The bar chart shown below provides an indication of the risks of investing in the Fund by showing the total return of its Class A shares for each full calendar year since inception. Although Class C and Class I shares have similar annual returns to Class A shares because the classes are invested in the same portfolio of securities, the returns for Class C and Class I shares are different from Class A shares because Class C and Class I shares have different expenses than Class A shares. The accompanying table shows how the Fund’s average annual returns compare over time with those of a broad-based market index. Sales charges are reflected in the information shown below in the table, but the information shown in the bar chart does not reflect sales charges and, if it did, returns would be lower. How the Fund has performed in the past (before and after taxes) is not necessarily an indication of how it will perform in the future. Updated performance information is available at no cost by calling 1-844-ACFUNDS (844-223-8637).
During the period shown in the bar chart, the highest return for a quarter was 20.92% (quarter ended June 30, 2020), and the lowest return for a quarter was (36.22)% (quarter ended March 31, 2020). The Fund’s Class shares A year-to-date return for the period ended June 30, 2025 was 5.07%.
| Class A Shares | 1 Year | 5 Year | Since
Inception (5/28/15) |
| Return Before Taxes | (5.37)% | (6.55)% | 1.38% |
| Return After Taxes on Distributions | (7.41)% | (7.82)% | (0.24)% |
| Return After Taxes on Distributions and Sale of Fund Shares | (3.18)% | (5.27)% | 0.44% |
| Class C Shares | |||
| Return Before Taxes | (1.36)% | (6.33)% | 1.15% |
| Class I Shares | |||
| Return Before Taxes | (0.37)% | (5.40)% | 2.15% |
| Bloomberg
US Aggregate Bond Index (reflects no deduction for fees, expenses or taxes) |
1.25% | (0.33)% | 1.32% |
After-tax returns are calculated using the highest historical individual federal marginal income tax rate and do not reflect the impact of state and local taxes. Actual after-tax returns depend on a shareholder’s tax situation and may differ from those shown. After-tax returns are not relevant for shareholders who hold Fund shares in tax-deferred accounts or to shares held by non-taxable entities. After-tax returns are only shown for Class A shares. After-tax returns for other share classes will vary.
The bar chart shown below provides an indication of the risks of investing in the Fund by showing the total return of its Class A shares for each full-calendar year since inception. Although Class C and Class I shares have similar annual returns to Class A shares because the classes are invested in the same portfolio of securities, the returns for Class C and Class I shares are different from Class A shares because Class C and Class I shares have different expenses than Class A shares. The accompanying table shows how the Fund’s average annual returns compare over time with those of a broad-based market index and supplemental indexes. Sales charges are reflected in the information shown below in the table, but the information shown in the bar chart does not reflect sales charges, and, if it did, returns would be lower. How the Fund has performed in the past (before and after taxes) is not necessarily an indication of how it will perform in the future. Updated performance information is available at no cost by calling 1-844-ACFUNDS (844-223-8637).
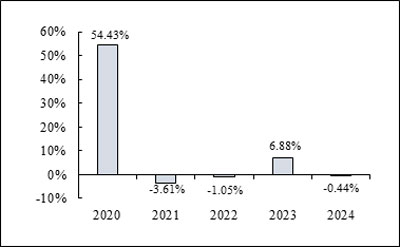
During the period shown in the bar chart, the highest return for a quarter was 27.49% (quarter ended December 31, 2020), and the lowest return for a quarter was (11.88)% (quarter ended June 30, 2022). The Fund’s Class A shares year-to-date return for the period ended June 30, 2025 was (2.87)%.
| Class A Shares | 1 Year | 5 Year | Since
Inception (11/29/19) |
| Return Before Taxes | (6.15)% | 8.11% | 8.24% |
| Return After Taxes on Distributions | (6.77)% | 6.17% | 6.33% |
| Return After Taxes on Distributions and Sale of Fund Shares | (3.53)% | 5.55% | 5.68% |
| Class C Shares | |||
| Return Before Taxes | (1.20)% | 8.73% | 8.85% |
| Class I Shares | |||
| Return Before Taxes | (0.26)% | 9.66% | 9.75% |
| S&P
500 Total Return Index (reflects no deduction for fees, expenses or taxes) |
25.02% | 14.53% | 14.93% |
| S&P
Biotechnology Select Industry Total Return Index (reflects no deduction for fees, expenses or taxes) |
1.18% | (0.89)% | (0.52)% |
| S&P
500 Health Care Sector Total Return Index (reflects no deduction for fees, expenses or taxes) |
2.58% | 7.99% | 8.60% |
After-tax returns are calculated using the highest historical individual federal marginal income tax rate and do not reflect the impact of state and local taxes. Actual after-tax returns depend on a shareholder’s tax situation and may differ from those shown. After-tax returns are not relevant for shareholders who hold Fund shares in tax-deferred accounts or to shares held by non-taxable entities. After-tax returns are only shown for Class A shares. After-tax returns for other share classes will vary.
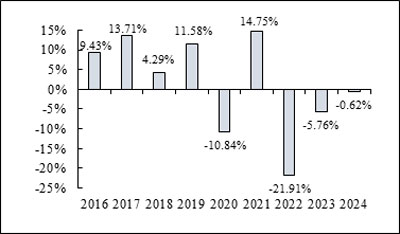
The bar chart shown below provides an indication of the risks of investing in the Fund by showing the total return of its Class I shares for each full calendar year since the Fund’s inception. Although Class A and C shares have similar annual returns to Class I shares because the classes are invested in the same portfolio of securities, the returns for Class A and C shares are different from Class I shares because Class A and C shares have different expenses than Class I shares. The accompanying table shows how the Fund’s average annual returns compare over time to those of a broad-based market index. Sales charges are reflected in the information shown below in the table. How the Fund has performed in the past (before and after taxes) is not necessarily an indication of how it will perform in the future. Updated performance information and daily NAV is available at no cost by calling 1-844-ACFUNDS (844-223-8637). The Fund acquired all of the assets and liabilities of Theta Funds, L.P. (the “Predecessor Fund”) in a tax-free reorganization on September 30, 2016. In connection with this acquisition, shares of the Predecessor Fund were exchanged for Class I shares of the Fund, so the Predecessor Fund became the Class I shares of the Fund. The Fund’s investment objective, policies and guidelines are, in all material respects, equivalent to the Predecessor Fund’s investment objectives, policies and guidelines. The performance information prior to September 30, 2016 set forth below reflects the historical performance of the Predecessor Fund shares. The Predecessor Fund was not registered under the 1940 Act and, therefore, was not subject to certain investment restrictions, limitations and diversification requirements that are imposed by the 1940 Act. If the Predecessor Fund had been registered under the 1940 Act, the Predecessor Fund’s performance may have been adversely affected.
During the period shown in the bar chart, the highest return for a quarter was 14.05% (quarter ended March 31, 2020), and the lowest return for a quarter was (12.25)% (quarter ended March 31, 2018). The Fund’s Class I year-to-date return for the period ended June 30, 2025 was (0.38)%.
The following table shows the average annual returns for the Fund and Predecessor Fund which includes all of its actual fees and expenses over various periods ended December 31, 2024. The Predecessor Fund did not have a distribution policy. It was an unregistered limited partnership, did not qualify as a regulated investment company for federal income tax purposes and it did not pay dividends and distributions. As a result of the different tax treatment, we are unable to show the after-tax returns for the Predecessor Fund.
| 1 Year | 5 Years | 10 Years* | |
| Class I Shares | |||
| Return Before Taxes | 8.87% | 8.76% | 7.23% |
| Return After Taxes on Distributions | 7.94% | 8.16% | 6.85% |
| Return After Taxes on Distributions and Sale of Fund Shares | 5.26% | 6.75% | 5.75% |
| S&P
500 TR Index (reflects no deduction for fees, expenses or taxes) |
25.02% | 14.53% | 13.10% |
| Since Inception (9/30/16) | |||
| Class A Shares | |||
| Return Before Taxes | 2.36% | 7.21% | 6.19% |
| Class C Shares | |||
| Return Before Taxes | 7.77% | 7.68% | 6.24% |
| S&P
500 TR Index (reflects no deduction for fees, expenses or taxes) |
25.02% | 14.53% | 14.84% |
| * | Includes the effect of performance fees paid by the investors of the Predecessor Fund. |
After-tax returns are calculated using the highest historical individual federal marginal income tax rate and do not reflect the impact of state and local taxes. Actual after-tax returns depend on a shareholder’s tax situation and may differ from those shown. After-tax returns are not relevant for shareholders who hold Fund shares in tax-deferred accounts or to shares held by non-taxable entities. After-tax returns for other share classes will vary.
The bar chart shown below provides an indication of the risks of investing in the Fund by showing the total return of its Class A shares for each full calendar year since inception. Although Class C and Class I shares have similar annual returns to Class A shares because the classes are invested in the same portfolio of securities, the returns for Class C and Class I shares are different from Class A shares because Class C and Class I shares have different expenses than Class A shares. The accompanying table shows how the Fund’s average annual returns compare over time with those of a broad-based market index and a supplemental index. Sales charges are reflected in the information shown below in the table, but the information shown in the bar chart does not reflect sales charges, and, if it did, returns would be lower. How the Fund has performed in the past (before and after taxes) is not necessarily an indication of how it will perform in the future. Updated performance information is available at no cost by calling 1-844-ACFUNDS (844-223-8637).
Effective August 1, 2022, the Fund changed its strategy. Performance information for periods prior to August 1, 2022, does not reflect the current investment strategy.
During the period shown in the bar chart, the highest return for a quarter was 31.88% (quarter ended June 30, 2020), and the lowest return for a quarter was (24.11)% (quarter ended June 30, 2022). The Fund’s Class A shares year-to-date return for the period ended June 30, 2025 was 6.73%.
| Class A Shares | 1 Year | 5 Year | Since
Inception (5/31/17) |
| Return Before Taxes | 17.42% | 4.59% | 6.26% |
| Return After Taxes on Distributions | 17.42% | 4.14% | 5.69% |
| Return After Taxes on Distributions and Sale of Fund Shares | 10.31% | 3.54% | 4.81% |
| Class C Shares | |||
| Return Before Taxes | 23.65% | 5.06% | 6.30% |
| Class I Shares | |||
| Return Before Taxes | 24.96% | 6.11% | 7.37% |
| S&P
500 Total Return Index (reflects no deduction for fees, expenses or taxes) |
25.02% | 14.53% | 14.41% |
| MSCI
AC World Index (reflects no deduction for fees, expenses or taxes) |
18.01% | 10.58% | 10.60% |
After-tax returns are calculated using the highest historical individual federal marginal income tax rate and do not reflect the impact of state and local taxes. Actual after-tax returns depend on a shareholder’s tax situation and may differ from those shown. After-tax returns are not relevant for shareholders who hold Fund shares in tax-deferred accounts or to shares held by non-taxable entities. After-tax returns are only shown for Class A shares. After-tax returns for other share classes will vary.
The Fund acquired all of the assets and liabilities of MLM Symmetry Fund, LP (the “Predecessor Fund”) in a tax-free reorganization on August 9, 2019. In connection with this acquisition, shares of the Predecessor Fund were exchanged for Class I shares of the Fund. The Fund’s investment objectives, policies, restrictions, and guidelines are, in all material respects, equivalent to the Predecessor Fund’s investment objectives, policies, restrictions, and guidelines. The Sub-Advisor was the adviser to the Predecessor Fund. The performance information set forth below includes the historical performance of the Predecessor Fund shares.
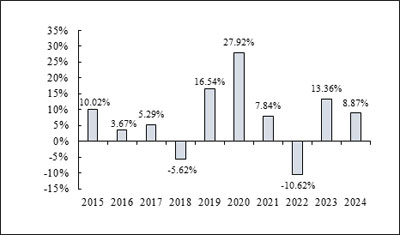
The bar chart and performance table below show the variability of the Fund’s returns, which is some indication of the risks of investing in the Fund. The bar chart shows performance of the Fund’s Class I shares for each full calendar year since the Predecessor Fund’s inception. Although Class A and Class C shares have similar annual returns to Class I shares because the classes are invested in the same portfolio of securities, the returns for Class A, and Class C shares are different from Class I shares because Class A, and Class C shares have different expenses than Class I shares. The performance table compares the performance of the Fund’s shares over time to those of a broad-based market index and a blended index. You should be aware that the Fund’s and Predecessor Fund’s past performance (before and after taxes) may not be an indication of how the Fund will perform in the future.
The Fund’s performance provided below for periods prior to the commencement of the Fund’s operations is that of the Predecessor Fund, which includes all of the Predecessor Fund’s gross fees and expenses over various periods ended December 31, 2019, as adjusted to include the applicable sales loads of each class of shares of the Fund. The performance of the Predecessor Fund has not been restated to reflect the fees, estimated expenses and fee waivers and/or expense limitations applicable to each class of shares of the Fund. If the performance of the Predecessor Fund had been restated to reflect the applicable fees and expenses of each class of shares of the Fund, the performance would have been lower. The Predecessor Fund did not have a distribution policy. It was a limited partnership, did not qualify as a regulated investment company for federal income tax purposes, and it did not pay dividends and distributions. As a result of the different tax treatment, we are unable to show the after-tax returns for the Predecessor Fund prior to its operations as the Fund. The Predecessor Fund was not registered under the 1940 Act and, therefore, was not subject to certain investment restrictions, limitations and diversification requirements that are imposed by the 1940 Act. If the Predecessor Fund had been registered under the 1940 Act, the Predecessor Fund’s performance may have been adversely affected.
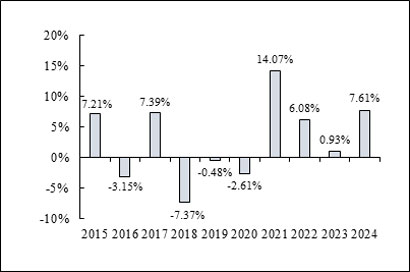
During the period shown in the bar chart, the highest return for a quarter was 9.89% (quarter ended December 31, 2020), and the lowest return for a quarter was (11.28)% (quarter ended March 31, 2020). The Fund’s Class I shares year-to-date returns for the period ended June 30, 2025 was 1.95%.
| Class I Shares | 1 Year | 5 Year | 10 Year 1 |
| Return Before Taxes | 7.61% | 5.06% | 2.78% |
| Return After Taxes on Distributions | 7.61% | 4.10% | 2.22% |
| Return After Taxes on Distributions and Sale of Fund Shares | 4.51% | 3.58% | 1.96% |
| Class A Shares2 | |||
| Return Before Taxes | 1.23% | 3.59% | 2.55% |
| Class C Shares | |||
| Return Before Taxes | 6.56% | 4.03% | 1.78% |
| S&P 500 TR Index3 (reflects no deduction for fees, expenses or taxes) | 25.02% | 14.53% | 13.10% |
| MSCI World/Bloomberg US Aggregate Bond Blended Index3 (reflects no deduction for fees, expenses or taxes) | 10.50% | 5.74% | 5.56% |
| 1. | Includes the effect of performance fees paid by the investors of the Predecessor Fund. |
| 2. | Includes the effect of the maximum sales load. |
| 3. | MSCI World/Bloomberg US Aggregate Bond Blended Index reflects an unmanaged portfolio of 60% of the MSCI World Index and 40% of the Bloomberg U.S. Aggregate Bond Index. |
After-tax returns are calculated using the highest historical individual federal marginal income tax rate and do not reflect the impact of state and local taxes. Actual after-tax returns depend on a shareholder’s tax situation and may differ from those shown. After-tax returns are not relevant for shareholders who hold Fund shares in tax-deferred accounts or to shares held by non-taxable entities. After-tax returns for other share classes will vary.
Updated performance information and daily net asset value per share are available at no cost by calling toll-free 1-844-223-8637.
The Fund acquired all the assets and liabilities of Strategos Deep Value Fund LP (the “Predecessor Fund”) in a tax-free reorganization on May 28, 2021. In connection with this acquisition, shares of the Predecessor Fund were exchanged for Class I shares of the Fund. The Fund’s investment objective, policies, restrictions, and guidelines are, in all material respects, equivalent to the Predecessor Fund’s investment objective, policies, restrictions, and guidelines. The performance information set forth below reflects the historical performance of the Predecessor Fund shares.
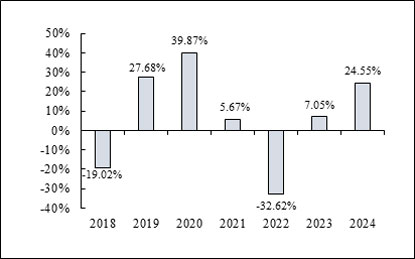
The bar chart and performance table below show the variability of the Fund’s returns, which is some indication of the risks of investing in the Fund. The bar chart shows performance of the Fund’s Class I shares for each full calendar year since the Predecessor Fund’s inception. Although Class A and Class C shares have similar annual returns to Class I shares because the classes are invested in the same portfolio of securities, the returns for Class A and Class C shares are different from Class I shares because Class A and Class C shares have different expenses than Class I shares. Class A sales charges are reflected in the information shown below in the average annual total return table. The performance table compares the performance of the Fund’s shares over time to the performance of a broad-based securities market index and supplemental broad-based securities market index composed of U.S. REITs. You should be aware that the Fund’s and Predecessor Fund’s past performance (before and after taxes) may not be an indication of how the Fund will perform in the future.
The Fund’s performance provided below for periods prior to the commencement of the Fund’s operations is that of the Predecessor Fund, which includes all the Predecessor Fund’s gross fees and expenses and, in the case of the performance table, as adjusted to include the applicable sales loads of each class of shares of the Fund. The performance of the Predecessor Fund has not been restated to reflect the fees, estimated expenses and fee waivers and/or expense limitations applicable to each class of shares of the Fund. If the performance of the Predecessor Fund had been restated to reflect the applicable fees and expenses of each class of shares of the Fund, the performance would have been lower. The Predecessor Fund did not have a distribution policy. It was a limited partnership, did not qualify as a regulated investment company for federal income tax purposes, and did not pay dividends or distributions. As a result of the different tax treatment, we are unable to show the after-tax returns for the Predecessor Fund. The Predecessor Fund was not registered under the 1940 Act and, therefore, was not subject to certain investment restrictions, limitations and diversification requirements that are imposed by the 1940 Act. If the Predecessor Fund had been registered under the 1940 Act, the Predecessor Fund’s performance may have been adversely affected.
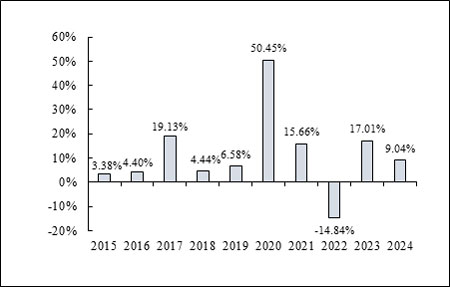
During the period shown in the bar chart, the highest return for a quarter was 24.17% (quarter ended June 30, 2020), and the lowest return for a quarter was (10.93)% (quarter ended June 30, 2022). The Fund’s Class I shares year-to-date returns for the period ended June 30, 2025 was 0.50%.
| Class I Shares | 1 Year | 5 Year1 | 10 Year1 |
| Return Before Taxes | 9.04% | 13.59% | 10.47% |
| Return After Taxes on Distributions | 6.66% | 11.87% | 9.63% |
| Return After Taxes on Distributions and Sale of Fund Shares | 5.77% | 10.21% | 8.32% |
| Class A Shares2 | |||
| Return Before Taxes | 3.56% | 12.21% | 9.65% |
| Class C Shares | |||
| Return Before Taxes | 7.96% | 12.48% | 9.38% |
| S&P
500 TR Index 3 (reflects no deduction for fees, expenses or taxes) |
25.02% | 14.53% | 13.10% |
| S&P
U.S. REIT Net TR Index (reflects no deduction for fees, expenses or taxes) |
8.44% | 4.30% | 5.55% |
| 1. | Includes the effect of performance fees paid by the investors of the Predecessor Fund. |
| 2. | Includes the effect of the maximum sales load. |
Updated performance information and daily net asset value per share are available at no cost by calling toll-free 1-844-223-8637.