Exhibit 99.1
CURBLINE PROPERTIES 2Q25 QUARTERLY FINANCIAL SUPPLEMENT QUARTER ENDED June 30, 2025 Recent Acquisition Plaza at Stacy Green, ALLEN, TEXAS CURB LISTED NYSE.
Exhibit 99.1
CURBLINE PROPERTIES 2Q25 QUARTERLY FINANCIAL SUPPLEMENT QUARTER ENDED June 30, 2025 Recent Acquisition Plaza at Stacy Green, ALLEN, TEXAS CURB LISTED NYSE.
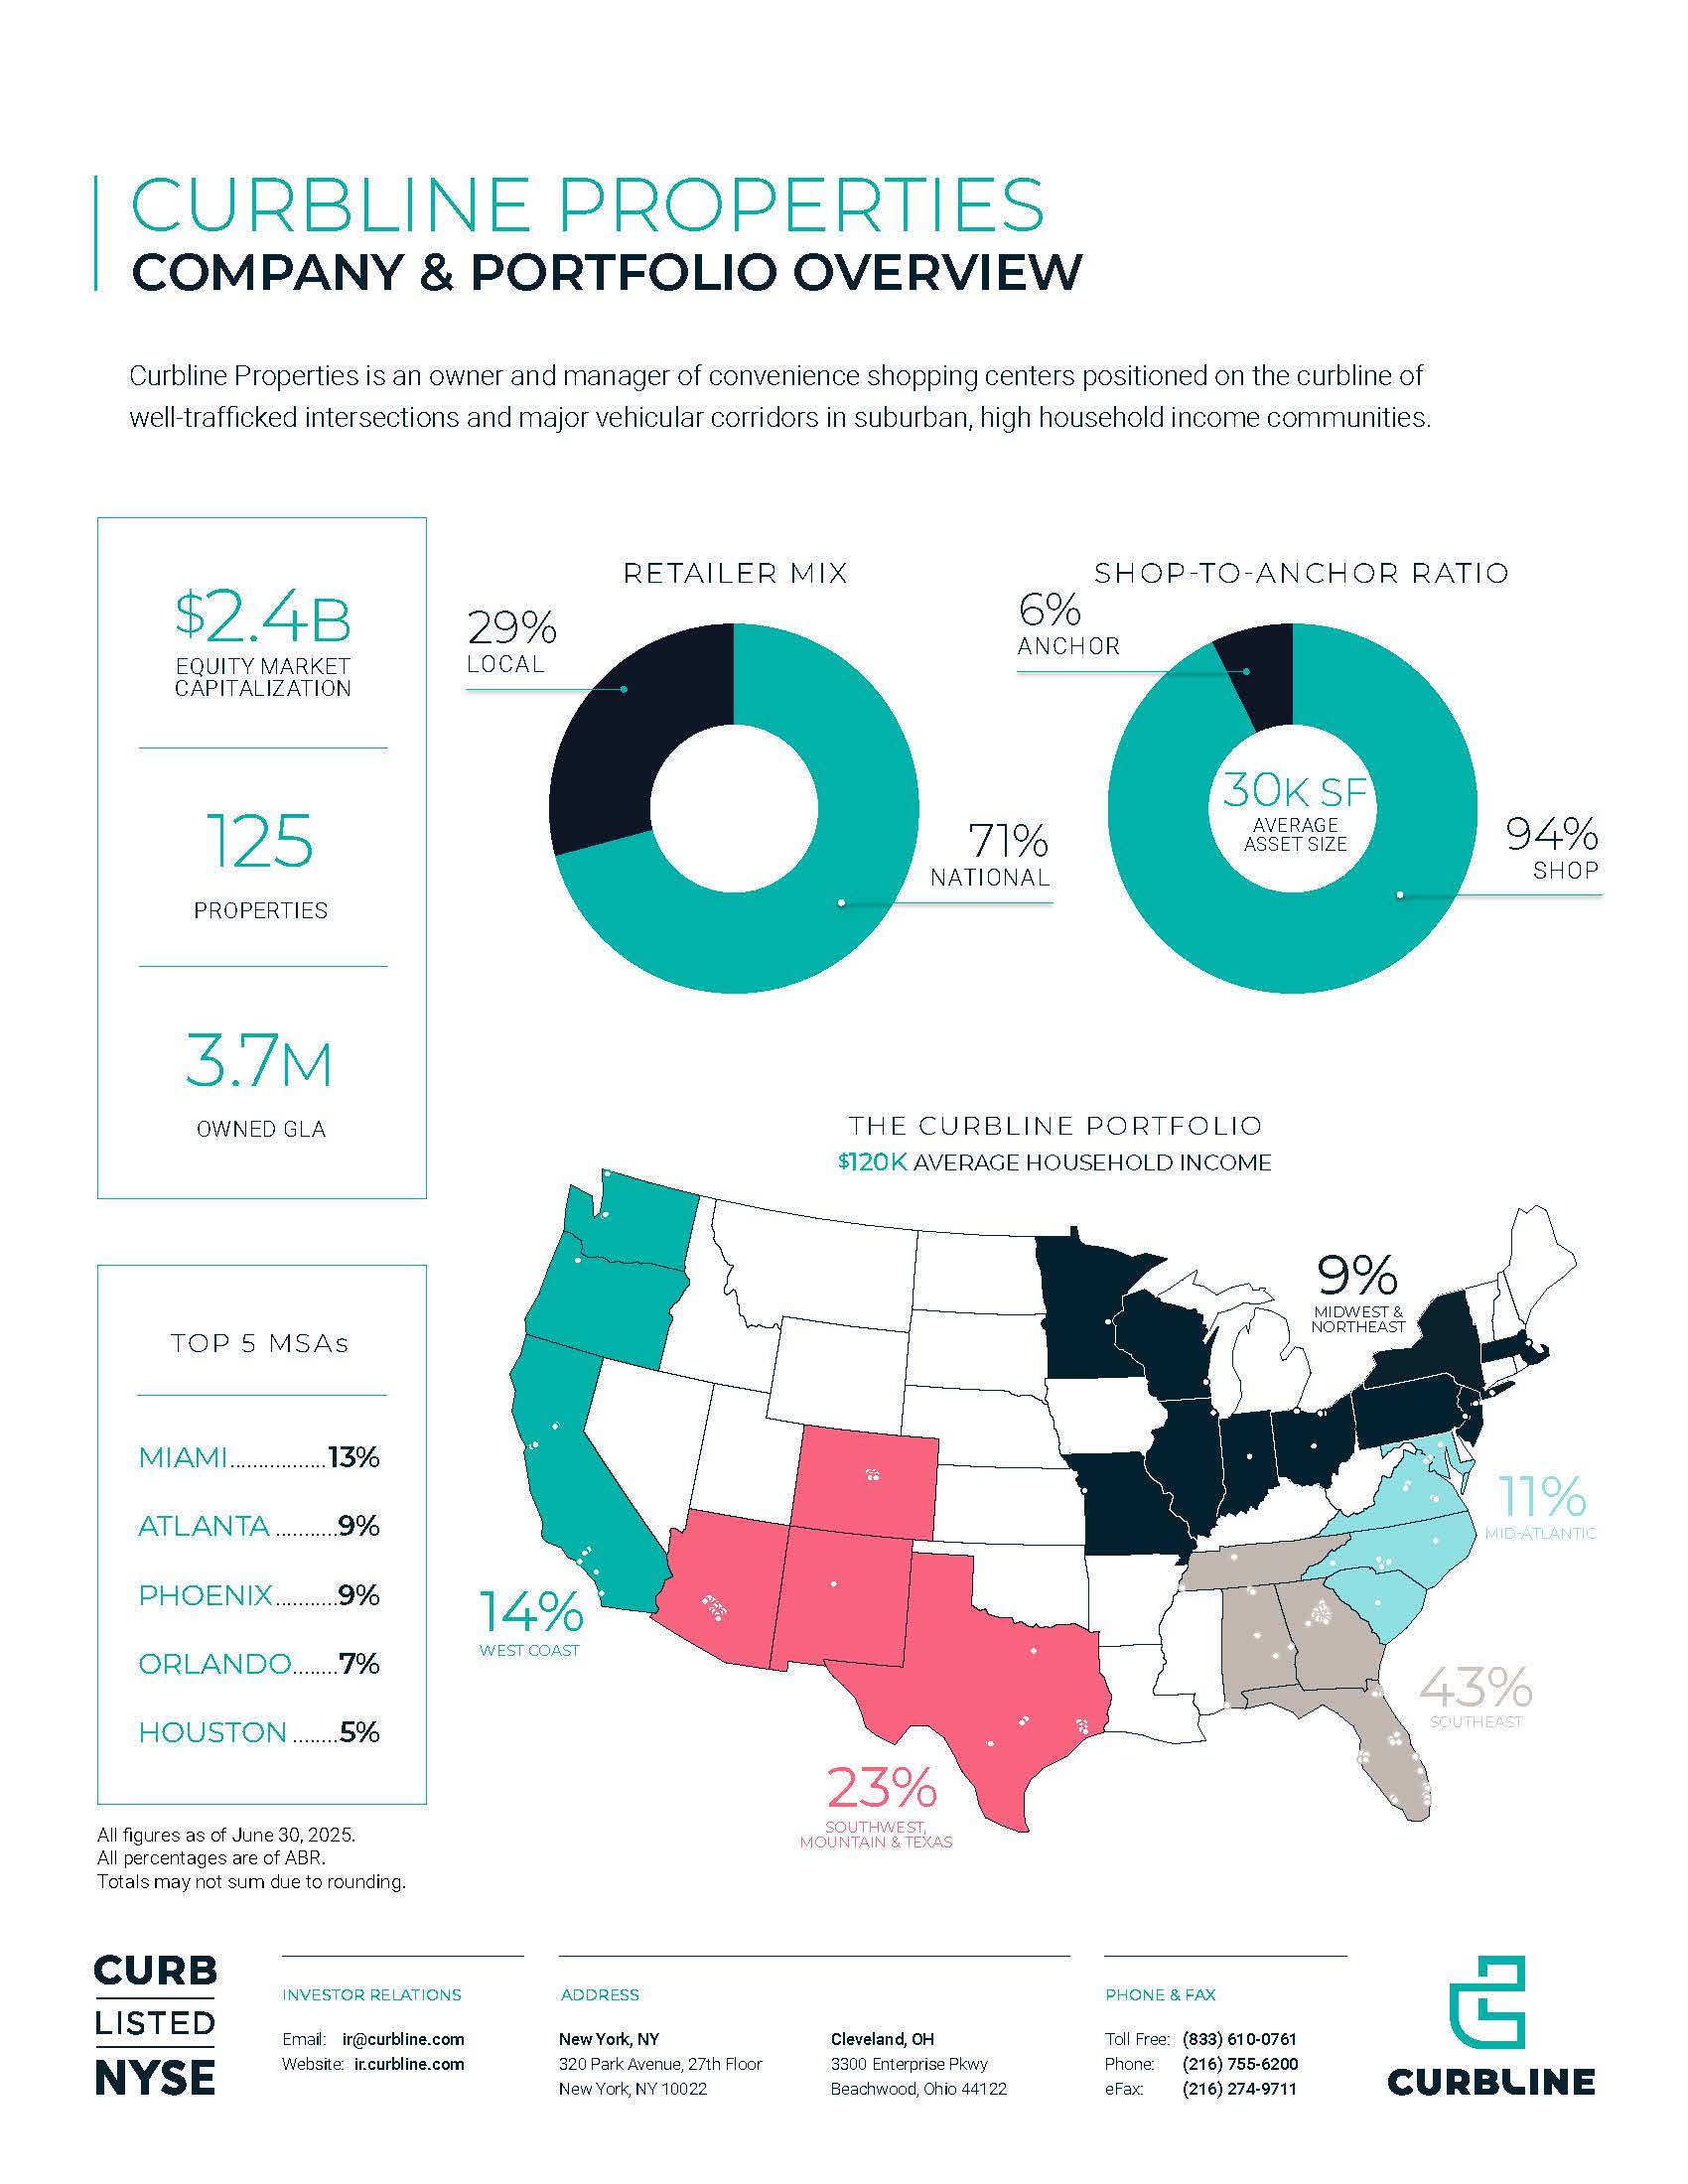
CURBLINE PROPERTIES COMPANY & PORTFOLIO OVERVIEW Curbline Properties is an owner and manager of convenience shopping centers positioned on the curbline of well-trafficked intersections and major vehicular corridors in suburban, high household income communities. $2.4B MARKET CAPITALIZATION 125 PROPERTIES 3.7M GLA THE CURBLINE PORTFOLIO 120K AVERAGE HOUSEHOLD INCOME TOP 5 MSAs by ABR MIAMI 13% ATLANTA 9% PHOENIX 9% ORLANDO 7% HOUSTON 5% THE CURBLINE PROTFOLIO SOUTHEAST 43% SOUTHWEST MOUNTAIN & TEXAS 23% MIDWEST & NORTHEAST 9% WEST COAST 15% RETAILER MIX LOCAL 29% NATIONAL 71% PROPERTY COMPOSITION ANCHOR 6% SHOP 94% AVERAGE ASSET SIZE 30K SF CURBLINE PROPERTIES INVESTOR RELATIONS DEPARTMENT e: ir@curbline.com w: ir.curbline.com 323 Park Avenue, 27thFloor, New York, NY 10022 3300 Enterprise Pkwy Beachwood, OH 44122 o:216-755-6200 f:216-274-9711 w: curbline.com • NYSE:CURB CURB LISTED NYSE
Curbline Properties Corp.
Table of Contents
Section |
Page |
|
|
Earnings Release & Financial Statements |
|
|
|
Company Summary |
|
|
|
Investments |
|
|
|
Shopping Center Summary |
|
|
|
Reporting Policies and Other |
|
|
|
For Immediate Release |
Curbline Properties Reports Second Quarter 2025 Results |
|
For additional information: |
|
Conor Fennerty, EVP and Chief Financial Officer |
New York, New York, July 28, 2025 – Curbline Properties Corp. (NYSE: CURB) (the “Company” or “Curbline”), an owner of convenience centers in suburban, high household income communities, announced today operating results for the quarter ended June 30, 2025.
“The second quarter of 2025 highlights Curbline’s embedded growth potential with results and same-property growth ahead of expectations, the highest quarterly new leasing volume since formation, $155 million of acquisitions and $150 million of capital raising via the Company’s inaugural private placement notes offering,” commented David R. Lukes, President and Chief Executive Officer. “The operational, investment and capital markets momentum has continued into the third quarter with $260 million of investments closed to date, elevated leasing activity, and an additional $150 million of debt capital raised.”
“Curbline is uniquely positioned in the public real estate sector as it looks to scale the first public real estate company focused exclusively on convenience properties given its differentiated investment focus, the leasing economics of the Company’s property type, and its balance sheet which remained in a net cash position at quarter end.”
1
Key Quarterly Operating Results
2025 Guidance
The Company has updated its guidance for net income attributable to Curbline for 2025 to be from $0.37 to $0.44 per diluted share and Operating FFO to be from $1.00 to $1.03 per diluted share. The Company does not include a projection of gains or losses on asset sales, transaction costs or debt extinguishment costs in guidance.
Reconciliation of Net Income Attributable to Curbline to FFO and Operating FFO estimates:
|
FY 2025E (prior) |
|
FY 2025E (revised) |
Net income attributable to Curbline |
$0.43 — $0.50 |
|
$0.37 — $0.44 |
Depreciation and amortization of real estate, net |
0.56 — 0.52 |
|
0.62 — 0.58 |
FFO attributable to Curbline (NAREIT) |
$0.99 — $1.02 |
|
$0.99 — $1.02 |
Transaction, debt extinguishment and other costs, net (reported actual) |
0.0 |
|
0.01 |
Operating FFO attributable to Curbline |
$0.99 — $1.02 |
|
$1.00 — $1.03 |
About Curbline Properties
Curbline Properties is an owner and manager of convenience shopping centers positioned on the curbline of well-trafficked intersections and major vehicular corridors in suburban, high household income communities. The Company is publicly traded under the ticker symbol “CURB” on the NYSE and plans to elect to be treated as a REIT for U.S. federal income tax purposes. Additional information about the Company is available at curbline.com. To be included in the Company’s e-mail distributions for press releases and other investor news, please click here.
Conference Call and Supplemental Information
The Company will hold its quarterly conference call today at 5:00 p.m. Eastern Time. To participate with access to the slide presentation, please visit the Investor Relations portion of Curbline's website, ir.curbline.com, or for audio only, dial 800-715-9871 (U.S.) or 646-307-1963 (international) using pass code 6823859 at least ten minutes prior to the scheduled start of the call. The call will also be webcast and available in a listen-only mode on Curbline's website at ir.curbline.com. If you are unable to participate during the live call, a replay of the conference call will also be available at ir.curbline.com for further review. You may also access the telephone replay by dialing 800-770-2030 or 609-800-9909 (international) using passcode 6823859 through August 4, 2025. Copies of the Company’s supplemental package and earnings slide presentation are available on the Company’s website.
Non-GAAP Measures and Other Operational Metrics
Funds from Operations (“FFO”) is a supplemental non-GAAP financial measure used as a standard in the real estate industry and is a widely accepted measure of real estate investment trust (“REIT”) performance. The Company believes that both FFO and Operating FFO provide additional indicators of the financial performance of a REIT, more appropriately measure the core operations of the Company, and provide benchmarks to its peer group.
2
FFO is generally defined and calculated by the Company as net income attributable to Curbline (computed in accordance with Generally Accepted Accounting Principles in the United States (“GAAP”)), adjusted to exclude (i) gains and losses from disposition of real estate property, which are presented net of taxes, (ii) impairment charges on real estate property, (iii) gains and losses from changes in control and (iv) certain non-cash items. These non-cash items principally include real property depreciation and amortization of intangibles net of depreciation allocated to non-controlling interests. The Company’s calculation of FFO is consistent with the definition of FFO provided by NAREIT. The Company calculates Operating FFO as FFO excluding certain non-operating charges, income and gains/losses. Operating FFO is useful to investors as the Company removes non-comparable charges, income and gains/losses to analyze the results of its operations and assess performance of the core operating real estate portfolio. Other real estate companies may calculate FFO and Operating FFO in a different manner.
In calculating the expected range for or amount of net income attributable to Curbline to estimate projected FFO and Operating FFO for future periods, the Company does not include a projection of gains and losses from the disposition of real estate property, potential impairments and reserves of real estate property, debt extinguishment costs and certain transaction costs. Other real estate companies may calculate expected FFO and Operating FFO in a different manner.
The Company also uses net operating income (“NOI”), a non-GAAP financial measure, as a supplemental performance measure. NOI is calculated as property revenues less property-related expenses and excludes depreciation and amortization expense, interest income and expense and corporate level transactions. The Company believes NOI provides useful information to investors regarding the Company’s financial condition and results of operations because it reflects only those income and expense items that are incurred at the property level and, when compared across periods, reflects the impact on operations from trends in occupancy rates, rental rates, operating costs and acquisition and disposition activity on an unleveraged basis.
The Company presents NOI information herein on a same-property basis or “SPNOI.” The Company defines SPNOI as property revenues less property-related expenses, which exclude straight-line rental income and reimbursements and expenses, lease termination income, management fee expense, and fair market value of leases. SPNOI only includes assets owned for the entirety of both comparable periods. SPNOI excludes all non-property and corporate level revenue and expenses. Other real estate companies may calculate NOI and SPNOI in a different manner. The Company believes SPNOI provides investors with additional information regarding the operating performances of comparable assets because it excludes certain non-cash and non-comparable items as noted above.
FFO, Operating FFO, NOI and SPNOI do not represent cash generated from operating activities in accordance with GAAP, are not necessarily indicative of cash available to fund cash needs and should not be considered as alternatives to net income computed in accordance with GAAP, as indicators of the Company’s operating performance or as alternatives to cash flow as a measure of liquidity. Reconciliations of these non-GAAP measures to their most directly comparable GAAP measures have been provided herein.
The Company calculates Cash Leasing Spreads by comparing the prior tenant's annual base rent in the final year of the prior lease to the executed tenant’s annual base rent in the first year of the executed lease. Straight-Lined Leasing Spreads are calculated by comparing the prior tenant’s average base rent over the prior lease term to the executed tenant’s average base rent over the term of the executed lease. For both Cash and Straight-Lined Leasing Spreads, the reported calculation excludes first generation units and spaces vacant at the time of acquisition and includes all leases for spaces vacant greater than twelve months along with split and combination deals.
Safe Harbor
Curbline Properties Corp. considers portions of the information in this press release to be forward-looking statements within the meaning of Section 27A of the Securities Act of 1933 and Section 21E of the Securities Exchange Act of 1934, both as amended, with respect to the Company’s expectation for future periods. Although the Company believes that the expectations reflected in such forward-looking statements are based upon reasonable assumptions, it can give no assurance that its expectations will be achieved. For this purpose, any statements contained herein that are not historical fact, including statements regarding the Company’s projected operational and financial performance, strategy, prospects and plans, may be deemed to be forward-looking statements. There are a number of important factors that could cause our results to differ materially from those indicated by such forward-looking statements, including, among other factors, (1) changes in the economic performance and value of the Company’s properties as a result of broad economic and local conditions, such as inflation, interest rate volatility and market reaction to tariffs and other trade policies; (2) changes in local conditions such as an increase or decrease in the supply of, or demand for, retail real estate space in our geographic markets; (3) the impact of changes in consumer trends, distribution channels, suburban population, retailing practices and the space needs of tenants; (4) our dependence on rental income which depends on the successful operations and financial condition of tenants, the loss of which, including as a result of downsizing or bankruptcy, could result in significant occupancy loss and negatively impact
3
rental income from our properties; (5) our ability to enter into new leases and renew existing leases, in each case, on favorable terms; (6) our ability to identify, acquire, construct or develop additional properties that produce the cash flows that we expect and may be limited by competitive pressures, and our ability to manage our growth effectively and capture the efficiencies of scale that we expect from expansion; (7) potential environmental liabilities; (8) our ability to secure debt and equity financing on commercially acceptable terms or at all, including the ability to complete the sale and purchase of our private placement notes; (9) the illiquidity of real estate investments which could limit our ability to make changes to our portfolio to respond to economic or other conditions; (10) property damage, expenses related thereto and other business and economic consequences (including the potential loss of rental revenues) resulting from climate change, natural disasters, public health crises and weather-related factors in locations where we own properties, the ability to estimate accurately the amounts thereof and the sufficiency and timing of any insurance recovery payments related to such damages; (11) any change in strategy; (12) the effect of future offerings of debt and equity securities on the value of our common stock; (13) any disruption, failure or breach of the networks or systems on which the Company relies, including as a result of cyber-attacks; (14) impairment in the value of real estate property that we own; (15) changes in tax laws impacting REITs and real estate in general, as well as our ability to qualify as a REIT and to maintain REIT status once elected, (16) our ability to retain and attract key management personnel, and (17) the finalization of the financial statements for the period ended June 30, 2025. For additional factors that could cause the results of the Company to differ materially from those indicated in the forward-looking statements, please refer to the Company’s Annual Report on Form 10-K under “Item 1A. Risk Factors” and our subsequent reports filed with the Securities and Exchange Commission. The Company undertakes no obligation to publicly revise these forward-looking statements to reflect events or circumstances that arise after the date hereof.
4
Curbline Properties Corp.
Income Statement
|
in thousands, except per share |
|
|
|
|
||||
|
|
2Q25 |
|
2Q24 |
|
6M25 |
|
6M24 |
|
|
Revenues: |
|
|
|
|
|
|
|
|
|
Rental income (1) |
$41,104 |
|
$27,944 |
|
$79,542 |
|
$55,810 |
|
|
Other property revenues |
298 |
|
212 |
|
555 |
|
385 |
|
|
|
41,402 |
|
28,156 |
|
80,097 |
|
56,195 |
|
|
Expenses: |
|
|
|
|
|
|
|
|
|
Operating and maintenance |
5,666 |
|
3,059 |
|
11,068 |
|
5,991 |
|
|
Real estate taxes |
4,971 |
|
2,975 |
|
9,792 |
|
5,996 |
|
|
|
10,637 |
|
6,034 |
|
20,860 |
|
11,987 |
|
|
|
|
|
|
|
|
|
|
|
|
Net operating income |
30,765 |
|
22,122 |
|
59,237 |
|
44,208 |
|
|
|
|
|
|
|
|
|
|
|
|
Other income (expense): |
|
|
|
|
|
|
|
|
|
Interest expense |
(1,767) |
|
(166) |
|
(2,334) |
|
(416) |
|
|
Interest income |
5,580 |
|
0 |
|
11,233 |
|
0 |
|
|
Depreciation and amortization |
(16,039) |
|
(9,376) |
|
(30,502) |
|
(18,611) |
|
|
General and administrative (2) |
(8,156) |
|
(2,201) |
|
(17,084) |
|
(3,725) |
|
|
Other income (expense), net (3) |
95 |
|
(4,143) |
|
553 |
|
(7,245) |
|
|
Gain on disposition of real estate, net |
0 |
|
0 |
|
42 |
|
0 |
|
|
Income before taxes |
10,478 |
|
6,236 |
|
21,145 |
|
14,211 |
|
|
Tax expense |
(72) |
|
0 |
|
(177) |
|
0 |
|
|
Net income |
10,406 |
|
6,236 |
|
20,968 |
|
14,211 |
|
|
Non-controlling interests |
(14) |
|
0 |
|
(26) |
|
0 |
|
|
Net income attributable to Curbline |
$10,392 |
|
$6,236 |
|
$20,942 |
|
$14,211 |
|
|
|
|
|
|
|
|
|
|
|
|
Weighted average shares – Basic – EPS |
105,003 |
|
104,860 |
|
104,958 |
|
104,860 |
|
|
Assumed conversion of diluted securities |
239 |
|
0 |
|
232 |
|
0 |
|
|
Weighted average shares – Diluted – EPS |
105,242 |
|
104,860 |
|
105,190 |
|
104,860 |
|
|
|
|
|
|
|
|
|
|
|
|
Earnings per share of common stock – Basic |
$0.10 |
|
$0.06 |
|
$0.20 |
|
$0.14 |
|
|
Earnings per share of common stock – Diluted |
$0.10 |
|
$0.06 |
|
$0.20 |
|
$0.14 |
|
|
|
|
|
|
|
|
|
|
|
|
Note: Amounts for the three and six month periods ended June 30, 2024 have been carved out of SITE Centers' consolidated financial statements which may impact the comparability between the periods. |
|
|||||||
|
|
|
|
|
|
|
|
|
|
(1) |
Rental income: |
|
|
|
|
|
|
|
|
|
Minimum rents |
$25,011 |
|
$16,789 |
|
$48,240 |
|
$33,225 |
|
|
Ground lease minimum rents |
3,586 |
|
2,663 |
|
6,790 |
|
5,334 |
|
|
Straight-line rent, net |
795 |
|
459 |
|
1,456 |
|
869 |
|
|
Amortization of (above)/below-market rent, net |
1,029 |
|
736 |
|
1,959 |
|
1,331 |
|
|
Percentage and overage rent |
269 |
|
232 |
|
362 |
|
331 |
|
|
Recoveries |
10,365 |
|
5,955 |
|
19,815 |
|
11,683 |
|
|
Uncollectible revenue |
(215) |
|
(316) |
|
(434) |
|
(479) |
|
|
Ancillary and other rental income |
264 |
|
108 |
|
500 |
|
246 |
|
|
Lease termination fees |
0 |
|
1,318 |
|
854 |
|
3,270 |
|
|
|
|
|
|
|
|
|
|
|
(2) |
SITE SSA gross up |
($625) |
|
N/A |
|
($1,256) |
|
N/A |
|
|
|
|
|
|
|
|
|
|
|
(3) |
Other income (expense), net: |
|
|
|
|
|
|
|
|
|
Transaction costs |
($343) |
|
($3,944) |
|
($516) |
|
($7,041) |
|
|
SITE SSA gross up |
625 |
|
N/A |
|
1,256 |
|
N/A |
|
|
Debt extinguishment and other |
(187) |
|
(199) |
|
(187) |
|
(204) |
|
|
|
|
|
|
|
|
|
|
|
5
Curbline Properties Corp.
Reconciliation: Net Income to FFO and Operating FFO
and Other Financial Information
|
in thousands, except per share |
|
|
|
||||
|
|
2Q25 |
|
2Q24 |
|
6M25 |
|
6M24 |
|
Net income attributable to Curbline |
$10,392 |
|
$6,236 |
|
$20,942 |
|
$14,211 |
|
Depreciation and amortization of real estate, net of non-controlling interests |
16,018 |
|
9,376 |
|
30,464 |
|
18,611 |
|
Gain on disposition of real estate, net |
0 |
|
0 |
|
(42) |
|
0 |
|
FFO attributable to Curbline |
$26,410 |
|
$15,612 |
|
$51,364 |
|
$32,822 |
|
Transaction, debt extinguishment and other costs, net of non-controlling interests |
529 |
|
4,230 |
|
702 |
|
7,341 |
|
Total non-operating items, net |
529 |
|
4,230 |
|
702 |
|
7,341 |
|
Operating FFO attributable to Curbline |
$26,939 |
|
$19,842 |
|
$52,066 |
|
$40,163 |
|
|
|
|
|
|
|
|
|
|
Weighted average shares & units – Basic: FFO & OFFO |
105,003 |
|
104,860 |
|
104,958 |
|
104,860 |
|
Assumed conversion of dilutive securities |
239 |
|
0 |
|
232 |
|
0 |
|
Weighted average shares & units – Diluted: FFO & OFFO |
105,242 |
|
104,860 |
|
105,190 |
|
104,860 |
|
|
|
|
|
|
|
|
|
|
FFO per share – Basic |
$0.25 |
|
$0.15 |
|
$0.49 |
|
$0.31 |
|
FFO per share – Diluted |
$0.25 |
|
$0.15 |
|
$0.49 |
|
$0.31 |
|
Operating FFO per share – Basic |
$0.26 |
|
$0.19 |
|
$0.50 |
|
$0.38 |
|
Operating FFO per share – Diluted |
$0.26 |
|
$0.19 |
|
$0.49 |
|
$0.38 |
|
|
|
|
|
|
|
|
|
|
Capital expenditures and certain non-cash items: |
|
|
|
|
|
|
|
|
Maintenance capital expenditures |
$1,090 |
|
|
|
$1,100 |
|
|
|
Tenant allowances and landlord work, net |
826 |
|
|
|
1,628 |
|
|
|
Leasing commissions, net |
351 |
|
|
|
830 |
|
|
|
Loan cost amortization |
(354) |
|
|
|
(607) |
|
|
|
Stock compensation expense |
(3,072) |
|
|
|
(6,666) |
|
|
|
|
|
|
|
|
|
|
|
6
Curbline Properties Corp.
Balance Sheet
|
$ in thousands |
|
|
|
|
|
|
||
|
|
2Q25 |
|
4Q24 |
|
Assets: |
|
|
|
|
Land |
$600,790 |
|
$490,563 |
|
Buildings |
995,543 |
|
841,912 |
|
Fixtures and tenant improvements |
90,525 |
|
80,636 |
|
|
1,686,858 |
|
1,413,111 |
|
Accumulated depreciation |
(184,454) |
|
(165,350) |
|
|
1,502,404 |
|
1,247,761 |
|
Construction in progress and land |
16,779 |
|
14,456 |
|
Real estate, net |
1,519,183 |
|
1,262,217 |
|
|
|
|
|
|
Cash |
429,865 |
|
626,409 |
|
Receivables and straight-line rents (1) |
18,774 |
|
15,887 |
|
Amounts receivable from SITE Centers |
31,287 |
|
33,762 |
|
Intangible assets, net (2) |
101,290 |
|
82,670 |
|
Other assets, net (4) |
33,404 |
|
12,153 |
|
Total Assets |
2,133,803 |
|
2,033,098 |
|
|
|
|
|
|
Liabilities and Equity: |
|
|
|
|
Revolving credit facilities |
0 |
|
0 |
|
Unsecured term loan |
99,090 |
|
0 |
|
|
99,090 |
|
0 |
|
Dividends payable |
17,403 |
|
26,674 |
|
Other liabilities (3) |
88,329 |
|
63,867 |
|
Total Liabilities |
204,822 |
|
90,541 |
|
|
|
|
|
|
Common stock |
1,052 |
|
1,050 |
|
Paid-in capital |
1,955,933 |
|
1,954,548 |
|
Distributions in excess of net income |
(27,948) |
|
(15,021) |
|
Accumulated comprehensive income |
(2,815) |
|
1,207 |
|
Non-controlling interest |
2,759 |
|
773 |
|
Total Equity |
1,928,981 |
|
1,942,557 |
|
|
|
|
|
|
Total Liabilities and Equity |
$2,133,803 |
|
$2,033,098 |
|
|
|
|
|
(1) |
Straight-line rents (including fixed CAM), net |
$11,434 |
|
$9,949 |
|
|
|
|
|
(2) |
Below-market leases (as lessee), net |
14,823 |
|
14,858 |
|
|
|
|
|
(3) |
Below-market leases, net |
52,514 |
|
40,149 |
|
|
|
|
|
(4) |
Acquisition escrow deposits |
22,914 |
|
750 |
|
|
|
|
|
7
Curbline Properties Corp.
Reconciliation of Net Income Attributable to Curbline to Same-Property NOI
$ in thousands |
|
|
|
|
|
|
|
|
2Q25 |
|
2Q24 |
|
6M25 |
|
6M24 |
GAAP Reconciliation: |
|
|
|
|
|
|
|
Net income attributable to Curbline |
$10,392 |
|
$6,236 |
|
$20,942 |
|
$14,211 |
Interest expense |
1,767 |
|
166 |
|
2,334 |
|
416 |
Interest income |
(5,580) |
|
0 |
|
(11,233) |
|
0 |
Depreciation and amortization |
16,039 |
|
9,376 |
|
30,502 |
|
18,611 |
General and administrative |
8,156 |
|
2,201 |
|
17,084 |
|
3,725 |
Other expense (income), net |
(95) |
|
4,143 |
|
(553) |
|
7,245 |
Gain on disposition of real estate, net |
0 |
|
0 |
|
(42) |
|
0 |
Tax expense |
72 |
|
0 |
|
177 |
|
0 |
Non-controlling interests |
14 |
|
0 |
|
26 |
|
0 |
Total Curbline NOI |
30,765 |
|
22,122 |
|
59,237 |
|
44,208 |
Less: Non-Same Property NOI |
(10,081) |
|
(2,653) |
|
(18,617) |
|
(5,288) |
Total Same-Property NOI |
$20,684 |
|
$19,469 |
|
$40,620 |
|
$38,920 |
|
|
|
|
|
|
|
|
Total Curbline NOI % Change |
39.1% |
|
|
|
34.0% |
|
|
Same-Property NOI % Change |
6.2% |
|
|
|
4.4% |
|
|
8
Curbline Properties Corp.
Portfolio Summary
|
|
|
|
|
|
|
|
|
|
|
|
||
|
|
|
|
|
|
|
|
|
6/30/2025 |
|
3/31/2025 |
|
12/31/2024 |
Quarterly Operational Overview |
|
|
|
|
|
|
|
|
|
|
|||
Properties |
|
|
|
|
|
125 |
|
107 |
|
97 |
|||
|
|
|
|
|
|
|
|
|
|
|
|
|
|
Owned GLA |
|
|
|
|
|
3,212 |
|
2,933 |
|
2,699 |
|||
Ground lease GLA |
|
|
|
|
|
477 |
|
452 |
|
399 |
|||
Total GLA |
|
|
|
|
|
3,689 |
|
3,385 |
|
3,098 |
|||
|
|
|
|
|
|
|
|
|
|
|
|
|
|
Base Rent PSF |
|
|
|
|
|
$35.26 |
|
$35.14 |
|
$35.62 |
|||
Commenced Rate |
|
|
|
|
|
93.5% |
|
93.5% |
|
93.9% |
|||
Leased Rate |
|
|
|
|
|
96.1% |
|
96.0% |
|
95.5% |
|||
|
|
|
|
|
|
|
|
|
|
|
|
|
|
Quarterly SPNOI |
|
|
|
|
|
6.2% |
|
2.5% |
|
3.0% |
|||
|
|
|
|
|
|
|
|
|
|
|
|||
TTM New Leasing (GLA in 000's) |
|
|
|
|
|
73 |
|
94 |
|
84 |
|||
TTM Renewals (GLA in 000's) |
|
|
|
|
|
216 |
|
253 |
|
225 |
|||
TTM Total Leasing (GLA in 000's) |
|
|
|
|
|
289 |
|
347 |
|
309 |
|||
|
|
|
|
|
|
|
|
|
|
|
|
|
|
TTM Cash New Rent Spreads |
|
|
|
|
|
15.3% |
|
27.8% |
|
30.5% |
|||
TTM Cash Renewal Rent Spreads |
|
|
|
|
|
8.5% |
|
10.5% |
|
10.3% |
|||
TTM Cash Blended New and Renewal Rent Spreads |
|
|
|
|
|
10.4% |
|
14.2% |
|
13.3% |
|||
|
|
|
|
|
|
|
|
|
|
|
|
|
|
TTM Straight-Lined New Rent Spreads |
|
|
|
|
|
33.0% |
|
47.7% |
|
54.0% |
|||
TTM Straight-Lined Renewal Rent Spreads |
|
|
|
|
|
18.1% |
|
21.2% |
|
21.2% |
|||
TTM Straight-Lined Blended New and Renewal Rent Spreads |
|
|
|
|
|
22.4% |
|
26.9% |
|
25.9% |
|||
|
|
|
|
|
|
|
|
|
|
|
|
|
|
|
|
|
|
|
|
|
|
|
|
|
|
|
|
Top 20 MSAs |
|
|
|
|
|
|
|
|
|
|
|
||
|
|
|
|
|
|
|
|
|
|
|
|
|
|
|
|
MSA |
Properties |
|
GLA |
|
% of GLA |
|
ABR |
|
% of ABR |
|
ABR PSF |
1 |
|
Miami-Fort Lauderdale-West Palm Beach, FL |
6 |
|
450 |
|
12.2% |
|
$15,699 |
|
12.9% |
|
$36.36 |
2 |
|
Atlanta-Sandy Springs-Alpharetta, GA |
14 |
|
396 |
|
10.7% |
|
11,403 |
|
9.4% |
|
$30.90 |
3 |
|
Phoenix-Mesa-Chandler, AZ |
13 |
|
300 |
|
8.1% |
|
11,332 |
|
9.3% |
|
$40.15 |
4 |
|
Orlando-Kissimmee-Sanford, FL |
4 |
|
225 |
|
6.1% |
|
8,687 |
|
7.1% |
|
$41.22 |
5 |
|
Houston-The Woodlands-Sugar Land, TX |
6 |
|
186 |
|
5.0% |
|
6,474 |
|
5.3% |
|
$41.59 |
6 |
|
San Francisco-Oakland-Hayward, CA |
2 |
|
128 |
|
3.5% |
|
5,872 |
|
4.8% |
|
$56.17 |
7 |
|
Jacksonville, FL |
6 |
|
211 |
|
5.7% |
|
5,404 |
|
4.4% |
|
$27.68 |
8 |
|
Los Angeles-Long Beach-Anaheim, CA |
4 |
|
146 |
|
4.0% |
|
5,382 |
|
4.4% |
|
$39.66 |
9 |
|
Denver-Aurora-Lakewood, CO |
6 |
|
142 |
|
3.8% |
|
4,935 |
|
4.1% |
|
$37.92 |
10 |
|
Charlotte-Concord-Gastonia, NC-SC |
4 |
|
177 |
|
4.8% |
|
4,036 |
|
3.3% |
|
$23.79 |
11 |
|
Tampa-St. Petersburg-Clearwater, FL |
4 |
|
117 |
|
3.2% |
|
3,957 |
|
3.3% |
|
$35.82 |
12 |
|
Sacramento-Roseville-Arden-Arcade, CA |
3 |
|
104 |
|
2.8% |
|
3,822 |
|
3.1% |
|
$39.46 |
13 |
|
Columbus, OH |
2 |
|
82 |
|
2.2% |
|
2,825 |
|
2.3% |
|
$35.90 |
14 |
|
Washington-Arlington-Alexandria, DC-VA-MD-WV |
3 |
|
49 |
|
1.3% |
|
2,496 |
|
2.1% |
|
$51.29 |
15 |
|
Austin-Round Rock-Georgetown, TX |
2 |
|
66 |
|
1.8% |
|
2,055 |
|
1.7% |
|
$31.41 |
16 |
|
Trenton, NJ |
1 |
|
62 |
|
1.7% |
|
1,867 |
|
1.5% |
|
$30.07 |
17 |
|
Memphis, TN-MS-AR |
1 |
|
66 |
|
1.8% |
|
1,487 |
|
1.2% |
|
$24.27 |
18 |
|
Raleigh, NC |
1 |
|
62 |
|
1.7% |
|
1,485 |
|
1.2% |
|
$30.04 |
19 |
|
Cleveland-Elyria, OH |
2 |
|
40 |
|
1.1% |
|
1,448 |
|
1.2% |
|
$43.83 |
20 |
|
Richmond, VA |
2 |
|
41 |
|
1.1% |
|
1,437 |
|
1.2% |
|
$34.88 |
|
|
Other |
39 |
|
639 |
|
17.3% |
|
19,396 |
|
16.0% |
|
$31.60 |
|
|
Total |
125 |
|
3,689 |
|
100.0% |
|
$121,499 |
|
100.0% |
|
$35.26 |
|
|
|
|
|
|
|
|
|
|
|
|
|
|
Note: $ and GLA in thousands except property count and base rent PSF. |
|||||||||||||
|
|||||||||||||
9
Curbline Properties Corp.
Capital Structure
$, shares and units in thousands, except per share |
|
|
|
|
|
|
|
|
June 30, 2025 |
|
December 31, 2024 |
Market Value Per Share |
$22.83 |
|
$23.22 |
|
|
|
|
Common Stock |
105,215 |
|
105,044 |
OP Units |
0 |
|
0 |
Total Common Stock |
105,215 |
|
105,044 |
|
|
|
|
Total Equity Market Capitalization |
$2,402,050 |
|
$2,439,122 |
|
|
|
|
Unsecured Revolver |
0 |
|
0 |
Unsecured Term Loan |
100,000 |
|
0 |
Total Debt |
100,000 |
|
0 |
Less: Cash(1) |
429,865 |
|
626,409 |
Net Debt |
(329,865) |
|
(626,409) |
|
|
|
|
Total Enterprise Value |
$2,072,185 |
|
$1,812,713 |
|
|
|
|
(1) Excludes $22.9 million and $0.8 million of acquisition escrow deposits as of June 30, 2025 and December 31, 2024, respectively. |
|||
10
Curbline Properties Corp.
Debt Detail
$ in thousands |
|
|
|
|
|
|
|
|
Balance |
|
Maturity |
|
Interest |
Bank Debt |
|
|
|
|
|
|
Unsecured Revolver ($400m) |
|
$0 |
|
Sep-29 |
|
SOFR+0.95% |
Unsecured Term Loan ($100m) |
|
100,000 |
|
Oct-29 |
|
4.68% |
Subtotal Debt |
|
$100,000 |
|
|
|
|
Unamortized Loan Costs, Net |
|
(910) |
|
|
|
|
Total Debt |
|
$99,090 |
|
|
|
|
|
|
|
|
|
|
|
|
|
|
|
|
|
|
|
|
|
|
|
|
|
(1) Maturity dates assumed all borrower extension options are exercised. |
||||||
(2) Rate excludes loan fees and unamortized loan costs. Interest rates are shown as swapped or capped all-in interest rate where applicable. |
||||||
|
||||||
11
Curbline Properties Corp.
Same Property Metrics
|
|
|
|
|
|
|
|
|
|
|
|
|
|
|
|
|
|
|
|
|
Same-Property Net Operating Income(1) |
||||||||
|
Quarterly Same-Property NOI |
|
Annual Same-Property NOI |
||||||
|
2Q25 |
|
2Q24 |
Change |
|
6M25 |
|
6M24 |
Change |
|
|
|
|
|
|
|
|
|
|
Same Property - Leased rate |
96.5% |
|
96.3% |
0.2% |
|
96.5% |
|
96.3% |
0.2% |
Same Property - Commenced rate |
93.9% |
|
94.1% |
(0.2%) |
|
93.9% |
|
94.1% |
(0.2%) |
|
|
|
|
|
|
|
|
|
|
Revenues: |
|
|
|
|
|
|
|
|
|
Minimum rents |
$19,833 |
|
$19,299 |
|
|
$39,621 |
|
$38,661 |
|
Recoveries |
6,790 |
|
5,938 |
|
|
13,384 |
|
11,821 |
|
Uncollectible revenue |
(80) |
|
(311) |
|
|
(147) |
|
(474) |
|
Percentage and overage rents |
269 |
|
232 |
|
|
362 |
|
331 |
|
Ancillary and other rental income |
381 |
|
319 |
|
|
817 |
|
630 |
|
|
27,193 |
|
25,477 |
6.7% |
|
54,037 |
|
50,969 |
6.0% |
Expenses: |
|
|
|
|
|
|
|
|
|
Operating and maintenance |
(3,207) |
|
(3,041) |
|
|
(6,822) |
|
(6,024) |
|
Real estate taxes |
(3,302) |
|
(2,967) |
|
|
(6,595) |
|
(6,025) |
|
|
(6,509) |
|
(6,008) |
8.3% |
|
(13,417) |
|
(12,049) |
11.4% |
Total Comparable SPNOI |
$20,684 |
|
$19,469 |
6.2% |
|
$40,620 |
|
$38,920 |
4.4% |
|
|
|
|
|
|
|
|
|
|
Non-Same Property NOI |
10,081 |
|
2,653 |
|
|
18,617 |
|
5,288 |
|
Total Curbline NOI |
$30,765 |
|
$22,122 |
39.1% |
|
$59,237 |
|
$44,208 |
34.0% |
|
|
|
|
|
|
|
|
|
|
Same Property NOI Operating Margin |
76.1% |
|
76.4% |
|
|
75.2% |
|
76.4% |
|
Same Property NOI Recovery Rate |
104.3% |
|
98.8% |
|
|
99.8% |
|
98.1% |
|
|
|||||||||
(1) See the definition in the Notable Accounting Policies and Non-GAAP Measures section and the GAAP reconciliation on page 8. |
|||||||||
12
Curbline Properties Corp.
Leasing Summary
Leasing Activity |
|
Net Effective Rents |
||||||||||||||||
|
Comparable Pool |
|
Total Pool |
|
|
|
CapEx PSF |
|
|
|||||||||
|
Count |
GLA |
ABR |
Cash |
Straight- |
|
Count |
GLA |
ABR |
Term |
|
GLA |
ABR |
TA & LL |
LC |
Total |
NER |
Term |
New Leases |
|
|
|
|
|
|
|
|
|
|
|
|
|
|
|
|
|
|
2Q25 |
11 |
24,543 |
$44.01 |
10.6% |
29.5% |
|
16 |
45,881 |
$40.03 |
11.6 |
|
26,845 |
$48.45 |
$4.43 |
$2.85 |
$7.28 |
$41.17 |
9.0 |
1Q25 |
11 |
33,808 |
$41.37 |
20.8% |
36.8% |
|
12 |
37,933 |
$40.24 |
9.6 |
|
37,933 |
$44.68 |
$5.24 |
$2.43 |
$7.67 |
$37.01 |
9.6 |
4Q24 |
4 |
7,375 |
$46.22 |
15.0% |
36.9% |
|
4 |
7,375 |
$46.22 |
8.4 |
|
7,375 |
$51.48 |
$6.02 |
$2.95 |
$8.97 |
$42.51 |
8.4 |
3Q24 |
3 |
7,113 |
$40.80 |
9.0% |
25.1% |
|
8 |
17,600 |
$50.14 |
10.7 |
|
8,737 |
$46.35 |
$2.55 |
$2.28 |
$4.83 |
$41.52 |
9.4 |
|
29 |
72,839 |
$42.69 |
15.3% |
33.0% |
|
40 |
108,789 |
$42.16 |
10.5 |
|
80,890 |
$46.73 |
$4.75 |
$2.60 |
$7.35 |
$39.38 |
9.3 |
|
|
|
|
|
|
|
|
|
|
|
|
|
|
|
|
|
|
|
Renewals |
|
|
|
|
|
|
|
|
|
|
|
|
|
|
|
|
|
|
2Q25 |
25 |
46,199 |
$34.47 |
8.3% |
20.0% |
|
26 |
47,599 |
$35.53 |
5.3 |
|
46,199 |
$36.53 |
$0.00 |
$0.00 |
$0.00 |
$36.53 |
5.5 |
1Q25 |
28 |
85,899 |
$37.96 |
8.3% |
17.9% |
|
28 |
85,899 |
$37.96 |
5.3 |
|
85,899 |
$39.59 |
$0.04 |
$0.00 |
$0.04 |
$39.55 |
5.3 |
4Q24 |
18 |
45,118 |
$29.54 |
9.5% |
16.9% |
|
18 |
45,118 |
$29.54 |
4.1 |
|
45,118 |
$30.30 |
$0.14 |
$0.00 |
$0.14 |
$30.16 |
4.1 |
3Q24 |
15 |
39,070 |
$32.47 |
8.1% |
17.7% |
|
15 |
39,070 |
$32.47 |
5.2 |
|
39,070 |
$33.98 |
$0.00 |
$0.02 |
$0.02 |
$33.96 |
5.2 |
|
86 |
216,286 |
$34.47 |
8.5% |
18.1% |
|
87 |
217,686 |
$34.70 |
5.1 |
|
216,286 |
$35.99 |
$0.05 |
$0.00 |
$0.05 |
$35.94 |
5.1 |
|
|
|
|
|
|
|
|
|
|
|
|
|
|
|
|
|
|
|
New + Renewals |
|
|
|
|
|
|
|
|
|
|
|
|
|
|
|
|
|
|
2Q25 |
36 |
70,742 |
$37.78 |
9.2% |
23.9% |
|
42 |
93,480 |
$37.74 |
8.4 |
|
73,044 |
$40.91 |
$2.17 |
$1.39 |
$3.56 |
$37.35 |
6.8 |
1Q25 |
39 |
119,707 |
$38.92 |
11.8% |
23.2% |
|
40 |
123,832 |
$38.66 |
6.6 |
|
123,832 |
$41.15 |
$2.35 |
$1.08 |
$3.43 |
$37.72 |
6.6 |
4Q24 |
22 |
52,493 |
$31.88 |
10.6% |
20.7% |
|
22 |
52,493 |
$31.88 |
4.7 |
|
52,493 |
$33.27 |
$1.61 |
$0.74 |
$2.35 |
$30.92 |
4.7 |
3Q24 |
18 |
46,183 |
$33.76 |
8.2% |
19.1% |
|
23 |
56,670 |
$37.96 |
6.9 |
|
47,807 |
$36.24 |
$0.73 |
$0.67 |
$1.40 |
$34.84 |
6.0 |
|
115 |
289,125 |
$36.54 |
10.4% |
22.4% |
|
127 |
326,475 |
$37.18 |
6.9 |
|
297,176 |
$38.91 |
$1.91 |
$1.03 |
$2.94 |
$35.97 |
6.2 |
|
|
|
|
|
|
|
|
|
|
|
|
|
|
|
|
|
|
|
|
||||||||||||||||||
Leasing Spreads
Net Effective Rents
13
Curbline Properties Corp.
Lease Expiration Schedule
$ and GLA in thousands |
|
|
|
|
|
|
|
|
|
|
|
|
|
|
|
|
|
|
|
|
|
|
|
|
|
|
Year |
# of |
|
Expiring |
% of SF |
ABR |
% of ABR |
|
Rent |
MTM |
6 |
|
11 |
0.3% |
$445 |
0.4% |
|
$40.53 |
2025 |
40 |
|
88 |
2.6% |
2,778 |
2.3% |
|
$31.71 |
2026 |
126 |
|
307 |
8.9% |
10,779 |
8.9% |
|
$35.09 |
2027 |
160 |
|
401 |
11.6% |
14,678 |
12.1% |
|
$36.38 |
2028 |
207 |
|
628 |
18.2% |
21,265 |
17.5% |
|
$33.84 |
2029 |
141 |
|
353 |
10.2% |
12,062 |
9.9% |
|
$34.19 |
2030 |
118 |
|
352 |
10.2% |
13,032 |
10.7% |
|
$36.98 |
2031 |
72 |
|
180 |
5.2% |
6,264 |
5.2% |
|
$34.79 |
2032 |
88 |
|
256 |
7.4% |
9,052 |
7.5% |
|
$35.32 |
2033 |
99 |
|
303 |
8.8% |
10,838 |
8.9% |
|
$35.73 |
2034 |
84 |
|
264 |
7.7% |
10,113 |
8.3% |
|
$38.24 |
Thereafter |
70 |
|
303 |
8.8% |
10,193 |
8.4% |
|
$33.68 |
Total |
1,211 |
|
3,446 |
100.0% |
$121,499 |
100.0% |
|
$35.26 |
|
|
|
|
|
|
|
|
|
Note: Before exercise of any lease options; includes ground leases. |
||||||||
14
Curbline Properties Corp.
Top 25 Tenants
$ and GLA in thousands |
|
|
|
|
|||
|
|
|
|
|
|
||
|
|
Tenant |
Units |
Base Rent |
% of Total |
GLA |
% of Total |
1 |
|
Starbucks |
28 |
$3,203 |
2.6% |
53 |
1.4% |
2 |
|
Verizon |
12 |
1,862 |
1.5% |
42 |
1.1% |
3 |
|
Darden (1) |
8 |
1,586 |
1.3% |
54 |
1.5% |
4 |
|
JPMorgan Chase |
8 |
1,521 |
1.3% |
34 |
0.9% |
5 |
|
Inspire Brands (2) |
19 |
1,447 |
1.2% |
38 |
1.0% |
6 |
|
AT&T |
18 |
1,317 |
1.1% |
38 |
1.0% |
7 |
|
Chipotle |
11 |
1,277 |
1.1% |
29 |
0.8% |
8 |
|
Total Wine & More |
2 |
1,259 |
1.0% |
49 |
1.3% |
9 |
|
JAB Holding (3) |
9 |
1,204 |
1.0% |
33 |
0.9% |
10 |
|
AFC Urgent Care |
8 |
1,198 |
1.0% |
41 |
1.1% |
11 |
|
Somnigroup (Mattress Firm) |
8 |
1,188 |
1.0% |
34 |
0.9% |
12 |
|
Chick-Fil-A |
6 |
1,057 |
0.9% |
31 |
0.8% |
13 |
|
FedEx Office |
7 |
1,015 |
0.8% |
29 |
0.8% |
14 |
|
Cracker Barrel (4) |
5 |
978 |
0.8% |
36 |
1.0% |
15 |
|
Brinker (Chili's) |
6 |
977 |
0.8% |
34 |
0.9% |
16 |
|
CVS |
4 |
947 |
0.8% |
38 |
1.0% |
17 |
|
Xponential Fitness (5) |
13 |
902 |
0.7% |
25 |
0.7% |
18 |
|
Restaurant Brands (6) |
12 |
902 |
0.7% |
29 |
0.8% |
19 |
|
Five Guys |
8 |
880 |
0.7% |
19 |
0.5% |
20 |
|
Wells Fargo |
5 |
879 |
0.7% |
21 |
0.6% |
21 |
|
Nordstrom Rack |
1 |
867 |
0.7% |
31 |
0.8% |
22 |
|
SITE Centers |
1 |
788 |
0.6% |
18 |
0.5% |
23 |
|
Amwins Insurance |
2 |
771 |
0.6% |
12 |
0.3% |
24 |
|
Torchy's Tacos |
4 |
758 |
0.6% |
17 |
0.5% |
25 |
|
Jersey Mike's |
13 |
741 |
0.6% |
22 |
0.6% |
|
|
Top 25 Total |
218 |
$29,524 |
24.3% |
807 |
21.9% |
|
|
Total Portfolio |
|
$121,499 |
100.0% |
3,689 |
100.0% |
|
|
|
|
|
|
|
|
(1) Longhorn Steakhouse (4) / Olive Garden (3) / Chuy's (1) |
|
||||||
(2) Dunkin (10) / Jimmy John's (5) / Buffalo Wild Wings (3) / Baskin Robbins (1) |
|
||||||
(3) Panera Bread (7) / Bruegger's Bagels (1) / Einstein Bros. Bagels (1) |
|
||||||
(4) Cracker Barrel (3) / Maple Street Biscuit (2) |
|
||||||
(5) Club Pilates (3) / Yoga Six (3) / Stretchlab (3) / Cyclebar (2) / Pure Barre (2) |
|
|
|||||
(6) Firehouse Subs (8) / Popeye's Chicken (3) / Burger King (1) |
|
|
|||||
15
Curbline Properties Corp.
Acquisitions
$ and GLA in thousands |
|
|
|
|
|
|
||
|
|
|
|
|
|
|
|
|
|
|
|
Owned |
|
|
|
||
|
|
Property Name |
MSA |
|
GLA |
|
Price |
|
|
|
|
|
|
|
|
|
|
01/16/25 |
|
Navarre Crossing |
Toledo, OH |
|
15 |
|
$4,950 |
|
01/24/25 |
|
Shops at Gilbert Crossroads - Phase II |
Phoenix-Mesa-Chandler, AZ |
|
3 |
|
2,700 |
|
02/24/25 |
|
Corner at Laveen Spectrum |
Phoenix-Mesa-Chandler, AZ |
|
15 |
|
10,350 |
|
02/27/25 |
|
6-Property Portfolio |
Jacksonville, FL |
|
211 |
|
86,300 |
|
03/31/25 |
|
Aramingo Assemblage |
Philadelphia-Camden-Wilmington, PA-NJ-DE-MD |
|
23 |
|
14,790 |
|
03/31/25 |
|
Corner at 240 |
Asheville, NC |
|
18 |
|
5,100 |
|
|
|
|
Total 1Q 2025 |
|
285 |
|
$124,190 |
|
|
|
|
|
|
|
|
|
|
04/11/25 |
|
3-Property Portfolio |
Various |
|
20 |
|
$11,000 |
|
04/17/25 |
|
Magnolia Point - Phase III |
Houston-The Woodlands-Sugar Land, TX |
|
7 |
|
1,583 |
|
04/21/25 |
|
Shops on North Avenue |
Chicago-Naperville-Elsin IL-IN-WI |
|
3 |
|
2,300 |
|
05/09/25 |
|
Shops on Highway 100 |
Milwaukee-Waukesha-West Allis, WI |
|
14 |
|
4,475 |
|
05/14/25 |
|
Salmon Creek Square |
Portland-Vancouver-Hillsboro, OR-WA |
|
22 |
|
11,625 |
|
05/14/25 |
|
Shops on Dobson |
Phoenix-Mesa-Chandler, AZ |
|
7 |
|
2,709 |
|
05/22/25 |
|
Plaza at Stacy Green |
Dallas-Fort Worth-Arlington, TX |
|
24 |
|
15,160 |
|
05/22/25 |
|
Jericho Crossing |
New York-Newark-Jersey City, NY-NJ-PA |
|
13 |
|
9,450 |
|
06/03/25 |
|
Dawson Marketplace Plaza |
Atlanta-Sandy Springs-Alpharetta, GA |
|
10 |
|
6,847 |
|
06/05/25 |
|
Shoppes at Alabaster |
Birmingham-Hoover, AL |
|
12 |
|
3,960 |
|
06/11/25 |
|
Orland Park Center |
Chicago-Naperville-Elsin IL-IN-WI |
|
9 |
|
3,350 |
|
06/16/25 |
|
Shops at Carson Town Center |
Los Angeles-Long Beach-Anaheim, CA |
|
13 |
|
8,205 |
|
06/27/25 |
|
Westside Shoppes |
Orlando-Kissimmee-Sanford, FL |
|
70 |
|
39,000 |
|
06/27/25 |
|
Shops at Wyoming Mall |
Albuquerque-Santa Fe-Los Alamos, NM |
|
42 |
|
14,650 |
|
06/27/25 |
|
Shops at Healthway |
Cleveland-Elyria, OH |
|
11 |
|
8,150 |
|
06/30/25 |
|
Sunset Crossing |
Columbia, SC |
|
13 |
|
6,847 |
|
06/30/25 |
|
Shops at Sunrise Oaks |
Sacramento-Roseville-Arden-Arcade, CA |
|
16 |
|
5,595 |
|
|
|
|
Total 2Q 2025 |
|
306 |
|
$154,906 |
|
|
|
|
|
|
|
|
|
|
07/07/25 |
|
Avalon Crossing |
San Francisco-Oakland-Hayward, CA |
|
12 |
|
$9,280 |
|
07/21/25 |
|
Ellingson Crossing |
Seattle-Tacoma-Bellevue, WA |
|
15 |
|
8,000 |
|
07/24/25 |
|
The Monterey |
Las Vegas, NV |
|
42 |
|
22,000 |
|
07/24/25 |
|
23-Property Portfolio |
Various |
|
422 |
|
158,930 |
|
07/25/25 |
|
Mockingbird Central Plaza |
Dallas-Fort Worth-Arlington, TX |
|
80 |
|
41,900 |
|
07/25/25 |
|
Silverlake Shopping Center |
Houston-The Woodlands-Sugar Land, TX |
|
25 |
|
13,000 |
|
07/25/25 |
|
College Park Corner |
Indianapolis-Carmel-Greenwood, IN |
|
12 |
|
7,276 |
|
|
|
|
3Q 2025 QTD |
|
608 |
|
$260,386 |
|
|
|
|
|
|
|
|
|
|
|
|
|
Total 2025 YTD |
|
1,199 |
|
$539,482 |
|
|
|
|
|
|
|
|
|
|
16
Curbline Properties Corp.
Property List
GLA in thousands; as of June 30, 2025
# |
Center |
MSA |
Location |
ST |
Owned |
ABR |
1 |
Shops at Tiger Town |
Auburn-Opelika, AL |
Opelika |
AL |
10 |
$26.44 |
2 |
Promenade Plaza |
Birmingham-Hoover, AL |
Alabaster |
AL |
13 |
$27.10 |
3 |
Shoppes at Alabaster |
Birmingham-Hoover, AL |
Alabaster |
AL |
12 |
$24.38 |
4 |
Hampton Cove Corner |
Huntsville, AL |
Huntsville |
AL |
14 |
$24.39 |
5 |
Madison Station |
Huntsville, AL |
Madison |
AL |
28 |
$23.20 |
6 |
Shops at Saraland |
Mobile, AL |
Saraland |
AL |
10 |
$19.55 |
7 |
Eastchase Point |
Montgomery, AL |
Montgmery |
AL |
8 |
$25.98 |
8 |
Chandler Center |
Phoenix-Mesa-Chandler, AZ |
Chandler |
AZ |
7 |
$43.58 |
9 |
Shops at Gilbert Crossroads |
Phoenix-Mesa-Chandler, AZ |
Gilbert |
AZ |
18 |
$39.58 |
10 |
Corner at Laveen Spectrum |
Phoenix-Mesa-Chandler, AZ |
Laveen |
AZ |
15 |
$40.77 |
11 |
Shops at Power and Baseline |
Phoenix-Mesa-Chandler, AZ |
Mesa |
AZ |
4 |
$56.22 |
12 |
Shops on Dobson |
Phoenix-Mesa-Chandler, AZ |
Mesa |
AZ |
7 |
$26.35 |
13 |
Shops at Lake Pleasant |
Phoenix-Mesa-Chandler, AZ |
Peoria |
AZ |
47 |
$41.38 |
14 |
Deer Valley Plaza |
Phoenix-Mesa-Chandler, AZ |
Phoenix |
AZ |
38 |
$35.29 |
15 |
Paradise Village Plaza |
Phoenix-Mesa-Chandler, AZ |
Phoenix |
AZ |
84 |
$36.28 |
16 |
Red Mountain Corner |
Phoenix-Mesa-Chandler, AZ |
Phoenix |
AZ |
6 |
$24.74 |
17 |
Artesia Village |
Phoenix-Mesa-Chandler, AZ |
Scottsdale |
AZ |
21 |
$41.97 |
18 |
Northsight Plaza |
Phoenix-Mesa-Chandler, AZ |
Scottsdale |
AZ |
10 |
$37.85 |
19 |
Shops at Prasada North |
Phoenix-Mesa-Chandler, AZ |
Surprise |
AZ |
33 |
$55.33 |
20 |
Broadway Center |
Phoenix-Mesa-Chandler, AZ |
Tempe |
AZ |
11 |
$38.14 |
21 |
Shops at Carson Town Center |
Los Angeles-Long Beach-Anaheim, CA |
Carson |
CA |
13 |
$34.37 |
22 |
Crossroads Marketplace |
Los Angeles-Long Beach-Anaheim, CA |
Chino Hills |
CA |
77 |
$35.17 |
23 |
Shops on Summit |
Los Angeles-Long Beach-Anaheim, CA |
Fontana |
CA |
27 |
$46.32 |
24 |
Santa Margarita Market Place |
Los Angeles-Long Beach-Anaheim, CA |
Rancho Santa Margarita |
CA |
29 |
$47.44 |
25 |
Shops at Sunrise Oaks |
Sacramento-Roseville-Arden-Arcade, CA |
Citrus Heights |
CA |
16 |
$26.68 |
26 |
Creekside Plaza |
Sacramento-Roseville-Arden-Arcade, CA |
Roseville |
CA |
32 |
$43.57 |
27 |
Creekside Shops |
Sacramento-Roseville-Arden-Arcade, CA |
Roseville |
CA |
57 |
$40.76 |
28 |
Loma Alta Station |
San Diego-Carlsbad, CA |
Oceanside |
CA |
35 |
$26.70 |
29 |
La Fiesta Square |
San Francisco-Oakland-Hayward, CA |
Lafayette |
CA |
75 |
$52.12 |
30 |
Lafayette Mercantile |
San Francisco-Oakland-Hayward, CA |
Lafayette |
CA |
53 |
$60.46 |
31 |
Shops at Olde Town Station |
Denver-Aurora-Lakewood, CO |
Arvada |
CO |
15 |
$40.12 |
32 |
Parker Keystone |
Denver-Aurora-Lakewood, CO |
Denver |
CO |
17 |
$41.89 |
33 |
Shops at University Hills |
Denver-Aurora-Lakewood, CO |
Denver |
CO |
26 |
$45.17 |
34 |
Shops on Montview |
Denver-Aurora-Lakewood, CO |
Denver |
CO |
9 |
$38.13 |
35 |
Nine Mile Corner |
Denver-Aurora-Lakewood, CO |
Erie |
CO |
31 |
$40.83 |
36 |
Parker Station |
Denver-Aurora-Lakewood, CO |
Parker |
CO |
45 |
$30.00 |
37 |
Estero Crossing |
Cape Coral-Fort Mysers, FL |
Estero |
FL |
34 |
$34.00 |
38 |
Carrie Plaza |
Jacksonville, FL |
Jacksonville |
FL |
26 |
$24.99 |
39 |
Deerwood Station |
Jacksonville, FL |
Jacksonville |
FL |
31 |
$29.86 |
40 |
Southlake Plaza |
Jacksonville, FL |
St. Augustine |
FL |
32 |
$27.29 |
41 |
Julington Station |
Jacksonville, FL |
St. Johns |
FL |
31 |
$24.96 |
42 |
Oakleaf Crossing |
Jacksonville, FL |
Jacksonville |
FL |
31 |
$33.34 |
43 |
Roosevelt Plaza |
Jacksonville, FL |
Jacksonville |
FL |
59 |
$26.24 |
44 |
Shops at Boca Center |
Miami-Fort Lauderdale-West Palm Beach, FL |
Boca Raton |
FL |
117 |
$44.24 |
45 |
Shoppes at Addison Place |
Miami-Fort Lauderdale-West Palm Beach, FL |
Delray Beach |
FL |
56 |
$48.02 |
46 |
Concourse Village |
Miami-Fort Lauderdale-West Palm Beach, FL |
Jupiter |
FL |
134 |
$19.47 |
47 |
Collection at Midtown Miami |
Miami-Fort Lauderdale-West Palm Beach, FL |
Miami |
FL |
119 |
$42.52 |
48 |
Shops at the Fountains |
Miami-Fort Lauderdale-West Palm Beach, FL |
Plantation |
FL |
14 |
$36.14 |
49 |
Shops at Midway |
Miami-Fort Lauderdale-West Palm Beach, FL |
Tamarac |
FL |
10 |
$47.48 |
50 |
Shops at Carillon |
Naples-Immokalee-Marco Island, FL |
Naples |
FL |
15 |
$28.61 |
51 |
Shops at Casselberry |
Orlando-Kissimmee-Sanford, FL |
Casselberry |
FL |
8 |
$38.50 |
52 |
Narcoossee Cove |
Orlando-Kissimmee-Sanford, FL |
Orlando |
FL |
16 |
$49.12 |
53 |
Shops at the Grove |
Orlando-Kissimmee-Sanford, FL |
Winter Garden |
FL |
131 |
$42.99 |
54 |
Sunrise Plaza |
Sebastian-Vero Beack-West Vero Corridor FL |
Vero Beach |
FL |
16 |
$24.94 |
55 |
Shops at Lake Brandon |
Tampa-St. Petersburg-Clearwater, FL |
Brandon |
FL |
12 |
$40.84 |
56 |
Shoppes of Boot Ranch |
Tampa-St. Petersburg-Clearwater, FL |
Palm Harbor |
FL |
52 |
$30.60 |
17
Curbline Properties Corp.
Property List
GLA in thousands; as of June 30, 2025
# |
Center |
MSA |
Location |
ST |
Owned |
ABR |
57 |
Shops at Bay Pines |
Tampa-St. Petersburg-Clearwater, FL |
Seminole |
FL |
9 |
$36.96 |
58 |
Southtown Center |
Tampa-St. Petersburg-Clearwater, FL |
Tampa |
FL |
44 |
$41.13 |
59 |
Westside Shoppes |
Tampa-St. Petersburg-Clearwater, FL |
Windemere |
FL |
70 |
$35.97 |
60 |
Alpha Soda Center |
Atlanta-Sandy Springs-Alpharetta, GA |
Alpharetta |
GA |
15 |
$41.84 |
61 |
Shoppes of Crabapple |
Atlanta-Sandy Springs-Alpharetta, GA |
Alpharetta |
GA |
8 |
$30.96 |
62 |
Brookhaven Station |
Atlanta-Sandy Springs-Alpharetta, GA |
Atlanta |
GA |
44 |
$36.83 |
63 |
Hammond Springs |
Atlanta-Sandy Springs-Alpharetta, GA |
Atlanta |
GA |
69 |
$33.54 |
64 |
Parkwood Shops |
Atlanta-Sandy Springs-Alpharetta, GA |
Atlanta |
GA |
20 |
$26.02 |
65 |
Marketplace Plaza North |
Atlanta-Sandy Springs-Alpharetta, GA |
Cumming |
GA |
37 |
$33.68 |
66 |
Marketplace Plaza South |
Atlanta-Sandy Springs-Alpharetta, GA |
Cumming |
GA |
44 |
$30.08 |
67 |
Dawson Marketplace Plaza |
Atlanta-Sandy Springs-Alpharetta, GA |
Dawsonville |
GA |
10 |
$46.35 |
68 |
Plaza at Market Square |
Atlanta-Sandy Springs-Alpharetta, GA |
Douglasville |
GA |
9 |
$16.28 |
69 |
Barrett Corners |
Atlanta-Sandy Springs-Alpharetta, GA |
Kennesaw |
GA |
19 |
$46.59 |
70 |
Roswell Market Center |
Atlanta-Sandy Springs-Alpharetta, GA |
Roswell |
GA |
82 |
$17.64 |
71 |
Presidential Plaza North |
Atlanta-Sandy Springs-Alpharetta, GA |
Snellville |
GA |
10 |
$43.02 |
72 |
Presidential Plaza South |
Atlanta-Sandy Springs-Alpharetta, GA |
Snellville |
GA |
11 |
$42.50 |
73 |
Scenic Plaza |
Atlanta-Sandy Springs-Alpharetta, GA |
Snellville |
GA |
20 |
$30.00 |
74 |
Shops on North Avenue |
Chicago-Naperville-Elsin IL-IN-WI |
Chicago |
IL |
3 |
$47.95 |
75 |
Orland Park Center |
Chicago-Naperville-Elsin IL-IN-WI |
Orland Park |
IL |
9 |
$24.12 |
76 |
Wilmette Center |
Chicago-Naperville-Elsin IL-IN-WI |
Wilmette |
IL |
9 |
$29.97 |
77 |
Shops at West Carmel Marketplace |
Indianapolis-Carmel-Greenwood, IN |
Carmel |
IN |
32 |
$24.12 |
78 |
Shops at Framingham |
Boston-Cambridge-Newton, MA-NH |
Framingham |
MA |
19 |
$61.23 |
79 |
Foxtail Center |
Baltimore-Columbia-Towson, MD |
Timonium |
MD |
30 |
$38.17 |
80 |
Shops at Riverdale Commons |
Minneapolis-St. Paul-Bloomington, MN-WI |
Coon Rapids |
MN |
10 |
$53.44 |
81 |
Independence Point |
Kansas City, MO-KS |
Independence |
MO |
7 |
$41.22 |
82 |
Corner at 240 |
Asheville, NC |
Asheville |
NC |
18 |
$17.22 |
83 |
Belgate Plaza |
Charlotte-Concord-Gastonia, NC-SC |
Charlotte |
NC |
21 |
$37.13 |
84 |
Point at University |
Charlotte-Concord-Gastonia, NC-SC |
Charlotte |
NC |
14 |
$38.65 |
85 |
Shops at The Fresh Market |
Charlotte-Concord-Gastonia, NC-SC |
Cornelius |
NC |
132 |
$18.55 |
86 |
Carolina Station |
Charlotte-Concord-Gastonia, NC-SC |
Charlotte |
NC |
10 |
$41.59 |
87 |
Meadowmont Village |
Raleigh, NC |
Chapel Hill |
NC |
62 |
$30.04 |
88 |
Freehold Marketplace |
New York-Newark-Jersey City, NY-NJ-PA |
Freehold |
NJ |
21 |
$37.18 |
89 |
Shops at Hamilton |
Trenton, NJ |
Hamilton |
NJ |
62 |
$30.07 |
90 |
Shops at Echelon Village |
Philadelphia-Camden-Wilmington, PA-NJ-DE-MD |
Voorhees |
NJ |
4 |
$49.52 |
91 |
Shops at Wyoming Mall |
Albuquerque, NM |
Albuquerque |
NM |
42 |
$24.95 |
92 |
Jericho Crossing |
New York-Newark-Jersey City, NY-NJ-PA |
Huntington Station |
NY |
13 |
$45.56 |
93 |
Shops at Healthway |
Cleveland-Elyria, OH |
Avon |
OH |
11 |
$49.74 |
94 |
Crocker Commons |
Cleveland-Elyria, OH |
Westlake |
OH |
29 |
$41.92 |
95 |
Shops on Polaris |
Columbus, OH |
Columbus |
OH |
71 |
$35.39 |
96 |
Worthington Plaza |
Columbus, OH |
Worthington |
OH |
11 |
$38.92 |
97 |
Navarre Crossing |
Toledo, OH |
Oregon |
OH |
15 |
$27.92 |
98 |
Shops at Tanasbourne |
Portland-Vancouver-Hillsboro, OR-WA |
Hillsboro |
OR |
5 |
$32.60 |
99 |
Aramingo Assemblage |
Philadelphia-Camden-Wilmington, PA-NJ-DE-MD |
Philadelphia |
PA |
23 |
$27.78 |
100 |
Sunset Crossing |
Columbia, SC |
Lexington |
SC |
13 |
$34.49 |
101 |
Houston Levee Galleria |
Memphis, TN-MS-AR |
Collierville |
TN |
66 |
$24.27 |
102 |
Maple Corner |
Nashville-Davidson-Murfreesboro-Franklin, TN |
Hendersonville |
TN |
20 |
$29.71 |
103 |
Plaza at Stacy Green |
Austin, TX |
Allen |
TX |
24 |
$45.28 |
104 |
Oaks at Slaughter |
Austin, TX |
Austin |
TX |
26 |
$36.24 |
105 |
Vintage Plaza |
Austin, TX |
Round Rock |
TX |
41 |
$28.26 |
106 |
Grove at Harper's Preserve |
Houston-The Woodlands-Sugar Land, TX |
Conroe |
TX |
21 |
$33.20 |
107 |
Briarcroft Center |
Houston-The Woodlands-Sugar Land, TX |
Houston |
TX |
33 |
$43.07 |
108 |
Marketplace at 249 |
Houston-The Woodlands-Sugar Land, TX |
Houston |
TX |
17 |
$37.83 |
109 |
Shops at Tanglewood |
Houston-The Woodlands-Sugar Land, TX |
Houston |
TX |
26 |
$51.12 |
110 |
Village Plaza |
Houston-The Woodlands-Sugar Land, TX |
Houston |
TX |
42 |
$42.04 |
111 |
Magnolia Point |
Houston-The Woodlands-Sugar Land, TX |
Magnolia |
TX |
47 |
$41.40 |
112 |
Bandera Corner |
San Antonio-New Braunfels, TX |
San Antonio |
TX |
3 |
$22.46 |
18
Curbline Properties Corp.
Property List
GLA in thousands; as of June 30, 2025
# |
Center |
MSA |
Location |
ST |
Owned |
ABR |
113 |
Shops at Bandera Pointe |
San Antonio-New Braunfels, TX |
San Antonio |
TX |
48 |
$26.09 |
114 |
Emmet Street North |
Charlottesville, VA |
Charlottesville |
VA |
2 |
$78.55 |
115 |
Emmet Street Station |
Charlottesville, VA |
Charlottesville |
VA |
11 |
$52.46 |
116 |
Towne Crossing Shops |
Richmond, VA |
Midlothian |
VA |
7 |
$40.29 |
117 |
White Oak Plaza |
Richmond, VA |
Richmond |
VA |
34 |
$33.75 |
118 |
Boulevard Marketplace |
Washington-Arlington-Alexandria, DC-VA-MD-WV |
Fairfax |
VA |
19 |
$43.31 |
119 |
Fairfax Marketplace |
Washington-Arlington-Alexandria, DC-VA-MD-WV |
Fairfax |
VA |
19 |
$59.60 |
120 |
Fairfax Pointe |
Washington-Arlington-Alexandria, DC-VA-MD-WV |
Fairfax |
VA |
10 |
$51.05 |
121 |
Samish Corner |
Bellingham, WA |
Bellingham |
WA |
9 |
$33.37 |
122 |
Village at Maple Leaf |
Seattle-Tacoma-Bellevue, WA |
Seattle |
WA |
6 |
$34.16 |
123 |
University Village Crossing |
Seattle-Tacoma-Bellevue, WA |
Seattle |
WA |
4 |
$49.42 |
124 |
Salmon Creek Square |
Portland-Vancouver-Hillsboro, OR-WA |
Vancouver |
WA |
22 |
$34.73 |
125 |
Shops at Highway 100 |
Milwaukee-Waukesha-West Allis, WI |
West Allis |
WI |
14 |
$25.59 |
|
|
|
|
|
|
|
19
Curbline Properties Corp.
Notable Accounting Policies and Non-GAAP Measures
The information contained in the Quarterly Financial Supplement does not purport to disclose all items required by the accounting principles generally accepted in the United States of America (“GAAP”) and is unaudited information. The Company’s Quarterly Financial Supplement should be read in conjunction with the Company’s Annual Reports on Form 10-K and Quarterly Reports on Form 10-Q.
Prior to the Spin-off
The historical results of operations, liquidity and capital resources of Curbline prior to the spin-off do not represent the historical results of operations, liquidity and capital resources of a legal entity, but rather a combination of entities under common control that have been “carved out” of SITE Centers’ consolidated financial statements and presented on a combined basis, in each case, in accordance with GAAP.
Performance Measures
FFO and Operating FFO
The Company believes that Funds from Operations (“FFO”) and Operating FFO, both non-GAAP financial measures, provide additional and useful means to assess the financial performance of REITs. FFO and Operating FFO are frequently used by the real estate industry, as well as securities analysts, investors and other interested parties, to evaluate the performance of REITs. The Company also believes that FFO and Operating FFO more appropriately measure the core operations of the Company and provide benchmarks to its peer group.
FFO excludes GAAP historical cost depreciation and amortization of real estate and real estate investments, which assume that the value of real estate assets diminishes ratably over time. Historically, however, real estate values have risen or fallen with market conditions, and many companies use different depreciable lives and methods. Because FFO excludes depreciation and amortization unique to real estate and gains and losses from property dispositions, it can provide a performance measure that, when compared year over year, reflects the impact on operations from trends in occupancy rates, rental rates, operating costs, interest costs and acquisition, disposition and development activities. This provides a perspective of the Company’s financial performance not immediately apparent from net income determined in accordance with GAAP.
FFO is generally defined and calculated by the Company as net income attributable to Curbline (computed in accordance with GAAP), adjusted to exclude (i) gains and losses from disposition of real estate property, which are presented net of taxes, (ii) impairment charges on real estate property, (iii) gains and losses from changes in control and (iv) certain non-cash items. These non-cash items principally include real property depreciation and amortization of intangibles net of depreciation allocated to non-controlling interests. The Company’s calculation of FFO is consistent with the definition of FFO provided by NAREIT.
The Company believes that certain charges, income and gains/losses recorded in its operating results are not comparable or reflective of its core operating performance. Operating FFO is useful to investors as the Company removes non-comparable charges, income and gains to analyze the results of its operations and assess performance of the core operating real estate portfolio. As a result, the Company also computes Operating FFO and discusses it with the users of its financial statements, in addition to other measures such as net income (loss) determined in accordance with GAAP and FFO. Operating FFO is generally defined and calculated by the Company as FFO excluding certain charges, income and gains/losses that management believes are not comparable and indicative of the results of the Company’s operating real estate portfolio. Such adjustments include gains/losses on the early extinguishments of debt, transaction costs and other restructuring type costs, including employee separation costs. The disclosure of these adjustments is regularly requested by users of the Company’s financial statements. The adjustment for these charges, income and gains/losses may not be comparable to how other REITs or real estate companies calculate their results of operations, and the Company’s calculation of Operating FFO differs from NAREIT’s definition of FFO. Additionally, the Company provides no assurances that these charges, income and gains/losses are non-recurring. These charges, income and gains/losses could be reasonably expected to recur in future results of operations.
These measures of performance are used by the Company for several business purposes and by other REITs. The Company uses FFO and/or Operating FFO in part (i) as a disclosure to improve the understanding of the Company’s operating results among the investing public, (ii) as a measure of a real estate asset’s performance, (iii) to influence acquisition, disposition and capital investment strategies and (iv) to compare the Company’s performance to that of other publicly traded shopping center REITs. For the reasons described above, management believes that FFO and
20
Operating FFO provide the Company and investors with an important indicator of the Company’s operating performance. They provide recognized measures of performance other than GAAP net income, which may include non-cash items (often significant).
In calculating the expected range for or amount of net income attributable to Curbline to estimate projected FFO and Operating FFO for future periods, the Company does not include a projection of gains and losses from the disposition of real estate property, potential impairments and reserves of real estate property, debt extinguishment costs or transaction costs. Other real estate companies may calculate expected FFO and Operating FFO in a different manner.
Management recognizes the limitations of FFO and Operating FFO when compared to GAAP’s net income. FFO and Operating FFO do not represent amounts available for dividends, capital replacement or expansion, debt service obligations or other commitments and uncertainties. Management does not use FFO or Operating FFO as an indicator of the Company’s cash obligations and funding requirements for future commitments, acquisitions or development activities. Neither FFO nor Operating FFO represents cash generated from operating activities in accordance with GAAP, and neither is necessarily indicative of cash available to fund cash needs. Neither FFO nor Operating FFO should be considered an alternative to net income (computed in accordance with GAAP) or as an alternative to cash flow as a measure of liquidity. FFO and Operating FFO are simply used as additional indicators of the Company’s operating performance. The Company believes that to further understand its performance, FFO and Operating FFO should be compared with the Company’s reported net income (loss) and considered in addition to cash flows determined in accordance with GAAP, as presented in its condensed financial statements. Reconciliations of these measures to their most directly comparable GAAP measure of net income (loss) have been provided herein.
Net Operating Income (“NOI”) and Same-Property Net Operating Income (“SPNOI”)
The Company uses NOI, which is a non-GAAP financial measure, as a supplemental performance measure. NOI is calculated as property revenues less property-related expenses and excludes depreciation and amortization expense, interest income and expense and corporate level transactions. The Company believes NOI provides useful information to investors regarding the Company’s financial condition and results of operations because it reflects only those income and expense items that are incurred at the property level and, when compared across periods, reflects the impact on operations from trends in occupancy rates, rental rates, operating costs and acquisition and disposition activity on an unleveraged basis.
The Company also presents NOI information on a same-property basis, or SPNOI. The Company defines SPNOI as property revenues less property-related expenses, which exclude straight-line rental income and reimbursements and expenses, lease termination income, management fee expense and fair market value of leases. SPNOI only includes assets owned for the entirety of both comparable periods. SPNOI excludes all non-property and corporate level revenue and expenses. Other real estate companies may calculate NOI and SPNOI in a different manner. The Company believes SPNOI provides investors with additional information regarding the operating performances of comparable assets because it excludes certain non-cash and non-comparable items as noted above. SPNOI is frequently used by the real estate industry, as well as securities analysts, investors and other interested parties, to evaluate the performance of REITs.
SPNOI is not, and is not intended to be, a presentation in accordance with GAAP. SPNOI information has its limitations as it excludes any capital expenditures associated with the re-leasing of tenant space or as needed to operate the assets. SPNOI does not represent amounts available for dividends, capital replacement or expansion, debt service obligations or other commitments and uncertainties. Management does not use SPNOI as an indicator of the Company’s cash obligations and funding requirements for future commitments, acquisitions or development activities. SPNOI does not represent cash generated from operating activities in accordance with GAAP and is not necessarily indicative of cash available to fund cash needs. SPNOI should not be considered as an alternative to net income (computed in accordance with GAAP) or as an alternative to cash flow as a measure of liquidity. A reconciliation of NOI and SPNOI to its most directly comparable GAAP measure of net income (loss) has been provided herein.
21

CURBLINE PROPERTIES INVESTOR RELATIONS DEPARTMENT e: ir@curbline.com w: curbline.com 323 Park Avenue, 27th Floor, New York, NY 10022; 3300 Enterprise Pkwy Beachwood, OH 44122 tf: 833-610-0761 p:216-755-6200 f:216-274-9711 • NYSE:CURB CURB LISTED NYSE
22