| : THFF |
| Forward-looking Information This presentation contains future oral and written statements of the Company and its management, forward-looking statements within the meaning of the Private Securities Litigation Reform Act of 1995 with respect to the financial condition, results of operations, plans, objectives, future performance and business of the Company. Forward-looking statements are generally identifiable by the use of words such as “believe”, “expect”, “anticipate”, “estimate”, “could”, and other similar expressions. All statements in this presentation, including forward-looking statements, speak only as of today’s date, and the Company undertakes no obligation to update any statement in light of new information or future events. A number of factors, many of which are beyond the ability of the Company to control or predict, could cause actual results to differ materially from those in its forward-looking statements. Additional information is included in the Company’s filings with the Securities and Exchange Commission. Factors that could have a material adverse effect on the Company’s financial condition, results of operations and future prospects can be found in the “Risk Factors” section in the Company’s Annual Report on Form 10-K for the year ended December 31, 2024 and elsewhere in the Company’s periodic and current reports filed with the Securities and Exchange Commission. These factors include, but are not limited to, the effects of future economic, business and market conditions and changes, domestic and foreign, including competition, governmental policies and seasonality; legislative and regulatory changes, including changes in banking, securities and tax laws and regulations and their application by Company regulators, and changes in the scope and cost of FDIC insurance and other coverages; the risks of changes in interest rates on the levels, composition and costs of deposits, loan demand and other interest sensitive assets and liabilities; the failure of assumptions and estimates underlying the establishment of reserves for possible loan losses, analysis of capital needs and other estimates; changes in borrowers’ credit risks and payment behaviors; and changes in the availability and cost of credit and capital. 2 |
| Norman D. Lowery President & Chief Executive Officer Rodger A. McHargue Chief Financial Officer, SVP Stephen P. Panagouleas Chief Credit Officer, SVP 3 |
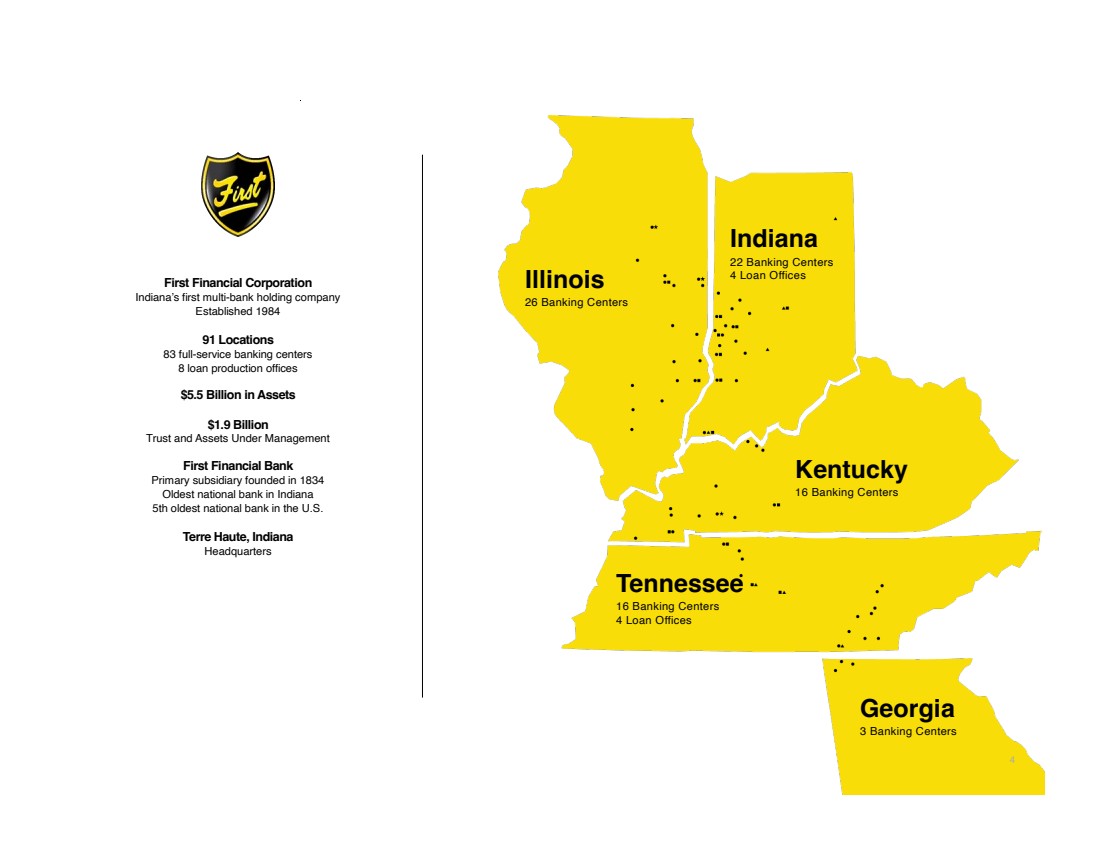
| Illinois 26 Banking Centers Indiana 22 Banking Centers 4 Loan Offices Kentucky 16 Banking Centers Tennessee 16 Banking Centers 4 Loan Offices First Financial Corporation Indiana’s first multi-bank holding company Established 1984 91 Locations 83 full-service banking centers 8 loan production offices $5.5 Billion in Assets $1.9 Billion Trust and Assets Under Management First Financial Bank Primary subsidiary founded in 1834 Oldest national bank in Indiana 5th oldest national bank in the U.S. Terre Haute, Indiana Headquarters Georgia 3 Banking Centers 4 |
| Best Bank Tribune-Star Readers’ Choice Top 50 Best U.S. Bank Bank Director Magazine Our Vision To be the foundation of community prosperity and trust for generations to come. Our Mission Empowering you with secure and innovative financial solutions focusing on quality of life. Our Values Start with SOUNDNESS The strongest foundation for success is based on experience and stability. Prioritize GROWTH Avoiding complacency with a focus on continuous improvement. Deliver VALUE Solve for every client need. Find the SOLUTION Get the job done, obstacles are not excuses, they are opportunities. Be ACCOUNTABLE Set ambitious goals and communicate transparently. Build COMMUNITY Foster a culture of respect, belonging, & support, internally and externally. 5-Star Rating BauerFinancial Best Ag Lender Pennyrile's Best Magazine 5 |
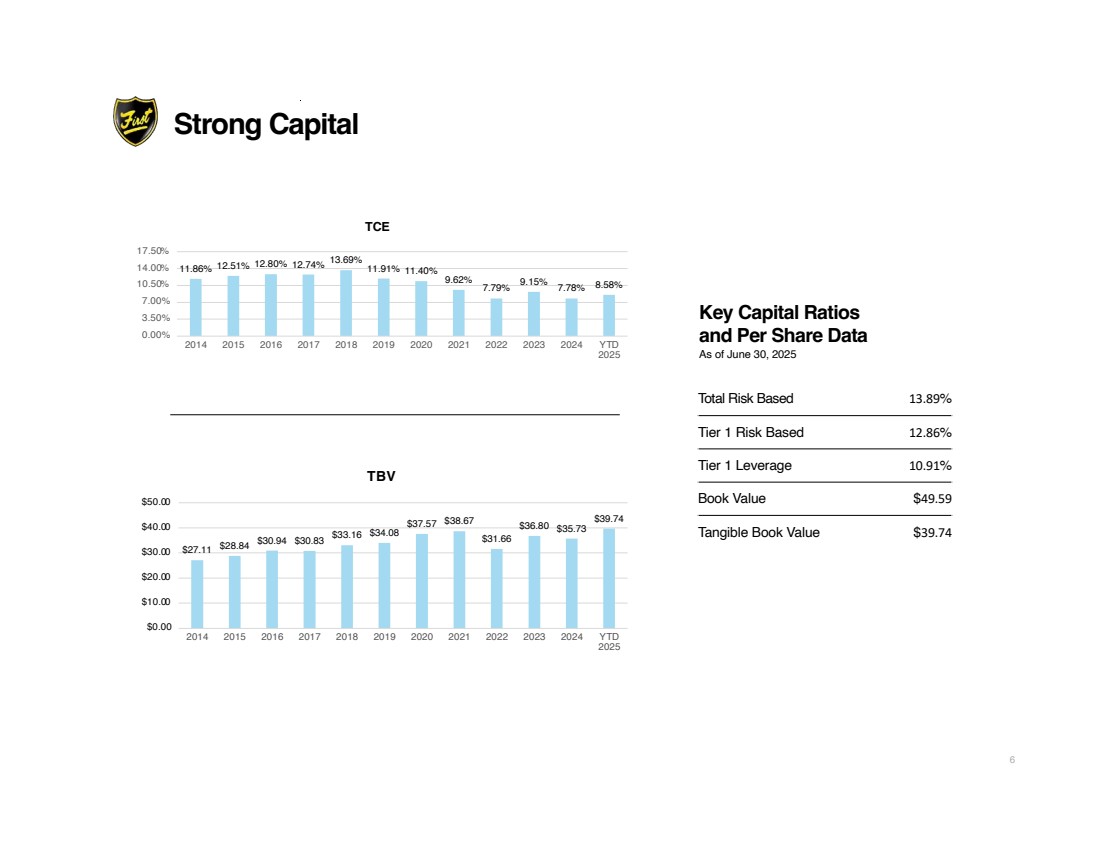
| TBV $27.11 $28.84 $30.94 $30.83 $33.16 $34.08 $37.57 $38.67 $31.66 $36.80 $35.73 $39.74 $0.00 $10.00 $20.00 $30.00 $40.00 $50.00 2014 2015 2016 2017 2018 2019 2020 2021 2022 2023 2024 YTD 2025 Strong Capital Key Capital Ratios and Per Share Data As of June 30, 2025 11.86% 12.51% 12.80% 12.74% 13.69% 11.91% 11.40% 9.62% 7.79% 9.15% 7.78% 8.58% 0.00% 3.50% 7.00% 10.50% 14.00% 17.50% 2014 2015 2016 2017 2018 2019 2020 2021 2022 2023 2024 YTD 2025 TCE Total Risk Based 13.89% Tier 1 Risk Based 12.86% Tier 1 Leverage 10.91% Book Value $49.59 Tangible Book Value $39.74 6 |
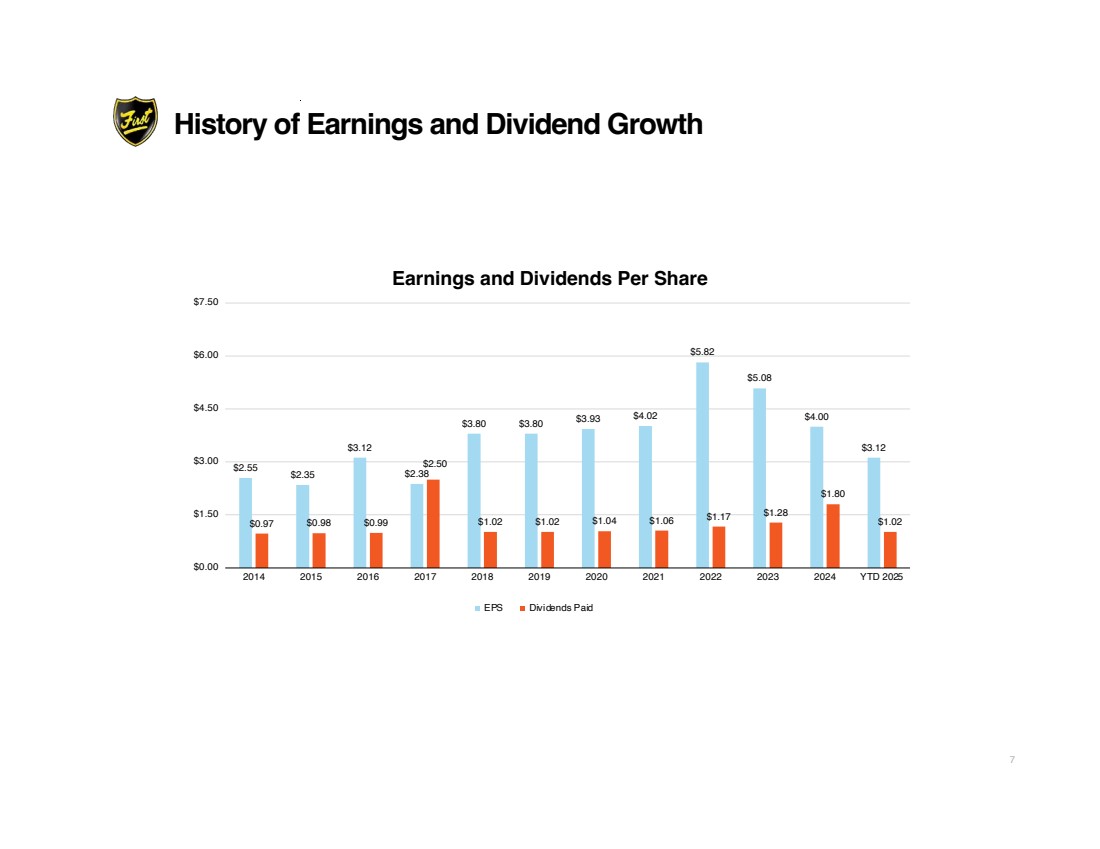
| $2.55 $2.35 $3.12 $2.38 $3.80 $3.80 $3.93 $4.02 $5.82 $5.08 $4.00 $3.12 $0.97 $0.98 $0.99 $2.50 $1.02 $1.02 $1.04 $1.06 $1.17 $1.28 $1.80 $1.02 $0.00 $1.50 $3.00 $4.50 $6.00 $7.50 2014 2015 2016 2017 2018 2019 2020 2021 2022 2023 2024 YTD 2025 Earnings and Dividends Per Share EPS Dividends Paid History of Earnings and Dividend Growth 7 |
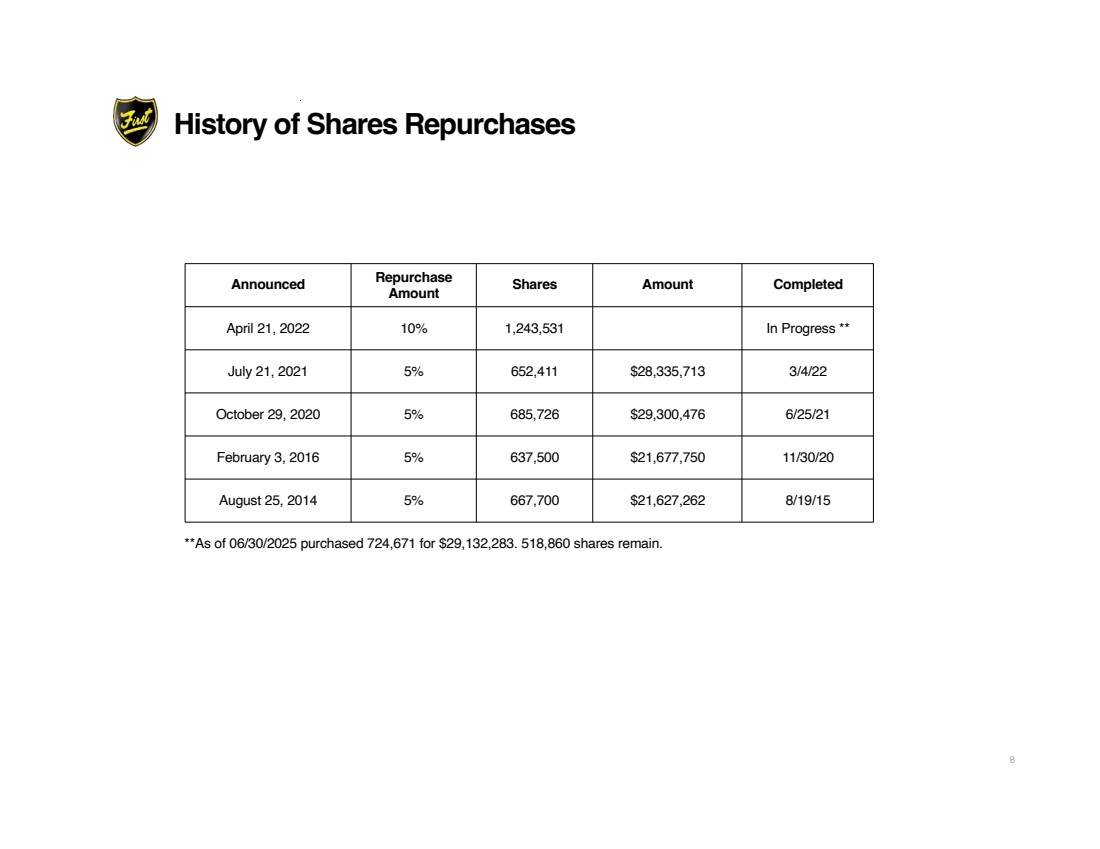
| Announced Repurchase Amount Shares Amount Completed April 21, 2022 10% 1,243,531 In Progress ** July 21, 2021 5% 652,411 $28,335,713 3/4/22 October 29, 2020 5% 685,726 $29,300,476 6/25/21 February 3, 2016 5% 637,500 $21,677,750 11/30/20 August 25, 2014 5% 667,700 $21,627,262 8/19/15 **As of 06/30/2025 purchased 724,671 for $29,132,283. 518,860 shares remain. History of Shares Repurchases 8 |
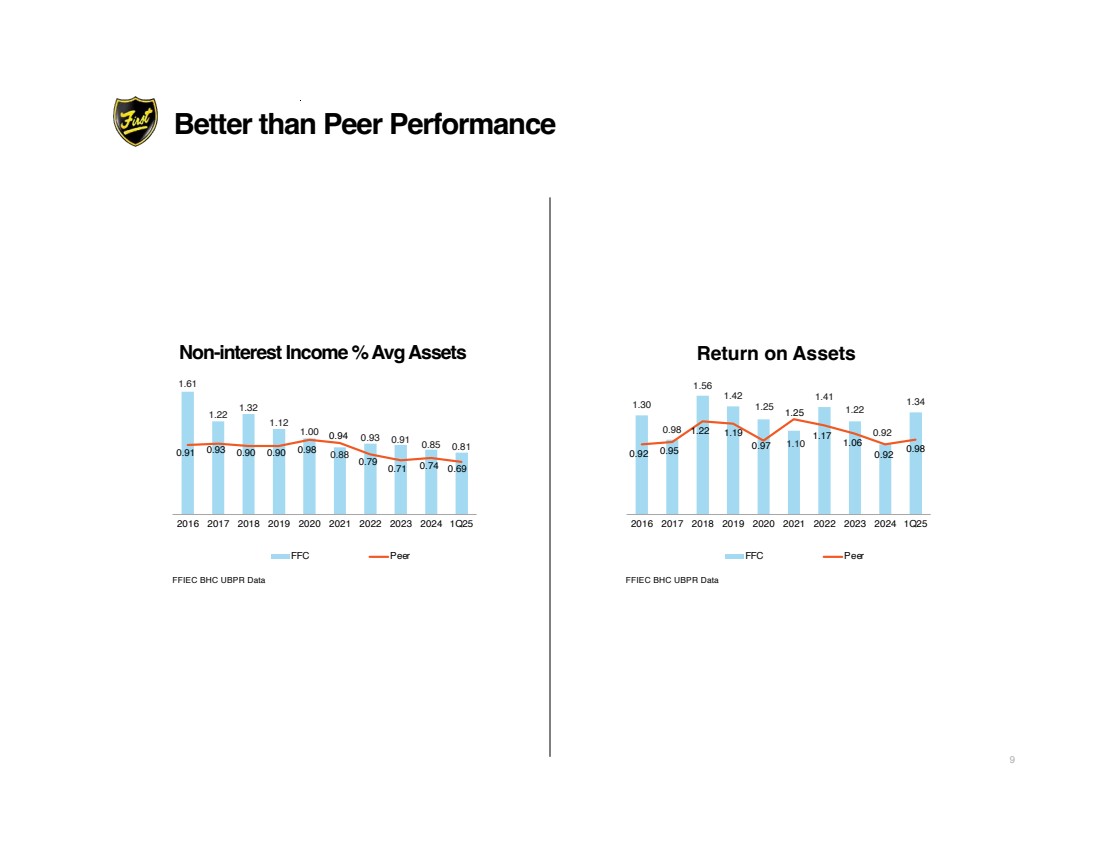
| FFIEC BHC UBPR Data Return on Assets 1.61 1.22 1.32 1.12 1.00 0.88 0.93 0.91 0.85 0.81 0.91 0.93 0.90 0.90 0.98 0.94 0.79 0.71 0.74 0.69 '- 2016 2017 2018 2019 2020 2021 2022 2023 2024 1Q25 FFC Peer Non-interest Income % Avg Assets FFIEC BHC UBPR Data 1.30 0.98 1.56 1.42 1.25 1.10 1.41 1.22 0.92 1.34 0.92 0.95 1.22 1.19 0.97 1.25 1.17 1.06 0.92 0.98 '- 2016 2017 2018 2019 2020 2021 2022 2023 2024 1Q25 FFC Peer Better than Peer Performance 9 |
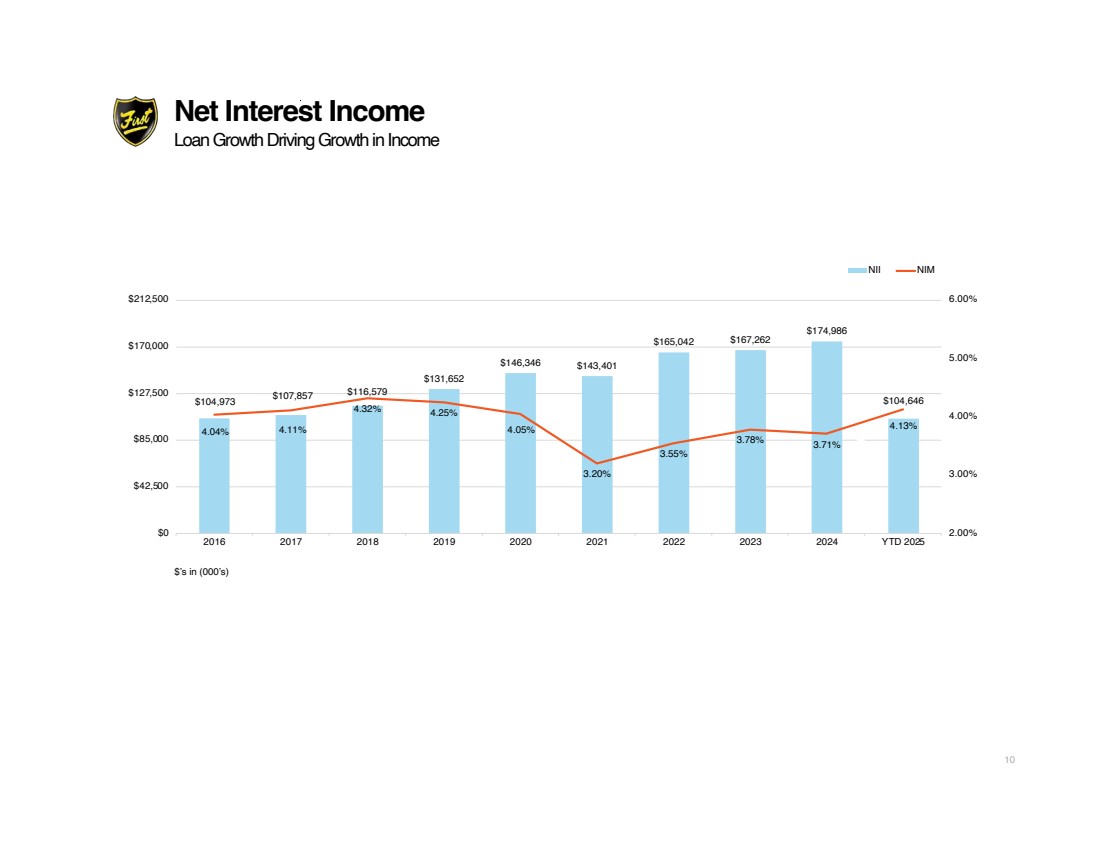
| Net Interest Income Loan Growth Driving Growth in Income $104,973 $107,857 $116,579 $131,652 $146,346 $143,401 $165,042 $167,262 $174,986 $104,646 4.04% 4.11% 4.32% 4.25% 4.05% 3.20% 3.55% 3.78% 3.71% 4.13% 2.00% 3.00% 4.00% 5.00% 6.00% $0 $42,500 $85,000 $127,500 $170,000 $212,500 2016 2017 2018 2019 2020 2021 2022 2023 2024 YTD 2025 NII NIM $’s in (000’s) 10 |
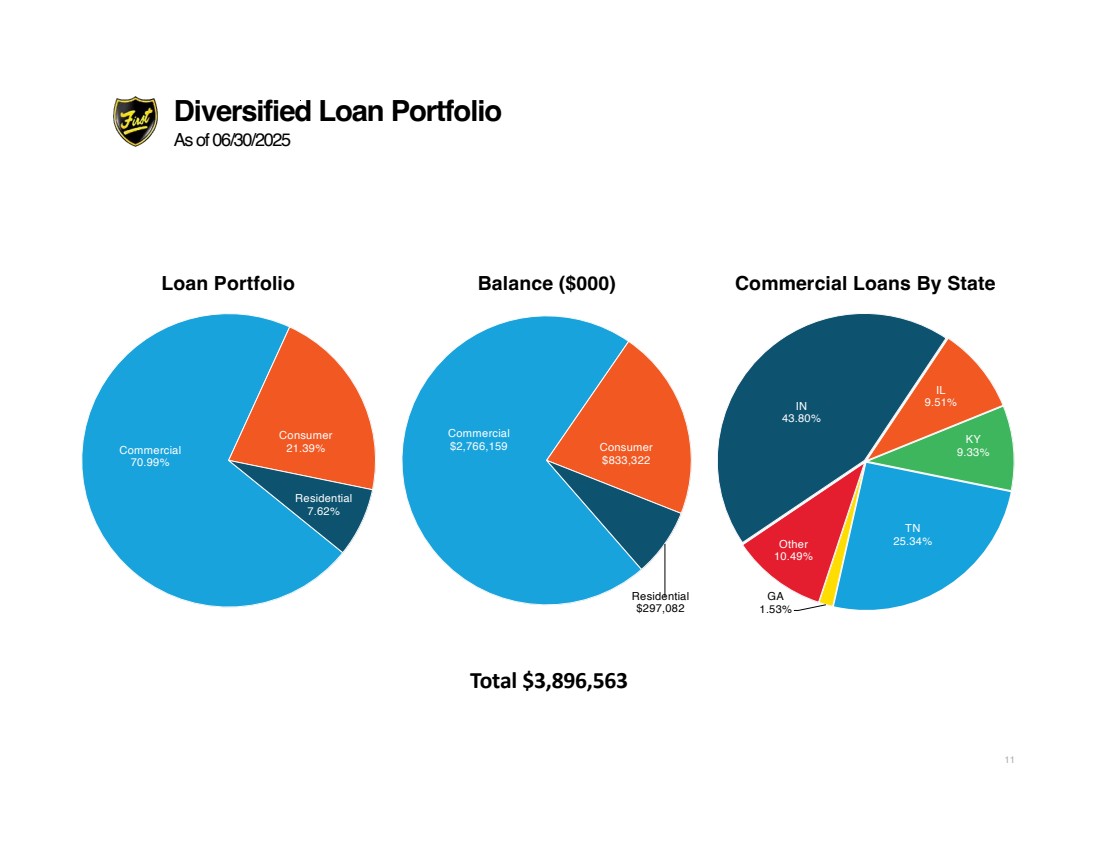
| Balance ($000) Commercial Loans By State Total $3,896,563 Diversified Loan Portfolio As of 06/30/2025 Loan Portfolio Commercial 70.99% Consumer 21.39% Residential 7.62% Commercial $2,766,159 Consumer $833,322 Residential $297,082 IN 43.80% IL 9.51% KY 9.33% TN 25.34% GA 1.53% Other 10.49% 11 |
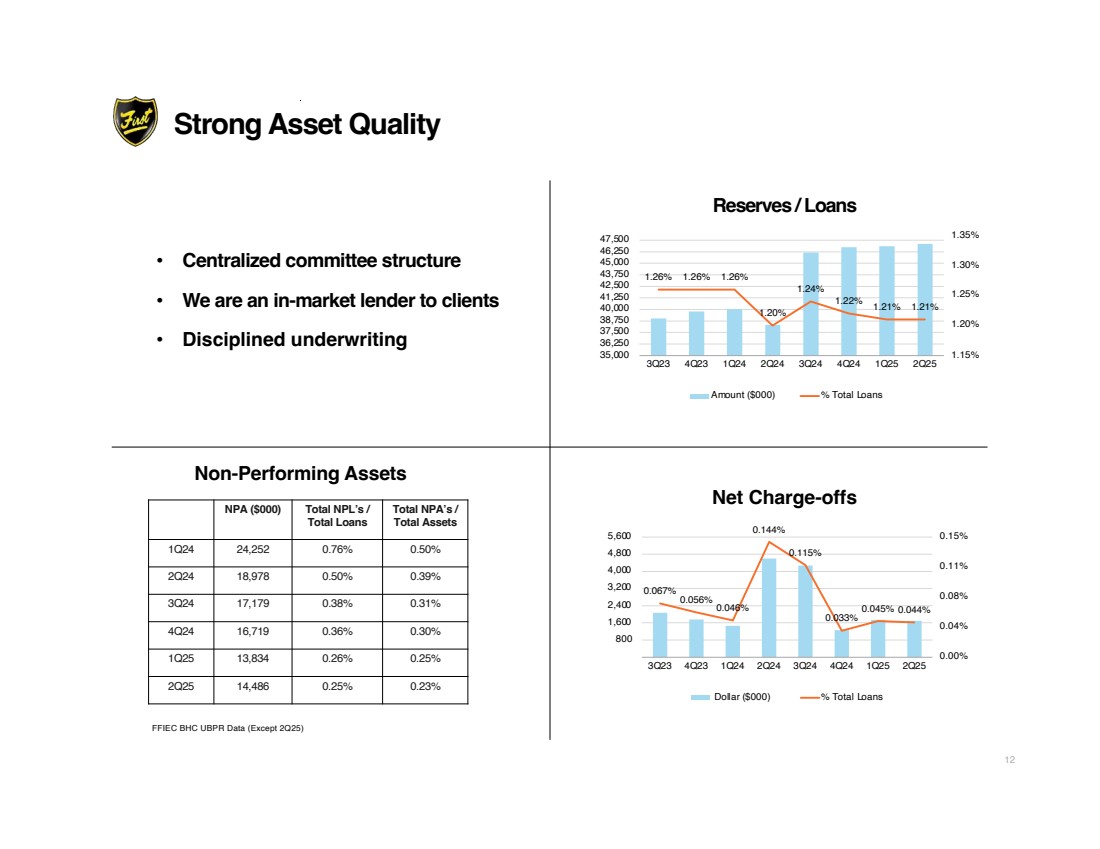
| FFIEC BHC UBPR Data (Except 2Q25) • Centralized committee structure • We are an in-market lender to clients • Disciplined underwriting Net Charge-offs 0.067% 0.056% 0.046% 0.144% 0.115% 0.033% 0.045% 0.044% 0.00% 0.04% 0.08% 0.11% 0.15% '- 800 1,600 2,400 3,200 4,000 4,800 5,600 3Q23 4Q23 1Q24 2Q24 3Q24 4Q24 1Q25 2Q25 Dollar ($000) % Total Loans 1.26% 1.26% 1.26% 1.20% 1.24% 1.22% 1.21% 1.21% 1.15% 1.20% 1.25% 1.30% 1.35% 35,000 36,250 37,500 38,750 40,000 41,250 42,500 43,750 45,000 46,250 47,500 3Q23 4Q23 1Q24 2Q24 3Q24 4Q24 1Q25 2Q25 Amount ($000) % Total Loans Reserves / Loans Non-Performing Assets NPA ($000) Total NPL’s / Total Loans Total NPA’s / Total Assets 1Q24 24,252 0.76% 0.50% 2Q24 18,978 0.50% 0.39% 3Q24 17,179 0.38% 0.31% 4Q24 16,719 0.36% 0.30% 1Q25 13,834 0.26% 0.25% 2Q25 14,486 0.25% 0.23% Strong Asset Quality 12 |
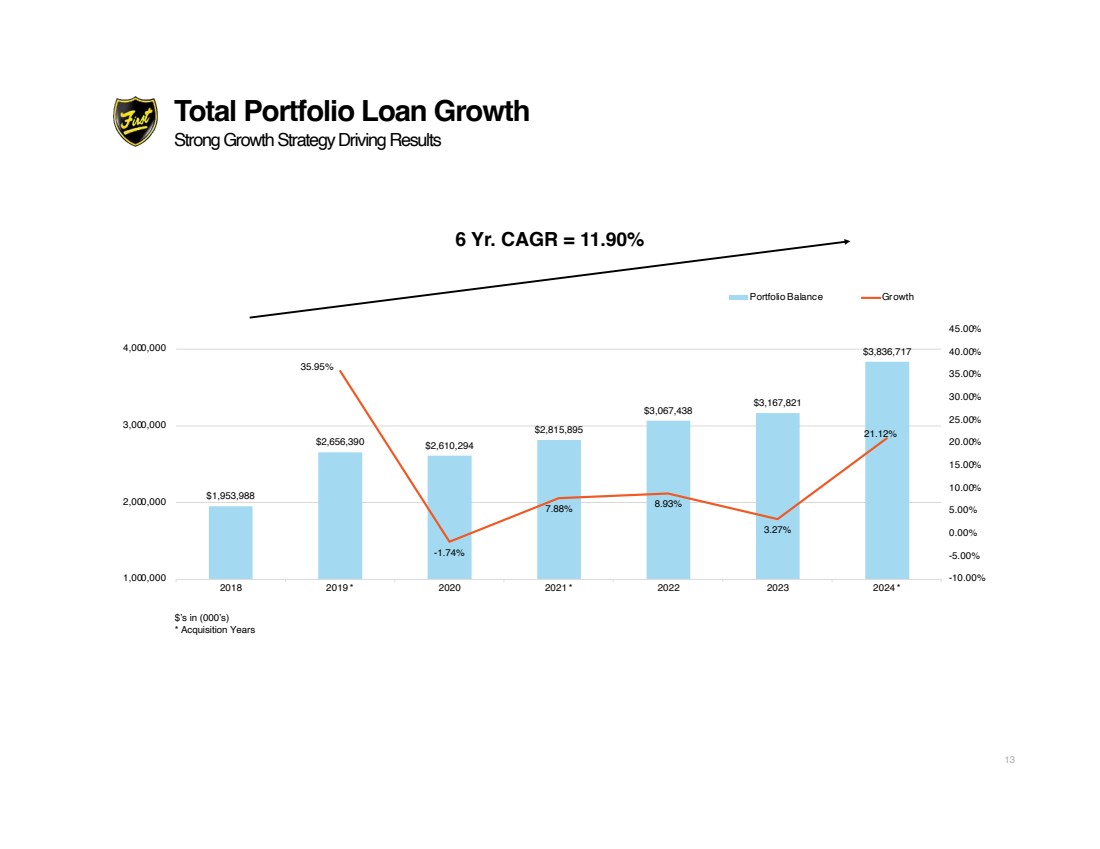
| Total Portfolio Loan Growth Strong Growth Strategy Driving Results $1,953,988 $2,656,390 $2,610,294 $2,815,895 $3,067,438 $3,167,821 $3,836,717 35.95% -1.74% 7.88% 8.93% 3.27% 21.12% -10.00% -5.00% 0.00% 5.00% 10.00% 15.00% 20.00% 25.00% 30.00% 35.00% 40.00% 45.00% 1,000,000 2,000,000 3,000,000 4,000,000 2018 2019 * 2020 2021 * 2022 2023 2024 * Portfolio Balance Growth 6 Yr. CAGR = 11.90% $’s in (000’s) * Acquisition Years 13 |
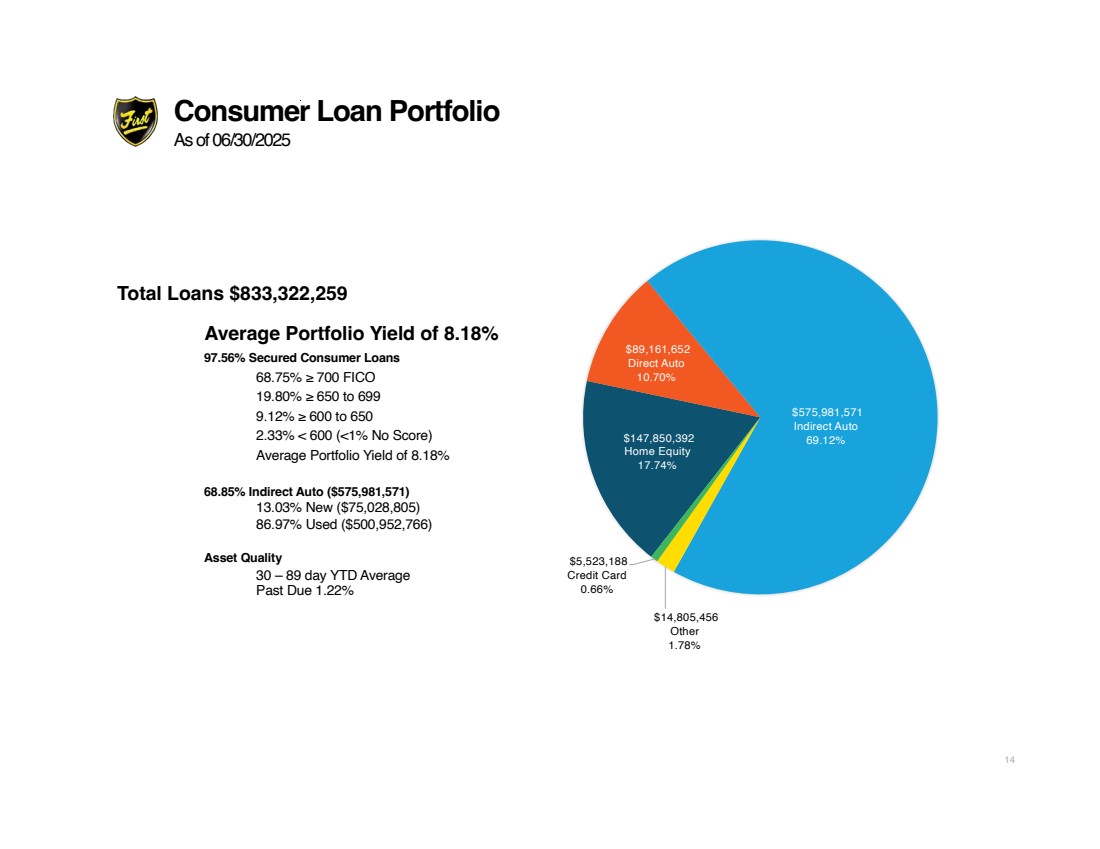
| Total Loans $833,322,259 Average Portfolio Yield of 8.18% 97.56% Secured Consumer Loans 68.75% ≥ 700 FICO 19.80% ≥ 650 to 699 9.12% ≥ 600 to 650 2.33% < 600 (<1% No Score) Average Portfolio Yield of 8.18% 68.85% Indirect Auto ($575,981,571) 13.03% New ($75,028,805) 86.97% Used ($500,952,766) Asset Quality 30 – 89 day YTD Average Past Due 1.22% Consumer Loan Portfolio As of 06/30/2025 $147,850,392 Home Equity 17.74% $89,161,652 Direct Auto 10.70% $575,981,571 Indirect Auto 69.12% $14,805,456 Other 1.78% $5,523,188 Credit Card 0.66% 14 |
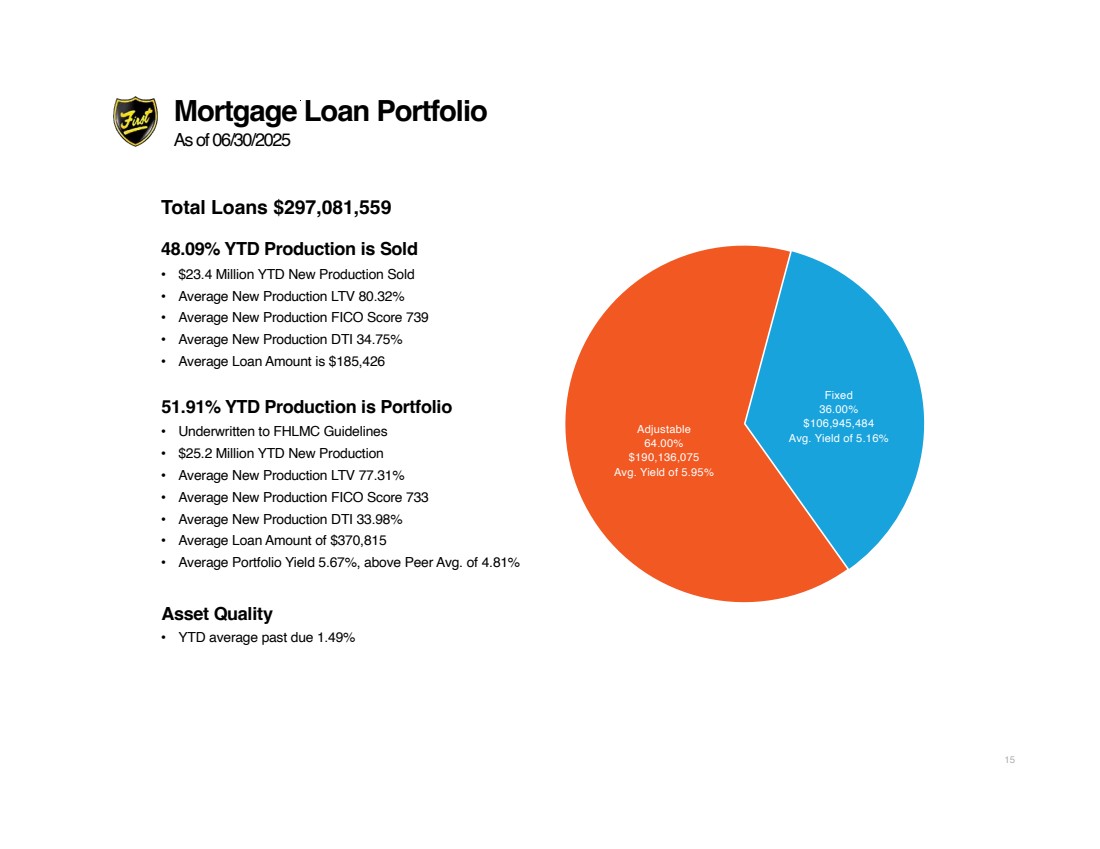
| Mortgage Loan Portfolio As of 06/30/2025 15 Total Loans $297,081,559 48.09% YTD Production is Sold • $23.4 Million YTD New Production Sold • Average New Production LTV 80.32% • Average New Production FICO Score 739 • Average New Production DTI 34.75% • Average Loan Amount is $185,426 51.91% YTD Production is Portfolio • Underwritten to FHLMC Guidelines • $25.2 Million YTD New Production • Average New Production LTV 77.31% • Average New Production FICO Score 733 • Average New Production DTI 33.98% • Average Loan Amount of $370,815 • Average Portfolio Yield 5.67%, above Peer Avg. of 4.81% Asset Quality • YTD average past due 1.49% Fixed 36.00% $106,945,484 Avg. Yield of 5.16% Adjustable 64.00% $190,136,075 Avg. Yield of 5.95% |
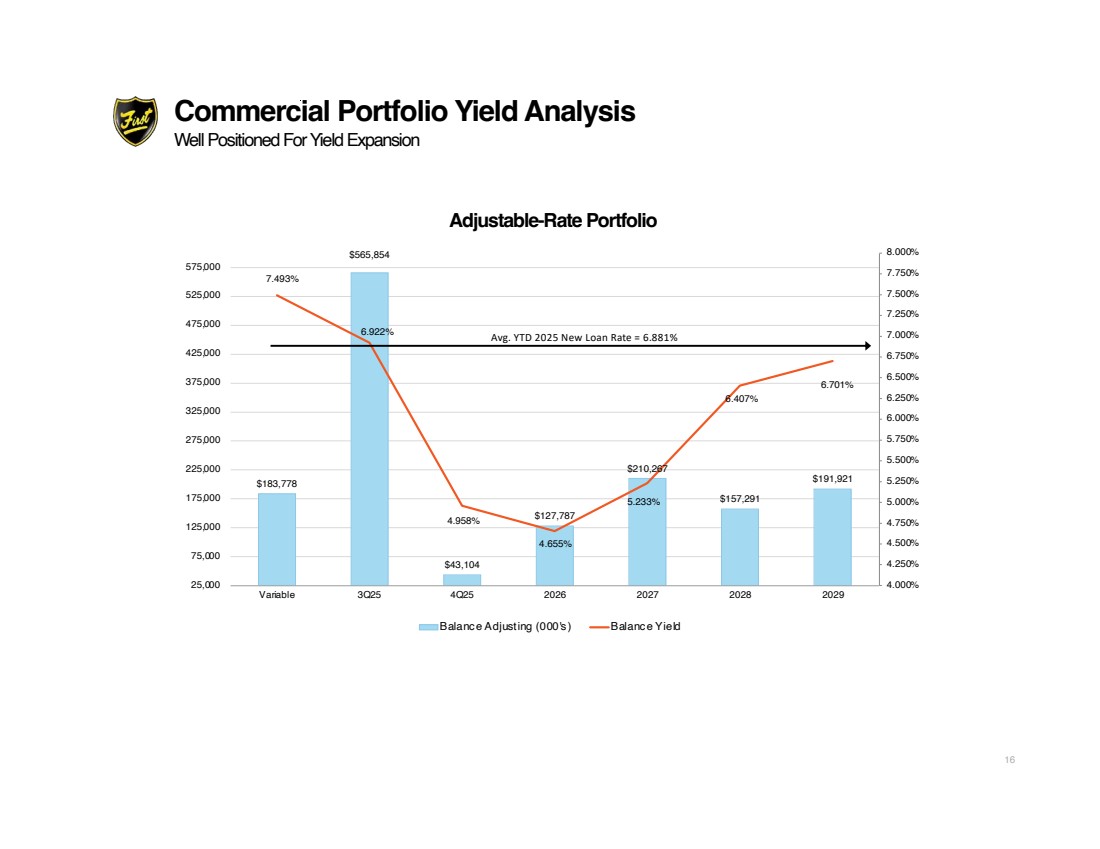
| Commercial Portfolio Yield Analysis Well Positioned For Yield Expansion $183,778 $565,854 $43,104 $127,787 $210,267 $157,291 $191,921 7.493% 6.922% 4.958% 4.655% 5.233% 6.407% 6.701% 4.000% 4.250% 4.500% 4.750% 5.000% 5.250% 5.500% 5.750% 6.000% 6.250% 6.500% 6.750% 7.000% 7.250% 7.500% 7.750% 8.000% 25,000 75,000 125,000 175,000 225,000 275,000 325,000 375,000 425,000 475,000 525,000 575,000 Variable 3Q25 4Q25 2026 2027 2028 2029 Balance Adjusting (000's) Balance Yield Avg. YTD 2025 New Loan Rate = 6.881% Adjustable-Rate Portfolio 16 |
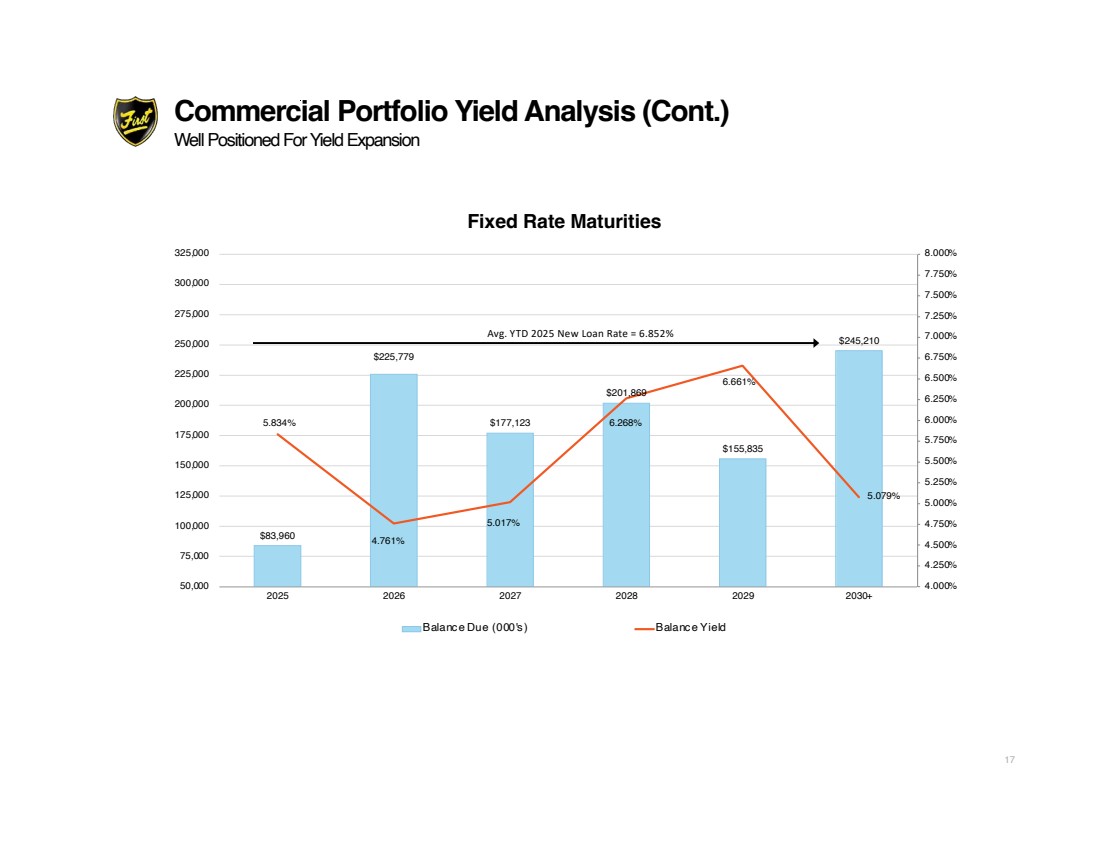
| Commercial Portfolio Yield Analysis (Cont.) Well Positioned For Yield Expansion $83,960 $225,779 $177,123 $201,869 $155,835 $245,210 5.834% 4.761% 5.017% 6.268% 6.661% 5.079% 4.000% 4.250% 4.500% 4.750% 5.000% 5.250% 5.500% 5.750% 6.000% 6.250% 6.500% 6.750% 7.000% 7.250% 7.500% 7.750% 8.000% 50,000 75,000 100,000 125,000 150,000 175,000 200,000 225,000 250,000 275,000 300,000 325,000 2025 2026 2027 2028 2029 2030+ Balance Due (000's) Balance Yield Fixed Rate Maturities Avg. YTD 2025 New Loan Rate = 6.852% 17 |
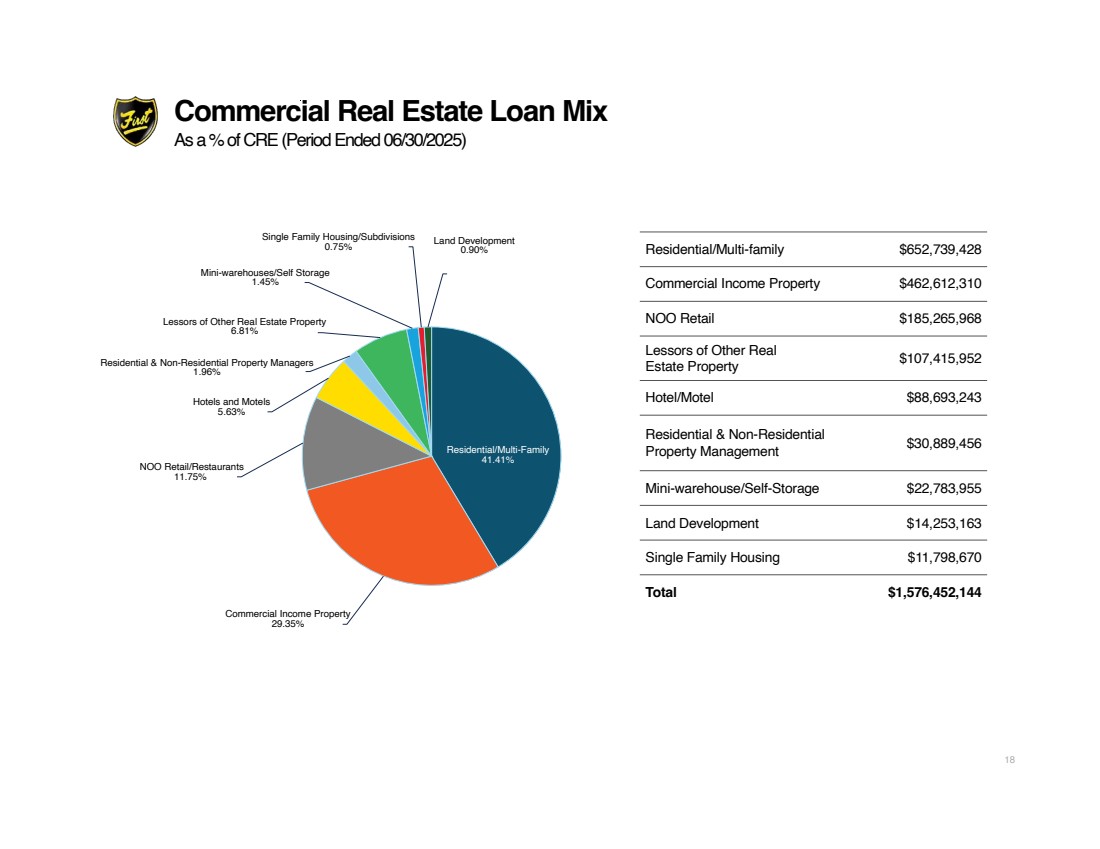
| Commercial Real Estate Loan Mix As a % of CRE(Period Ended 06/30/2025) Residential/Multi-Family 41.41% Commercial Income Property 29.35% NOO Retail/Restaurants 11.75% Hotels and Motels 5.63% Residential & Non-Residential Property Managers 1.96% Lessors of Other Real Estate Property 6.81% Mini-warehouses/Self Storage 1.45% Single Family Housing/Subdivisions 0.75% Land Development 0.90% Residential/Multi-family $652,739,428 Commercial Income Property $462,612,310 NOO Retail $185,265,968 Lessors of Other Real Estate Property $107,415,952 Hotel/Motel $88,693,243 Residential & Non-Residential Property Management $30,889,456 Mini-warehouse/Self-Storage $22,783,955 Land Development $14,253,163 Single Family Housing $11,798,670 Total $1,576,452,144 18 |
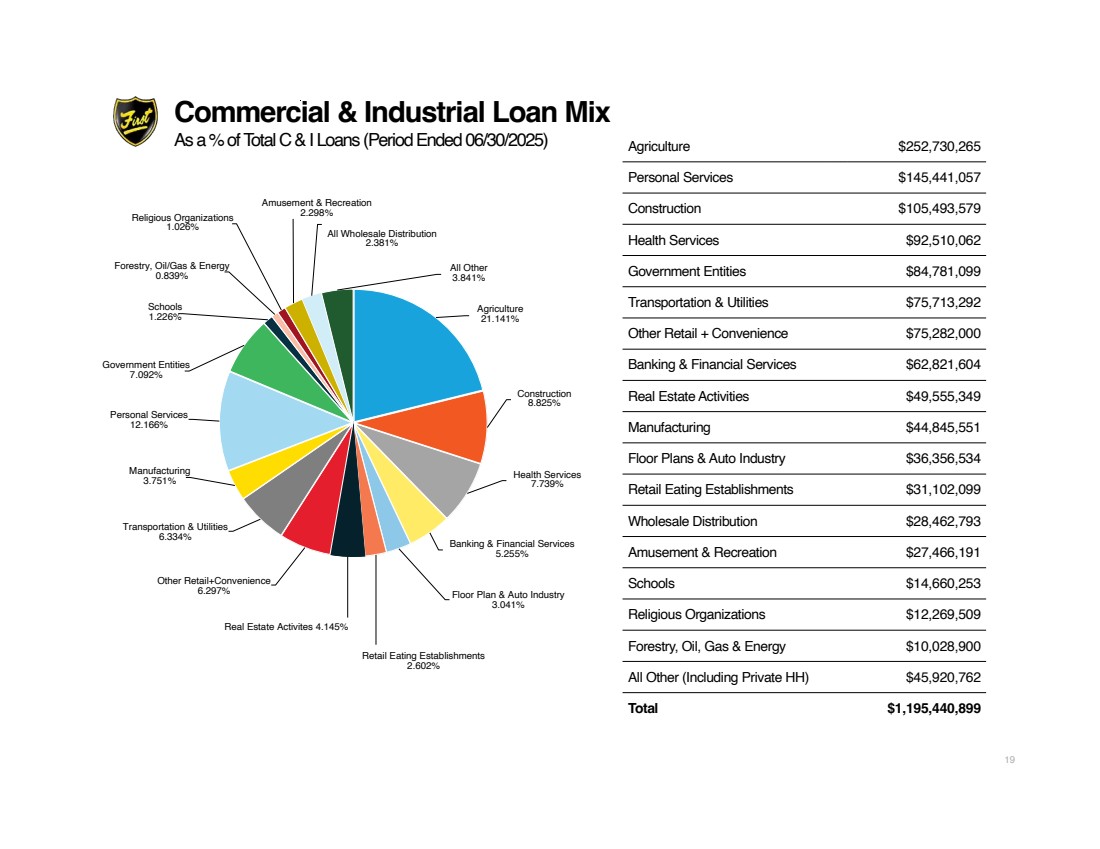
| Commercial & Industrial Loan Mix As a % of Total C & I Loans (Period Ended 06/30/2025) Agriculture 21.141% Construction 8.825% Health Services 7.739% Banking & Financial Services 5.255% Floor Plan & Auto Industry 3.041% Retail Eating Establishments 2.602% Real Estate Activites 4.145% Other Retail+Convenience 6.297% Transportation & Utilities 6.334% Manufacturing 3.751% Personal Services 12.166% Government Entities 7.092% Schools 1.226% Forestry, Oil/Gas & Energy 0.839% Religious Organizations 1.026% Amusement & Recreation 2.298% All Wholesale Distribution 2.381% All Other 3.841% Agriculture $252,730,265 Personal Services $145,441,057 Construction $105,493,579 Health Services $92,510,062 Government Entities $84,781,099 Transportation & Utilities $75,713,292 Other Retail + Convenience $75,282,000 Banking & Financial Services $62,821,604 Real Estate Activities $49,555,349 Manufacturing $44,845,551 Floor Plans & Auto Industry $36,356,534 Retail Eating Establishments $31,102,099 Wholesale Distribution $28,462,793 Amusement & Recreation $27,466,191 Schools $14,660,253 Religious Organizations $12,269,509 Forestry, Oil, Gas & Energy $10,028,900 All Other (Including Private HH) $45,920,762 Total $1,195,440,899 19 |
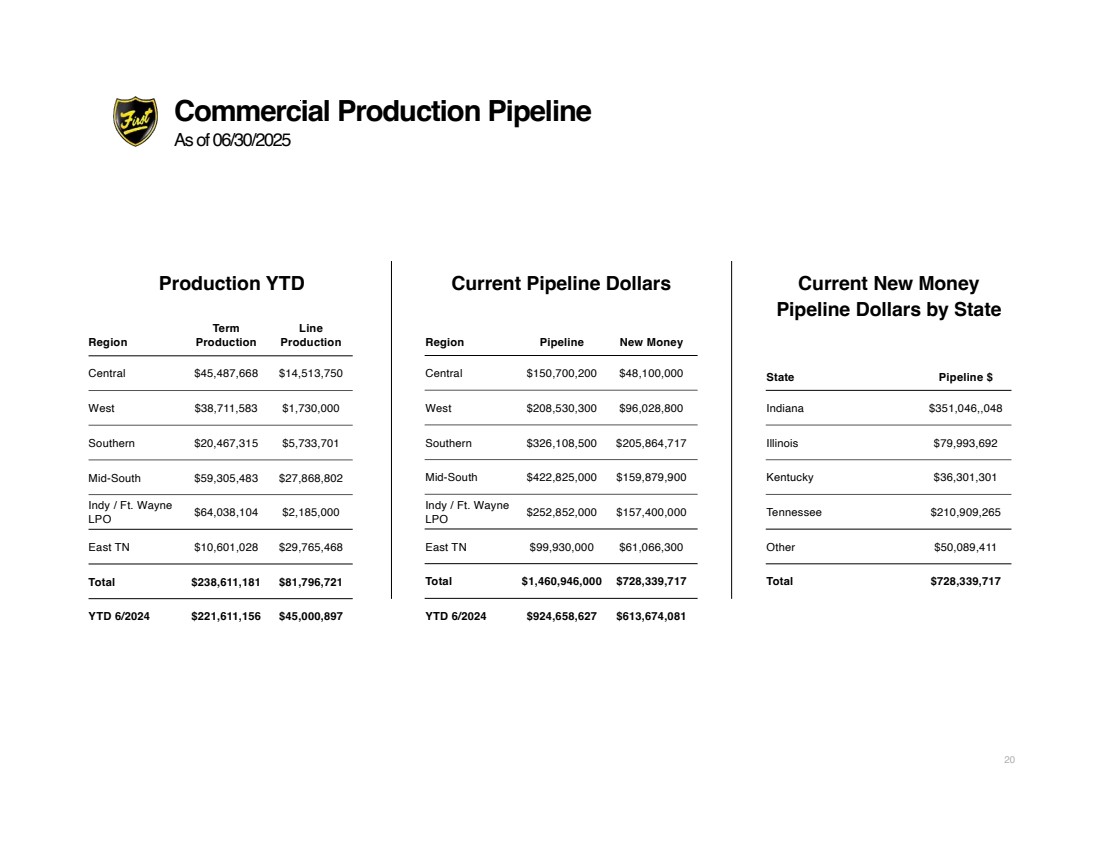
| Commercial Production Pipeline As of 06/30/2025 Region Pipeline New Money Central $150,700,200 $48,100,000 West $208,530,300 $96,028,800 Southern $326,108,500 $205,864,717 Mid-South $422,825,000 $159,879,900 Indy / Ft. Wayne LPO $252,852,000 $157,400,000 East TN $99,930,000 $61,066,300 Total $1,460,946,000 $728,339,717 YTD 6/2024 $924,658,627 $613,674,081 Production YTD Current Pipeline Dollars Region Term Production Line Production Central $45,487,668 $14,513,750 West $38,711,583 $1,730,000 Southern $20,467,315 $5,733,701 Mid-South $59,305,483 $27,868,802 Indy / Ft. Wayne LPO $64,038,104 $2,185,000 East TN $10,601,028 $29,765,468 Total $238,611,181 $81,796,721 YTD 6/2024 $221,611,156 $45,000,897 State Pipeline $ Indiana $351,046,,048 Illinois $79,993,692 Kentucky $36,301,301 Tennessee $210,909,265 Other $50,089,411 Total $728,339,717 Current New Money Pipeline Dollars by State 20 |
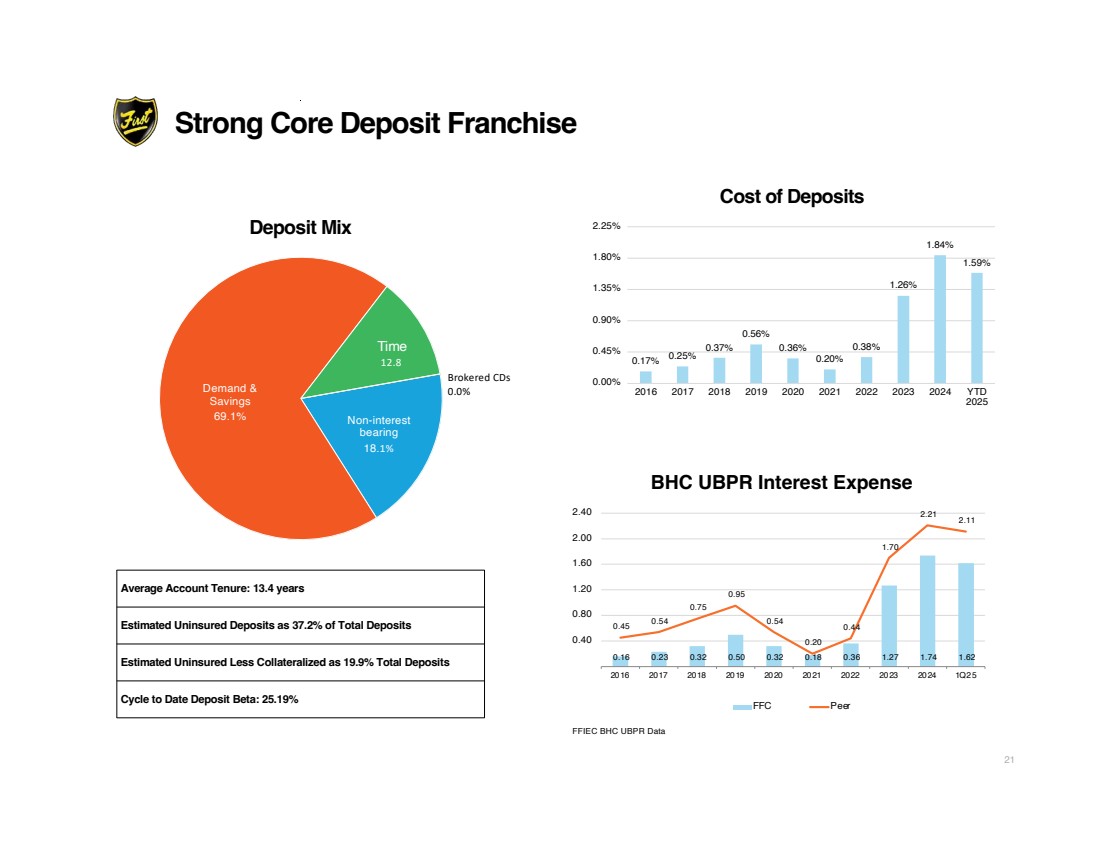
| Strong Core Deposit Franchise Deposit Mix Cost of Deposits 0.16 0.23 0.32 0.50 0.32 0.18 0.36 1.27 1.74 1.62 0.45 0.54 0.75 0.95 0.54 0.20 0.44 1.70 2.21 2.11 '- 0.40 0.80 1.20 1.60 2.00 2.40 2016 2017 2018 2019 2020 2021 2022 2023 2024 1Q25 BHC UBPR Interest Expense FFC Peer FFIEC BHC UBPR Data Non-interest bearing Demand & Savings Time 69.1% 18.1% 12.8 Brokered CDs 0.0% Average Account Tenure: 13.4 years Estimated Uninsured Deposits as 37.2% of Total Deposits Estimated Uninsured Less Collateralized as 19.9% Total Deposits Cycle to Date Deposit Beta: 25.19% 0.17% 0.25% 0.37% 0.56% 0.36% 0.20% 0.38% 1.26% 1.84% 1.59% 0.00% 0.45% 0.90% 1.35% 1.80% 2.25% 2016 2017 2018 2019 2020 2021 2022 2023 2024 YTD 2025 21 |
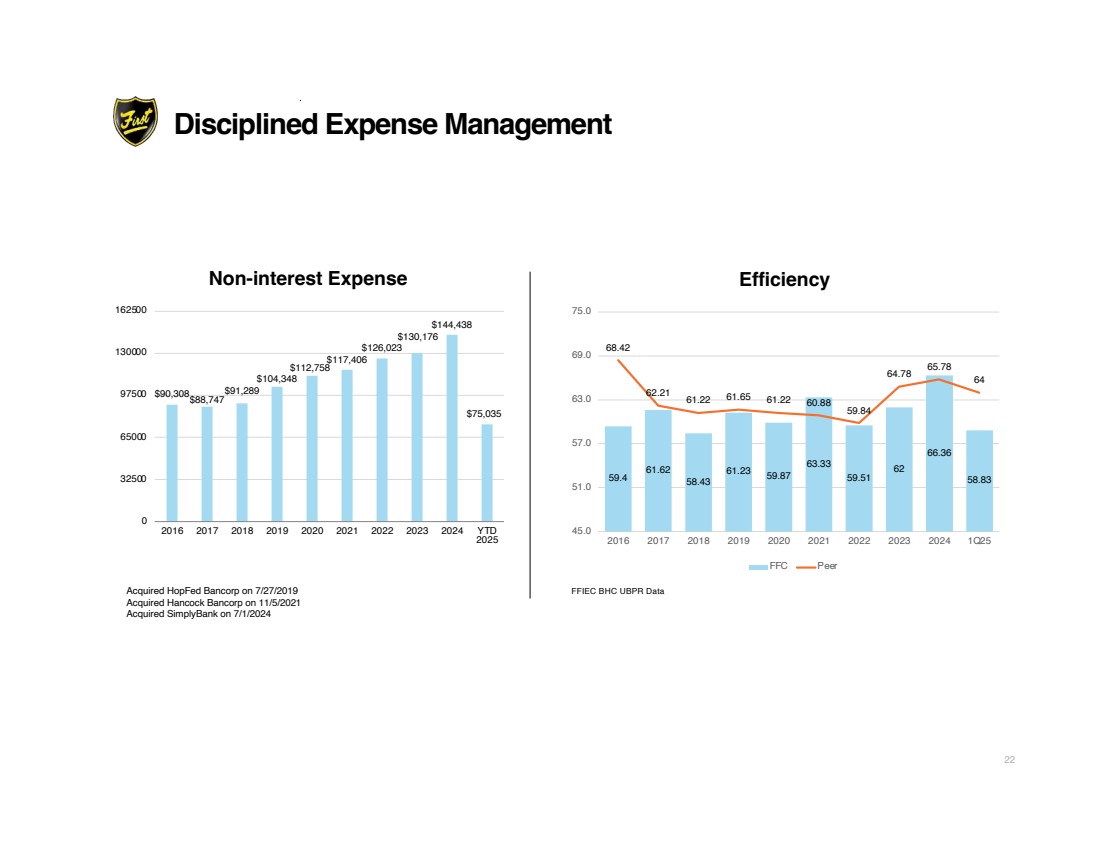
| $90,308$88,747 $91,289 $104,348 $112,758$117,406 $126,023 $130,176 $144,438 $75,035 0 32500 65000 97500 130000 162500 2016 2017 2018 2019 2020 2021 2022 2023 2024 YTD 2025 59.4 61.62 58.43 61.23 59.87 63.33 59.51 62 66.36 58.83 68.42 62.21 61.22 61.65 61.22 60.88 59.84 64.78 65.78 64 45.0 51.0 57.0 63.0 69.0 75.0 2016 2017 2018 2019 2020 2021 2022 2023 2024 1Q25 FFC Peer FFIEC BHC UBPR Data Non-interest Expense Efficiency Acquired HopFed Bancorp on 7/27/2019 Acquired Hancock Bancorp on 11/5/2021 Acquired SimplyBank on 7/1/2024 Disciplined Expense Management 22 |
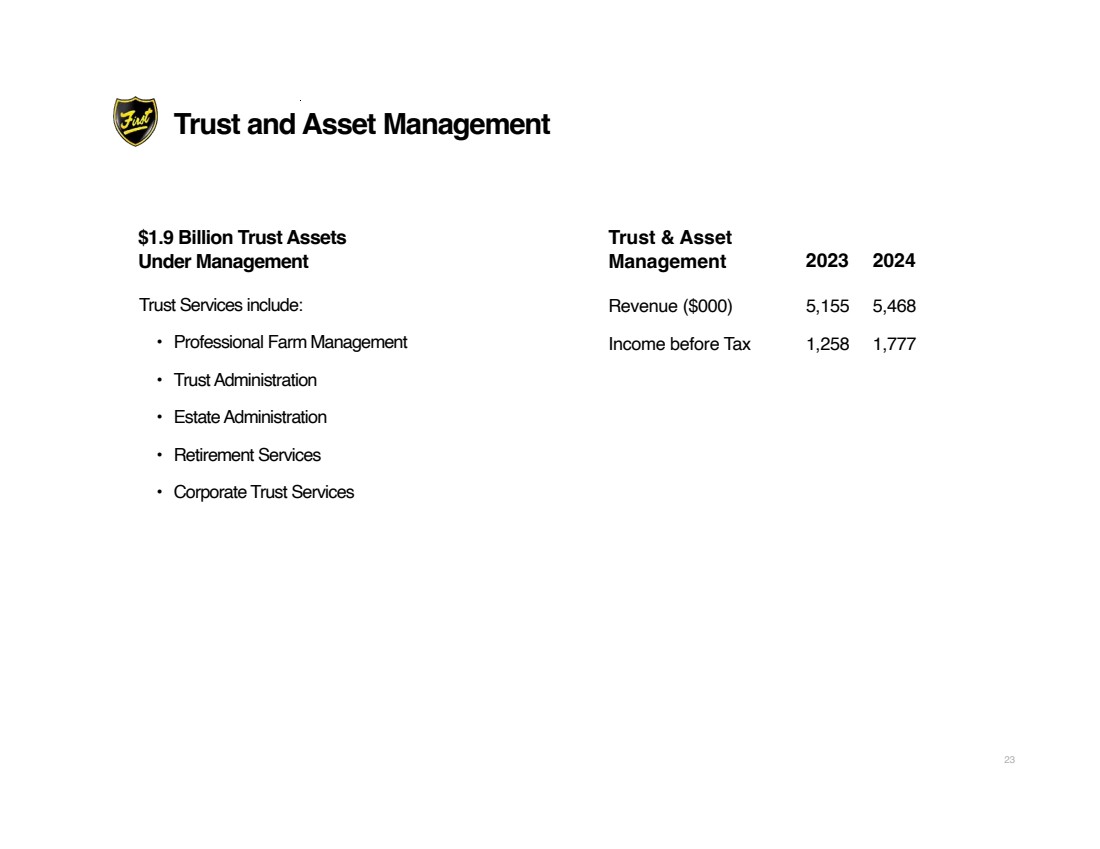
| $1.9 Billion Trust Assets Under Management Trust & Asset Management 2023 2024 Revenue ($000) 5,155 5,468 Income before Tax 1,258 1,777 Trust and Asset Management Trust Services include: • Professional Farm Management • Trust Administration • Estate Administration • Retirement Services • Corporate Trust Services 23 |
| Well-positioned for sustainable and profitable growth • Diversified business model with strong risk management • High-caliber team members focused on customer service and technology optimization • Expanding presence in larger growth markets • Commercial banking focus with quality core deposits • Demonstrated ability to successfully complete mergers and acquisitions • Unblemished track record of delivering shareholder value • Over 30 consecutive years of increased shareholder dividends Key Investment Points 24 |
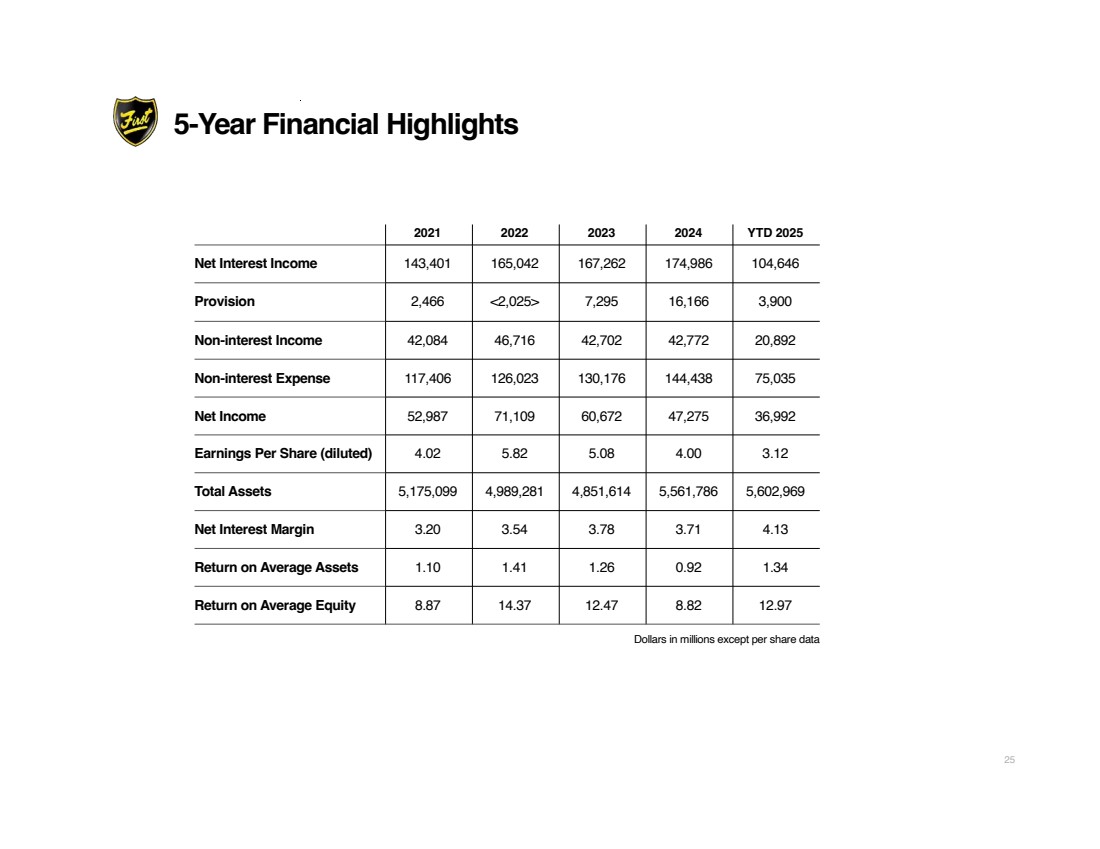
| 2021 2022 2023 2024 YTD 2025 Net Interest Income 143,401 165,042 167,262 174,986 104,646 Provision 2,466 <2,025> 7,295 16,166 3,900 Non-interest Income 42,084 46,716 42,702 42,772 20,892 Non-interest Expense 117,406 126,023 130,176 144,438 75,035 Net Income 52,987 71,109 60,672 47,275 36,992 Earnings Per Share (diluted) 4.02 5.82 5.08 4.00 3.12 Total Assets 5,175,099 4,989,281 4,851,614 5,561,786 5,602,969 Net Interest Margin 3.20 3.54 3.78 3.71 4.13 Return on Average Assets 1.10 1.41 1.26 0.92 1.34 Return on Average Equity 8.87 14.37 12.47 8.82 12.97 Dollars in millions except per share data 5-Year Financial Highlights 25 |
| Norman D. Lowery President and CEO lowerynd@first-online.com 812.238.6185 Rodger A. McHargue Chief Financial Officer, SVP rmchargue@first-online.com 812.238.6334 Stephen P. Panagouleas Chief Credit Officer, SVP spanagouleas@first-online.com 812.238.6431 Thank You! : THFF |