The following performance information provides some indication of the risks of investing in the fund. The fund’s performance information represents only past performance (before and after taxes) and is not necessarily an indication of future results.
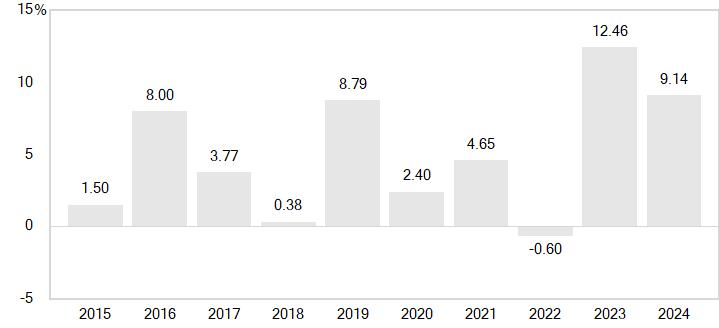
The following bar chart illustrates how much returns can differ from year to year by showing calendar year returns and the best and worst calendar quarter returns during those years for the fund’s Institutional Class. Returns for other share classes vary since they have different expenses.
| Quarter Ended |
Total |
Quarter Ended |
Total |
|||||
| Best Quarter | 8.16% | Worst Quarter | -11.28% |
The fund’s return for the six months ended 6/30/25 was 3.12%.
The following table shows the average annual total returns for each class of the fund that has been in operation for at least one full calendar year. The fund’s performance information included in the table is compared with a regulatory required index that represents an overall securities market (Regulatory Benchmark). In addition, the table may also include one or more indexes that more closely aligns to the fund’s investment strategy (Strategy Benchmark(s)).
In addition, the table shows hypothetical after-tax returns to demonstrate how taxes paid by a shareholder may influence returns. After-tax returns are calculated using the historical highest individual federal marginal income tax rates and do not reflect the impact of state and local taxes. Actual after-tax returns depend on an investor’s tax situation and may differ from those shown. After-tax returns shown are not relevant to investors who hold their fund shares through tax-deferred arrangements, such as a 401(k) account or an IRA. After-tax returns are shown only for the Institutional Class and will differ for other share classes.
| Average Annual Total Returns | ||||||||||||||||
| Periods ended | ||||||||||||||||
| December 31, 2024 | ||||||||||||||||
| Since | Inception | |||||||||||||||
| 1 Year | 5 Years | 10 Years | inception | date | ||||||||||||
| Institutional Class | 01/31/2008 | |||||||||||||||
| Returns before taxes | 9.14 | % | 5.51 | % | 4.97 | % | % | |||||||||
| Returns after taxes on distributions | 5.46 | 2.88 | 2.65 | |||||||||||||
| Returns after taxes on distributions | ||||||||||||||||
| and sale of fund shares | 5.32 | 3.05 | 2.76 | |||||||||||||
| F Class | 08/27/2010 | |||||||||||||||
| Returns before taxes | 9.01 | 5.38 | 4.84 | |||||||||||||
| Z Class | 03/10/2020 | |||||||||||||||
| Returns before taxes | 9.74 | 7.07 | ||||||||||||||
| Regulatory Benchmark | ||||||||||||||||
| Bloomberg U.S. Aggregate Bond Index (reflects no deduction for fees, expenses, or taxes) | ||||||||||||||||
| 1.25 | -0.33 | 1.35 | -1.24 | a | ||||||||||||
| Strategy Benchmark(s) | ||||||||||||||||
| Morningstar LSTA Performing Loan Index (reflects no deduction for fees, expenses, or taxes) | ||||||||||||||||
| 9.15 | 6.09 | 5.41 | 7.24 | a | ||||||||||||
| a | Return since 3/10/20. |
Updated performance information is available through troweprice.com.
The following performance information provides some indication of the risks of investing in the fund. The fund’s performance information represents only past performance (before and after taxes) and is not necessarily an indication of future results.
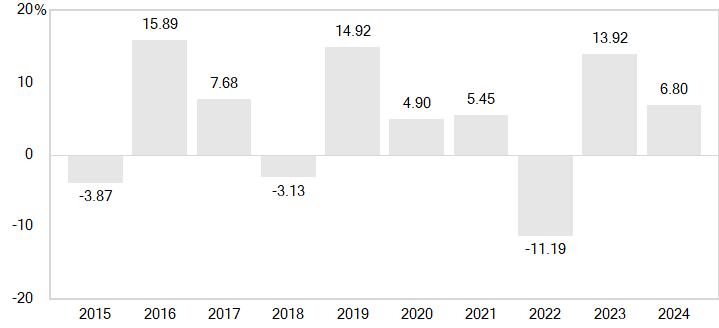
The following bar chart illustrates how much returns can differ from year to year by showing calendar year returns and the best and worst calendar quarter returns during those years for the fund. Returns for other share classes vary since they have different expenses.
| Quarter Ended |
Total |
Quarter Ended |
Total |
|||||
| Best Quarter | 10.12% | Worst Quarter | -13.62% |
The fund’s return for the six months ended 6/30/25 was 4.91%.
The following table shows the average annual total returns for the fund. The fund’s performance information included in the table is compared with a regulatory required index that represents an overall securities market (Regulatory Benchmark). In addition, the table may also include one or more indexes that more closely aligns to the fund’s investment strategy (Strategy Benchmark(s)).
In addition, the table shows hypothetical after-tax returns to demonstrate how taxes paid by a shareholder may influence returns. After-tax returns are calculated using the historical highest individual federal marginal income tax rates and do not reflect the impact of state and local taxes. Actual after-tax returns depend on an investor’s tax situation and may differ from those shown. After-tax returns shown are not relevant to investors who hold their fund shares through tax-deferred arrangements, such as a 401(k) account or an IRA.
| Average Annual Total Returns | |||||||||||||
| Periods ended | |||||||||||||
| December 31, 2024 | |||||||||||||
| Inception | |||||||||||||
| 1 Year | 5 Years | 10 Years | date | ||||||||||
| Institutional High Yield Fund | 05/31/2002 | ||||||||||||
| Returns before taxes | 6.80 | % | 3.63 | % | 4.79 | % | |||||||
| Returns after taxes on distributions | 3.92 | 1.10 | 2.16 | ||||||||||
| Returns after taxes on distributions | |||||||||||||
| and sale of fund shares | 3.97 | 1.65 | 2.47 | ||||||||||
| Regulatory Benchmark | |||||||||||||
| Bloomberg U.S. Aggregate Bond Index (reflects no deduction for fees, expenses, or taxes) | |||||||||||||
| 1.25 | -0.33 | 1.35 | |||||||||||
| Strategy Benchmark(s) | |||||||||||||
| Bloomberg U.S. High-Yield 2% Issuer Capped Bond Index (reflects no deduction for fees, expenses, or taxes) | |||||||||||||
| 8.19 | 4.20 | 5.16 | |||||||||||
| Lipper Global High Yield Funds Average | |||||||||||||
| 7.81 | 3.28 | 4.08 | |||||||||||
Updated performance information is available through troweprice.com.
The following performance information provides some indication of the risks of investing in the fund. The fund’s performance information represents only past performance (before and after taxes) and is not necessarily an indication of future results.
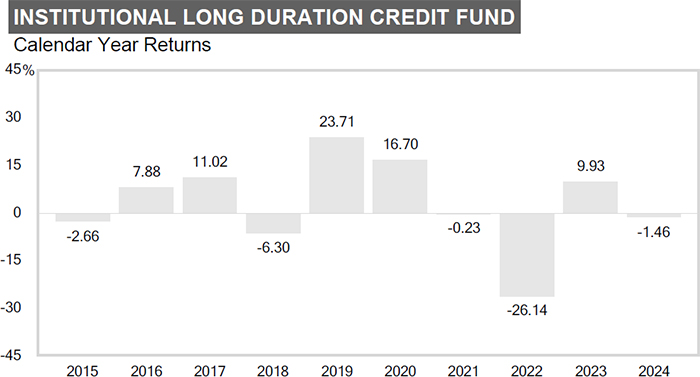
The following bar chart illustrates how much returns can differ from year to year by showing calendar year returns and the best and worst calendar quarter returns during those years for the fund.
| Quarter Ended |
Total Return |
Quarter Ended |
Total Return |
|||||
| Best Quarter | 13.47% | Worst Quarter | -13.21% |
The fund’s return for the six months ended 6/30/25 was 3.43%.
The following table shows the average annual total returns for the fund. The fund’s performance information included in the table is compared with a regulatory required index that represents an overall securities market (Regulatory Benchmark). In addition, the table may also include one or more indexes that more closely aligns to the fund’s investment strategy (Strategy Benchmark(s)).
In addition, the table shows hypothetical after-tax returns to demonstrate how taxes paid by a shareholder may influence returns. After-tax returns are calculated using the historical highest individual federal marginal income tax rates and do not reflect the impact of state and local taxes. Actual after-tax returns depend on an investor’s tax situation and may differ from those shown. After-tax returns shown are not relevant to investors who hold their fund shares through tax-deferred arrangements, such as a 401(k) account or an IRA.
| Periods ended | |||||||||||||
| December 31, 2024 | |||||||||||||
| Inception | |||||||||||||
| 1 Year | 5 Years | 10 Years | date | ||||||||||
| Institutional Long Duration Credit Fund | 06/03/2013 | ||||||||||||
| Returns before taxes | -1.46 | % | -1.41 | % | 2.33 | % | |||||||
| Returns after taxes on distributions | -3.61 | -3.47 | 0.13 | ||||||||||
| Returns after taxes on distributions | |||||||||||||
| and sale of fund shares | -0.85 | -1.73 | 1.01 | ||||||||||
| Regulatory Benchmark | |||||||||||||
| Bloomberg U.S. Aggregate Bond Index (reflects no deduction for fees, expenses, or taxes) | |||||||||||||
| 1.25 | -0.33 | 1.35 | |||||||||||
| Strategy Benchmark(s) | |||||||||||||
| Bloomberg U.S. Long Credit Bond Index (reflects no deduction for fees, expenses, or taxes) | |||||||||||||
| -2.01 | -1.92 | 2.11 | |||||||||||
| Lipper Corporate Debt Funds BBB-Rated Average | |||||||||||||
| 2.15 | 0.06 | 1.94 | |||||||||||
Updated performance information is available through troweprice.com.