
Investor Presentation Second Quarter 2025 Dennis G. Shaffer - Chief Executive Officer & President Charles A. Parcher – Executive Vice President, Chief Lending Officer Richard J. Dutton - Senior Vice President, Chief Operating Officer Ian Whinnem – Senior Vice President, Chief Financial Officer NASDAQ: CIVB
Forward-Looking Statements. This presentation may contain “forward-looking statements” within the meaning of Section 21E of the Securities Exchange Act of 1934, as amended. Forward-looking statements express management’s current expectations, estimates or projections of future events, results or long-term goals, and are generally identifiable by the use of words such as “believe,” “expect,” “anticipate,” “plan,” “intend,” “estimate,” “may,” “will,” “would,” “could,” “should” or other similar expressions. All statements in this material speak only as of the date they are made, and we undertake no obligation to update any statement except to the extent required by law. Forward-looking statements are not guarantees of performance and are inherently subject to known and unknown risks, uncertainties and assumptions that are difficult to predict and could cause actual results or performance to differ materially from those expressed in or implied by the forward-looking statements. Factors that could cause actual results or performance to differ from those discussed in the forward-looking statements include the risks identified from time to time in our public filings with the SEC, including those risks identified in “Item 1A. Risk Factors” of Part I of the Company’s Annual Report on Form 10-K for the fiscal year ended December 31, 2024, as supplemented by any additional risks identified in the Company’s subsequent Form 10-Qs. These risks and uncertainties should be considered in evaluating forward-looking statements and undue reliance should not be placed on such statements. Use of Non-GAAP Financial Measures. This presentation contains certain financial information determined by methods other than in accordance with accounting principals generally accepted in the United States (“GAAP”). These non-GAAP financial measures include “Tangible Book Value per Share” , “Tangible Common Equity to Tangible Assets” and “Efficiency Ratio”. The Company believes that these non-GAAP financial measures provide both management and investors a more complete understanding of the Company’s profitability. These non-GAAP financial measures are supplemental and are not a substitute for any analysis based on GAAP Measures. Not all companies use the same calculation of these measures; therefore this presentation may not be comparable to other similarly titled measures as presented by other companies. Reconciliations of these non-GAAP measures are provided in the Appendix section of this presentation. Sources of Information: Company Management and S&P Global Market Intelligence 2
Contact Information Civista Bancshares, Inc.’s common shares are traded on the NASDAQ Capital Market under the symbol “CIVB.” Additional information can be found at: civb.com civista.bank Dennis G. Shaffer Chief Executive Officer & President dgshaffer@civista.bank Telephone: 888.645.4121 3
Who We Are 4
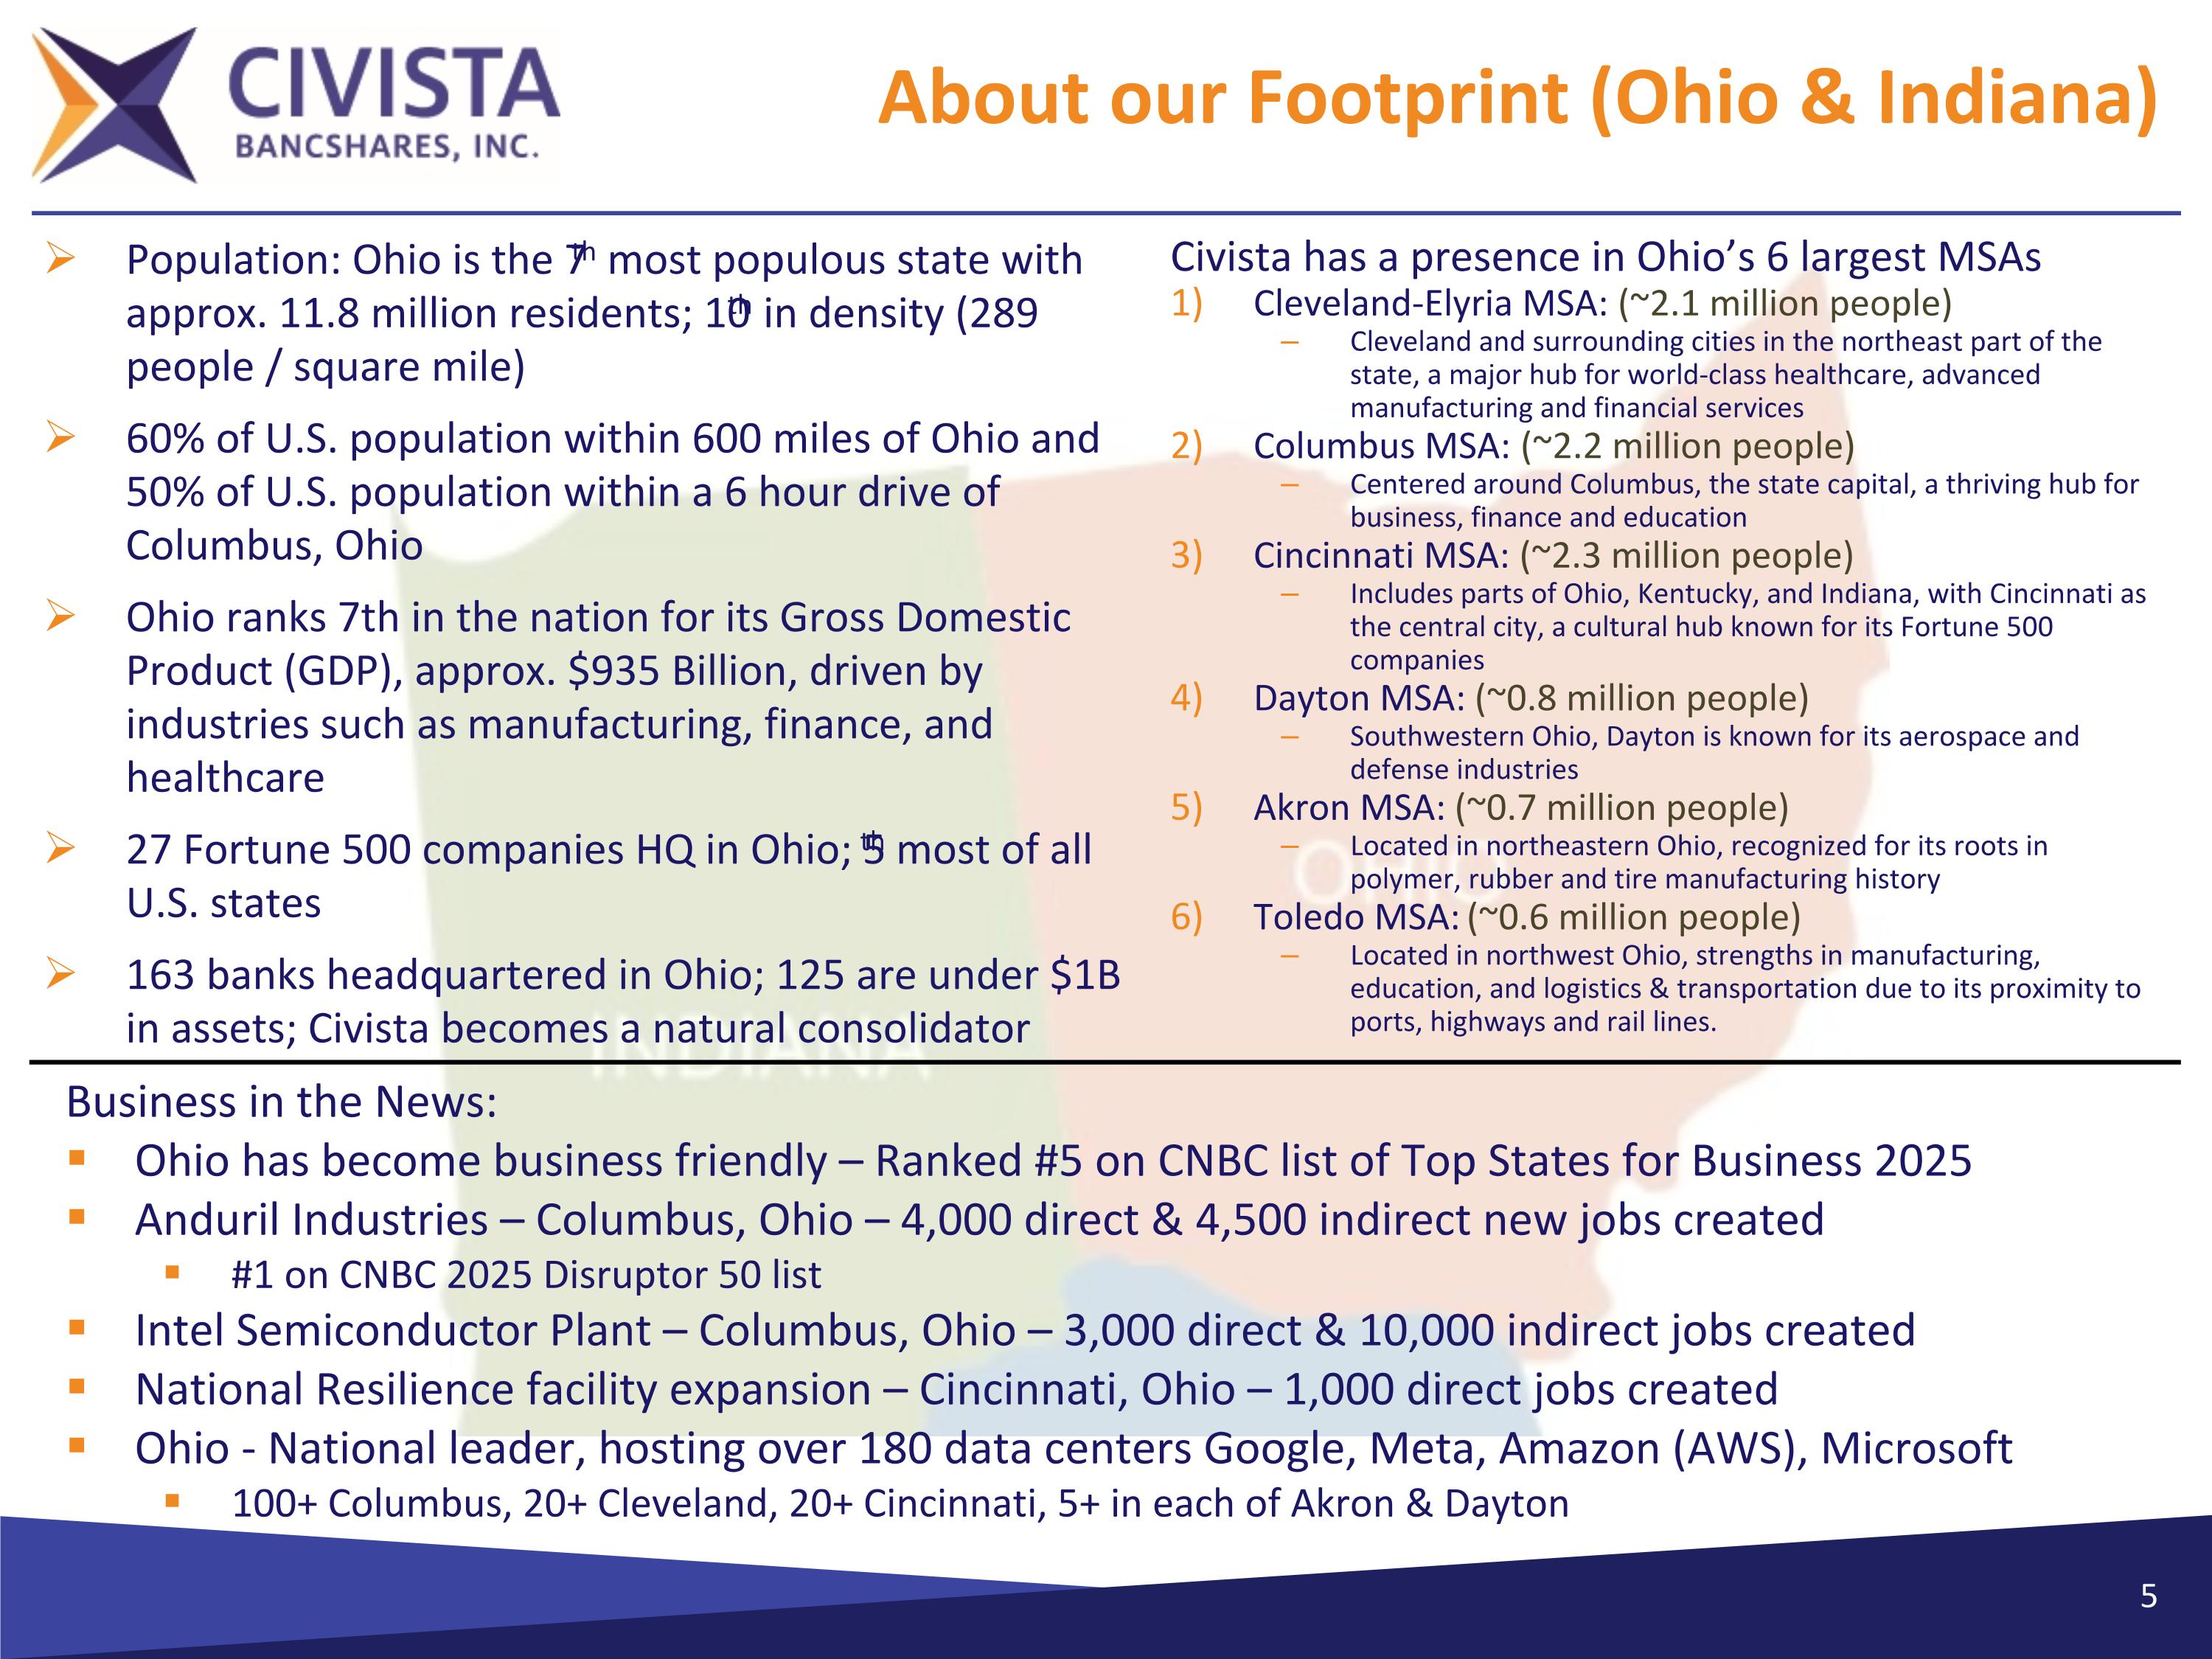
About our Footprint (Ohio & Indiana) Civista has a presence in Ohio’s 6 largest MSAs Cleveland-Elyria MSA: (~2.1 million people) Cleveland and surrounding cities in the northeast part of the state, a major hub for world-class healthcare, advanced manufacturing and financial services Columbus MSA: (~2.2 million people) Centered around Columbus, the state capital, a thriving hub for business, finance and education Cincinnati MSA: (~2.3 million people) Includes parts of Ohio, Kentucky, and Indiana, with Cincinnati as the central city, a cultural hub known for its Fortune 500 companies Dayton MSA: (~0.8 million people) Southwestern Ohio, Dayton is known for its aerospace and defense industries Akron MSA: (~0.7 million people) Located in northeastern Ohio, recognized for its roots in polymer, rubber and tire manufacturing history Toledo MSA: (~0.6 million people) Located in northwest Ohio, strengths in manufacturing, education, and logistics & transportation due to its proximity to ports, highways and rail lines. Population: Ohio is the 7th most populous state with approx. 11.8 million residents; 10th in density (289 people / square mile) 60% of U.S. population within 600 miles of Ohio and 50% of U.S. population within a 6 hour drive of Columbus, Ohio Ohio ranks 7th in the nation for its Gross Domestic Product (GDP), approx. $935 Billion, driven by industries such as manufacturing, finance, and healthcare 27 Fortune 500 companies HQ in Ohio; 5th most of all U.S. states 163 banks headquartered in Ohio; 125 are under $1B in assets; Civista becomes a natural consolidator Business in the News: Ohio has become business friendly – Ranked #5 on CNBC list of Top States for Business 2025 Anduril Industries – Columbus, Ohio – 4,000 direct & 4,500 indirect new jobs created #1 on CNBC 2025 Disruptor 50 list Intel Semiconductor Plant – Columbus, Ohio – 3,000 direct & 10,000 indirect jobs created National Resilience facility expansion – Cincinnati, Ohio – 1,000 direct jobs created Ohio - National leader, hosting over 180 data centers Google, Meta, Amazon (AWS), Microsoft 100+ Columbus, 20+ Cleveland, 20+ Cincinnati, 5+ in each of Akron & Dayton
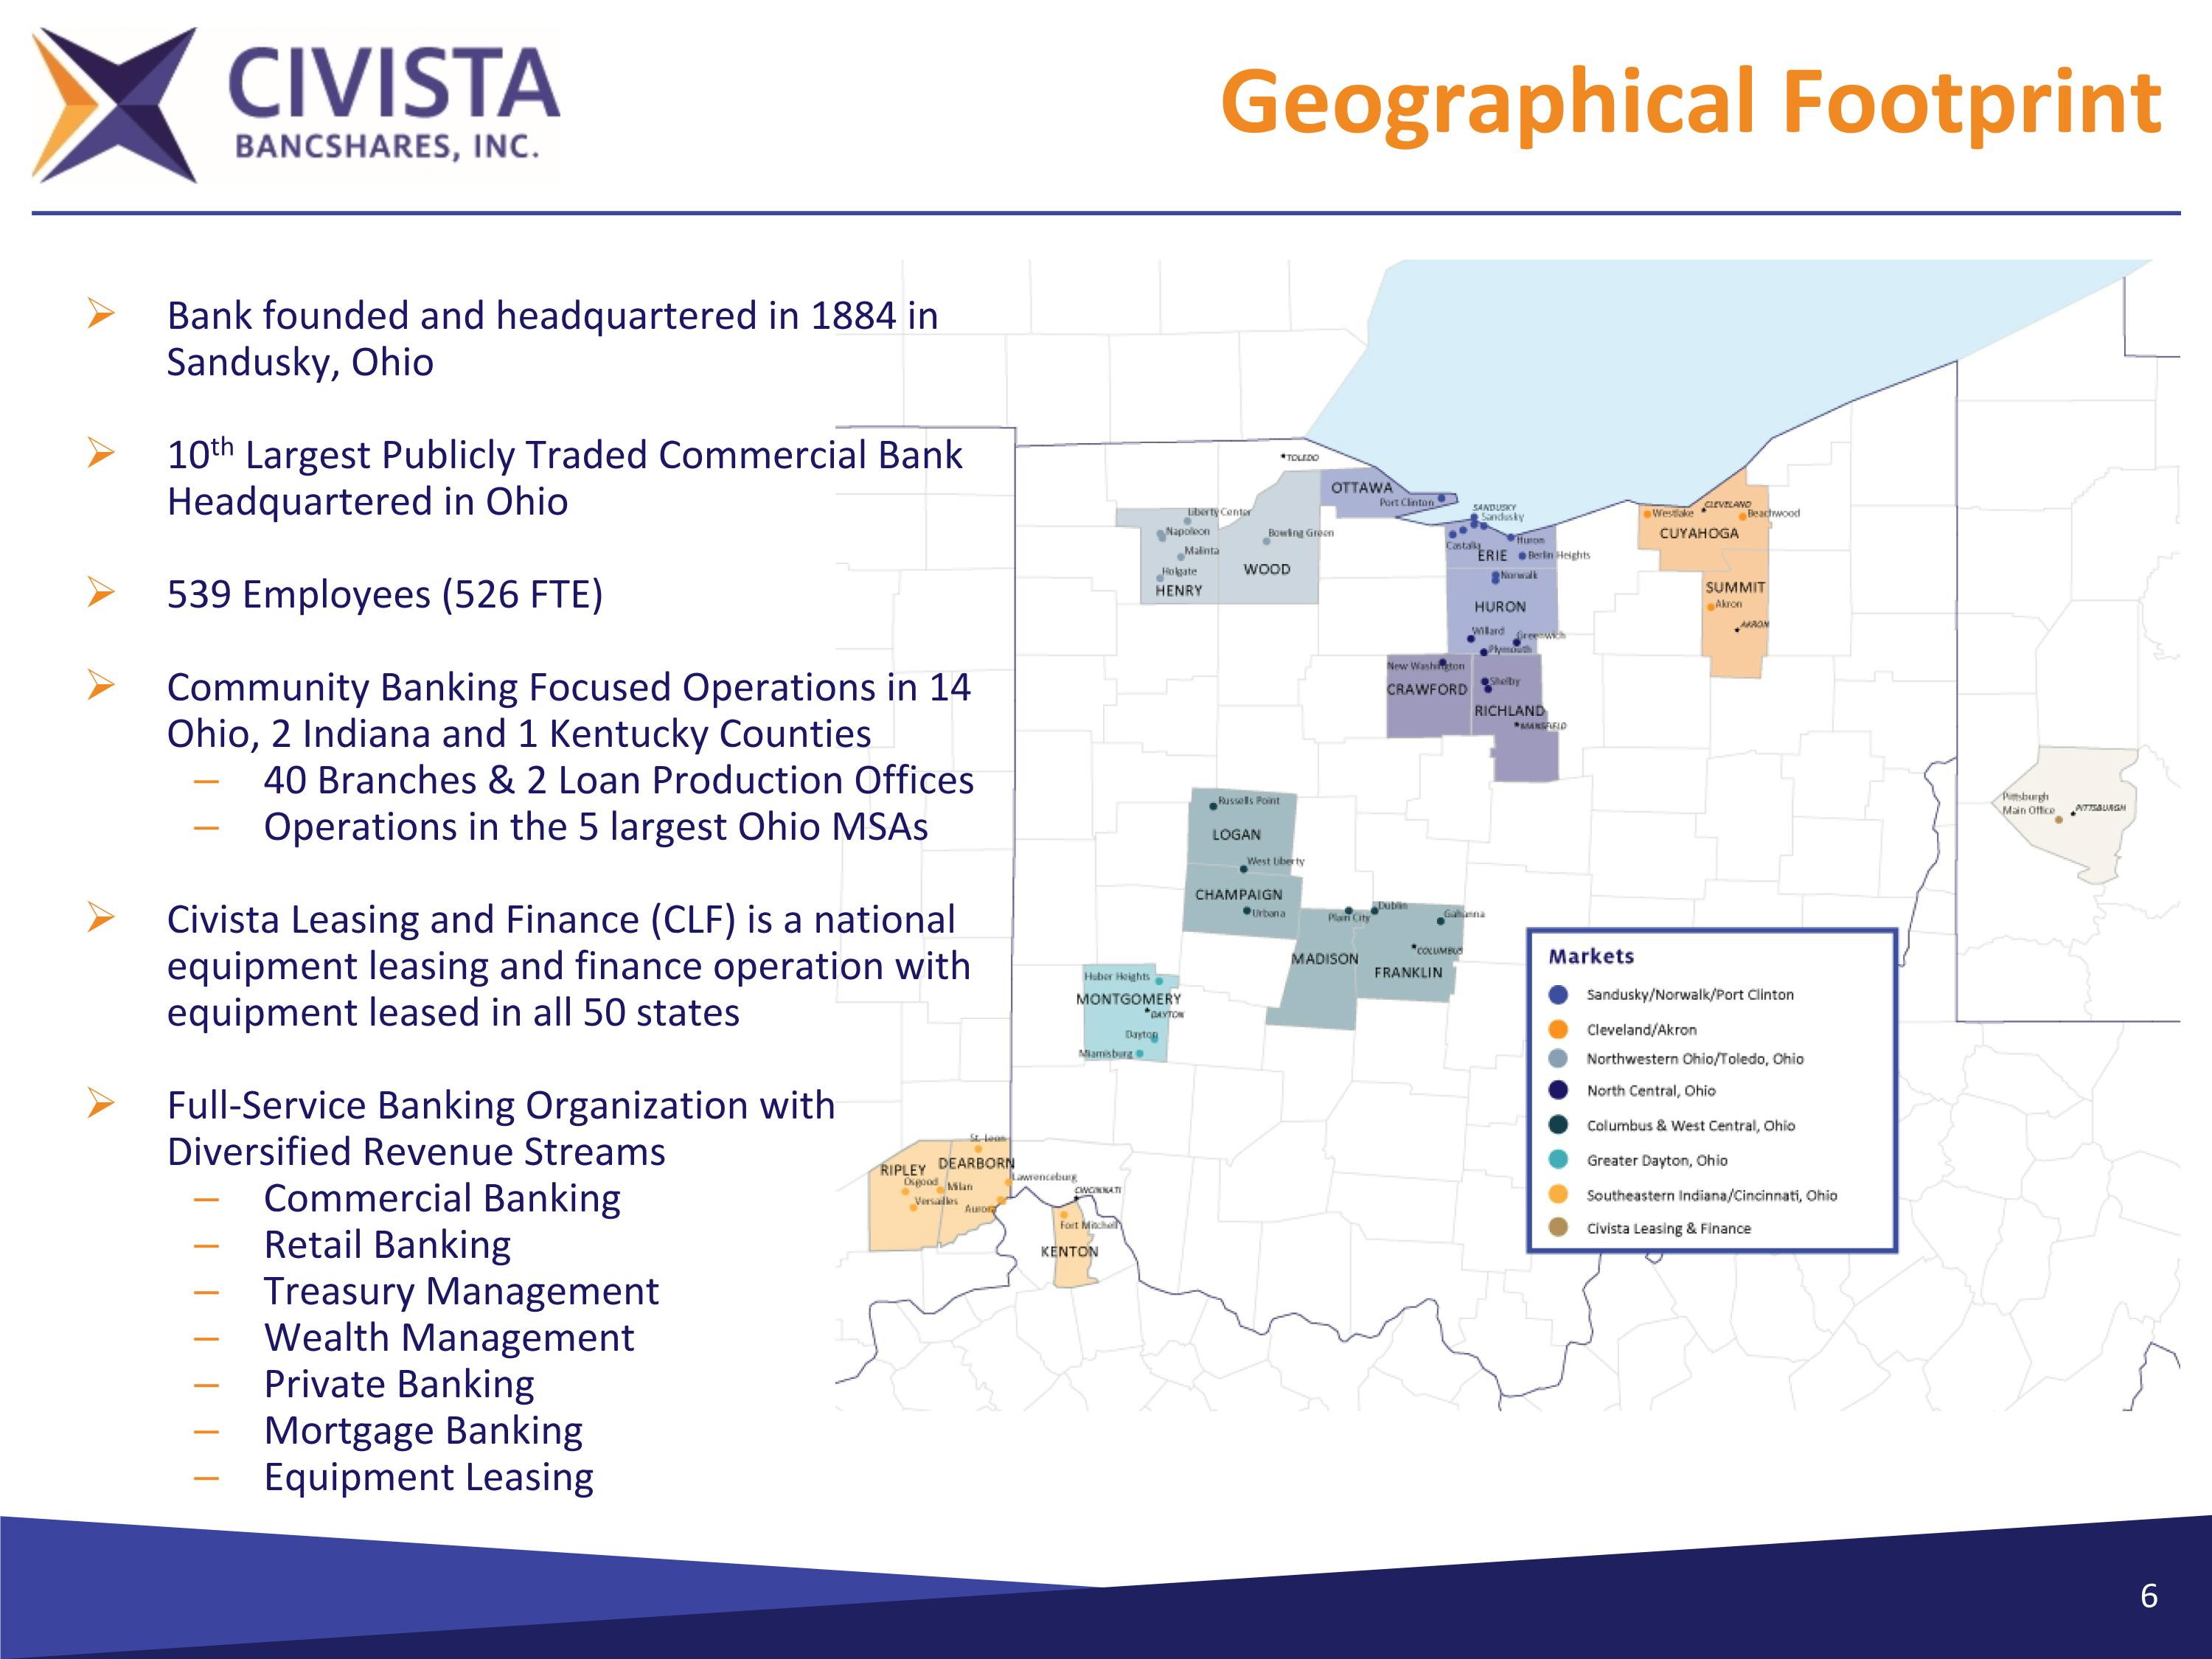
Geographical Footprint Bank founded and headquartered in 1884 in Sandusky, Ohio 10th Largest Publicly Traded Commercial Bank Headquartered in Ohio 539 Employees (526 FTE) Community Banking Focused Operations in 14 Ohio, 2 Indiana and 1 Kentucky Counties 40 Branches & 2 Loan Production Offices Operations in the 5 largest Ohio MSAs Civista Leasing and Finance (CLF) is a national equipment leasing and finance operation with equipment leased in all 50 states Full-Service Banking Organization with Diversified Revenue Streams Commercial Banking Retail Banking Treasury Management Wealth Management Private Banking Mortgage Banking Equipment Leasing
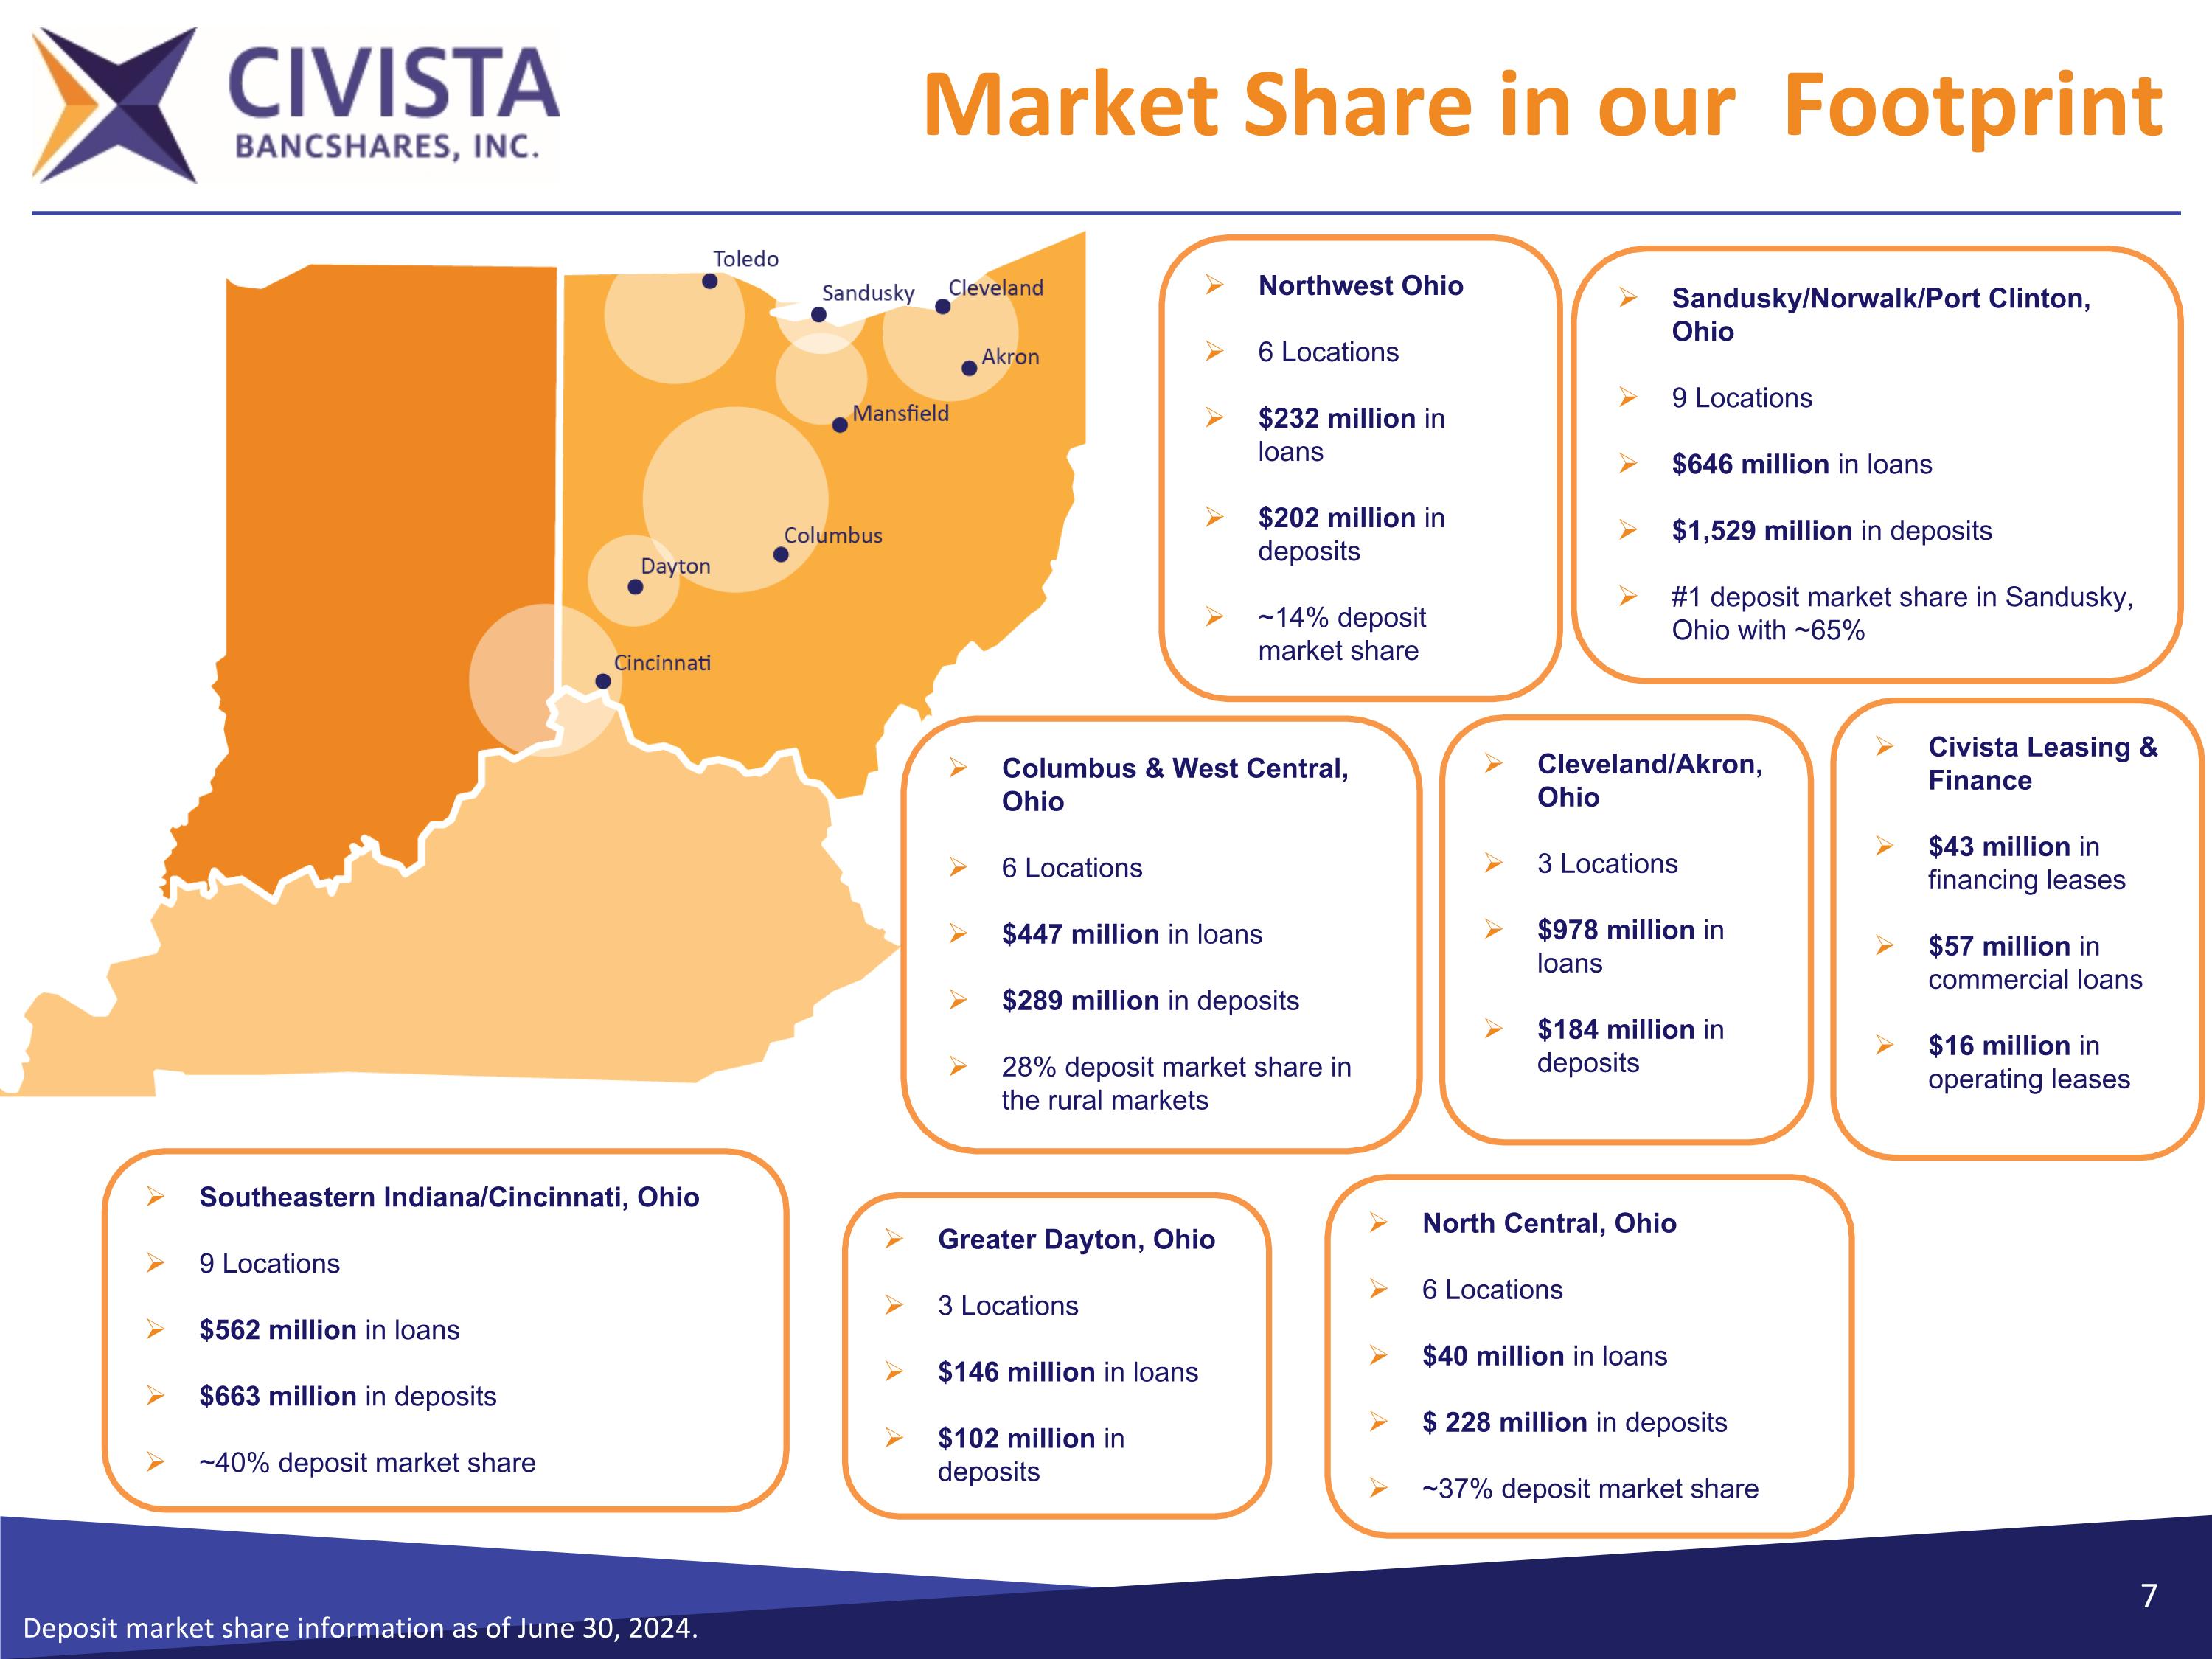
Market Share in our Footprint Deposit market share information as of June 30, 2024. Sandusky/Norwalk/Port Clinton, Ohio 9 Locations $646 million in loans $1,529 million in deposits #1 deposit market share in Sandusky, Ohio with ~65% Cleveland/Akron, Ohio 3 Locations $978 million in loans $184 million in deposits North Central, Ohio 6 Locations $40 million in loans $ 228 million in deposits ~37% deposit market share Columbus & West Central, Ohio 6 Locations $447 million in loans $289 million in deposits 28% deposit market share in the rural markets Greater Dayton, Ohio 3 Locations $146 million in loans $102 million in deposits Southeastern Indiana/Cincinnati, Ohio 9 Locations $562 million in loans $663 million in deposits ~40% deposit market share Northwest Ohio 6 Locations $232 million in loans $202 million in deposits ~14% deposit market share Civista Leasing & Finance $43 million in financing leases $57 million in commercial loans $16 million in operating leases
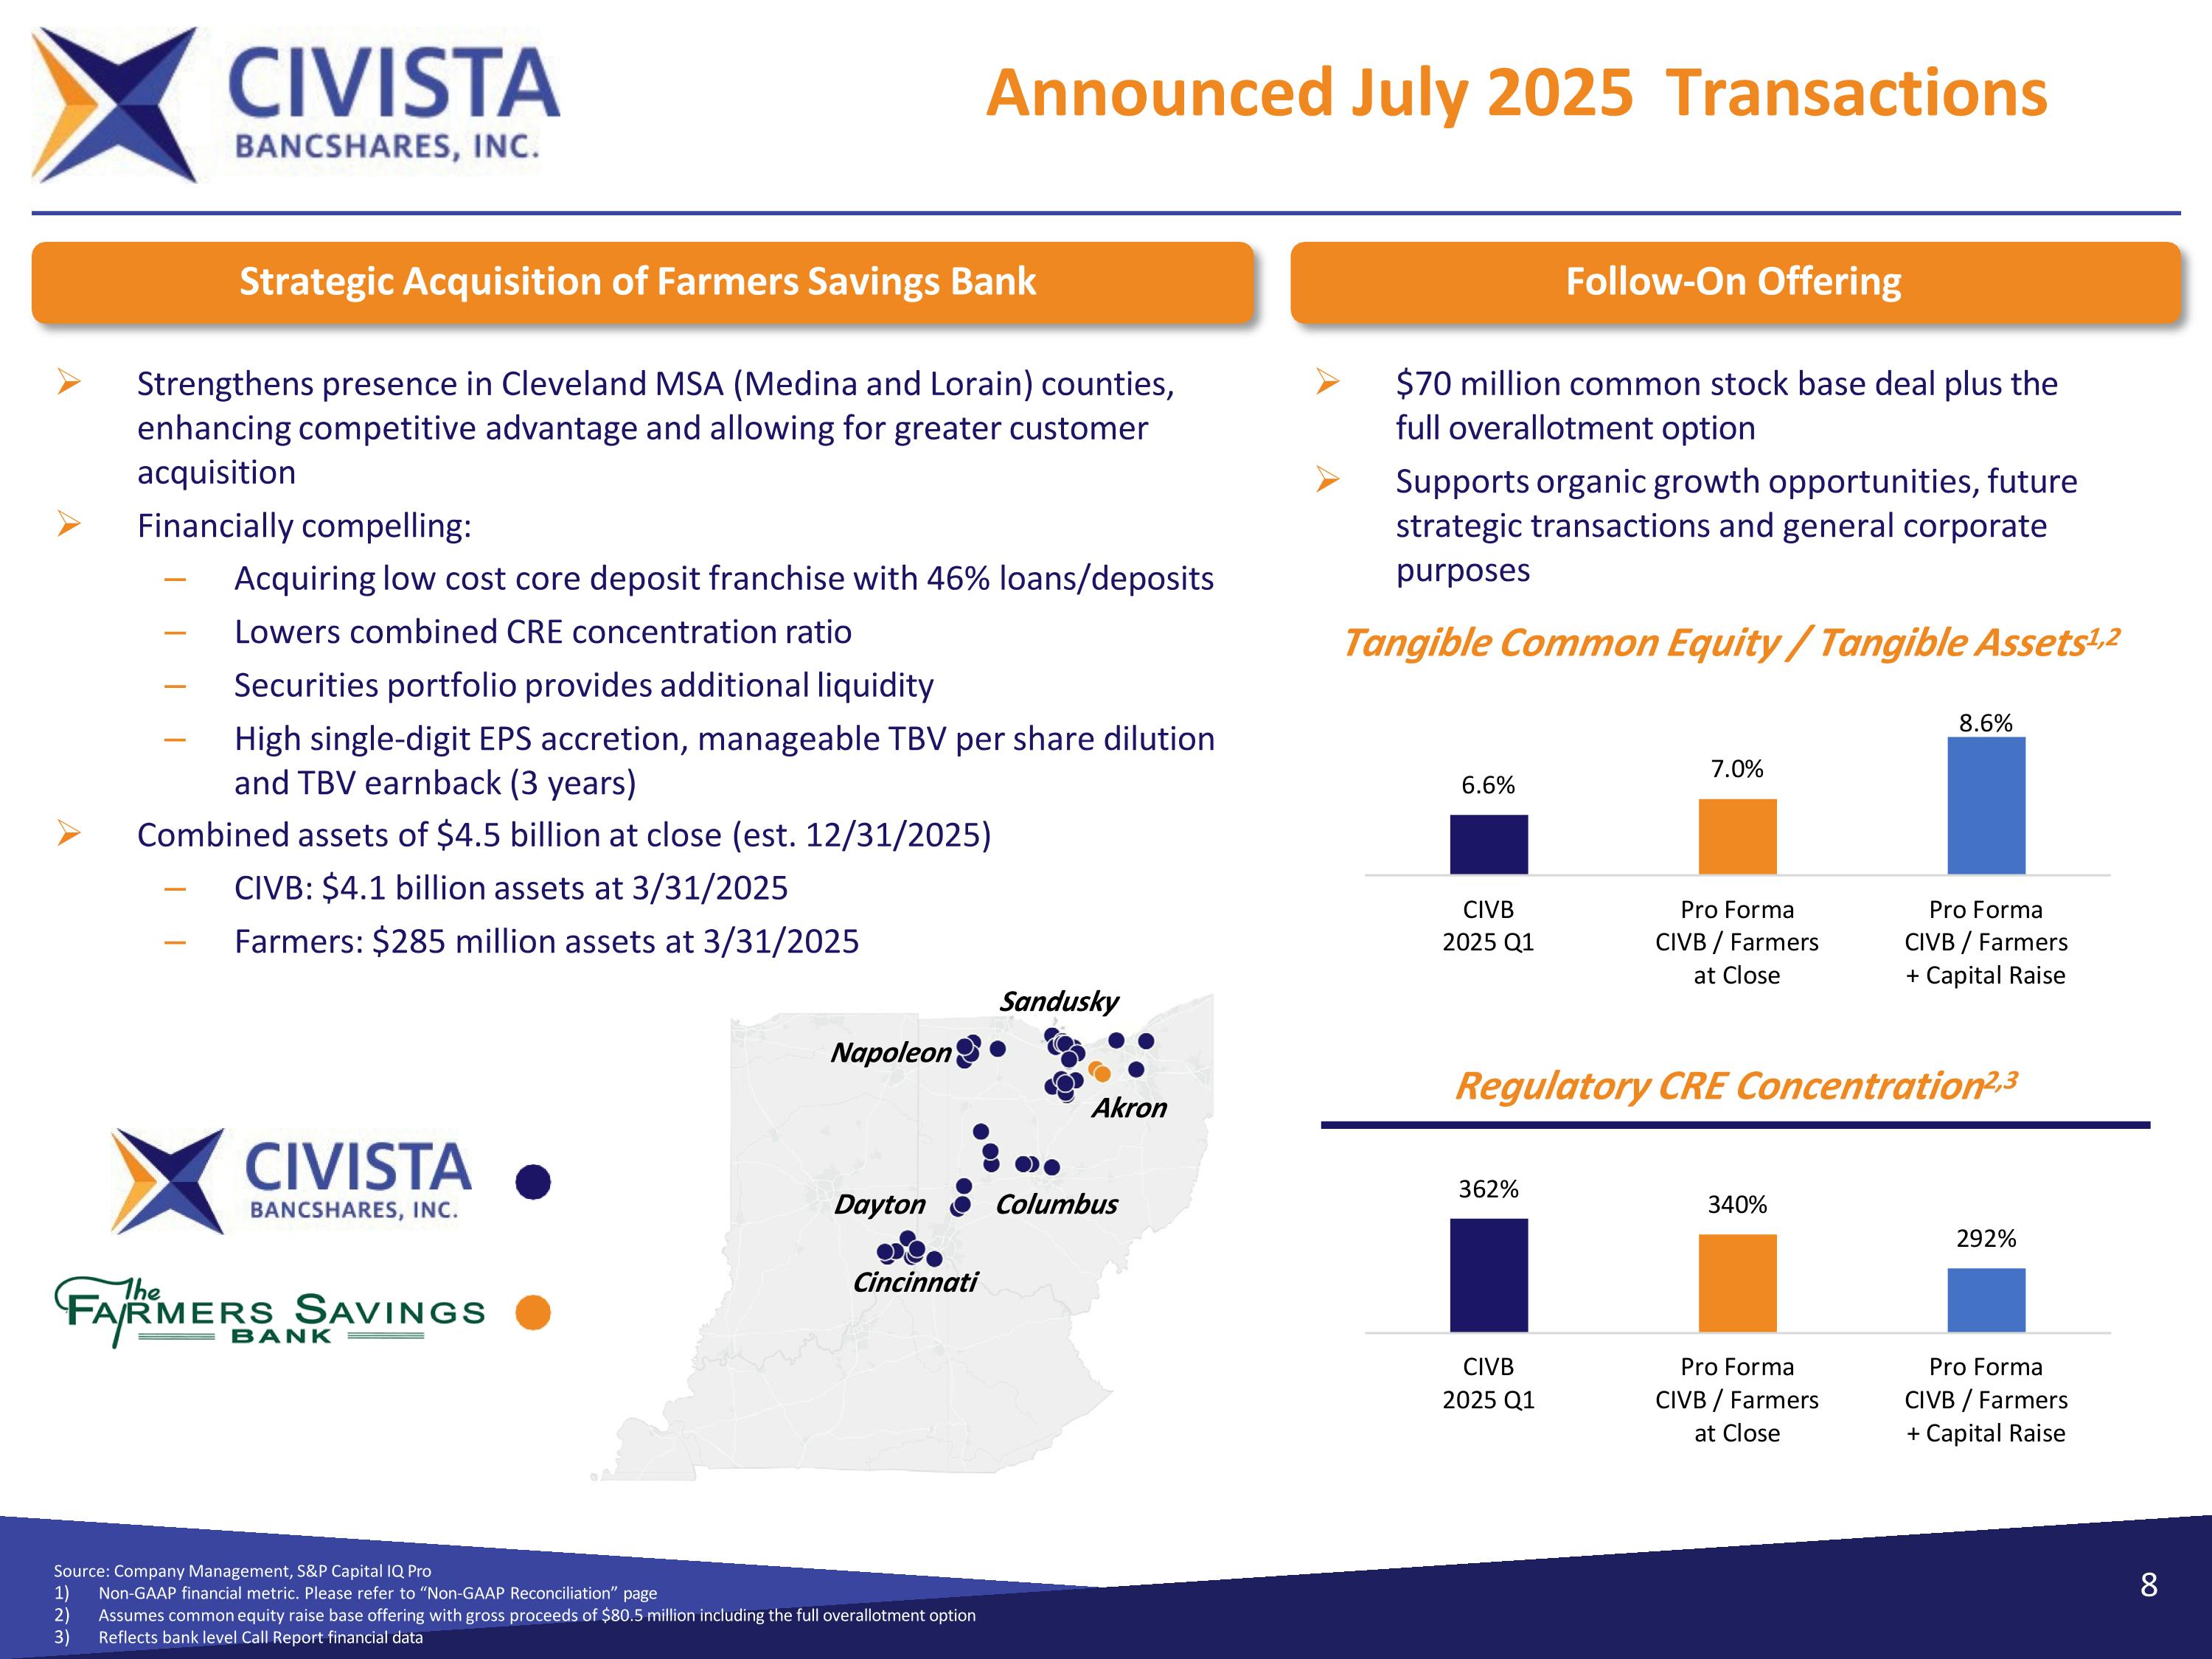
Source: Company Management, S&P Capital IQ Pro Non-GAAP financial metric. Please refer to “Non-GAAP Reconciliation” page Assumes common equity raise base offering with gross proceeds of $80.5 million including the full overallotment option Reflects bank level Call Report financial data Strategic Acquisition of Farmers Savings Bank Follow-On Offering Cincinnati Columbus Dayton Sandusky Akron Napoleon Strengthens presence in Cleveland MSA (Medina and Lorain) counties, enhancing competitive advantage and allowing for greater customer acquisition Financially compelling: Acquiring low cost core deposit franchise with 46% loans/deposits Lowers combined CRE concentration ratio Securities portfolio provides additional liquidity High single-digit EPS accretion, manageable TBV per share dilution and TBV earnback (3 years) Combined assets of $4.5 billion at close (est. 12/31/2025) CIVB: $4.1 billion assets at 3/31/2025 Farmers: $285 million assets at 3/31/2025 $70 million common stock base deal plus the full overallotment option Supports organic growth opportunities, future strategic transactions and general corporate purposes Tangible Common Equity / Tangible Assets1,2 Regulatory CRE Concentration2,3 8 Announced July 2025 Transactions
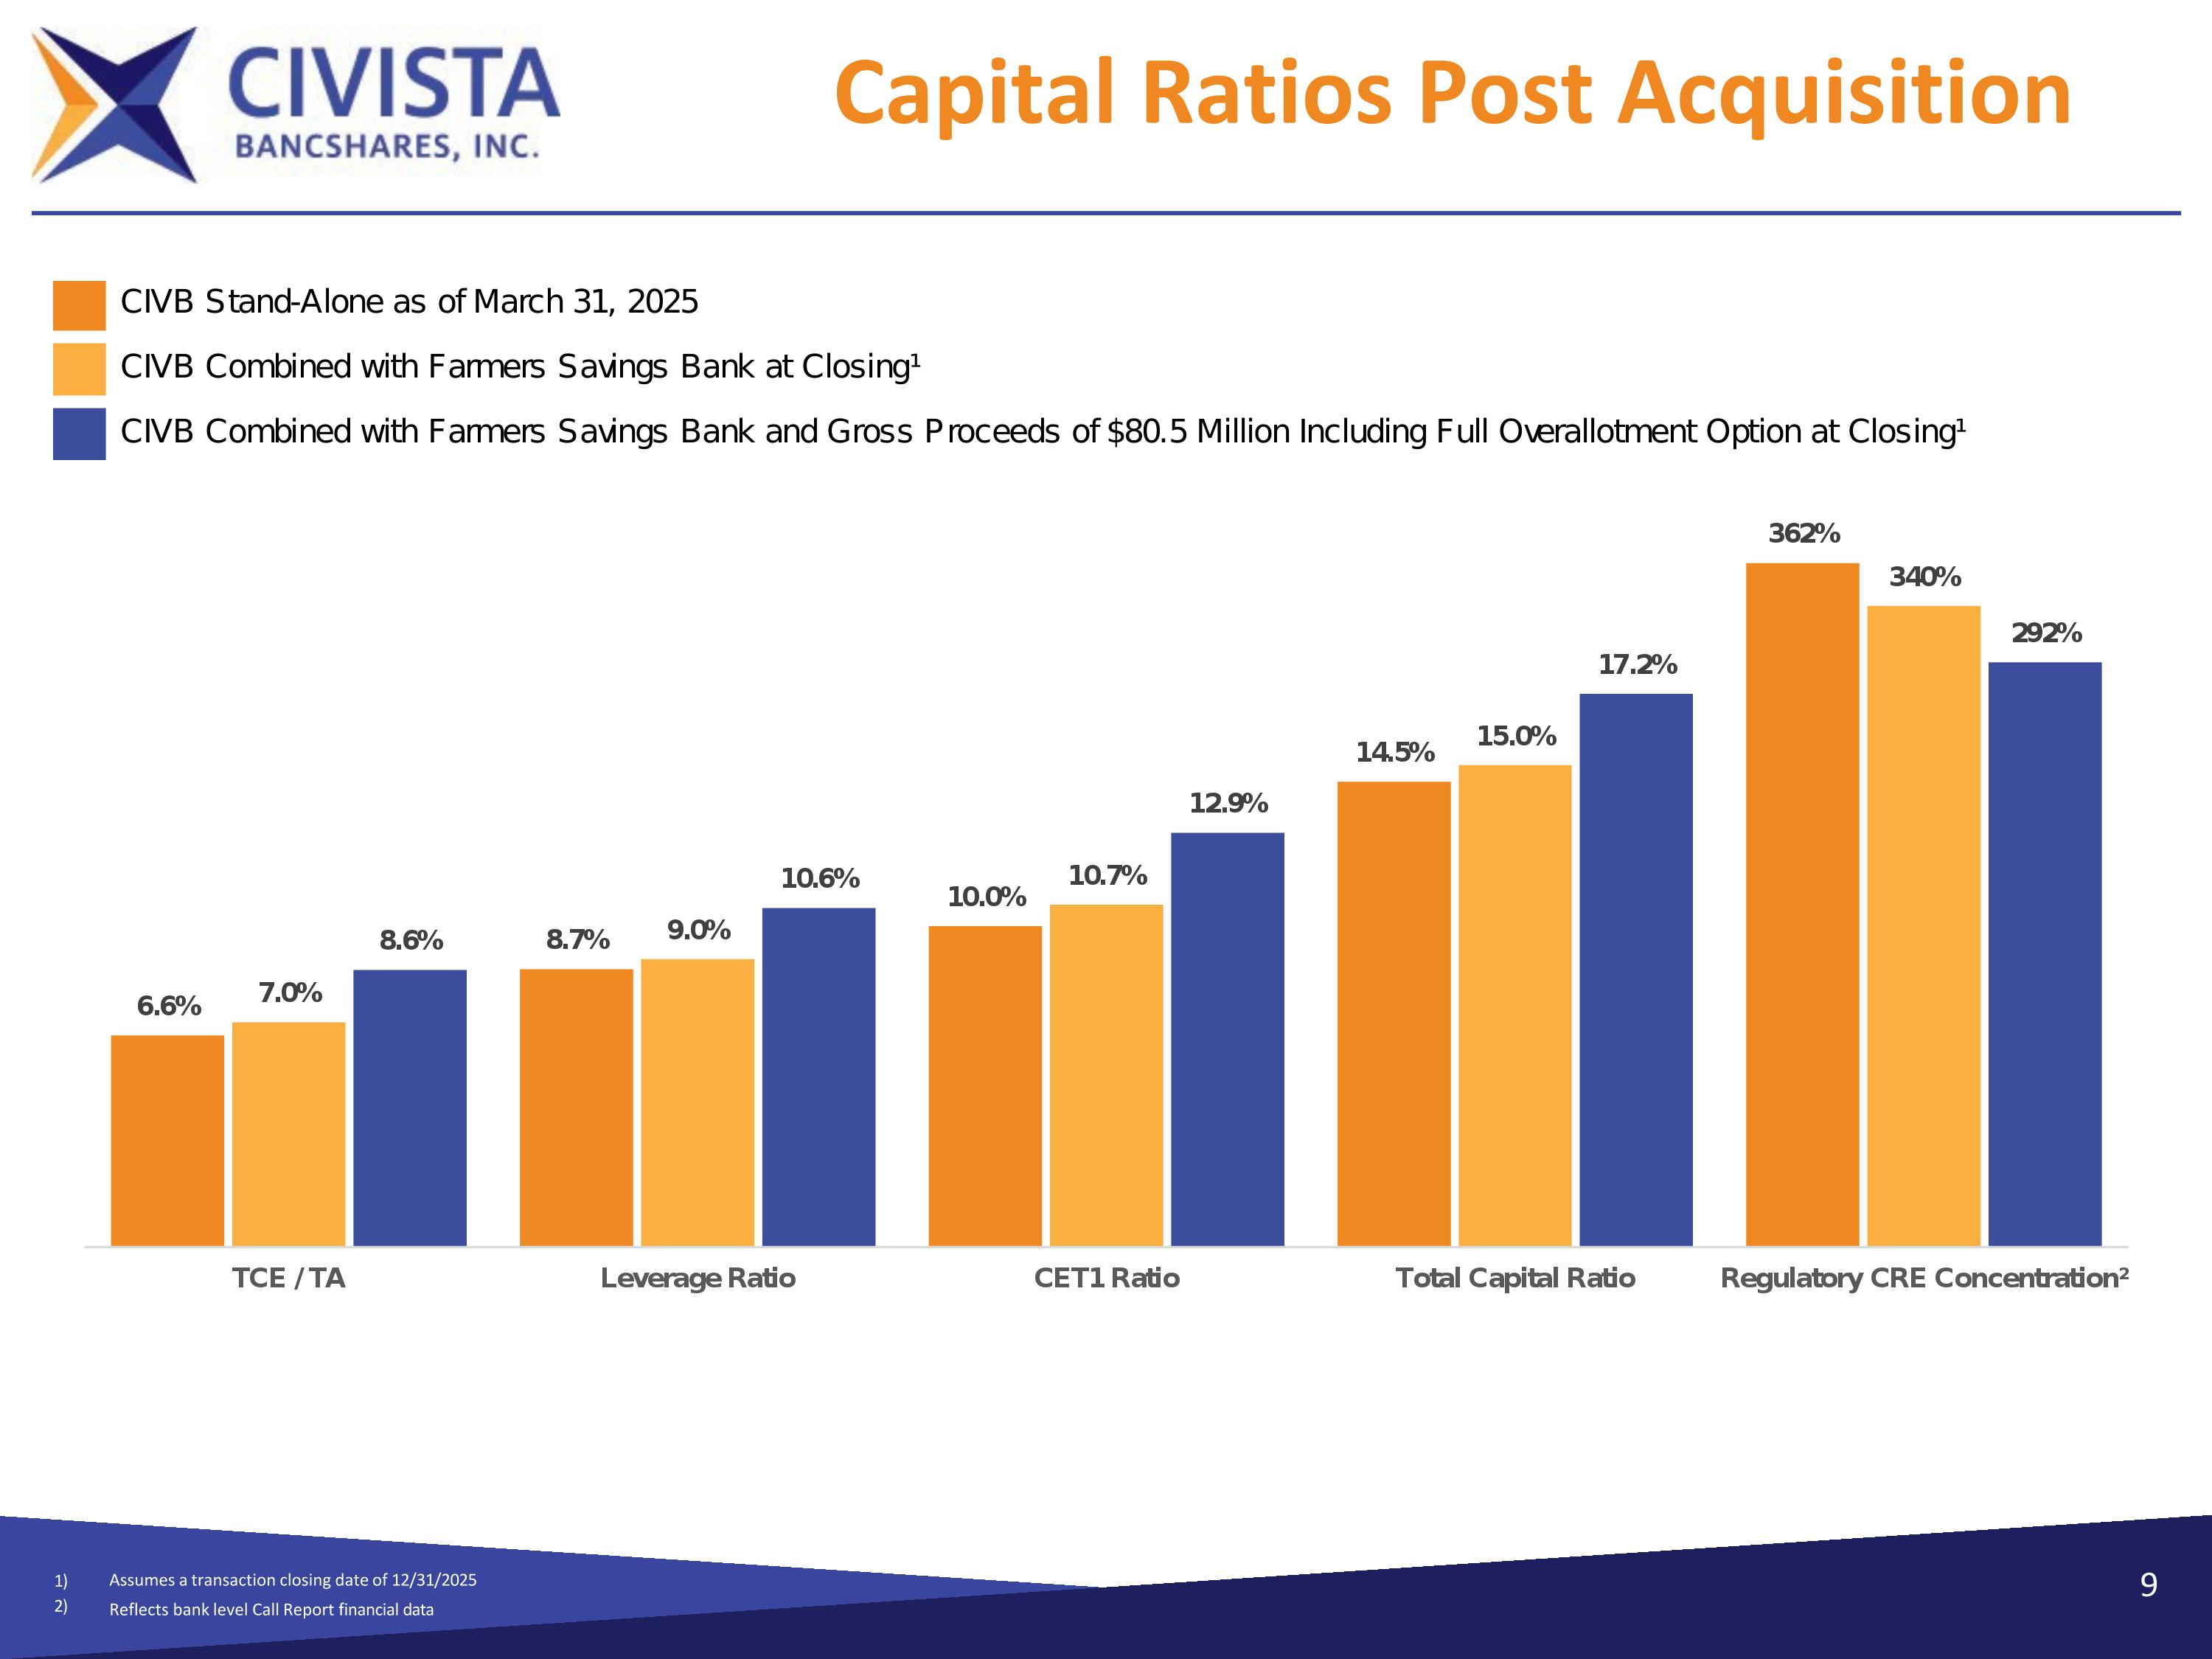
Capital Ratios Post Acquisition 1) 2) Assumes a transaction closing date of 12/31/2025 Reflects bank level Call Report financial data 9
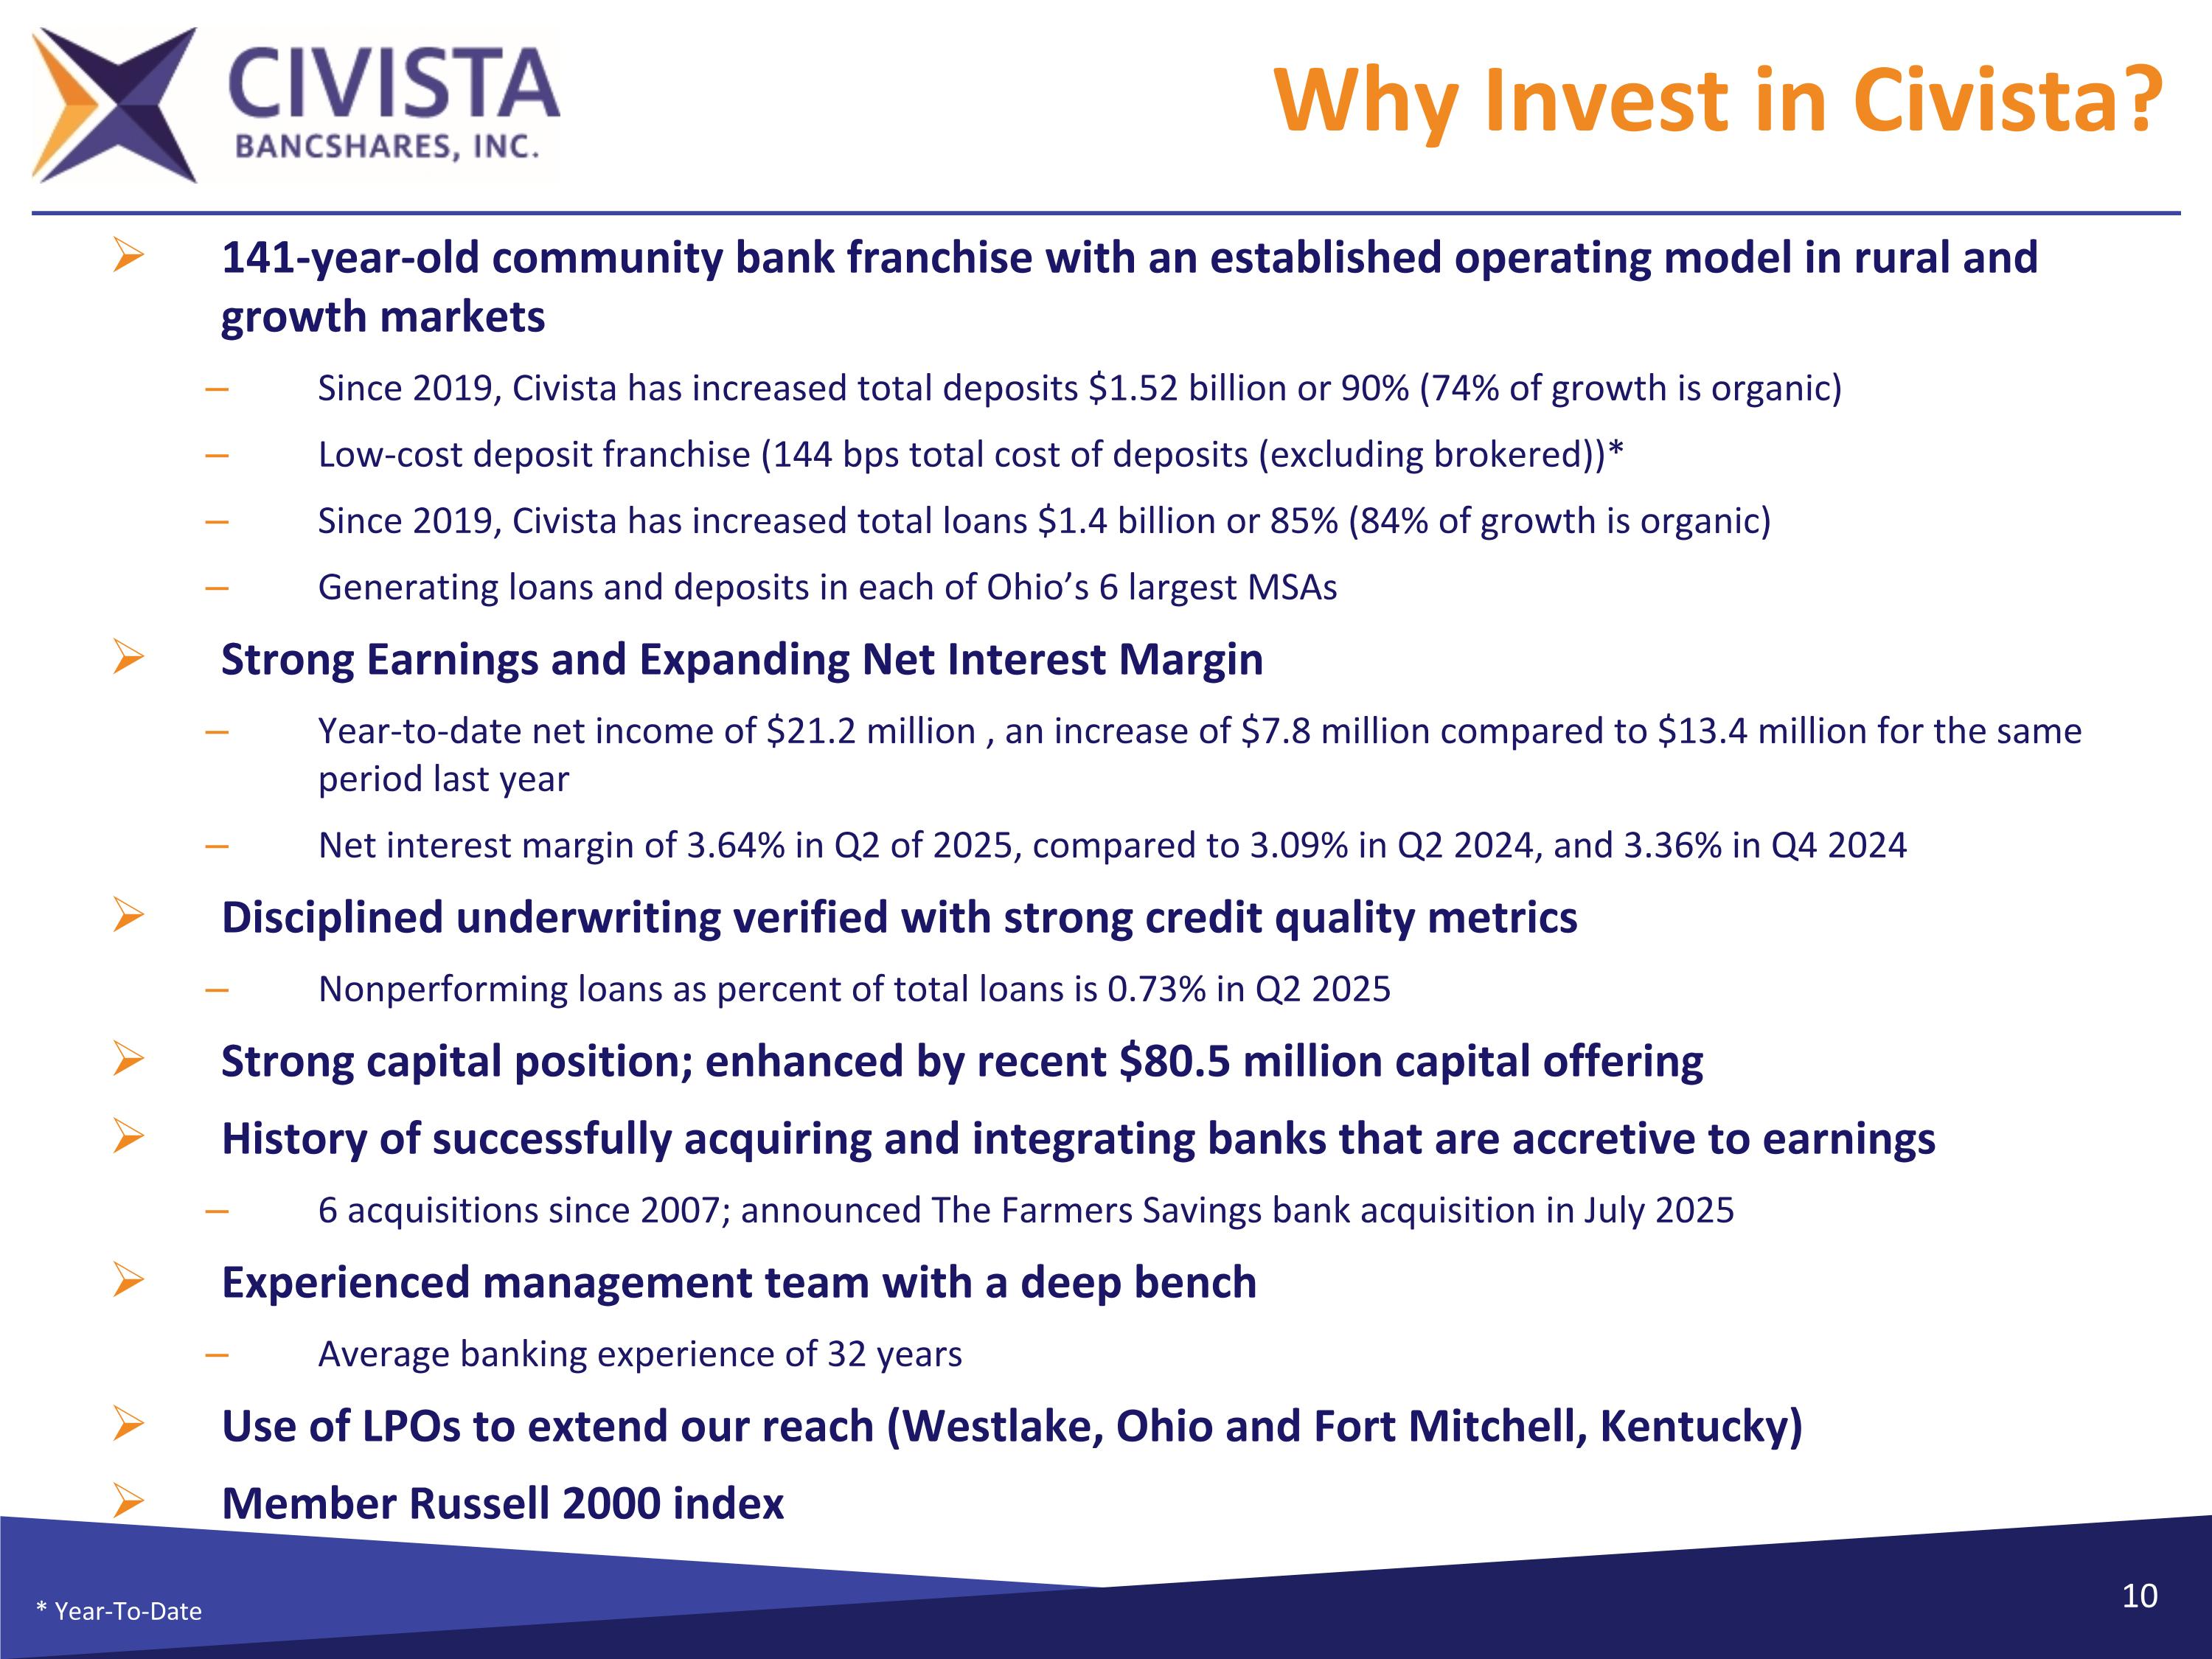
Why Invest in Civista? 141-year-old community bank franchise with an established operating model in rural and growth markets Since 2019, Civista has increased total deposits $1.52 billion or 90% (74% of growth is organic) Low-cost deposit franchise (144 bps total cost of deposits (excluding brokered))* Since 2019, Civista has increased total loans $1.4 billion or 85% (84% of growth is organic) Generating loans and deposits in each of Ohio’s 6 largest MSAs Strong Earnings and Expanding Net Interest Margin Year-to-date net income of $21.2 million , an increase of $7.8 million compared to $13.4 million for the same period last year Net interest margin of 3.64% in Q2 of 2025, compared to 3.09% in Q2 2024, and 3.36% in Q4 2024 Disciplined underwriting verified with strong credit quality metrics Nonperforming loans as percent of total loans is 0.73% in Q2 2025 Strong capital position; enhanced by recent $80.5 million capital offering History of successfully acquiring and integrating banks that are accretive to earnings 6 acquisitions since 2007; announced The Farmers Savings bank acquisition in July 2025 Experienced management team with a deep bench Average banking experience of 32 years Use of LPOs to extend our reach (Westlake, Ohio and Fort Mitchell, Kentucky) Member Russell 2000 index * Year-To-Date
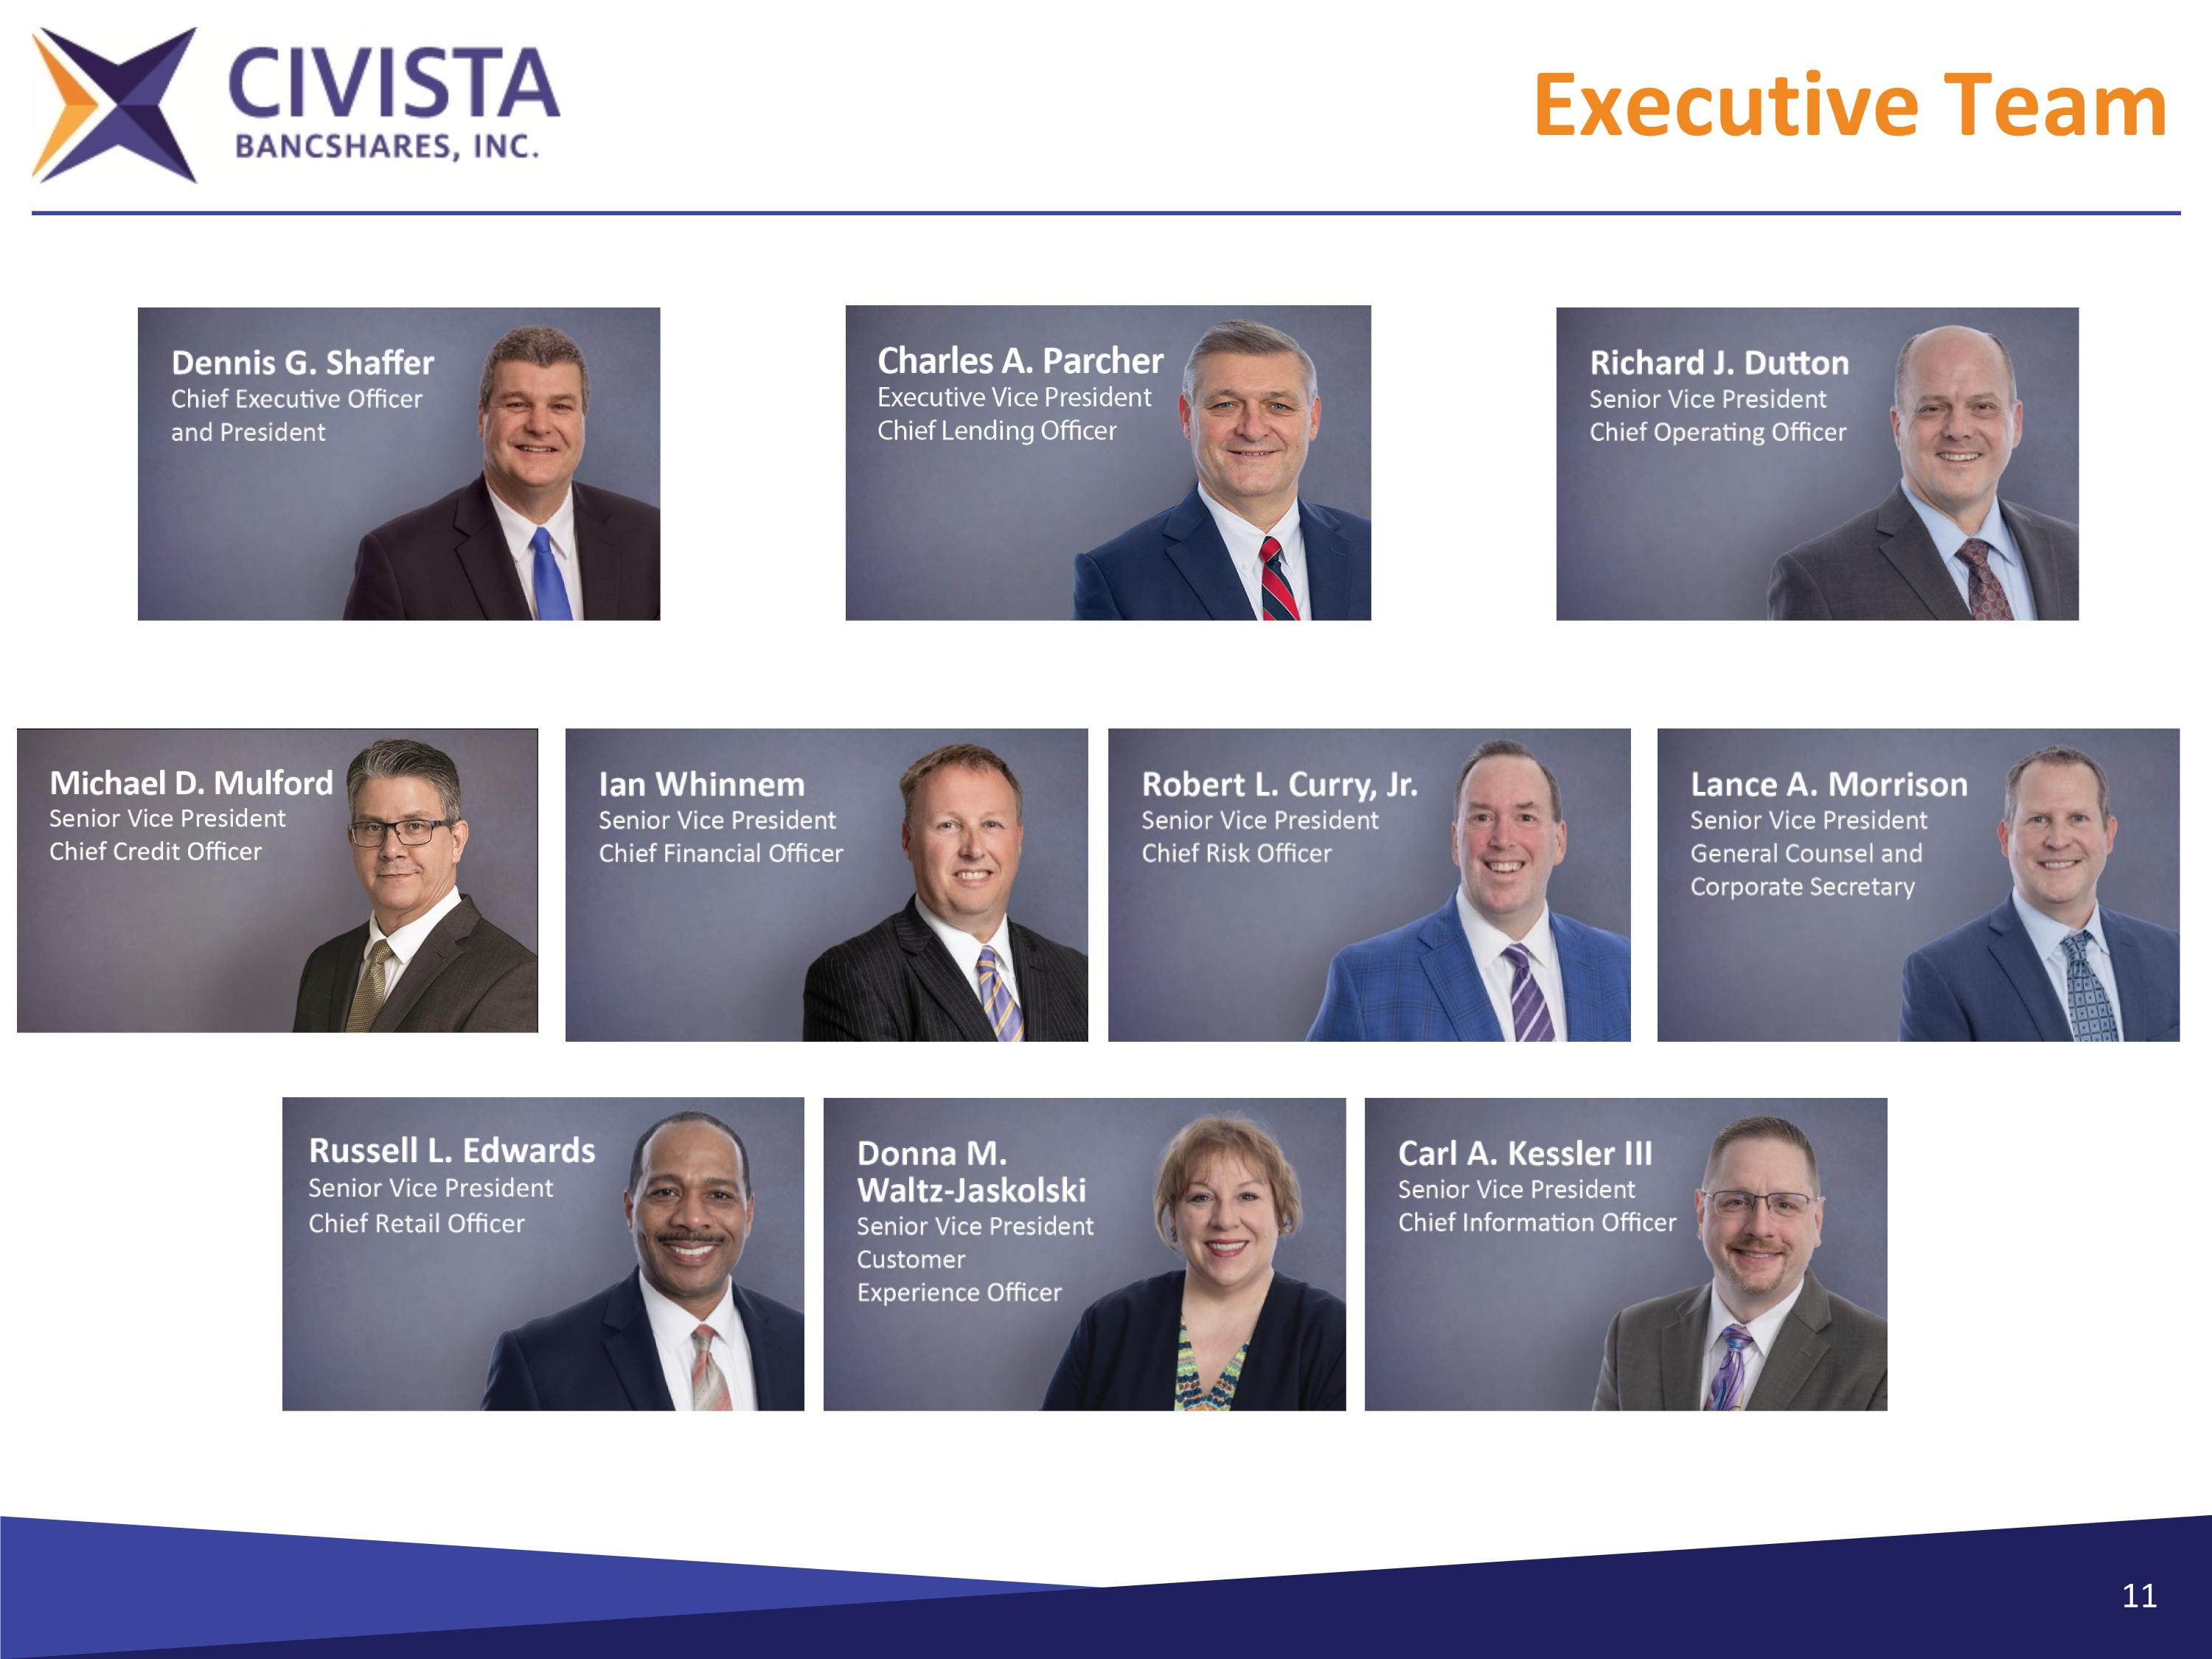
Executive Team

Community

Current Events 13
Deposits $3.2 billion in Total Deposits Excluding brokered, cost of deposits are 148 bps and deposits grew organically 7.3% YoY Civista Bank is 141 years old with a generational and relationship driven deposit core 85.7%* of deposits insured Excluding $544 million of primarily public operating deposits, Civista had no deposit concentrations “Civista’s deposit franchise is one of our most valuable characteristics and contributes significantly to our peer leading net interest margin and profitability” *Excluding Civista internal and tax program related deposit accounts - All Figures are as of June 30, 2025
Liquidity Cash and Securities are 23.7% of Total Deposits All securities are held for sale Strong on-balance sheet liquidity $508 million of cash and unpledged securities Ready access to off-balance sheet funding Immediate access to $1.3 billion in funding from FHLB, Federal Reserve and CDARS/IntraFi All Figures are as of June 30, 2025
Credit Credit metrics remain stable and strong Allowance for credit losses to loans was 1.28% Strong allowance for credit losses of $40.5 million Nonperforming loans as percent of total loans is 0.73% Net charge offs as percent of average loans is 0.01%* Virtually no central business office exposure $15.6 million, 0.5% of loan portfolio All Figures are as of June 30, 2025 * Last-Twelve-Months Basis
Capital Total shareholders’ equity of $404 million Tier 1 risk-based capital ratio of 11.18% Total risk-based capital ratio of 14.73% Civista continues to create capital through earnings “Well Capitalized” by regulatory standards Tangible Common Equity ratio of 6.70% Successful $70 million common stock base deal plus the full overallotment option in July 2025; bolstering capital ratios. Supports organic growth opportunities, future strategic transactions and general corporate purposes Proforma capital ratios following Farmers Acquisition & including Capital Raise 1 Regulatory CRE Concentration 2 = 292% Tangible Common Equity / Tangible Assets = 8.6% All Figures are as of June 30, 2025 Assumes common equity raise base offering with gross proceeds of $80.5 million including the full overallotment option – estimated at 12/31/2025 Reflects bank level Call Report financial data
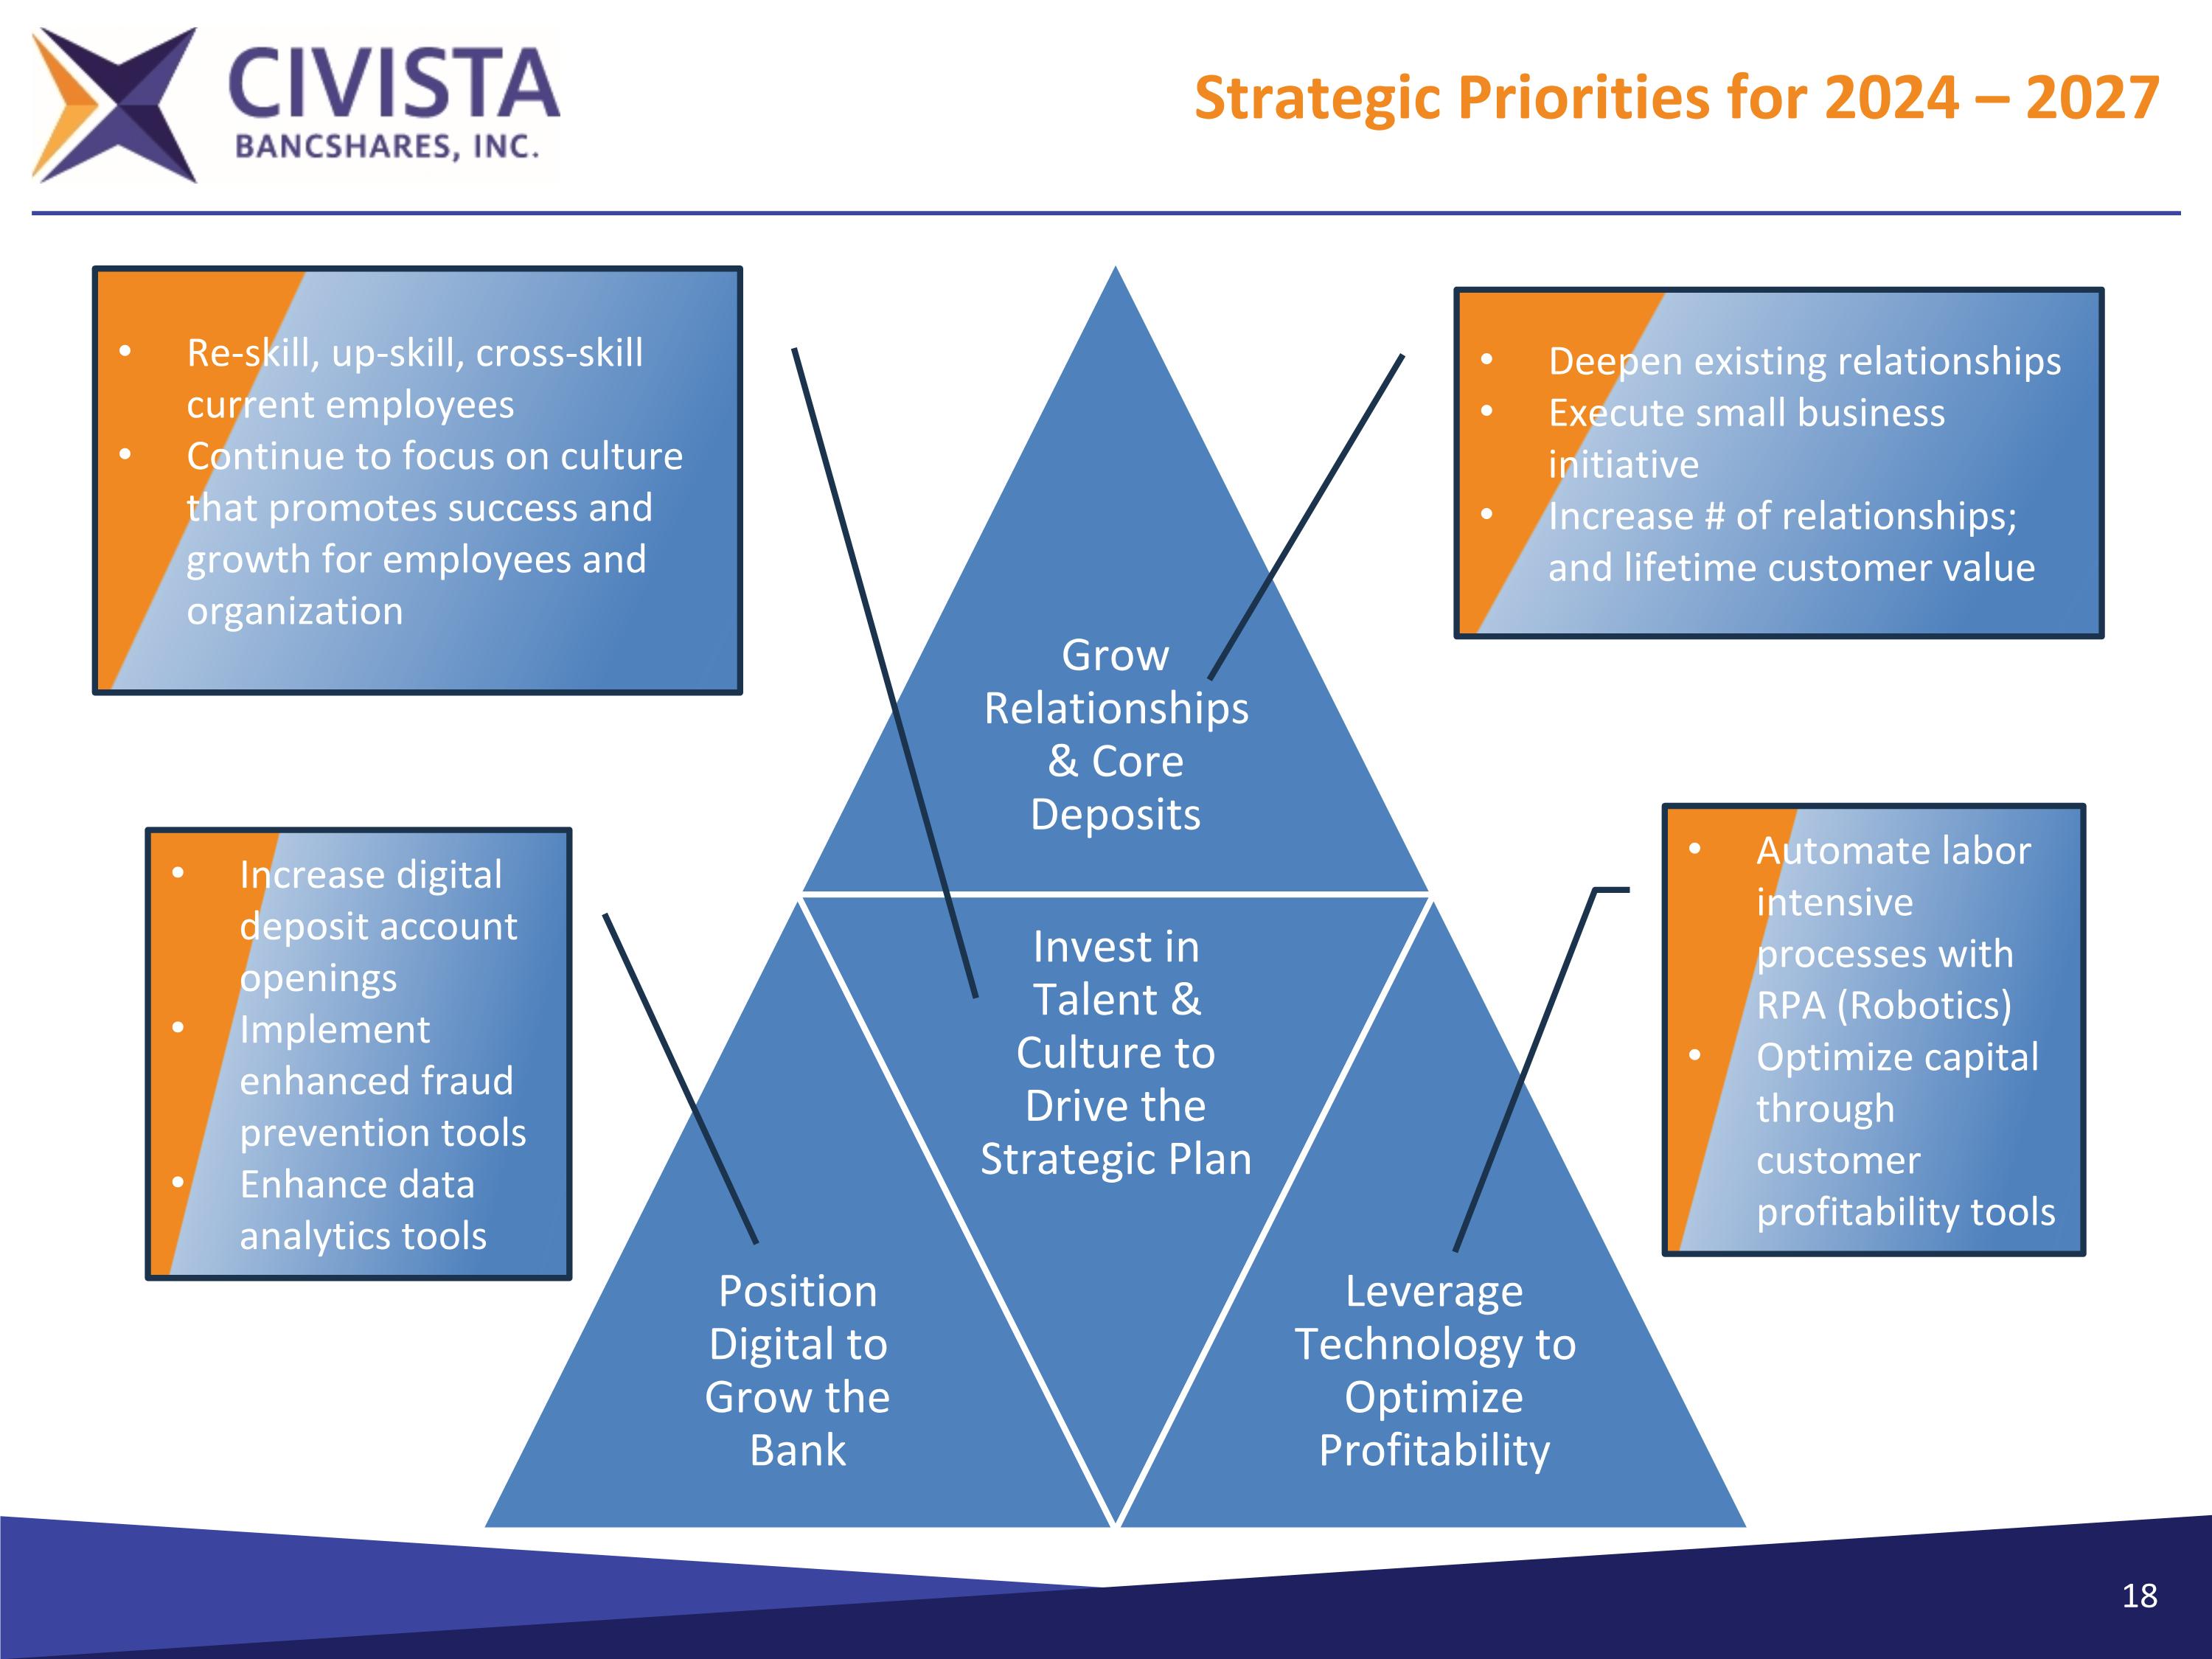
Strategic Priorities for 2024 – 2027 Grow Relationships & Core Deposits Position Digital to Grow the Bank Invest in Talent & Culture to Drive the Strategic Plan Leverage Technology to Optimize Profitability Deepen existing relationships Execute small business initiative Increase # of relationships; and lifetime customer value Automate labor intensive processes with RPA (Robotics) Optimize capital through customer profitability tools Re-skill, up-skill, cross-skill current employees Continue to focus on culture that promotes success and growth for employees and organization Increase digital deposit account openings Implement enhanced fraud prevention tools Enhance data analytics tools
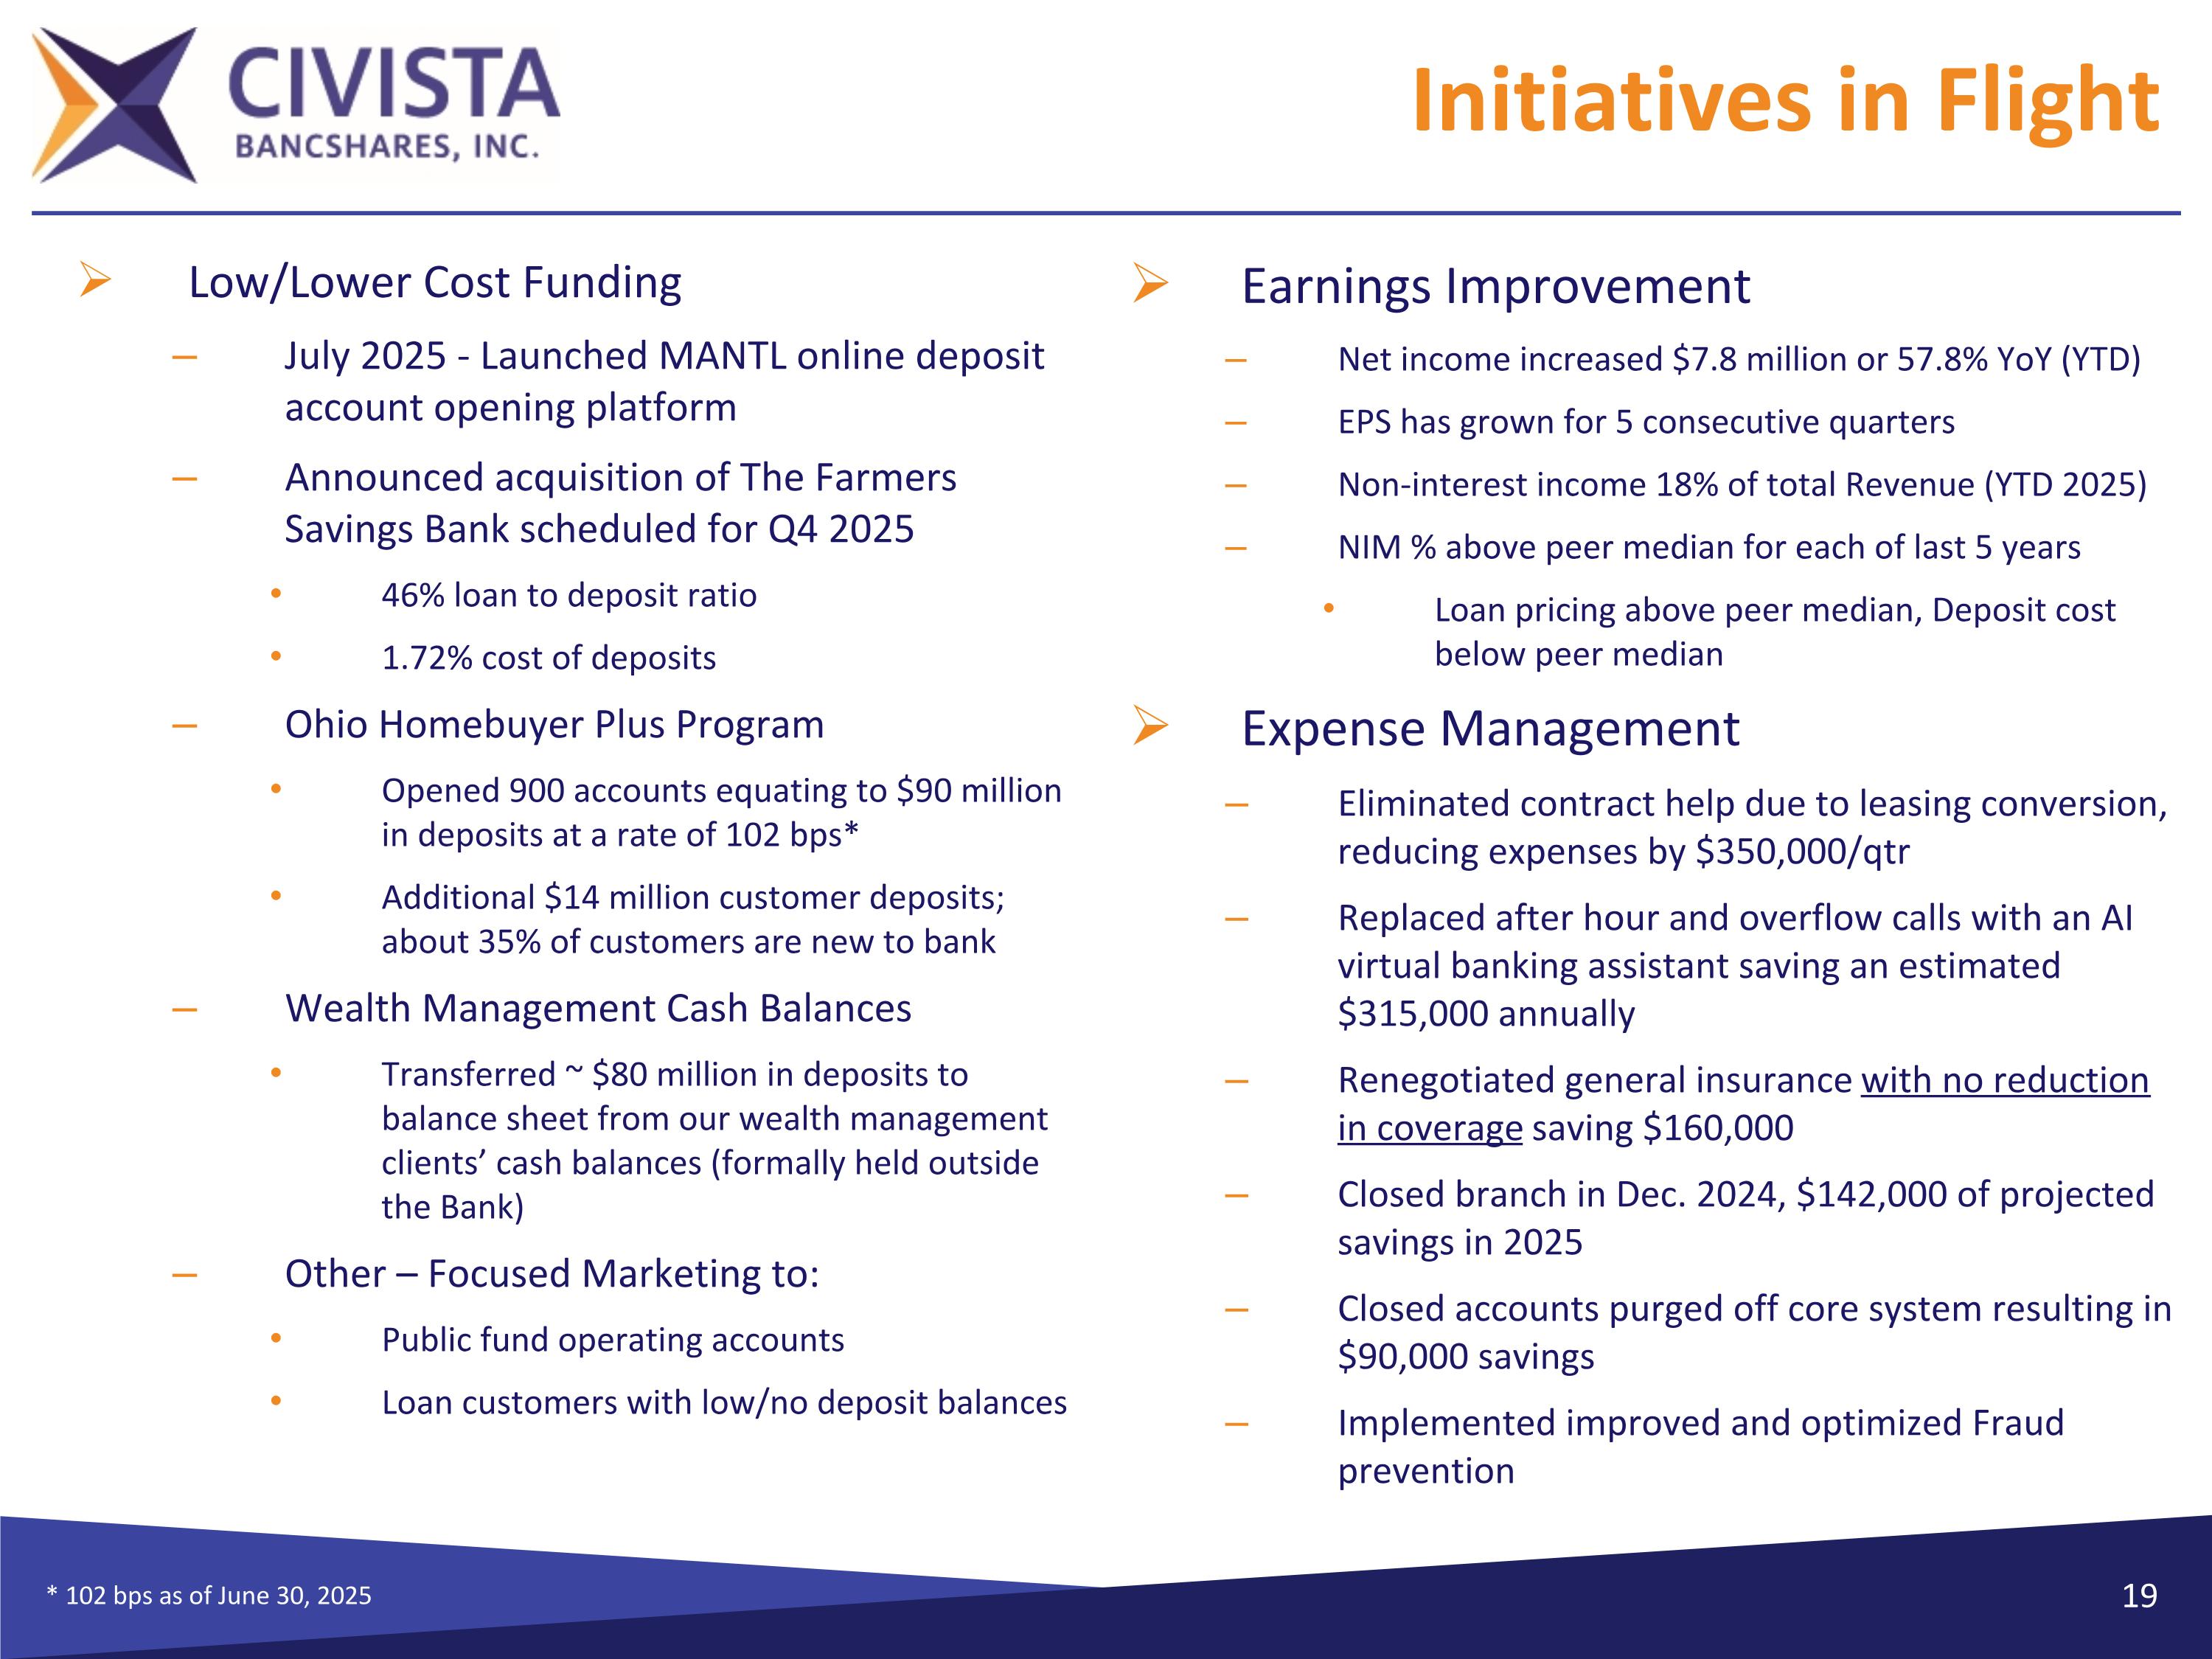
Initiatives in Flight Earnings Improvement Net income increased $7.8 million or 57.8% YoY (YTD) EPS has grown for 5 consecutive quarters Non-interest income 18% of total Revenue (YTD 2025) NIM % above peer median for each of last 5 years Loan pricing above peer median, Deposit cost below peer median Expense Management Eliminated contract help due to leasing conversion, reducing expenses by $350,000/qtr Replaced after hour and overflow calls with an AI virtual banking assistant saving an estimated $315,000 annually Renegotiated general insurance with no reduction in coverage saving $160,000 Closed branch in Dec. 2024, $142,000 of projected savings in 2025 Closed accounts purged off core system resulting in $90,000 savings Implemented improved and optimized Fraud prevention Low/Lower Cost Funding July 2025 - Launched MANTL online deposit account opening platform Announced acquisition of The Farmers Savings Bank scheduled for Q4 2025 46% loan to deposit ratio 1.72% cost of deposits Ohio Homebuyer Plus Program Opened 900 accounts equating to $90 million in deposits at a rate of 102 bps* Additional $14 million customer deposits; about 35% of customers are new to bank Wealth Management Cash Balances Transferred ~ $80 million in deposits to balance sheet from our wealth management clients’ cash balances (formally held outside the Bank) Other – Focused Marketing to: Public fund operating accounts Loan customers with low/no deposit balances * 102 bps as of June 30, 2025
Financial Trends 20
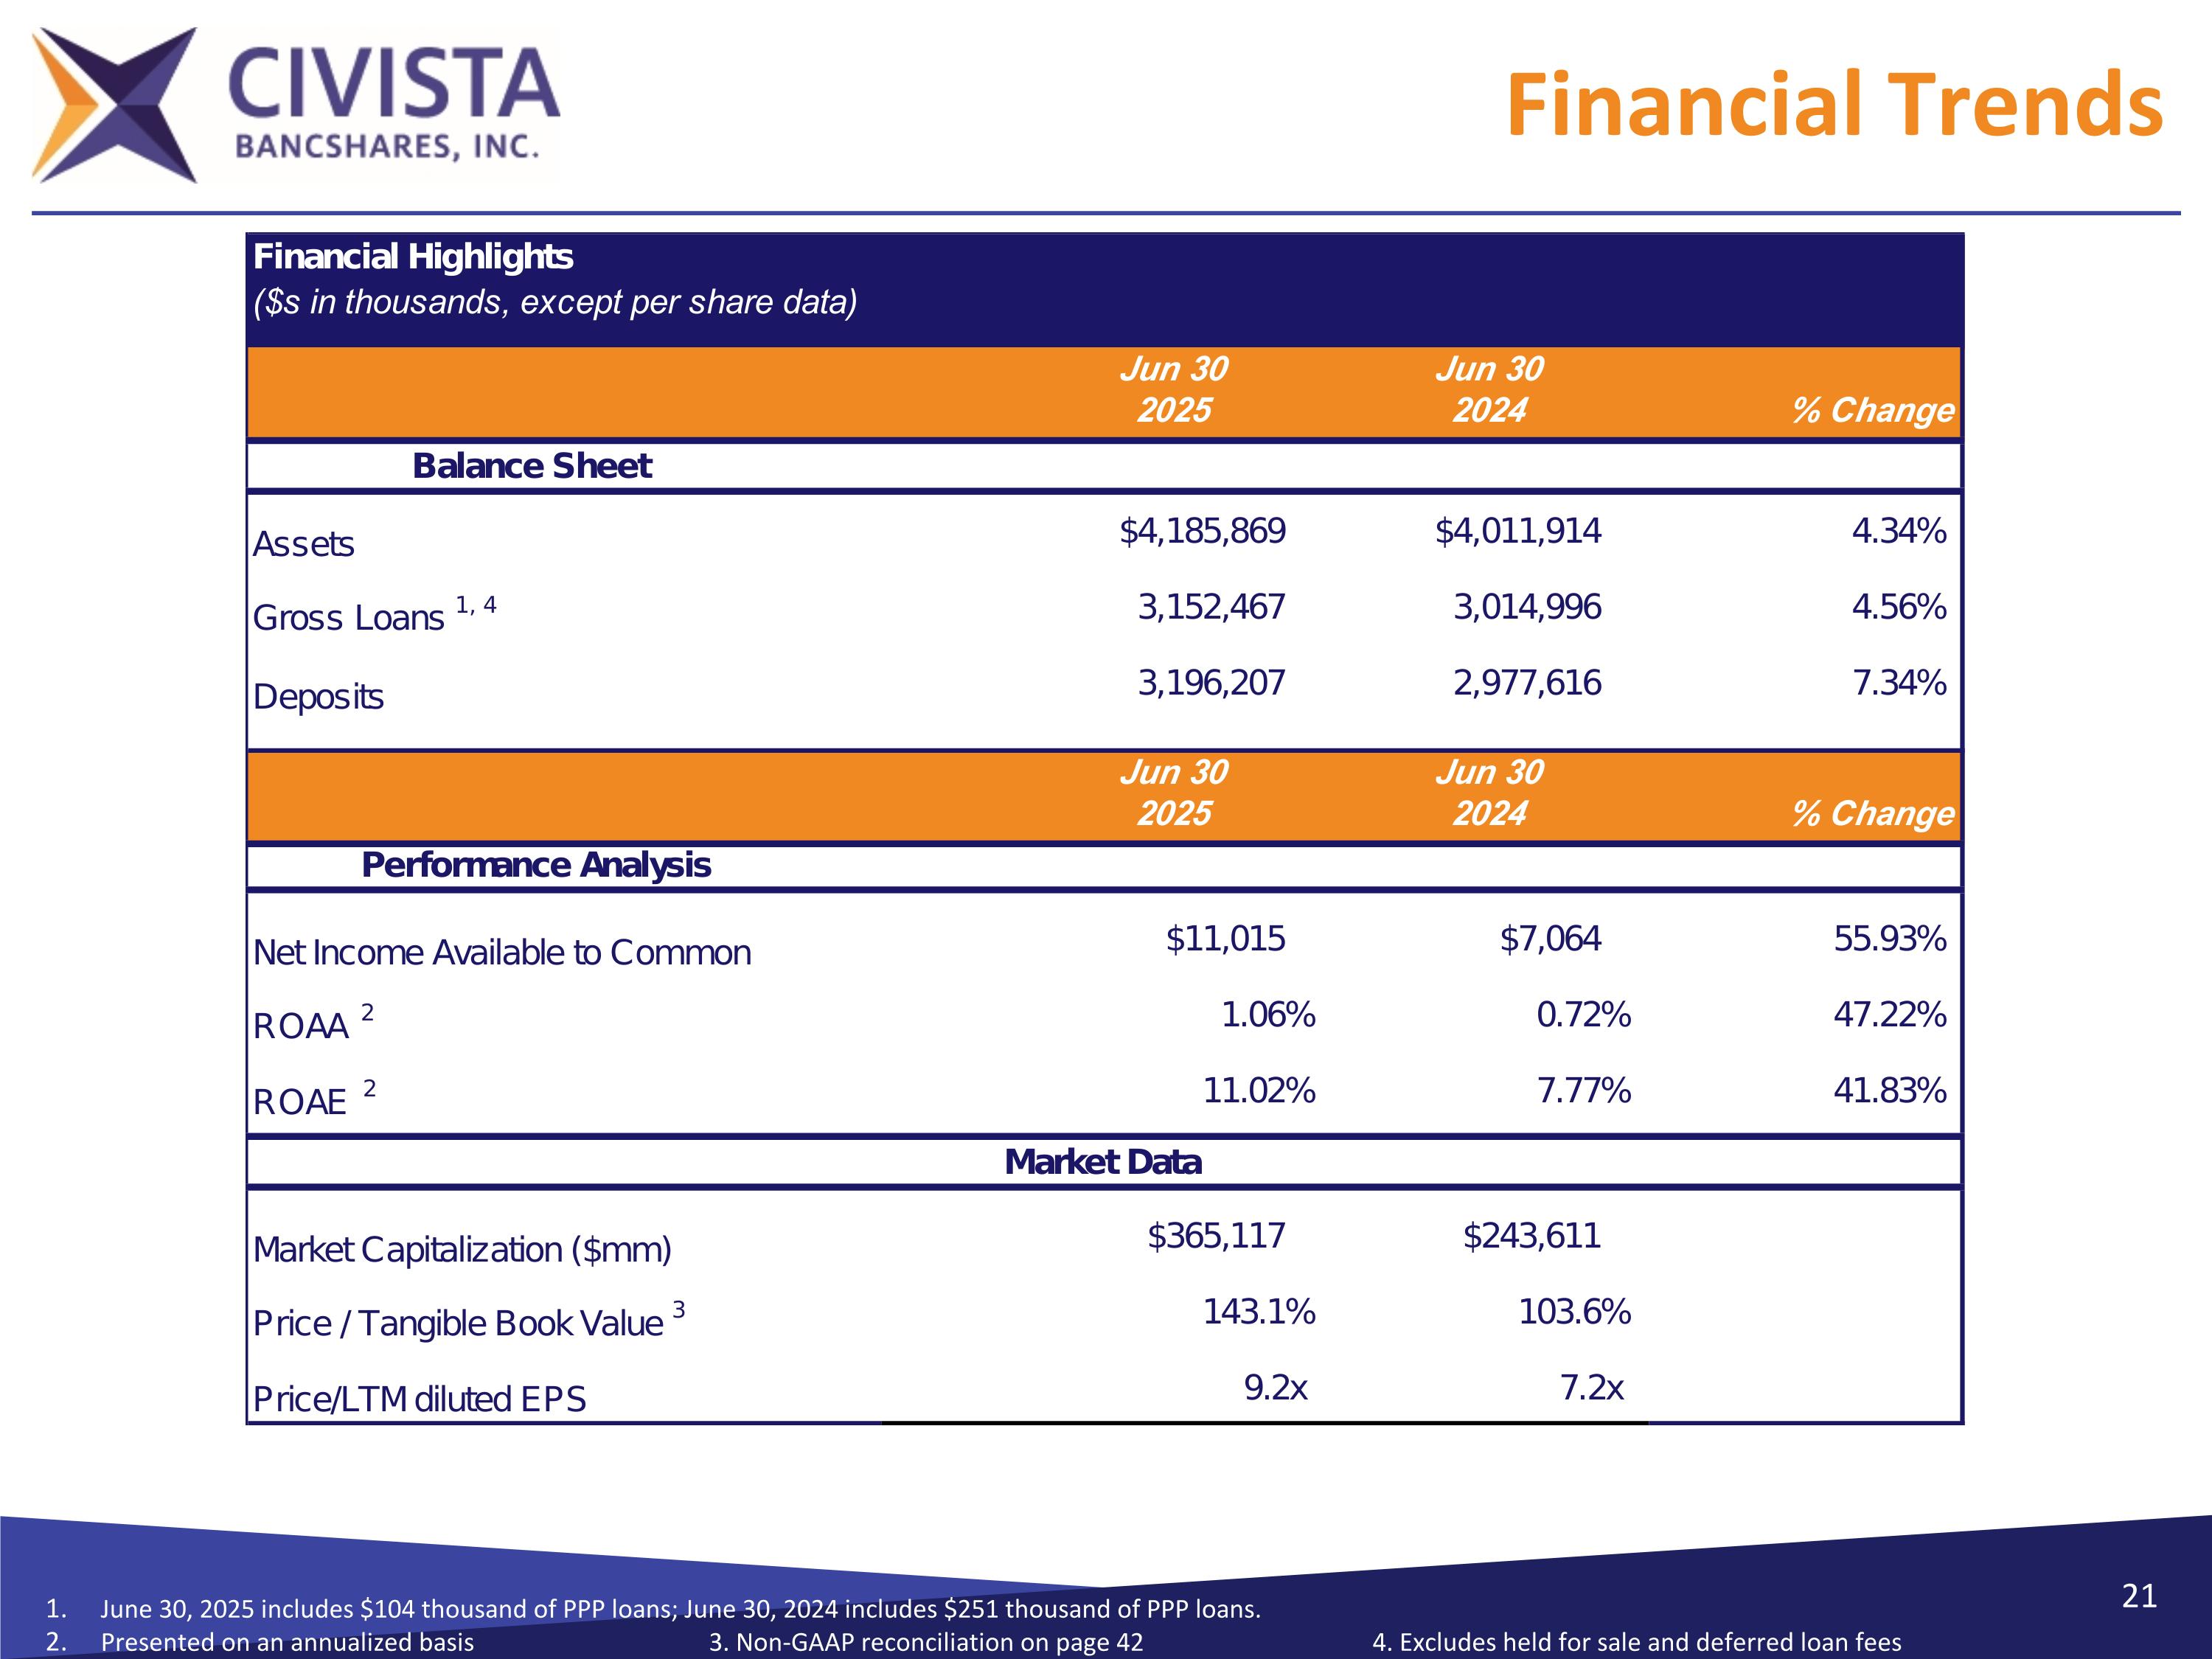
June 30, 2025 includes $104 thousand of PPP loans; June 30, 2024 includes $251 thousand of PPP loans. Presented on an annualized basis 3. Non-GAAP reconciliation on page 42 4. Excludes held for sale and deferred loan fees Financial Trends
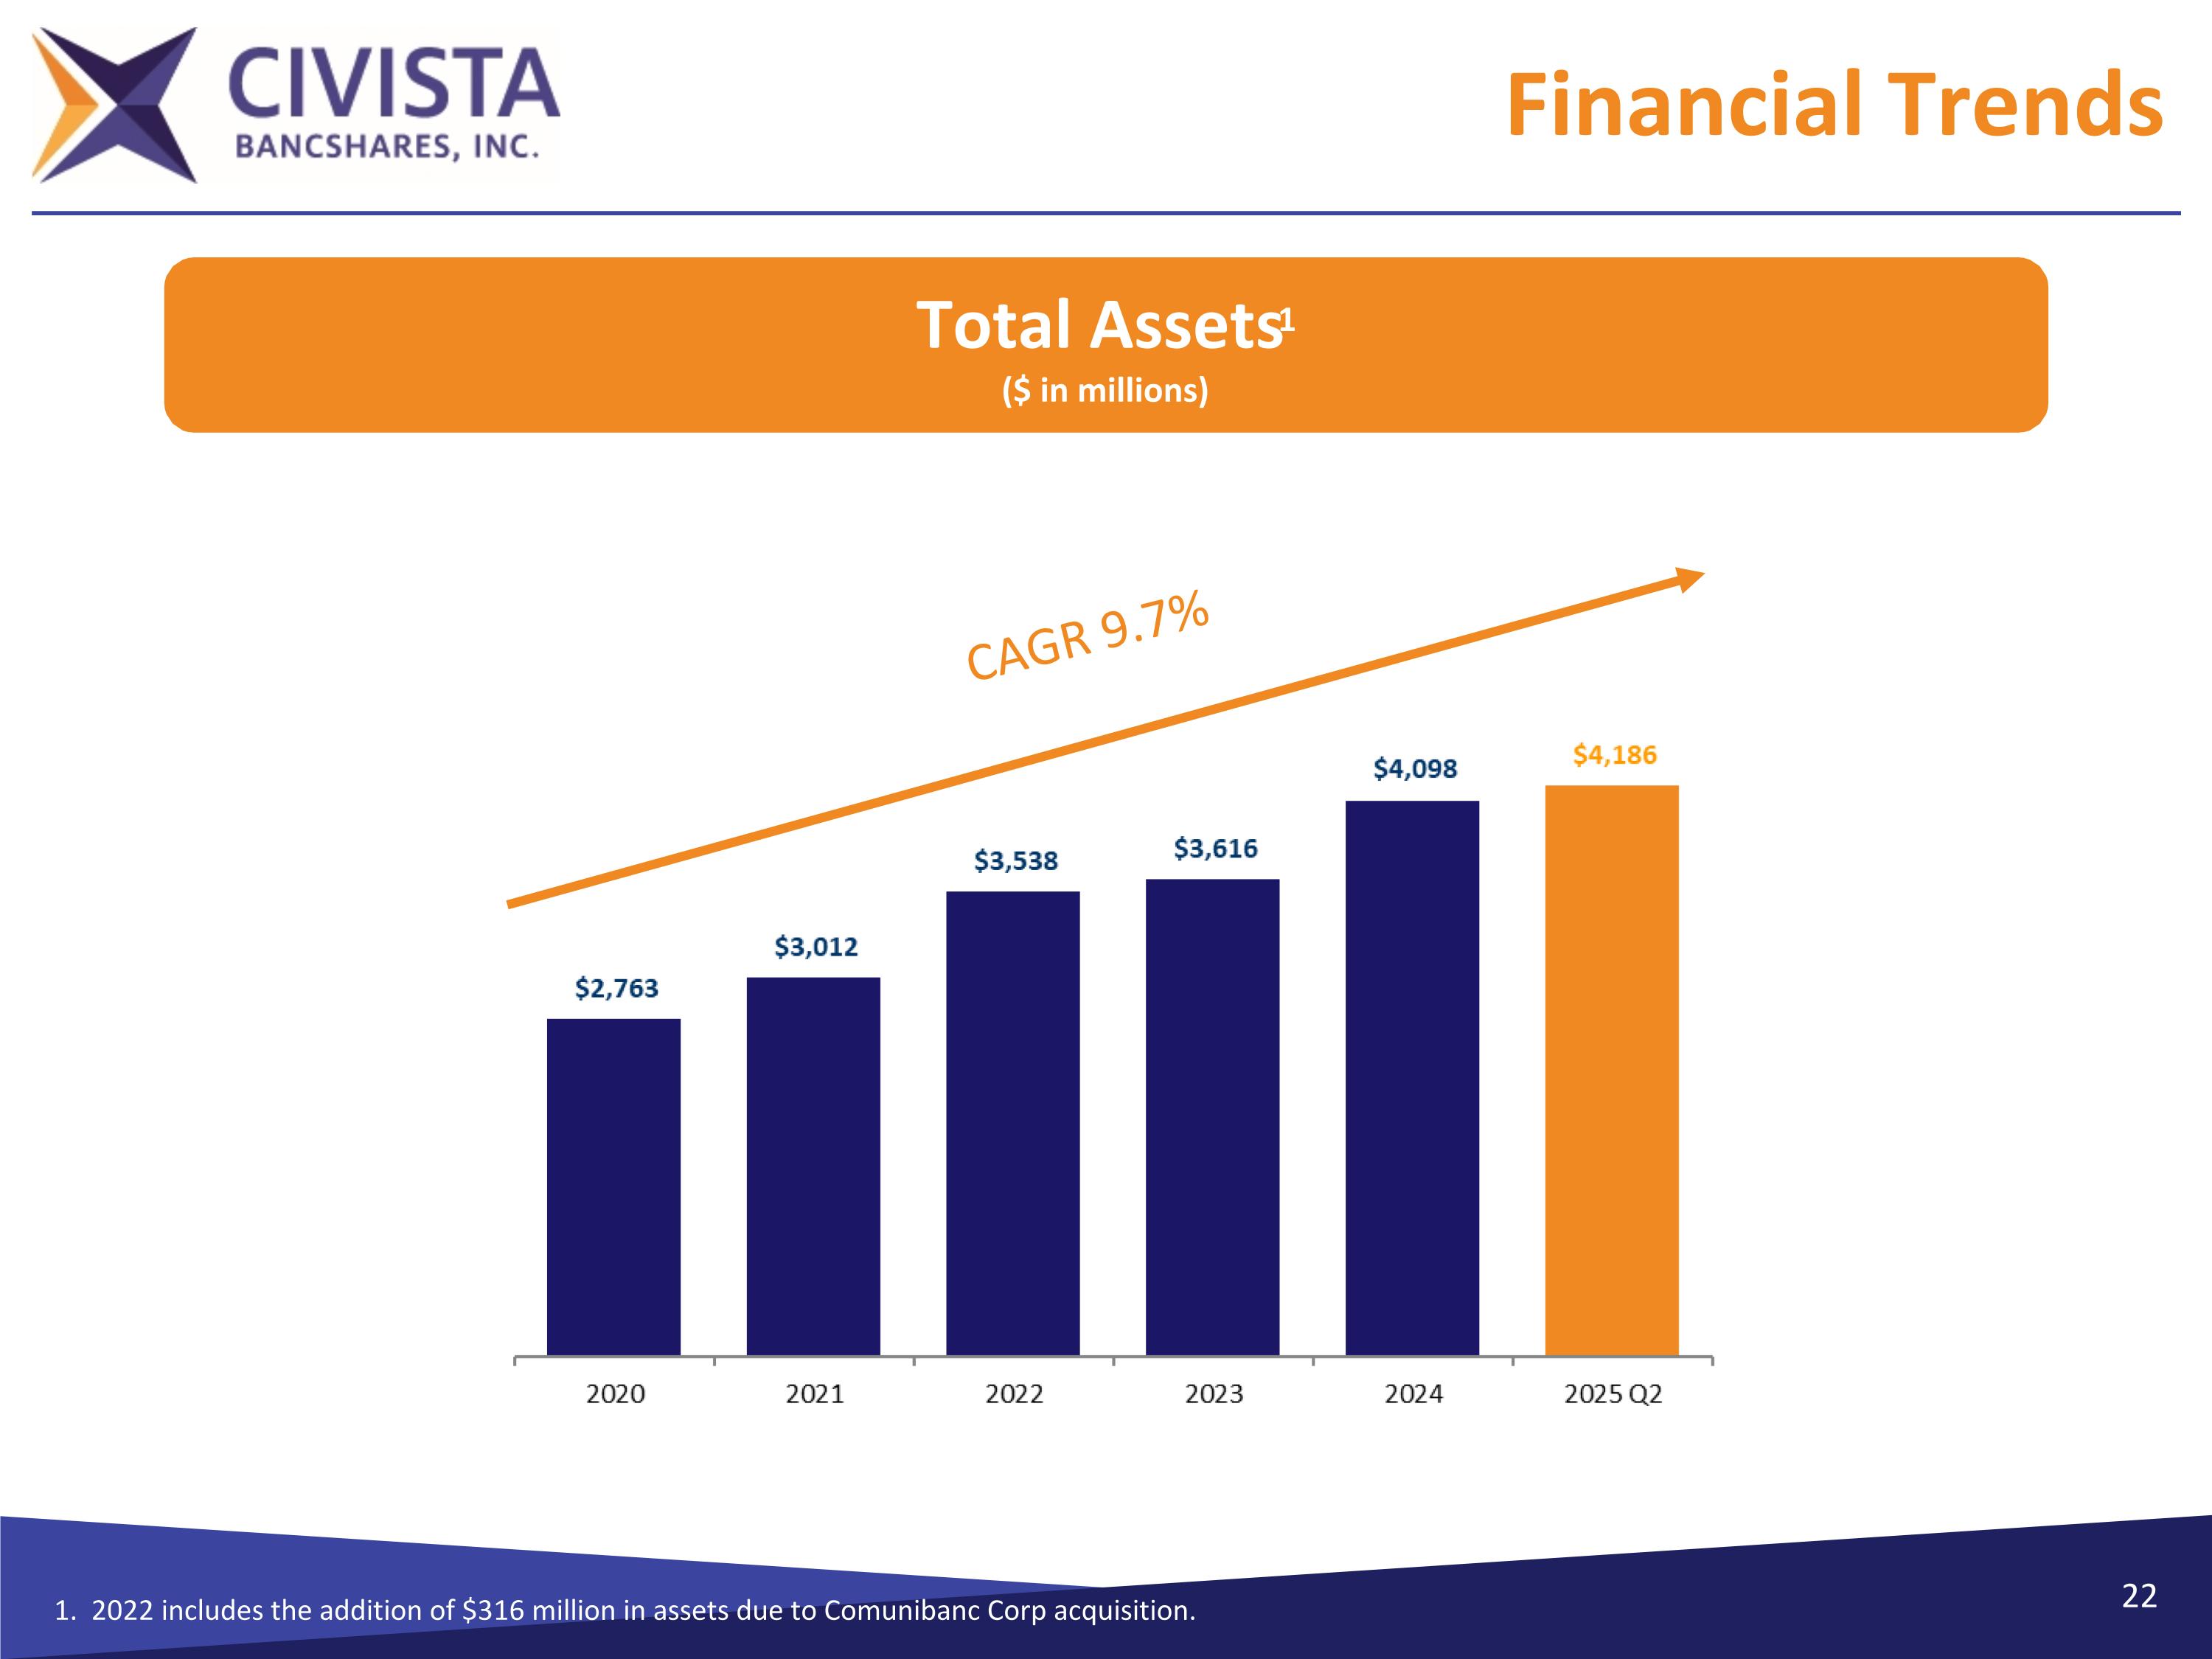
Total Assets1 ($ in millions) 1. 2022 includes the addition of $316 million in assets due to Comunibanc Corp acquisition. CAGR 9.7% Financial Trends
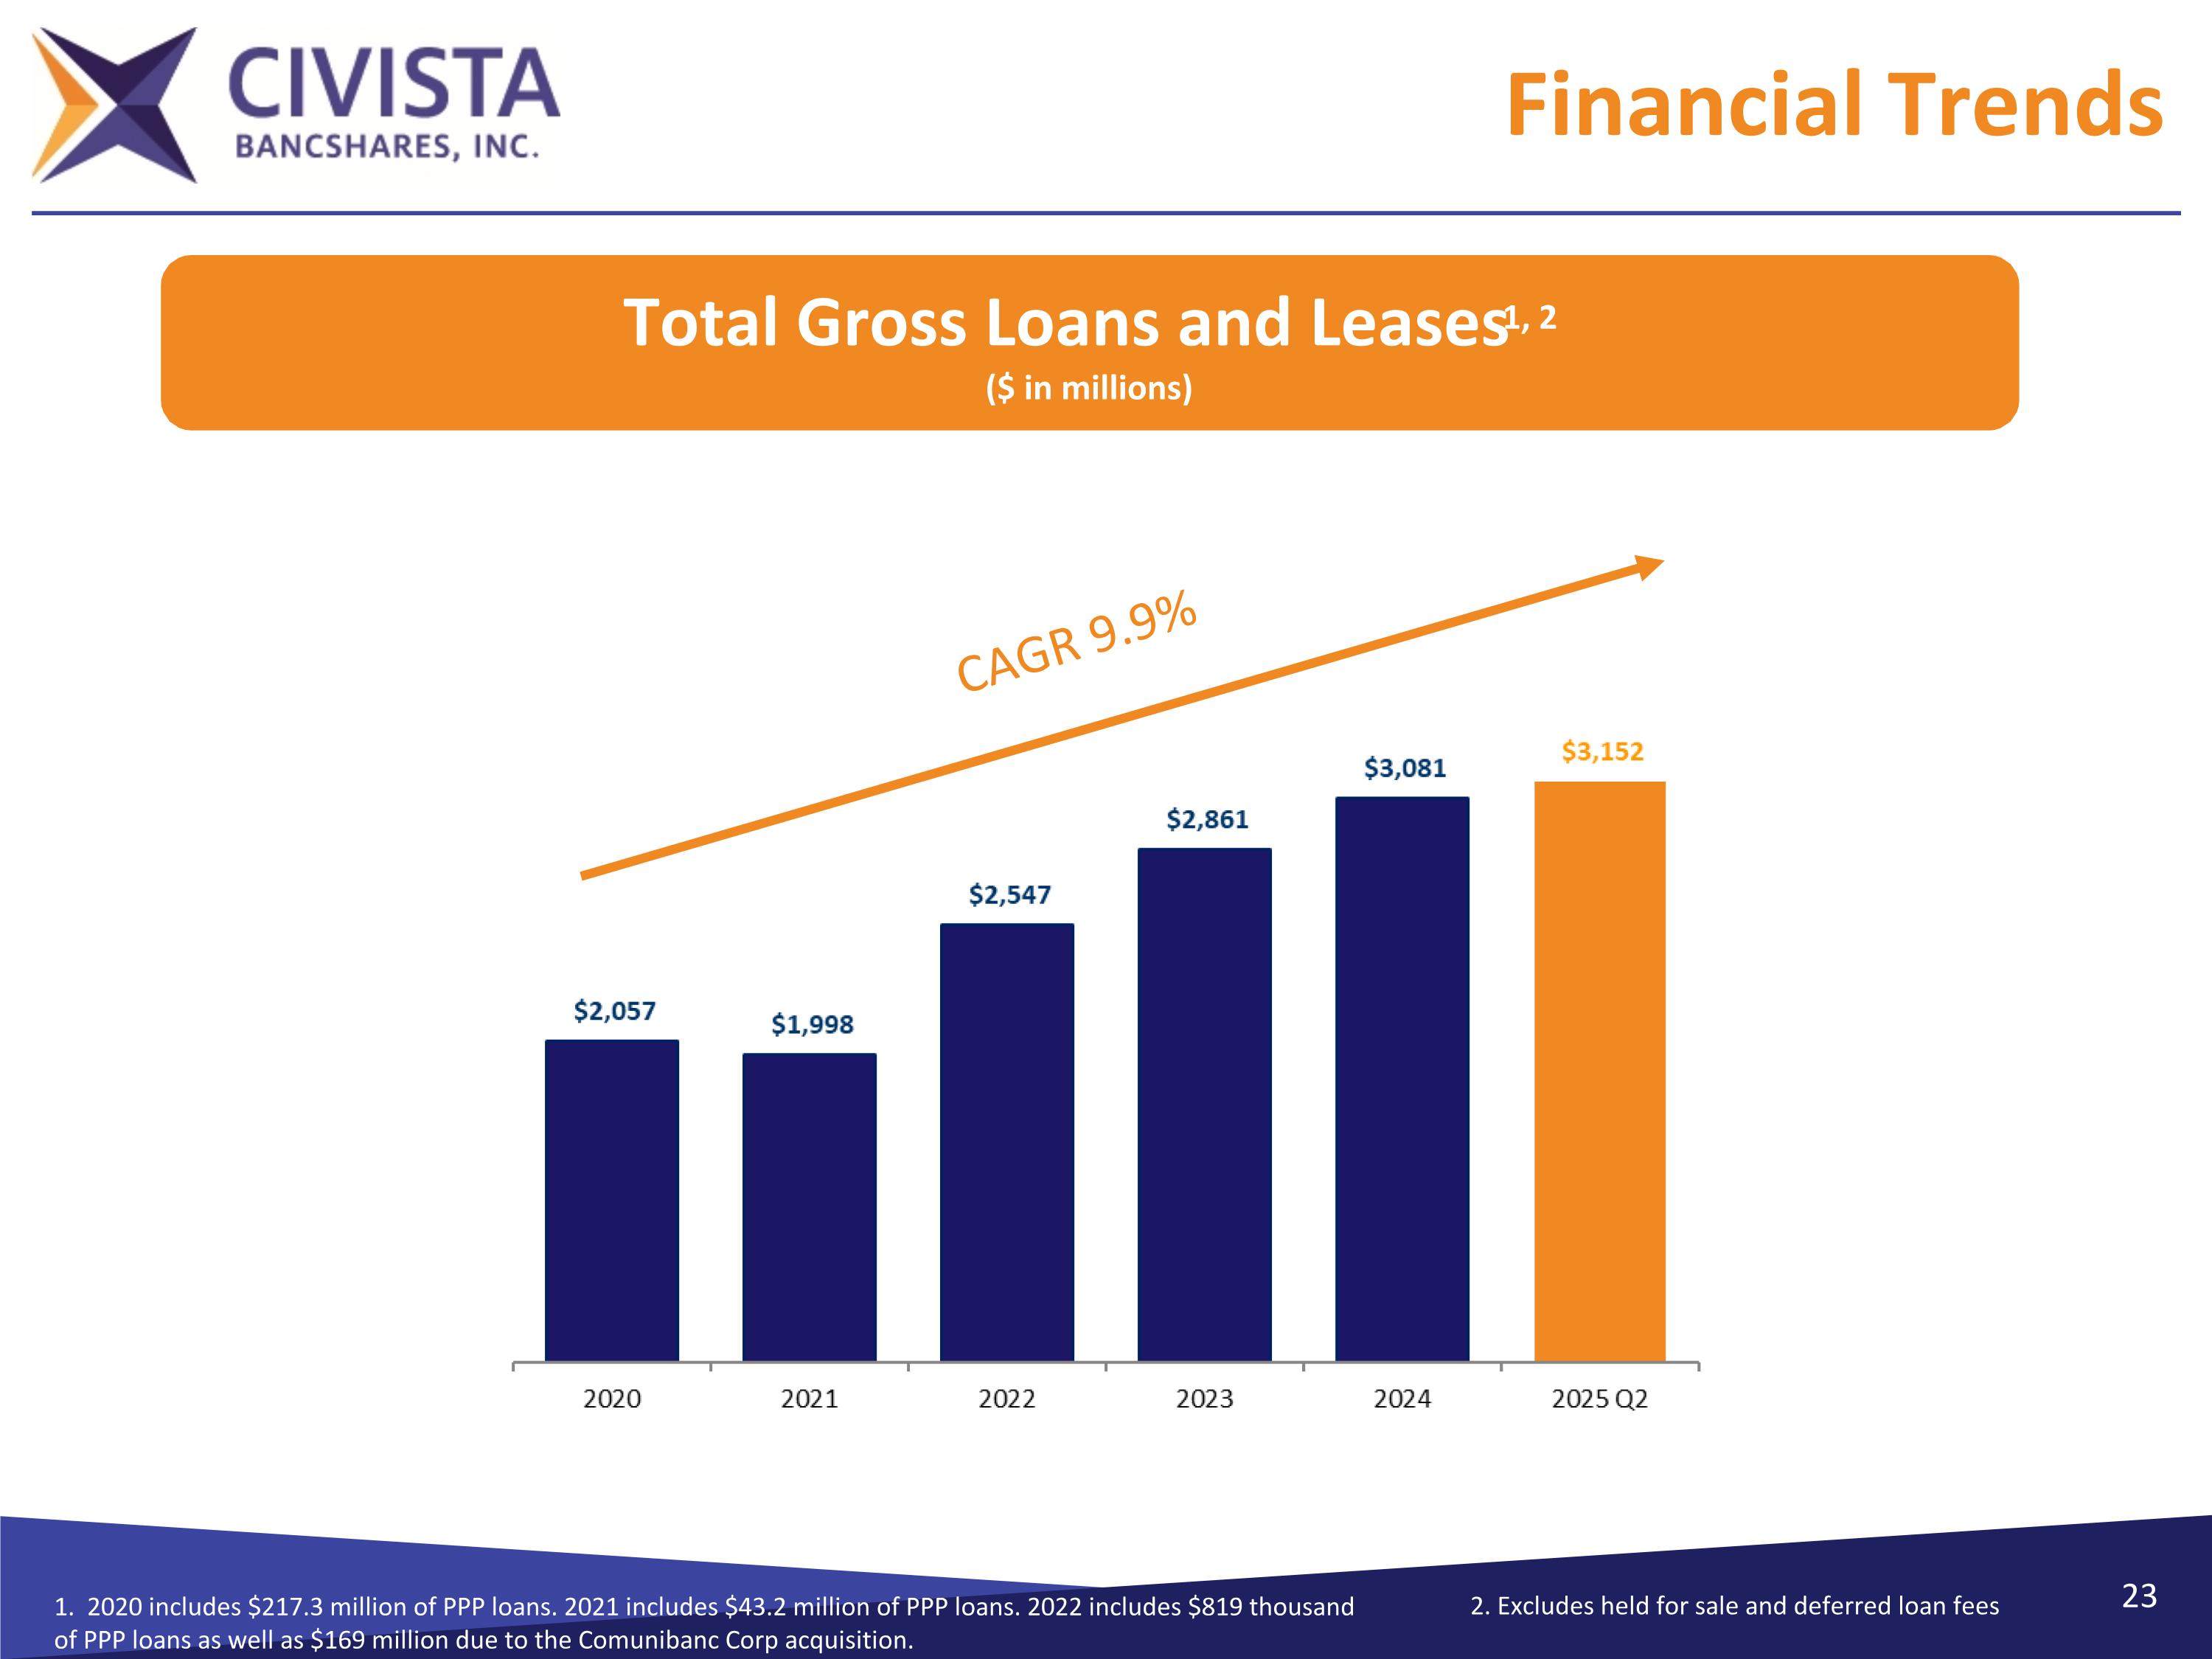
Total Gross Loans and Leases1, 2 ($ in millions) 1. 2020 includes $217.3 million of PPP loans. 2021 includes $43.2 million of PPP loans. 2022 includes $819 thousand of PPP loans as well as $169 million due to the Comunibanc Corp acquisition. Financial Trends CAGR 9.9% 2. Excludes held for sale and deferred loan fees
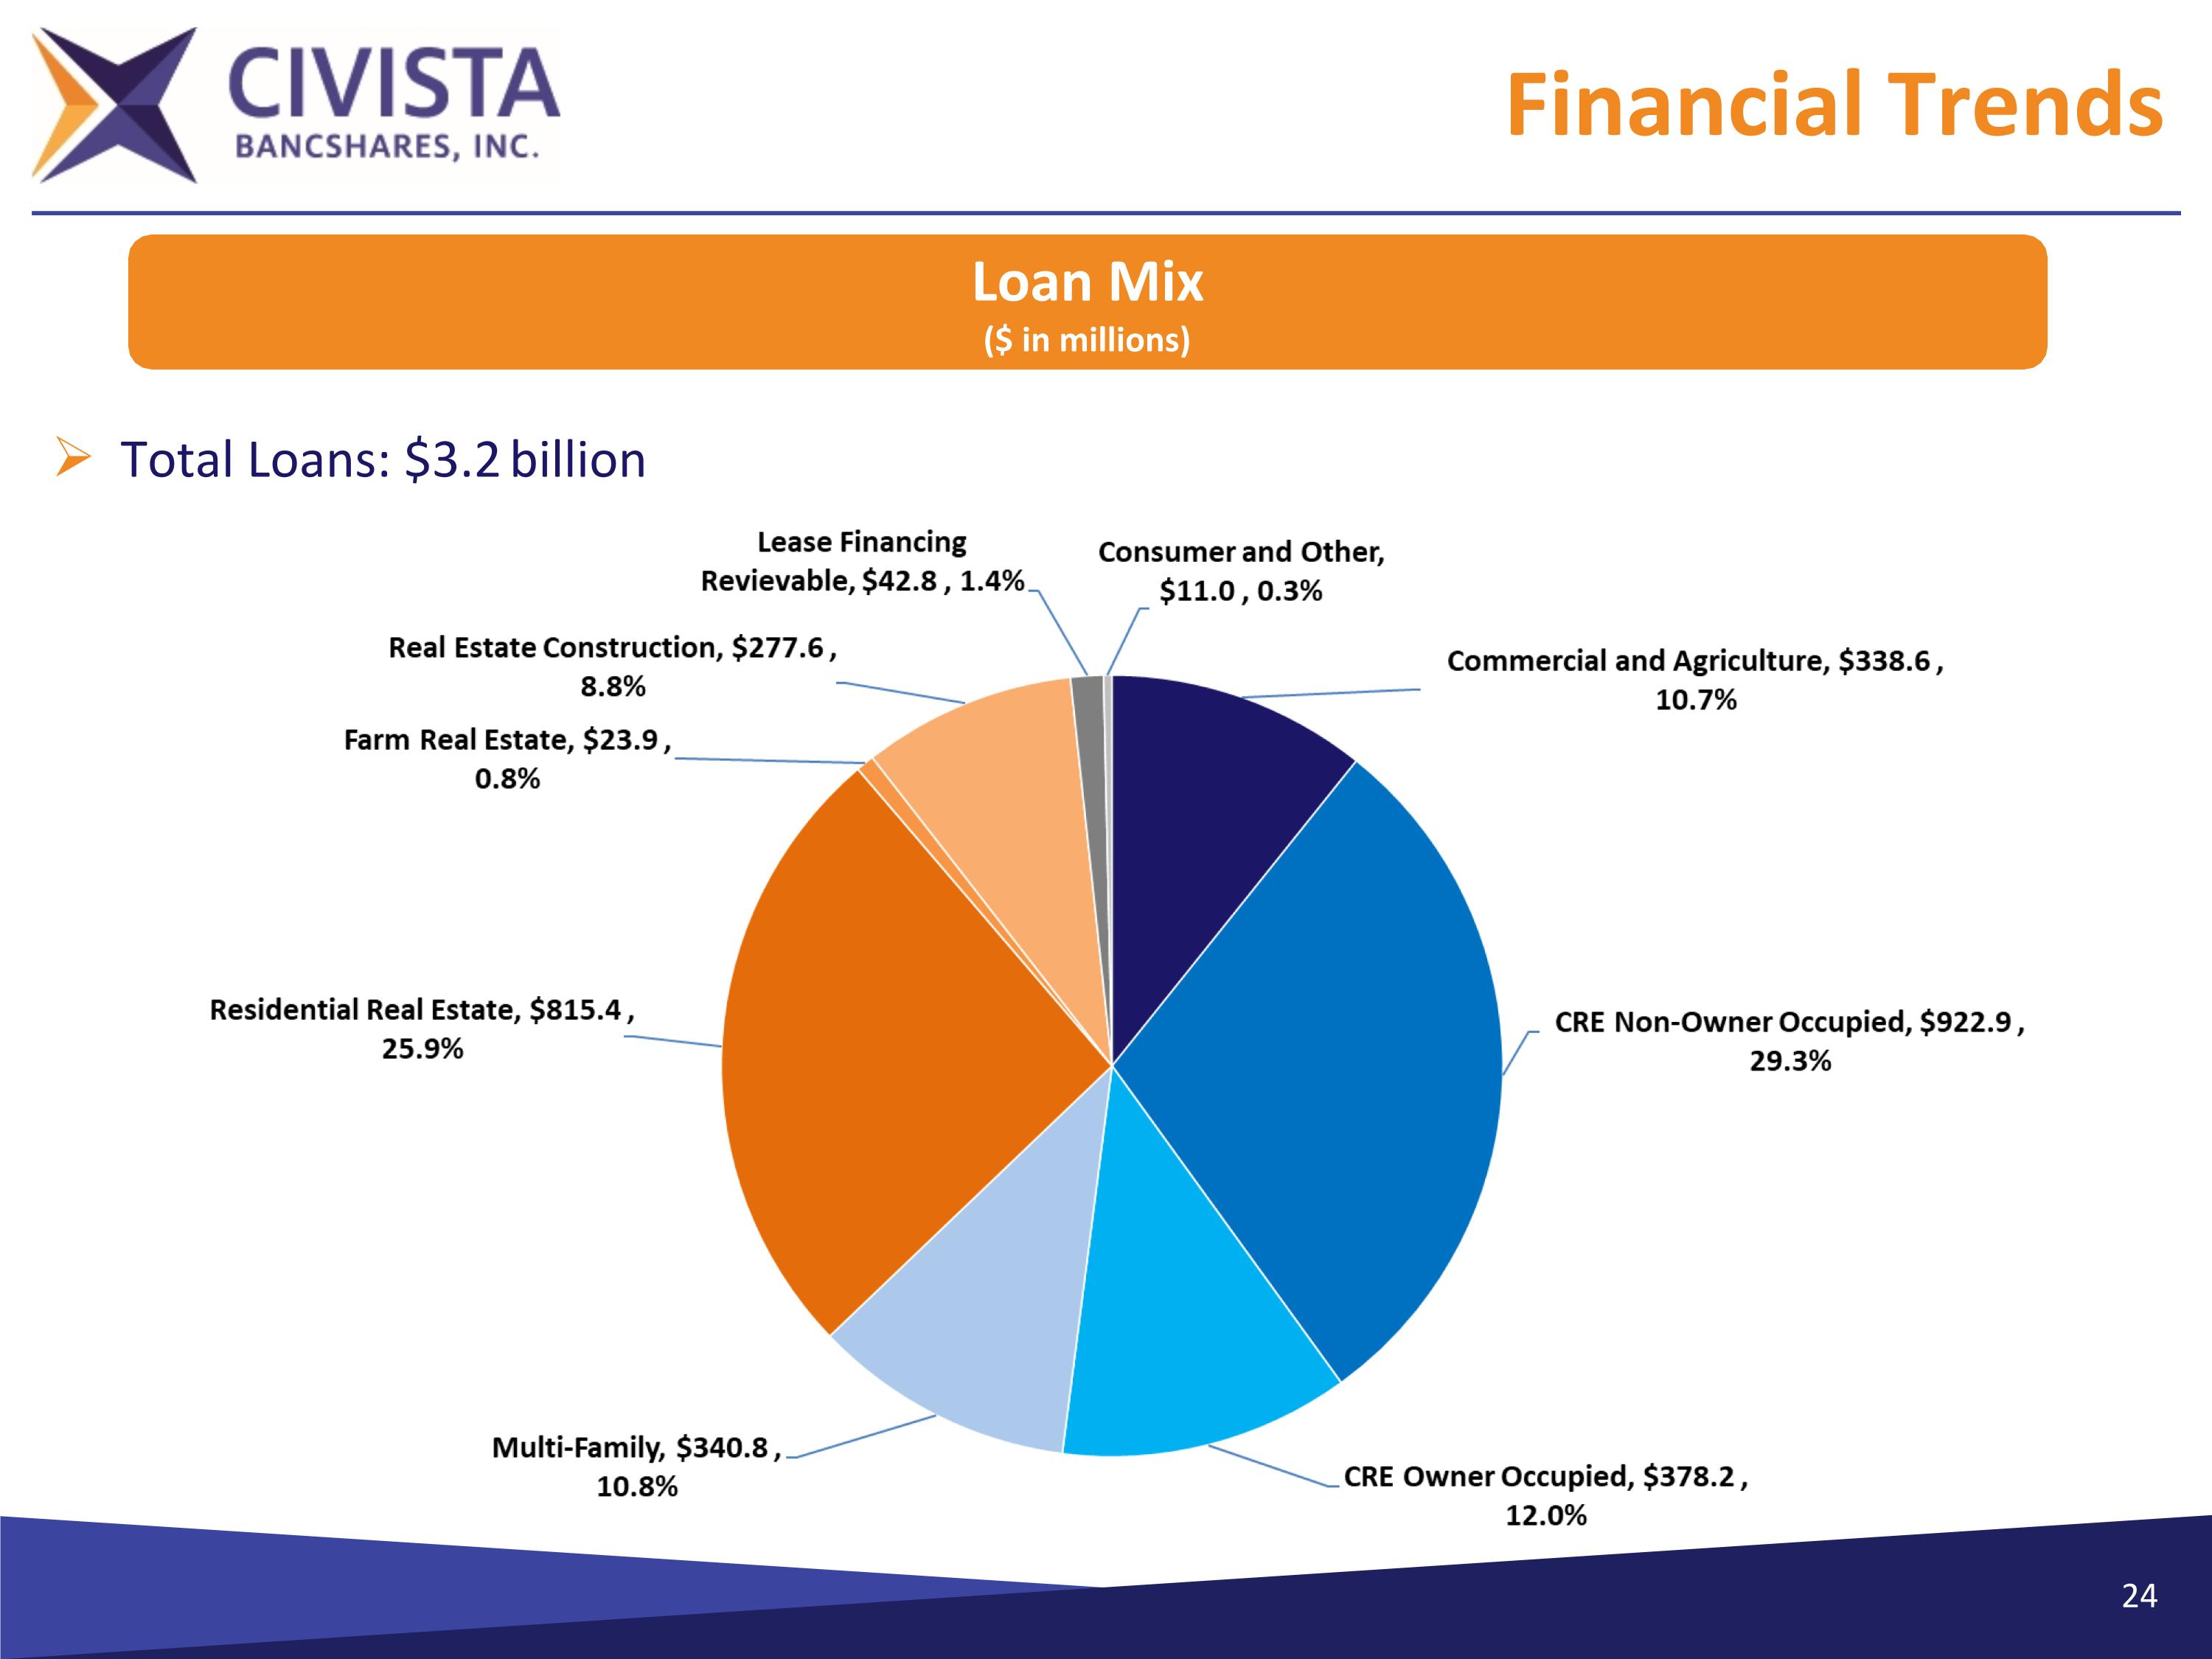
Financial Trends Total Loans: $3.2 billion Loan Mix ($ in millions)
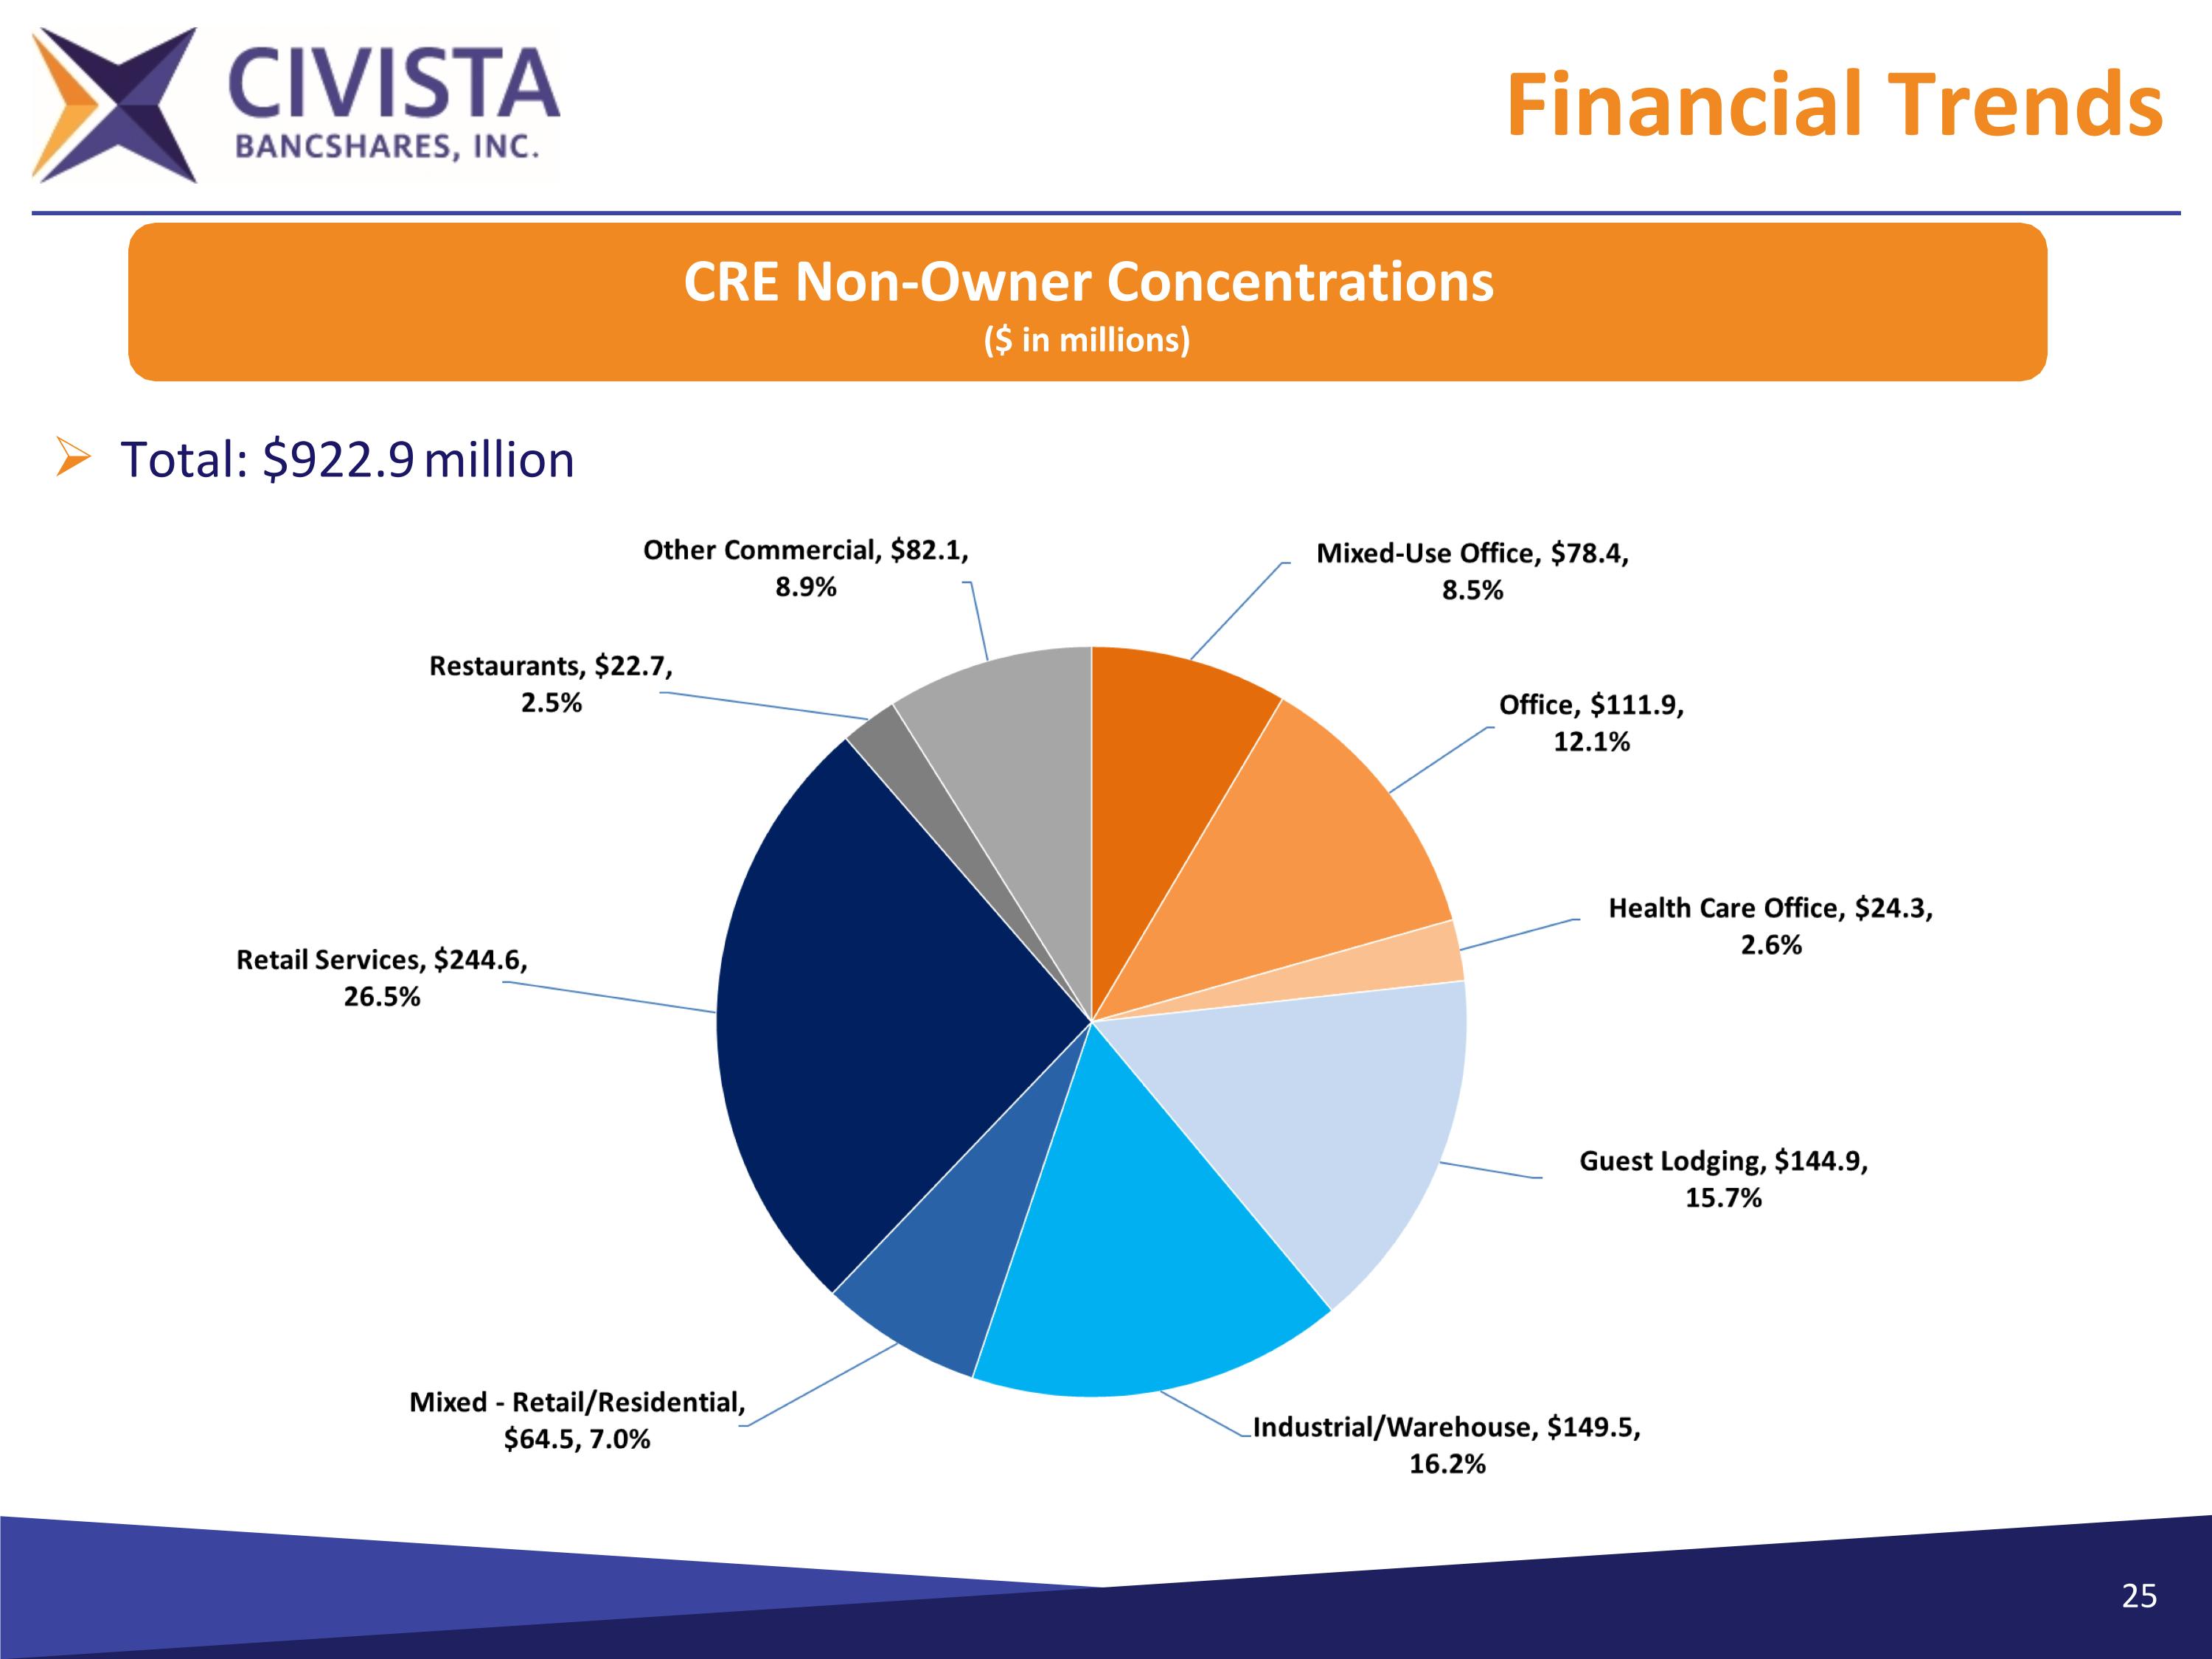
Financial Trends CRE Non-Owner Concentrations ($ in millions) Total: $922.9 million
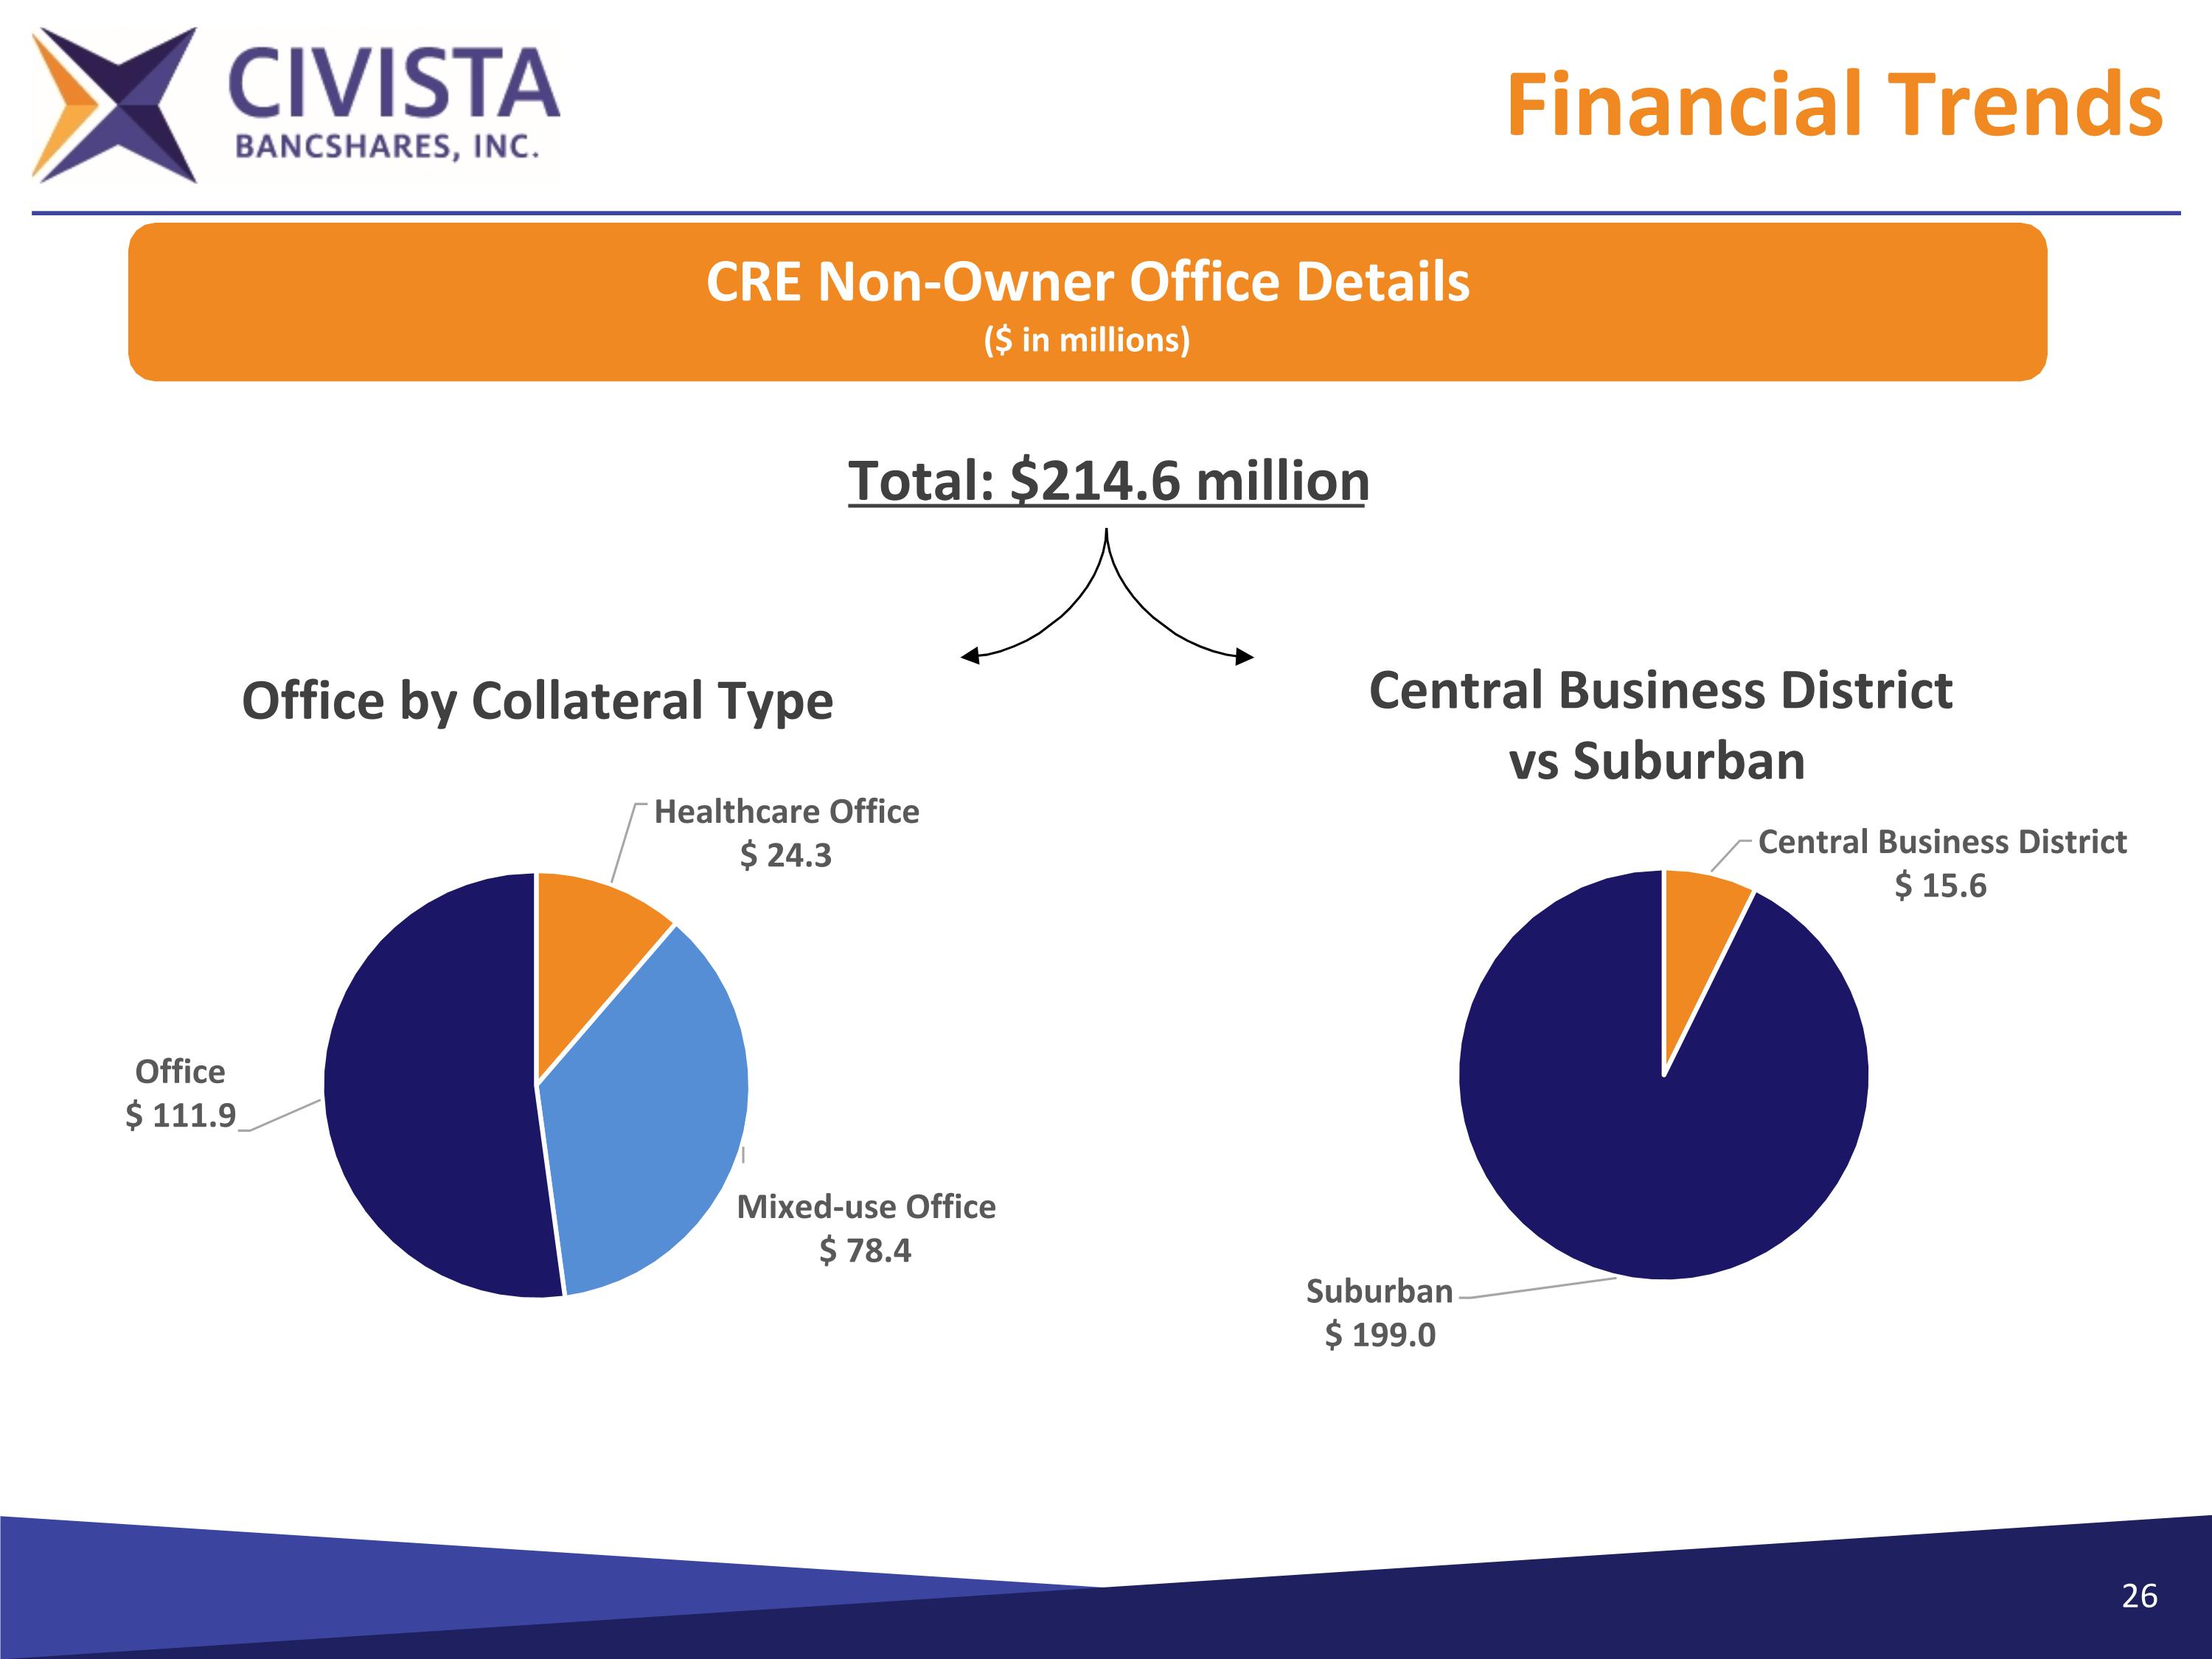
Financial Trends CRE Non-Owner Office Details ($ in millions) Total: $214.6 million
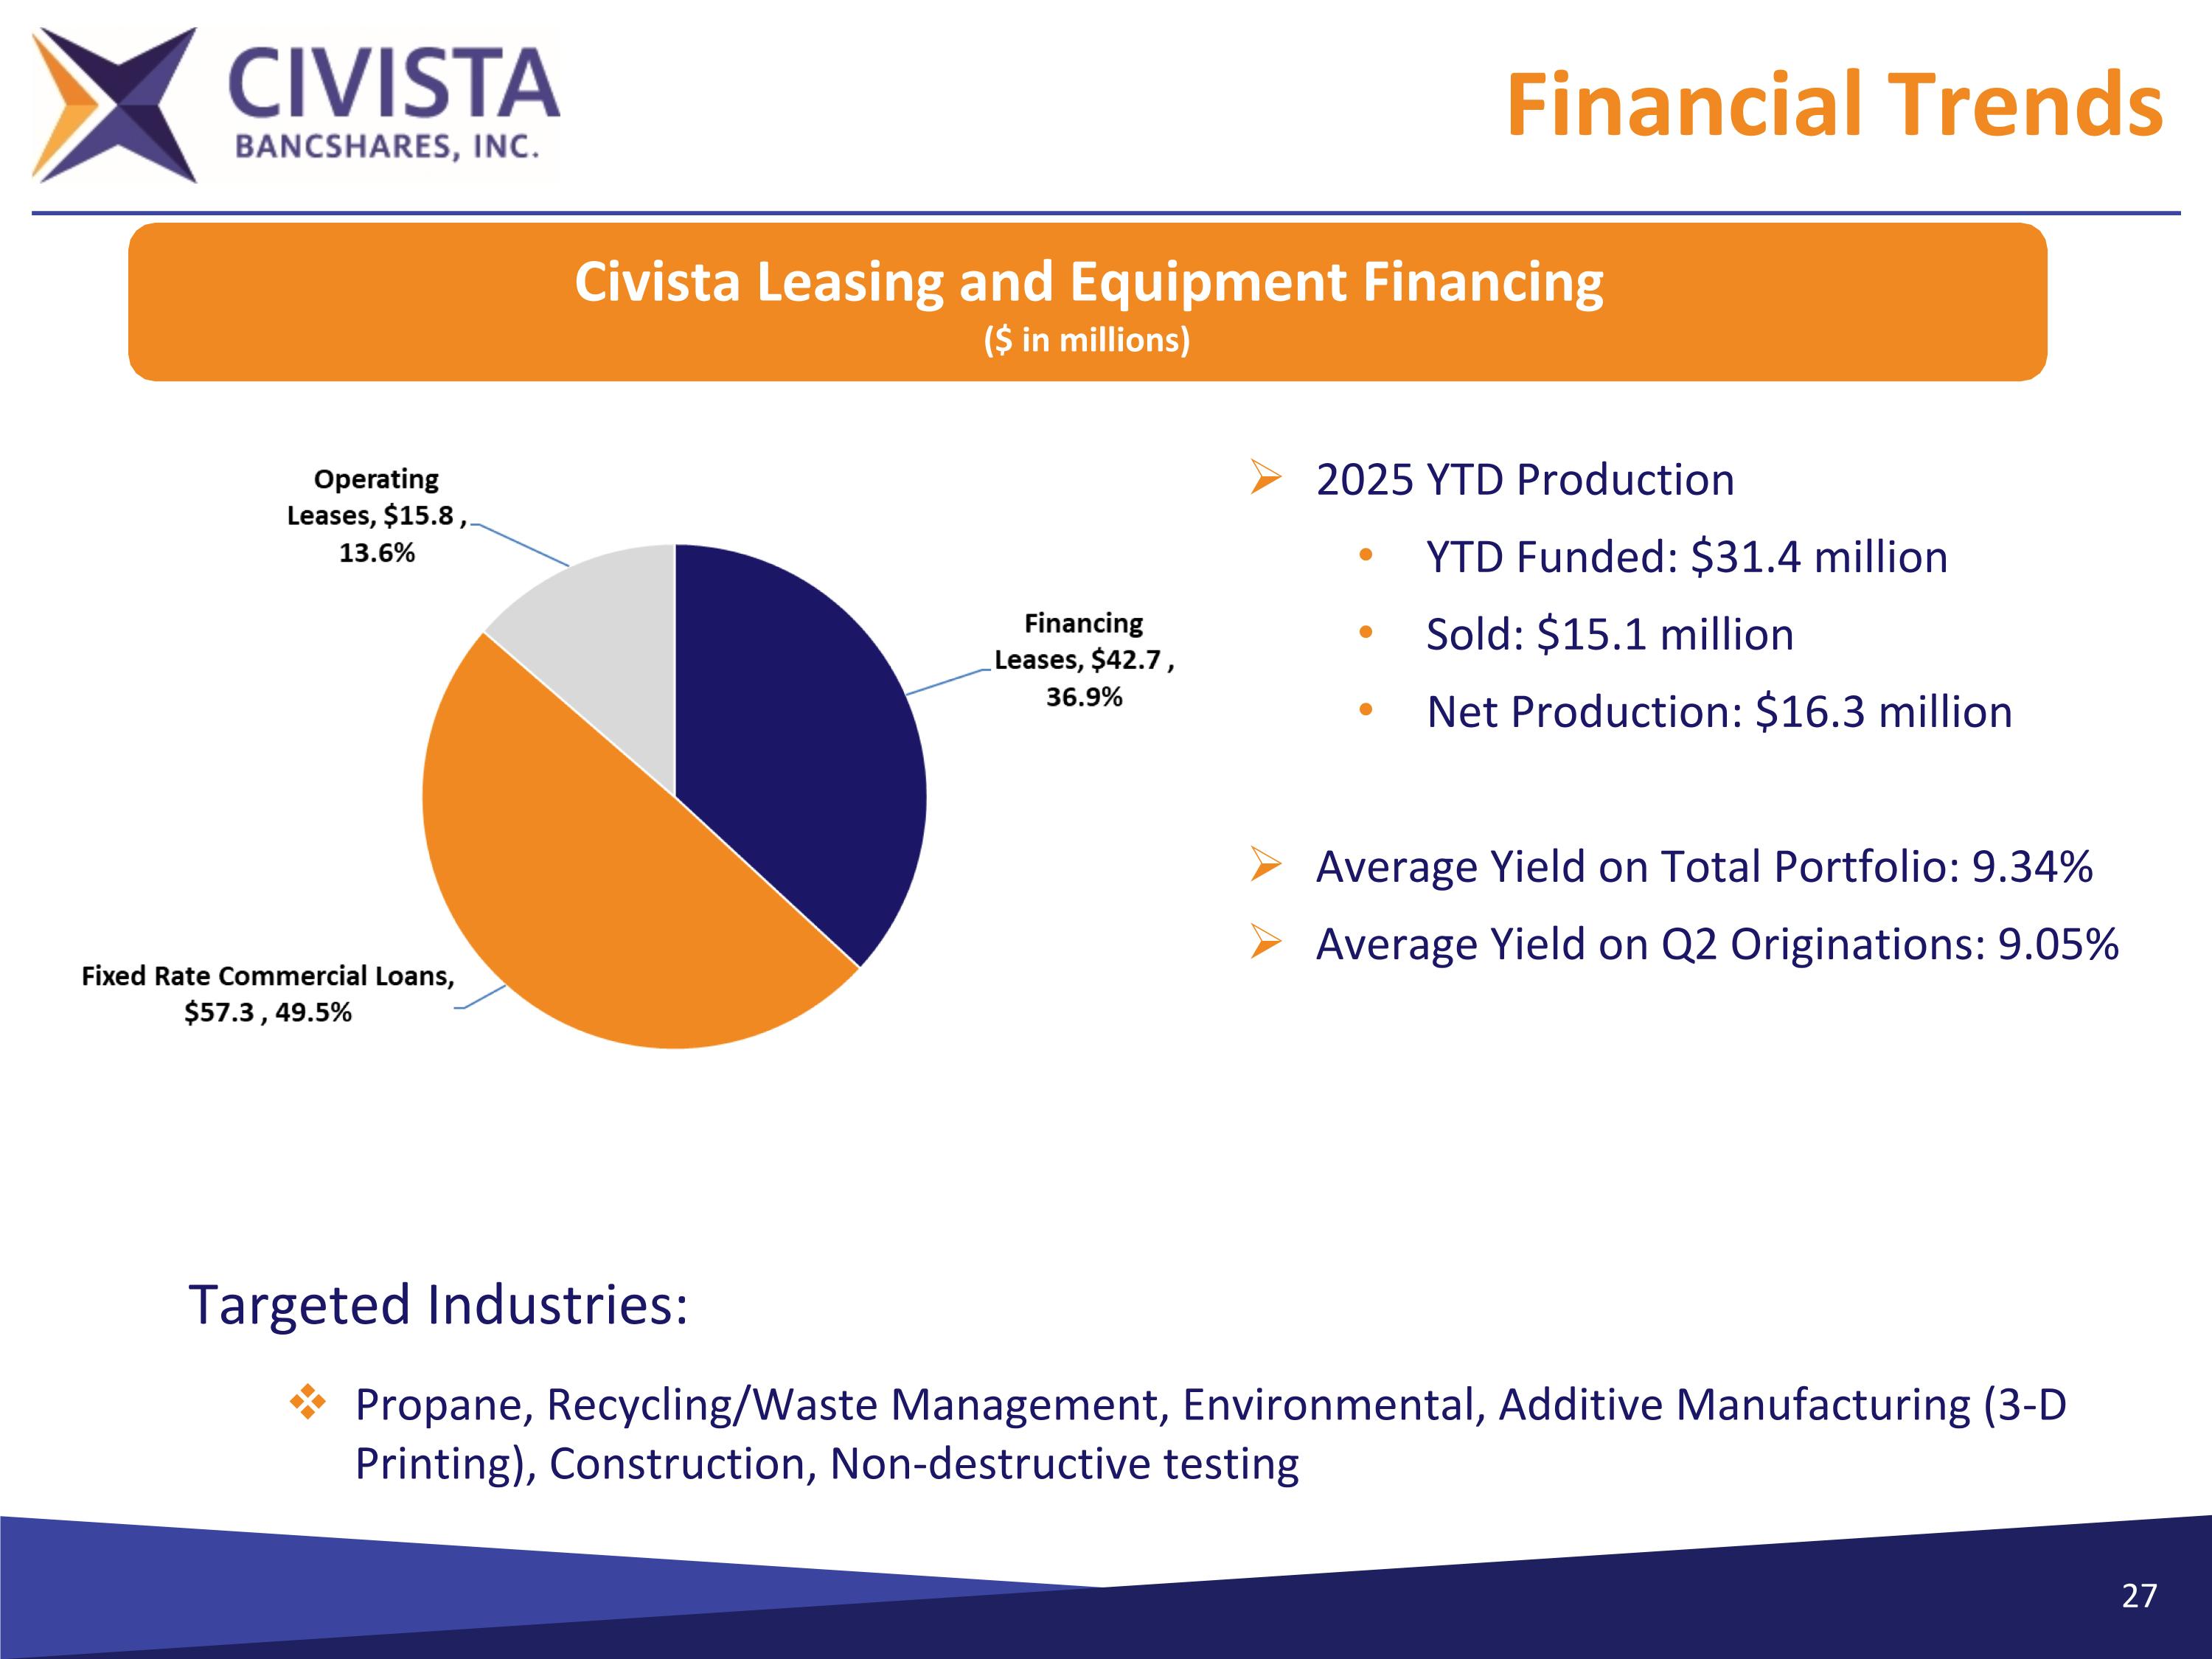
Financial Trends Civista Leasing and Equipment Financing ($ in millions) 2025 YTD Production YTD Funded: $31.4 million Sold: $15.1 million Net Production: $16.3 million Average Yield on Total Portfolio: 9.34% Average Yield on Q2 Originations: 9.05% Targeted Industries: Propane, Recycling/Waste Management, Environmental, Additive Manufacturing (3-D Printing), Construction, Non-destructive testing
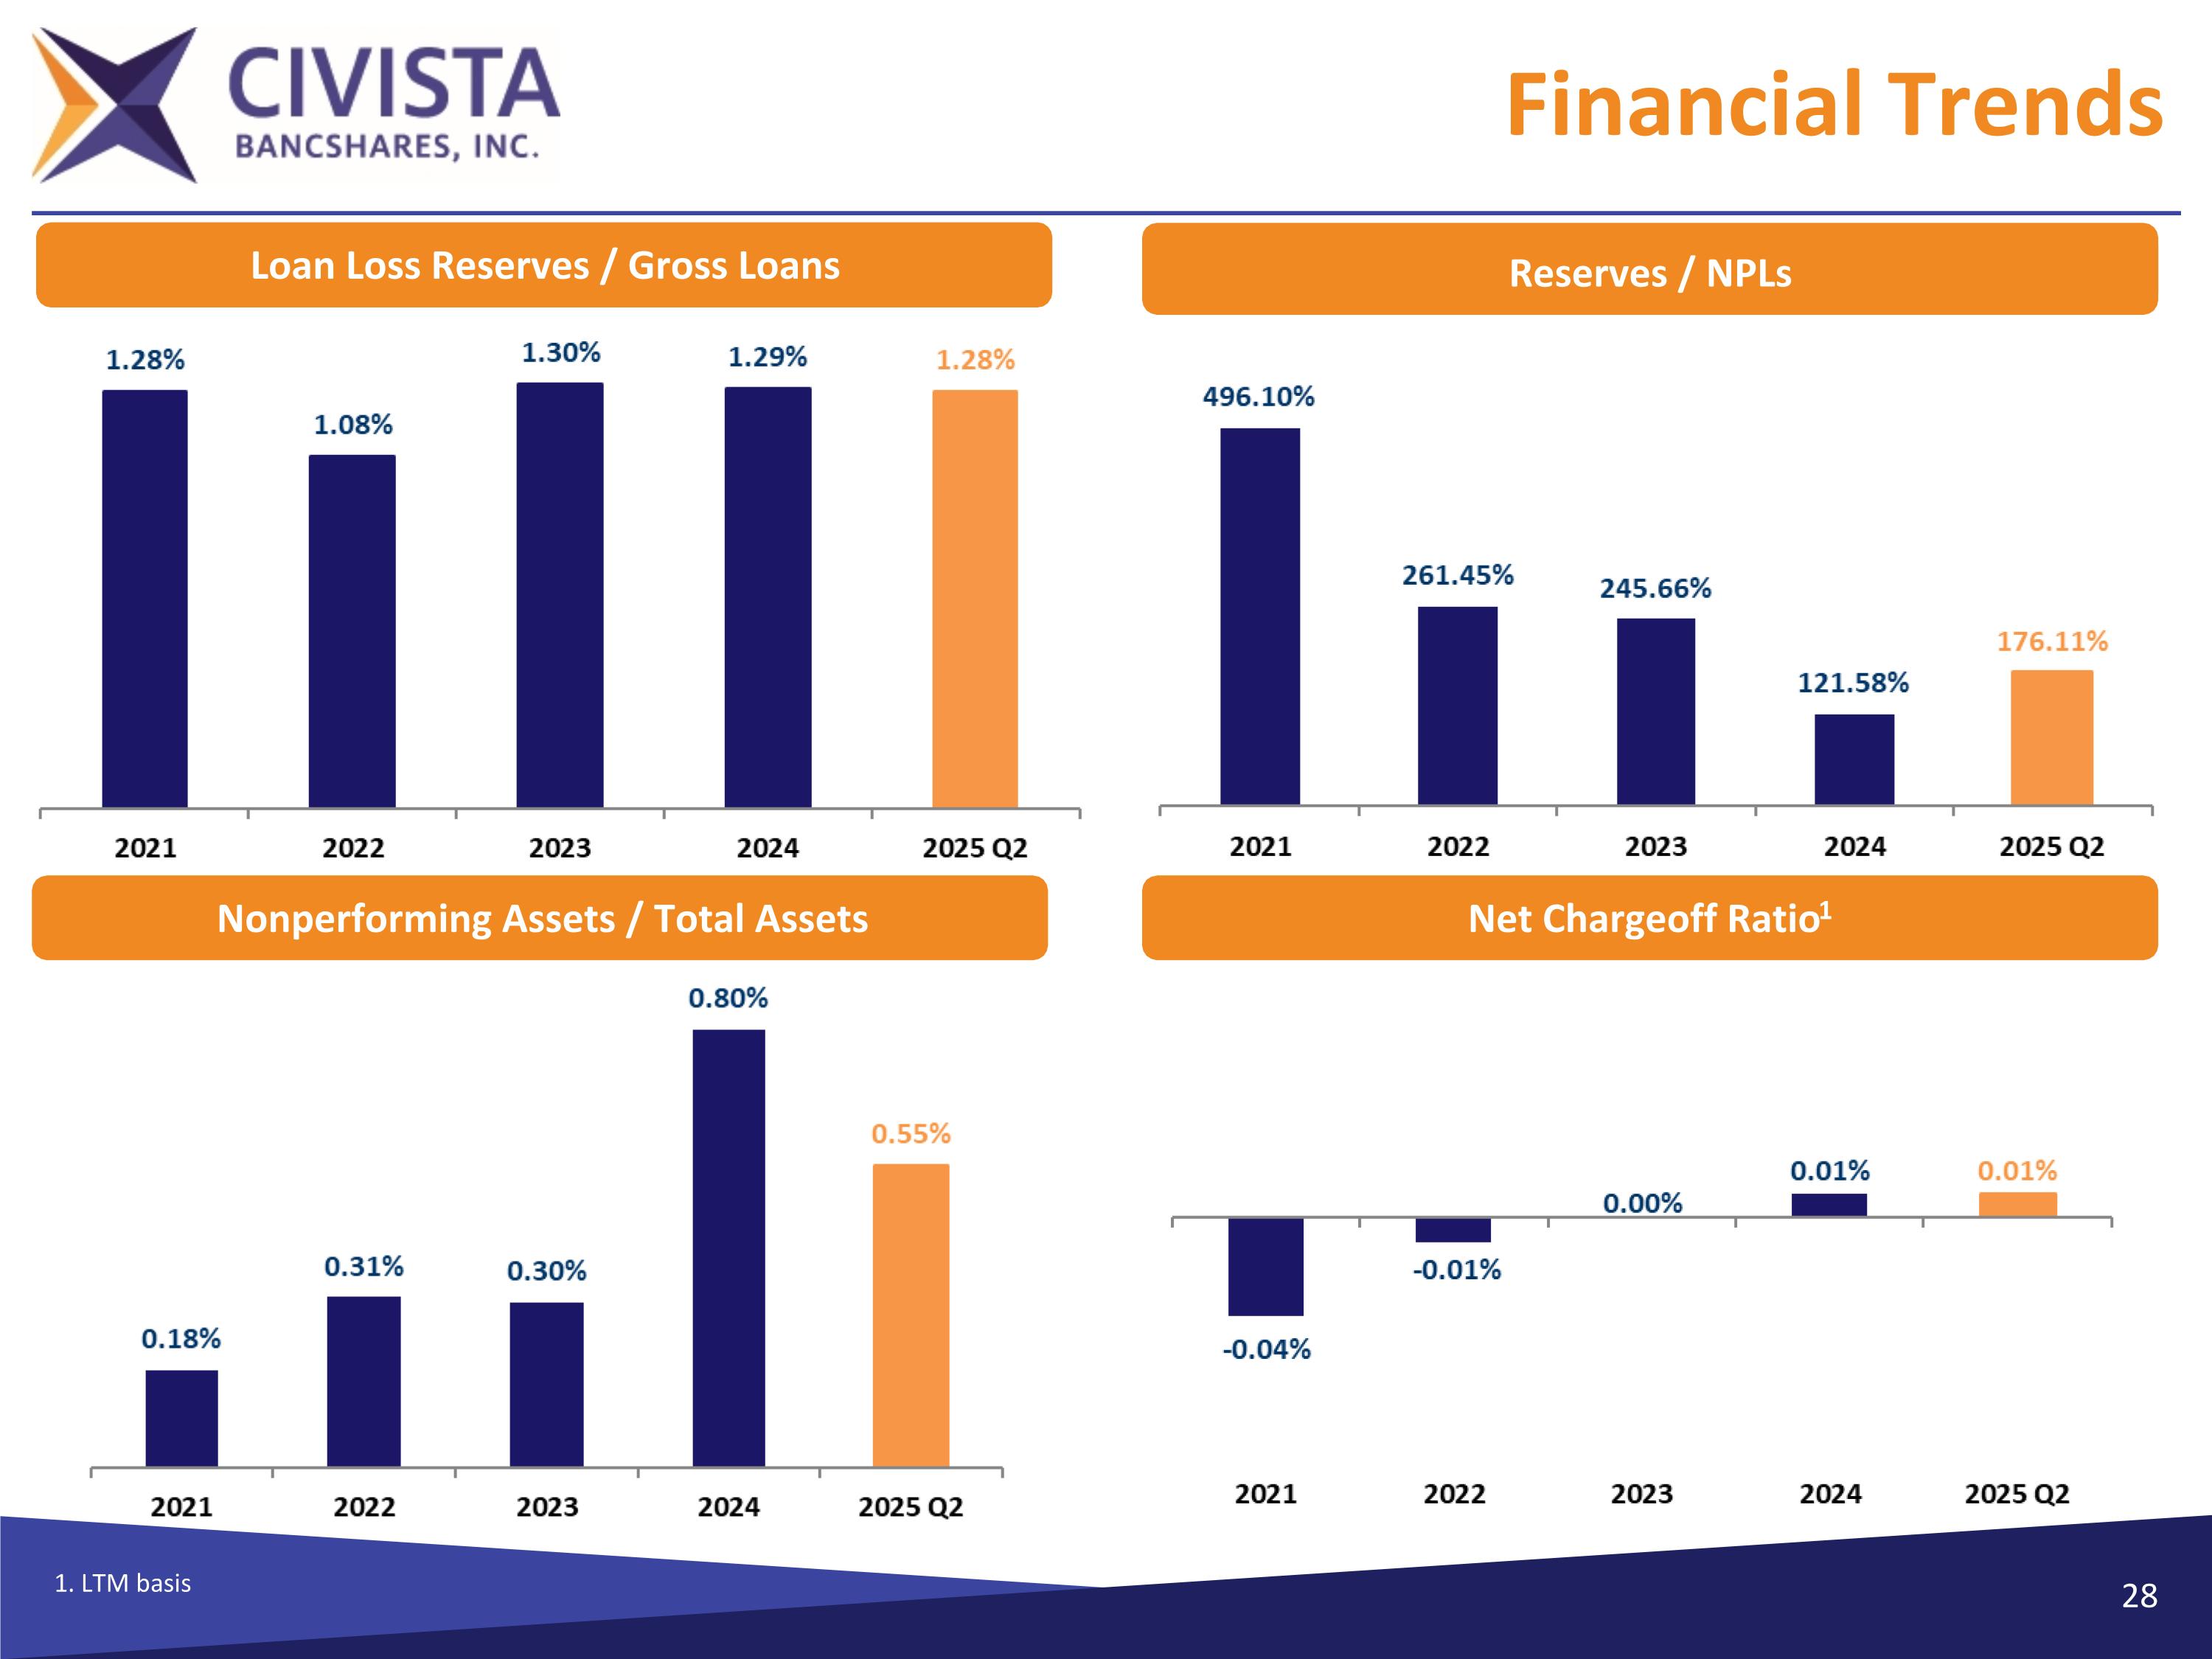
Financial Trends 1. LTM basis Net Chargeoff Ratio1 Loan Loss Reserves / Gross Loans NPAs & 90+PD / Assets Loan Loss Reserves / Gross Loans Nonperforming Assets / Total Assets Reserves / NPLs
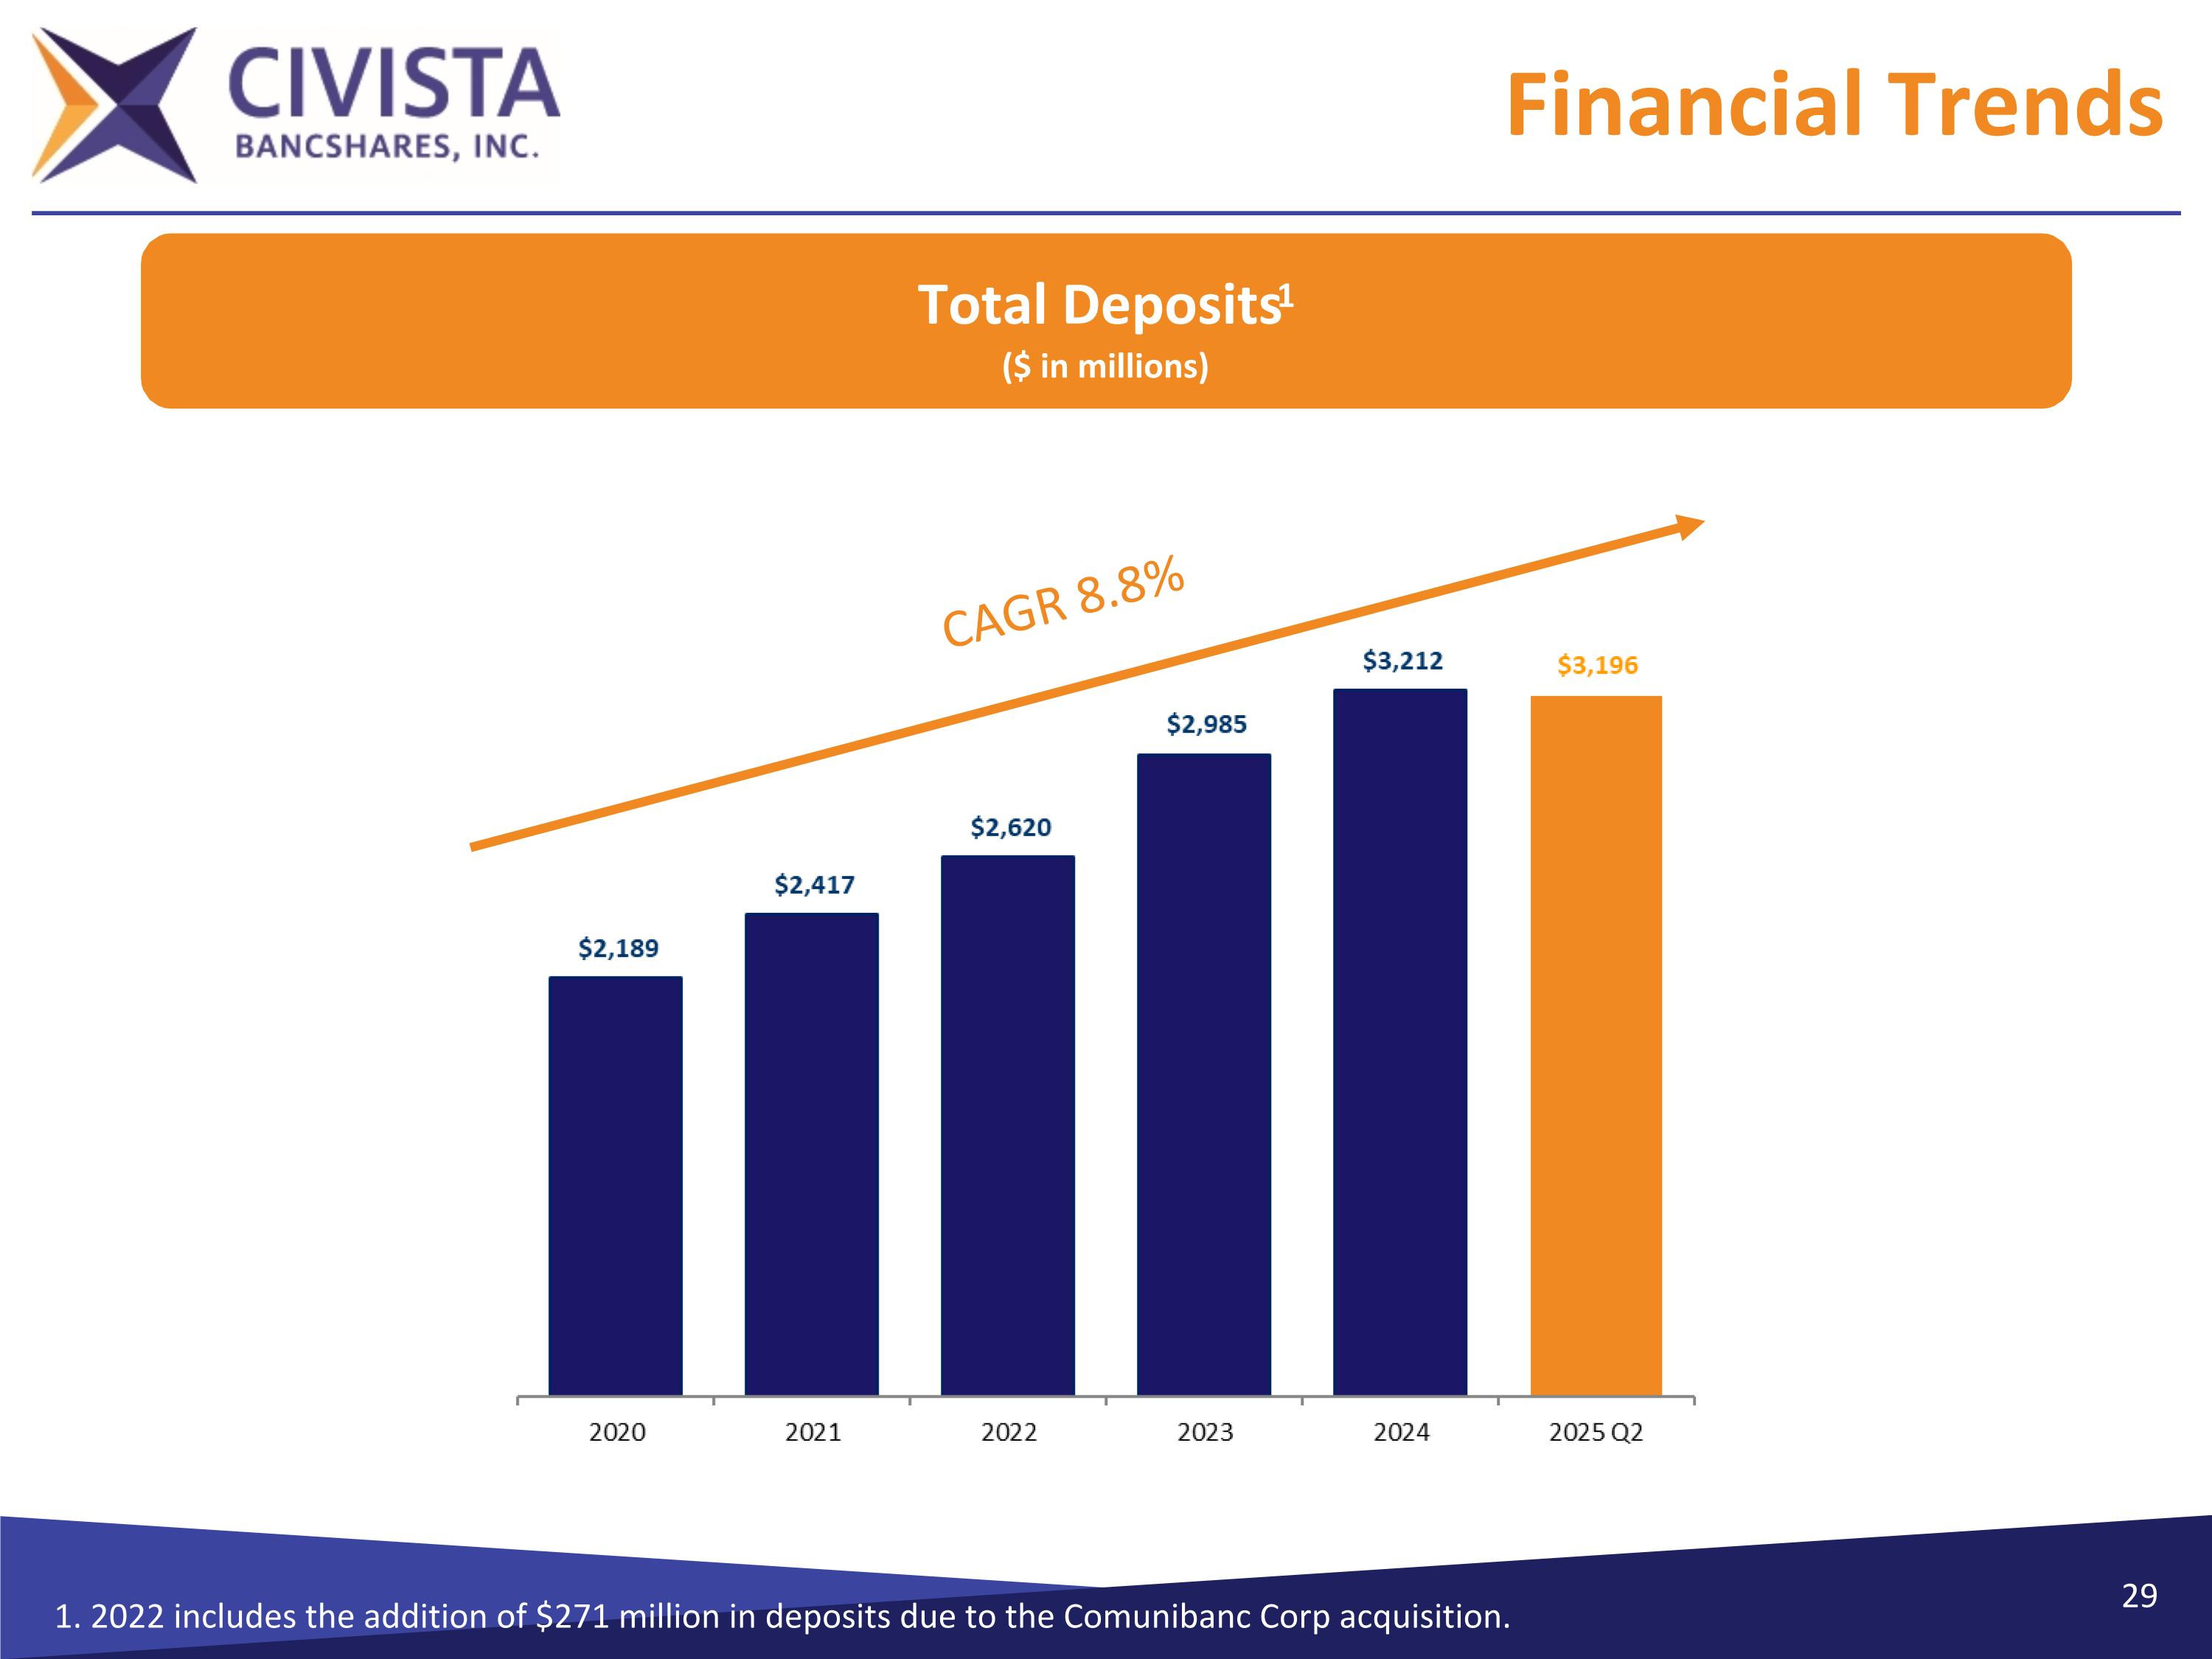
Financial Trends Total Deposits1 ($ in millions) 1. 2022 includes the addition of $271 million in deposits due to the Comunibanc Corp acquisition. CAGR 8.8%
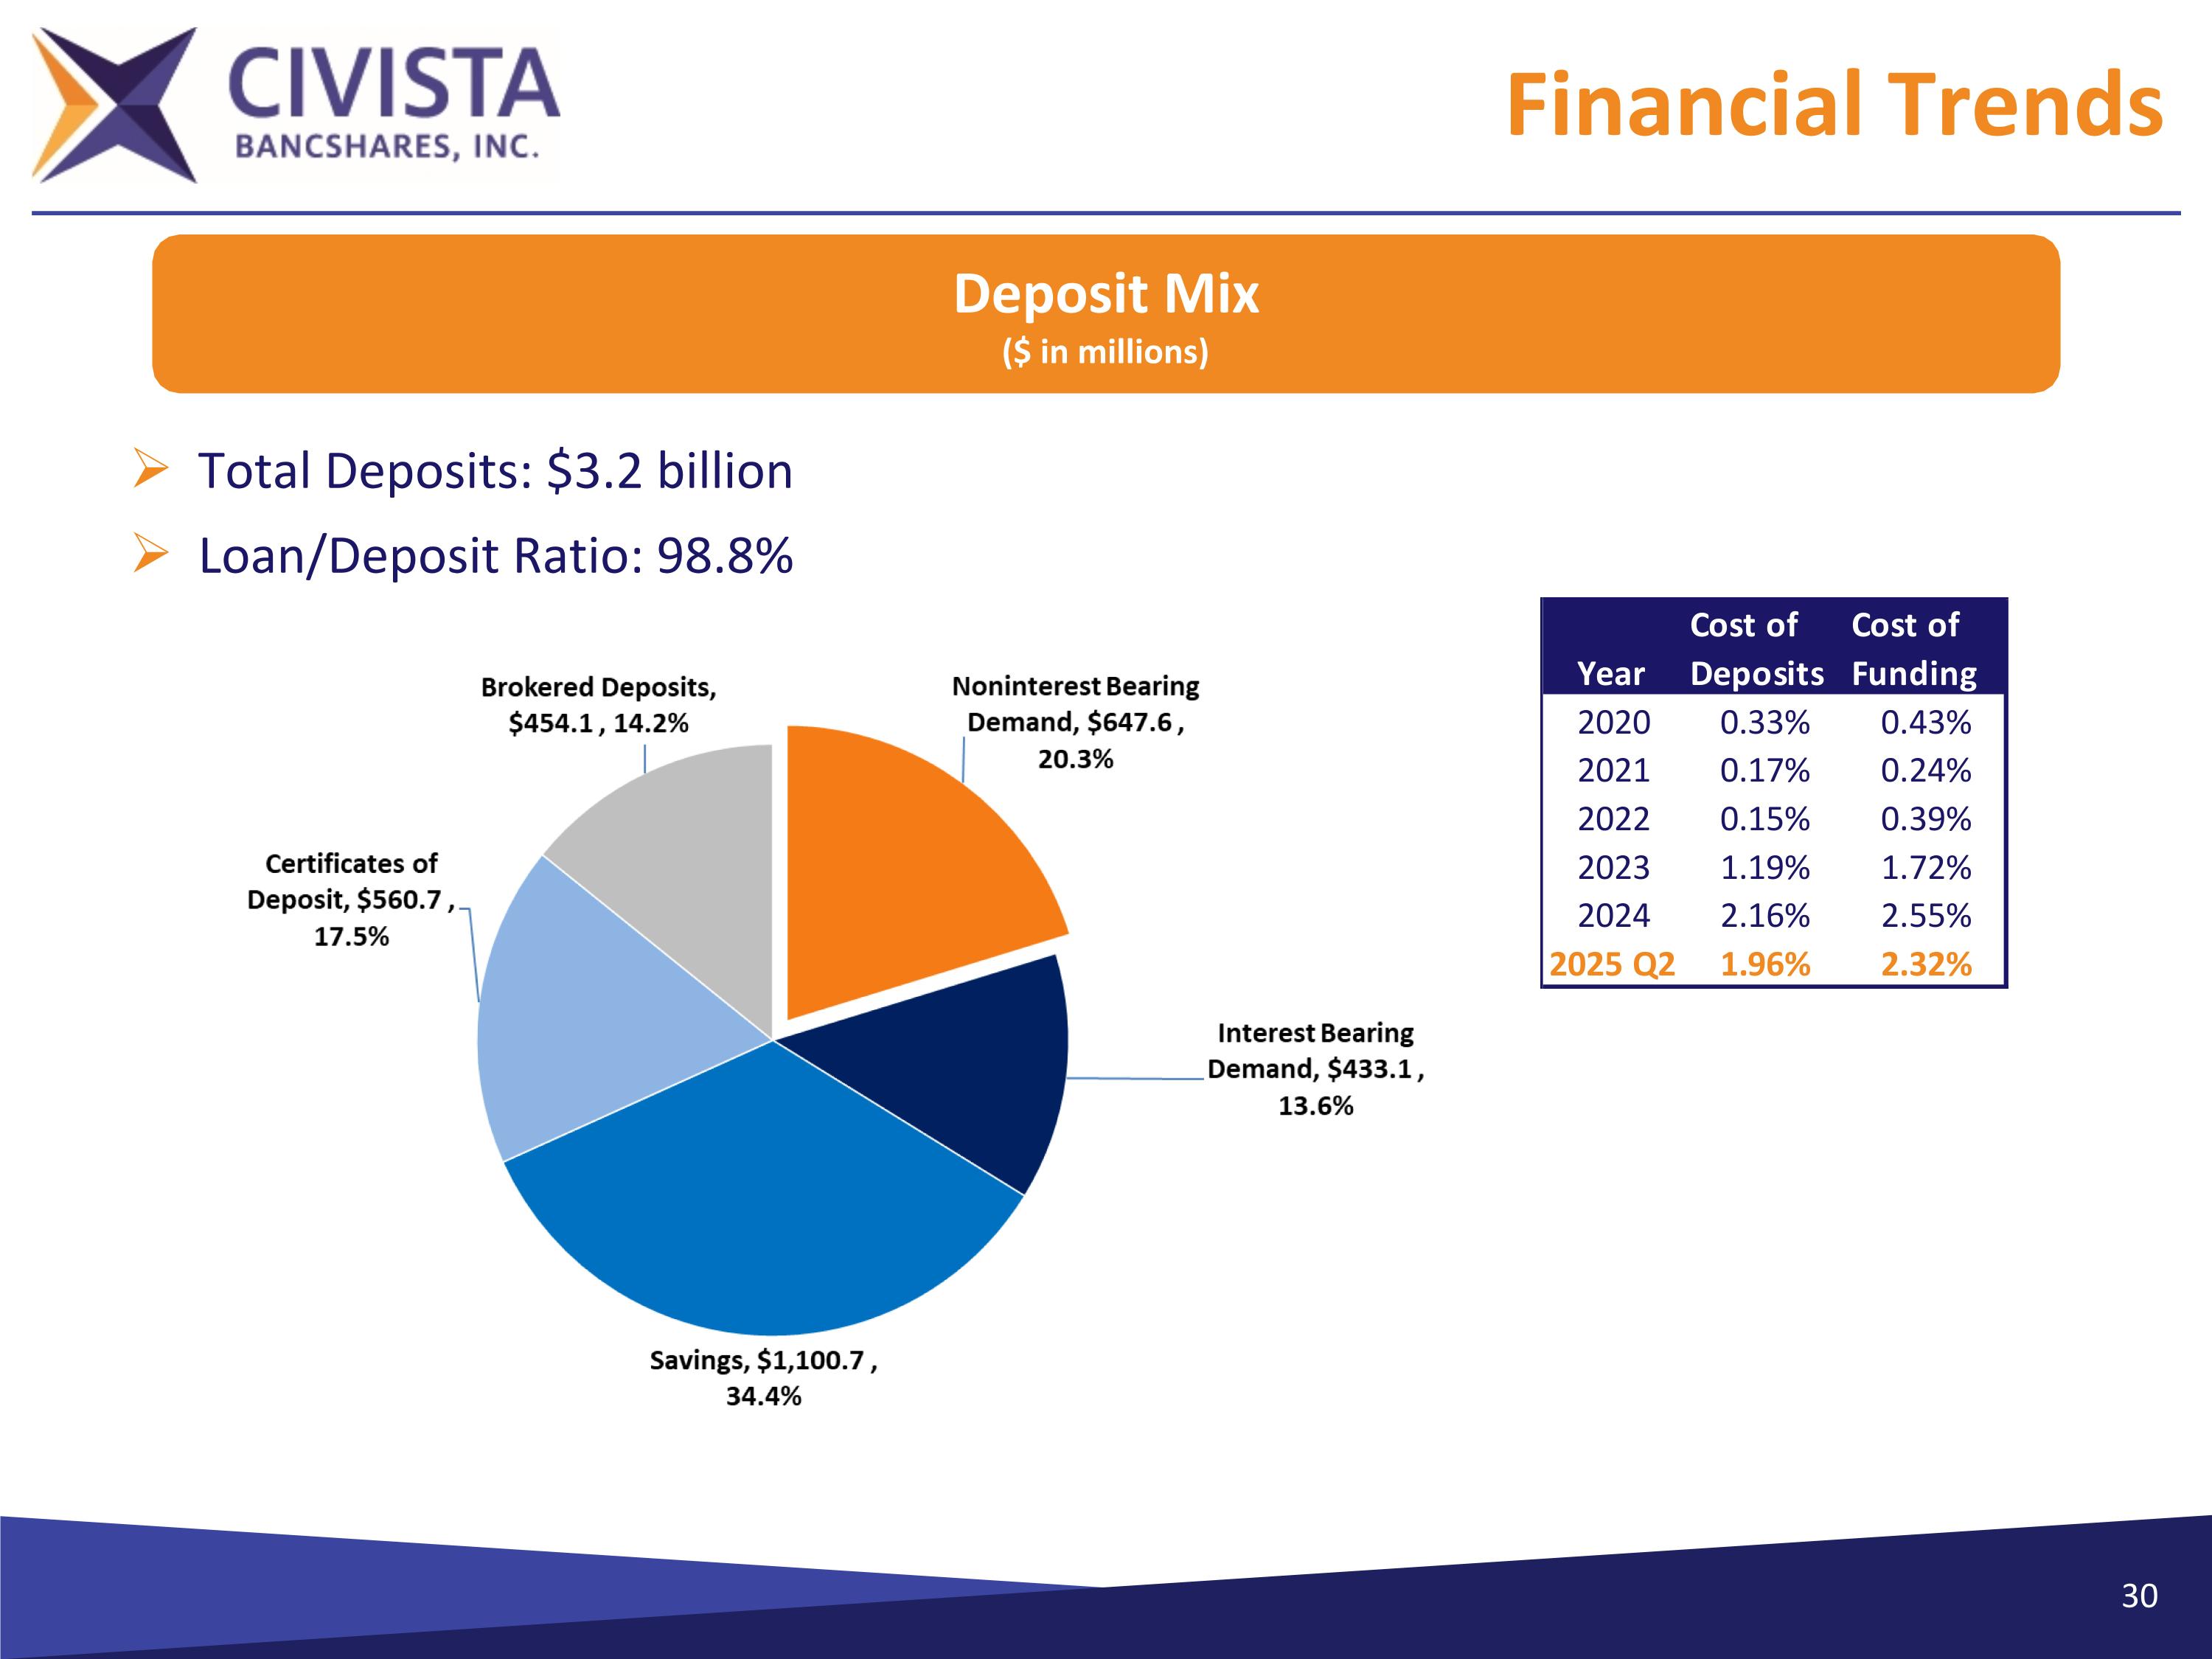
Financial Trends Total Deposits: $3.2 billion Loan/Deposit Ratio: 98.8% Deposit Mix ($ in millions)
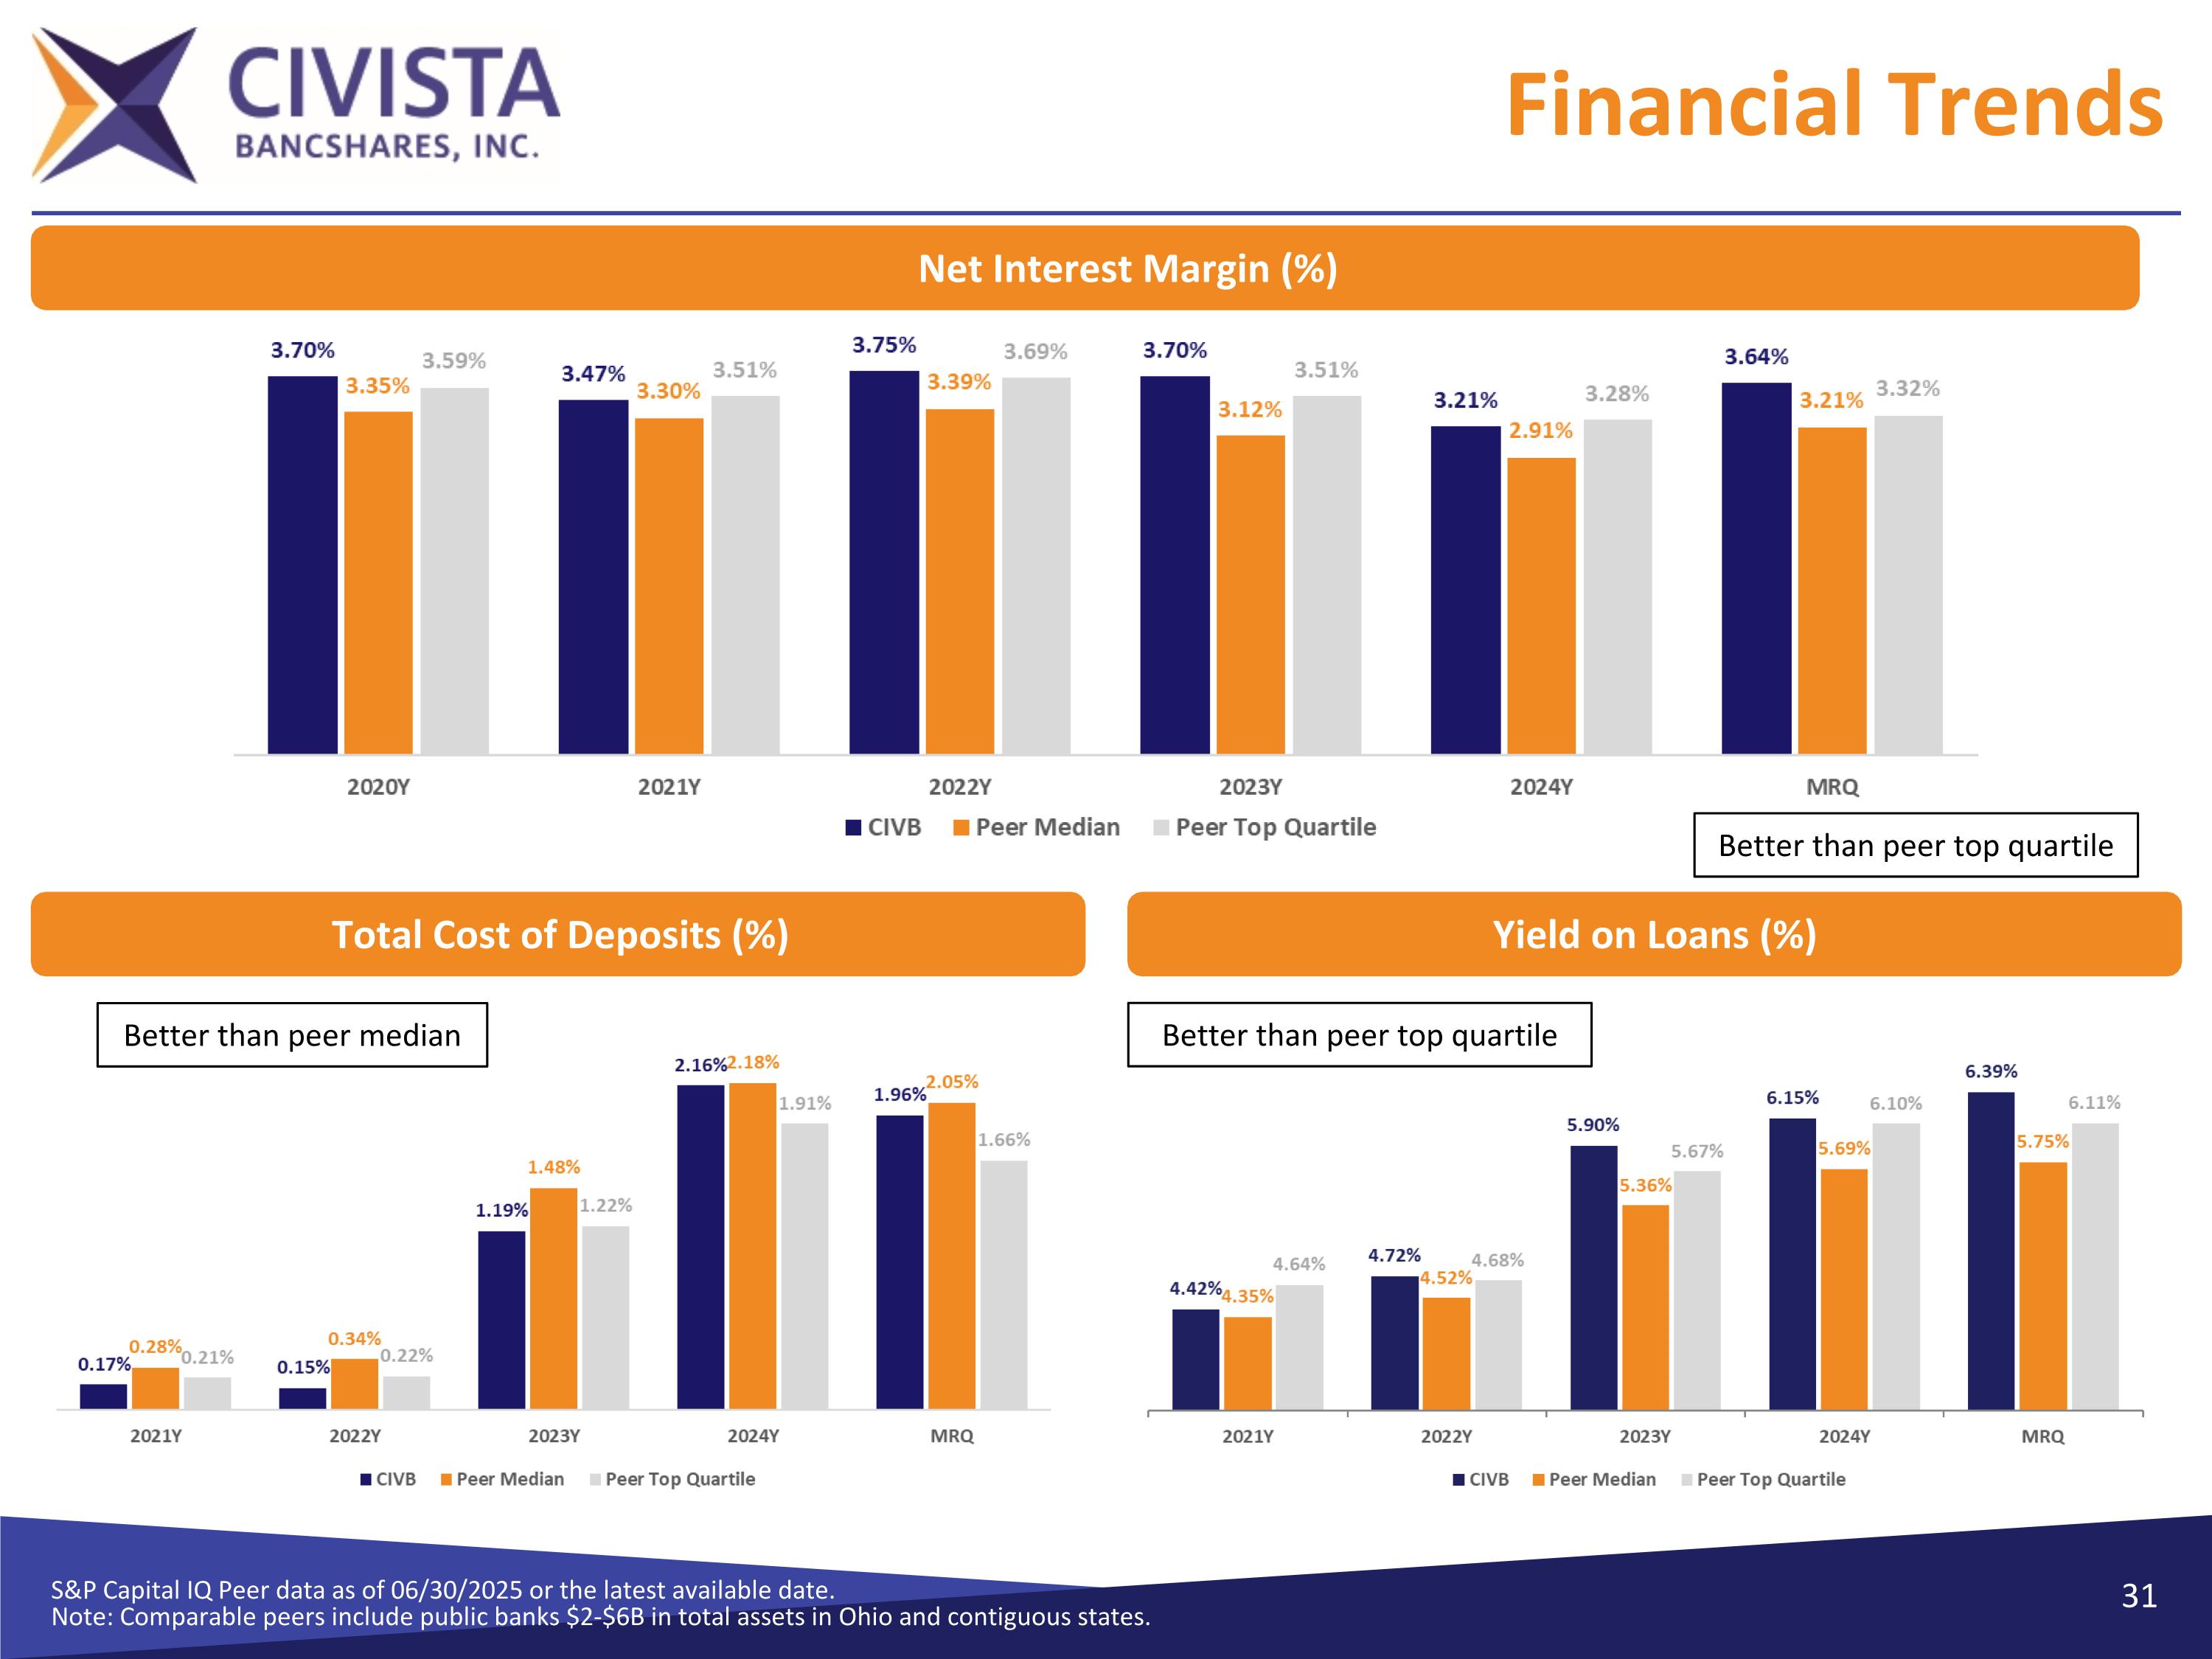
Financial Trends S&P Capital IQ Peer data as of 06/30/2025 or the latest available date. Note: Comparable peers include public banks $2-$6B in total assets in Ohio and contiguous states. Net Interest Margin (%) Total Cost of Deposits (%) Yield on Loans (%) Better than peer median Better than peer top quartile Better than peer top quartile
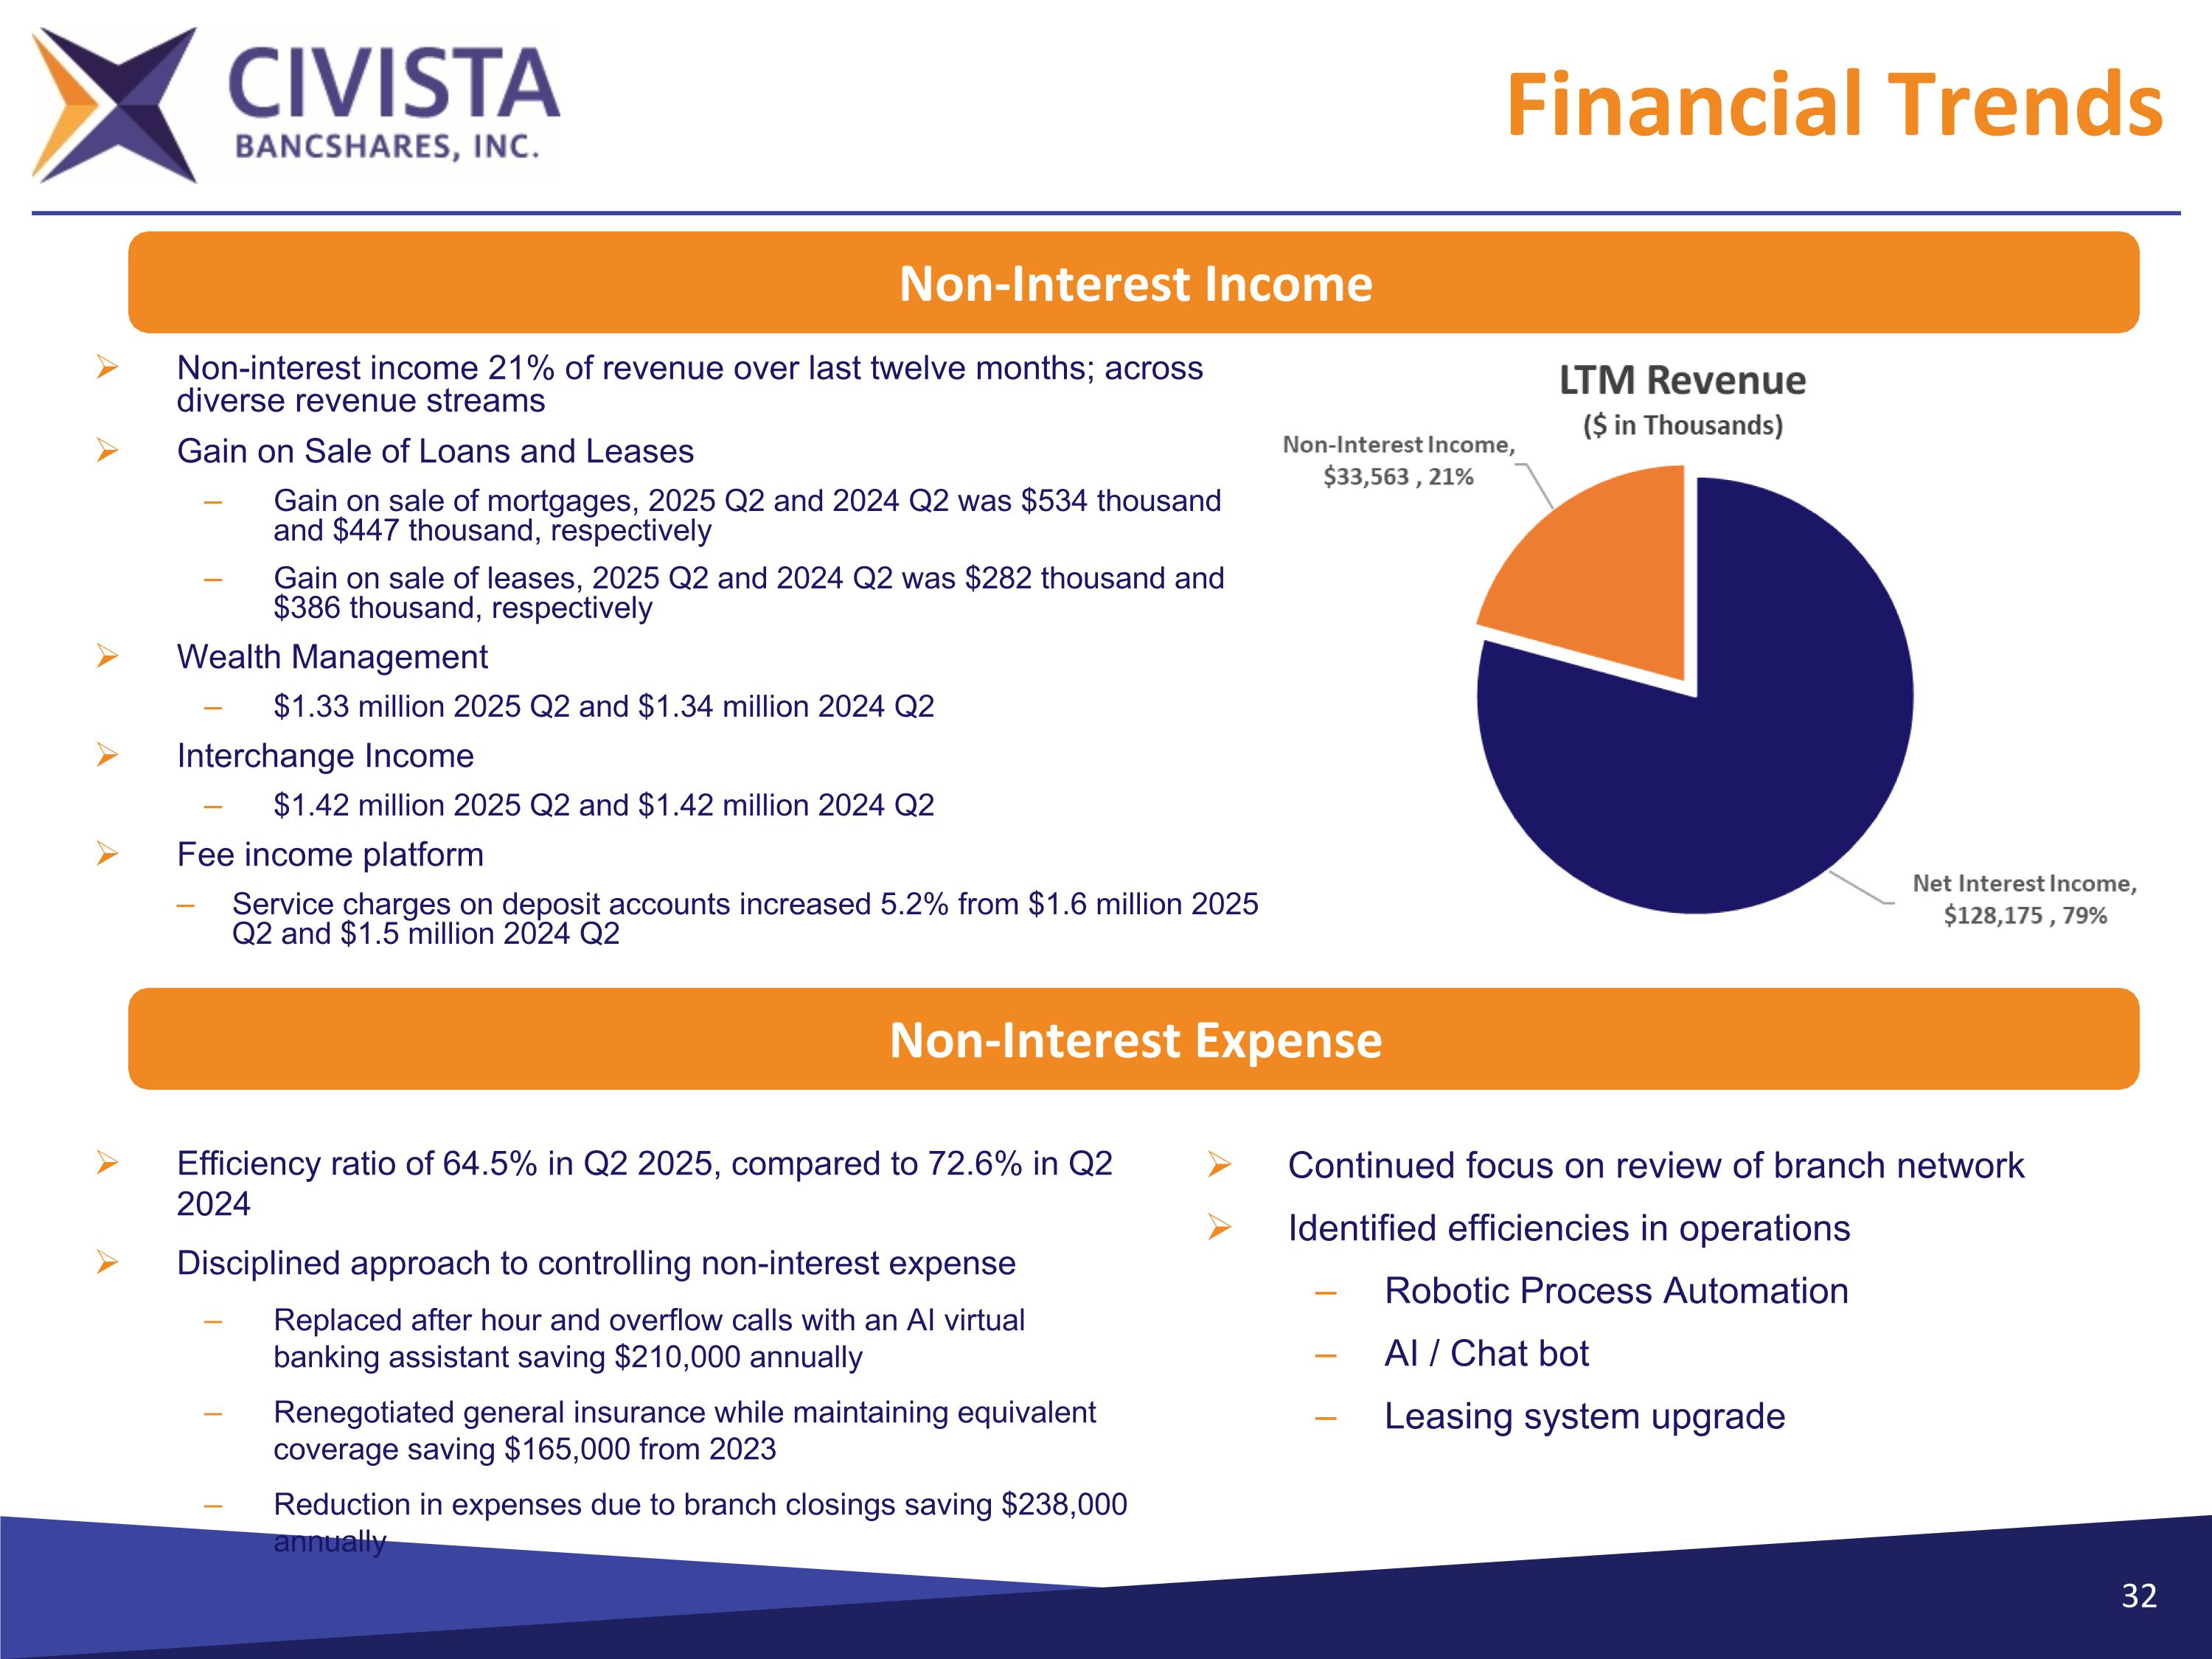
Financial Trends Non-interest income 21% of revenue over last twelve months; across diverse revenue streams Gain on Sale of Loans and Leases Gain on sale of mortgages, 2025 Q2 and 2024 Q2 was $534 thousand and $447 thousand, respectively Gain on sale of leases, 2025 Q2 and 2024 Q2 was $282 thousand and $386 thousand, respectively Wealth Management $1.33 million 2025 Q2 and $1.34 million 2024 Q2 Interchange Income $1.42 million 2025 Q2 and $1.42 million 2024 Q2 Fee income platform Service charges on deposit accounts increased 5.2% from $1.6 million 2025 Q2 and $1.5 million 2024 Q2 Continued focus on review of branch network Identified efficiencies in operations Robotic Process Automation AI / Chat bot Leasing system upgrade Non-Interest Income Efficiency ratio of 64.5% in Q2 2025, compared to 72.6% in Q2 2024 Disciplined approach to controlling non-interest expense Replaced after hour and overflow calls with an AI virtual banking assistant saving $210,000 annually Renegotiated general insurance while maintaining equivalent coverage saving $165,000 from 2023 Reduction in expenses due to branch closings saving $238,000 annually Non-Interest Expense
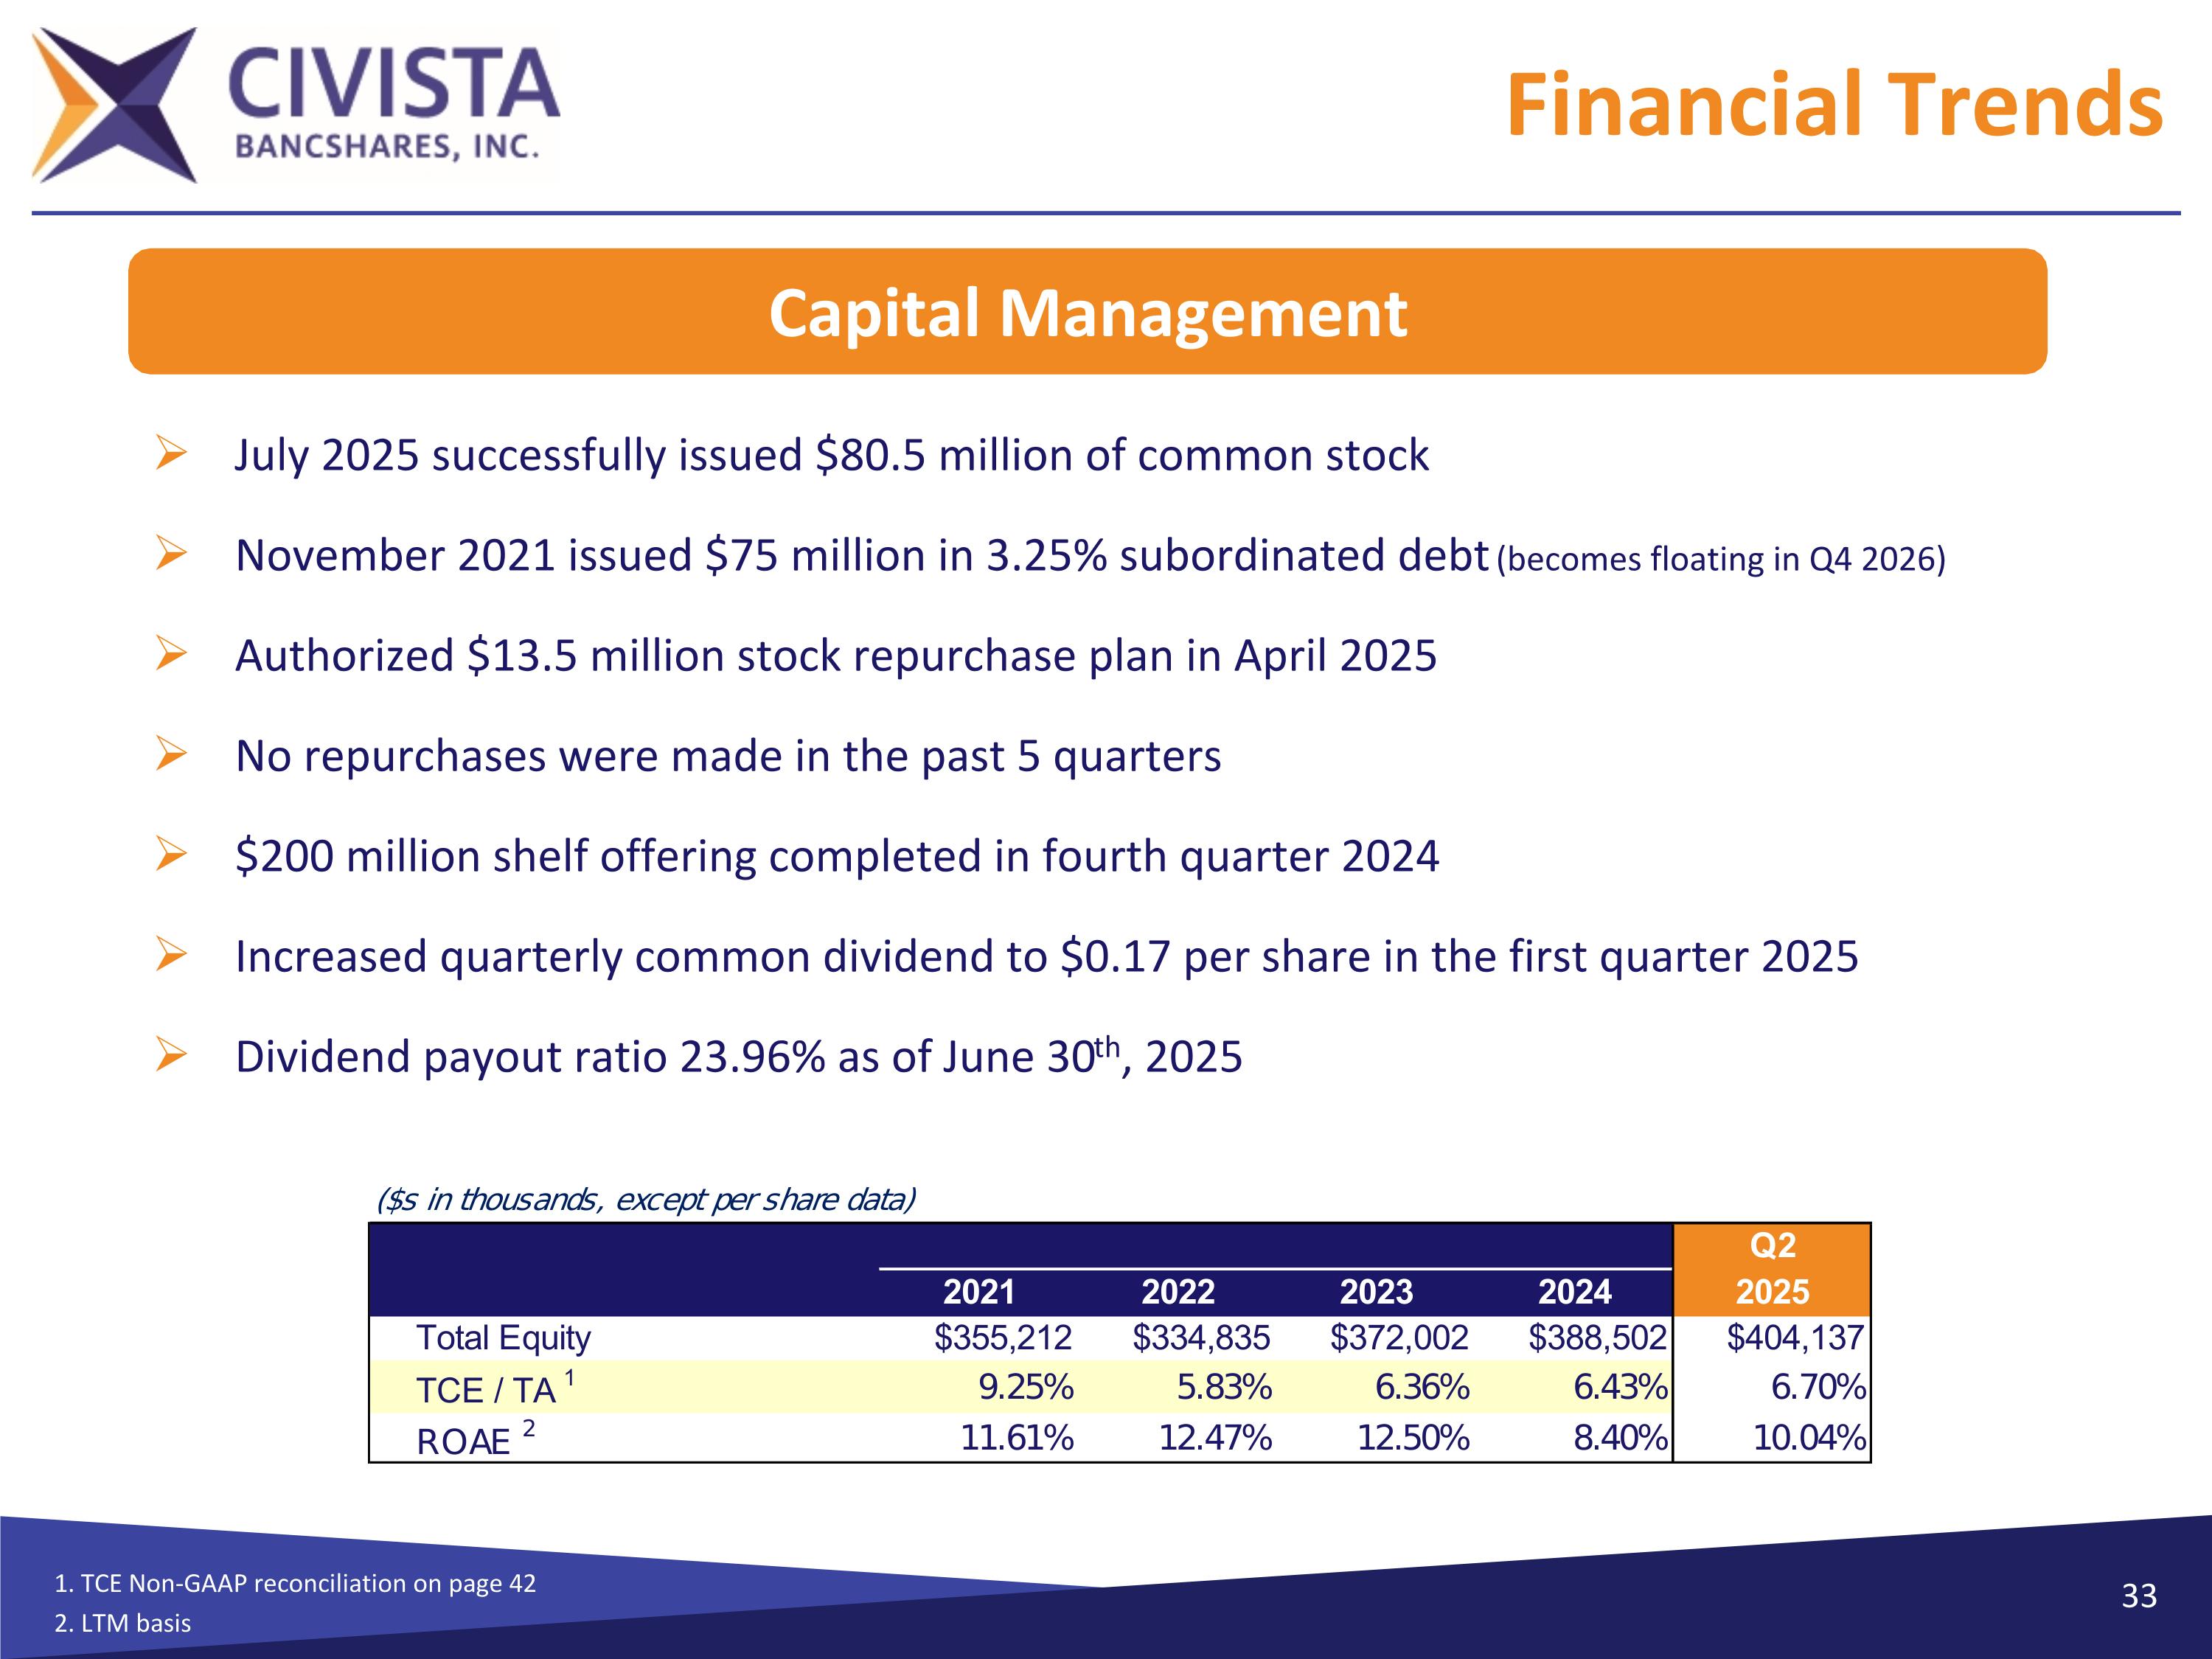
Financial Trends 1. TCE Non-GAAP reconciliation on page 42 2. LTM basis July 2025 successfully issued $80.5 million of common stock November 2021 issued $75 million in 3.25% subordinated debt (becomes floating in Q4 2026) Authorized $13.5 million stock repurchase plan in April 2025 No repurchases were made in the past 5 quarters $200 million shelf offering completed in fourth quarter 2024 Increased quarterly common dividend to $0.17 per share in the first quarter 2025 Dividend payout ratio 23.96% as of June 30th, 2025 Capital Management
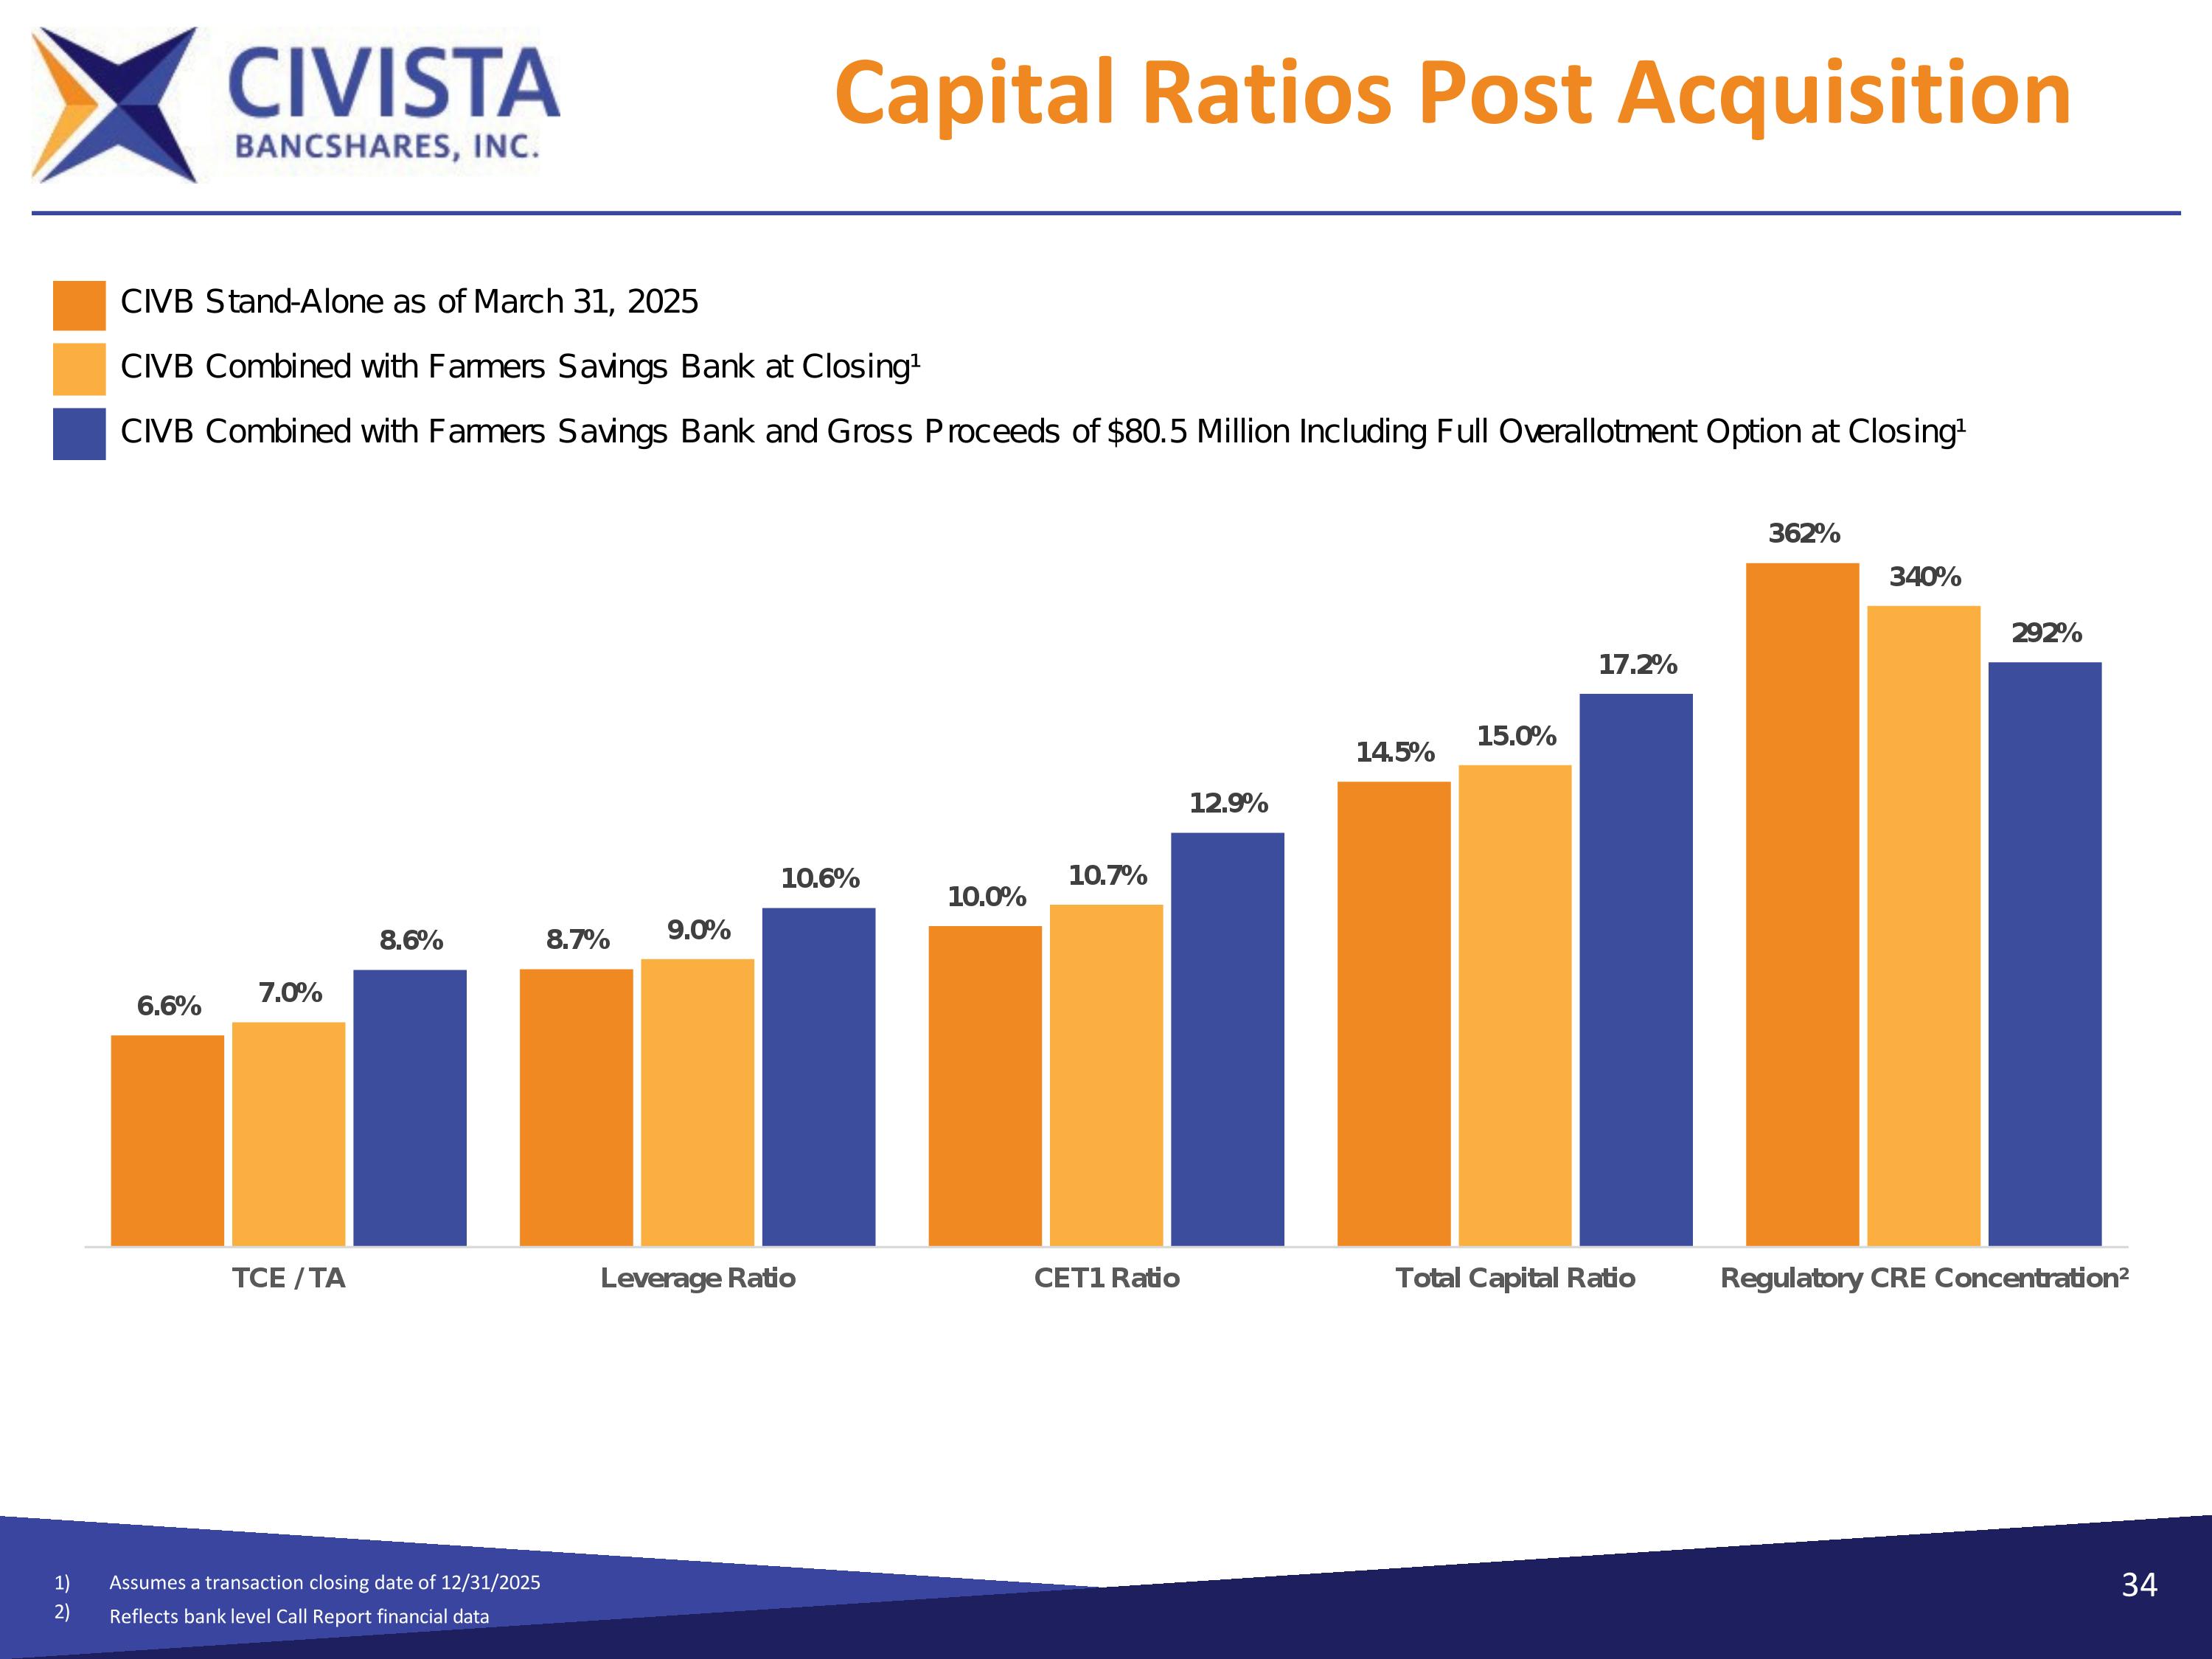
Capital Ratios Post Acquisition 1) 2) Assumes a transaction closing date of 12/31/2025 Reflects bank level Call Report financial data 34
Why Civista? 35
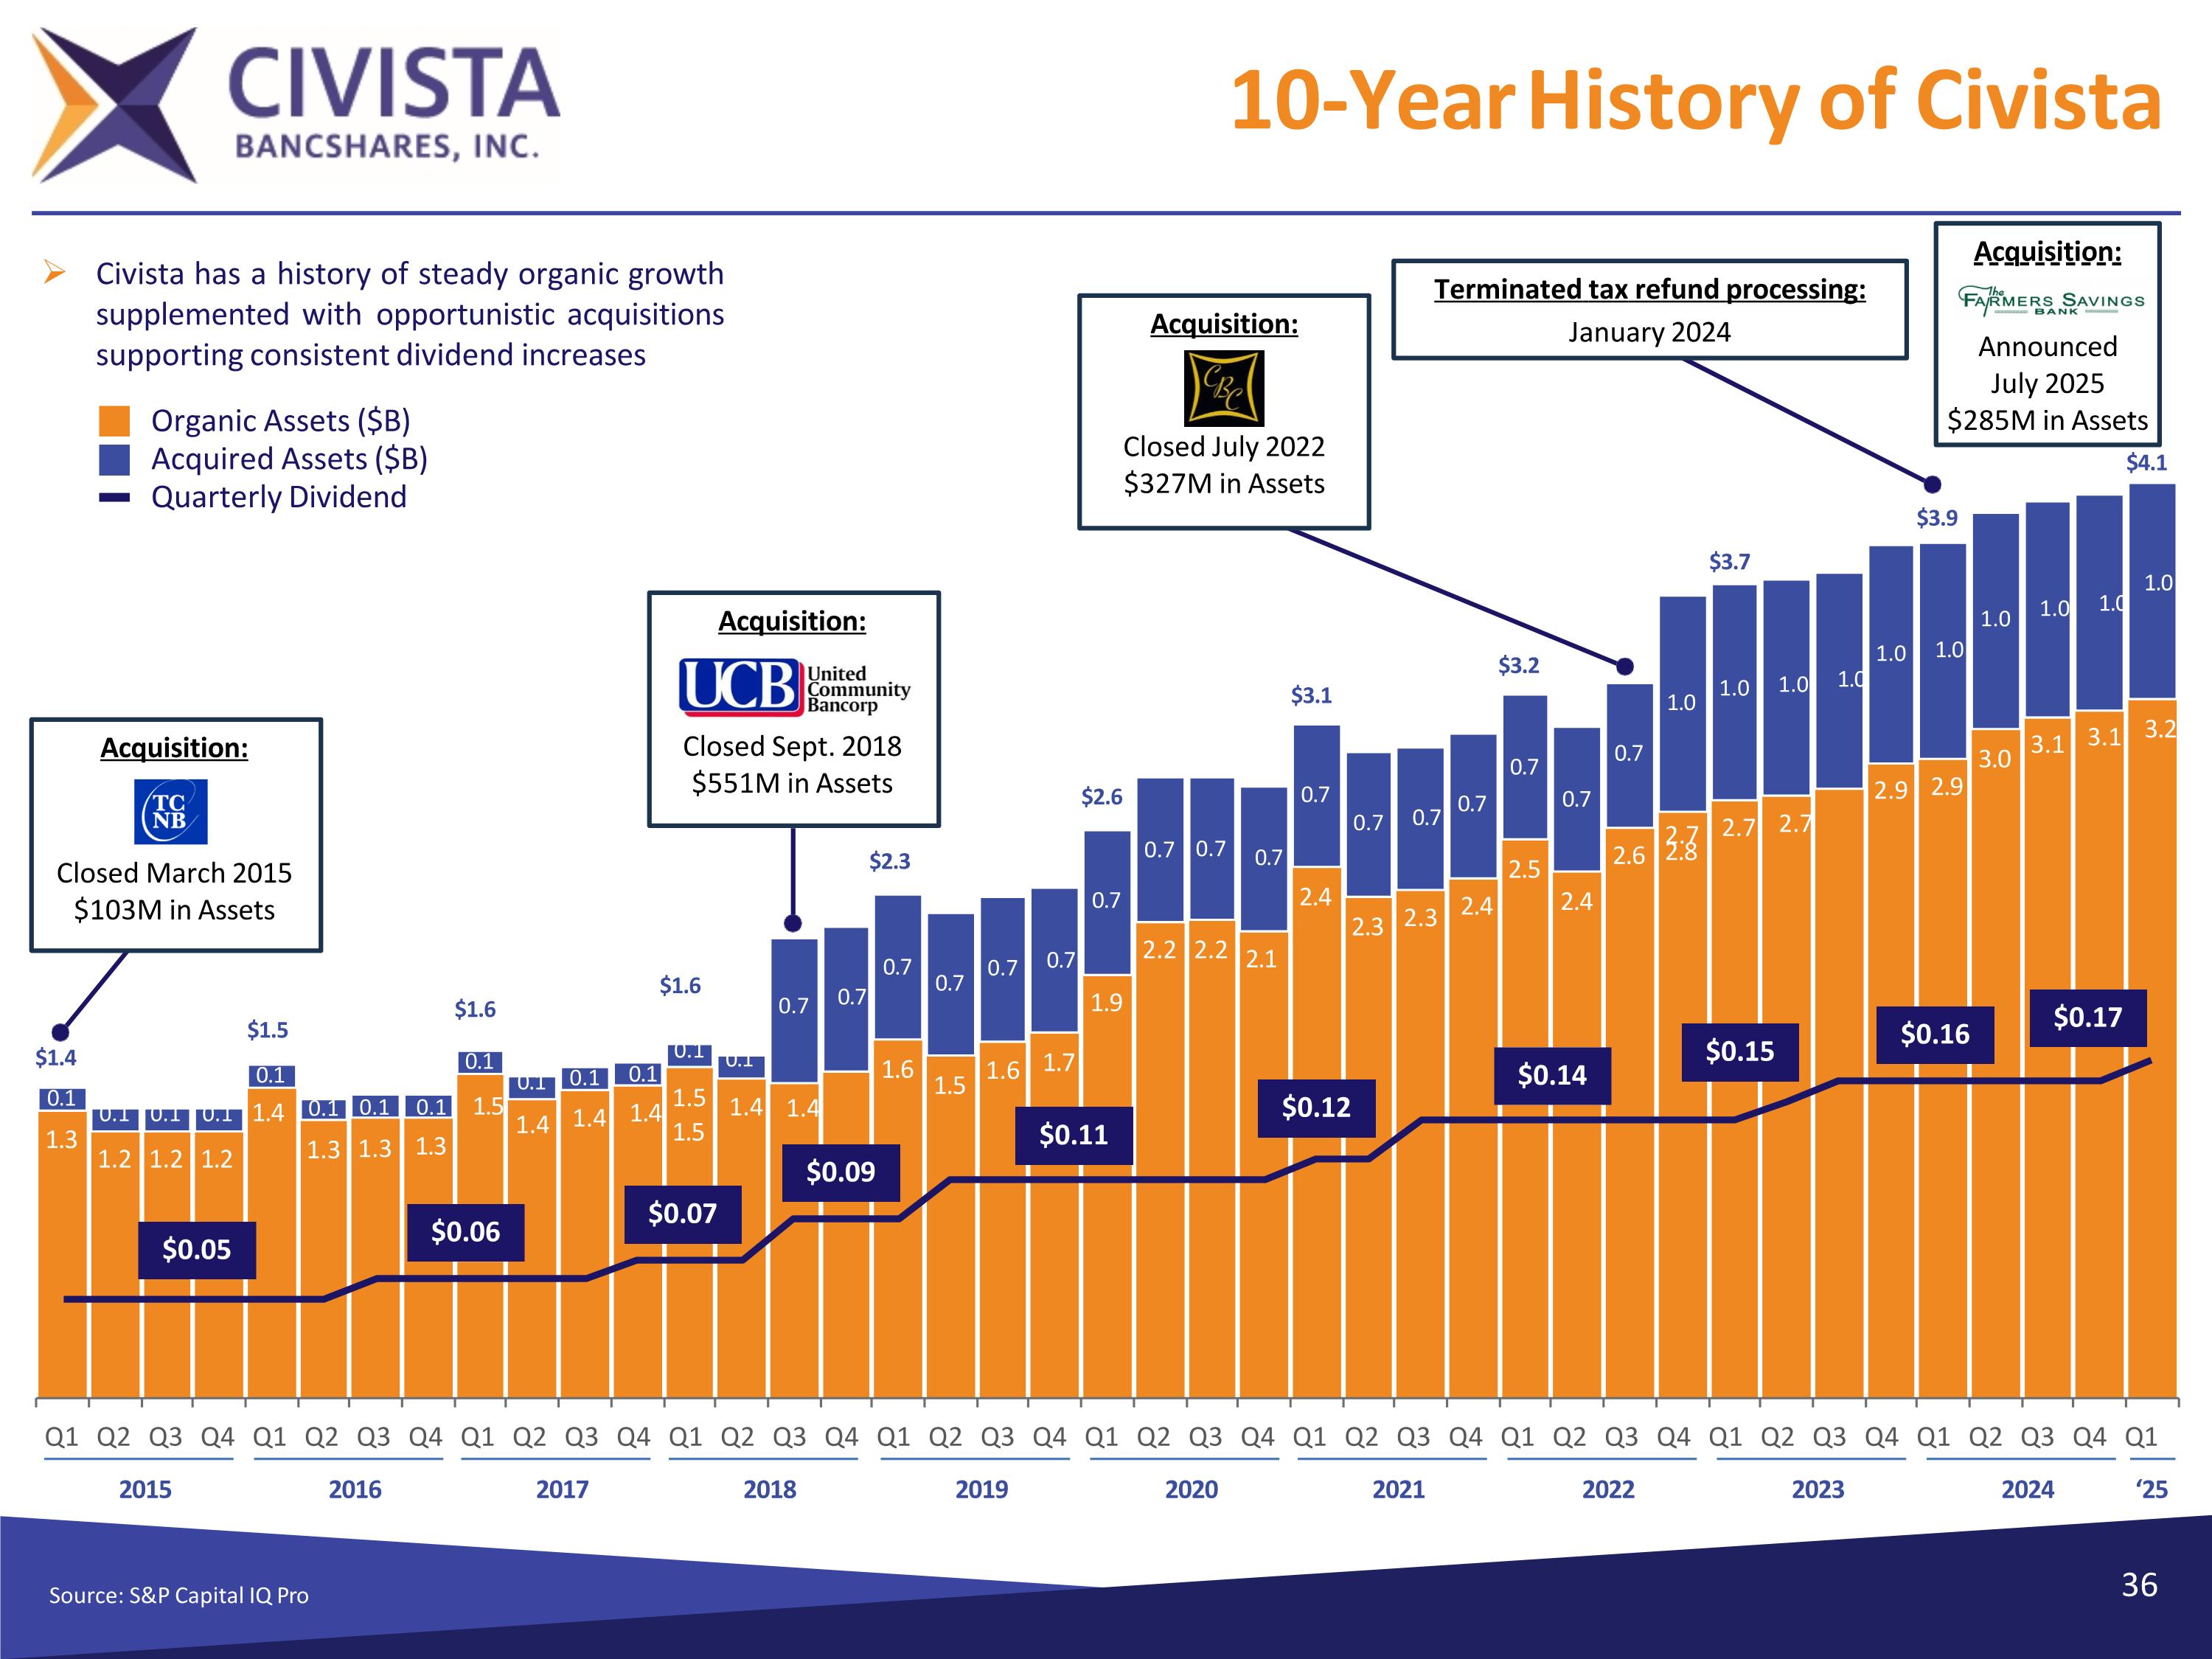
10-Year History of Civista Source: S&P Capital IQ Pro 1.2 1.2 1.2 1.3 1.3 1.3 1.4 1.4 1.4 1.5 1.4 1.4 1.5 1.6 1.5 1.6 1.7 1.9 2.2 2.2 2.1 2.4 2.3 2.3 2.4 2.5 2.4 2.6 2.7 2.7 2.7 2.8 2.9 2.9 3.0 3.1 3.1 3.2 0.1 0.1 0.1 0.1 1.4 1.3 0.1 0.1 0.1 0.1 0.1 0.1 1.5 0.1 0.1 0.1 0.1 0.7 0.7 0.7 0.7 0.7 0.7 0.7 0.7 0.7 0.7 0.7 0.7 0.7 0.7 0.7 0.7 0.7 1.0 1.0 1.0 1.0 1.0 1.0 1.0 1.0 1.0 1.0 Civista has a history of steady organic growth supplemented with opportunistic acquisitions supporting consistent dividend increases Acquisition: Closed Sept. 2018 $551M in Assets $1.4 Acquisition: Closed July 2022 $327M in Assets Acquisition: Announced July 2025 $285M in Assets $0.05 $0.06 $0.07 $0.09 $0.11 $0.12 $0.14 $0.15 $0.16 $0.17 $1.5 $1.6 $1.6 $2.3 $2.6 $3.1 $3.2 $3.7 $3.9 $4.1 Acquisition: Closed March 2015 $103M in Assets Q1 Q2 Q3 Q4 Q1 Q2 Q3 Q4 Q1 Q2 Q3 Q4 Q1 Q2 Q3 Q4 Q1 Q2 Q3 Q4 Q1 Q2 Q3 Q4 Q1 Q2 Q3 Q4 Q1 Q2 Q3 Q4 Q1 Q2 Q3 Q4 Q1 Q2 Q3 Q4 Q1 2015 2016 2017 2018 2019 2020 2021 2022 2023 2024 ‘25 Organic Assets ($B) Acquired Assets ($B) Quarterly Dividend Terminated tax refund processing: January 2024 36
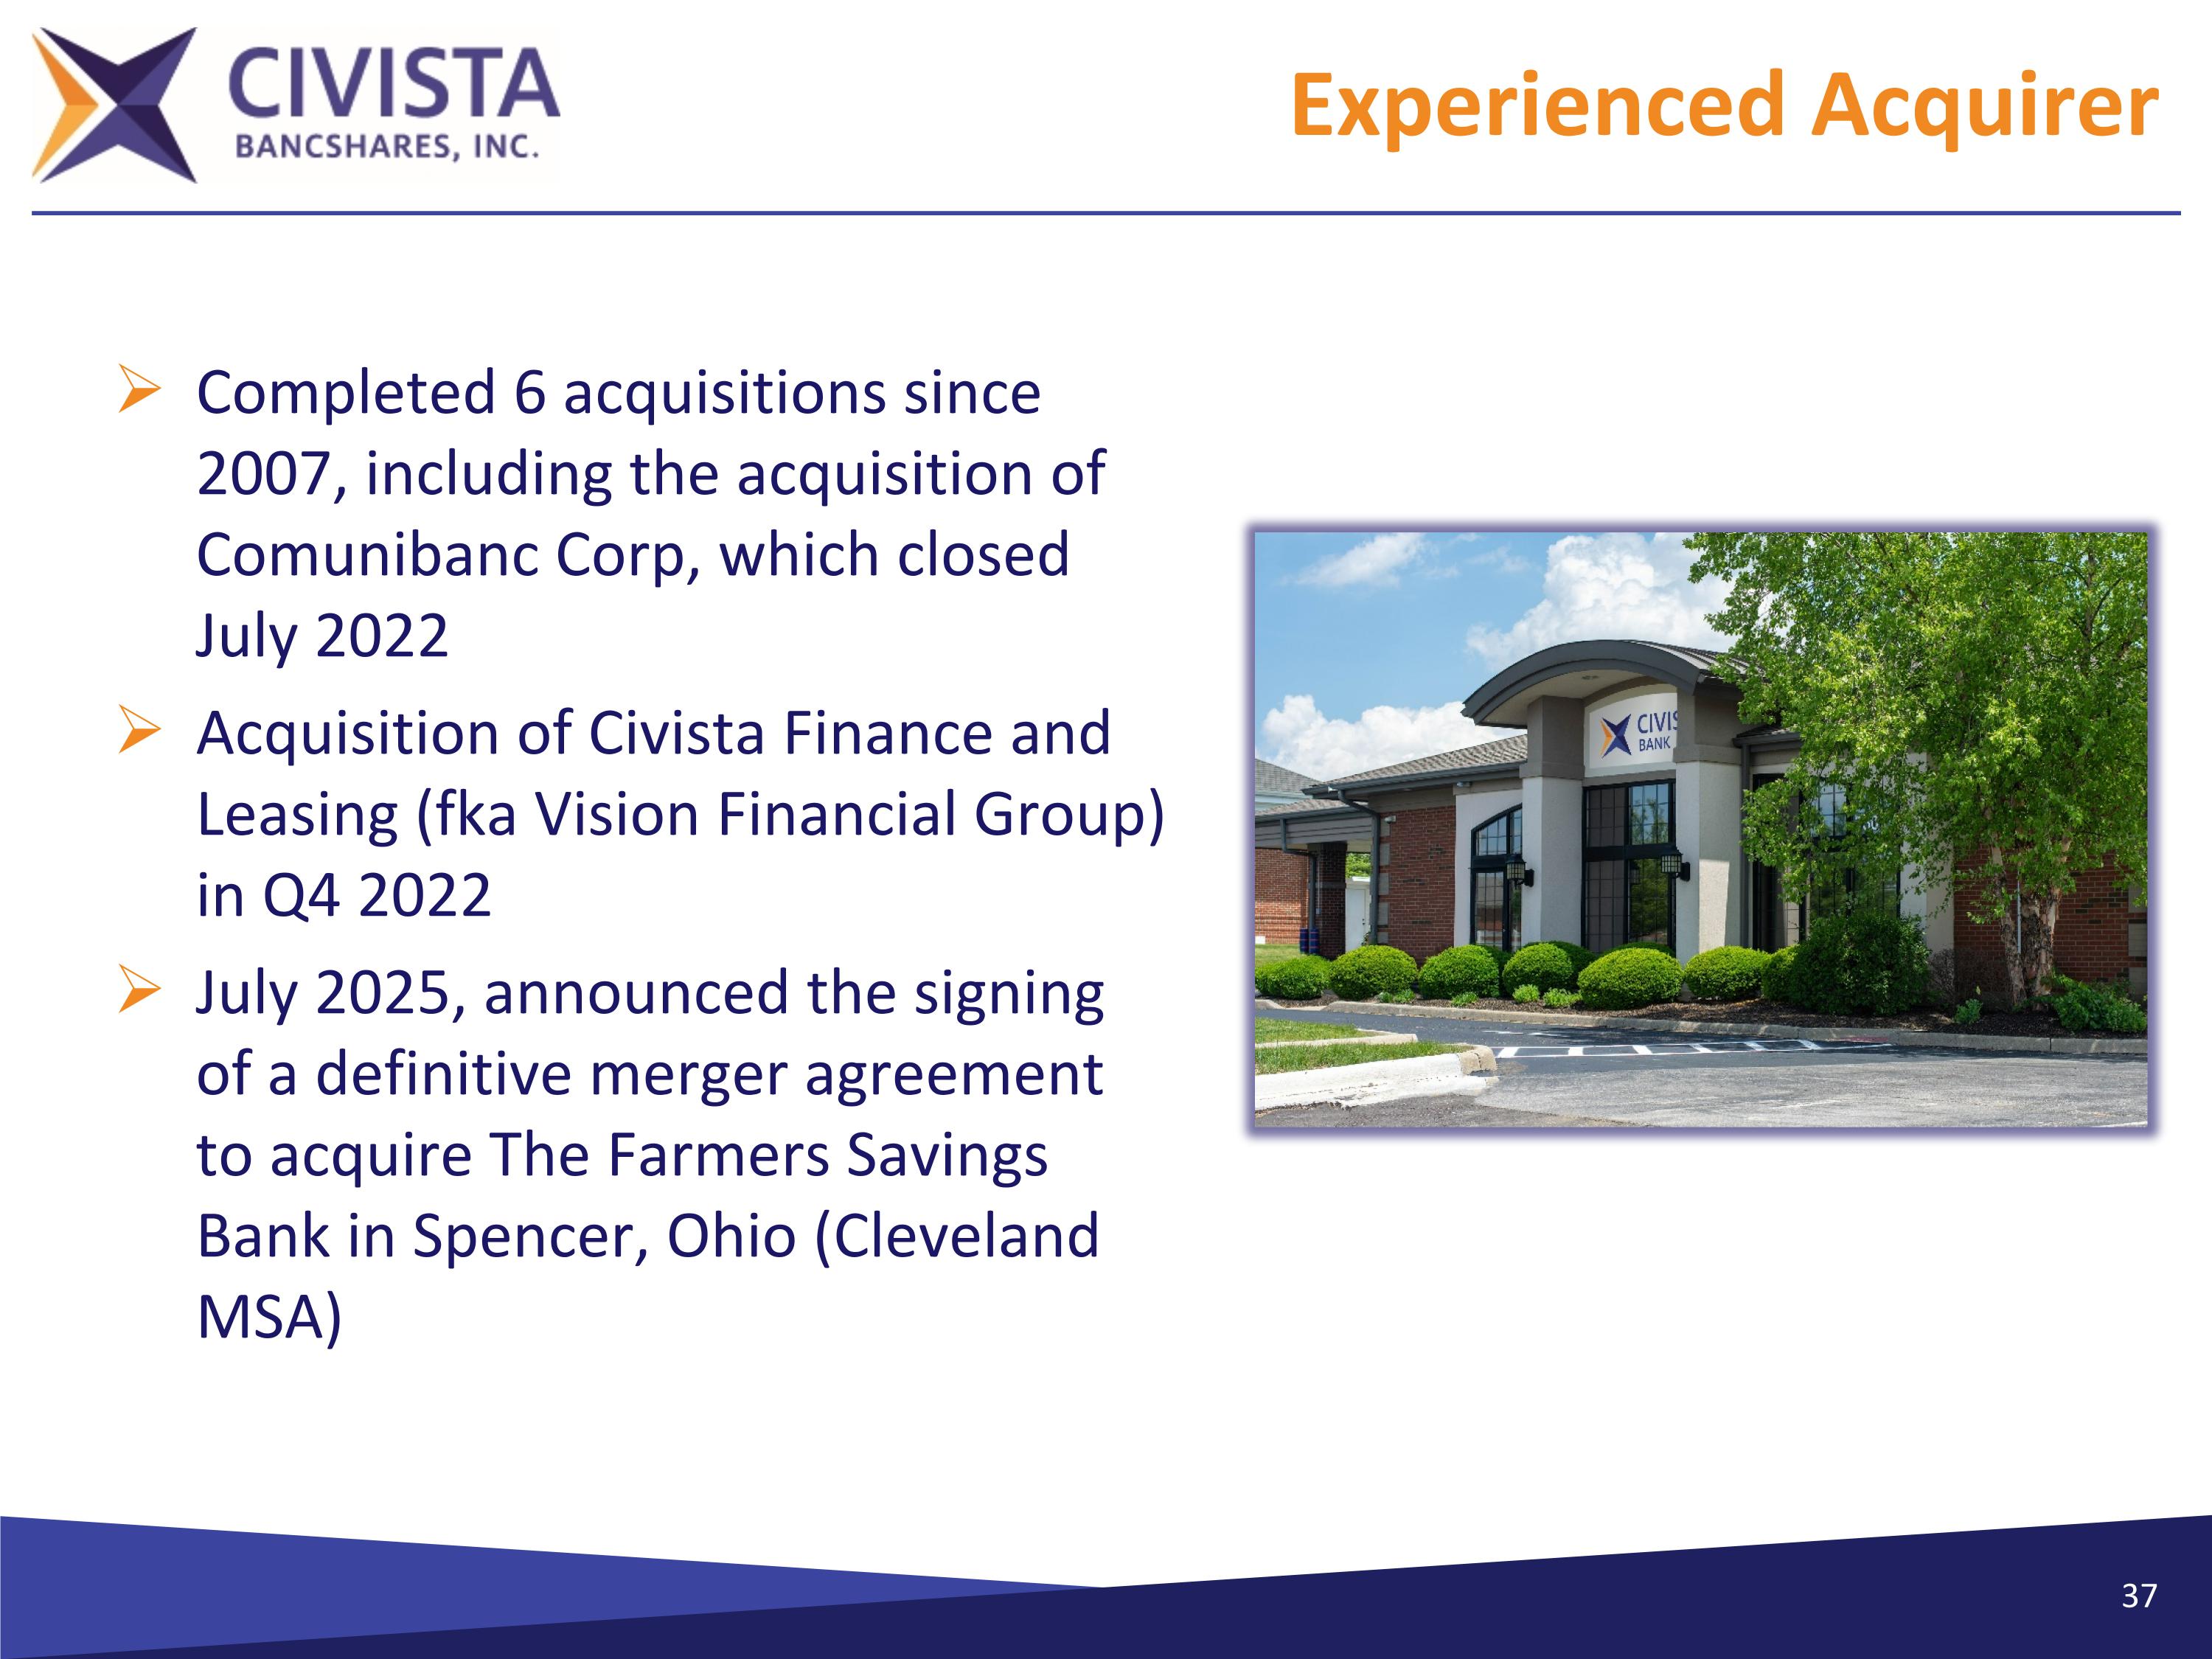
Experienced Acquirer Completed 6 acquisitions since 2007, including the acquisition of Comunibanc Corp, which closed July 2022 Acquisition of Civista Finance and Leasing (fka Vision Financial Group) in Q4 2022 July 2025, announced the signing of a definitive merger agreement to acquire The Farmers Savings Bank in Spencer, Ohio (Cleveland MSA)
Organic Growth Model Expanded commercial loan growth in Columbus, Cleveland, Akron, Dayton, Toledo and Cincinnati markets Loan portfolios in these markets has increased from $1.27 billion in 2019 to $2.37 billion on June 30, 2025. Growth of $1.1 billion or 87% (represents 76% of Civista’s total loan growth) Deposits in these markets has increased from $789 million in 2019 to $1.44 billion at year-end 2024. Growth of $651 million or 83% (represents 43% of Civista’s total deposit growth) Low cost, locally generated deposit base Core Deposits have grown 11.5% YoY Strong Net Interest Margin 3.64% for Q2 2025; 3.47% excl non-recurring items
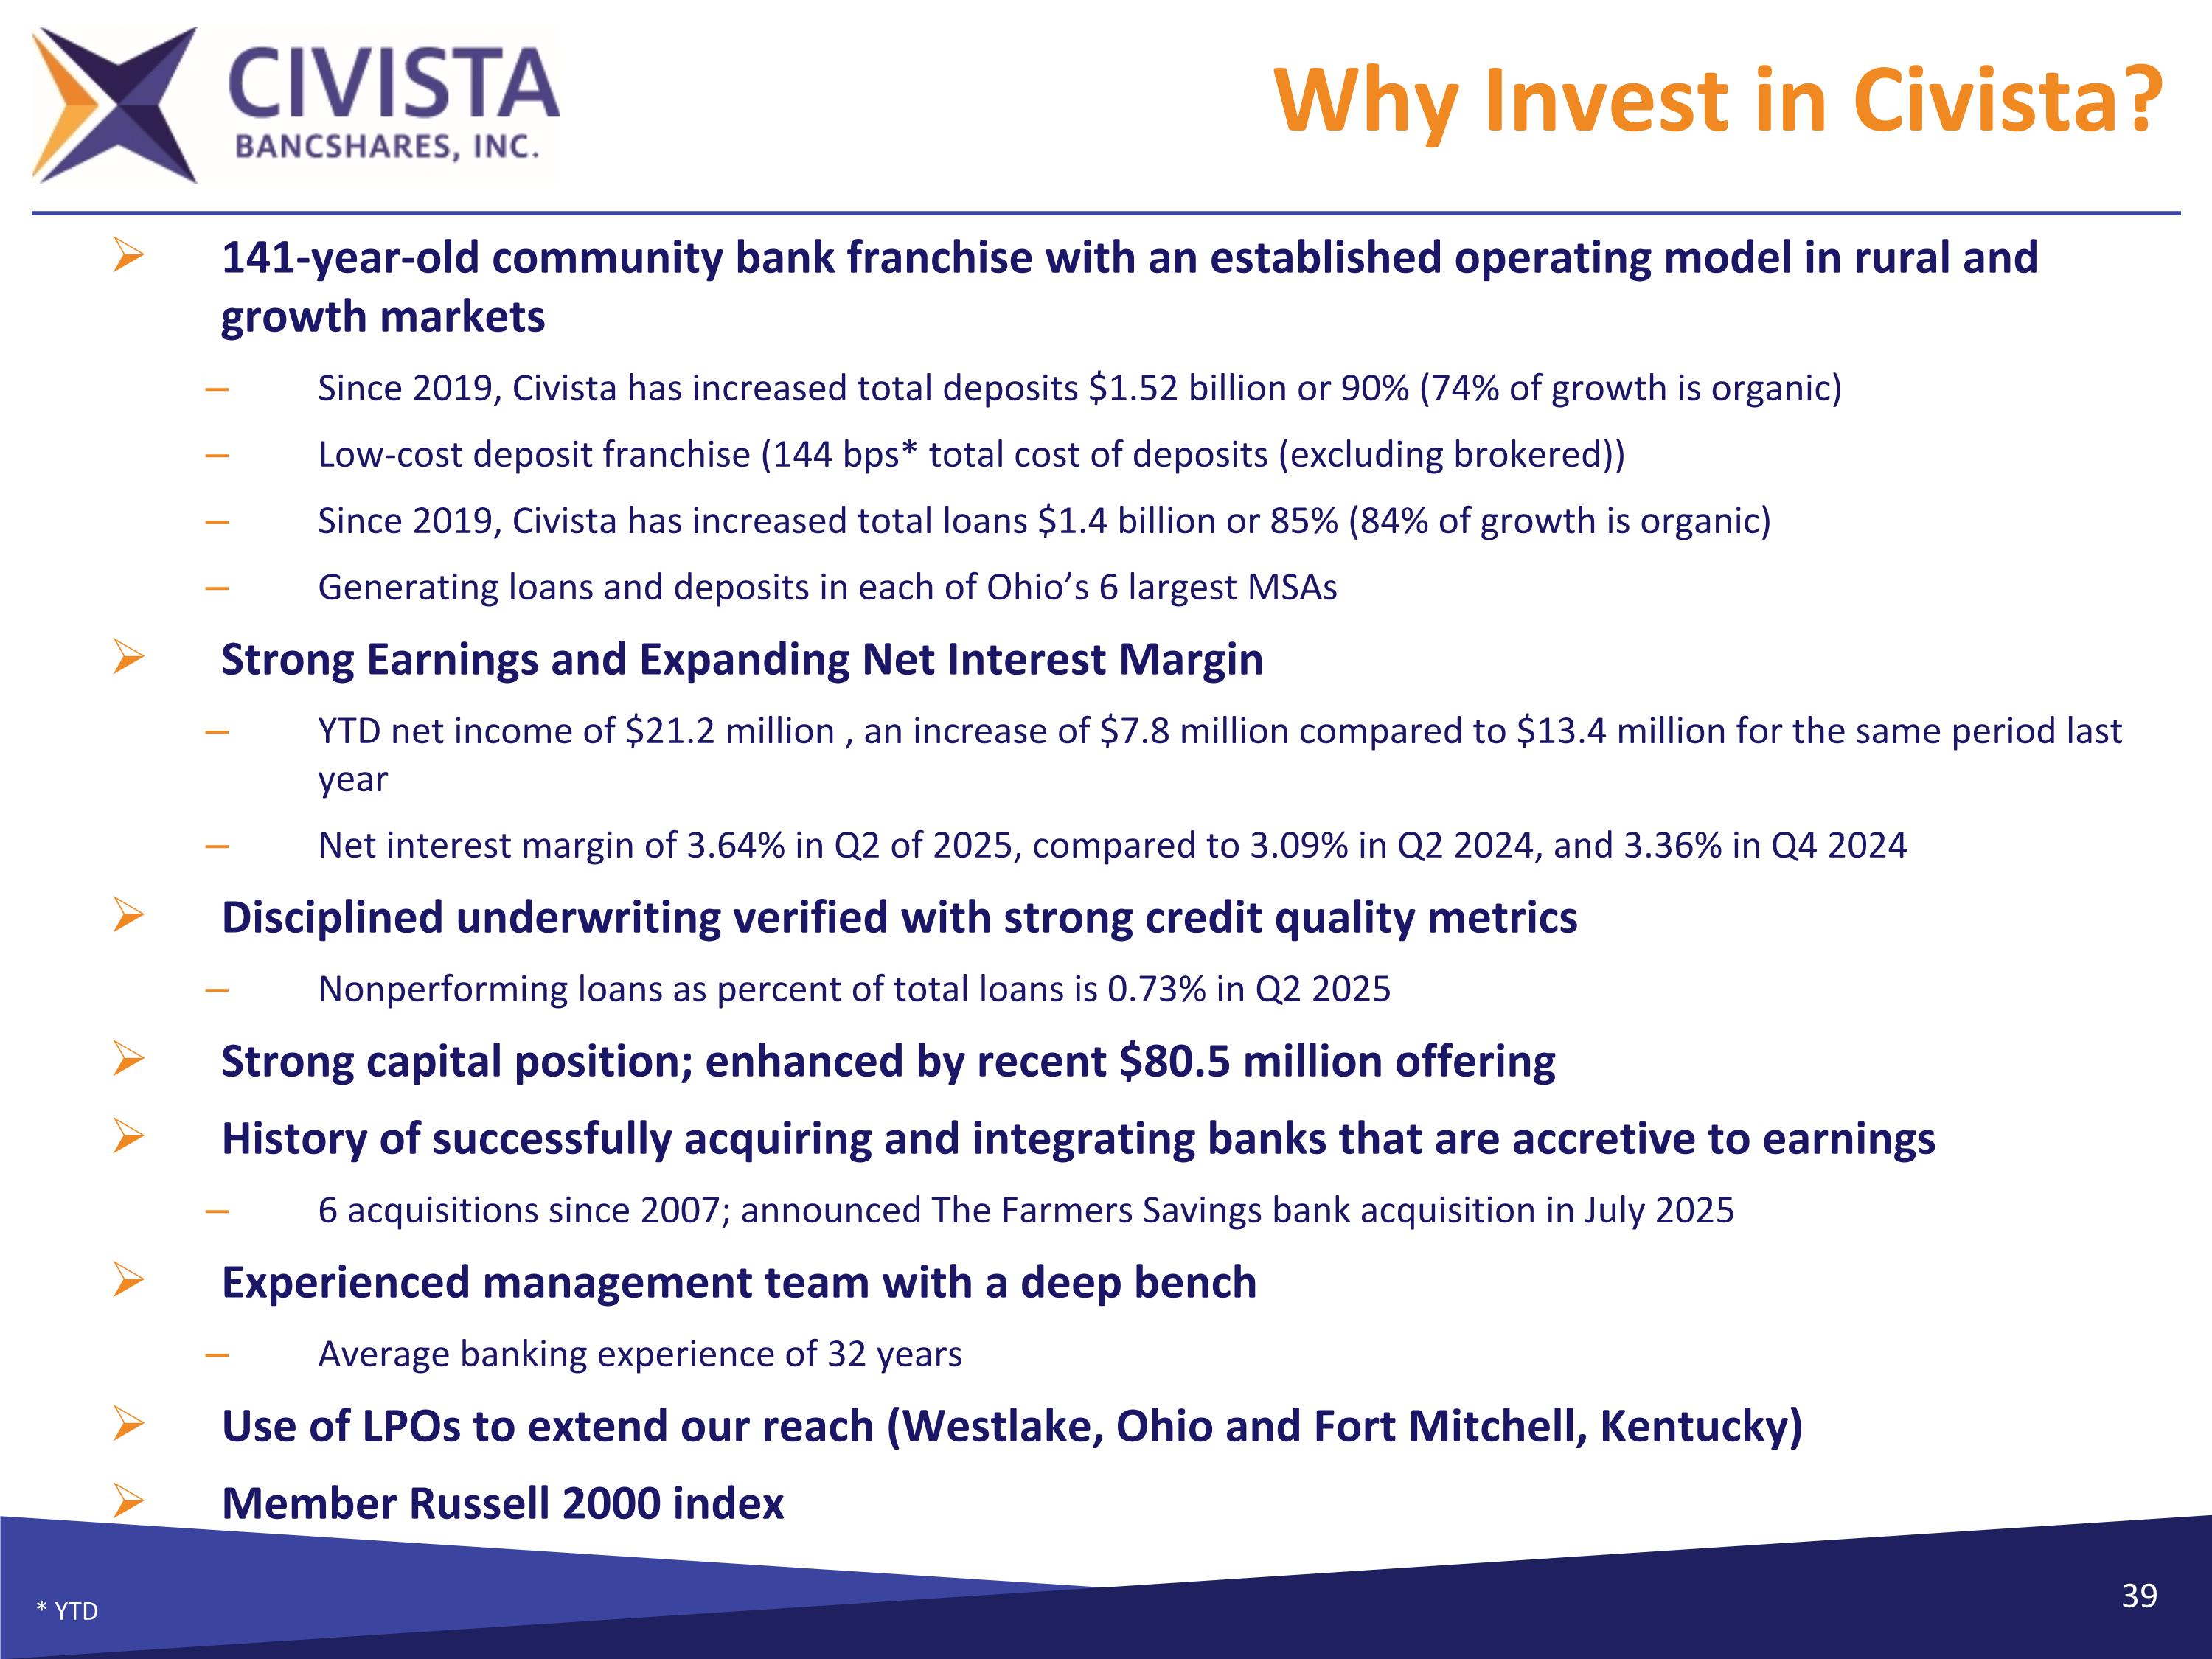
Why Invest in Civista? 141-year-old community bank franchise with an established operating model in rural and growth markets Since 2019, Civista has increased total deposits $1.52 billion or 90% (74% of growth is organic) Low-cost deposit franchise (144 bps* total cost of deposits (excluding brokered)) Since 2019, Civista has increased total loans $1.4 billion or 85% (84% of growth is organic) Generating loans and deposits in each of Ohio’s 6 largest MSAs Strong Earnings and Expanding Net Interest Margin YTD net income of $21.2 million , an increase of $7.8 million compared to $13.4 million for the same period last year Net interest margin of 3.64% in Q2 of 2025, compared to 3.09% in Q2 2024, and 3.36% in Q4 2024 Disciplined underwriting verified with strong credit quality metrics Nonperforming loans as percent of total loans is 0.73% in Q2 2025 Strong capital position; enhanced by recent $80.5 million offering History of successfully acquiring and integrating banks that are accretive to earnings 6 acquisitions since 2007; announced The Farmers Savings bank acquisition in July 2025 Experienced management team with a deep bench Average banking experience of 32 years Use of LPOs to extend our reach (Westlake, Ohio and Fort Mitchell, Kentucky) Member Russell 2000 index * YTD
Additional Information 40
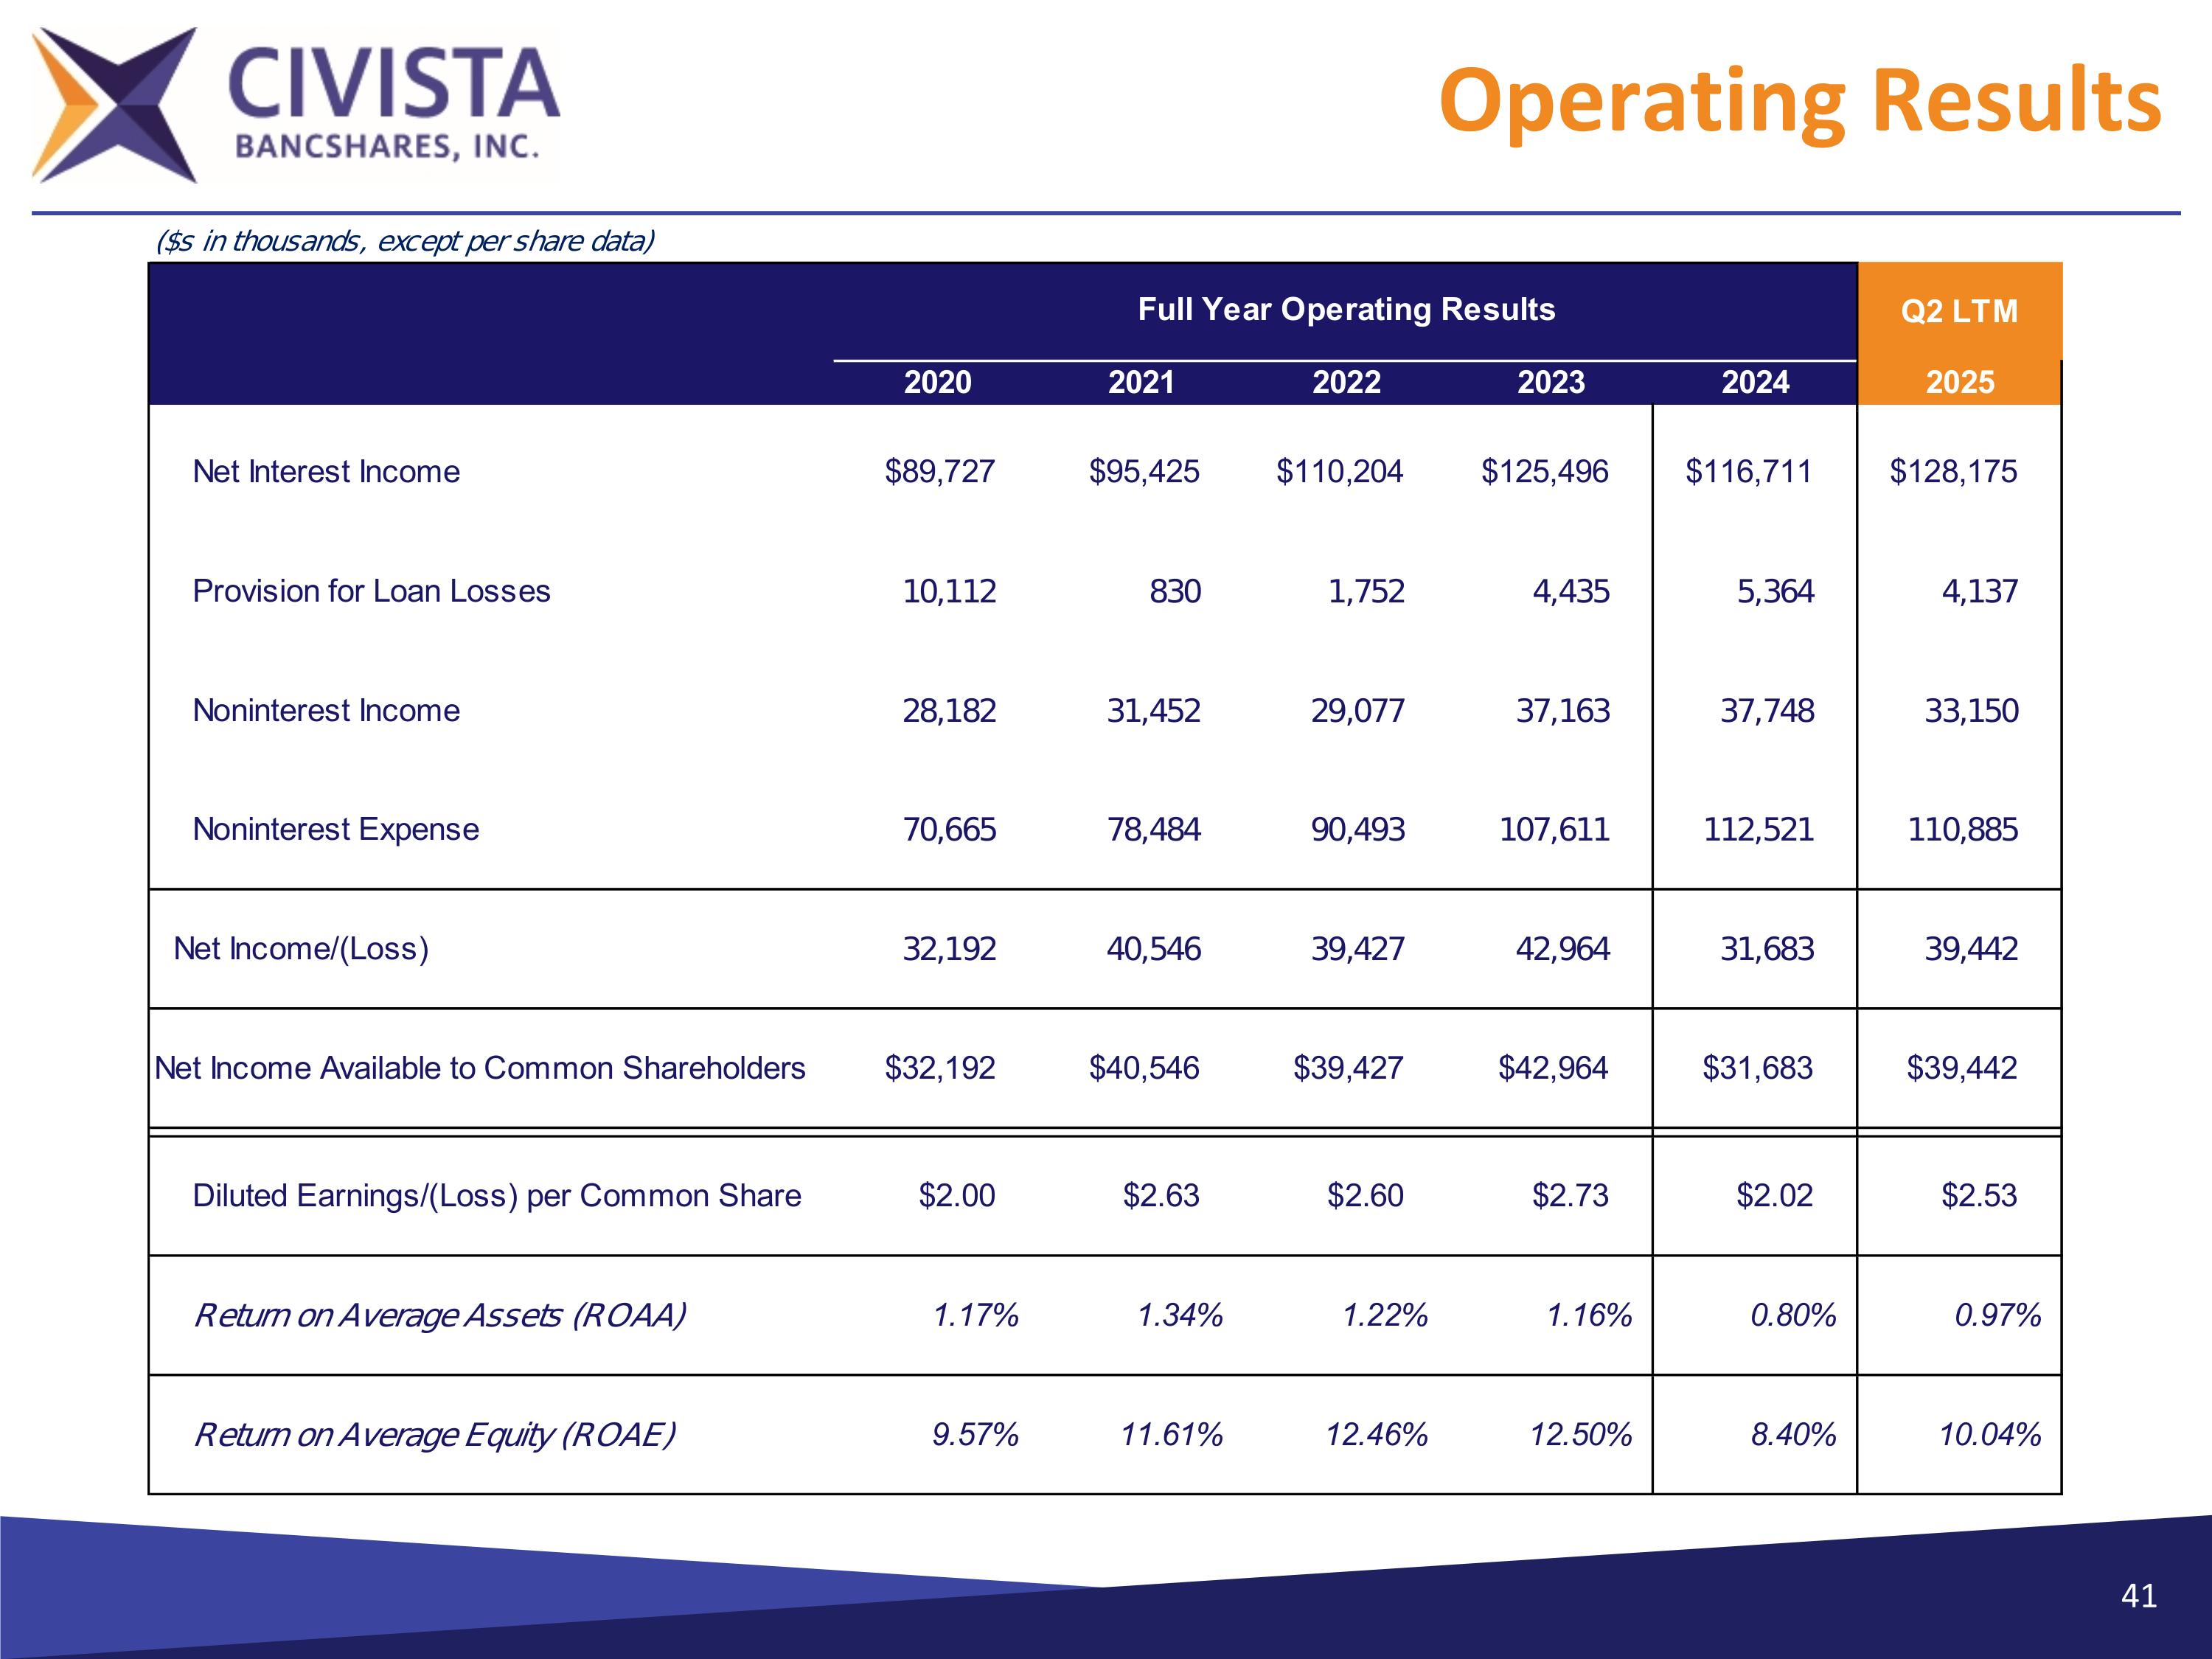
Operating Results
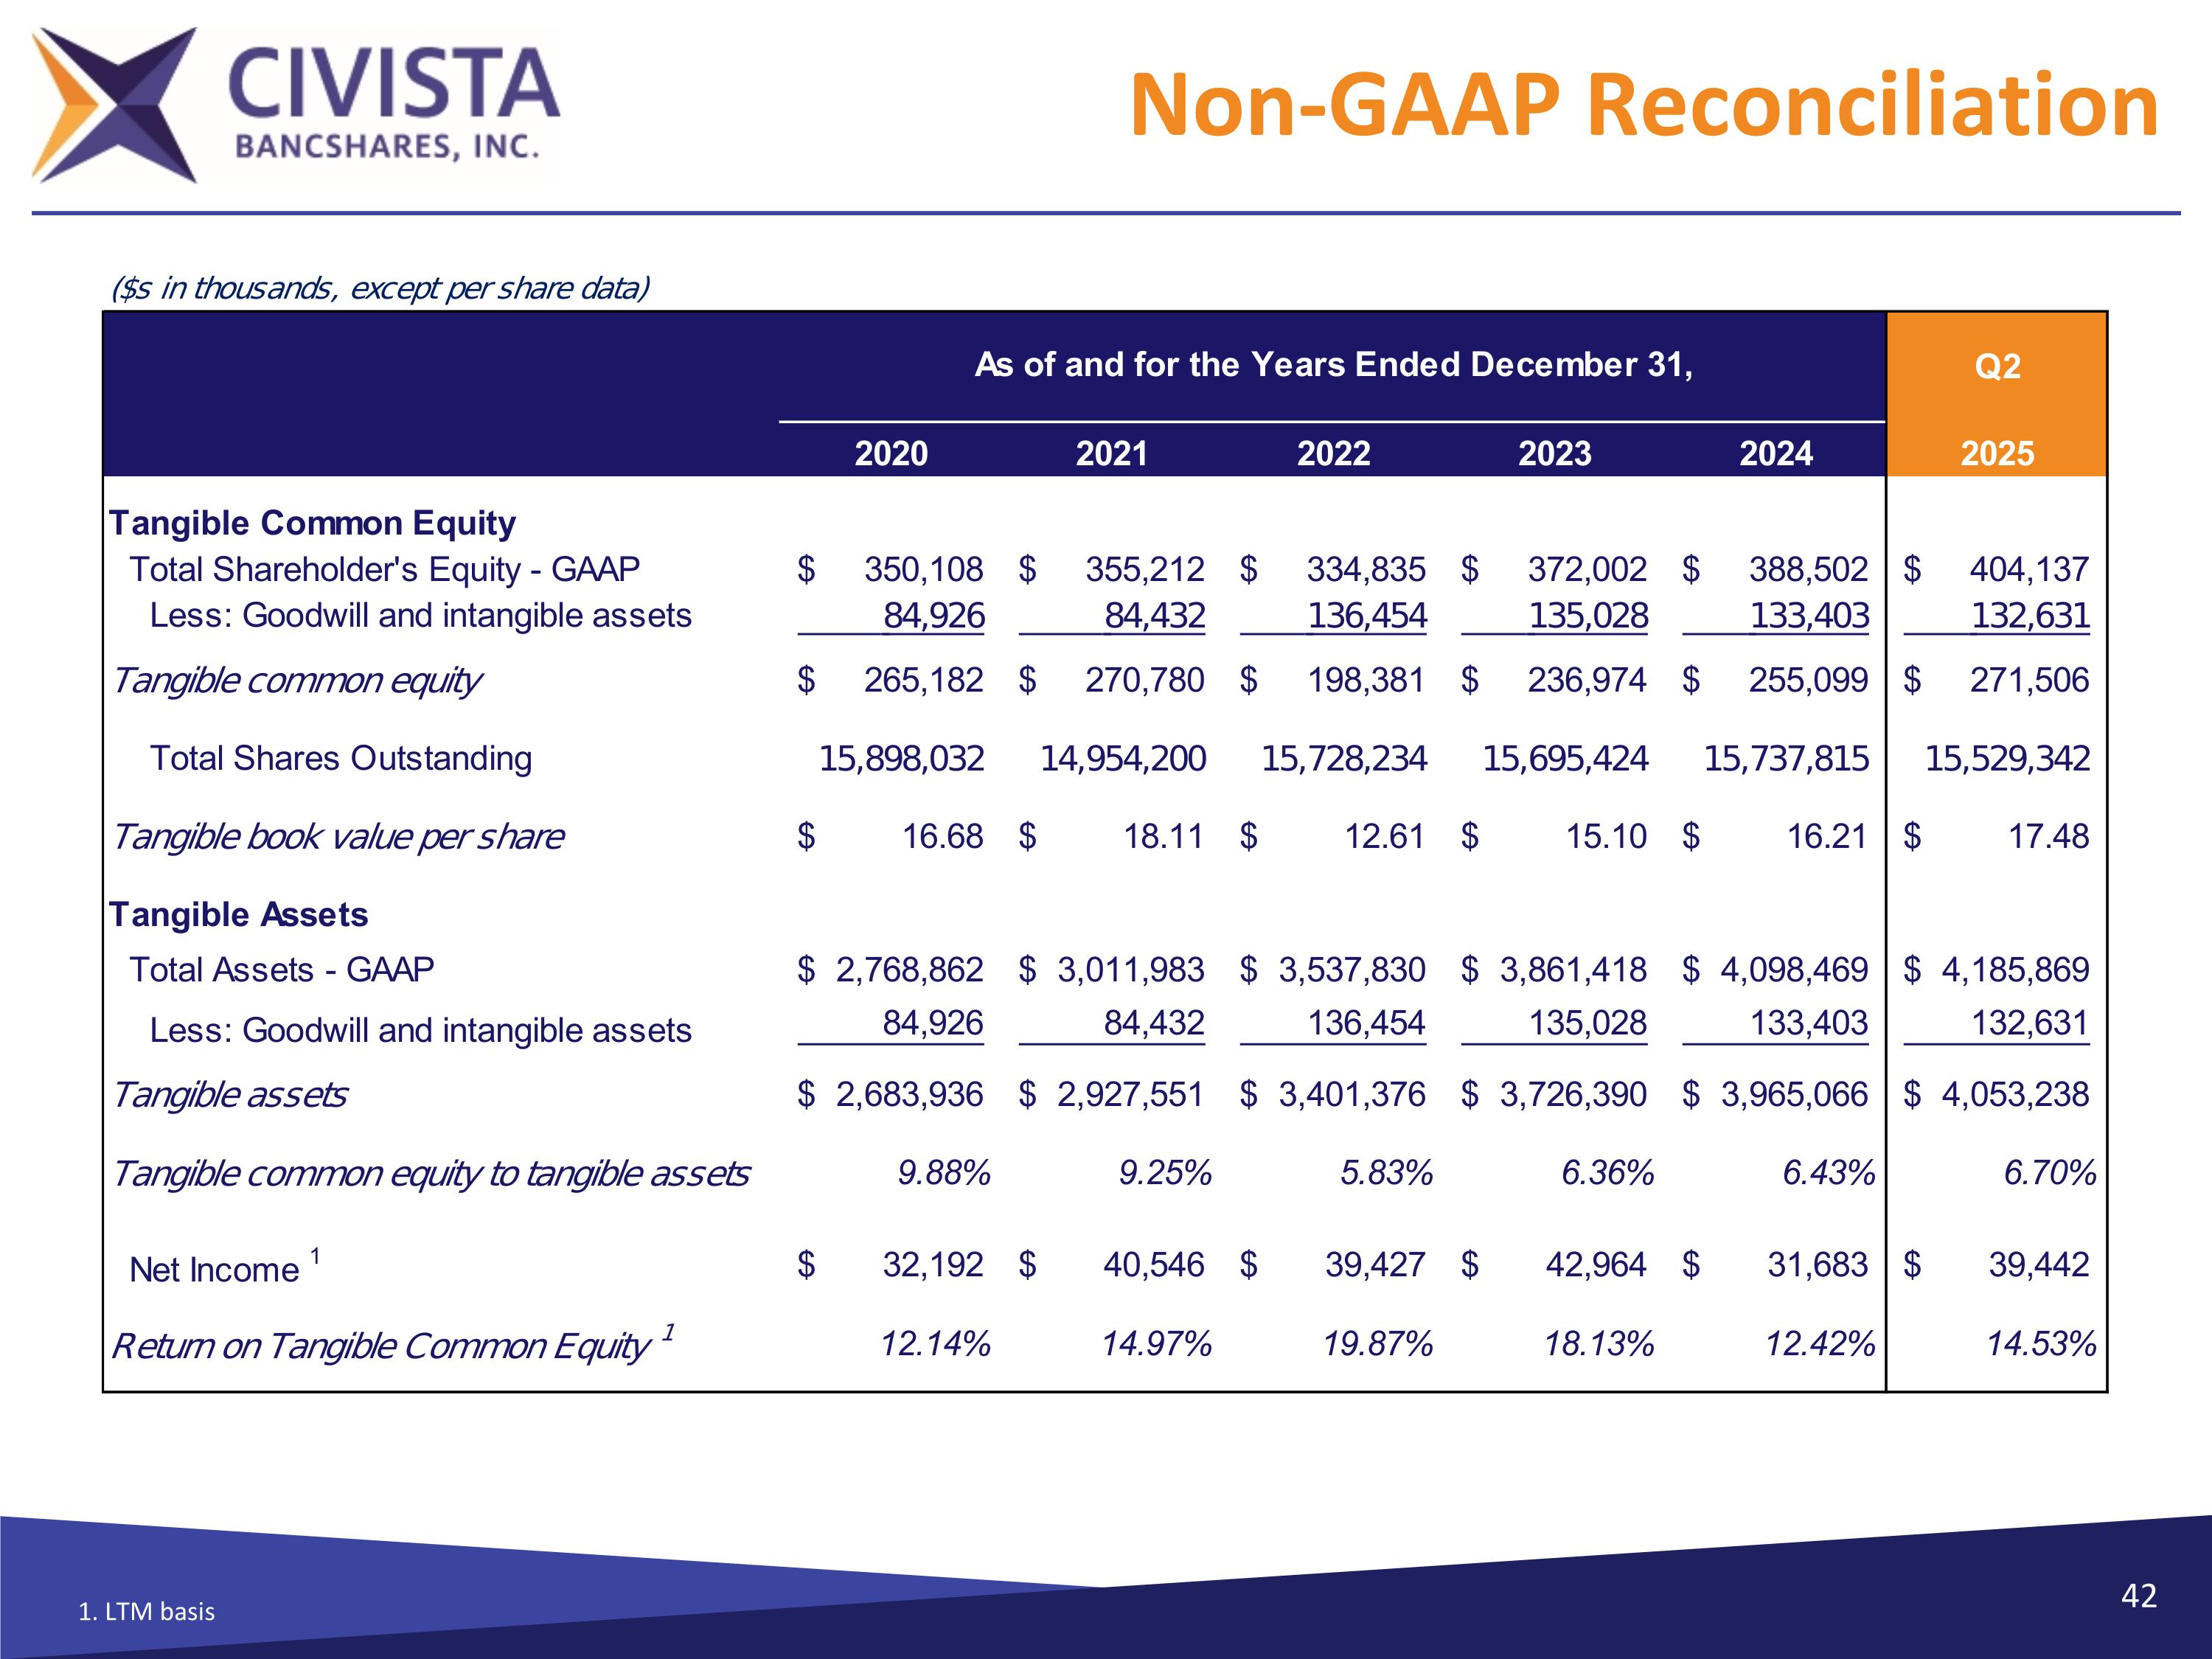
Non-GAAP Reconciliation 1. LTM basis
Thank You