Performance Management
|
Jul. 25, 2025 |
| T. Rowe Price Retirement Blend 2005 Fund |
|
| Prospectus [Line Items] |
|
| Bar Chart and Performance Table [Heading] |
Performance
|
| Performance Narrative [Text Block] |
The
following performance information provides some indication of the risks of investing in the fund. The fund’s performance
information represents only past performance (before and after taxes) and is not necessarily an indication of future results.
The
following bar chart illustrates how much returns can differ from year to year by showing calendar year returns and the best and
worst calendar quarter returns during those years for the fund’s Investor Class. Returns for other share classes vary since
they have different expenses.
|
| Performance Past Does Not Indicate Future [Text] |
The fund’s performance
information represents only past performance (before and after taxes) and is not necessarily an indication of future results.
|
| Performance Information Illustrates Variability of Returns [Text] |
The
following performance information provides some indication of the risks of investing in the fund.The
following bar chart illustrates how much returns can differ from year to year by showing calendar year returns and the best and
worst calendar quarter returns during those years for the fund’s Investor Class. Returns for other share classes vary since
they have different expenses.The
following table shows the average annual total returns for each class of the fund that has been in operation for at least one
full calendar year. The fund’s performance information included in the table is compared with a regulatory required index
that represents an overall securities market (Regulatory Benchmark). In addition, the table may also include one or more indexes
that more closely aligns to the fund’s investment strategy (Strategy Benchmark(s)).
|
| Bar Chart [Heading] |
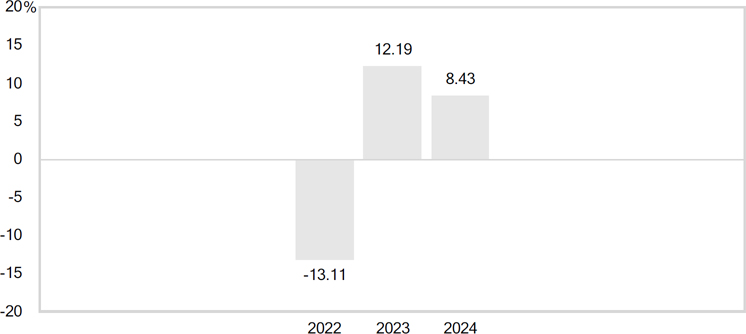
Calendar
Year Returns
|
| Bar Chart [Table] |
| |
|
| 2022 |
-13.11 |
| 2023 |
12.19 |
| 2024 |
8.43 |
|
| Bar Chart Closing [Text Block] |
| |
|
Quarter
Ended |
Total
Return |
|
|
Quarter
Ended |
Total
Return |
|
| |
Best
Quarter |
12/31/23 |
7.68% |
|
Worst
Quarter |
6/30/22 |
-9.15% |
|
The
fund’s return for the six months ended 6/30/25 was 5.76%.
|
| Year to Date Return, Label [Optional Text] |
The
fund’s return for the six months ended
|
| Bar Chart, Year to Date Return |
5.76%
|
| Bar Chart, Year to Date Return, Date |
Jun. 30, 2025
|
| Highest Quarterly Return, Label [Optional Text] |
Best
Quarter
|
| Highest Quarterly Return |
7.68%
|
| Highest Quarterly Return, Date |
Dec. 31, 2023
|
| Lowest Quarterly Return, Label [Optional Text] |
Worst
Quarter
|
| Lowest Quarterly Return |
(9.15%)
|
| Lowest Quarterly Return, Date |
Jun. 30, 2022
|
| Performance Table Heading |
Average
Annual Total ReturnsPeriods
endedDecember
31, 2024
|
| Performance Table Narrative |
The
following table shows the average annual total returns for each class of the fund that has been in operation for at least one
full calendar year. The fund’s performance information included in the table is compared with a regulatory required index
that represents an overall securities market (Regulatory Benchmark). In addition, the table may also include one or more indexes
that more closely aligns to the fund’s investment strategy (Strategy Benchmark(s)).
In
addition, the table shows hypothetical after-tax returns to demonstrate how taxes paid by a shareholder may influence returns.
After-tax returns are calculated using the historical highest individual federal marginal income tax rates and do not reflect
the impact of state and local taxes. Actual after-tax returns depend on an investor’s tax situation and may differ from
those shown. After-tax returns shown are not relevant to investors who hold their fund shares through tax-deferred arrangements,
such as a 401(k) account or an IRA. After-tax returns are shown only for the Investor Class and will differ for other share classes.
|
| Performance Table Uses Highest Federal Rate |
After-tax returns are calculated using the historical highest individual federal marginal income tax rates and do not reflect
the impact of state and local taxes.
|
| Performance Table Not Relevant to Tax Deferred |
Actual after-tax returns depend on an investor’s tax situation and may differ from
those shown. After-tax returns shown are not relevant to investors who hold their fund shares through tax-deferred arrangements,
such as a 401(k) account or an IRA.
|
| Performance [Table] |
| Average
Annual Total Returns |
|
|
|
|
|
|
| |
|
|
Periods
ended |
|
| |
|
|
December
31, 2024 |
|
| |
|
|
|
|
|
|
|
|
| |
|
|
|
|
|
Since |
Inception |
|
| |
|
|
1
Year |
|
|
inception |
date |
|
| |
Investor
Class |
|
|
|
|
|
07/26/2021 |
|
| |
|
Returns
before taxes |
8.43 |
% |
|
2.09 |
% |
|
|
|
| |
|
Returns
after taxes on distributions |
7.60 |
|
|
1.05 |
|
|
|
|
| |
|
Returns
after taxes on distributions and sale |
|
|
|
|
|
|
|
|
| |
|
of
fund shares |
5.10 |
|
|
1.21 |
|
|
|
|
| |
I
Class |
|
|
|
|
|
07/26/2021 |
|
| |
|
Returns
before taxes |
8.70 |
|
|
2.24 |
|
|
|
|
| |
|
|
|
|
|
|
|
|
|
|
| |
Regulatory
Benchmark |
|
|
|
| |
Bloomberg
U.S. Aggregate Bond Index (reflects no deduction for fees, expenses, or taxes) |
|
|
|
| |
|
1.25 |
|
|
-2.32 |
a |
|
|
|
| |
Strategy
Benchmark(s) |
|
|
|
| |
S&P
Target Date Retirement Income Index (reflects no deduction for fees, expenses, or taxes) |
|
|
|
| |
|
6.54 |
|
|
1.64 |
a |
|
|
|
|
| Performance Table One Class of after Tax Shown [Text] |
After-tax returns are shown only for the Investor Class and will differ for other share classes.
|
| Index No Deduction for Fees, Expenses, or Taxes [Text] |
(reflects no deduction for fees, expenses, or taxes)
|
| Performance Table Closing [Text Block] |
Updated
performance information is available through troweprice.com.
|
| Performance Availability Website Address [Text] |
troweprice.com
|
| T. Rowe Price Retirement Blend 2010 Fund |
|
| Prospectus [Line Items] |
|
| Bar Chart and Performance Table [Heading] |
Performance
|
| Performance Narrative [Text Block] |
The
following performance information provides some indication of the risks of investing in the fund. The fund’s performance
information represents only past performance (before and after taxes) and is not necessarily an indication of future results.
The
following bar chart illustrates how much returns can differ from year to year by showing calendar year returns and the best and
worst calendar quarter returns during those years for the fund’s Investor Class. Returns for other share classes vary since
they have different expenses.
|
| Performance Past Does Not Indicate Future [Text] |
The fund’s performance
information represents only past performance (before and after taxes) and is not necessarily an indication of future results.
|
| Performance Information Illustrates Variability of Returns [Text] |
The
following performance information provides some indication of the risks of investing in the fund.The
following bar chart illustrates how much returns can differ from year to year by showing calendar year returns and the best and
worst calendar quarter returns during those years for the fund’s Investor Class. Returns for other share classes vary since
they have different expenses.The
following table shows the average annual total returns for each class of the fund that has been in operation for at least one
full calendar year. The fund’s performance information included in the table is compared with a regulatory required index
that represents an overall securities market (Regulatory Benchmark). In addition, the table may also include one or more indexes
that more closely aligns to the fund’s investment strategy (Strategy Benchmark(s)).
|
| Bar Chart [Heading] |
Calendar Year Returns
|
| Bar Chart [Table] |
| |
|
| 2022 |
-13.64 |
| 2023 |
12.78 |
| 2024 |
8.86 |

|
| Bar Chart Closing [Text Block] |
| |
|
Quarter
Ended |
Total
Return |
|
|
Quarter
Ended |
Total
Return |
|
| |
Best
Quarter |
12/31/23 |
7.97% |
|
Worst
Quarter |
6/30/22 |
-9.46% |
|
The
fund’s return for the six months ended 6/30/25 was 5.88%.
|
| Year to Date Return, Label [Optional Text] |
The
fund’s return for the six months ended
|
| Bar Chart, Year to Date Return |
5.88%
|
| Bar Chart, Year to Date Return, Date |
Jun. 30, 2025
|
| Highest Quarterly Return, Label [Optional Text] |
Best
Quarter
|
| Highest Quarterly Return |
7.97%
|
| Highest Quarterly Return, Date |
Dec. 31, 2023
|
| Lowest Quarterly Return, Label [Optional Text] |
Worst
Quarter
|
| Lowest Quarterly Return |
(9.46%)
|
| Lowest Quarterly Return, Date |
Jun. 30, 2022
|
| Performance Table Heading |
Average
Annual Total ReturnsPeriods
endedDecember
31, 2024
|
| Performance Table Narrative |
The
following table shows the average annual total returns for each class of the fund that has been in operation for at least one
full calendar year. The fund’s performance information included in the table is compared with a regulatory required index
that represents an overall securities market (Regulatory Benchmark). In addition, the table may also include one or more indexes
that more closely aligns to the fund’s investment strategy (Strategy Benchmark(s)).
In
addition, the table shows hypothetical after-tax returns to demonstrate how taxes paid by a shareholder may influence returns.
After-tax returns are calculated using the historical highest individual federal marginal income tax rates and do not reflect
the impact of state and local taxes. Actual after-tax returns depend on an investor’s tax situation and may differ from
those shown. After-tax returns shown are not relevant to investors who hold their fund shares through tax-deferred arrangements,
such as a 401(k) account or an IRA. After-tax returns are shown only for the Investor Class and will differ for other share classes.
|
| Performance Table Uses Highest Federal Rate |
After-tax returns are calculated using the historical highest individual federal marginal income tax rates and do not reflect
the impact of state and local taxes.
|
| Performance Table Not Relevant to Tax Deferred |
Actual after-tax returns depend on an investor’s tax situation and may differ from
those shown. After-tax returns shown are not relevant to investors who hold their fund shares through tax-deferred arrangements,
such as a 401(k) account or an IRA.
|
| Performance [Table] |
| Average
Annual Total Returns |
|
|
|
|
| |
|
Periods
ended |
|
| |
|
December
31, 2024 |
|
| |
|
|
|
|
|
|
| |
|
|
|
Since |
Inception |
|
| |
|
1
Year |
|
inception |
date |
|
| |
Investor
Class |
|
|
|
|
07/26/2021 |
|
| |
Returns
before taxes |
8.86 |
% |
2.21 |
% |
|
|
| |
Returns
after taxes on distributions |
7.66 |
|
1.10 |
|
|
|
| |
Returns
after taxes on distributions and sale of
fund shares |
5.40 |
|
1.29 |
|
|
|
| |
I
Class |
|
|
|
|
07/26/2021 |
|
| |
Returns
before taxes |
9.02 |
|
2.38 |
|
|
|
| |
|
|
|
|
|
|
|
| |
Regulatory
Benchmark |
|
|
| |
Bloomberg
U.S. Aggregate Bond Index (reflects no deduction for fees, expenses, or taxes) |
|
|
| |
|
1.25 |
|
-2.32 |
a |
|
|
| |
Strategy
Benchmark(s) |
|
|
| |
S&P
Target Date 2010 Index (reflects no deduction for fees, expenses, or taxes) |
|
|
| |
|
6.74 |
|
1.83 |
a |
|
|
| |
|
|
|
|
|
|
|
|
| Performance Table One Class of after Tax Shown [Text] |
After-tax returns are shown only for the Investor Class and will differ for other share classes.
|
| Index No Deduction for Fees, Expenses, or Taxes [Text] |
(reflects no deduction for fees, expenses, or taxes)
|
| Performance Table Closing [Text Block] |
Updated
performance information is available through troweprice.com.
|
| Performance Availability Website Address [Text] |
troweprice.com
|
| T. Rowe Price Retirement Blend 2015 Fund |
|
| Prospectus [Line Items] |
|
| Bar Chart and Performance Table [Heading] |
Performance
|
| Performance Narrative [Text Block] |
The
following performance information provides some indication of the risks of investing in the fund. The fund’s performance
information represents only past performance (before and after taxes) and is not necessarily an indication of future results.
The
following bar chart illustrates how much returns can differ from year to year by showing calendar year returns and the best and
worst calendar quarter returns during those years for the fund’s Investor Class. Returns for other share classes vary since
they have different expenses.
|
| Performance Past Does Not Indicate Future [Text] |
The fund’s performance
information represents only past performance (before and after taxes) and is not necessarily an indication of future results.
|
| Performance Information Illustrates Variability of Returns [Text] |
The
following performance information provides some indication of the risks of investing in the fund.The
following bar chart illustrates how much returns can differ from year to year by showing calendar year returns and the best and
worst calendar quarter returns during those years for the fund’s Investor Class. Returns for other share classes vary since
they have different expenses.The
following table shows the average annual total returns for each class of the fund that has been in operation for at least one
full calendar year. The fund’s performance information included in the table is compared with a regulatory required index
that represents an overall securities market (Regulatory Benchmark). In addition, the table may also include one or more indexes
that more closely aligns to the fund’s investment strategy (Strategy Benchmark(s)).
|
| Bar Chart [Heading] |
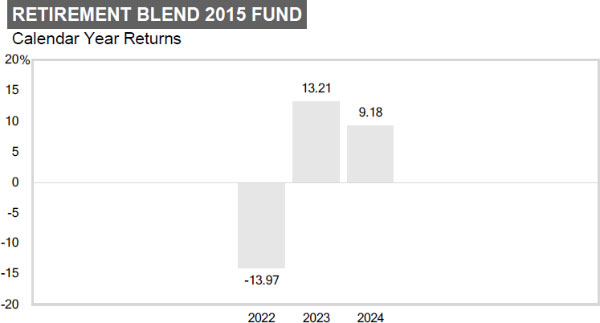
Calendar Year Returns
|
| Bar Chart [Table] |
| |
|
| 2022 |
-13.97 |
| 2023 |
13.21 |
| 2024 |
9.18 |
|
| Bar Chart Closing [Text Block] |
| |
|
Quarter
Ended |
Total
Return
|
|
|
Quarter
Ended |
Total
Return |
|
| |
Best
Quarter |
12/31/23 |
8.15% |
|
Worst
Quarter |
6/30/22 |
-9.88% |
|
The
fund’s return for the six months ended 6/30/25 was 6.05%.
|
| Year to Date Return, Label [Optional Text] |
The
fund’s return for the six months ended
|
| Bar Chart, Year to Date Return |
6.05%
|
| Bar Chart, Year to Date Return, Date |
Jun. 30, 2025
|
| Highest Quarterly Return, Label [Optional Text] |
Best
Quarter
|
| Highest Quarterly Return |
8.15%
|
| Highest Quarterly Return, Date |
Dec. 31, 2023
|
| Lowest Quarterly Return, Label [Optional Text] |
Worst
Quarter
|
| Lowest Quarterly Return |
(9.88%)
|
| Lowest Quarterly Return, Date |
Jun. 30, 2022
|
| Performance Table Heading |
Average
Annual Total ReturnsPeriods
endedDecember
31, 2024
|
| Performance Table Narrative |
The
following table shows the average annual total returns for each class of the fund that has been in operation for at least one
full calendar year. The fund’s performance information included in the table is compared with a regulatory required index
that represents an overall securities market (Regulatory Benchmark). In addition, the table may also include one or more indexes
that more closely aligns to the fund’s investment strategy (Strategy Benchmark(s)).
In
addition, the table shows hypothetical after-tax returns to demonstrate how taxes paid by a shareholder may influence returns.
After-tax returns are calculated using the historical highest individual federal marginal income tax rates and do not reflect
the impact of state and local taxes. Actual after-tax returns depend on an investor’s tax situation and may differ from
those shown. After-tax returns shown are not relevant to investors who hold their fund shares through tax-deferred arrangements,
such as a 401(k) account or an IRA. After-tax returns are shown only for the Investor Class and will differ for other share classes.
|
| Performance Table Uses Highest Federal Rate |
After-tax returns are calculated using the historical highest individual federal marginal income tax rates and do not reflect
the impact of state and local taxes.
|
| Performance Table Not Relevant to Tax Deferred |
Actual after-tax returns depend on an investor’s tax situation and may differ from
those shown. After-tax returns shown are not relevant to investors who hold their fund shares through tax-deferred arrangements,
such as a 401(k) account or an IRA.
|
| Performance [Table] |
| Average
Annual Total Returns |
|
|
|
|
|
| |
|
|
Periods
ended |
|
| |
|
|
December
31, 2024 |
|
| |
|
|
|
|
|
|
|
|
|
| |
|
|
|
|
|
|
Since |
Inception |
|
| |
|
|
1
Year |
|
|
|
inception |
date |
|
| |
Investor
Class |
|
|
|
|
|
|
07/26/2021 |
|
| |
|
Returns
before taxes |
9.18 |
% |
|
|
2.34 |
% |
|
|
| |
|
Returns
after taxes on distributions |
8.00 |
|
|
|
1.25 |
|
|
|
| |
|
Returns
after taxes on distributions and sale |
|
|
|
|
|
|
|
|
| |
|
of
fund shares |
5.61 |
|
|
|
1.40 |
|
|
|
| |
I
Class |
|
|
|
|
|
|
07/26/2021 |
|
| |
|
Returns
before taxes |
9.33 |
|
|
|
2.52 |
|
|
|
| |
|
|
|
|
|
|
|
|
|
|
| |
Regulatory
Benchmark |
|
|
| |
Bloomberg
U.S. Aggregate Bond Index (reflects no deduction for fees, expenses, or taxes) |
|
|
| |
|
1.25 |
|
|
|
-2.32 |
a |
|
|
| |
Strategy
Benchmark(s) |
|
|
| |
S&P
Target Date 2015 Index (reflects no deduction for fees, expenses, or taxes) |
|
|
| |
|
7.25 |
|
|
|
2.04 |
a |
|
|
| |
|
|
|
|
|
|
|
|
|
|
|
| Performance Table One Class of after Tax Shown [Text] |
After-tax returns are shown only for the Investor Class and will differ for other share classes.
|
| Index No Deduction for Fees, Expenses, or Taxes [Text] |
(reflects no deduction for fees, expenses, or taxes)
|
| Performance Table Closing [Text Block] |
Updated
performance information is available through troweprice.com.
|
| Performance Availability Website Address [Text] |
troweprice.com
|
| T. Rowe Price Retirement Blend 2020 Fund |
|
| Prospectus [Line Items] |
|
| Bar Chart and Performance Table [Heading] |
Performance
|
| Performance Narrative [Text Block] |
The
following performance information provides some indication of the risks of investing in the fund. The fund’s performance
information represents only past performance (before and after taxes) and is not necessarily an indication of future results.
The
following bar chart illustrates how much returns can differ from year to year by showing calendar year returns and the best and
worst calendar quarter returns during those years for the fund’s Investor Class. Returns for other share classes vary since
they have different expenses.
|
| Performance Past Does Not Indicate Future [Text] |
The fund’s performance
information represents only past performance (before and after taxes) and is not necessarily an indication of future results.
|
| Performance Information Illustrates Variability of Returns [Text] |
The
following performance information provides some indication of the risks of investing in the fund.The
following bar chart illustrates how much returns can differ from year to year by showing calendar year returns and the best and
worst calendar quarter returns during those years for the fund’s Investor Class. Returns for other share classes vary since
they have different expenses.The
following table shows the average annual total returns for each class of the fund that has been in operation for at least one
full calendar year. The fund’s performance information included in the table is compared with a regulatory required index
that represents an overall securities market (Regulatory Benchmark). In addition, the table may also include one or more indexes
that more closely aligns to the fund’s investment strategy (Strategy Benchmark(s)).
|
| Bar Chart [Heading] |
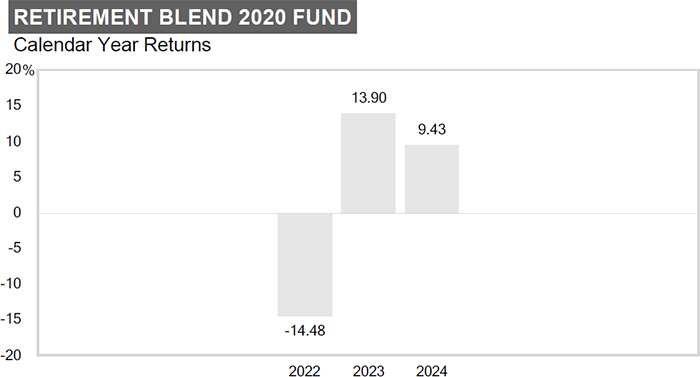
Calendar
Year Returns
|
| Bar Chart [Table] |
| |
|
| 2022 |
-14.48 |
| 2023 |
13.90 |
| 2024 |
9.43 |
|
| Bar Chart Closing [Text Block] |
| |
|
Quarter
Ended |
Total
Return |
|
|
Quarter
Ended |
Total
Return |
|
| |
Best
Quarter |
12/31/23 |
8.42% |
|
Worst
Quarter |
6/30/22 |
-10.39% |
|
The
fund’s return for the six months ended 6/30/25 was 6.30%.
|
| Year to Date Return, Label [Optional Text] |
The
fund’s return for the six months ended
|
| Bar Chart, Year to Date Return |
6.30%
|
| Bar Chart, Year to Date Return, Date |
Jun. 30, 2025
|
| Highest Quarterly Return, Label [Optional Text] |
Best
Quarter
|
| Highest Quarterly Return |
8.42%
|
| Highest Quarterly Return, Date |
Dec. 31, 2023
|
| Lowest Quarterly Return, Label [Optional Text] |
Worst
Quarter
|
| Lowest Quarterly Return |
(10.39%)
|
| Lowest Quarterly Return, Date |
Jun. 30, 2022
|
| Performance Table Heading |
Average
Annual Total ReturnsPeriods
endedDecember
31, 2024
|
| Performance Table Narrative |
The
following table shows the average annual total returns for each class of the fund that has been in operation for at least one
full calendar year. The fund’s performance information included in the table is compared with a regulatory required index
that represents an overall securities market (Regulatory Benchmark). In addition, the table may also include one or more indexes
that more closely aligns to the fund’s investment strategy (Strategy Benchmark(s)).
In
addition, the table shows hypothetical after-tax returns to demonstrate how taxes paid by a shareholder may influence returns.
After-tax returns are calculated using the historical highest individual federal marginal income tax rates and do not reflect
the impact of state and local taxes. Actual after-tax returns depend on an investor’s tax situation and may differ from
those shown. After-tax returns shown are not relevant to investors who hold their fund shares through tax-deferred arrangements,
such as a 401(k) account or an IRA. After-tax returns are shown only for the Investor Class and will differ for other share classes.
|
| Performance Table Uses Highest Federal Rate |
After-tax returns are calculated using the historical highest individual federal marginal income tax rates and do not reflect
the impact of state and local taxes.
|
| Performance Table Not Relevant to Tax Deferred |
Actual after-tax returns depend on an investor’s tax situation and may differ from
those shown. After-tax returns shown are not relevant to investors who hold their fund shares through tax-deferred arrangements,
such as a 401(k) account or an IRA.
|
| Performance [Table] |
| Average
Annual Total Returns |
|
|
|
|
|
|
| |
|
|
Periods
ended |
|
| |
|
|
December
31, 2024 |
|
| |
|
|
|
|
|
|
|
|
|
| |
|
|
|
|
|
|
Since |
Inception |
|
| |
|
|
1
Year |
|
|
|
inception |
date |
|
| |
Investor
Class |
|
|
|
|
|
|
07/26/2021 |
|
| |
|
Returns
before taxes |
9.43 |
% |
|
|
2.49 |
% |
|
|
|
| |
|
Returns
after taxes on distributions |
8.36 |
|
|
|
1.47 |
|
|
|
|
| |
|
Returns
after taxes on distributions and sale |
|
|
|
|
|
|
|
|
|
| |
|
of
fund shares |
5.76 |
|
|
|
1.56 |
|
|
|
|
| |
I
Class |
|
|
|
|
|
|
07/26/2021 |
|
| |
|
Returns
before taxes |
9.74 |
|
|
|
2.63 |
|
|
|
|
| |
|
|
|
|
|
|
|
|
|
|
|
| |
Regulatory
Benchmark |
|
|
|
| |
Bloomberg
U.S. Aggregate Bond Index (reflects no deduction for fees, expenses, or taxes) |
|
|
|
| |
|
1.25 |
|
|
|
-2.32 |
a |
|
|
|
| |
Strategy
Benchmark(s) |
|
|
|
| |
S&P
Target Date 2020 Index (reflects no deduction for fees, expenses, or taxes) |
|
|
|
| |
|
8.09 |
|
|
|
2.39 |
a |
|
|
|
| |
|
|
|
|
|
|
|
|
|
|
|
|
| Performance Table One Class of after Tax Shown [Text] |
After-tax returns are shown only for the Investor Class and will differ for other share classes.
|
| Index No Deduction for Fees, Expenses, or Taxes [Text] |
(reflects no deduction for fees, expenses, or taxes)
|
| Performance Table Closing [Text Block] |
Updated
performance information is available through troweprice.com.
|
| Performance Availability Website Address [Text] |
troweprice.com
|
| T. Rowe Price Retirement Blend 2025 Fund |
|
| Prospectus [Line Items] |
|
| Bar Chart and Performance Table [Heading] |
Performance
|
| Performance Narrative [Text Block] |
The
following performance information provides some indication of the risks of investing in the fund. The fund’s performance
information represents only past performance (before and after taxes) and is not necessarily an indication of future results.
The
following bar chart illustrates how much returns can differ from year to year by showing calendar year returns and the best and
worst calendar quarter returns during those years for the fund’s Investor Class. Returns for other share classes vary since
they have different expenses.
|
| Performance Past Does Not Indicate Future [Text] |
The fund’s performance
information represents only past performance (before and after taxes) and is not necessarily an indication of future results.
|
| Performance Information Illustrates Variability of Returns [Text] |
The
following performance information provides some indication of the risks of investing in the fund.The
following bar chart illustrates how much returns can differ from year to year by showing calendar year returns and the best and
worst calendar quarter returns during those years for the fund’s Investor Class. Returns for other share classes vary since
they have different expenses.The
following table shows the average annual total returns for each class of the fund that has been in operation for at least one
full calendar year. The fund’s performance information included in the table is compared with a regulatory required index
that represents an overall securities market (Regulatory Benchmark). In addition, the table may also include one or more indexes
that more closely aligns to the fund’s investment strategy (Strategy Benchmark(s)).
|
| Bar Chart [Heading] |
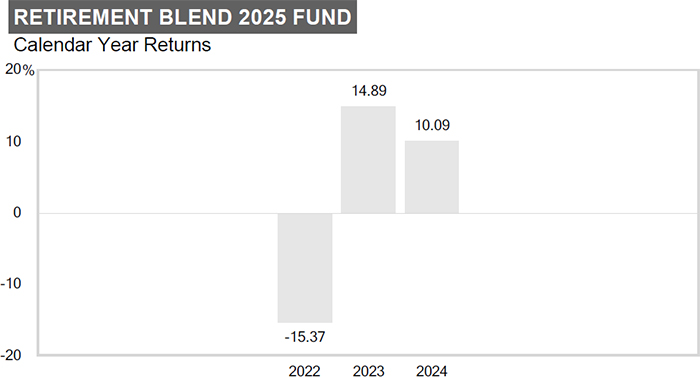
Calendar Year Returns
|
| Bar Chart [Table] |
| |
|
| 2022 |
-15.37 |
| 2023 |
14.89 |
| 2024 |
10.09 |
|
| Bar Chart Closing [Text Block] |
| |
|
Quarter
Ended |
Total
Return |
|
|
Quarter
Ended |
Total
Return |
|
| |
Best
Quarter |
12/31/23 |
8.82% |
|
Worst
Quarter |
6/30/22 |
-11.26% |
|
The
fund’s return for the six months ended 6/30/25 was 6.33%.
|
| Year to Date Return, Label [Optional Text] |
The
fund’s return for the six months ended
|
| Bar Chart, Year to Date Return |
6.33%
|
| Bar Chart, Year to Date Return, Date |
Jun. 30, 2025
|
| Highest Quarterly Return, Label [Optional Text] |
Best
Quarter
|
| Highest Quarterly Return |
8.82%
|
| Highest Quarterly Return, Date |
Dec. 31, 2023
|
| Lowest Quarterly Return, Label [Optional Text] |
Worst
Quarter
|
| Lowest Quarterly Return |
(11.26%)
|
| Lowest Quarterly Return, Date |
Jun. 30, 2022
|
| Performance Table Heading |
Average
Annual Total ReturnsPeriods
endedDecember
31, 2024
|
| Performance Table Narrative |
The
following table shows the average annual total returns for each class of the fund that has been in operation for at least one
full calendar year. The fund’s performance information included in the table is compared with a regulatory required index
that represents an overall securities market (Regulatory Benchmark). In addition, the table may also include one or more indexes
that more closely aligns to the fund’s investment strategy (Strategy Benchmark(s)).
In
addition, the table shows hypothetical after-tax returns to demonstrate how taxes paid by a shareholder may influence returns.
After-tax returns are calculated using the historical highest individual federal marginal income tax rates and do not reflect
the impact of state and local taxes. Actual after-tax returns depend on an investor’s tax situation and may differ from
those shown. After-tax returns shown are not relevant to investors who hold their fund shares through tax-deferred arrangements,
such as a 401(k) account or an IRA. After-tax returns are shown only for the Investor Class and will differ for other share classes.
|
| Performance Table Uses Highest Federal Rate |
After-tax returns are calculated using the historical highest individual federal marginal income tax rates and do not reflect
the impact of state and local taxes.
|
| Performance Table Not Relevant to Tax Deferred |
Actual after-tax returns depend on an investor’s tax situation and may differ from
those shown. After-tax returns shown are not relevant to investors who hold their fund shares through tax-deferred arrangements,
such as a 401(k) account or an IRA.
|
| Performance [Table] |
| Average
Annual Total Returns |
|
|
|
|
|
|
| |
|
|
Periods
ended |
|
| |
|
|
December
31, 2024 |
|
| |
|
|
|
|
|
|
|
|
|
| |
|
|
|
|
|
|
Since |
Inception |
|
| |
|
|
1
Year |
|
|
|
inception |
date |
|
| |
Investor
Class |
|
|
|
|
|
|
07/26/2021 |
|
| |
|
Returns
before taxes |
10.09 |
% |
|
|
2.68 |
% |
|
|
|
| |
|
Returns
after taxes on distributions |
9.14 |
|
|
|
1.73 |
|
|
|
|
| |
|
Returns
after taxes on distributions and sale |
|
|
|
|
|
|
|
|
|
| |
|
of
fund shares |
6.15 |
|
|
|
1.74 |
|
|
|
|
| |
I
Class |
|
|
|
|
|
|
07/26/2021 |
|
| |
|
Returns
before taxes |
10.27 |
|
|
|
2.80 |
|
|
|
|
| |
|
|
|
|
|
|
|
|
|
|
|
| |
Regulatory
Benchmark |
|
|
|
| |
Russell
3000® Index (reflects no deduction for fees, expenses, or taxes) |
|
|
|
| |
|
23.81 |
|
|
|
9.04 |
a |
|
|
|
| |
Strategy
Benchmark(s) |
|
|
|
| |
S&P
Target Date 2025 Index (reflects no deduction for fees, expenses, or taxes) |
|
|
|
| |
|
8.44 |
|
|
|
2.65 |
a |
|
|
|
| |
|
|
|
|
|
|
|
|
|
|
|
|
| Performance Table One Class of after Tax Shown [Text] |
After-tax returns are shown only for the Investor Class and will differ for other share classes.
|
| Index No Deduction for Fees, Expenses, or Taxes [Text] |
(reflects no deduction for fees, expenses, or taxes)
|
| Performance Table Closing [Text Block] |
Updated
performance information is available through troweprice.com.
|
| Performance Availability Website Address [Text] |
troweprice.com
|
| T. Rowe Price Retirement Blend 2030 Fund |
|
| Prospectus [Line Items] |
|
| Bar Chart and Performance Table [Heading] |
Performance
|
| Performance Narrative [Text Block] |
The following performance information provides some indication
of the risks of investing in the fund. The fund’s performance information represents only past performance (before and after
taxes) and is not necessarily an indication of future results.
The
following bar chart illustrates how much returns can differ from year to year by showing calendar year returns and the best and
worst calendar quarter returns during those years for the fund’s Investor Class. Returns for other share classes vary since
they have different expenses.
|
| Performance Past Does Not Indicate Future [Text] |
The fund’s performance information represents only past performance (before and after
taxes) and is not necessarily an indication of future results.
|
| Performance Information Illustrates Variability of Returns [Text] |
The following performance information provides some indication
of the risks of investing in the fund.The
following bar chart illustrates how much returns can differ from year to year by showing calendar year returns and the best and
worst calendar quarter returns during those years for the fund’s Investor Class. Returns for other share classes vary since
they have different expenses.The
following table shows the average annual total returns for each class of the fund that has been in operation for at least one
full calendar year. The fund’s performance information included in the table is compared with a regulatory required index
that represents an overall securities market (Regulatory Benchmark). In addition, the table may also include one or more indexes
that more closely aligns to the fund’s investment strategy (Strategy Benchmark(s)).
|
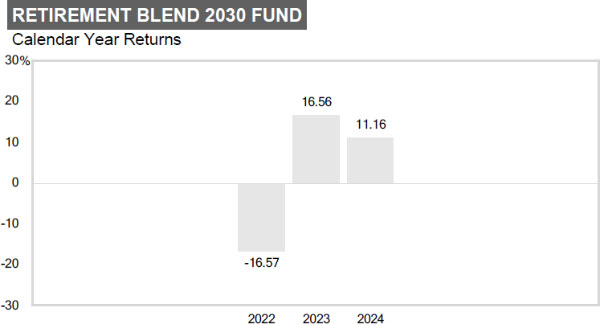
| Bar Chart [Heading] |
Calendar Year Returns
|
| Bar Chart [Table] |
| |
|
| 2022 |
-16.57 |
| 2023 |
16.56 |
| 2024 |
11.16 |
|
| Bar Chart Closing [Text Block] |
| |
|
Quarter
Ended |
Total
Return
|
|
|
Quarter
Ended |
Total
Return
|
|
| |
Best
Quarter |
12/31/23 |
9.50% |
|
Worst
Quarter |
6/30/22 |
-12.50% |
|
The fund’s return for the six months
ended 6/30/25 was 7.06%.
|
| Year to Date Return, Label [Optional Text] |
The fund’s return for the six months
ended
|
| Bar Chart, Year to Date Return |
7.06%
|
| Bar Chart, Year to Date Return, Date |
Jun. 30, 2025
|
| Highest Quarterly Return, Label [Optional Text] |
Best
Quarter
|
| Highest Quarterly Return |
9.50%
|
| Highest Quarterly Return, Date |
Dec. 31, 2023
|
| Lowest Quarterly Return, Label [Optional Text] |
Worst
Quarter
|
| Lowest Quarterly Return |
(12.50%)
|
| Lowest Quarterly Return, Date |
Jun. 30, 2022
|
| Performance Table Heading |
Average
Annual Total ReturnsPeriods
endedDecember
31, 2024
|
| Performance Table Narrative |
The
following table shows the average annual total returns for each class of the fund that has been in operation for at least one
full calendar year. The fund’s performance information included in the table is compared with a regulatory required index
that represents an overall securities market (Regulatory Benchmark). In addition, the table may also include one or more indexes
that more closely aligns to the fund’s investment strategy (Strategy Benchmark(s)).
In
addition, the table shows hypothetical after-tax returns to demonstrate how taxes paid by a shareholder may influence returns.
After-tax returns are calculated using the historical highest individual federal marginal income tax rates and do not reflect
the impact of state and local taxes. Actual after-tax returns depend on an investor’s tax situation and may differ from
those shown. After-tax returns shown are not relevant to investors who hold their fund shares through tax-deferred arrangements,
such as a 401(k) account or an IRA. After-tax returns are shown only for the Investor Class and will differ for other share classes.
|
| Performance Table Uses Highest Federal Rate |
After-tax returns are calculated using the historical highest individual federal marginal income tax rates and do not reflect
the impact of state and local taxes.
|
| Performance Table Not Relevant to Tax Deferred |
Actual after-tax returns depend on an investor’s tax situation and may differ from
those shown. After-tax returns shown are not relevant to investors who hold their fund shares through tax-deferred arrangements,
such as a 401(k) account or an IRA.
|
| Performance [Table] |
| Average
Annual Total Returns |
|
|
|
|
|
| |
|
|
Periods
ended |
|
| |
|
|
December
31, 2024 |
|
| |
|
|
|
|
|
|
|
|
|
| |
|
|
|
|
|
|
Since |
Inception |
|
| |
|
|
1 Year |
|
|
|
inception |
date |
|
| |
Investor Class |
|
|
|
|
|
|
07/26/2021 |
|
| |
|
Returns before taxes |
11.16 |
% |
|
|
3.10 |
% |
|
|
| |
|
Returns after taxes on distributions |
10.34 |
|
|
|
2.31 |
|
|
|
| |
|
Returns after taxes on distributions
and sale |
|
|
|
|
|
|
|
|
| |
|
of fund shares |
6.82 |
|
|
|
2.15 |
|
|
|
| |
I Class |
|
|
|
|
|
|
07/26/2021 |
|
| |
|
Returns before
taxes |
11.30 |
|
|
|
3.30 |
|
|
|
| |
|
|
|
|
|
|
|
|
|
|
| |
Regulatory Benchmark |
|
|
| |
Russell
3000® Index (reflects no deduction for fees, expenses,
or taxes) |
|
|
| |
|
23.81 |
|
|
|
9.04 |
a |
|
|
| |
Strategy Benchmark(s) |
|
|
| |
S&P
Target Date 2030 Index (reflects no deduction for fees, expenses, or taxes) |
|
|
| |
|
9.90 |
|
|
|
3.38 |
a |
|
|
| |
|
|
|
|
|
|
|
|
|
|
|
| Performance Table One Class of after Tax Shown [Text] |
After-tax returns are shown only for the Investor Class and will differ for other share classes.
|
| Index No Deduction for Fees, Expenses, or Taxes [Text] |
(reflects no deduction for fees, expenses,
or taxes)
|
| Performance Table Closing [Text Block] |
Updated
performance information is available through troweprice.com.
|
| Performance Availability Website Address [Text] |
troweprice.com
|
| T. Rowe Price Retirement Blend 2035 Fund |
|
| Prospectus [Line Items] |
|
| Bar Chart and Performance Table [Heading] |
Performance
|
| Performance Narrative [Text Block] |
The
following performance information provides some indication of the risks of investing in the fund. The fund’s performance
information represents only past performance (before and after taxes) and is not necessarily an indication of future results.
The
following bar chart illustrates how much returns can differ from year to year by showing calendar year returns and the best and
worst calendar quarter returns during those years for the fund’s Investor Class. Returns for other share classes vary since
they have different expenses.
|
| Performance Past Does Not Indicate Future [Text] |
The fund’s performance
information represents only past performance (before and after taxes) and is not necessarily an indication of future results.
|
| Performance Information Illustrates Variability of Returns [Text] |
The
following performance information provides some indication of the risks of investing in the fund.The
following bar chart illustrates how much returns can differ from year to year by showing calendar year returns and the best and
worst calendar quarter returns during those years for the fund’s Investor Class. Returns for other share classes vary since
they have different expenses.The
following table shows the average annual total returns for each class of the fund that has been in operation for at least one
full calendar year. The fund’s performance information included in the table is compared with a regulatory required index
that represents an overall securities market (Regulatory Benchmark). In addition, the table may also include one or more indexes
that more closely aligns to the fund’s investment strategy (Strategy Benchmark(s)).
|
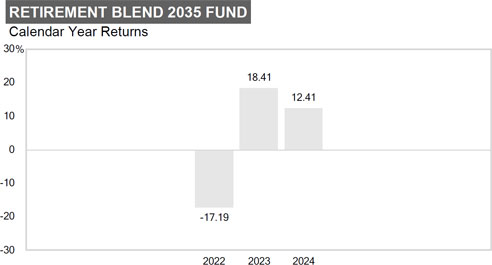
| Bar Chart [Heading] |
Calendar
Year Returns
|
| Bar Chart [Table] |
| |
|
| 2022 |
-17.19 |
| 2023 |
18.41 |
| 2024 |
12.41 |
|
| Bar Chart Closing [Text Block] |
| |
|
Quarter
Ended |
Total
Return |
|
|
Quarter
Ended |
Total
Return
|
|
| |
Best
Quarter |
12/31/23 |
10.18% |
|
Worst
Quarter |
6/30/22 |
-13.56% |
|
The
fund’s return for the six months ended 6/30/25 was 7.82%.
|
| Year to Date Return, Label [Optional Text] |
The
fund’s return for the six months ended
|
| Bar Chart, Year to Date Return |
7.82%
|
| Bar Chart, Year to Date Return, Date |
Jun. 30, 2025
|
| Highest Quarterly Return, Label [Optional Text] |
Best
Quarter
|
| Highest Quarterly Return |
10.18%
|
| Highest Quarterly Return, Date |
Dec. 31, 2023
|
| Lowest Quarterly Return, Label [Optional Text] |
Worst
Quarter
|
| Lowest Quarterly Return |
(13.56%)
|
| Lowest Quarterly Return, Date |
Jun. 30, 2022
|
| Performance Table Heading |
Average
Annual Total ReturnsPeriods
endedDecember
31, 2024
|
| Performance Table Narrative |
The
following table shows the average annual total returns for each class of the fund that has been in operation for at least one
full calendar year. The fund’s performance information included in the table is compared with a regulatory required index
that represents an overall securities market (Regulatory Benchmark). In addition, the table may also include one or more indexes
that more closely aligns to the fund’s investment strategy (Strategy Benchmark(s)).
In
addition, the table shows hypothetical after-tax returns to demonstrate how taxes paid by a shareholder may influence returns.
After-tax returns are calculated using the historical highest individual federal marginal income tax rates and do not reflect
the impact of state and local taxes. Actual after-tax returns depend on an investor’s tax situation and may differ from
those shown. After-tax returns shown are not relevant to investors who hold their fund shares through tax-deferred arrangements,
such as a 401(k) account or an IRA. After-tax returns are shown only for the Investor Class and will differ for other share classes.
|
| Performance Table Uses Highest Federal Rate |
After-tax returns are calculated using the historical highest individual federal marginal income tax rates and do not reflect
the impact of state and local taxes.
|
| Performance Table Not Relevant to Tax Deferred |
Actual after-tax returns depend on an investor’s tax situation and may differ from
those shown. After-tax returns shown are not relevant to investors who hold their fund shares through tax-deferred arrangements,
such as a 401(k) account or an IRA.
|
| Performance [Table] |
Average
Annual Total Returns
| |
|
|
|
|
|
|
| |
|
|
Periods
ended |
|
| |
|
|
December
31, 2024 |
|
| |
|
|
|
|
|
|
|
|
|
| |
|
|
|
|
|
|
Since |
Inception |
|
| |
|
|
1
Year |
|
|
|
inception |
date |
|
| |
Investor
Class |
|
|
|
|
|
|
07/26/2021 |
|
| |
|
Returns
before taxes |
12.41
|
% |
|
|
4.02 |
% |
|
|
|
| |
|
Returns
after taxes on distributions |
11.75 |
|
|
|
3.37 |
|
|
|
|
| |
|
Returns
after taxes on distributions and sale |
|
|
|
|
|
|
|
|
|
| |
|
of
fund shares |
7.60 |
|
|
|
2.93 |
|
|
|
|
| |
I
Class |
|
|
|
|
|
|
07/26/2021 |
|
| |
|
Returns
before taxes |
12.58 |
|
|
|
4.20 |
|
|
|
|
| |
|
|
|
|
|
|
|
|
|
|
|
| |
Regulatory
Benchmark |
|
|
|
| |
Russell
3000® Index (reflects no deduction for fees, expenses, or taxes) |
|
|
|
| |
|
23.81 |
|
|
|
9.04 |
a |
|
|
|
| |
Strategy
Benchmark(s) |
|
|
|
| |
S&P
Target Date 2035 Index (reflects no deduction for fees, expenses, or taxes) |
|
|
|
| |
|
11.38 |
|
|
|
4.08 |
a |
|
|
|
| |
|
|
|
|
|
|
|
|
|
|
|
|
| Performance Table One Class of after Tax Shown [Text] |
After-tax returns are shown only for the Investor Class and will differ for other share classes.
|
| Index No Deduction for Fees, Expenses, or Taxes [Text] |
(reflects no deduction for fees, expenses, or taxes)
|
| Performance Table Closing [Text Block] |
Updated
performance information is available through troweprice.com.
|
| Performance Availability Website Address [Text] |
troweprice.com
|
| T. Rowe Price Retirement Blend 2040 Fund |
|
| Prospectus [Line Items] |
|
| Bar Chart and Performance Table [Heading] |
Performance
|
| Performance Narrative [Text Block] |
The
following performance information provides some indication of the risks of investing in the fund. The fund’s performance
information represents only past performance (before and after taxes) and is not necessarily an indication of future results.
The
following bar chart illustrates how much returns can differ from year to year by showing calendar year returns and the best and
worst calendar quarter returns during those years for the fund’s Investor Class. Returns for other share classes vary since
they have different expenses.
|
| Performance Past Does Not Indicate Future [Text] |
The fund’s performance
information represents only past performance (before and after taxes) and is not necessarily an indication of future results.
|
| Performance Information Illustrates Variability of Returns [Text] |
The
following performance information provides some indication of the risks of investing in the fund.The
following bar chart illustrates how much returns can differ from year to year by showing calendar year returns and the best and
worst calendar quarter returns during those years for the fund’s Investor Class. Returns for other share classes vary since
they have different expenses.The
following table shows the average annual total returns for each class of the fund that has been in operation for at least one
full calendar year. The fund’s performance information included in the table is compared with a regulatory required index
that represents an overall securities market (Regulatory Benchmark). In addition, the table may also include one or more indexes
that more closely aligns to the fund’s investment strategy (Strategy Benchmark(s)).
|
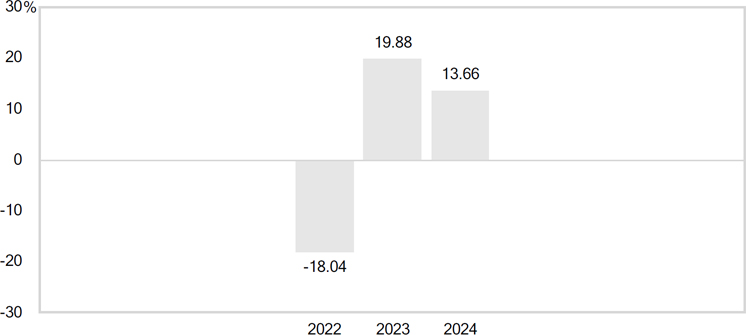
| Bar Chart [Heading] |
Calendar
Year Returns
|
| Bar Chart [Table] |
| |
|
| 2022 |
-18.04 |
| 2023 |
19.88 |
| 2024 |
13.66 |
|
| Bar Chart Closing [Text Block] |
| |
Quarter
Ended |
Total
Return |
|
|
Quarter
Ended |
Total
Return |
| Best
Quarter |
12/31/23 |
10.54% |
|
Worst
Quarter |
6/30/22 |
-14.39% |
The
fund’s return for the six months ended 6/30/25 was 8.31%.
|
| Year to Date Return, Label [Optional Text] |
The
fund’s return for the six months ended
|
| Bar Chart, Year to Date Return |
8.31%
|
| Bar Chart, Year to Date Return, Date |
Jun. 30, 2025
|
| Highest Quarterly Return, Label [Optional Text] |
Best
Quarter
|
| Highest Quarterly Return |
10.54%
|
| Highest Quarterly Return, Date |
Dec. 31, 2023
|
| Lowest Quarterly Return, Label [Optional Text] |
Worst
Quarter
|
| Lowest Quarterly Return |
(14.39%)
|
| Lowest Quarterly Return, Date |
Jun. 30, 2022
|
| Performance Table Heading |
Average
Annual Total ReturnsPeriods
endedDecember
31, 2024
|
| Performance Table Narrative |
The
following table shows the average annual total returns for each class of the fund that has been in operation for at least one
full calendar year. The fund’s performance information included in the table is compared with a regulatory required index
that represents an overall securities market (Regulatory Benchmark). In addition, the table may also include one or more indexes
that more closely aligns to the fund’s investment strategy (Strategy Benchmark(s)).
In
addition, the table shows hypothetical after-tax returns to demonstrate how taxes paid by a shareholder may influence returns.
After-tax returns are calculated using the historical highest individual federal marginal income tax rates and do not reflect
the impact of state and local taxes. Actual after-tax returns depend on an investor’s tax situation and may differ from
those shown. After-tax returns shown are not relevant to investors who hold their fund shares through tax-deferred arrangements,
such as a 401(k) account or an IRA. After-tax returns are shown only for the Investor Class and will differ for other share classes.
|
| Performance Table Uses Highest Federal Rate |
After-tax returns are calculated using the historical highest individual federal marginal income tax rates and do not reflect
the impact of state and local taxes.
|
| Performance Table Not Relevant to Tax Deferred |
Actual after-tax returns depend on an investor’s tax situation and may differ from
those shown. After-tax returns shown are not relevant to investors who hold their fund shares through tax-deferred arrangements,
such as a 401(k) account or an IRA.
|
| Performance [Table] |
| Average
Annual Total Returns |
|
|
|
|
|
|
| |
|
|
Periods
ended |
|
| |
|
|
December
31, 2024 |
|
| |
|
|
|
|
|
|
|
|
|
| |
|
|
|
|
|
|
Since |
Inception |
|
| |
|
|
1
Year |
|
|
|
inception |
date |
|
| |
Investor
Class |
|
|
|
|
|
|
07/26/2021 |
|
| |
|
Returns
before taxes |
13.66 |
% |
|
|
4.33 |
% |
|
|
|
| |
|
Returns
after taxes on distributions |
13.08 |
|
|
|
3.70 |
|
|
|
|
| |
|
Returns
after taxes on distributions and sale |
|
|
|
|
|
|
|
|
|
| |
|
of
fund shares |
8.36 |
|
|
|
3.20 |
|
|
|
|
| |
I
Class |
|
|
|
|
|
|
07/26/2021 |
|
| |
|
Returns
before taxes |
13.85 |
|
|
|
4.50 |
|
|
|
|
| |
|
|
|
|
|
|
|
|
|
|
|
| |
Regulatory
Benchmark |
|
|
|
| |
Russell
3000® Index (reflects no deduction for fees, expenses, or taxes) |
|
|
|
| |
|
23.81 |
|
|
|
9.04 |
a |
|
|
|
| |
Strategy
Benchmark(s) |
|
|
|
| |
S&P
Target Date 2040 Index (reflects no deduction for fees, expenses, or taxes) |
|
|
|
| |
|
12.87 |
|
|
|
4.80 |
a |
|
|
|
|
| Performance Table One Class of after Tax Shown [Text] |
After-tax returns are shown only for the Investor Class and will differ for other share classes.
|
| Index No Deduction for Fees, Expenses, or Taxes [Text] |
(reflects no deduction for fees, expenses, or taxes)
|
| Performance Table Closing [Text Block] |
Updated
performance information is available through troweprice.com.
|
| Performance Availability Website Address [Text] |
troweprice.com
|
| T. Rowe Price Retirement Blend 2045 Fund |
|
| Prospectus [Line Items] |
|
| Bar Chart and Performance Table [Heading] |
Performance
|
| Performance Narrative [Text Block] |
The following performance information provides some indication
of the risks of investing in the fund. The fund’s performance information represents only past performance (before and after
taxes) and is not necessarily an indication of future results.
The following bar chart illustrates how much returns can differ
from year to year by showing calendar year returns and the best and worst calendar quarter returns during those years
for the fund’s Investor Class. Returns for other share classes vary since they have different expenses.
|
| Performance Past Does Not Indicate Future [Text] |
The fund’s performance information represents only past performance (before and after
taxes) and is not necessarily an indication of future results.
|
| Performance Information Illustrates Variability of Returns [Text] |
The following performance information provides some indication
of the risks of investing in the fund.The following bar chart illustrates how much returns can differ
from year to year by showing calendar year returns and the best and worst calendar quarter returns during those years
for the fund’s Investor Class. Returns for other share classes vary since they have different expenses.The following table shows the
average annual total returns for each class of the fund that has been in operation for at least one full calendar year. The fund’s
performance information included in the table is compared with a regulatory required index that represents an overall securities
market (Regulatory Benchmark). In addition, the table may also include one or more indexes that more closely aligns to the fund’s
investment strategy (Strategy Benchmark(s)).
|
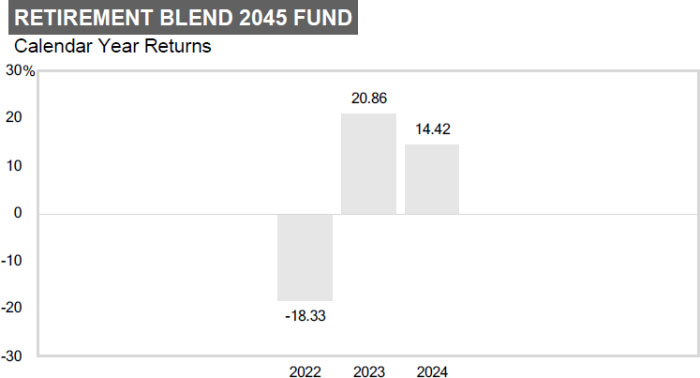
| Bar Chart [Heading] |
Calendar Year Returns
|
| Bar Chart [Table] |
| |
|
| 2022 |
-18.33 |
| 2023 |
20.86 |
| 2024 |
14.42 |
|
| Bar Chart Closing [Text Block] |
| |
|
Quarter
Ended |
Total
Return |
|
|
Quarter
Ended |
Total
Return |
|
| |
Best Quarter |
12/31/23 |
10.93% |
|
Worst
Quarter |
6/30/22 |
-14.81% |
|
The fund’s return for the six months
ended 6/30/25 was 8.73%.
|
| Year to Date Return, Label [Optional Text] |
The fund’s return for the six months
ended
|
| Bar Chart, Year to Date Return |
8.73%
|
| Bar Chart, Year to Date Return, Date |
Jun. 30, 2025
|
| Highest Quarterly Return, Label [Optional Text] |
Best Quarter
|
| Highest Quarterly Return |
10.93%
|
| Highest Quarterly Return, Date |
Dec. 31, 2023
|
| Lowest Quarterly Return, Label [Optional Text] |
Worst
Quarter
|
| Lowest Quarterly Return |
(14.81%)
|
| Lowest Quarterly Return, Date |
Jun. 30, 2022
|
| Performance Table Heading |
Average
Annual Total ReturnsPeriods
endedDecember
31, 2024
|
| Performance Table Narrative |
The following table shows the
average annual total returns for each class of the fund that has been in operation for at least one full calendar year. The fund’s
performance information included in the table is compared with a regulatory required index that represents an overall securities
market (Regulatory Benchmark). In addition, the table may also include one or more indexes that more closely aligns to the fund’s
investment strategy (Strategy Benchmark(s)).
In addition, the table shows hypothetical after-tax returns to demonstrate
how taxes paid by a shareholder may influence returns. After-tax returns are calculated using the historical highest individual
federal marginal income tax rates and do not reflect the impact of state and local taxes. Actual after-tax returns depend on an
investor’s tax situation and may differ from those shown. After-tax returns shown are not relevant to investors who hold
their fund shares through tax-deferred arrangements, such as a 401(k) account or an IRA. After-tax returns are shown only for
the Investor Class and will differ for other share classes.
|
| Performance Table Uses Highest Federal Rate |
After-tax returns are calculated using the historical highest individual
federal marginal income tax rates and do not reflect the impact of state and local taxes.
|
| Performance Table Not Relevant to Tax Deferred |
Actual after-tax returns depend on an
investor’s tax situation and may differ from those shown. After-tax returns shown are not relevant to investors who hold
their fund shares through tax-deferred arrangements, such as a 401(k) account or an IRA.
|
| Performance [Table] |
| Average
Annual Total Returns |
|
|
|
|
|
| |
|
|
Periods
ended |
|
| |
|
|
December
31, 2024 |
|
| |
|
|
|
|
|
|
|
|
|
| |
|
|
|
|
|
|
Since |
Inception |
|
| |
|
|
1 Year |
|
|
|
inception |
date |
|
| |
Investor Class |
|
|
|
|
|
|
07/26/2021 |
|
| |
|
Returns before taxes |
14.42 |
% |
|
|
4.72 |
% |
|
|
| |
|
Returns after taxes on distributions |
13.90 |
|
|
|
4.13 |
|
|
|
| |
|
Returns after taxes on distributions
and sale |
|
|
|
|
|
|
|
|
| |
|
of fund shares |
8.84 |
|
|
|
3.53 |
|
|
|
| |
I Class |
|
|
|
|
|
|
07/26/2021 |
|
| |
|
Returns before
taxes |
14.78 |
|
|
|
4.90 |
|
|
|
| |
|
|
|
|
|
|
|
|
|
|
| |
Regulatory Benchmark |
|
|
| |
Russell
3000® Index (reflects no deduction for fees,
expenses, or taxes) |
|
|
| |
|
23.81 |
|
|
|
9.04 |
a |
|
|
| |
Strategy Benchmark(s) |
|
|
| |
S&P
Target Date 2045 Index (reflects no deduction for fees, expenses, or taxes) |
|
|
| |
|
13.58 |
|
|
|
5.22 |
a |
|
|
| |
|
|
|
|
|
|
|
|
|
|
|
| Performance Table One Class of after Tax Shown [Text] |
After-tax returns are shown only for
the Investor Class and will differ for other share classes.
|
| Index No Deduction for Fees, Expenses, or Taxes [Text] |
(reflects no deduction for fees,
expenses, or taxes)
|
| Performance Table Closing [Text Block] |
Updated
performance information is available through troweprice.com.
|
| Performance Availability Website Address [Text] |
troweprice.com
|
| T. Rowe Price Retirement Blend 2050 Fund |
|
| Prospectus [Line Items] |
|
| Bar Chart and Performance Table [Heading] |
Performance
|
| Performance Narrative [Text Block] |
The
following performance information provides some indication of the risks of investing in the fund. The fund’s performance
information represents only past performance (before and after taxes) and is not necessarily an indication of future results.
The
following bar chart illustrates how much returns can differ from year to year by showing calendar year returns and the best and
worst calendar quarter returns during those years for the fund’s Investor Class. Returns for other share classes vary since
they have different expenses.
|
| Performance Past Does Not Indicate Future [Text] |
The fund’s performance
information represents only past performance (before and after taxes) and is not necessarily an indication of future results.
|
| Performance Information Illustrates Variability of Returns [Text] |
The
following performance information provides some indication of the risks of investing in the fund.The
following bar chart illustrates how much returns can differ from year to year by showing calendar year returns and the best and
worst calendar quarter returns during those years for the fund’s Investor Class. Returns for other share classes vary since
they have different expenses.The
following table shows the average annual total returns for each class of the fund that has been in operation for at least one
full calendar year. The fund’s performance information included in the table is compared with a regulatory required index
that represents an overall securities market (Regulatory Benchmark). In addition, the table may also include one or more indexes
that more closely aligns to the fund’s investment strategy (Strategy Benchmark(s)).
|
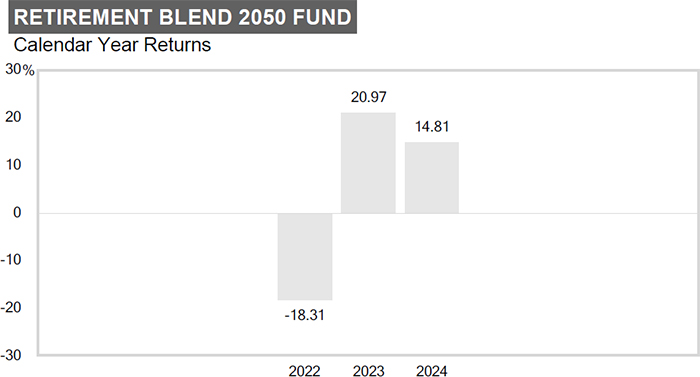
| Bar Chart [Heading] |
Calendar Year Returns
|
| Bar Chart [Table] |
| |
|
| 2022 |
-18.31 |
| 2023 |
20.97 |
| 2024 |
14.81 |
|
| Bar Chart Closing [Text Block] |
| |
|
Quarter
Ended |
Total
Return |
|
|
Quarter
Ended |
Total
Return |
|
| |
Best
Quarter |
12/31/23 |
10.91% |
|
Worst
Quarter |
6/30/22 |
-14.90% |
|
The
fund’s return for the six months ended 6/30/25 was 8.93%.
|
| Year to Date Return, Label [Optional Text] |
The
fund’s return for the six months ended
|
| Bar Chart, Year to Date Return |
8.93%
|
| Bar Chart, Year to Date Return, Date |
Jun. 30, 2025
|
| Highest Quarterly Return, Label [Optional Text] |
Best
Quarter
|
| Highest Quarterly Return |
10.91%
|
| Highest Quarterly Return, Date |
Dec. 31, 2023
|
| Lowest Quarterly Return, Label [Optional Text] |
Worst
Quarter
|
| Lowest Quarterly Return |
(14.90%)
|
| Lowest Quarterly Return, Date |
Jun. 30, 2022
|
| Performance Table Heading |
Average
Annual Total ReturnsPeriods
endedDecember
31, 2024
|
| Performance Table Narrative |
The
following table shows the average annual total returns for each class of the fund that has been in operation for at least one
full calendar year. The fund’s performance information included in the table is compared with a regulatory required index
that represents an overall securities market (Regulatory Benchmark). In addition, the table may also include one or more indexes
that more closely aligns to the fund’s investment strategy (Strategy Benchmark(s)).
In
addition, the table shows hypothetical after-tax returns to demonstrate how taxes paid by a shareholder may influence returns.
After-tax returns are calculated using the historical highest individual federal marginal income tax rates and do not reflect
the impact of state and local taxes. Actual after-tax returns depend on an investor’s tax situation and may differ from
those shown. After-tax returns shown are not relevant to investors who hold their fund shares through tax-deferred arrangements,
such as a 401(k) account or an IRA. After-tax returns are shown only for the Investor Class and will differ for other share classes.
|
| Performance Table Uses Highest Federal Rate |
After-tax returns are calculated using the historical highest individual federal marginal income tax rates and do not reflect
the impact of state and local taxes.
|
| Performance Table Not Relevant to Tax Deferred |
Actual after-tax returns depend on an investor’s tax situation and may differ from
those shown. After-tax returns shown are not relevant to investors who hold their fund shares through tax-deferred arrangements,
such as a 401(k) account or an IRA.
|
| Performance [Table] |
| Average
Annual Total Returns |
|
|
|
|
|
|
| |
|
|
Periods
ended |
|
| |
|
|
December
31, 2024 |
|
| |
|
|
|
|
|
|
|
|
|
| |
|
|
|
|
|
|
Since |
Inception |
|
| |
|
|
1
Year |
|
|
|
inception |
date |
|
| |
Investor
Class |
|
|
|
|
|
|
07/26/2021 |
|
| |
|
Returns
before taxes |
14.81 |
% |
|
|
4.89 |
% |
|
|
|
| |
|
Returns
after taxes on distributions |
14.34 |
|
|
|
4.33 |
|
|
|
|
| |
|
Returns
after taxes on distributions and sale |
|
|
|
|
|
|
|
|
|
| |
|
of
fund shares |
9.09 |
|
|
|
3.68 |
|
|
|
|
| |
I
Class |
|
|
|
|
|
|
07/26/2021 |
|
| |
|
Returns
before taxes |
15.02 |
|
|
|
5.09 |
|
|
|
|
| |
|
|
|
|
|
|
|
|
|
|
|
| |
Regulatory
Benchmark |
|
|
|
| |
Russell
3000® Index (reflects no deduction for fees, expenses, or taxes) |
|
|
|
| |
|
23.81 |
|
|
|
9.04 |
a |
|
|
|
| |
Strategy
Benchmark(s) |
|
|
|
| |
S&P
Target Date 2050 Index (reflects no deduction for fees, expenses, or taxes) |
|
|
|
| |
|
14.30 |
|
|
|
5.52 |
a |
|
|
|
| |
|
|
|
|
|
|
|
|
|
|
|
|
| Performance Table One Class of after Tax Shown [Text] |
After-tax returns are shown only for the Investor Class and will differ for other share classes.
|
| Index No Deduction for Fees, Expenses, or Taxes [Text] |
(reflects no deduction for fees, expenses, or taxes)
|
| Performance Table Closing [Text Block] |
Updated
performance information is available through troweprice.com.
|
| Performance Availability Website Address [Text] |
troweprice.com
|
| T. Rowe Price Retirement Blend 2055 Fund |
|
| Prospectus [Line Items] |
|
| Bar Chart and Performance Table [Heading] |
Performance
|
| Performance Narrative [Text Block] |
The following performance information provides some indication
of the risks of investing in the fund. The fund’s performance information represents only past performance (before and after
taxes) and is not necessarily an indication of future results.
The following bar chart illustrates how much returns can differ
from year to year by showing calendar year returns and the best and worst calendar quarter returns during those years
for the fund’s Investor Class. Returns for other share classes vary since they have different expenses.
|
| Performance Past Does Not Indicate Future [Text] |
The fund’s performance information represents only past performance (before and after
taxes) and is not necessarily an indication of future results
|
| Performance Information Illustrates Variability of Returns [Text] |
The following performance information provides some indication
of the risks of investing in the fund.The following bar chart illustrates how much returns can differ
from year to year by showing calendar year returns and the best and worst calendar quarter returns during those years
for the fund’s Investor Class. Returns for other share classes vary since they have different expenses.The following table shows the
average annual total returns for each class of the fund that has been in operation for at least one full calendar year. The fund’s
performance information included in the table is compared with a regulatory required index that represents an overall securities
market (Regulatory Benchmark). In addition, the table may also include one or more indexes that more closely aligns to the fund’s
investment strategy (Strategy Benchmark(s)).
|
| Bar Chart [Heading] |
Calendar Year Returns
|
| Bar Chart [Table] |
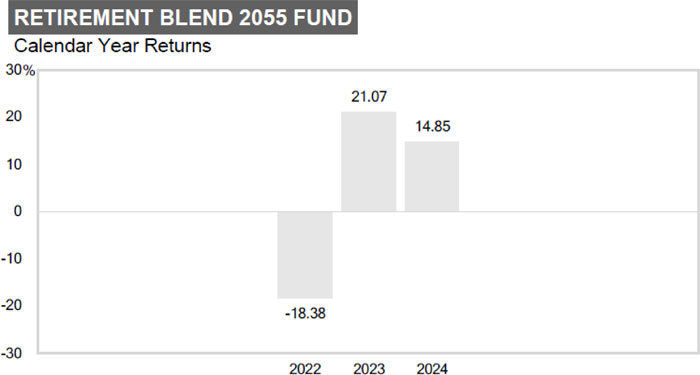
| |
|
| 2022 |
-18.38 |
| 2023 |
21.07 |
| 2024 |
14.85 |
|
| Bar Chart Closing [Text Block] |
| |
|
Quarter
Ended |
Total
Return |
|
|
Quarter
Ended |
Total
Return |
|
| |
Best Quarter |
12/31/23 |
10.99% |
|
Worst
Quarter |
6/30/22 |
-15.01% |
|
The fund’s return for the six
months ended 6/30/25 was 8.93%.
|
| Year to Date Return, Label [Optional Text] |
The fund’s return for the six
months ended
|
| Bar Chart, Year to Date Return |
8.93%
|
| Bar Chart, Year to Date Return, Date |
Jun. 30, 2025
|
| Highest Quarterly Return, Label [Optional Text] |
Best Quarter
|
| Highest Quarterly Return |
10.99%
|
| Highest Quarterly Return, Date |
Dec. 31, 2023
|
| Lowest Quarterly Return, Label [Optional Text] |
Worst
Quarter
|
| Lowest Quarterly Return |
(15.01%)
|
| Lowest Quarterly Return, Date |
Jun. 30, 2022
|
| Performance Table Heading |
Average
Annual Total ReturnsPeriods
endedDecember
31, 2024
|
| Performance Table Narrative |
The following table shows the
average annual total returns for each class of the fund that has been in operation for at least one full calendar year. The fund’s
performance information included in the table is compared with a regulatory required index that represents an overall securities
market (Regulatory Benchmark). In addition, the table may also include one or more indexes that more closely aligns to the fund’s
investment strategy (Strategy Benchmark(s)).
In addition, the table shows hypothetical after-tax returns to demonstrate
how taxes paid by a shareholder may influence returns. After-tax returns are calculated using the historical highest individual
federal marginal income tax rates and do not reflect the impact of state and local taxes. Actual after-tax returns depend on an
investor’s tax situation and may differ from those shown. After-tax returns shown are not relevant to investors who hold
their fund shares through tax-deferred arrangements, such as a 401(k) account or an IRA. After-tax returns are shown only for
the Investor Class and will differ for other share classes.
|
| Performance Table Uses Highest Federal Rate |
After-tax returns are calculated using the historical highest individual
federal marginal income tax rates and do not reflect the impact of state and local taxes.
|
| Performance Table Not Relevant to Tax Deferred |
Actual after-tax returns depend on an
investor’s tax situation and may differ from those shown. After-tax returns shown are not relevant to investors who hold
their fund shares through tax-deferred arrangements, such as a 401(k) account or an IRA.
|
| Performance [Table] |
| Average
Annual Total Returns |
|
|
|
|
|
| |
|
|
Periods
ended |
|
| |
|
|
December
31, 2024 |
|
| |
|
|
|
|
|
|
|
|
|
| |
|
|
|
|
|
|
Since |
Inception |
|
| |
|
|
1 Year |
|
|
|
inception |
date |
|
| |
Investor Class |
|
|
|
|
|
|
07/26/2021 |
|
| |
|
Returns before taxes |
14.85 |
% |
|
|
4.87 |
% |
|
|
| |
|
Returns after taxes on distributions |
14.37 |
|
|
|
4.32 |
|
|
|
| |
|
Returns after taxes on distributions
and sale |
|
|
|
|
|
|
|
|
| |
|
of fund shares |
9.09 |
|
|
|
3.66 |
|
|
|
| |
I Class |
|
|
|
|
|
|
07/26/2021 |
|
| |
|
Returns before
taxes |
15.11 |
|
|
|
5.03 |
|
|
|
| |
|
|
|
|
|
|
|
|
|
|
| |
Regulatory Benchmark |
|
|
| |
Russell
3000® Index (reflects no deduction for fees,
expenses, or taxes) |
|
|
| |
|
23.81 |
|
|
|
9.04 |
a |
|
|
| |
Strategy Benchmark(s) |
|
|
| |
S&P
Target Date 2055 Index (reflects no deduction for fees, expenses, or taxes) |
|
|
| |
|
14.32 |
|
|
|
5.53 |
a |
|
|
| |
|
|
|
|
|
|
|
|
|
|
|
| Performance Table One Class of after Tax Shown [Text] |
After-tax returns are shown only for
the Investor Class and will differ for other share classes.
|
| Index No Deduction for Fees, Expenses, or Taxes [Text] |
(reflects no deduction for fees,
expenses, or taxes)
|
| Performance Table Closing [Text Block] |
Updated
performance information is available through troweprice.com.
|
| Performance Availability Website Address [Text] |
troweprice.com
|
| T. Rowe Price Retirement Blend 2060 Fund |
|
| Prospectus [Line Items] |
|
| Bar Chart and Performance Table [Heading] |
Performance
|
| Performance Narrative [Text Block] |
The
following performance information provides some indication of the risks of investing in the fund. The fund’s performance
information represents only past performance (before and after taxes) and is not necessarily an indication of future results.
The
following bar chart illustrates how much returns can differ from year to year by showing calendar year returns and the best and
worst calendar quarter returns during those years for the fund’s Investor Class. Returns for other share classes vary since
they have different expenses.
|
| Performance Past Does Not Indicate Future [Text] |
The fund’s performance
information represents only past performance (before and after taxes) and is not necessarily an indication of future results
|
| Performance Information Illustrates Variability of Returns [Text] |
The
following performance information provides some indication of the risks of investing in the fund.The
following bar chart illustrates how much returns can differ from year to year by showing calendar year returns and the best and
worst calendar quarter returns during those years for the fund’s Investor Class. Returns for other share classes vary since
they have different expenses.The
following table shows the average annual total returns for each class of the fund that has been in operation for at least one
full calendar year. The fund’s performance information included in the table is compared with a regulatory required index
that represents an overall securities market (Regulatory Benchmark). In addition, the table may also include one or more indexes
that more closely aligns to the fund’s investment strategy (Strategy Benchmark(s)).
|
| Bar Chart [Heading] |
Calender Year Returns
|
| Bar Chart [Table] |

| |
|
| 2022 |
-18.43 |
| 2023 |
21.17 |
| 2024 |
14.74 |
|
| Bar Chart Closing [Text Block] |
| |
|
Quarter
Ended |
Total
Return
|
|
|
Quarter
Ended |
Total
Return
|
|
| |
Best Quarter |
12/31/23 |
11.05% |
|
Worst
Quarter |
6/30/22 |
-15.04% |
|
The
fund’s return for the six months ended 6/30/25 was 8.97%.
|
| Year to Date Return, Label [Optional Text] |
The
fund’s return for the six months ended
|
| Bar Chart, Year to Date Return |
8.97%
|
| Bar Chart, Year to Date Return, Date |
Jun. 30, 2025
|
| Highest Quarterly Return, Label [Optional Text] |
Best Quarter
|
| Highest Quarterly Return |
11.05%
|
| Highest Quarterly Return, Date |
Dec. 31, 2023
|
| Lowest Quarterly Return, Label [Optional Text] |
Worst
Quarter
|
| Lowest Quarterly Return |
(15.04%)
|
| Lowest Quarterly Return, Date |
Jun. 30, 2022
|
| Performance Table Heading |
Average
Annual Total ReturnsPeriods
endedDecember
31, 2024
|
| Performance Table Narrative |
The
following table shows the average annual total returns for each class of the fund that has been in operation for at least one
full calendar year. The fund’s performance information included in the table is compared with a regulatory required index
that represents an overall securities market (Regulatory Benchmark). In addition, the table may also include one or more indexes
that more closely aligns to the fund’s investment strategy (Strategy Benchmark(s)).
In
addition, the table shows hypothetical after-tax returns to demonstrate how taxes paid by a shareholder may influence returns.
After-tax returns are calculated using the historical highest individual federal marginal income tax rates and do not reflect
the impact of state and local taxes. Actual after-tax returns depend on an investor’s tax situation and may differ from
those shown. After-tax returns shown are not relevant to investors who hold their fund shares through tax-deferred arrangements,
such as a 401(k) account or an IRA. After-tax returns are shown only for the Investor Class and will differ for other share classes.
|
| Performance Table Uses Highest Federal Rate |
After-tax returns are calculated using the historical highest individual federal marginal income tax rates and do not reflect
the impact of state and local taxes.
|
| Performance Table Not Relevant to Tax Deferred |
Actual after-tax returns depend on an investor’s tax situation and may differ from
those shown. After-tax returns shown are not relevant to investors who hold their fund shares through tax-deferred arrangements,
such as a 401(k) account or an IRA.
|
| Performance [Table] |
| Average
Annual Total Returns |
|
|
|
|
|
| |
|
|
Periods
ended |
|
| |
|
|
December
31, 2024 |
|
| |
|
|
|
|
|
|
|
|
|
| |
|
|
|
|
|
|
Since |
Inception |
|
| |
|
|
1
Year |
|
|
|
inception |
date |
|
| |
Investor
Class |
|
|
|
|
|
|
07/26/2021 |
|
| |
|
Returns
before taxes |
14.74 |
% |
|
|
4.84 |
% |
|
|
| |
|
Returns after
taxes on distributions |
14.27 |
|
|
|
4.26 |
|
|
|
| |
|
Returns after
taxes on distributions and sale |
|
|
|
|
|
|
|
|
| |
|
of
fund shares |
9.05 |
|
|
|
3.63 |
|
|
|
| |
I
Class |
|
|
|
|
|
|
07/26/2021 |
|
| |
|
Returns
before taxes |
15.07 |
|
|
|
5.06 |
|
|
|
| |
|
|
|
|
|
|
|
|
|
|
| |
Regulatory
Benchmark |
|
|
| |
Russell
3000® Index (reflects no deduction for fees, expenses, or taxes) |
|
|
| |
|
23.81 |
|
|
|
9.04 |
a |
|
|
| |
Strategy
Benchmark(s) |
|
|
| |
S&P
Target Date 2060 Index (reflects no deduction for fees, expenses, or taxes) |
|
|
| |
|
14.44 |
|
|
|
5.58 |
a |
|
|
| |
|
|
|
|
|
|
|
|
|
|
|
| Performance Table One Class of after Tax Shown [Text] |
After-tax returns are shown only for the Investor Class and will differ for other share classes.
|
| Index No Deduction for Fees, Expenses, or Taxes [Text] |
(reflects no deduction for fees, expenses, or taxes)
|
| Performance Table Closing [Text Block] |
Updated
performance information is available through troweprice.com.
|
| Performance Availability Website Address [Text] |
troweprice.com
|
| T. Rowe Price Retirement Blend 2065 Fund |
|
| Prospectus [Line Items] |
|
| Bar Chart and Performance Table [Heading] |
Performance
|
| Performance Narrative [Text Block] |
The following performance information provides some indication
of the risks of investing in the fund. The fund’s performance information represents only past performance (before and after
taxes) and is not necessarily an indication of future results.
The following bar chart illustrates how much returns can differ
from year to year by showing calendar year returns and the best and worst calendar quarter returns during those years
for the fund’s Investor Class. Returns for other share classes vary since they have different expenses.
|
| Performance Past Does Not Indicate Future [Text] |
The fund’s performance information represents only past performance (before and after
taxes) and is not necessarily an indication of future results.
|
| Performance Information Illustrates Variability of Returns [Text] |
The following performance information provides some indication
of the risks of investing in the fund.The following bar chart illustrates how much returns can differ
from year to year by showing calendar year returns and the best and worst calendar quarter returns during those years
for the fund’s Investor Class. Returns for other share classes vary since they have different expenses.The following table shows the average annual total returns for
each class of the fund that has been in operation for at least one full calendar year. The fund’s performance information
included in the table is compared with a regulatory required index that represents an overall securities market (Regulatory Benchmark).
In addition, the table may also include one or more indexes that more closely aligns to the fund’s investment strategy (Strategy
Benchmark(s)).
|
| Bar Chart [Heading] |
Calendar
Year Returns
|
| Bar Chart [Table] |
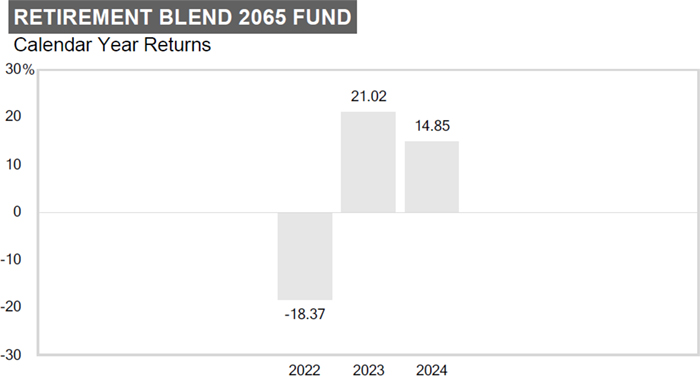
| |
|
| 2022 |
-18.37 |
| 2023 |
21.02 |
| 2024 |
14.85 |
|
| Bar Chart Closing [Text Block] |
| |
|
Quarter Ended |
Total
Return
|
|
|
Quarter Ended |
Total
Return
|
|
| |
Best Quarter |
12/31/23 |
10.97% |
|
Worst Quarter |
6/30/22 |
-14.92% |
|
The fund’s return for the six months
ended 6/30/25 was 8.91%.
|
| Year to Date Return, Label [Optional Text] |
The fund’s return for the six months
ended
|
| Bar Chart, Year to Date Return |
8.91%
|
| Bar Chart, Year to Date Return, Date |
Jun. 30, 2025
|
| Highest Quarterly Return, Label [Optional Text] |
Best Quarter
|
| Highest Quarterly Return |
10.97%
|
| Highest Quarterly Return, Date |
Dec. 31, 2023
|
| Lowest Quarterly Return, Label [Optional Text] |
Worst Quarter
|
| Lowest Quarterly Return |
(14.92%)
|
| Lowest Quarterly Return, Date |
Jun. 30, 2022
|
| Performance Table Heading |
Average
Annual Total ReturnsPeriods endedDecember 31, 2024
|
| Performance Table Narrative |
The following table shows the average annual total returns for
each class of the fund that has been in operation for at least one full calendar year. The fund’s performance information
included in the table is compared with a regulatory required index that represents an overall securities market (Regulatory Benchmark).
In addition, the table may also include one or more indexes that more closely aligns to the fund’s investment strategy (Strategy
Benchmark(s)).
In addition, the table shows hypothetical after-tax returns
to demonstrate how taxes paid by a shareholder may influence returns. After-tax returns are calculated using the historical highest
individual federal marginal income tax rates and do not reflect the impact of state and local taxes. Actual after-tax returns depend
on an investor’s tax situation and may differ from those shown. After-tax returns shown are not relevant to investors who
hold their fund shares through tax-deferred arrangements, such as a 401(k) account or an IRA. After-tax returns are shown only
for the Investor Class and will differ for other share classes.
|
| Performance Table Uses Highest Federal Rate |
After-tax returns are calculated using the historical highest
individual federal marginal income tax rates and do not reflect the impact of state and local taxes.
|
| Performance Table Not Relevant to Tax Deferred |
Actual after-tax returns depend
on an investor’s tax situation and may differ from those shown. After-tax returns shown are not relevant to investors who
hold their fund shares through tax-deferred arrangements, such as a 401(k) account or an IRA.
|
| Performance [Table] |
Average
Annual Total Returns
| |
|
|
|
|
|
|
| |
|
|
Periods ended |
|
| |
|
|
December 31, 2024 |
|
| |
|
|
|
|
|
|
|
|
|
| |
|
|
|
|
|
|
Since |
Inception |
|
| |
|
|
1 Year |
|
|
|
inception |
date |
|
| |
Investor Class |
|
|
|
|
|
|
07/26/2021 |
|
| |
|
Returns before taxes |
14.85 |
% |
|
|
4.86 |
% |
|
|
|
| |
|
Returns after taxes on distributions |
14.36 |
|
|
|
4.31 |
|
|
|
|
| |
|
Returns after taxes on distributions and sale |
|
|
|
|
|
|
|
|
|
| |
|
of fund shares |
9.13 |
|
|
|
3.64 |
|
|
|
|
| |
I Class |
|
|
|
|
|
|
07/26/2021 |
|
| |
|
Returns before taxes |
15.04 |
|
|
|
5.04 |
|
|
|
|
| |
|
|
|
|
|
|
|
|
|
|
|
| |
Regulatory Benchmark |
|
|
|
| |
Russell 3000®
Index (reflects no deduction for fees, expenses, or taxes) |
|
|
|
| |
|
23.81 |
|
|
|
9.04 |
a |
|
|
|
| |
Strategy Benchmark(s) |
|
|
|
| |
S&P Target Date 2065+
Index (reflects no deduction for fees, expenses, or taxes) |
|
|
|
| |
|
14.83 |
|
|
|
5.74 |
a |
|
|
|
| |
|
|
|
|
|
|
|
|
|
|
|
|
| Performance Table One Class of after Tax Shown [Text] |
After-tax returns are shown only
for the Investor Class and will differ for other share classes.
|
| Index No Deduction for Fees, Expenses, or Taxes [Text] |
(reflects no deduction for fees, expenses, or taxes)
|
| Performance Table Closing [Text Block] |
Updated performance information is available through troweprice.com.
|
| Performance Availability Website Address [Text] |
troweprice.com
|
| T. Rowe Price Retirement Blend 2070 Fund |
|
| Prospectus [Line Items] |
|
| Bar Chart and Performance Table [Heading] |
Performance
|
| Performance Narrative [Text Block] |
Because
the fund commenced operations in 2025, there is no historical performance information shown here. Performance history will be
presented after the fund has been in operation for one full calendar year.
Current
performance information is available through troweprice.com.
|
| Performance One Year or Less [Text] |
Because
the fund commenced operations in 2025, there is no historical performance information shown here.
|
| Performance Availability Website Address [Text] |
troweprice.com
|