EXHIBIT 96.1
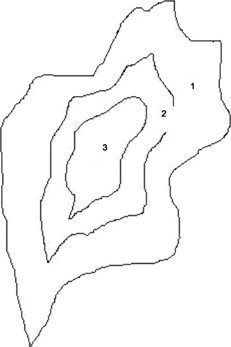
Cover Image Credits
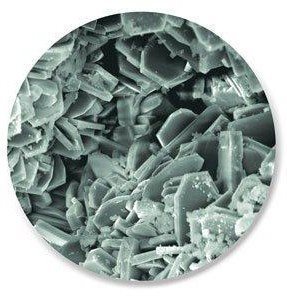
Bear River Zeolite Mine Site (drone image), Processing Plant, Zeolite Crystal Image
(SEM), and Digital Elevation Model (DEM) background.
Images courtesy of Bear River Zeolite Company and GeoGRAFX Consulting.
| Bear River Zeolite Project Franklin County, USA | Page: 3 |
Contents
| 1. Executive Summary |
| 17 |
|
| 1.1 Introduction |
| 17 |
|
| 1.2 Terms of Reference |
| 17 |
|
| 1.3 Property Setting |
| 17 |
|
| 1.4 Mineral Tenure, Surface Rights, Water Rights, Royalties and Agreements |
| 18 |
|
| 1.5 Geology and Mineralization |
| 19 |
|
| 1.6 History and Exploration |
| 20 |
|
| 1.7 Drilling and Sampling |
| 21 |
|
| 1.8 Data Verification |
| 22 |
|
| 1.9 Mineral Processing and Metallurgical Testing |
| 23 |
|
| 1.9.1 Testing Overview and Methodology |
| 23 |
|
| 1.9.2 Key Findings and Mineralogical Characteristics |
| 23 |
|
| 1.9.3 Qualified Person’s Assessment |
| 23 |
|
| 1.10 Mineral Resource Estimation |
| 24 |
|
| 1.10.1 Estimation Methodology |
| 24 |
|
| 1.10.2 Mineral Resource Statement |
| 24 |
|
| 1.10.3 Factors That May Affect the Mineral Resource Estimate |
| 25 |
|
| 1.11 Mineral Reserve Estimation |
| 25 |
|
| 1.11.1 Estimation Methodology |
| 25 |
|
| 1.11.2 Mineral Reserve Statement |
| 25 |
|
| 1.11.3 Factors That May Affect the Mineral Resource Estimate |
| 26 |
|
| 1.12 Mining Methods |
| 26 |
|
| 1.13 Processing and Recovery Methods |
| 27 |
|
| 1.14 Infrastructure |
| 27 |
|
| 1.14.1 Site Facilities and Layout |
| 27 |
|
| 1.14.2 Power and Communications |
| 28 |
|
| 1.14.3 Water and Fuel Supply |
| 28 |
|
| 1.14.4 Roads, Rail, and Transportation |
| 28 |
|
| 1.14.5 Waste and Reclamation Management |
| 28 |
|
| 1.15 Markets and Contracts |
| 29 |
|
| 1.15.1 Market Overview and Product Positioning |
| 29 |
|
| 1.15.2 Pricing and Sales Strategy |
| 29 |
|
| GeoGRAFX GIS Services | July 2, 2025 |
| Bear River Zeolite Project Franklin County, USA | Page: 4 |
| 1.16 Environmental, Permitting and Social Considerations |
| 30 |
|
| 1.16.1 Permitting |
| 30 |
|
| 1.16.2 Environmental Studies and Monitoring |
| 30 |
|
| 1.16.3 Closure and Reclamation Considerations |
| 31 |
|
| 1.16.4 Social Considerations, Plans, Negotiations and Agreements |
| 31 |
|
| 1.17 Capital and Operating Cost Estimates |
| 31 |
|
| 1.18 Economic Analysis |
| 32 |
|
| 1.19 Risks and Opportunities |
| 33 |
|
| 1.19.1 Key Risks |
| 33 |
|
| 1.19.2 Key Opportunities |
| 34 |
|
| 1.20 Conclusions |
| 34 |
|
| 1.21 Recommendations |
| 34 |
|
| 2 Introduction |
| 36 |
|
| 2.1 Registrant |
| 36 |
|
| 2.2 Scope of Report |
| 36 |
|
| 2.2.1 Report Purpose |
| 36 |
|
| 2.2.2 Terms of Reference |
| 36 |
|
| 2.3 Qualified Persons |
| 37 |
|
| 2.4 Site Visits and Scope of Personal Inspection |
| 38 |
|
| 2.5 Report Date |
| 39 |
|
| 2.6 Information Sources and References |
| 39 |
|
| 2.7 Previous Technical Report Summaries |
| 40 |
|
| 3 Property Description |
| 41 |
|
| 3.1 Property Location |
| 41 |
|
| 3.2 Land Tenure and Mineral Titles |
| 43 |
|
| 3.2.1 Federal Lands |
| 45 |
|
| 3.2.2 Private Ground |
| 48 |
|
| 3.3 Property Agreements |
| 51 |
|
| 3.3.1 Zeolite, LLC Amended and Restated Mining Lease |
| 51 |
|
| 3.4 Additional Royalties |
| 51 |
|
| 3.5 Surface Rights |
| 52 |
|
| 3.6 Water Rights |
| 52 |
|
| GeoGRAFX GIS Services | July 2, 2025 |
| Bear River Zeolite Project Franklin County, USA | Page: 5 |
| 3.7 Significant Encumbrances |
| 52 |
|
| 3.7.1 Permitting Requirements |
| 52 |
|
| 3.7.2 Permitting Timelines |
| 52 |
|
| 3.7.3 Violations and Fines |
| 52 |
|
| 3.8 Significant Factors and Risks That May Affect Access, Title or Work Programs |
| 53 |
|
| 3.9 Qualified Person Statement |
| 53 |
|
| 4 Accessibility, Climate, Local Resources, Infrastructure and Physiography |
| 54 |
|
| 4.1 Accessibility |
| 54 |
|
| 4.2 Climate |
| 54 |
|
| 4.3 Local Resources and Infrastructure |
| 54 |
|
| 4.4 Physiography |
| 55 |
|
| 5 History |
| 59 |
|
| 5.1 Overview of Zeolite Development in the United States |
| 59 |
|
| 5.2 Property Discovery and Early Development |
| 59 |
|
| 5.3 Ownership History |
| 59 |
|
| 5.4 Historic Exploration |
| 60 |
|
| 5.5 Initial Mine Development and Plant Construction |
| 60 |
|
| 5.6 Facility and Infrastructure Expansion |
| 62 |
|
| 5.7 Production History |
| 63 |
|
| 6 Geological Setting, Mineralization and Deposit Type |
| 64 |
|
| 6.1 District Geology |
| 66 |
|
| 6.1.1 Lithologies |
| 66 |
|
| 6.1.2 Structure |
| 69 |
|
| 6.1.3 Mineralization |
| 70 |
|
| 6.2 Property Geology |
| 71 |
|
| 6.2.1 Lithology |
| 71 |
|
| 6.2.2 Structure |
| 76 |
|
| 6.3 Bear River Deposit |
| 76 |
|
| 6.3.1 Lithology |
| 76 |
|
| 6.3.2 Genesis and Depositional Environment |
| 79 |
|
| 6.3.3 Structure |
| 80 |
|
| 6.3.4 Mineralization |
| 80 |
|
| 6.3.5 Deposit Dimensions |
| 80 |
|
| 6.4 Geological Model and Deposit Type |
| 81 |
|
| GeoGRAFX GIS Services | July 2, 2025 |
| Bear River Zeolite Project Franklin County, USA | Page: 6 |
| 7 Exploration |
| 83 |
|
| 7.1 Exploration (Other Than Drilling) |
| 83 |
|
| 7.1.1 Topographic Surveying |
| 83 |
|
| 7.1.2 Geological Mapping |
| 84 |
|
| 7.1.3 Surface Geochemistry |
| 85 |
|
| 7.1.4 Qualified Person’s Interpretation of the Exploration Information |
| 87 |
|
| 7.2 Drilling |
| 87 |
|
| 7.2.1 Overview |
| 87 |
|
| 7.2.2 Drill Methods |
| 89 |
|
| 7.2.3 Logging |
| 89 |
|
| 7.2.4 Recovery |
| 90 |
|
| 7.2.5 Collar Surveys |
| 90 |
|
| 7.2.6 Down Hole Surveys |
| 90 |
|
| 7.2.7 Drilling Results |
| 90 |
|
| 7.2.8 Comment on Material Results and Interpretation |
| 96 |
|
| 7.3 Hydrogeology |
| 97 |
|
| 7.4 Geotechnical |
| 97 |
|
| 7.5 Exploration Potential |
| 97 |
|
| 7.6 Qualified Person’s Conclusions on Exploration |
| 98 |
|
| 8 Sample Preparation, Analyses, and Security |
| 99 |
|
| 8.1 Sampling Methods |
| 99 |
|
| 8.1.1 Surface Samples |
| 99 |
|
| 8.1.2 Hydraulic Percussion Drill Rig |
| 99 |
|
| 8.2 Sample Security Methods |
| 100 |
|
| 8.3 Density Determinations |
| 100 |
|
| 8.4 Analytical and Test Laboratories |
| 100 |
|
| 8.5 Sample Preparation |
| 101 |
|
| 8.6 Analysis |
| 101 |
|
| 8.6.1 ALS |
| 101 |
|
| 8.6.2 SGS |
| 101 |
|
| 8.7 Quality Assurance and Quality Control |
| 102 |
|
| 8.7.1 Certified Reference Materials (Standards) |
| 103 |
|
| GeoGRAFX GIS Services | July 2, 2025 |
| Bear River Zeolite Project Franklin County, USA | Page: 7 |
| 8.7.2 Blank Samples |
| 103 |
|
| 8.7.3 Field Duplicates |
| 105 |
|
| 8.7.4 Laboratory Quality Control |
| 106 |
|
| 8.8 Qualified Person’s Opinion on Sample Preparation, Security, and Analytical Procedures |
| 107 |
|
| 9 Data Verification |
| 108 |
|
| 9.1 Internal Data Verification |
| 108 |
|
| 9.1.1 Drill Hole Database Audit |
| 108 |
|
| 9.2 External Data Verification |
| 108 |
|
| 9.2.1 Independent CEC Analysis |
| 108 |
|
| 9.3 Data Verified by Qualified Person |
| 110 |
|
| 9.3.1 Data and Document Examination |
| 110 |
|
| 9.3.2 Unpatented Claim Status |
| 110 |
|
| 9.3.3 Site Visit |
| 111 |
|
| 9.3.4 Field Collar Verification |
| 112 |
|
| 9.4 Data Adequacy for Mineral Resource and Reserve Estimation |
| 113 |
|
| 10 Mineral Processing and Metallurgical Testing |
| 114 |
|
| 10.1 Physical and Chemical Characteristics of Clinoptilolite Zeolite |
| 114 |
|
| 10.2 Mineralogy |
| 115 |
|
| 10.2.1 Cation Exchange Capacity Analysis |
| 115 |
|
| 10.2.2 XRD Analysis |
| 120 |
|
| 10.2.3 XRD Analysis of Zeo1 lithology |
| 121 |
|
| 10.2.4 Whole Rock Analysis |
| 125 |
|
| 10.2.5 Elemental Analysis |
| 127 |
|
| 10.3 Applications |
| 130 |
|
| 10.3.1 CEC Classification and Potential Uses |
| 130 |
|
| 10.3.2 Classification of Bear River Lithologies |
| 130 |
|
| 10.4 Registrations and Certifications |
| 132 |
|
| 10.5 Qualified Person’s Opinion on Data Adequacy |
| 133 |
|
| 11 Mineral Resource Estimate |
| 134 |
|
| 11.1 Summary of Mineral Resources |
| 134 |
|
| 11.2 Data Used in the Estimate |
| 134 |
|
| 11.3 Exploratory Data Analysis (EDA) |
| 135 |
|
| 11.4 Geological and Mineralization Interpretation |
| 140 |
|
| GeoGRAFX GIS Services | July 2, 2025 |
| Bear River Zeolite Project Franklin County, USA | Page: 8 |
| 11.5 Compositing and Capping |
| 152 |
|
| 11.6 Variography and Geostatistics |
| 152 |
|
| 11.7 Block Model Parameters |
| 156 |
|
| 11.8 Classification Criteria |
| 156 |
|
| 11.9 Validation of the Estimate |
| 160 |
|
| 11.10 Mineral Resource Sensitivity Analysis |
| 169 |
|
| 11.11 QP Statement |
| 170 |
|
| 11.12 Mineral Resource Statement |
| 171 |
|
| 11.13 Uncertainties (Factors) That May Affect the Mineral Resource Estimate |
| 172 |
|
| 12 Mineral Reserve Estimate |
| 174 |
|
| 12.1 Introduction |
| 174 |
|
| 12.2 Reserve Classification Confidence |
| 174 |
|
| 12.3 Reserve Estimation Methodology |
| 174 |
|
| 12.4 Modifying Factors |
| 174 |
|
| 12.5 Ore Selection Analysis |
| 175 |
|
| 12.6 Mineral Reserve Estimate |
| 175 |
|
| 12.7 Design Pit |
| 178 |
|
| 12.8 Risk Factors Affecting Reserves |
| 181 |
|
| 12.9 Recommendations |
| 181 |
|
| 12.10 Qualified Person’s Statement |
| 181 |
|
| 13 Mining Methods |
| 182 |
|
| 13.1 Introduction |
| 182 |
|
| 13.2 Geotechnical Considerations |
| 183 |
|
| 13.3 Hydrogeological Considerations |
| 183 |
|
| 13.4 Mine Design |
| 183 |
|
| 13.5 Dilution and Recovery Factors |
| 184 |
|
| 13.6 Mining Method |
| 184 |
|
| 13.7 Stripping and Backfilling |
| 184 |
|
| 13.8 Blasting and Explosives |
| 185 |
|
| 13.9 Explosives Storage and Handling |
| 185 |
|
| 13.10 Grade Control and Production Monitoring |
| 186 |
|
| 13.11 Production Schedule |
| 186 |
|
| 13.12 Mining Fleet |
| 186 |
|
| GeoGRAFX GIS Services | July 2, 2025 |
| Bear River Zeolite Project Franklin County, USA | Page: 9 |
| 13.13 Personnel |
| 187 |
|
| 13.14 Operations |
| 187 |
|
| 13.15 Recommendations |
| 189 |
|
| 14 Process and Recovery Methods |
| 190 |
|
| 14.1 Process Flowsheet and Equipment Description |
| 190 |
|
| 14.2 Flowsheet |
| 193 |
|
| 14.3 Plant Throughput and Design |
| 196 |
|
| 14.3.1 Overview |
| 196 |
|
| 14.3.2 Packaging |
| 196 |
|
| 14.4 Process Facility Performance |
| 196 |
|
| 14.5 Equipment Specifications |
| 197 |
|
| 14.6 Power, Water, and Process Materials |
| 198 |
|
| 14.6.1 Power |
| 198 |
|
| 14.6.2 Water |
| 198 |
|
| 14.6.3 Consumables |
| 198 |
|
| 14.7 Personnel |
| 199 |
|
| 14.8 Conclusion |
| 199 |
|
| 15 Infrastructure |
| 200 |
|
| 15.1 Overview |
| 200 |
|
| 15.2 Roads and Logistics |
| 202 |
|
| 15.3 Rail and Transport |
| 202 |
|
| 15.4 Stockpiles |
| 202 |
|
| 15.5 Waste Rock Storage Facilities |
| 202 |
|
| 15.6 Water Management |
| 203 |
|
| 15.7 Water Supply |
| 203 |
|
| 15.8 Site Buildings and Facilities |
| 203 |
|
| 15.9 Camps and Accommodation |
| 203 |
|
| 15.10 Power and Electrical |
| 204 |
|
| 15.11 Communications |
| 204 |
|
| 15.12 Fuel Storage |
| 204 |
|
| 15.13 Qualified Person’s Opinion |
| 205 |
|
| 16 Market Studies and Contracts |
| 206 |
|
| 16.1 Market Overview |
| 206 |
|
| GeoGRAFX GIS Services | July 2, 2025 |
| Bear River Zeolite Project Franklin County, USA | Page: 10 |
| 16.2 Product Portfolio |
| 207 |
|
| 16.3 Commodity Price Forecasts |
| 208 |
|
| 16.4 BRZ Product Pricing |
| 208 |
|
| 16.5 Mining, Processing, and Cost Structure |
| 209 |
|
| 16.6 Contracts |
| 209 |
|
| 16.7 Qualified Person Statement |
| 210 |
|
| 17 Environmental Studies, Permitting, and Plans, Negotiations, or Agreements with Local Individuals or Groups |
| 211 |
|
| 17.1 Introduction |
| 211 |
|
| 17.2 Baseline and Supporting Studies |
| 211 |
|
| 17.2.1 Land Use |
| 211 |
|
| 17.2.2 Climatology |
| 212 |
|
| 17.2.3 Air Quality |
| 213 |
|
| 17.2.4 Geochemistry |
| 215 |
|
| 17.2.5 Surface Water |
| 215 |
|
| 17.2.6 Groundwater Resources |
| 222 |
|
| 17.2.7 Soil Map Units and Composition |
| 223 |
|
| 17.2.8 Vegetation |
| 226 |
|
| 17.2.9 Wildlife Resources |
| 229 |
|
| 17.2.10 Habitat Setting |
| 230 |
|
| 17.2.11 Endangered Species and Critical Habitat |
| 231 |
|
| 17.3 Environmental Considerations/Monitoring Programs |
| 233 |
|
| 17.3.1 Waste Rock and Tailings Management |
| 233 |
|
| 17.3.2 Site Monitoring |
| 234 |
|
| 17.3.3 Water Management |
| 234 |
|
| 17.4 Project Permitting Requirements and Status |
| 235 |
|
| 17.4.1 Permitting Requirements |
| 235 |
|
| 17.4.2 Status of Permit Applications |
| 236 |
|
| 17.5 Social Considerations, Plans, Negotiations and Agreements |
| 236 |
|
| 17.5.1 Local Workforce and Economic Impact |
| 236 |
|
| 17.5.2 Support for Local Businesses: |
| 237 |
|
| 17.5.3 Community Engagement and Support: |
| 237 |
|
| 17.5.4 Social Considerations: |
| 237 |
|
| GeoGRAFX GIS Services | July 2, 2025 |
| Bear River Zeolite Project Franklin County, USA | Page: 11 |
| 17.5.5 Environmental and Social Responsibility |
| 237 |
|
| 17.5.6 Future Plans and Local Collaboration |
| 238 |
|
| 17.6 Closure and Reclamation Considerations |
| 238 |
|
| 17.6.1 Closure Plan and Regulatory Compliance |
| 238 |
|
| 17.6.2 Reclamation and Asset Retirement Obligations |
| 238 |
|
| 17.6.3 Financial Assurance and Bonding |
| 239 |
|
| 17.6.4 Post-Closure Monitoring and Reporting |
| 239 |
|
| 17.7 Qualified Person’s Opinion on Adequacy of Current Plans to Address Issues |
| 240 |
|
| 18 Capital and Operating Costs |
| 241 |
|
| 18.1 Basis of Estimate |
| 241 |
|
| 18.2 Capital Costs |
| 241 |
|
| 18.3 Operating Costs |
| 242 |
|
| 18.4 Economic Assumptions |
| 242 |
|
| 19 Economic Analysis |
| 243 |
|
| 19.1 Assumptions |
| 243 |
|
| 19.2 Cash Flow Summary |
| 243 |
|
| 19.3 Sensitivity Analysis |
| 244 |
|
| 19.4 Conclusion |
| 245 |
|
| 20 Adjacent Properties |
| 246 |
|
| 21 Other Relevant Data and Information |
| 247 |
|
| 22 Interpretation and Conclusions |
| 248 |
|
| 22.1 Introduction |
| 248 |
|
| 22.2 Mineral Tenure, Surface Rights, Water Rights, Royalties and Agreements |
| 248 |
|
| 22.2.1 Mineral Tenure and Land Control |
| 248 |
|
| 22.2.2 Surface Rights and Access |
| 248 |
|
| 22.2.3 Water Rights |
| 248 |
|
| 22.2.4 Royalties and Agreements |
| 249 |
|
| 22.2.5 Encumbrances and Legal Considerations |
| 249 |
|
| 22.3 Geology and Mineralization |
| 249 |
|
| 22.4 Exploration, Drilling, and Sampling |
| 250 |
|
| 22.4.1 Exploration (Other Than Drilling) |
| 250 |
|
| 22.4.2 Drilling Program |
| 251 |
|
| 22.4.3 Sampling Quality and Data Confidence |
| 251 |
|
| 22.4.4 Exploration Potential |
| 251 |
|
| GeoGRAFX GIS Services | July 2, 2025 |
| Bear River Zeolite Project Franklin County, USA | Page: 12 |
| 22.5 Data Verification |
| 252 |
|
| 22.6 Mineral Processing and Metallurgical Testing |
| 252 |
|
| 22.6.1 Testwork Overview |
| 253 |
|
| 22.6.2 Processing Methods |
| 253 |
|
| 22.6.3 Certifications |
| 254 |
|
| 22.6.4 Qualified Person’s Opinion |
| 254 |
|
| 22.7 Mineral Resource Estimate |
| 254 |
|
| 22.8 Mineral Reserve Estimates |
| 255 |
|
| 22.8.1 Summary |
| 256 |
|
| 22.8.2 Geological and Economic Viability |
| 256 |
|
| 22.8.3 Risk Factors |
| 256 |
|
| 22.8.4 Opportunities for Enhancement |
| 257 |
|
| 22.9 Mining Methods |
| 257 |
|
| 22.10 Processing and Recovery Methods |
| 257 |
|
| 22.11 Infrastructure |
| 258 |
|
| 22.11.1 Site Facilities |
| 258 |
|
| 22.11.2 Power and Utilities |
| 258 |
|
| 22.11.3 Communications |
| 258 |
|
| 22.11.4 Personnel and Logistics |
| 258 |
|
| 22.11.5 Limitations and Expansion Potential |
| 258 |
|
| 22.12 Market Studies |
| 259 |
|
| 22.13 Environmental, Permitting and Social Considerations |
| 259 |
|
| 22.13.1 Permitting |
| 259 |
|
| 22.13.2 Environmental Studies |
| 260 |
|
| 22.13.3 Closure and Reclamation |
| 260 |
|
| 22.13.4 Community and Social Engagement |
| 260 |
|
| 22.13.5 Qualified Person’s Opinion |
| 260 |
|
| 22.14 Capital and Operating Costs |
| 260 |
|
| 22.15 Economic Analysis |
| 261 |
|
| 22.16 Risks and Opportunities |
| 262 |
|
| 22.16.1 Risks |
| 262 |
|
| 22.16.2 Opportunities |
| 263 |
|
| 22.17 Conclusions |
| 263 |
|
| 23 Recommendations |
| 265 |
|
| 24 References |
| 266 |
|
| 25 Reliance on Information Provided by the Registrant |
| 269 |
|
| 26 Date and Signature Page |
| 271 |
|
| GeoGRAFX GIS Services | July 2, 2025 |
| Bear River Zeolite Project Franklin County, USA | Page: 13 |
Tables
| Table 1-1 Measured and Indicated Mineral Resources (Exclusive of Reserves) |
| 24 |
|
| Table 1-2 Inferred Mineral Resources (Exclusive of Reserves) |
| 24 |
|
| Table 1-3 Mineral Reserve for Bear River Zeolite Project |
| 26 |
|
| Table 1-4 Simplified Pre-Tax Cash Flow Summary |
| 32 |
|
| Table 2-1 Report Contributors and Responsibility |
| 37 |
|
| Table 3-1 Annual Claim Holding Costs |
| 46 |
|
| Table 3-2 Brear River Zeolite active placer claims |
| 46 |
|
| Table 3-3 Mine Safety Disclosure Information for the year ending December 31, 2024 |
| 53 |
|
| Table 5-1 Zeolite Production |
| 63 |
|
| Table 6-1 Description of District Geology Map Units |
| 68 |
|
| Table 6-2 Description of Property Geology Map Units |
| 73 |
|
| Table 6-3 Stratigraphic Section of Worm Creek, Idaho |
| 74 |
|
| Table 7-1 2024 Surface Rock Sample Results – CEC Analysis |
| 85 |
|
| Table 7-2 Summary Statistics for CEC Results Grouped by Lithology |
| 92 |
|
| Table 8-1 Descriptive Statistics for Bulk Density by Mineralized Zone |
| 100 |
|
| Table 8-2 Analytical Laboratories used by BRZ. |
| 100 |
|
| Table 8-3 Summary Counts of 2024 BRZ QA/QC Analyses |
| 103 |
|
| Table 8-4 Summary of Blank material submitted by the Company in sample submissions. |
| 104 |
|
| Table 8-5 CEC in blank reference materials |
| 104 |
|
| Table 9-1 Check assay results for 2024 air track drilling |
| 109 |
|
| Table 9-2 Check Coordinates for Drill Collar Locations |
| 113 |
|
| Table 10-1 Summary Statistics for CEC Results for Zeo1 |
| 116 |
|
| Table 10-2 X-ray Diffraction (XRD) Analysis of Zeo1 Lithology in the Bear River Deposit |
| 123 |
|
| Table 10-3 Whole Rock Geochemistry of Zeo1 Lithology in the Bear River Deposit |
| 126 |
|
| Table 10-4 Elemental Analysis of Zeo1 Lithology in the Bear River Deposit |
| 127 |
|
| Table 10-5 Bear River Lithology Applications |
| 130 |
|
| Table 11-1 Drillhole Collar and Interval Statistics |
| 134 |
|
| Table 11-2 General CEC Statistics for the Drilling Database |
| 135 |
|
| Table 11-3: General CEC Drilling Statistics Broken Down by Lithologic Code |
| 138 |
|
| Table 11-4 Mineralized Envelope Statistics |
| 146 |
|
| Table 11-5: Variogram Parameters for Samples Inside and Outside the Mineralized Envelope |
| 153 |
|
| Table 11-6: Estimation Parameters for OK, ID2, and NN Estimators Inside and Outside Mineralized Envelope |
| 153 |
|
| Table 11-7: Block Construction Parameters |
| 156 |
|
| GeoGRAFX GIS Services | July 2, 2025 |
| Bear River Zeolite Project Franklin County, USA | Page: 14 |
| Table 11-8 Categorization Parameters for Measured and Indicated Blocks |
| 157 |
|
| Table 11-9 Grade-Tonnage Report Providing Short Tons and Average Grade of Various CEC Cutoffs, All Blocks Considered |
| 170 |
|
| Table 11-10 Total In-Situ Mineral Resource Estimate (Inclusive of Reserves) – Bear River Zeolite Project |
| 171 |
|
| Table 11-11 Measured and Indicated Mineral Resources (Exclusive of Reserves) |
| 172 |
|
| Table 11-12 Inferred Mineral Resources (Exclusive of Reserves) |
| 172 |
|
| Table 12-1 Mineral Reserve for Bear River Zeolite Project |
| 175 |
|
| Table 12-2 Ore and waste tonnage by pit bench elevation |
| 179 |
|
| Table 13-1 Mobile Equipment Fleet Supporting Bear River Zeolite Operations |
| 186 |
|
| Table 16-1 Bear River Zeolite Market Share by Application |
| 206 |
|
| Table 16-2 Historical Natural Zeolite Price Range |
| 208 |
|
| Table 16-3 BRZ Average Sale Price per Ton Sold (2013-2024) |
| 208 |
|
| Table 17-1 NRCS Soil Map Units Within the Bear River Zeolite Property |
| 225 |
|
| Table 17-2 Likely Wildlife Species Observed or Expected in the BRZ Area |
| 229 |
|
| Table 18-1 Bear River Zeolite Mine & Processing Capital Costs |
| 241 |
|
| Table 18-2 Operating Cost Summary |
| 242 |
|
| Table 19-1 Simplified Pre-Tax Cash Flow Summary |
| 244 |
|
| Table 19-2 Sensitivity of Pre-Tax Cash Flow to Sales Price and Operating Cost Assumptions (2025 Example) |
| 244 |
|
| Table 22-1 Measured and Indicated Mineral Resources (Exclusive of Reserves) |
| 255 |
|
| Table 22-2 Inferred Mineral Resources (Exclusive of Reserves) |
| 255 |
|
| Table 22-3 Mineral Reserve for Bear River Zeolite Project |
| 256 |
|
| Table 22-4 Simplified Pre-Tax Cash Flow Summary |
| 261 |
|
Figures
| Figure 3.1-1 Location Map |
| 42 |
|
| Figure 3.2-1 Land Status Map |
| 44 |
|
| Figure 3.2-2 BRZ Unpatented Placer Claims |
| 47 |
|
| Figure 3.2-3 BRZ Zeolite, LLC Leased Ground |
| 50 |
|
| Figure 4.4-1 Ecoregion Map |
| 57 |
|
| Figure 4.4-2 Typical Physiography of the Project Area |
| 58 |
|
| Figure 5.5-1 2003 Mine and Production Facilities |
| 61 |
|
| Figure 5.7-1 Idaho Geologic Provinces |
| 65 |
|
| Figure 6.1-1 District Geology |
| 67 |
|
| Figure 6.1-2 Section F' - F" |
| 69 |
|
| Figure 6.1-3 Structural Geology of the Cache Valley Region |
| 70 |
|
| Figure 6.2-1 Property Geology |
| 72 |
|
| Figure 6.2-2 Map of Worm Creek Geology |
| 74 |
|
| Figure 6.3-1 Geology of the Bear River Zeolite Deposit |
| 77 |
|
| Figure 6.3-2 Generalized Cross Sections of the BRZ Deposit |
| 78 |
|
| Figure 6.3-3 Bear River Middle Pit |
| 79 |
|
| Figure 6.4-1 Alteration mineral zoning in saline, alkaline lake environment. |
| 81 |
|
| GeoGRAFX GIS Services | July 2, 2025 |
| Bear River Zeolite Project Franklin County, USA | Page: 15 |
| Figure 7.1-1 2024 Surface Topography and Imagery |
| 84 |
|
| Figure 7.1-2 Surface Sample Locations and CEC Results |
| 86 |
|
| Figure 7.2-1 Drill Hole Location Map |
| 88 |
|
| Figure 7.2-2 Furukawa HRC 1450 ED2 Hydraulic Percussion Drill |
| 89 |
|
| Figure 7.2-3 Chip Trays from 2024 Hydraulic percussion Drilling Program |
| 90 |
|
| Figure 7.2-4 N-S Cross Section |
| 91 |
|
| Figure 7.2-5 E-W Cross Section |
| 92 |
|
| Figure 7.2-6 Histogram of CEC Results Grouped by Lithology |
| 93 |
|
| Figure 7.2-7 Split Probability Plots of CEC Results Grouped by Lithology |
| 94 |
|
| Figure 7.2-8 Tukey Box Plots for CEC Results Grouped by Lithology |
| 96 |
|
| Figure 8.7-1 CEC values in Blanks reference material control chart. |
| 104 |
|
| Figure 8.7-2 BRZ Field Duplicate Graph |
| 106 |
|
| Figure 9.2-1 Comparison of CEC meq/100g Samples from 2024 Drilling |
| 109 |
|
| Figure 9.3-1 Mineralized Zeolite Material in the Old Pit |
| 112 |
|
| Figure 10.2-1 Histogram of CEC values for zeo1 |
| 117 |
|
| Figure 10.2-2 Probability Plot of CEC values for zeo1 |
| 118 |
|
| Figure 10.2-3 Tukey Box Plot of CEC values for zeo1 |
| 119 |
|
| Figure 10.2-4 Histogram of Cation Exchange Capacity (CEC) Values for Bear River Lithologies |
| 121 |
|
| Figure 10.2-5 X-ray Diffraction (XRD) Pattern of Sample 1941507 – Bear River Zeolite Deposit |
| 122 |
|
| Figure 10.2-6 Scatter Plot of CEC vs. % Clinoptilolite for Bear River Lithologies |
| 125 |
|
| Figure 11.3-1: Plan View of Drillhole Collars (Yellow) Relative to Lease Boundary (Red Overlay) and Aerial Photo |
| 136 |
|
| Figure 11.3-2: Histogram of CEC Grade Distribution, All Drilling |
| 137 |
|
| Figure 11.3-3: CEC Histogram Broken Down by Lithologic Code, All Drilling Samples |
| 138 |
|
| Figure 11.4-1: Cumulative Frequency Plot of CEC within Rhyolite and Zeolite Lithologic Codes |
| 141 |
|
| Figure 11.4-2: Box Plot of CEC within Rhyolite and Zeolite Lithologic Codes |
| 142 |
|
| Figure 11.4-3: Inclined View of Topography with Aerial Image Overlay Showing Zeolite/Rhyolite Bedding Relative to Reference Plane for Geological and Mineralization Modeling |
| 143 |
|
| Figure 11.4-4: Representative Cross-Sectional View of the Geologic Model and Drilling, Looking North- Northeast, with Rhyolite in Green, Topsoil in Tan, and Zeolite in Blue |
| 144 |
|
| Figure 11.4-5: Histogram of CEC Values Inside the Mineralized Envelope |
| 147 |
|
| Figure 11.4-6: Histogram of CEC Values Outside the Mineralized Envelope |
| 148 |
|
| Figure 11.4-7: 100 CEC Mineralized Envelope with CEC Drillhole Values, Plan View |
| 149 |
|
| Figure 11.4-8: 100 CEC Mineralized Envelope with CEC Drillhole Values, Rotated Aerial View Looking North |
| 150 |
|
| Figure 11.4-9: 100 CEC Mineralized Envelope with CEC Drillhole Values, Representative Cross-Sectional View Looking North-Northeast |
| 151 |
|
| Figure 11.6-1: Variograms Inside the Mineralized Envelope |
| 154 |
|
| Figure 11.6-2: Variograms Outside the Mineralized Envelope |
| 155 |
|
| Figure 11.8-1: Method for Obtaining the Average Distances Required for Measured and Indicated Categorizations from Variography |
| 157 |
|
| Figure 11.8-2: Measured (Red), Indicated (Green), and Inferred (Blue) Resource Blocks, Plan View 5060 Level |
| 158 |
|
| Figure 11.8-3: Measured (Red), Indicated (Green), and Inferred (Blue) Blocks, Cross Section B-B’ |
| 159 |
|
| GeoGRAFX GIS Services | July 2, 2025 |
| Bear River Zeolite Project Franklin County, USA | Page: 16 |
| Figure 11.9-1: Plan View of Block Model with Estimated CEC Grades, 5060 Level |
| 161 |
|
| Figure 11.9-2: Cross-Sectional View B-B’ of Block Model with Estimated CEC Grades |
| 162 |
|
| Figure 11.9-3: Cross-Sectional View C-C’ of Block Model with Estimated CEC Grades |
| 163 |
|
| Figure 11.9-4: Swath Plot in X (East) Direction, with OK (Blue), ID2 (Orange), and NN(Green) Block Grades Compared with Original Samples (Green) |
| 164 |
|
| Figure 11.9-5: Swath Plot in Y (North) Direction, with OK (Blue), ID2 (Orange), and NN(Green) Block Grades Compared with Original Samples (Green) |
| 165 |
|
| Figure 11.9-6: Swath Plot in Z (Vertical) Direction, with OK (Blue), ID2 (Orange), and NN(Green) Block Grades Compared with Original Samples (Green) |
| 166 |
|
| Figure 11.9-7: Scatter Plot OK vs ID2 Block Grades in Mineralized Envelope |
| 167 |
|
| Figure 11.9-8: Scatter Plot OK vs NN Block Grades in Mineralized Envelope |
| 168 |
|
| Figure 11.10-1 Grade Tonnage Curve of OK Estimations Showing the Effect of Various CEC Cutoffs, All Blocks |
| 169 |
|
| Figure 12.6-1 Plan view of Mineflow™ 100% profit shell and ownership boundary |
| 177 |
|
| Figure 12.6-2 Isometric view of zeolite ore blocks within pit shell |
| 178 |
|
| Figure 12.7-1 Contour map of final pit design at 12-foot elevation intervals. |
| 180 |
|
| Figure 13.1-1 Drone image of Bear River Zeolite mine site, haul roads, and stockpile shelter (May 2024). |
| 182 |
|
| Figure 13.14-1 Bear River Mine Site Layout |
| 188 |
|
| Figure 14.1-1 Bear River Processing Facility |
| 190 |
|
| Figure 14.1-2 Processing Facility |
| 192 |
|
| Figure 14.2-1 BRZ Crushing and Screening Circuit Flowsheet |
| 193 |
|
| Figure 14.2-2 BRZ Line 1 Screening Circuit Flowsheet |
| 194 |
|
| Figure 14.2-3 BRZ Line 2 Screening Circuit Flowsheet |
| 195 |
|
| Figure 15.1-1 BRZ Site Infrastructure |
| 201 |
|
| Figure 16.1-1 Bear River Zeolite Market Share by Application |
| 207 |
|
| Figure 17.2-1 Surface Water |
| 217 |
|
| Figure 17.2-2 Bear River Project Wetland Areas |
| 221 |
|
| Figure 17.2-3 NRCS Soil Classification |
| 224 |
|
| Figure 17.2-4 Vegetation Classification Based on NRCS SSURGO Soil Units |
| 228 |
|
| Figure 19.3-1 Pre-Tax Cash Flow Sensitivity to Sales Price and Operating Cost (2025 Example) |
| 245 |
|
Appendix
| A. | Certificate of Qualified Person |
|
|
|
| B. | BRZ Unpatented Placer Mining Claims |
|
|
|
| C. | Drilling Collar Table |
|
|
|
| D. | Independent CEC Analysis |
| GeoGRAFX GIS Services | July 2, 2025 |
| Bear River Zeolite Project Franklin County, USA | Page: 17 |
1 Executive Summary
1.1 Introduction
Ms. Barbara Carroll, CPG, Mr. P. J. Hollenbeck, CPG, Mr. Randall K. Martin, RM, and Mr. L. J. Bardswich, PE were retained by United States Antimony Corporation (USAC) to prepare a Technical Report Summary (TRS) on the Bear River Zeolite Mine Operations (BRZ), located in southeastern Idaho.
USAC acquired the Bear River Zeolite operations in June 2000 from Bear River Zeolite, LLC. Operations are conducted by USAC’s wholly owned subsidiary, Bear River Zeolite Company, an Idaho corporation. In 2000. In 2000, shortly after acquisition, BRZ began construction of a processing plant on the property. Commercial mining of zeolite at the current site commenced in 2001.
1.2 Terms of Reference
The Report was prepared to be attached as an exhibit to support mineral property disclosure, including - Mineral Resource and Mineral Reserve estimates - for the Bear River Zeolite operation in United States Antimony Corporation’s (USAC’s) Form 10-K for the year ended December 31, 2024.
Mineral Resources and Mineral Reserves are reported based on a geologic block model and pit shell developed from the Bear River Zeolite deposit and are not limited to the currently active pit area. The deposit is currently mined using conventional drill, blast, truck-and-loader methods.
Unless otherwise stated, all financial values, including operating costs, capital costs, cash flows, taxes, revenues, expenses, and overhead distributions, are presented in United States currency (US$). This report uses the U.S. customary unit system for mineral resources, mineral reserves, and associated financials, unless otherwise noted.
Mineral resources and mineral reserves are reported using the definitions set forth in Item 1300 of Regulation S–K (17 CFR Part 229) (SK1300) of the United States Securities and Exchange Commission Illustrations and disclosures required by S-K 1300 are included in the relevant chapters of the Report, as specified.
1.3 Property Setting
The Bear River Zeolite property is located in Franklin County, Idaho, approximately seven miles east of Preston, 34 miles north of Logan, Utah, 79 miles south of Pocatello, Idaho, and 100 miles north of Salt Lake City, Utah.
Access to the BRZ plant is via State Highway ID-34 from Preston, a paved route. Travel 1.8 miles north on ID-34 to East Glendale Road, then proceed 4 miles east on the paved road to the intersection with gravel road N2200 E. Turn left onto N2200 E and continue north for 0.5 miles to reach the processing plant, warehouses, and office building.
The climate at the BRZ operations area is classified as semi-arid. Mining operations have been demonstrated to be feasible year-round, though snow removal equipment is required during the winter months to maintain access roads.
| GeoGRAFX GIS Services | July 2, 2025 |
| Bear River Zeolite Project Franklin County, USA | Page: 18 |
The mine is situated in a region characterized by rolling hills, mountain foothills, and broad valleys. Elevations in the area generally range from around 4,500 feet in the valleys to over 9,000 feet in the nearby mountain ranges. The terrain near the mine is moderately sloping, with low hills and ridgelines.
Vegetation in the vicinity reflects a transition between semi-arid plains and forested mountain environments. In the valleys and lower elevations, the landscape is dominated by sagebrush, grasses, and juniper, typical of high desert and steppe ecosystems. At higher elevations, particularly in the nearby Bear River Range, the terrain becomes increasingly forested, with stands of pine, fir, and aspen.
1.4 Mineral Tenure, Surface Rights, Water Rights, Royalties and Agreements
The Bear River Zeolite Project is situated on a combination of federal unpatented placer mining claims administered by the U.S. Bureau of Land Management (BLM) and privately owned leased lands. The property comprises 50 contiguous unpatented federal placer claims, each approximately 20 acres, covering a total of approximately 994 acres (402.26 hectares), held directly by Bear River Zeolite Company (BRZ). These claims are active and valid through August 31, 2025, with annual maintenance fees paid.
In addition, BRZ holds a long-term lease agreement with Zeolite, LLC covering approximately 320 acres (129.5 hectares) of private land. This lease was renewed effective January 1, 2025, and extends through December 31, 2034, with automatic annual renewal provisions unless terminated with 180 days’ written notice. There are no known encumbrances, disputes, or conflicting claims associated with the lease. The leased land includes the active open pit, processing plant, access roads, and stockpile areas, and BRZ maintains exclusive operational control.
Under the 2025 lease agreement, BRZ pays production royalties to Zeolite, LLC based on tonnage removed and shipped from the leased premises. The royalty structure is tiered as follows:
| 0K to 10K tons | - | $ 9.00 per ton |
| 10.1K to 20K tons | - | $ 10.50 per ton |
| 20.1K to 30K tons | - | $ 12.00 per ton |
| Over 30K tons | - | $ 8.00 per ton |
BRZ also pays royalties on any zeolite brought from nearby sources and shipped from the leased site. The lease guarantees Zeolite, LLC a minimum annual royalty of $100,000, with any shortfall to be paid within 90 days of year-end.
In addition to the Zeolite, LLC Amended and Restated Mining Lease royalties, there are additional royalty holders. Nick Raymond and the estate of George Desborough each have a graduated royalty of
$1.00 per ton to $5.00 per ton, depending on the sale price.
During 2002, the Company sold a 3% gross proceeds royalty on all zeolite extracted from BRZ to Delaware Royalty Company, Inc., a company controlled by a Al Dugan, a major shareholder.
On a combined basis, BRZ pays total royalties ranging from 8% to 13% of zeolite product revenue.
Surface rights are secured through federal mining claims and the private lease and are sufficient to support the life-of-mine (LOM) plan presented in this Report.
| GeoGRAFX GIS Services | July 2, 2025 |
| Bear River Zeolite Project Franklin County, USA | Page: 19 |
Water for operations is sourced from onsite wells located on the leased private land. These sources provide sufficient water for dust control and site operations. No additional water rights are expected to be needed for the life-of-mine (LOM) operations.
1.5 Geology and Mineralization
The zeolite-bearing units mined at the Bear River property occur within the Tertiary Cache Valley Formation of the Salt Lake Group. The zeolite mineralization is stratigraphic in nature, and the deposit type is considered an example of a sedimentary zeolite hosted in tuffaceous rocks deposited in a closed hydrologic system.
The Bear River Zeolite property is located on the western slope of the Bear River Range in southwest Idaho, within the Southeast Basin and Range Geologic Province. This range is located along the western margin of the Cordilleran overthrust belt that spans Idaho, Wyoming, and Utah. The belt features north- south-oriented, eastward-directed folds and imbricate thrust faults. In Idaho, the overthrust belt includes formations from the Laramide Orogeny (80–35 Ma) and the earlier Sevier Orogeny (160–50 Ma). About 17 million years ago, Basin and Range extension and normal faulting began, forming linear north-south and northwest-southeast trending mountain ranges in southeastern and east-central Idaho. This extension overlaid the older thrust belt, creating sedimentary basins with sandstone, conglomerate, and limestone deposits ranging in age from the Miocene to recent. The Salt Lake Group was deposited during Tertiary/Pliocene time, prior to the Quaternary/Pleistocene, Bonneville flood events which further shaped the region, carving drainage paths down-gradient to the Snake River Valley, including Cache Valley.
Tertiary rocks of the Salt Lake Group consist of conglomerates, siltstones, sandstones, limestones, and tuffaceous sedimentary units deposited in and along the flanks of extensional basins. The Cache Valley Formation of the Salt Lake Group contains the zeolite beds that form the basis for this current investigation into the zeolite mineralization found at the Bear River deposit.
Cache Valley is a long, narrow intermontane basin, approximately 60 miles by·l7 miles wide, tapering gradually at both ends. The valley floor rises gently northward from 4,400 feet near Hyrum, Utah to 4,800 feet: near Banida, Idaho. Structurally, Cache Valley, directly to the west of the property, lies along the Wasatch Fault Zone, part of the Basin and Range Province. It is characterized by north-striking, high- angle normal faults (the East Cache and West Cache fault zones). The valley is a result of crustal extension that began around 15 to 20 million years ago. Here, the Paleozoic rocks were folded into northward and southward trending flexures and dislocated by high-angle faults. The Cenozoic beds, in most localities, dip eastward at relatively low angles and are displaced only to a minor degree by faulting. They overlie the older rocks with pronounced unconformity.
The Bear River Zeolite deposit itself is a thick sedimentary deposit of zeolitized volcanic ash of Tertiary age deposited in the Cache Valley Formation of the Salt Lake Group. The sedimentary interval in which the clinoptilolite occurs is more than 1000 feet thick in this area. Thick intervals of the zeolite are separated by thin beds of limestone which was deposited in the freshwater lake where the volcanic ash accumulated. The zeolite and limestone layers are overlain by zeolite rich soil varying in thickness from a few inches to approximately 12 feet.
| GeoGRAFX GIS Services | July 2, 2025 |
| Bear River Zeolite Project Franklin County, USA | Page: 20 |
The Bear River zeolites consist of a recurring sequence of over 93 feet of olive green to gray green tuffaceous zeolite bearing sediments interspersed with lenses of what is locally termed “limey shale” overburden which is locally derived from thinly layered rhyolitic tuff. In some areas, this cap exceeds 40 feet in thickness and forms a mechanically competent layer that supports ridgelines. Where this cap is thin or absent, increased erosion of the underlying zeolitized tuff is observed.
Mineralogically, the Bear River Zeolite consists of approximately 77 to 85% clinoptilolite with the remainder consisting primarily of opaline silica. Clinoptilolite is a natural zeolite mineral, primarily composed of hydrated aluminosilicates of sodium, potassium, and calcium with the chemical formula (Na, K, Ca)2-3Al3(Al, Si)2Si13O.12H2O. Its unique, porous crystal structure enables it to absorb and exchange ions, making it valuable in filtering, detoxifying, and nutrient exchange applications.
The properties of the zeolite at BRZ reflect its formation conditions, including:
|
| · | The temperature of the air-fall tuff at the time of deposition; |
|
| · | The composition of the felsic volcanic ash; |
|
| · | And the chemistry of the lake waters in which the ash was altered. |
The primary alkali component—whether calcium, sodium, or potassium—is largely determined by the chemical composition of these waters.
BRZ clinoptilolite samples typically exhibit high cation exchange capacity (CEC) values ranging from 98 to 178 meq/100g, low sodium content (<0.5%), high potassium content, and a Mohs hardness of 3.5 to 4. The consistency of these geochemical and physical properties across the deposit supports a robust geologic model and contributes to predictable product performance.
The zeolite deposits in the Tertiary Cache Valley Formation of the Salt Lake Group formed in a lacustrine depositional environment characterized by:
|
| · | Low-energy lake basins that accumulated thick layers of volcanic ash. |
|
| · | Interaction of volcanic ash with alkaline/saline waters, leading to diagenetic alteration. |
|
| · | Stable geochemical conditions that promoted zeolite mineral growth, particularly clinoptilolite, analcime, and chabazite. |
The deposit type is considered an example of a sedimentary zeolite in tuffs of a closed hydrologic system.
1.6 History and Exploration
Early work by the U.S. Bureau of Mines and U.S. Geological Survey identified the zeolite occurrences in the Salt Lake formation at the Bear River location as a potential source of clinoptilolite.
During 2000, USAC formed a 75% owned subsidiary, Bear River Zeolite Company (BRZ), to mine and market zeolite and zeolite products from a mineral deposit in southeastern Idaho. In 2001, an operating plant was constructed at the zeolite site and zeolite extraction and sales commenced. During 2002, USAC acquired the remaining 25% of BRZ and continued to extract and sell zeolite products.
| GeoGRAFX GIS Services | July 2, 2025 |
| Bear River Zeolite Project Franklin County, USA | Page: 21 |
Shortly after its formation, BRZ constructed a processing plant on the property, which has been routinely upgraded to accommodate increased demand, expanded product lines, and improved operating efficiency. Groundbreaking for an additional warehouse and equipment shop began in 2021, and both facilities were completed in 2023.
A vertical-shaft impactor (VSI) crusher was replaced by a hammer mill in 2021 for Crushing Line #1, increasing production rates. A replacement jaw crusher was also installed in 2021 and was enhanced later that year with a variable-speed apron feeder. Substantial improvements were made to the jaw crusher system again in 2022.
Historic exploration was limited to examination and sampling of surface outcrops. Modern exploration activities resumed in 2024, including topographic surveys, geologic mapping in the pit area, and surface geochemical sampling.
The 2024 program also marked the first exploration drilling campaign conducted on the property.
Since its inception in 2000, BRZ has conducted drilling, mining studies, metallurgical testing, permitting and environmental activities, and active mining operations, as described in this report.
1.7 Drilling and Sampling
In June 2024, a drilling contractor conducted a drilling program using a percussion rock drill. The percussion rig drilled 82 shallow, vertical holes with a diameter of 3.5 inches, reaching a maximum depth of 84 feet each. Of these, 80 holes were successfully completed, totaling 6,713 feet (2,046 meters) of drilling. The drill holes were spaced approximately 100 feet apart and positioned using the available access roads.
The BRZ contract geologist logged the drill holes for rock type and lithology using small, washed, representative chip samples. The logging information was recorded on paper forms and then later entered into electronic spreadsheets.
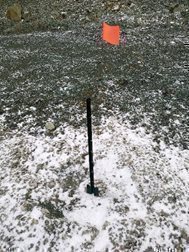
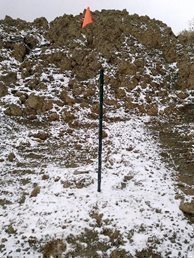
Drill collars were initially located by the project geologist using UTM coordinates and downloaded onto a handheld GPS unit. Each proposed drill pad was located in the field using a differential GPS (DGPS) unit with a positional accuracy of approximately 2.5 meters. A wooden stake marked with the pad name was placed at each location. Upon hole completion, all drill collars were marked with a survey flag attached to a metal stake inserted into the collar plug. Collar locations were entered into electronic spreadsheets for data management.
Cuttings from the drill rig were collected from an air exchange purge valve mounted on the drill rig in six-foot increments, then split, bagged and tagged. The entire drill hole was sampled.
Fourteen representative samples for bulk density measurement were collected by the contract geologist from three main excavations on the mine site. Samples were dried, coated in paraffin, and processed using the water displacement method. Bulk density values ranged from 2.0 to 2.6 g/cm³, depending on lithology, and were used in resource estimation.
Independent, ISO/IEC 17025:2017-accredited laboratories used for analysis include ALS Global (ALS) in North Vancouver, BC, Canada, ALS Environmental in Saskatoon, SK, Canada, and SGS Canada, Inc. located in Lakefield, Ontario, Canada. All laboratories are independent of BRZ and its parent company, US Antimony Corporation.
| GeoGRAFX GIS Services | July 2, 2025 |
| Bear River Zeolite Project Franklin County, USA | Page: 22 |
At ALS laboratory in North Vancouver, samples were dried, crushed to greater than 70% of the sample passing 2mm, and pulverized to greater than 85% passing a 425μm screen. Pulverized splits from each of the prepared samples was sent to the ALS Environmental Lab in Saskatoon, Saskatchewan, Canada for Cation Exchange Capacity (“CEC”) determination (ALS Code: E407). Cation Exchange Capacity was determined by ammonium acetate (NH4Oac) extraction. The ammonium ions will displace cations present on exchange sites in the sample. The ammonium acetate solution is flushed from the sample using alcohol. The treated sample is then extracted using potassium chloride where potassium ions displace the ammonium on the active sites in the sample. The ammonium ions in solution are then analyzed by the colorimetric method using a discrete analyzer. The ammonium concentration in the extract is a direct representation of the cation exchange capacity of the sample. Values were reported in milliequivalents per 100 grams (meq/100 g).
Based on the CEC analytical results, fourteen representative samples were sent to SGS Canada, Inc. in Lakefield, Ontario, each weighing up to 250 g for assay and X-ray diffraction (XRD) analysis. Bulk crystalline minerals identified by X-ray diffraction analysis were processed using RIR method and reported in weight percent. Mineral abundances generated by RIR method XRD analysis were reconciled with a Whole Rock Analysis plus any other major elements contained in the sample and reported.
BRZ implemented QA/QC protocols to monitor precision and accuracy of sampling, preparation, and analysis. Commercial standards were not available for natural zeolite, which is typical for industrial minerals of this type and composition. As a result, certified reference materials could not be included in the sample stream. Instead, BRZ’s QA/QC program included the routine insertion of coarse blanks and field duplicate samples to monitor analytical precision and contamination.
QA/QC samples were inserted at a frequency of approximately 1 in 20 samples, including 26 blanks and 25 duplicates—representing 5.4% of all assayed intervals. Field duplicates were collected at the rig in real time with the primary sample. Assay results of blanks and duplicates were monitored routinely.
Blanks returning values more than ten times the detection limit were flagged as analytical failures. Review of 2024 QA/QC data indicated no material bias or contamination in the sample stream.
1.8 Data Verification
Data verification activities included review of CEC assay results, confirmation of spatial and lithological data integrity, and field inspections. This process involved an independent comparison of Cation Exchange Capacity (CEC) values for selected samples, as well as a systematic review of the project database for internal consistency, including checks for unique sample identifiers, non-overlapping intervals, and correct collar coordinates.
The Qualified Person (QP) personally verified a total of 182 assay records in the drillhole database, and reviewed the 2024 QA/QC program, including blank and duplicate results. The QP also confirmed the land status of BRZ’s unpatented placer mining claims and conducted field verification of selected drill collar locations to ensure positional accuracy.
| GeoGRAFX GIS Services | July 2, 2025 |
| Bear River Zeolite Project Franklin County, USA | Page: 23 |
The QP believes that the data verification procedures adequately support the geological interpretation, ensure the reliability of analytical data and database structure, and are appropriate for use in Mineral Resource and Reserve estimation, as well as for ongoing mine planning.
1.9 Mineral Processing and Metallurgical Testing
The Bear River Zeolite (BRZ) Project involves industrial mineral processing, rather than conventional metallurgical extraction. The value of the deposit lies in the natural ion-exchange, adsorption, and filtration properties of high-purity clinoptilolite zeolite. Testing has focused on characterizing the physical and chemical attributes of the zeolite—particularly its Cation Exchange Capacity (CEC), mineralogical composition, and suitability for industrial, environmental, and agricultural applications. The results of these investigations support the technical and economic assumptions used in this Report.
1.9.1 Testing Overview and Methodology
Metallurgical and analytical testing for the BRZ Project focused on evaluating the CEC, mineralogical composition, and geochemical consistency of the Zeo1 lithologic unit, which forms the economic core of the deposit. Key testwork included:
|
| · | CEC Analysis: A total of 559 Zeo1 samples from the 2024 drill program were analyzed by ALS Environmental Lab, Saskatoon, Canada, using ammonium acetate extraction (ALS Code E407). |
|
|
|
|
|
| · | X-Ray Diffraction (XRD): Fourteen representative samples were analyzed by SGS Canada, Inc., (Lakefield, Ontario) to determine mineralogical composition using the RIR method. |
|
|
|
|
|
| · | Whole Rock and Elemental Analysis: Eight Zeo1 samples were analyzed for major and trace elements by SGS Canada labs. |
Both ALS and SGS are ISO/IEC 17025:2017 accredited and independent of Bear River Zeolite and US Antimony Corporation.
1.9.2 Key Findings and Mineralogical Characteristics
|
| · | Clinoptilolite Content: Average 81.2%, ranging from 76.6% to 85.4%. |
|
| · | CEC Values: Average 146.45 meq/100g, ranging from 97.6 to 178 meq/100g. |
|
| · | Purity: No detectable calcite, dolomite, or sulfides; trace quartz, feldspar, cristobalite, and iron oxides present |
|
| · | Bulk Chemistry: Silica-rich (~67.2%), aluminosilicate dominant; low Fe₂O₃ (~2.3%) and MgO (~0.56%) content. |
The correlation between clinoptilolite content and CEC values confirms that the deposit meets industry standards for ion-exchange and filtration performance. These characteristics support the material’s application in water treatment, soil remediation, animal nutrition, and odor control.
1.9.3 Qualified Person’s Assessment
The Qualified Person considers the test data to be technically sufficient and representative for use in the Technical Report Summary. The analytical protocols followed accepted industry standards and were conducted by independent, certified laboratories. The extensive CEC dataset and supporting mineralogical analyses provide a reliable basis for product specification and mine planning. Variability in test results reflects expected heterogeneity in grain size, alteration intensity, and lithologic mixing, and does not materially impact confidence in the processing assumptions or product performance.
| GeoGRAFX GIS Services | July 2, 2025 |
| Bear River Zeolite Project Franklin County, USA | Page: 24 |
1.10 Mineral Resource Estimation
The Mineral Resource estimate for the Bear River Zeolite Project reflects the application of SEC Regulation S-K 1300 standards and is based on three-dimensional geologic modeling of zeolite-bearing units constrained by grade, continuity, and data confidence. The following subsections summarize the estimation methodology, classified Mineral Resources exclusive of reserves, and factors that may influence the estimate over time. The full Mineral Resource statement, including Effective Date and Qualified Person responsibility, is presented in Section 11 of this report.
1.10.1 Estimation Methodology
The Mineral Resource estimate was prepared using a 3D block model constrained by geologic interpretation and a cutoff grade of 100 meq/100g CEC. Resources were classified as Measured, Indicated, or Inferred based on drill density, lithologic confidence, and data quality. No capping or compositing was required. Estimation was conducted in accordance with SEC Regulation S-K 1300 standards using validated drill data and surface mapping.
1.10.2 Mineral Resource Statement
As of May 22, 2024, the Bear River Zeolite Project is estimated to contain the following in-situ Mineral Resources, reported above a cutoff grade of 100 meq/100g CEC and exclusive of Mineral Reserves.
Measured and Indicated Mineral Resources are summarized in Table 11-11 in compliance with SEC Regulation S-K 1300, and Inferred Mineral Resources are summarized separately in Table 11-12.
Table 1-1 Measured and Indicated Mineral Resources (Exclusive of Reserves)
| Geologic Model | Category | Mass short tons | Average Value All Material OK CEC |
| Zeolite | Measured | 54,000 | 147.16 |
| Indicated | 285,000 | 145.41 | |
| Measured + Indicated | 339,000 | 146.16 | |
| Differences may occur in totals due to rounding | |||
Table 1-2 Inferred Mineral Resources (Exclusive of Reserves)
| Geologic Model | Category | Mass short tons | Average Value All Material OK CEC |
| Zeolite | Inferred | 426,000 | 139.71 |
| Differences may occur in totals due to rounding | |||
These estimates are based on validated drill data and block modeling of zeolite-bearing tuffs, incorporating all drilling, sampling, and technical data available through May 22, 2024. The Mineral Resource estimates reflect the tonnage and grade of material with reasonable prospects for economic extraction under current conditions.
| GeoGRAFX GIS Services | July 2, 2025 |
| Bear River Zeolite Project Franklin County, USA | Page: 25 |
1.10.3 Factors That May Affect the Mineral Resource Estimate
The estimate may be affected by future changes in cutoff grade, market demand for zeolite, mining recovery factors, or additional drilling that could better define grade continuity and extend known mineralized zones. No known legal, technical, or permitting limitations currently affect the accessibility or extractability of the Mineral Resources.
1.11 Mineral Reserve Estimation
The Mineral Reserve estimate for the Bear River Zeolite Project reflects a robust evaluation of the economically mineable portion of the Measured and Indicated Mineral Resources, using well-supported modifying factors and established pit design parameters. Prepared in accordance with SEC Regulation S- K 1300, the Reserve estimate demonstrates the Project’s economic viability under current operating and market conditions. This section summarizes the estimation methodology, Reserve classification results, and key risk factors that may influence Reserve confidence or long-term extraction potential. The full Mineral Reserve statement, including Effective Date and Qualified Person responsibility, is presented in Section 12 of this report.
1.11.1 Estimation Methodology
The Mineral Reserve estimate was prepared in compliance with the disclosure standards of SEC Regulation S-K 1300 by independent Qualified Person Randall K. Martin, SME-RM. The estimate is based on the Measured and Indicated Mineral Resources, incorporating inputs derived from the 2024 geologic model and operational data provided by site management. A 3D pit optimization analysis was conducted utilizing the Colorado School of Mines MineFlow™ software, incorporating geotechnical slope angles, economic assumptions, and operational data provided by site management.
Key modifying factors applied in the reserve estimation include:
|
| · | Long-term zeolite product price: $287.93/ton |
|
| · | Mining cost: $7.50/ton mined |
|
| · | Processing cost: $159.24/ton processed. |
|
| · | G&A cost: $76.19/ton processed. |
|
| · | Specific gravity: 2.2 g/cc for zeolite |
|
| · | Processing recovery: 100% |
|
| · | Mining dilution and recovery: 0% dilution, 100% recovery |
|
| · | Pit slope angle: 45 degrees. |
|
| · | Property limits: Only blocks within company-owned boundaries included. |
Inferred Resources were excluded from the estimate. Only blocks within the final pit shell and within the company-owned property boundaries were considered.
1.11.2 Mineral Reserve Statement
As of the effective date of May 31, 2025, the Bear River Zeolite Project hosts the following Mineral Reserves, reported as dry in situ tons and exclusive of Mineral Resources summarized in Table 12-1 below:
| GeoGRAFX GIS Services | July 2, 2025 |
| Bear River Zeolite Project Franklin County, USA | Page: 26 |
Table 1-3 Mineral Reserve for Bear River Zeolite Project
| Classification | Tonnage short tons | Grade (CEC meq/100g) | Recovery (%) | Saleable Product short tons |
| Proven | 2,267,000 | 147.0 | 100 | 2,267,000 |
| Probable | 2,860,000 (*) | 145.5 | 100 | 2,860,000 |
| Total | 5,127,000 (*) | 146.2 | 100 | 5,127,000 |
(*) The Probable category has been adjusted downward to reflect approximately 12,600 tons of material mined between the date of topographic survey (May 22, 2024) and the report effective date (May 31, 2025). All mined material was sourced from the Probable category.
At the current production rate of approximately 12,600 short tons per year, the Reserve supports a theoretical mine life exceeding 400 years. Even with a 20-fold increase in production, the Reserve could support two or more decades of operations.
1.11.3 Factors That May Affect the Mineral Resource Estimate
The Qualified Person has identified several risk factors that could materially affect the Mineral Reserve estimate:
|
| · | Market Volatility: Fluctuations in zeolite prices may impact on economic viability. |
|
| · | Geological Variability: Changes in mineral quality (CEC, % clinoptilolite) or continuity not captured by current drilling may affect reserve confidence. |
|
| · | Cost Inflation: Increases in fuel, labor, haulage, and processing costs could reduce margins. |
|
| · | Regulatory Risk: Future environmental or permitting constraints may limit mine operations or expansion. |
|
| · | Logistics and Infrastructure: Transport capacity or access limitations could restrict throughput. |
|
| · | Drillhole Spacing: Some zones remain classified as Probable due to sparse drilling; infill drilling is recommended to upgrade classification to Proven. |
1.12 Mining Methods
The Bear River Zeolite Project utilizes conventional open-pit mining methods, employing a truck-and- loader fleet in conjunction with controlled drilling and blasting. The operation is optimized for the selective recovery of high-grade zeolite from shallow, gently dipping beds within the Cache Valley Formation.
Mining is conducted on 20-foot benches, with visual ore control performed in the field by trained operators and geologists. This allows for real-time differentiation between ore and waste materials, ensuring high selectivity and minimal dilution. Due to the strong lithologic contrast between zeolite-rich units and waste (e.g., rhyolitic tuff or limey shale), dilution is not a significant concern, and no explicit dilution factor is applied in the mine plan.
No ore blending is required at the pit level. Ore is delivered either directly to the processing plant or stockpiled, depending on plant feed needs and operational logistics. Overburden stripping is conducted as needed using conventional dozers and hydraulic excavators.
| GeoGRAFX GIS Services | July 2, 2025 |
| Bear River Zeolite Project Franklin County, USA | Page: 27 |
Pit advancement is phased to maintain multiple working faces and provide operational flexibility. This ensures continuous access to ore while allowing for concurrent waste stripping and road maintenance. The current mining configuration is well-suited to the geometry and geomechanical characteristics of the deposit and is expected to remain appropriate over the life of mine.
1.13 Processing and Recovery Methods
The Bear River Zeolite Project utilizes a dry mechanical processing system consisting of crushing, screening, and packaging facilities located on site. Run-of-mine (ROM) material is transported directly from the pit to a surface stockpile, from which it is fed into the primary crushing circuit.
The processing system is designed to produce multiple particle size fractions in accordance with customer specifications. All processing occurs within enclosed shelters to protect the zeolite material from moisture prior to and during handling. No chemical reagents or water are used, and no tailings or wastewater streams are generated, as the beneficiation process relies solely on size reduction and material classification.
The final product is packaged in customer supplied (25 to 55 lb.) bags, bulk bags (supersacks) or loaded as bulk material for shipment to customers.
The plant currently operates at a nominal throughput rate of approximately 12,600 short tons per year, consistent with market demand and sales volumes. This throughput rate forms the basis for the Mineral Reserve estimate (Section 12) and the economic analysis (Section 22).
Historical production in 2024 totaled 11,095 short tons. Incremental improvements to the crushing and screening circuits are underway, with a target throughput increase to 14–18 tons per hour projected by late 2025. These upgrades are designed to improve operational efficiency without materially altering the flowsheet or processing methodology, which remains consistent with historical practice at the site.
First quarter 2025 production totaled 3,802 short tons, up from 2,273 short tons in Q1 2024—an increase of 1,529 short tons year-over-year. This growth underscores the effectiveness of recent equipment and operational enhancements.
1.14 Infrastructure
All infrastructure necessary to support mining and processing operations at the Bear River Zeolite (BRZ) Project is fully constructed, operational, and considered sufficient to support the life-of-mine (LOM) plan. The site includes all-weather mine access roads, power supply, water systems, communications infrastructure, and on-site processing facilities. No material infrastructure gaps have been identified by the Qualified Person that would limit the feasibility of continued operations.
1.14.1 Site Facilities and Layout
The BRZ site includes an open pit mine, a fully equipped processing plant with crushing, screening, and packaging circuits, enclosed ore storage sheds, a warehouse, administrative offices, and ancillary buildings. The infrastructure layout supports efficient internal logistics and operational safety through controlled site access, fencing, and natural topographic features that function as barriers.
On-site employee accommodations are not required, as the workforce commutes from nearby towns with established housing, utilities, and services.
| GeoGRAFX GIS Services | July 2, 2025 |
| Bear River Zeolite Project Franklin County, USA | Page: 28 |
1.14.2 Power and Communications
Electricity is supplied by Rocky Mountain Power via a 12.47 kV line and a 750 kVA transformer, currently operating at approximately 50% of peak capacity. The utility has confirmed adequate capacity to support future site expansions up to 2,000 kVA.
Site communications are well-developed, with dual internet systems (Rise Broadband and Starlink), VoIP phone service, Ubiquiti-managed Wi-Fi, two-way radios, and a signal-boosted Verizon cellular system.
Uninterruptible power supply (UPS) units protect critical networking equipment during short-term outages.
1.14.3 Water and Fuel Supply
Water for dust control and general operational use is sourced from a well located on leased private land, under agreement with the landowner. Potable water is delivered by a third-party vendor (Culligan). Dust suppression is conducted using water trucks and engineered drainage channels to manage stormwater.
Fuel infrastructure includes:
|
| · | A 2,000-gallon diesel aboveground storage tank (AST) |
|
| · | A 200-gallon mobile diesel tank |
|
| · | A skid-mounted gasoline tank used for small engines and equipment. |
1.14.4 Roads, Rail, and Transportation
The site is accessed via a combination of paved highways (ID-34 and Glendale Road) and a maintained gravel road suitable for semi-truck transport. Internal haul roads connect the mine, plant, and stockpile areas.
Preston, Idaho, is served by the Union Pacific Railroad’s Cache Valley branch. Although the BRZ site is not directly rail-served, regional freight access via Union Pacific and BNSF routes through Pocatello provide logistical flexibility for bulk product transport.
1.14.5 Waste and Reclamation Management
Due to the deposit’s low strip ratio, minimal waste rock is generated during operations. Waste material is inert and is used for internal road construction and site reclamation. Formal Waste Rock Storage Facilities (WRSFs) are not required.
Topsoil is stripped selectively and used for reclamation as needed. No long-term top-soil stockpiles are maintained beyond operational requirements.
Qualified Person’s Assessment
The Qualified Person has reviewed the BRZ site’s infrastructure and confirms that it is adequate to support both current and planned operations and the projected life-of-mine plan. No infrastructure deficiencies were identified that would materially affect the implementation of the mine plan or processing strategy.
| GeoGRAFX GIS Services | July 2, 2025 |
| Bear River Zeolite Project Franklin County, USA | Page: 29 |
1.15 Markets and Contracts
The Bear River Zeolite (BRZ) Project produces high-purity natural clinoptilolite zeolite for a wide range of industrial, agricultural, and environmental applications. Unlike commodity metal markets, the value of BRZ's products is tied to their functional properties—particularly ion-exchange capacity and adsorption performance—rather than to market-based metal pricing. Recent market analysis and internal sales data indicate growing demand for BRZ’s product line across multiple sectors, supporting the long-term economic viability of BRZ’s operations.
1.15.1 Market Overview and Product Positioning
Natural zeolite is a niche industrial mineral with diverse applications. BRZ holds approximately 22% of the North American zeolite market, supplying product across sectors including agriculture, animal feed, water treatment, and environmental cleanup. The global market for natural zeolites reached $7.3 billion in 2023 and is projected to grow at a 2.9% CAGR, reaching $9.4 billion by 2032, according to Acumen Research and Consulting.
BRZ offers a range of granular, powdered, and blended zeolite products, tailored to specific market segments. In 2024, BRZ launched CattleMax™, a branded livestock feed additive, to expand its presence in the animal health sector. Key application areas and estimated revenue distribution include:
|
| · | Agriculture (30%): Soil conditioning and water retention |
|
| · | Animal Feed (25%): Digestive health and toxin absorption |
|
| · | Water Treatment (20%): Ammonia and heavy metal removal |
|
| · | Environmental Cleanup (15%) |
|
| · | Odor Control (10%) |
1.15.2 Pricing and Sales Strategy
BRZ's average sales price reached $264 per ton in 2024, reflecting enhancements to product quality and packaging. The company anticipates a 10% price increase in 2025, based on sustained demand and cost recovery. Zeolite pricing remains highly dependent on grade, particle size, and intended application— ranging from $50/ton for bulk soil additives to over $300/ton for specialized industrial and environmental products.
BRZ operates without long-term offtake or hedging contracts. Sales are managed through spot or short- term agreements, with terms negotiated directly with end users or distributors. All commercial terms are consistent with prevailing industry practices, and there are no related-party transactions or insider arrangements associated with the sale of the product.
Qualified Person's Assessment
The Qualified Persons have reviewed BRZ’s market share, historical pricing, and contracting strategies and consider the supporting data to be reasonable and appropriate for use in economic evaluations, Mineral Reserve estimation, and mine planning. The company’s flexible product portfolio, regional market position, and ongoing operational enhancements are expected to support continued growth and sustained market participation.
| GeoGRAFX GIS Services | July 2, 2025 |
| Bear River Zeolite Project Franklin County, USA | Page: 30 |
1.16 Environmental, Permitting and Social Considerations
The Bear River Zeolite property includes both privately leased ground and adjacent federal (BLM- managed) mining claims. All current mining and processing operations are confined to the private lease area. No baseline field studies were required at the time of mine development. However, the Company has undertaken desktop environmental analyses and permitting actions consistent with Idaho state regulations and to satisfy SEC Regulation S-K 1300 disclosure requirements.
All permits necessary for current operations have been obtained and are summarized below. Each permit outlines potential environmental impacts, includes required operational controls, and incorporates closure and reclamation provisions where applicable.
1.16.1 Permitting
Permitting for the BRZ Project is managed primarily at the state and county levels. The following authorizations are in place:
|
| · | Idaho Department of Environmental Quality (IDEQ) Air Quality Permit to Construct No. P- 2007.0025 (Rev. January 2025). |
|
|
|
|
|
| · | Franklin County land use and zoning compliance for mineral processing and industrial operations. |
|
|
|
|
|
| · | No water discharge permits, water rights filings, or tailings permits are required under the current operational configuration. |
Because mining and processing take place exclusively on private land, BRZ is not subject to BLM mine plan review or NEPA requirements. Permitting risk is therefore considered low, and the company maintains a history of compliant operations.
1.16.2 Environmental Studies and Monitoring
No formal baseline environmental fieldwork has been conducted, as it was not required under applicable Idaho regulations for private land operations. Instead, a series of desktop environmental reviews were conducted using publicly available datasets to evaluate potential environmental sensitivities within the project footprint. These include:
|
| · | Wetlands: U.S. Fish and Wildlife Service National Wetlands Inventory (NWI) data showed no mapped wetlands within the disturbed or permitted area. |
|
| · | Soils: NRCS SSURGO data indicate well-drained soils typical of previously disturbed rangeland. |
|
| · | Air Quality: Managed under Idaho DEQ Permit to Construct No. P-2007.0025 (Rev. 2025), with operational BMPs including misting and belt skirting. |
|
| · | Wildlife and Habitat: U.S. Fish and Wildlife Service IPaC screening identified potential regional presence of federally listed species, but no critical habitat or documented species occurrences within the project footprint. |
|
| · | Sage-Grouse: Desktop habitat mapping indicates the site lies outside Priority Habitat Management Areas (PHMAs), with only low-value general habitat present near the project boundary. |
|
| · | Vegetation: Review of regional vegetation maps shows typical Great Basin shrub-steppe communities, with no identified sensitive plant species. |
| GeoGRAFX GIS Services | July 2, 2025 |
| Bear River Zeolite Project Franklin County, USA | Page: 31 |
These reviews confirm that the project area has a low likelihood of intersecting environmentally
sensitive resources and support the conclusion that BRZ’s operations pose minimal risk of adverse environmental impact. No ongoing monitoring programs are currently in place. Operational BMPs— especially for dust suppression—are implemented consistent with IDEQ guidance and permit conditions.
1.16.3 Closure and Reclamation Considerations
All current surface disturbance at the Bear River Zeolite operation is located on privately leased land. No development or mining activity has yet occurred on the federally administered (BLM) portion of the property. As such, no federal reclamation bond has been required or filed to date.
Reclamation of disturbed areas is conducted on an ongoing basis, with the use of locally sourced native seed to stabilize and revegetate exposed ground. While Idaho does not require a formal reclamation bond for private land operations, BRZ maintains a mine plan that includes:
|
| · | Final grading of haul roads, stockpiles, and benches |
|
| · | Erosion control measures |
|
| · | Revegetation using appropriate native species. |
Because the deposit contains no sulfide minerals, there is no potential for acid rock drainage (ARD). As a result, closure liabilities are considered minimal, and concurrent reclamation has reduced the need for future large-scale earthworks.
1.16.4 Social Considerations, Plans, Negotiations and Agreements
There are no tribal lands, subsistence resources, or traditional cultural sites within or adjacent to the BRZ Project areas. The area is rural and sparsely populated, and BRZ’s operations have been ongoing since the early 2000s without any recorded conflicts or public opposition.
No social impact or community impact agreements are in place, and none are required. BRZ maintains informal but positive relationships with nearby landowners, local authorities and regional stakeholders. No public opposition or permitting challenges have been documented..
1.17 Capital and Operating Cost Estimates
Capital and operating cost estimates for the Bear River Zeolite (BRZ) Project were developed using a combination of historical actuals and forward-looking assumptions. Site cost data from 2019 through 2024 form the empirical basis for projections covering 2025 and 2026.
Capital expenditures are reported as annual aggregates and include scheduled investments in infrastructure maintenance, mobile equipment replacement, and plant system upgrades. These estimates reflect actual expenditures for recent construction (e.g., warehouse/shop facilities completed in 2023), as well as anticipated replacement intervals for critical processing and support equipment.
Operating costs are presented on a per-ton processed basis, and include:
|
| · | Mining (drilling, blasting, loading, hauling, overburden removal) |
|
| · | Processing (crushing, screening, and packaging) |
|
| · | General and Administrative (G&A) (site labor, utilities, insurance, compliance) |
| GeoGRAFX GIS Services | July 2, 2025 |
| Bear River Zeolite Project Franklin County, USA | Page: 32 |
These costs reflect current throughput rates and do not incorporate inflation escalators or scale-up assumptions beyond minor incremental efficiency gains projected in 2025. Refer to Section 18 for a full breakdown of capital expenditures and Section 19 for a detailed life-of-mine economic analysis, including sensitivity scenarios.
The Qualified Person considers capital and operating cost assumptions to be reasonable, representative of current conditions, and sufficiently robust to support the Mineral Reserve estimate and associated economic analyses. All estimates are presented in U.S. dollars and assume continued operations at current production capacity (~12,600 tons/year).
1.18 Economic Analysis
An economic analysis was completed to evaluate the Bear River Zeolite (BRZ) Project’s ability to sustain profitable operations under current conditions. A simplified, pre-tax cash flow model was developed using actual 2025 production rates, average realized sales prices, and verified site-specific operating costs, all of which are detailed in Section 19.
To maintain conservative assumptions and reflect observed performance, the model holds these 2025 values constant over the 5-year projection period. No escalation, discounting, or long-term growth adjustments were applied.
The model incorporates a 10% aggregate royalty burden on gross product sales, consistent with the combined royalty structure outlined in Section 3.4. Federal and state income taxes, financing charges, and salvage value are excluded from the analysis, as permitted by SEC Regulation S-K 1300 for pre-tax cash flow modeling.
The analysis assumes:
|
| · | 100% product recovery |
|
| · | No mining dilution or losses |
|
| · | Steady-state production of 12,600 tons/year |
|
| · | Consistent revenue and cost assumptions based on verified 2025 data. |
These inputs result in a pre-tax cash flow of $2,149,856 per year, totaling approximately $10.75 million over the 5-year projection, as shown in Table 19-1. The analysis demonstrates strong positive cash flow under base-case conditions and confirms the Project’s ability to operate profitably using conservative, documented production and cost data. Based on the current production rate, the mine life supported by the defined Mineral Reserve exceeds 400 years.
Table 1-4 Simplified Pre-Tax Cash Flow Summary
| Year | Tons Sold | Revenue ($) | Operating Costs ($) | Capital Costs ($) | Royalties ($) | Pre-Tax Cash Flow ($) |
| 2025 | 12,600 | $3,364,200 | $777,924 | $100,000 | $336,420 | $2,149,856 |
| 2026 | 12,600 | $3,364,200 | $777,924 | $100,000 | $336,420 | $2,149,856 |
| 2027 | 12,600 | $3,364,200 | $777,924 | $100,000 | $336,420 | $2,149,856 |
| Year | Tons Sold | Revenue ($) | Operating Costs ($) | Capital Costs ($) | Royalties ($) | Pre-Tax Cash Flow ($) |
| 2028 | 12,600 | $3,364,200 | $777,924 | $100,000 | $336,420 | $2,149,856 |
| 2029 | 12,600 | $3,364,200 | $777,924 | $100,000 | $336,420 | $2,149,856 |
Note: Five-year projection shown for illustration. Actual production life extends well beyond this period based on current Reserves.
| GeoGRAFX GIS Services | July 2, 2025 |
| Bear River Zeolite Project Franklin County, USA | Page: 33 |
A sensitivity analysis was performed to evaluate the impact of changes in sales price and operating costs. The project remains economically robust under sensitivity scenarios of up to ±20% in both price and cost variables.
|
| · | A ±10% change in sales price results in a significant impact on cash flow |
|
|
|
|
|
| · | A ±10% change in operating costs has a moderate impact. |
|
|
|
|
|
| · | The project maintains robust economics under ±20% changes in either variable. |
The analysis supports the Project’s long-term economic viability and demonstrates its ability to recover capital and generate sustained positive returns using actual operational performance data and assumptions consistent with current operations.
Qualified Person’s Assessment:
Based on this analysis, the Qualified Person considers the Bear River Zeolite Project’s Mineral Reserves to be economically extractable under the stated assumptions. The analysis confirms that current operational practices and market conditions are sufficient to support long-term production.
1.19 Risks and Opportunities
The Bear River Zeolite Project benefits from a large, high-purity mineral inventory and a stable production history, underpinned by robust Mineral Reserves and a well-maintained processing facility. However, as with all industrial mineral projects, certain risks and opportunities could affect long-term performance, economic returns, and development pathways.
1.19.1 Key Risks
|
| · | Market Sensitivity: Zeolite is a niche industrial mineral, and product pricing is closely tied to performance characteristics and end-use demand. Fluctuations in agricultural, environmental, and feed markets may affect revenue. |
|
|
|
|
|
| · | Inflation and Cost Escalation: Rising fuel, labor, packaging, and shipping costs could reduce operating margins if not offset by product pricing. |
|
|
|
|
|
| · | Geological Confidence: Some portions of the Mineral Reserve remain classified as Probable due to limited drilling density. Targeted infill drilling is recommended to improve confidence and upgrade classification. |
|
|
|
|
|
| · | Permitting and Regulatory Risk: While current operations are permitted on private land, any future expansion onto federal (BLM) ground would require additional permitting and potential NEPA review. |
|
|
|
|
|
| · | Infrastructure and Logistics: While current access is sufficient, any future increases in production may require upgraded road, rail, or packaging logistics infrastructure. |
| GeoGRAFX GIS Services | July 2, 2025 |
| Bear River Zeolite Project Franklin County, USA | Page: 34 |
1.19.2 Key Opportunities
|
| · | Resource Conversion: The defined Mineral Resource base includes significant Measured and Indicated material that could be converted to Reserves with pit expansion and mine plan optimization. |
|
|
|
|
|
| · | Process Optimization: Ongoing upgrades to crushing and screening systems may increase throughput and reduce unit costs without major capital investment. |
|
|
|
|
|
| · | Market Expansion: The company is actively pursuing new markets in animal health and water treatment. Continued product development and certification could significantly increase product value. |
|
|
|
|
|
| · | Operational Scale-Up: The deposit could support production levels many times higher than current throughput. Should market conditions warrant, the facility and mine plan could be scaled accordingly. |
|
|
|
|
|
| · | Minimal Closure Liabilities: The lack of sulfide minerals and inert nature of the deposit greatly reduce environmental risk and future closure cost burdens. |
Qualified Person’s Assessment:
The Qualified Person concludes that the Bear River Zeolite Project presents a low-risk, high-confidence industrial mineral operation with strong potential for future optimization and market-driven growth.
1.20 Conclusions
Based on the assumptions and parameters presented in this Report, the Bear River Zeolite Project is projected to generate positive cash flow over the remaining life of mine. The proposed mine plan is technically achievable and economically viable under current operational and market conditions.
The Qualified Persons conclude that there are no known fatal flaws and that all key technical areas— geology, mining, processing, permitting, and economics—have been appropriately addressed to a level sufficient for disclosure.
This Technical Report Summary has been prepared in accordance with the requirements of SEC Regulation S-K 1300 and is considered suitable to support inclusion in the Company’s Annual Report on Form 10-K.
1.21 Recommendations
As the Bear River Zeolite Project is an active, ongoing mining operation with current production and established infrastructure, the Qualified Persons have no material recommendations for additional exploration work at this time. However, they recommend formalizing mine planning, resource development, and reclamation practices as part of routine operations. Waste stripping should be directed toward final reclamation areas, with concurrent topsoiling and reseeding where final contours are achieved.
| GeoGRAFX GIS Services | July 2, 2025 |
| Bear River Zeolite Project Franklin County, USA | Page: 35 |
A significant quantity of high-grade zeolite was delineated in the 2024 exploration drilling program, and no immediate technical work is required to define additional resources. Future exploration drilling will be guided by operational needs, market demand, and strategic decisions by management. No phased programs or associated cost estimates are included at this time.
| GeoGRAFX GIS Services | July 2, 2025 |
| Bear River Zeolite Project Franklin County, USA | Page: 36 |
2 Introduction
2.1 Registrant
Ms. Barbara Carroll, CPG, Mr. P. J. Hollenbeck, CPG, Mr. Randall K. Martin, RM, and Mr. L. J. Bardswich, PE were retained by US Antimony Corporation to prepare a Technical Report Summary (TRS) on the Bear River Zeolite Mine (BRZ), located in southeastern Idaho.
United States Antimony Corp. (USAC), publicly traded on the NYSE under the ticker UAMY, was established in 1969. The company specializes in the extraction, processing, and sale of antimony, zeolite, silver, and gold products. Headquartered in Thompson Falls, Montana, USA, USAC operates across several segments: United States antimony operations, Mexican antimony operations, precious metals recovery, and United States zeolite operations.
USAC acquired the Bear River Zeolite Operations in June 2000 from Bear River Zeolite, LLC. The zeolite operations are conducted by USAC’s wholly owned subsidiary, Bear River Zeolite Company, an Idaho corporation. In 2000, shortly after inception, BRZ began construction on a processing plant on the property. Mining of zeolite at the current location commenced in 2001.
2.2 Scope of Report
2.2.1 Report Purpose
The purpose of this Technical Report Summary (TRS) is to support the disclosure of Mineral Resource and Mineral Reserve estimates for the Bear River Zeolite operation in accordance with the United States Securities and Exchange Commission’s (SEC) Modernized Property Disclosure Requirements for Mining Registrants, as set forth in Subpart 229.1300 of Regulation S-K (S-K 1300) and Item 601(b)(96) of Regulation S-K.
The Mineral Resource and Mineral Reserve estimates presented in this TRS have effective dates of May 22, 2024, as described in detail within this report. This TRS has been prepared to be filed as an exhibit to US Antimony Corporation’s Form 10-K for the year ended December 31, 2024, to provide the required technical support for mineral property disclosures, including the reporting of Mineral Resources and Mineral Reserves under S-K 1300.
The Mineral Resource and Mineral Reserve estimates presented in this report are based in part on results from the 2024 drilling program, which supported updated geological modeling and reserve definition. The Bear River Zeolite operation is an active surface mining operation utilizing conventional truck-and-loader methods to extract zeolite for commercial sale.
2.2.2 Terms of Reference
The Bear River Zeolite project is located in the United States. The majority of the historical and recent reports and documents pertaining to the property primarily use Imperial units of measurement. Where such units are referenced in this report, metric conversions are also provided where applicable.
Unless otherwise stated, all financial values, including operating costs, capital costs, cash flows, taxes, revenues, expenses, and overhead distributions, are presented in United States currency (US$).
| GeoGRAFX GIS Services | July 2, 2025 |
| Bear River Zeolite Project Franklin County, USA | Page: 37 |
This report uses the US customary unit system for mineral resources, mineral reserves, and associated financials, unless otherwise noted.
Mineral resources and mineral reserves are reported using the definitions set forth in Item 1300 of Regulation S–K (17 CFR Part 229) (SK1300) of the United States Securities and Exchange Commission. Illustrations required by S-K 1300 are included in the relevant chapters of the report where specified. This Technical Report Summary has been prepared with specific consideration of the characteristics of an industrial minerals mining operation and the requirements of S-K 1300 as applied to such operations.
2.3 Qualified Persons
The mining professionals preparing this Technical Report are specialists in the fields of geology, exploration, Mineral Resource and Mineral Reserve estimation and classification, metallurgical testing, mineral processing, processing design, capital and operating cost estimation, and mineral economics.
The following serve as the qualified persons or qualified firms for this Report in compliance with 17 CFR
§ 229.1302 (b)(1)(i) and (ii) qualified person definition:
|
| · | Ms. Barbara Carroll, CPG, RM of GeoGRAFX Consulting, LLC |
|
| · | Mr. Patrick J. Hollenbeck, CPG of Blue Goo Enterprises, LLC |
|
| · | Mr. Randall K. Martin, RM, Randall K Martin and Associates, Inc |
|
| · | Mr. Loyd Joseph Bardswich, M. Eng. of US Antimony Corp. |
The QPs have supervised the preparation of this Report and take responsibility for the contents of the Report as set out in Table 2-1. The Date and Signature summary can be found in Section 26 Date and Signature Page.
Table 2-1 Report Contributors and Responsibility
| Qualified Person or Firm | Report Responsibilities | Report Sections |
| Ms. Barbara Carroll, CPG, RM | Geology, Exploration, Mineral Processing, Market Studies, Environmental Studies, Capital and Operating Costs, Economic Analysis | 1.1, 1.2, 1.3, 1.4, 1.5, 1.6, 1.7, 1.8, 1,9, 1.15, 1.16, 1.17, 1.18, 1.19, 1.20, 1.21, 2, 3, 4, 5, 6, 7, 8, 9, 10, 16, 17, 18, 19, 20, 21, 22.1, 22.2, 22.3, 22.4, 22.5, 22.6, 22.12, 22.13, 22.14, 22.15, 22.16, 22.17, 23, 24, 25 |
| Mr. Patrick J. Hollenbeck, CPG | Mineral Resource Estimate | 1.10, 11, 22.7 |
| Mr. Randall K. Martin, RM | Mineral Reserve Estimate | 1.11, 12, 22.8 |
| Mr. L. Joseph Bardswich, M. Eng. PE | Mining Methods, Process and Recovery, Infrastructure | 1.12, 1.13, 1.14, 13, 14, 15, 22.9, 22.10, 22.11 |
Ms. Barbara Carroll, of GeoGRAFX Consulting, LLC is a Certified Professional Geologist (CPG #10987) in good standing with the American Institute of Professional Geologists and a Registered Member (RM) of the Society of Mining Metallurgy & Exploration (4100964RM). She is an independent consultant to the mineral resource sector and a Qualified Person (QP) as defined by 17 CFR §229.1302(b)(1)(i). Ms. Carroll earned a Bachelor of Science in Extended Geology from Northern Arizona University in 1975 and has over 40 years of professional experience in the minerals industry. Her work spans a wide range of mineral resource projects, including gold, silver, polymetallic resources, and industrial minerals across the Americas. Ms. Carroll served as the project manager for the preparation of this report and is the QP responsible for Sections 1 through 10, 16 through 21, and 23 through 25 (except as noted), as well as for the overall content of the report. Email: bcarroll@geografxworld.com.
| GeoGRAFX GIS Services | July 2, 2025 |
| Bear River Zeolite Project Franklin County, USA | Page: 38 |
Mr. Patrick J. Hollenbeck, of Blue Goo Enterprises is a Certified Professional Geologist (CPG) (#11436) in good standing with the American Institute of Professional Geologists and is a “Qualified Person” as defined as defined by 17 CFR §229.1302 (b)(1)(i). He holds a BA in Geology from Colorado College and an MBA from Colorado State University. With over 15 years of experience as a Mineral Resource Modeler and Geostatistical Analyst, Mr. Hollenbeck specializes in Leapfrog and VULCAN software, geological and resource modeling, and reporting. He is the QP responsible for Section 11, 1.10 and 22.7. Email: pj@bluegooenterprises.com.
Mr. Randall K. Martin, president of Randall K Martin and Associates, Inc, is an SME registered member (RM-4063888) and is a “Qualified Person” as defined by 17 CFR §229.1302 (b)(1)(i). He holds both a BS in Metallurgical Engineering and MS in Mineral Economics from the Colorado School of Mines. He has spent 45 years as a resource modeler, mine planner, and computer software engineer. He is president and owner of a software company which specializes in mineral modeling and mine planning tools (MicroMODEL and PolyMap). He is the QP responsible for Section12, 1.11, and 22.8. Email: rkmassoc@comcast.net
Mr. Lloyd Joseph Bardswich, M.Eng. Mining, serves as EVP, Chief Mining Officer, & Director for USAC. bringing extensive experience in all facets of mining. His career spans roles from contract mining and production supervision to mining engineering, heavy civil engineering, and mine management in underground, open-pit, and alluvial operations across Canada, the U.S., Europe, and Africa. He holds a B.A.Sc. in Civil Engineering from the University of Windsor and a Master’s Degree (M.Eng. Mining) from McGill University. Mr. Bardswich is a licensed Professional Engineer (PE) in the State of Arizona and a Professional Engineer (P. Eng.) in the Province of Ontario. He is a life member of the Canadian Institute of Mining and Metallurgy (CIM) and is recognized as a Qualified Person (QP) as defined by 17 CFR
§229.1302(b)(1)(i). In his role with USAC, he serves as Executive Vice President, Chief Mining Officer, and Director of the Company. Mr. Bardswich is the QP responsible for Sections 13, 14, 15, 1.12, 1.13, 1.14, 22.9, 22.10, and 22.11. He has conducted multiple site visits in his role at USAC from February 2021 to the present. Email: joebardswich@hotmail.com
2.4 Site Visits and Scope of Personal Inspection
Ms. Carroll visited the BRZ property on November 5, 2024, accompanied by Jeff Fink, BRZ’s VP & General
Manager and Nick O'Neill, the Plant Superintendent, to complete a QP data verification site inspection.
During this site visit, Ms. Carroll received a project overview by site management that included a tour of the mine itself, review of current drilling, geology, plant tour, discussion of the site security, permitting, mining, and processing operations.
Mr. Hollenbeck has not visited the property. His role as a QP was limited to the preparation of the Mineral Resource Estimate, which was based entirely on technical data provided by BRZ, including drilling, sampling, analytical, and geological information. Mr. Hollenbeck's resource estimate was prepared in accordance with the disclosure requirements of Regulation S-K 1300, utilizing verified datasets and QA/QC protocols, which did not require a site inspection for this scope of work.
| GeoGRAFX GIS Services | July 2, 2025 |
| Bear River Zeolite Project Franklin County, USA | Page: 39 |
Mr. Martin has not visited the property. His role as a QP was focused on the preparation of the Mineral Reserve Estimate, including evaluation of mine planning, processing assumptions, and economic factors, all of which were based on technical information and production data provided by BRZ management and site personnel. Mr. Martin’s reserve estimate was prepared in accordance with Regulation S-K 1300 requirements and is supported by site-derived data, but a personal site visit was not deemed necessary for his specific scope of responsibility.
Mr. Bardswich has visited the mine site multiple times in his role as a Director, Executive Vice President, and Chief Mining Officer of USAC over the period of February 2021 to present and has participated in management and Directors discussions regarding operations at BRZ. Mr. Bardswich was on site for several days to ensure a professional start-up of the exploration drilling program.
2.5 Report Date
The information in this report is current as of March 31, 2025.
Although this Technical Report Summary has an Effective Date of March 31, 2025, it has been prepared to support United States Antimony Corporation’s Annual Report on Form 10-K for the fiscal year ended December 31, 2024, in accordance with SEC Regulation S-K 1300. The Report reflects Mineral Resource and Mineral Reserve estimates based on all available data through March 31, 2025. The Qualified Persons completed and signed off on these estimates following that date, and their respective effective dates are stated in the applicable sections of this Report.
2.6 Information Sources and References
The information, conclusions, opinions, and estimates contained herein are based on:
|
| · | Internal Company technical reports, previous studies, maps, published government reports, company correspondence, third-party contractor reports, and public information as cited throughout this report and listed in References Section 24. |
|
| · | Reliance upon information provided by the registrant is listed in Section 25 where applicable. |
In preparing this Technical Report Summary, the Qualified Persons have relied on information provided by Bear River Zeolite Company management regarding operational history, mining and processing methods, site infrastructure, cost data, and product pricing assumptions. This reliance is based on the site’s continuous operations since the early 2000s and the technical experience of BRZ personnel.
Discussions regarding past and current operations at the Bear River Mine were held with the following personnel:
|
| · | Taylon W. Earl, Senior Environmental Consultant, Barr Engineering |
|
| · | Troy Blackledge, Consulting Geologist |
|
| · | Jeff Fink, VP and General Manager of Bear River Zeolite Mine |
|
| · | Nick O’Neil, Plant Superintendent at Bear River Zeolite Mine |
| GeoGRAFX GIS Services | July 2, 2025 |
| Bear River Zeolite Project Franklin County, USA | Page: 40 |
2.7 Previous Technical Report Summaries
This S-K 1300 Technical Report Summary is the first report that has been prepared by USAC for the Bear River Zeolite Mine. Thus, this report is not an update of a previously filed Technical Report Summary under the S-K Regulations.
| GeoGRAFX GIS Services | July 2, 2025 |
| Bear River Zeolite Project Franklin County, USA | Page: 41 |
3 Property Description
This section addresses the Project landholdings, corporate agreements, existing environmental liabilities and the permitting process.
Ms. Carroll is not an expert in land, legal, environmental, and permitting matters and expresses no opinion regarding these topics as they pertain to the Bear River Zeolite project. Sections 3.2, 3.3, and 3.4 are based entirely on information provided to the author by Bear River Zeolite Company, their consultants, and their legal advisors.
3.1 Property Location
The Bear River Zeolite Project (the "Project") is located in southeastern Idaho in Franklin County, approximately 7 miles east of Preston, Idaho (population ~5,591) and 34 miles north of Logan, Utah (population ~52,778). The geographic center of current mine operations is located at approximately 42.1441574° North latitude and -111.7751464° West longitude (WGS84 datum). The Project is situated on the Riverdale and Mink Creek 7.5-minute USGS quadrangle maps and occupies portions of Township 14 South, Range 40 East, Sections 33, 34, and 35, and Township 15 South, Range 40 East, Sections 3 and 10, Boise Meridian. Figure 3.11 presents a location map for the Project.
| GeoGRAFX GIS Services | July 2, 2025 |
| Bear River Zeolite Project Franklin County, USA | Page: 42 |
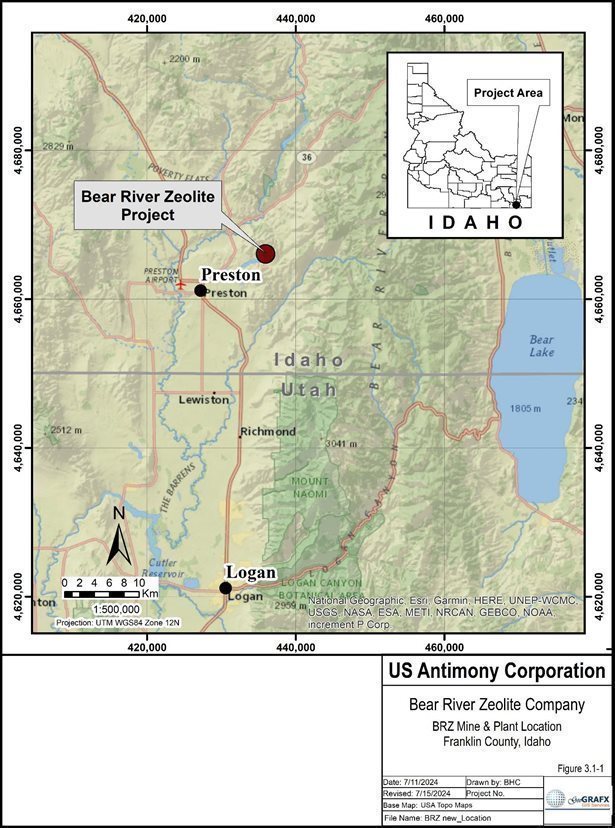
Figure 3.1-1 Location Map
| GeoGRAFX GIS Services | July 2, 2025 |
| Bear River Zeolite Project Franklin County, USA | Page: 43 |
3.2 Land Tenure and Mineral Titles
The Bear River Zeolite Project is situated on public lands administered by the United States Department of the Interior Bureau of Land Management (BLM) and on privately owned leased lands. The property comprises 50 unpatented placer mining claims of 20 acres each held directly by Bear River Zeolite Company. (BRZ), covering approximately 994 acres (402.258 hectares); and approximately 320 acres (129.499 hectares) of private land leased by BRZ under a Mining Agreement with Zeolite, L.L.C. (the “Zeolite lease”).
Figure 3.2-1 shows the land status and configuration of the various mineral holdings comprising the Property.
| GeoGRAFX GIS Services | July 2, 2025 |
| Bear River Zeolite Project Franklin County, USA | Page: 44 |
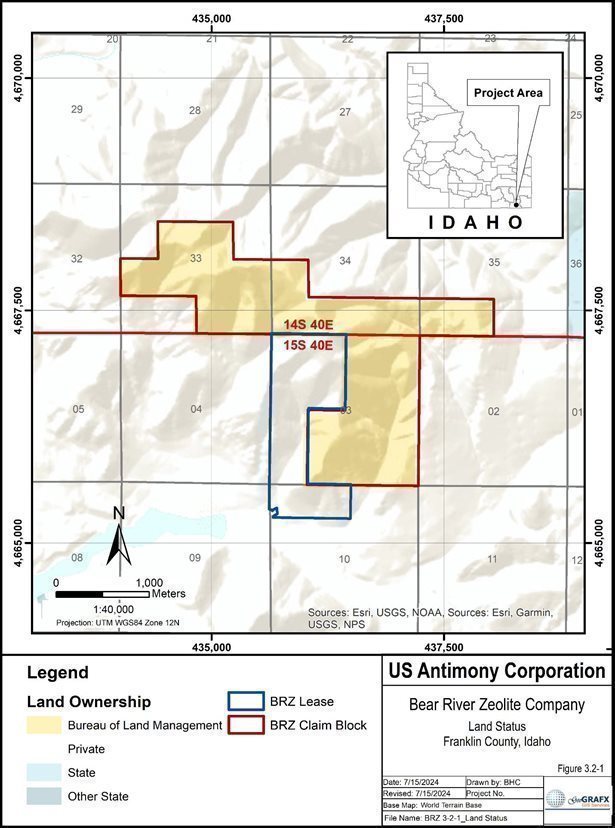
Figure 3.2-1 Land Status Map
| GeoGRAFX GIS Services | July 2, 2025 |
| Bear River Zeolite Project Franklin County, USA | Page: 45 |
3.2.1 Federal Lands
Ownership of unpatented mining claims on federal land is in the name of the holder (locator), subject to the paramount title of the United States of America, under the administration of the U.S. Bureau of Land Management (“BLM”). Under the Mining Law of 1872, which governs the location of unpatented mining claims on Federal lands, the locator has the right to explore, develop, and mine minerals on unpatented mining claims without payments of production royalties to the U.S. government, subject to the surface management regulation of the BLM. In recent years, there have been efforts in the U.S. Congress to change the 1872 Mining Law to include, among other items, a provision of production royalties to theU.S. government. Currently, annual claim maintenance fees are the only federal payments related to unpatented mining claims. BLM records of mining claims can be searched on-line at https://reports.blm.gov/reports/MLRS.
The located mineral claims were staked as placer claims on public lands administered by the Bureau of Land Management (BLM) in accordance with BLM regulations, which are documented online at BLM Idaho Mining and Minerals. The BRZ placer claims within the project area were located in the field using substantial wooden posts at least four feet in height and four inches square. Each post/monument was marked with the name of the claim, position or number of corner, and direction of boundary lines. A discovery monument containing a “Notice of Location” was posted at one corner of the claim, conforming to Idaho regulations. The placer claims occupy no more than 20 acres and measure 660 feet by 1,320 feet. As nearly as practical, the placer claim conforms to the public land survey system (PLSS), meaning it aligns with the boundaries of a section and takes a legal subdivision (aliquot part) of the section. The Company staked and recorded its wholly owned unpatented placer mining claims BRZ# 1 through BRZ# 50 in October 2020. The claims cover portions of Township 14 South, Range 40 East, Sections 33,34 35 and Township 15 South, Range 40 East, Section 3 Boise Meridian as shown in Figure 3.2-2.
The Company represents that the list of unpatented claims held by Bear River Zeolite Company, a wholly owned subsidiary of United States Antimony Corporation (USAC) shown in Figure 3.2.2 and included in Appendix B is complete and accurate as of July 12, 2024, and that all claims are valid through August 31, 2025. USAC has not sought a legal opinion regarding claim status. Ms. Carroll produced a Mining Claim Customer Information Report from the BLM for all claims current as of July 2024 that agrees with the BRZ unpatented Placer Mining Claims listing provided in Appendix B.
The report generated from the BLM shows that the 50 unpatented mining claims starting with “BRZ” are listed as “active” in the BLM's database, and annual maintenance fees were paid in July 2024. Annual maintenance fees of US$200 per unpatented mining claim are due to BLM on or before September 1 each year to maintain the claims. The next annual maintenance fees (for fiscal year 2026) are due before September 1, 2025. The claim fees for the Fiscal Year 2025 have been paid to the BLM.
Additionally, according to Idaho Code § 47-6, Location of Mining Claims, a Notice of Intent to Hold (NOI) must be filed before December 30 of any year when annual labor, improvements, or claim maintenance fee payments are required. The individual responsible for the work, improvements, or payment—or their representative—may record an Affidavit of Annual Work or an Affidavit of Claim Maintenance Fee Payment with the county recorder’s office in the county where the claim is located.
| GeoGRAFX GIS Services | July 2, 2025 |
| Bear River Zeolite Project Franklin County, USA | Page: 46 |
The Franklin County NOI recording fee is $20.48 per instrument. The Notice of Intent to Hold and Affidavit of Payment for the BMZ Claims was recorded with the Franklin County Recorder on July 16, 2024, for fiscal year 2025.
The total holding costs of the unpatented mining claims comprising the Bear River Zeolite property that were paid in 2024 for fiscal year 2025 were US$10,020.48 (Table 3-1).
Table 3-1 Annual Claim Holding Costs
| BLM Maintenance Fee | US$10,000 |
| Franklin County Filing Fee | US$20.48 |
| Total Filing and Holding Cost | US$10,020.48 |
Table 3-2 lists the active placer claims for Bear River Zeolite as of July 18, 2024:
Table 3-2 Brear River Zeolite active placer claims
| Claim Name | Serial Number |
| Claim Name | Serial Number |
| Claim Name | Serial Number |
| BRZ #1 | ID102154373 | BRZ #18 | ID102154769 | BRZ #35 | ID102154786 | ||
| BRZ #2 | ID102154374 | BRZ #19 | ID102154770 | BRZ #36 | ID102154787 | ||
| BRZ #3 | ID102154375 | BRZ #20 | ID102154771 | BRZ #37 | ID102154788 | ||
| BRZ #4 | ID102154376 | BRZ #21 | ID102154772 | BRZ #38 | ID102154789 | ||
| BRZ #5 | ID102154377 | BRZ #22 | ID102154773 | BRZ #39 | ID102154790 | ||
| BRZ #6 | ID102154378 | BRZ #23 | ID102154774 | BRZ #40 | ID102154791 | ||
| BRZ #7 | ID102154379 | BRZ #24 | ID102154775 | BRZ #41 | ID102154792 | ||
| BRZ #8 | ID102154759 | BRZ #25 | ID102154776 | BRZ #42 | ID102154793 | ||
| BRZ #9 | ID102154760 | BRZ #26 | ID102154777 | BRZ #43 | ID102154794 | ||
| BRZ #10 | ID102154761 | BRZ #27 | ID102154778 | BRZ #44 | ID102154795 | ||
| BRZ #11 | ID102154762 | BRZ #28 | ID102154779 | BRZ #45 | ID102154796 | ||
| BRZ #12 | ID102154763 | BRZ #29 | ID102154780 | BRZ #46 | ID102154797 | ||
| BRZ #13 | ID102154764 | BRZ #30 | ID102154781 | BRZ #47 | ID102154798 | ||
| BRZ #14 | ID102154765 | BRZ #31 | ID102154782 | BRZ #48 | ID102154799 | ||
| BRZ #15 | ID102154766 | BRZ #32 | ID102154783 | BRZ #49 | ID102154800 | ||
| BRZ #16 | ID102154767 | BRZ #33 | ID102154784 | BRZ #50 | ID102154980 | ||
| BRZ #17 | ID102154768 | BRZ #34 | ID102154785 |
| |||
| GeoGRAFX GIS Services | July 2, 2025 |
| Bear River Zeolite Project Franklin County, USA | Page: 47 |
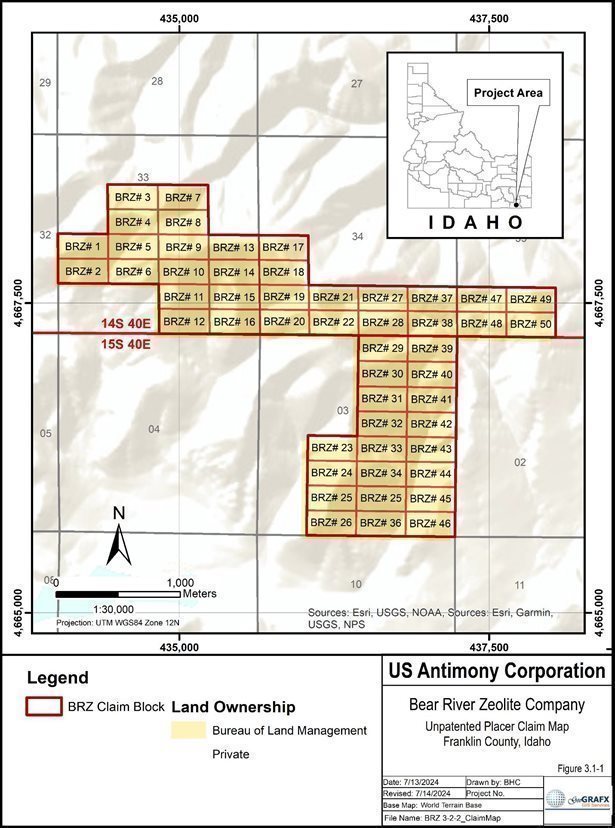
Figure 3.2-2 BRZ Unpatented Placer Claims
| GeoGRAFX GIS Services | July 2, 2025 |
| Bear River Zeolite Project Franklin County, USA | Page: 48 |
3.2.2 Private Ground
Zeolite, L.L.C., an Idaho Limited Liability Company referred to in section 3.3.1, is the owner of real property located in Franklin County, Idaho, (the “BRZ Leased Property”), together with all surface rights, mineral rights and interests, rights of ways and easements and all other rights appurtenant or incidental to the property. The property covers approximately 320 acres in portions of Sections 3 and 10, Township 15 South, Range 40 East of the Boise Meridian.
Bear River Zeolite Company, a wholly owned subsidiary of United States Antimony Corporation, has entered into a lease agreement with Zeolite LLC to lease the property shown in Figure 3.2-3, until December 31, 2034. This includes the mill site and zeolite in the area of the open pit. This lease replaces previous lease agreements and grants the Lessee the right to extract zeolites (the "Subject Minerals") from the Leased Premises, specifically excluding the extraction of any other minerals. Under the terms and conditions set forth in section 3.3.1, Lessee is permitted to remove and dispose of any sand, gravel, caliche, and other unleased materials that need to be removed in connection with its operations. If these materials are associated with the Subject Minerals, Lessee may dispose of them as it sees fit, provided that any net profits received from such disposal are shared equally with the Lessor. Lessee is also responsible for all reclamation work.
The Lessor grants Lessee the right to enter the Leased Premises for surveying, exploring (including geophysical and geochemical exploration), and production activities. This includes stockpiling, waste disposal, removing, milling, shipping, and marketing the Subject Minerals, though chemical treatment of these minerals is not permitted except for the application of specific chemicals such as ammonium nitrate and phosphate during production. Lessee must ensure that no chemicals or products contaminate surrounding lands or vegetation and must keep all such substances contained, preventing drift or runoff into streams or drainage areas. Chemical waste materials must be stored in impermeable containers and enclosed facilities, except for dolomite and mill shale (phosphate rock), which may be stored in piles in unenclosed areas provided they do not drift onto surrounding lands or vegetation.
Lessee is prohibited from placing underground fuel tanks on the Leased Premises and must immediately clean up any fuel spills, disposing of contaminated soil according to Idaho Department of Environmental Quality standards. Lessee is allowed to construct and use buildings, roads, camp facilities, inclines, adits, drifts, pits, mine buildings, power and communication lines, mills, and related facilities necessary for its operations. Additionally, Lessee has the right to use the surface of the Leased Premises as needed for these activities and is granted an easement for ingress and egress through an existing private road to a gravel pit owned by Lessor located near the Northwest corner of Section 10, Township 15 South, Range 40 East of the Boise Meridian.
Upon termination of mining activities or the Lease, Lessee must remove all improvements, buildings, mills, equipment, and other facilities from the Leased Premises at its own cost within one year. Any property not removed within this period becomes the exclusive property of Lessor, and Lessee must cover any costs incurred by Lessor for removal within ten days of demand.
Lessee may construct an access roadway from the gravel pit across a cultivated field of Lessor to the uncultivated portion of the Leased Premises, minimizing roadway construction and use on Lessor's cultivated lands. If no significant mining occurs on the Leased Premises but does occur on adjacent land, Lessor will allow Lessee an easement for ingress and egress, up to 25 feet wide, to convey minerals across the Leased Premises. In consideration for such an easement, Lessee will pay the same royalty for each ton of mineral extracted and the Minimum Royalty per year as referred to in section 3.3.1.
| GeoGRAFX GIS Services | July 2, 2025 |
| Bear River Zeolite Project Franklin County, USA | Page: 49 |
Mining operations shall be conducted in a manner consistent with the usual and customary practices of skillful and proper mining operations of a similar nature. These operations must be carried out to prevent any injury or damage to persons or property. In the course of mining, the Lessee shall deposit all earth and other waste materials in locations and in a manner that will not obstruct or impair future mining operations and, to the extent reasonably possible, will not interfere with the Lessor's use of the surface of the Leased Premises.
| GeoGRAFX GIS Services | July 2, 2025 |
| Bear River Zeolite Project Franklin County, USA | Page: 50 |
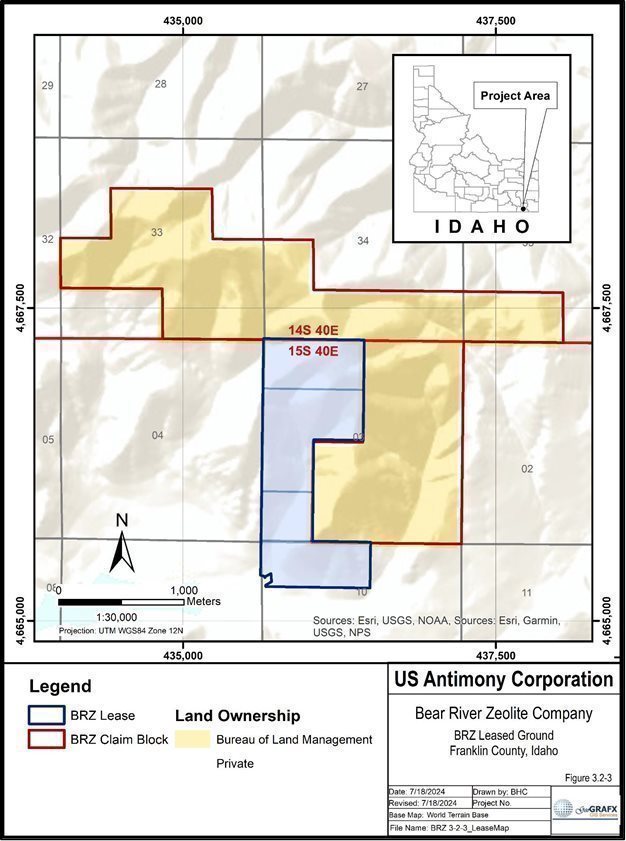
Figure 3.2-3 BRZ Zeolite, LLC Leased Ground
| GeoGRAFX GIS Services | July 2, 2025 |
| Bear River Zeolite Project Franklin County, USA | Page: 51 |
3.3 Property Agreements
The copies of the following agreement on the Zeolite, LLC Amended and Restated Mining Lease were provided by Mr. Joe Bardswich, Ex VP, Chief Mining Officer and a Director for US Antimony.
3.3.1 Zeolite, LLC Amended and Restated Mining Lease
On January 1, 2025, Bear River Zeolite Corporation (BRZ), a subsidiary of United States Antimony Corporation, renewed its mining lease with Zeolite, LLC for parcels RP02094.02, RP02043.00, and RP02040.00. The lease has been extended until December 31, 2034, and will automatically renew each year unless either party provides 180 days' prior written notice of termination before the renewal date.
|
| 2025 Agreement Terms: | |
|
|
|
|
|
| · | The updated lease describes the lands that are to be included in this Lease and described as the 'Leased Premises. Any additional land within a two-mile radius that Bear River Zeolite mines may also be covered under this agreement, as long as the land is owned by Zeolite, LLC or affiliated entities. |
|
|
|
|
|
| · | Bear River Zeolite will pay royalties to Zeolite, LLC for any minerals extracted from within this two-mile zone, as well as for any zeolite brought onto the leased land and shipped from there. |
|
|
|
|
|
| · | Zeolite, LLC is guaranteed a minimum annual royalty payment of $100,000. If the total royalties paid in any given year are less than this amount, Bear River Zeolite will cover the difference within 90 days of year-end. |
This agreement ensures continued operations and royalty payments for the duration of the lease, benefiting both companies.
Production Royalty:
BRZ shall pay Zeolite, LLC the royalty on all zeolite mineral removed and shipped from the Leased Premises during the remainder Term as follows:
| 0K to 10K tons | - | $ 9.00 per ton |
| 10.1K to 20K tons | - | $ 10.50 per ton |
| 20.1K to 30K tons | - | $ 12.00 per ton |
| Over 30K tons | - | $ 8.00 per ton |
The Production Royalty shall continue to be paid according to this schedule until the termination of the Lease.
3.4 Additional Royalties
This section describes the obligations that must be met to retain the Property, and to the extent known, the terms of any royalties, back-in rights, payments, or other agreements and encumbrances to which the Property is subject.
In addition to the Zeolite, LLC Amended and Restated Mining Lease royalties, there are additional royalty holders. Nick Raymond and the estate of George Desborough each have a graduated royalty of
$1.00 per ton to $5.00 per ton, depending on the sale price.
| GeoGRAFX GIS Services | July 2, 2025 |
| Bear River Zeolite Project Franklin County, USA | Page: 52 |
During 2002, the Company sold a 3% gross proceeds royalty on all zeolite extracted from BRZ to Delaware Royalty Company, Inc., a company controlled by a Al Dugan, a major shareholder.
On a combined basis, BRZ pays total royalties ranging from 8% to 13% of zeolite product revenue. According to United States Antimony Corporation’s (USAC) filings, Bear River Zeolite (BRZ) accrued royalties payable of $133,434 as of December 31, 2024, and $153,429 as of December 31, 2023.
3.5 Surface Rights
BRZ controls surface rights through a combination of federal mining claims and the Zeolite Lease. The lease also grants access to easements, road construction rights, and use of existing infrastructure (e.g., mill site, pits, roads). The lessee is responsible for reclamation, contamination prevention, and compliance with Idaho DEQ regulations. Access to the site is via a private road and permitted rights-of- way. No additional rights are needed to support the life-of-mine (LOM) plan as presented in this Report.
3.6 Water Rights
Water for operations is sourced from onsite wells located on the Zeolite, LLC leased property. These sources provide sufficient water for dust control and site operations. No additional water rights are expected to be needed for the life-of-mine (LOM) operations.
3.7 Significant Encumbrances
3.7.1 Permitting Requirements
The current Bear River Zeolite Operations are fully permitted for current operations (see discussion in Section 17.4). BRZ holds necessary permits from the Idaho Department of Environmental Quality and other applicable authorities.
3.7.2 Permitting Timelines
There are no relevant permitting timelines that apply to the Bear Rives Zeolite Operations; the operations as envisaged in the Life of Mine (LOM) plan are fully permitted.
3.7.3 Violations and Fines
BRZ has all necessary MSHA and operational permits and is regularly inspected by MSHA for compliance with Federal requirements.
Historically, from time to time, the Company is assessed fines and penalties by the Mine Safety and Health Administration (“MSHA”). Using appropriate regulatory channels, management may contest these proposed assessments. In 2024, Bear River Zeolite Company (“BRZ”), received four significant and substantial citations from MSHA, all of which have been rectified.
Information concerning mine safety violations or other regulatory matters required by section 1503(a) of the Dodd-Frank Wall Street Reform and Consumer Protection Act and Item 104 of Regulation S-K are included in Exhibit 95 to the 2024 Annual Report (United States Antimony Corporation, 2024b). Table
3-3 provides Mine Safety Disclosure information for the year ending December 31, 2024:
| GeoGRAFX GIS Services | July 2, 2025 |
| Bear River Zeolite Project Franklin County, USA | Page: 53 |
Table 3-3 Mine Safety Disclosure Information for the year ending December 31, 2024
| MINE SAFETY DISCLOSURE | |
| Mine | Bear River Zeolite |
| §104 Significant and Substantial Citations (1) | 4 |
| §104(b) Orders (2) | 0 |
| §104(d) Citations and Orders (3) | 0 |
| §110(b)(2) Violations (4) | 0 |
| §107(a) Orders (5) | 0 |
| Proposed Assessments from MSHA (In dollars $) | $25,721 |
| Mining Related Fatalities | 0 |
| §104(e) Notice (yes/no) (6) | No |
| Pending Legal Action before Federal Mine Safety and Health Review Commission (yes/no) | No |
| (1) | The total number of violations received from MSHA under §104 of the Mine Act, which includes citations for health or safety standards that could significantly and substantially contribute to a serious injury if left unabated. |
|
|
|
| (2) | The total number of orders issued by MSHA under §104(b) of the Mine Act, which represents a failure to abate a citation under §104(a) within the period of time prescribed by MSHA. |
|
|
|
| (3) | The total number of citations and orders issued by MSHA under §104(d) of the Mine Act for unwarrantable failure to comply with mandatory health or safety standards. |
|
|
|
| (4) | The total number of flagrant violations issued by MSHA under §110(b)(2) of the Mine Act. |
|
|
|
| (5) | The total number of orders issued by MSHA under §107(a) of the Mine Act for situations in which MSHA determined an imminent danger existed. |
|
|
|
| (6) | A written notice from the MSHA regarding a pattern of violations, or a potential to have such pattern under §104(e) of the Mine Act. |
3.8 Significant Factors and Risks That May Affect Access, Title or Work Programs
To the extent known to the author, there are no other known significant factors and risks that may affect access, title, or the right or ability to perform work on the properties that comprise the Bear River Zeolite Operations that are not disclosed in this Report.
3.9 Qualified Person Statement
The Qualified Person for this section, Ms. Carroll, is not an expert in legal, environmental, permitting, or land matters and expresses no professional opinion on such topics. Information in Sections 3.2 through 3.4 is based on documentation and representations provided by Bear River Zeolite Company, its consultants, and legal advisors.
| GeoGRAFX GIS Services | July 2, 2025 |
| Bear River Zeolite Project Franklin County, USA | Page: 54 |
4 Accessibility, Climate, Local Resources, Infrastructure and Physiography
The information summarized in this section is derived from publicly available sources, as cited. The author has reviewed this information and believes this summary is materially accurate.
4.1 Accessibility
The Bear River Zeolite Project is located in southeastern Idaho, approximately seven (7) miles east of Preston, Idaho; 34 miles north of Logan, Utah; 79 miles south of Pocatello, Idaho; and 100 miles north of Salt Lake City, Utah. The nearest air transportation is available at the Preston Airport, located approximately 8 miles from the mine site.
The town of Preston is in close proximity to Interstate 15, a major north-south corridor connecting Salt Lake City and Pocatello. Access to the Bear River Project is accessed via paved Idaho State Highway 34, which runs north from Preston for 1.8 miles to East Glendale Road. From there, a paved road continues 4 miles east to the intersection with gravel road N2200 E. The site is reached by traveling 0.5 miles north on N2200 E to the processing plant, warehouse facilities, and office complex.
The mine operations area is accessible via a private access road originating at the office parking lot.
The mine operations areas are accessible from the mine access road starting at the office parking lot.
4.2 Climate
The Project lies within a semi-arid (Köppen BSk) climatic zone typical of the western interior United States. This climate is characterized by low humidity, infrequent rainfall, and wide temperature variations due to elevation and continentality. Annual precipitation ranges from 250 to 500 mm (10 to 20 inches), with the majority occurring between September and May. Snowfall is common during winter, averaging 52.4 inches (132.1 cm) across 30.6 days per year.
Long-term climate data from the nearby town of Preston (Zip Code 83263) between 1991 and 2020 indicates average monthly temperatures ranging from -7.1°F (-21.7°C) in January to 60.3°F (15.8°C) in July. The area averages 94.2 precipitation days per year and experiences snow cover typically from November through March or April.
Mining operations at the Bear River Zeolite site are feasible year-round. Snow removal equipment is utilized to maintain access during winter months. Although there are no on-site drying facilities, three ore storage sheds are used to protect zeolite from moisture, and operations are scheduled around precipitation events.
4.3 Local Resources and Infrastructure
The nearby towns Preston, Idaho (population 5,591 in 2020), and Logan, Utah (population 52,778 in 2020) hosts the majority of the local workforce and have a well-developed infrastructure of stores and shops for supplies, restaurants and motels. Experienced surface mining personnel are sourced from Preston as well as North Logan. Contractor support, transportation, and general suppliers are all readily available in these communities as well as in Pocatello and the greater Salt Lake City area Salt Lake is approximately 100 miles (161 km) to the south of the project area and serves as a major hub for mining and industrial equipment, drilling contractors, fuel, maintenance, engineering services and supplies as well as telecommunications, hospitals and banking. The Salt Lake City International Airport provides daily air service to larger western airports such as Denver and San Francisco.
| GeoGRAFX GIS Services | July 2, 2025 |
| Bear River Zeolite Project Franklin County, USA | Page: 55 |
Electric power for the Property is available through a 12,470 V Rocky Mountain Power line coming to the property from Glendale Rd. The plant is currently powered with a 750 KVA transformer fed from that line and the plant currently uses about half of the transformer capacity at peak demand. Rocky Mountain Power has indicated that there is sufficient power available to add another 2,000 KVA of transformer capacity, which can provide all the power needed for any future expansion.
Potable water for the Bear River Mine Site is supplied by Culligan Water. A water truck is used for on- site industrial use, while dust control water is drawn from a well located on the leased property under an agreement with the landowner.
Preston is served by the Union Pacific Railroad, which connects the region to the broader western U.S. rail network. Burlington Northern Santa Fe (BNSF) Railway does not directly serve Preston but maintains routes through nearby Pocatello. These rail lines offer regional and national freight connectivity.
The property covers approximately 1,300 acres, which supports the current mine site and processing facilities on a small portion of the property as well as providing sufficient size for potential future expansion.
4.4 Physiography
The Bear River Zeolite project area lies within the Semiarid Hills and Low Mountains (80b) subregion of the Northern Basin and Range (80) ecoregion. Ecoregions denote areas of general similarity in ecosystems and in the type, quality, and quantity of environmental resources; they are designed to serve as a spatial framework for the research, assessment, management, and monitoring of ecosystems and ecosystem components. By recognizing the spatial differences in the capacities and potentials of ecosystems, ecoregions stratify the environment by its probable response to disturbance (Bryce and others, 1999). These general-purpose regions are critical for structuring and implementing ecosystem management strategies across federal agencies, state agencies, and nongovernment organizations that are responsible for different types of resources within the same geographical areas (Omernik and others, 2000).
The Semiarid Hills and Low Mountains ecoregion is characterized by moderately rugged hills, low mountains, and dissected volcanic plateaus. These landforms result from volcanic activity and tectonic uplift, typical of the Basin and Range Province. Elevations in this ecoregion generally range from 4,500 to 8,000 feet, with isolated peaks reaching higher. The terrain is more rugged than the lower, flatter basins that surround it. Valleys and steep slopes are common, with occasional ridges and outcrops of resistant rock. The geology comprises Quaternary loess, alluvium, colluvium, and basalt. Tertiary volcanics, tuffaceous rocks, and sedimentary rock, Paleozoic schist, quartzite, siltstone, sandstone, and limestone.
Vegetation varies by elevation and moisture. Lower elevations are dominated by sagebrush, grasses, and juniper, while higher elevations—particularly in the adjacent Bear River Range—support pine, fir, and aspen forests. Riparian areas along streams and in more sheltered valleys can support denser, lusher vegetation, including willows and cottonwoods.
| GeoGRAFX GIS Services | July 2, 2025 |
| Bear River Zeolite Project Franklin County, USA | Page: 56 |
The ecoregion supports a variety of wildlife species adapted to semi-arid environments. Typical animals include mule deer, pronghorn antelope, sage-grouse, and various species of lizards and small mammals. The shrubland areas provide habitat for species that depend on sagebrush ecosystems, such as sage sparrows and pygmy rabbits.
The land is used primarily for livestock grazing and wildlife habitat. Some dryland farming of small grains and irrigated farming for potatoes, sugar beets, and alfalfa. A few feedlots occur. The ecoregion is sparsely populated, with small, isolated communities and ranches scattered across the landscape.
Figure 4.4-1 shows the relationship between Semiarid Hills and Low Mountains (80b) and Malad and Cache Valleys (13i) (Griffith, 2014) peripheral to the project area.
| GeoGRAFX GIS Services | July 2, 2025 |
| Bear River Zeolite Project Franklin County, USA | Page: 57 |
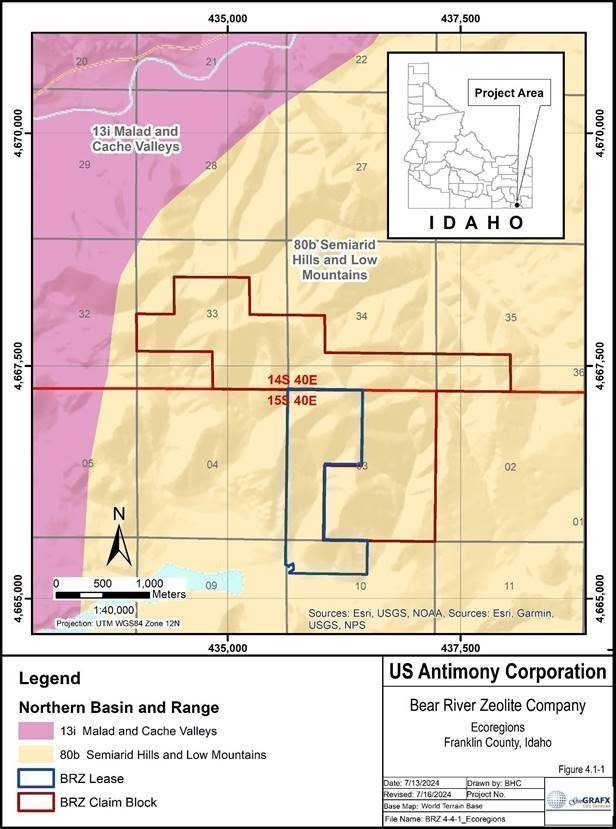
Figure 4.4-1 Ecoregion Map
| GeoGRAFX GIS Services | July 2, 2025 |
| Bear River Zeolite Project Franklin County, USA | Page: 58 |
The mine is situated in a region characterized by rolling hills, mountain foothills, and broad valleys as shown in Figure 4.4-2. The Bear River Range, part of the larger Rocky Mountains, lies to the east, providing a backdrop of rugged, forested mountains. Elevations in the area generally range from around 4,500 feet in the valleys to over 9,000 feet in the nearby mountain ranges. The terrain near the mine is more gentle, with lower hills and ridges. Water in the region is relatively scarce, as much of the area is semi-arid, but the Bear River and its tributaries support some irrigation and wildlife in the valleys. In the hills and mountain areas, there are intermittent streams and springs. Vegetation around the mine reflects a transition between the semi-arid plains and the forested mountain environments. In the valleys and lower elevations, the landscape is dominated by sagebrush, grasses, and juniper, typical of the high desert and steppe ecosystems. At higher elevations, particularly in the nearby Bear River Range, the terrain becomes more forested, with predominant stands of pine, fir, and aspen. The mix of vegetation changes with elevation and exposure to moisture.
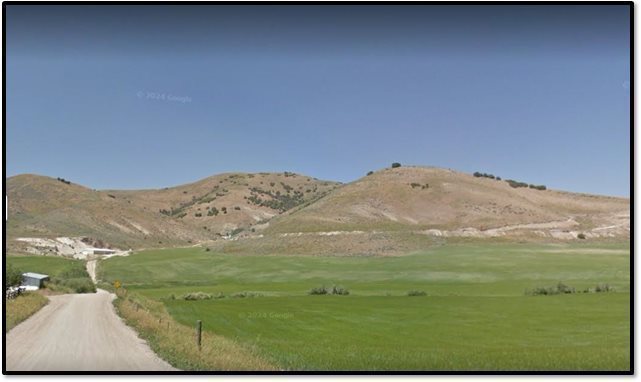
Figure 4.4-2 Typical Physiography of the Project Area
| GeoGRAFX GIS Services | July 2, 2025 |
| Bear River Zeolite Project Franklin County, USA | Page: 59 |
5 History
5.1 Overview of Zeolite Development in the United States
According to Crangle (2018), commercial-scale mining of natural zeolites in the United States began in the early 1970s. Prior to that time, natural zeolites were primarily viewed as mineralogical curiosities, typically filling vugs and fractures in igneous rocks. The discovery of extensive zeolite-bearing volcanic tuffs in the Western United States during the late 1950s spurred exploration by major mining and petroleum companies throughout the 1950s to mid-1980s which lead to the discovery of additional reserves. However, due to underdeveloped markets and limited commercial applications at the time, production remained minimal—only a few hundred metric tons annually through the mid-1970s.
By the mid-1980s, the major companies had withdrawn from the industry owing to low annual production and sales. Companies better suited to small-scale mining then stepped in and slowly developed the natural zeolite market into the small yet sustainable industry that exists today. Domestic production and sales have steadily increased since the 1970s, although production significantly declined for a few years after 1994 owing to an imbalance between production and market demand. Production and sales of natural zeolites have more than doubled from 1993 through 2023 owing to increased sales for animal feed, odor control, soil amendment, and water purification applications.
5.2 Property Discovery and Early Development
Zeolitic tuffs of the Salt Lake Formation at the Bear River location were identified as prospective for clinoptilolite by the U.S. Geological Survey (USGS) and U.S. Bureau of Mines. In 1997, Bear River Zeolite Co staked the first five Red Ace lode claims on Bureau of Land Management (BLM) ground.
In 1999, geologists George Desborough and Nick Raymond presented the Bear River Zeolite (BRZ) property to United States Antimony Corporation (USAC). Both geologists had previously worked for the USGS, and Desborough was widely recognized as an expert in zeolite deposits worldwide (Bear River Zeolite Company, Inc., 2009).
5.3 Ownership History
Bear River Zeolite, LLC was incorporated in Idaho on June 1, 2000, with John C. Lawrence, Michael J. Floersch, and William H. Raymond as its initial directors. That same year, USAC formed a subsidiary, Bear River Zeolite Company (“BRZ”), initially structured with 75% ownership by USAC and 25% ownership by Desborough and Raymond to mine and market zeolite and zeolite products from the mineral deposit identified by Desborough and Raymond, near Preston in southeastern Idaho.
A mining lease was executed with Webster Farm, L.L.C. for access to 320 acres of private land near Preston, Idaho. The lease granted BRZ surface rights to mine and process zeolite in exchange for royalty payments. The plant and the initial pit were located on 320 acres of private land owned by the Webster Farm, L.L.C. and leased to BRZ by the Webster Farm, L.L.C. This area includes the mill site and zeolite material in the area of the open pit (Bear River Zeolite Company, Inc., 2009).
BRZ constructed its initial processing plant in 2000 to produce basically two products - 14 +40 mesh (a granule) and minus 40 mesh (a powder). Limited commercial sales began in Q4 of 2001. In 2002, USAC acquired the remaining 25% interest in BRZ and assumed full ownership. That same year, USAC staked additional federal lands adjacent to the private property as 50 BLM placer claims (BRZ 1 through BRZ 50), covering approximately 1,000 acres. By 2007, USAC was listed as the sole owner of Bear River Zeolite Company in filings with the Idaho Secretary of State.
| GeoGRAFX GIS Services | July 2, 2025 |
| Bear River Zeolite Project Franklin County, USA | Page: 60 |
In 2015, BRZ acquired an additional 600 acres (243 hectares) and initiated permitting for pit expansion to support future sales into the oil and gas sector.
In 2015, BRZ. acquired an additional 600 acres (243 hectares) at its mine in southeastern Idaho and initiated the permitting process for expanding the mining pit. The company was targeting applications in the oil and gas industry as end uses for the expected increase in zeolite production (U.S. Antimony Corp., 2015)
5.4 Historic Exploration
Historic exploration has been limited to the examination and sampling of surface outcrops. No exploration drilling was conducted on the property until the summer 2024 program.
5.5 Initial Mine Development and Plant Construction
Construction of the processing facility began in 2000. USAC leased mining and processing equipment to BRZ and advanced development costs. Surface mining began in 2001 and included:
|
| · | Development of access and haul roads. |
|
| · | An open pit that covers approximately 3 acres. |
|
| · | Drilling, blasting, and hauling of mineralized material to the mill using a 40-ton truck over a 4,000-foot road with a 2.5% uphill grade. With equipment current at that time, the mine was capable of producing 80 tons per hour. |
|
| · | A processing plant consisting of a primary crusher, cone crusher with dual lines, and a Raymond mill for fine products. |
|
| · | A semi-automatic bagging line and warehouse for inventory storage. |
|
| · | On-site maintenance facilities |
The operation received its MSHA permit in 2003 (MSHA Mine ID: 1001993) and continues to maintain compliance with applicable federal and state regulations.
Figure 5.5-1shows an aerial view of the mine and processing facilities in 2003.
| GeoGRAFX GIS Services | July 2, 2025 |
| Bear River Zeolite Project Franklin County, USA | Page: 61 |
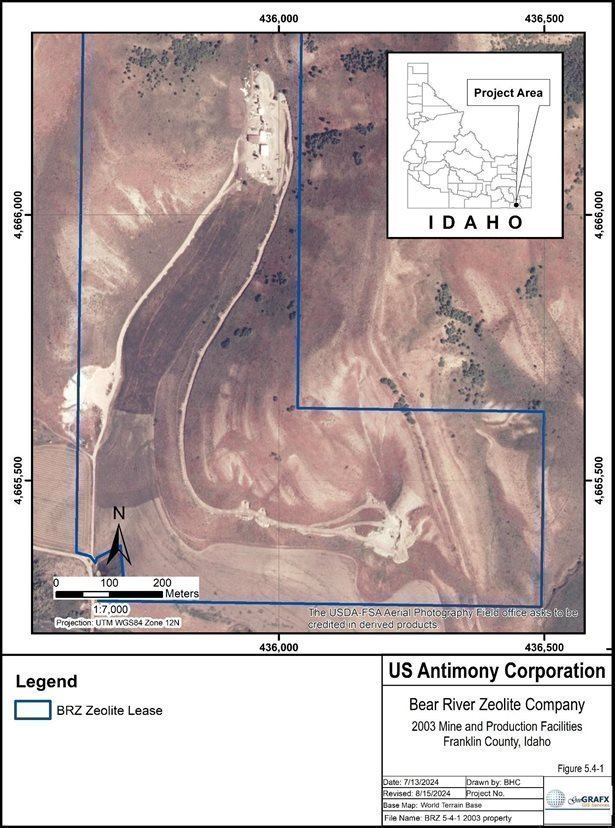
Figure 5.5-1 2003 Mine and Production Facilities
| GeoGRAFX GIS Services | July 2, 2025 |
| Bear River Zeolite Project Franklin County, USA | Page: 62 |
5.6 Facility and Infrastructure Expansion
Since its inception in 2000, BRZ has conducted numerous plant expansions and upgrades to meet increasing demand, diversify its product lines, and to minimize costs.:
2002: Installation of a dryer for year-round production and a blending unit for fertilizer-grade products combining ammonium, phosphate, and BRZ zeolite.
2003-2004: Addition of three buildings and new equipment including augers, silo, crusher, and generator. (Industrial Specialities News, 2023).
2005: Completion of a major plant expansion with a new dryer.
2006: BRZ initiated the permitting process to install a fine grinding circuit at its mill and expand storage capacity. The additional capacity was necessary to meet growing demand for finely ground zeolite used in animal feed, concrete additives, environmental remediation, and wastewater treatment (Industrial Minerals, 2006b). BRZ also contracted Utah Power to install power lines, which replaced the costly fuel- powered generator system at the mill (Industrial Minerals, 2006a).
2007: The company began operating a new roller mill circuit to produce finely ground zeolite products for animal feed (United States Antimony Corp., 2007).
2008-2009: BRZ made several upgrades to its plant, including the addition of more silos, conveyors, and other equipment. The company also installed a small packaging plant with a semi-automatic line for large bags, completed the Raymond Mill setup, and implemented line electricity.
2017-2018: Upgraded production equipment and constructed a new warehouse.
2021-2023: BRZ continued expanding its production capacity by constructing a 100’ by 50’ warehouse for product storage and a 60’ by 40’ shop building. Two additional winter-storage buildings were added—one between the mine and the mill, and another near the mine. Salt sheds are planned for these storage locations to eliminate the need for tarps to keep zeolite dry during winter and rainy seasons. The building near the mine also provides a space for regular maintenance of mining equipment during the winter and rainy months.
2021: A vertical-shaft impactor crusher was replaced by a hammer mill on crushing line 1 to increase production rates. A new jaw crusher was also installed that year, later improved with a variable-speed apron feeder, with further enhancements made in 2022 (United States Antimony Corporation, 2022a).
The company also made significant infrastructure upgrades by acquiring key pieces of rolling stock equipment, including a Cat 235 excavator, a Cat 12H road grader, a Cat 740 articulated haul truck, and a Cat D8T dozer with dual rippers, to replace its aging fleet (United States Antimony Corporation, 2022).
2024 Following major shutdowns in 2023 related to dust control problems and equipment failures (cone crusher, jaw crusher, vibratory screens and dust collectors) a concerted effort to upgrade the plant was undertaken starting in January 2024. An experienced mechanical engineer was hired to manage the zeolite division. The dust collection system was repaired and placed back into operation, the cone crusher base was re-constructed, crusher liners were replaced, conveyor transfer points were hooded, and a safety training program was initiated. Plant operating availability approached 100%, back orders were filled and the warehouse storage approached 100% of capacity.
| GeoGRAFX GIS Services | July 2, 2025 |
| Bear River Zeolite Project Franklin County, USA | Page: 63 |
In the pit a new loader was purchased and a contractor drilled and blasted sufficient material to meet production requirements in excess of one year.
5.7 Production History
Commercial sales commenced in late 2001 with approximately 100 tons sold. Since then, production has steadily increased, peaking at over 15,000 tons in some years. A summary of production data is presented in Table 5.1.
The financials for the last 10 year of production are included in Section 18, Capital and Operating Costs.
Table 5-1 Zeolite Production
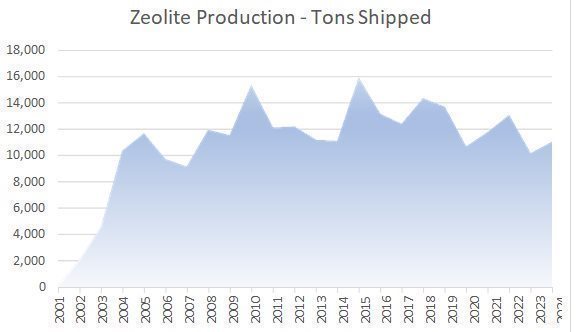
| Year | Zeolite Sales - Tons |
| Year | Zeolite Sales - Tons |
| 2001 | 100 |
| 2014 | 11,079 |
| 2002 | 2,054 |
| 2015 | 15,901 |
| 2003 | 4,526 |
| 2016 | 13,143 |
| 2004 | 10,333 |
| 2017 | 12,377 |
| 2005 | 11,654 |
| 2018 | 14,321 |
| 2006 | 9,696 |
| 2019 | 13,680 |
| 2007 | 9,147 |
| 2020 | 10,661 |
| 2008 | 11,919 |
| 2021 | 11,747 |
| 2009 | 11,519 |
| 2022 | 13,047 |
| 2010 | 15,319 |
| 2023 | 10,145 |
| 2011 | 12,105 |
| 2024 | 11,024 |
| 2012 | 12,189 |
|
| |
| 2013 | 11,182 |
|
| GeoGRAFX GIS Services | July 2, 2025 |
| Bear River Zeolite Project Franklin County, USA | Page: 64 |
6 Geological Setting, Mineralization and Deposit Type
The Bear River Zeolite (BRZ) property is situated on the western slope of the Bear River Range in southwest Idaho, within the Southeast Basin and Range Geologic Province (refer to Figure 5.7-1). This range is located along the western margin of the Cordilleran Overthrust Belt that spans Idaho, Wyoming, and Utah. The belt is characterized by north-south-oriented, eastward-directed folds and imbricate thrust faults (Hauser & Rains, 1988). In Idaho, the overthrust belt includes formations from the Laramide Orogeny (80–35 Ma) and the earlier Sevier Orogeny (160–50 Ma). Approximately 17 million years ago, Basin and Range extension and normal faulting began, forming linear north-south and northwest- southeast trending mountain ranges in southeastern and east-central Idaho. This extension overlaid the older thrust belt, creating sedimentary basins with sandstone, conglomerate, and limestone deposits ranging in age from the Miocene to recent. The Salt Lake Group was deposited during Tertiary/Pliocene time, prior to the Quaternary/Pleistocene, Bonneville flood events which further shaped the region, carving drainage paths down-gradient to the Snake River Valley, including Cache Valley.
Utah contains 58 known zeolite deposits of which 27 are igneous/hydrothermal and 31 are sedimentary occurrences. Table 3 summarizes the 31 sedimentary occurrences.
Tertiary rocks of the Salt Lake Group consist of conglomerates, siltstones, sandstones, limestones, and tuffaceous sedimentary units deposited in and along the flanks of extensional basins. The Cache Valley Formation of the Salt Lake Group contains the zeolite beds that form the basis for this current investigation into the zeolite mineralization found at the Bear River deposit.
Additional occurrences include the Trenton occurrence which crops out in the southern end of the Malad Range immediately west of Trenton. Potassium clinoptilolite occurs as an alteration product in the 19 Ma Cache Valley Formation of the Salt Lake Group of Williams (1964). Exposures are generally poor but the tuff is known to be at least 25 feet thick and assays up to 67% clinoptilolite with CEC up to 1.8 meq/g. One of the most accessible exposures is in the town of Trenton. Other zeolite occurrences known in the Salt Lake Group include a deposit near Oneida Narrows, Idaho (Danzl, 1985) and one near Richmond, Utah where the zeolitized tuff is 40-60 feet.
| GeoGRAFX GIS Services | July 2, 2025 |
| Bear River Zeolite Project Franklin County, USA | Page: 65 |
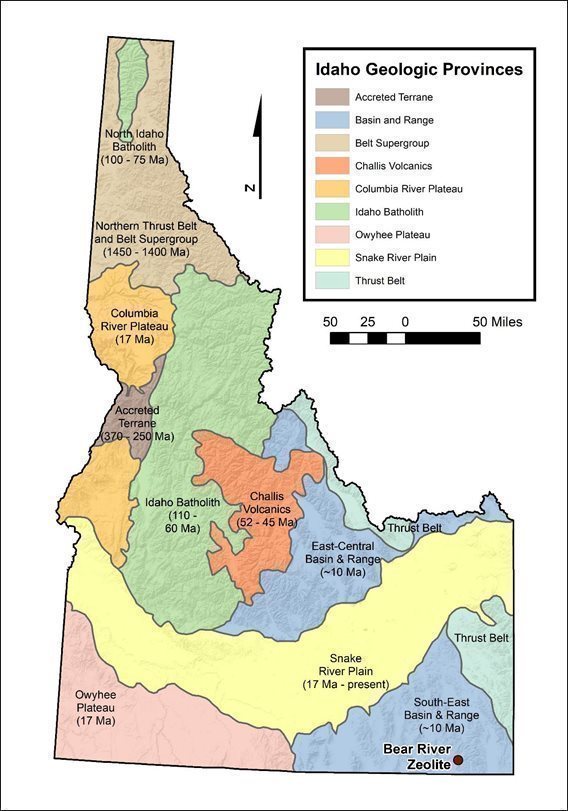
Figure 5.7-1 Idaho Geologic Provinces
| GeoGRAFX GIS Services | July 2, 2025 |
| Bear River Zeolite Project Franklin County, USA | Page: 66 |
6.1 District Geology
The district geology covers the area is shown in Figure 6.1-1 at a scale of 1:250,000 (Lewis, Link, Stanford, & Long, 2012). It includes the east central section of Cache Valley and the foothills of the west central section of the Bear River Range within Franklin County, Idaho.
6.1.1 Lithologies
Cache Valley is a long narrow valley, 60 miles by·l7 miles, tapering gradually at both ends. The valley floor rises gently northward from 4,400 feet near .Hyrum, Utah to 4,800 feet: near Banida, Idaho. Only a small portion of the east central margin of the valley is considered in the District Geology section.
West of the Front Ridge of the Bear River Range lie a series of low rounded hills and dissected foothill benches generally developed on relatively non-resistant Cenozoic rocks, including the sedimentary rocks associated with Basin and Range extension (QTpms in Figure 6.1-1 District Geology Along the western margin of this complex there are well displayed evidences of former shorelines of Lake Bonneville. Cache Valley proper is floored with a thick mantle of generally flat-lying lacustrine sediments in which the present drainage pattern has been incised.
In this area, the Cenozoic sedimentary rocks include the Tertiary Salt Lake group, which is composed of coarse fanglomerates, greyish yellow green tuffaceous sandstones, pale yellowish brown marls and sandstones, and fine grained white tuffaceous beds. The fanglomerates are composed of subangular to well-rounded pebbles, cobbles and boulders, the most of which appear to have been derived from the local Cambrian formations, in a fine-grained light grey siliceous matrix. The individual units of the formation are exceedingly transitionary and discontinuous (Coulter, 1956).
| GeoGRAFX GIS Services | July 2, 2025 |
| Bear River Zeolite Project Franklin County, USA | Page: 67 |
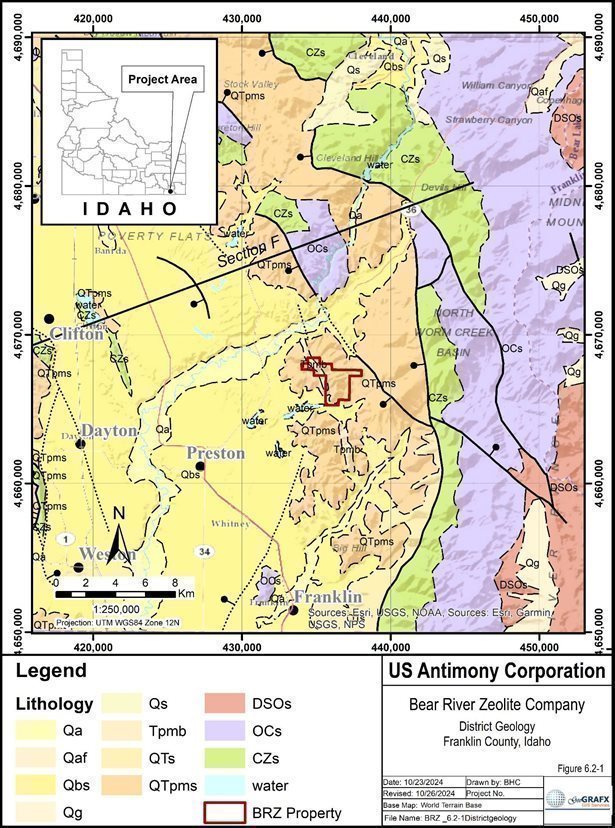
Figure 6.1-1 District Geology
| GeoGRAFX GIS Services | July 2, 2025 |
| Bear River Zeolite Project Franklin County, USA | Page: 68 |
Map units shown in Figure 6.1-1 are summarized below in Table 6-1.
Table 6-1 Description of District Geology Map Units
| Lith Symbol |
Name |
Description |
Period |
|
Qa |
Alluvial deposits | Deposits in valleys consist of gravel, sand, and silt. Includes younger terrace deposits. May contain some glacial deposits and colluvium in uplands. |
Quaternary |
|
Qaf |
Alluvial-fan deposits | Gravel and subordinate sand and silt deposited at mouths of canyons; largest fans are in Basin and Range Province in east-central and southeastern Idaho. |
Quaternary |
|
Qbs |
Lake Bonneville deposits | Silt, clay, sand, and gravel deposited in and at margins of former Lake Bonneville (33-11 calibrated ka) and sand and gravel deposited in giant flood bars by outburst floods from the lake (17.4 calibrated ka). The 1,575-m (5,170 ft) Lake Bonneville shoreline was used to determine the maximum extent of the lake deposits. Flood deposits follow Bonneville flood path from near Downey and the Portneuf River westward along the Snake River to Lewiston. They include sand and silt deposited in slack-water areas to 740 m (2,430 ft) elevation in the Boise, Weiser, Payette, and Snake river drainages. |
Pleistocene |
|
Qg |
Glacial deposits | Till and outwash consisting of gravel, sand, silt, and clay. Formed by valley glaciers at higher elevations and by the Cordilleran ice sheet in northern Idaho. Includes deposits of several glacial episodes. Includes rock glacier deposits and some modern alluvium derived from reworked till and outwash. |
Pleistocene |
|
Qs |
Fluvial and lake sediment | Largely fine-grained sediment, in part playa deposits of evaporative lakes; includes Snake River Group and Bruneau Formation in central Snake River Plain and glacial lake deposits in Bonners Ferry area of northern Idaho. Also includes travertine and tufa northeast of Bancroft and Lake Thatcher sediments in the Gem Valley south of Grace. |
Quaternary |
|
Tpmb |
Basalt | Flows and cinder cones of olivine tholeiite basalt, and shallow basalt intrusives (~15-3 Ma); includes basalt in Owyhee County and southwest of Twin Falls, basalt of Weiser (basalt to andesite), basalt of Cuddy Mountain (alkali basalt and picro-basalt) north of Cambridge, basalt in Mount Bennett Hills north of Gooding, andesite at Square Mountain near Magic Reservoir, and Cub River diabase sill east of Preston. |
Pliocene and Miocene |
|
QTs | Sediments and sedimentary rocks | Older gravel, sand, and silt deposited in fans, streams, and lakes. Includes older terrace gravels and Tuana Gravel northwest of Twin Falls. | Pleistocene and Pliocene |
|
QTpms |
Sedimentary rocks associated with Basin and Range extension | Fluvial, fan, and lacustrine deposits and intercalated volcanic rocks of the Basin and Range Province (~16-2 Ma); consolidated to weakly consolidated sandstone, siltstone, arkose, conglomerate, mudstone, tuffaceous sediment, basalt, basaltic tephra, and rhyolite tuff. Includes deposits of Lake Idaho (Idaho Group) in western Snake River Plain and Salt Lake Formation deposited in Basin and Range Province of east-central Idaho. |
Quaternary, Pliocene, and Miocene |
|
DSOs |
Sedimentary rocks | Marine dolostone and limestone and sandstone in east-central and southeastern Idaho (Summerhouse, Kinnikinic, and Swan Peak sandstones, Fish Haven, Laketown, Jefferson, Three Forks, and Darby formations) and deep-water carbonaceous mudrocks of Phi Kappa, Trail Creek, and Milligen formations east of Ketchum. |
Devonian to Ordovician |
|
OCs |
Sedimentary rocks | Marine limestone, dolomite, and subordinate shale and sandstone of Cambrian carbonate bank of southeast Idaho stratigraphically up to St. Charles Formation and Ordovician Garden City Limestone. Includes Bayhorse succession (Cash Creek Quartzite, Garden Creek Phyllite, Bayhorse Dolomite, Ramshorn Slate, and Clayton Mine Quartzite) of Clayton area and Pioneer Mountains; quartzite of Kamiak Butte north of Moscow; and Cambrian Gold Creek quartzite, Rennie Shale, and Lakeview Limestone east of Bayview. |
Ordovician and Cambrian) |
|
CZs |
Windermere Supergroup | Upper part consists of shallow marine and fluvial quartzose sandstone, and minor siltite, shale, and limestone of the Brigham Group of southeast Idaho, Wilbert Formation of east-central Idaho, and quartzites of unknown affinity west of Borah Peak. More highly metamorphosed equivalents are quartzite, metaconglomerate, metasiltite, calc-silicate marble, and schist of Gospel Peaks successions C and D in central Idaho; mature quartzite, biotite schist, and minor calc-silicate rocks of Syringa metamorphic sequence east of Moscow; and schist and quartzite in the Albion Range (Elba Quartzite, schist of Upper Narrows, quartzite of Yost, schist of Stevens Spring, quartzite of Clarks Basin, schist of Mahogany Peaks, and Harrison Summit Quartzite). Lower part consists of diamictite, immature sandstone, and bimodal volcanic rocks related to continental rifting. Includes Pocatello Formation (700-665 Ma), formation of Leaton Gulch near Challis, Shedroof Conglomerate in extreme northwest Idaho, and metamorphic equivalents (schist, marble, calc- silicate rocks, metaconglomerate, and ~686 Ma metavolcanic rocks) of Gospel Peaks successions A and B in central Idaho. |
Cambrian and Neoproterozoic |
| GeoGRAFX GIS Services | July 2, 2025 |
| Bear River Zeolite Project Franklin County, USA | Page: 69 |
| Lith Symbol |
Name |
Description |
Period |
|
XAm |
Metamorphic rocks | Pend Oreille granodiorite gneiss near Priest River (~2650 Ma); schist, gneiss, and subordinate quartzite along North Fork Clearwater River; Kelly Creek granite gneiss northeast of Pierce (~2670 Ma); orthogneiss in Pioneer Mountains (~2600 Ma and 695 Ma); granite gneiss, granite, schist, and amphibolite of Green Creek complex in Albion Mountains (~2600 Ma); granite gneiss in Beaverhead Mountains east of Leadore (~2450 Ma); and marble, quartzite, schist, and amphibolite of uncertain age near Henrys Lake. |
Paleoproterozoic and Archean |
Section F’ – F” shown in Figure 6.1-2 cuts thru the Cache Valley to the north of the BRZ property. It displays the geology and structural relationships described in Section 6.1.1 and 6.2.2.
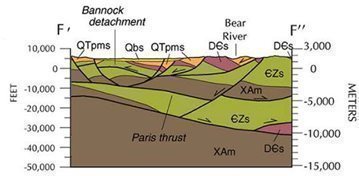
Figure 6.1-2 Section F' - F"
6.1.2 Structure
Structurally, Cache Valley, directly to the west of the property, lies along the Wasatch Fault Zone, part of the Basin and Range Province. It is characterized by north-striking, high-angle normal faults (the East Cache and West Cache fault zones) shown in Figure 6.1-3. The valley is a result of crustal extension that began around 15 to 20 million years ago. Here, the Paleozoic rooks are folded into northward and southward trending flexures and dislocated by high-angle faults. The Cenozoic beds, in most localities, dip eastward at relatively low angles and are displaced only to a minor degree by faulting. They overlie the older rocks with pronounced unconformity (Coulter, 1956).
| GeoGRAFX GIS Services | July 2, 2025 |
| Bear River Zeolite Project Franklin County, USA | Page: 70 |
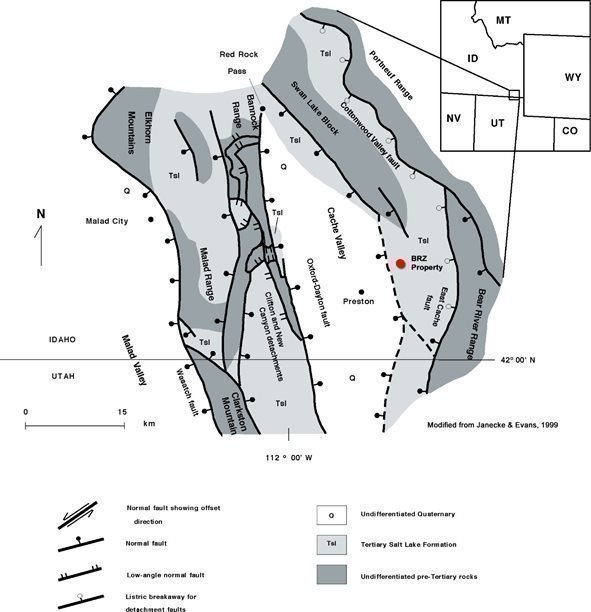
Figure 6.1-3 Structural Geology of the Cache Valley Region
6.1.3 Mineralization
Previous exploration efforts undertaken by the US Geological Survey (USGS) were limited to the examination and sampling of surface outcrops for favorable zeolite occurrences within the Cache Valley Formation Analysis of zeolite samples, particularly around the BRZ property, showed those zeolites to be of lower quality due to higher silica content.
Bear River has since focused efforts on developing and expanding their existing deposit.
| GeoGRAFX GIS Services | July 2, 2025 |
| Bear River Zeolite Project Franklin County, USA | Page: 71 |
6.2 Property Geology
The deposit contains a thick sedimentary deposit of zeolitized volcanic ash of Tertiary age known as the Cache Valley Formation of the Salt Lake Group. The sedimentary interval in which the clinoptilolite occurs is more than 1000 feet thick in the area. Thick intervals of the zeolite are separated by thin limestone beds deposited in the freshwater lake where the volcanic ash accumulated (Lawrence, 2009).
6.2.1 Lithology
Mapping of the Preston 15 minute quad by Oriel and Platt (1980) at a scale of 1:62,500, describes the lithology on the property to be part of the Tertiary Salt Lake (Tsl) group shown in Figure 6.2-1. They describe the Tsl group as white, gray, and green tuff, calcareous siltstone, sandstone, and conglomerate which grade into red-weathering diamictite near exposures of older rocks. The Salt Lake group is composed of the basal Collinston conglomerate, the Cache Valley Formation and The upper Mink Creek Conglomerate (Adamson R. D., 1955). It reaches a thickness of several thousand meters near Preston.
| GeoGRAFX GIS Services | July 2, 2025 |
| Bear River Zeolite Project Franklin County, USA | Page: 72 |
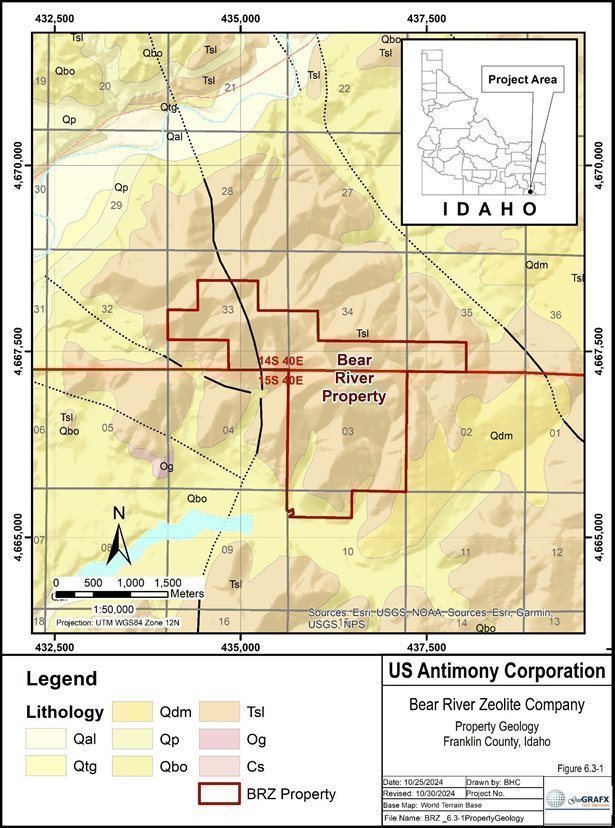
Figure 6.2-1 Property Geology
| GeoGRAFX GIS Services | July 2, 2025 |
| Bear River Zeolite Project | Page: 73 |
| Franklin County, USA |
|
Map units shown in Figure 6.2-1 are summarized below in Table 6-2.
Table 6-2 Description of Property Geology Map Units
| Lith Symbol |
| Name | Description | ERA/Period |
|
|
|
| HOLOCENE AND PLEISTOCENE SURFICIAL DEPOSITS |
|
| Qal |
| Alluvium | Well to poorly sorted, unconsolidated gravel, sand, and silt in channels and flood plains. As much as 20m thick |
|
| Qtg |
| Terrace gravels | Unconsolidated coarse to fine gravel. Lines within unit separate terraces of different elevations and ages. As much as 100m thick. |
|
| Qd |
| Colluvium | Unconsolidated and unstratified angular debris on hillsides. |
|
|
|
|
|
|
|
|
|
|
| PLEISTOCENE SURFICIAL DEPOSITS |
|
|
|
|
| Unconsolidated, strikingly unsorted clastic material that ranges in size from | CENOZOIC/ Quaternary |
| Qdm |
| Diamicton | clay and silt to blocks of quartzite and other massive units. Deposited as mudslides, rock glaciers, and hillwash. As much as 200 m thick Unconsolidated gravel and sand deposited along the periphery of Lake |
|
| Qp |
| PROVO FORMATION | Bonneville during the Provo state; grades basinward into pink silt and clay (Qpb). As much as 30 m thick |
|
| Qbo |
| BONNEVILLE AND ALPINE FORMATIONS | Poorly consolidated gravel and sand, mainly pink; deposited along the periphery of Lake Bonneville during the Alpine and Bonneville stages; grades basinward into pink silt and clay (Qpb). About 30 m exposed. |
|
|
|
|
| PLIOCENE AND MIOCENE SEDIMENTS |
|
| Tsl |
| SALT LAKE FORMATION | White, gray, and green tuff, calcareous siltstone, sandstone, and conglomerate; grades into red-weathering diamictite near exposures of older rocks. Reaches a thickness of several thousand meters near Preston. | Tertiary |
|
|
|
| UNCONFORMITY | PALEOZOIC |
| Og |
| GARDEN CITY LIMESTONE | Dark-gray limestone; minor dolomite. Abundant bioclastic and intraformational conglomerate and chert, increasing toward top. 360 m thick. | Middle And Lower Ordovician |
|
|
|
| UNCONFORMITY |
|
| Cs |
| ST. CHARLES LIMESTONE | Medium-gray crystalline limestone containing beds of intraformational conglomerate and chert; some thin-bedded dolomite near top. 300 m thick. | Upper Cambrian |
| Cbo |
| BLOOMINGTON FORMATION | Green mudstone containing partly nodular siltstone beds in upper part and limestone in lower part. 300 m thick. | Middle Cambrian |
| Cbb |
| BLACKSMITH, BANCROFT, AND UTE LIMESTONES | Thin-to medium-bedded, medium gray oolitic and crystalline limestone. 400 m thick. | Middle Cambrian |
Detailed mapping by Adamson (1955) classified the property lithology as belonging to the Cache Valley (Tcv) Formation of the Tertiary Salt Lake (Tsl) group. The following discussion of the Cache Valley Formation is taken largely from the (Adamson, Hardy, & Williams, 1955) publication with additional information as cited.
In the foothills of the Bear River Range east of Preston, Idaho, between Worm Creek and Cub River, a thick succession of the Salt Lake group is exposed. Tuffaceous sediments 7,674 feet thick unconformably overlie Paleozoic rocks and are overlain by a conglomerate at least 1,026 feet thick (Figure 6.2-2). The conglomerate is well exposed in Cub River Canyon to the south.
In Worm Creek valley, just north of the Glendale Reservoir, Paleozoic rocks are exposed near the core of an anticline involving tuff of the Salt Lake group (Figure 6.2-2). The Salt Lake group unconformably overlies and dips away from the Paleozoic outcrops. A stratigraphic section was measured along the east limb of the anticline. The succession strikes generally north and dips to the east. The dip increases gradually from 1° near the crest of the anticline to 40° near the middle of the section on the eastern limb. Near the overlying conglomerate, however, the dip is only 20°.
|
|
|
| GeoGRAFX GIS Services | July 2, 2025 |
| Bear River Zeolite Project | Page: 74 |
| Franklin County, USA |
|
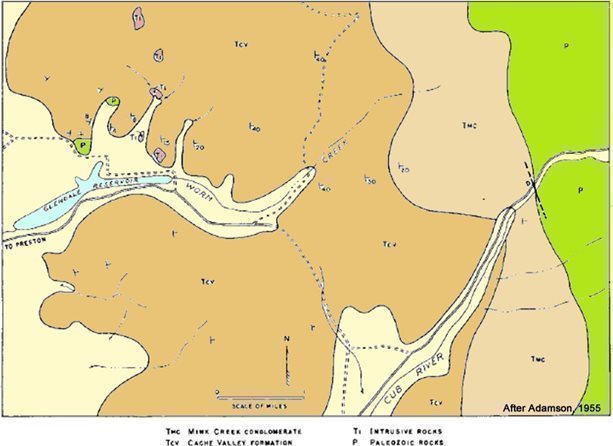
Figure 6.2-2 Map of Worm Creek Geology
A composite section of Salt Lake group was measured in Worm Creek Valley, Idaho, starting near the outcrop of Paleozoic rocks just north of the mid-point of Glendale Reservoir on the Bear River property, and extending eastward across the limb of an anticline, (Secs. 3, 4, and 5, T15S., R40E.) is shown in Table 6-3 Stratigraphic Section of Worm Creek, Idaho.
Table 6-3 Stratigraphic Section of Worm Creek, Idaho
| Mink Creek conglomerate | Thickness (Feet) | |
| 15. | Conglomerate, pebble and cobble, matrix of marl and some tuff. Pebbles and cobbles of dark-gray limestone, tuff, and quartzite; boulders as large as 5 feet of quartzite and limestone | 1026.0+ |
| Cache Valley formation | ||
| 14. | Tuff, gray, interbedded coarse sandstone | 1320.0 |
| 13. | Tuff, gray, resistant beds, plant fossils | 318.0 |
| 12. | Sandstone, light gray. Largely covered | 610.0 |
| 11. | Tuff, gray to green | 860.0 |
| 10. | Tuff, pale yellowish green; sandstone, brown to light gray, few thin pebble conglomerate layers | 2142.0 |
|
|
|
| GeoGRAFX GIS Services | July 2, 2025 |
| Bear River Zeolite Project | Page: 75 |
| Franklin County, USA |
|
| 9. | Limestone, gray, platy, "petroliferous," tuffaceous. One chert bed 2 feet thick | 93-0 |
| 8. | Tuff, yellow green, interbedded gray limestone and "petroliferous" limestone. Basic dike 112 feet from bottom. Largely covered | 1734.0 |
| 7. | Limestone, dark gray, thin bedded, "petroliferous" | 66.0 |
| 6. | Covered. Limestone, tuff, and igneous rock. | 134.0 |
| 5. | Tuff, gray, interbedded dark-gray limestone | 92.0 |
| 4. | Limestone, gray | 102.0 |
| 3. | Tuff, grayish green, interbedded limestone | 106.3 |
| 2. | Limestone, light gray. Largely covered | 15.4 |
| 1. | Tuff, gray to green, interbedded green tuffaceous limestone | 82.0 |
|
| Total | 8700.3+ |
| Unconformity | ||
| Paleozoic rocks | ||
The lower 7,674 feet of the section consists mostly of well bedded tuff and limestone of lacustrine origin. The base is marked by a very light-gray to light-green tuff, 82 feet thick, with interbedded thin- bedded light-olive-gray limestone. The remainder of the tuffaceous beds, 5,502 feet, consists of light- gray to light-green, thin- to massive-bedded tuffs interbedded with light-gray to dark gray, thin- to medium-bedded limestones. A few sandstone and conglomerate beds are interbedded with the tuffs and limestones; light gray to light-green tuffaceous sandstone beds become abundant near the top. The sandstones and conglomerates are medium- to massive bedded and in some places are cross-bedded. The light-gray tuffs usually weather to smooth slopes and offer little resistance to erosion. They are thin- to massive-bedded; many massive beds are more resistant and stand out as ridges. In contrast to the weaker light-gray tuffs, the green tuffs are generally more resistant and harder. They weather to small chips with conchoidal surfaces and sharp edges and stand out as ridges. Limestones in the section are well bedded, thin to medium, arid three of the limestones are "petroliferous." A limestone near the top of the section contains a 2-foot dark-yellowish- orange chert bed.
The 86 feet of smoke-gray "petroliferous" limestone and tuff of the area north of Bear River Narrows may be equivalent to the "petroliferous" limestone and tuff in the Worm Creek area. The only basis for suggesting a correlation of this nature would be the lithologic similarity and the "petroliferous" character of the limestone.
The tuffaceous conglomerate in the upper part of the succession in Worm Creek valley is at least 1,026 feet thick and overlies the tuffaceous beds conformably. Pebbles and cobbles of the conglomerate consist chiefly of dark-gray limestone, light-gray tuff, light-tan to white quartzite, and black chert. Many boulders of light-tan to white quartzite, and dark-gray limestone are scattered throughout the conglomerate. Some are as large as 5 feet in diameter. The pebbles and cobbles are subrounded to subangular and are cemented by pale-yellow-orange to white tuffaceous marl and white calcareous tuff. A few thin calcareous tuffs, 2 to 10 inches, are present near the bottom. The conglomerate becomes finer toward the top. Scattered gastropod fossils were found in one limestone bed, and ostracod tests are abundant in a limestone. Plant remains were found in two places.
|
|
|
| GeoGRAFX GIS Services | July 2, 2025 |
| Bear River Zeolite Project | Page: 76 |
| Franklin County, USA |
|
A basic igneous mass intrudes the Salt Lake group near the crest of the anticline in Worm Creek valley about a quarter of a mile north of the middle of Glendale Reservoir. The intrusion has cut and altered tuff and limestone beds overlying it. Later basic dikes have cut both the intrusion and overlying limestone and tuff. Little alteration was produced by the dikes. The beds of the Salt Lake group appear little disturbed by the intrusions; however, the intrusions may have caused the anticline in the area.
6.2.2 Structure
The mountain ranges bounding Cache Valley stood in high relief at the time of Salt Lake group deposition possibly as a result of Basin and Range faulting (Williams J. S., 1948) or normal processes of erosion. During the deposition of the Salt Lake group, faulting occurred along the boundaries of Cache Valley resulting in the deposition of the Mink Creek conglomerate over the tuff and limestone of the Cache Valley formation (Keller, 1952). Post-Salt Lake group high-angle faults parallel all mountain fronts that bound the valley. These faults trend essentially northward and probably result from renewed movements in the boundary faults previously delineating the valley (Williams J. S., 1948). The faults displace the Salt Lake group, and the fault blocks have tilted generally toward the valley except in the northeastern part where they dip generally toward the mountain front. The dip of the beds toward the valley is too great, in most instances, to be accounted for by normal valleyward dips resulting from deposition.
6.3 Bear River Deposit
The Bear River Zeolite deposit itself is a thick sedimentary deposit of zeolitized volcanic ash of Tertiary age deposited in the Cache Valley Formation of the Salt Lake Group. The sedimentary interval in which the clinoptilolite occurs is more than 1000 feet thick in this area. Thick intervals of the zeolite are separated by thin beds of limestone which was deposited in the freshwater lake where the volcanic ash accumulated. The zeolite and limestone layers are overlain by zeolite rich soil varying in thickness from a few inches to approximately 12 feet (Brewer, 2015).
6.3.1 Lithology
The following description of the Bear River Zeolite deposit is taken largely from the (Blackledge, 2024) report with additional information as cited. The map and sections of the Bear River Zeolite deposit are credited to the field work done by Tracy Crane that appears in the John Lawrence Report (2009) in Figure 6.3-1, and Figure 6.3-2.
|
|
|
| GeoGRAFX GIS Services | July 2, 2025 |
| Bear River Zeolite Project | Page: 77 |
| Franklin County, USA |
|
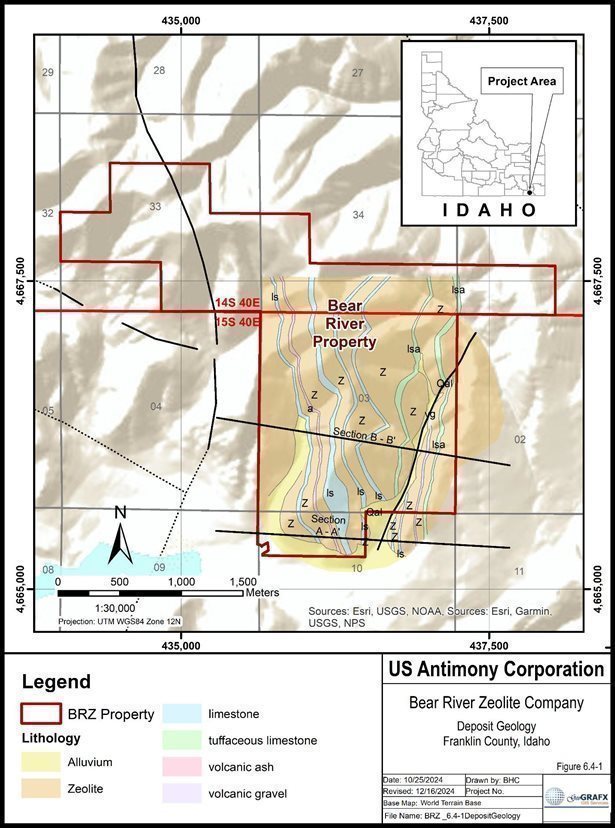
Figure 6.3-1 Geology of the Bear River Zeolite Deposit
|
|
|
| GeoGRAFX GIS Services | July 2, 2025 |
| Bear River Zeolite Project | Page: 78 |
| Franklin County, USA |
|
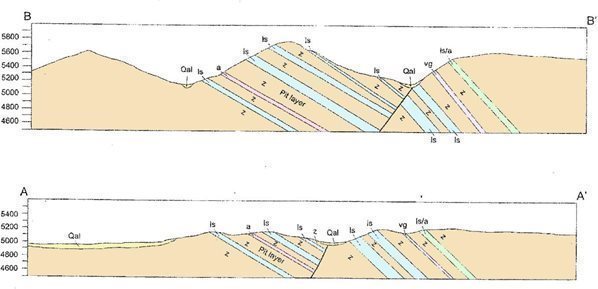
Figure 6.3-2 Generalized Cross Sections of the BRZ Deposit
The Bear River property contains a substantial thickness of zeolitic tuff exceeding 93 feet (84 feet drilled vertically into an assumed 25 degree dip). This tuff, which comprises the lower member of the Cache Valley Formation is a significant source of Clinoptilolite occurring on the Bear River property.
The Bear River zeolites consist of a recurring sequence of over 93 feet of olive green to gray green tuffaceous zeolite bearing sediments interspersed with lenses of what is locally termed “limey shale” overburden. This overburden, formed from thinly layered rhyolitic tuff, can exceed 40 feet in thickness in certain areas. The “shale” is significantly harder than the underlying zeolite and acts as a protective cap, forming a structural “backbone” for many of the property’s ridges. Accelerated erosion of the green, zeolite-bearing tuff is observed in areas where the rhyolitic tuff layer is thin or absent. Figure 6.3-3 below shows the gray green tuffaceous zeolite bearing sediments the Bear River middle pit.
The green, zeolite-bearing tuff in this deposit is relatively soft, with a Mohs hardness of 3–4. It fractures irregularly, with semi-conchoidal patterns in denser sections. The thicker, massive layers—often exceeding 4 to 6 feet—exhibit jointing that is roughly perpendicular to bedding. Bedding thickness varies significantly; near the contact with the thin-bedded, rhyolitic capping tuff, the layers become notably thin. This is likely due to a change in the chemistry of the volcanic ejecta, rather than a shift in the eruptive style, which remained short with sparse ejecta. Dark gray and mottled gray-green tuff layers, which tend to be more massive, generally appear below these initial thin layers.
The ore grade in these layers is minimal, and they are considered overburden. Observations indicate that this "low-grade" ore can reach up to 20 feet in thickness, based on drill cuttings. Once drilling passes through the mottled dark gray and green tuff, undifferentiated dark, Kelly green, zeolite-bearing tuff chips are encountered. Under 10x magnification, the tuff shows little variation other than density and color, ranging from light olive green to dark Kelly green. This lack of differentiation suggests that the volcanic events responsible for this extensive deposit were likely large-scale and geologically brief.
|
|
|
| GeoGRAFX GIS Services | July 2, 2025 |
| Bear River Zeolite Project | Page: 79 |
| Franklin County, USA |
|
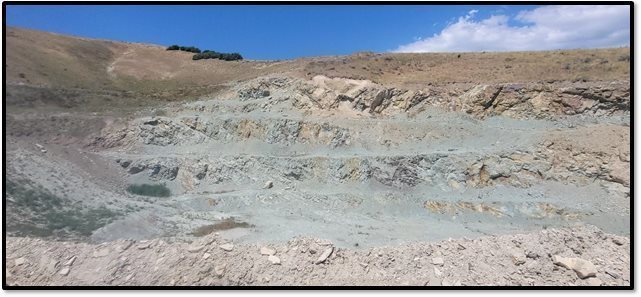
Figure 6.3-3 Bear River Middle Pit
6.3.2 Genesis and Depositional Environment
The Bear River zeolite deposits in the Cache Valley formation near Worm Creek formed in a lacustrine (lake) environment. This setting is marked by the interaction of volcanic ash with alkaline and saline lake waters, which leads to the alteration of volcanic glass into zeolite minerals. The Cache Valley tuff was deposited in a low-energy, closed-basin lake during the late Miocene to early Pliocene. Volcanic ash from explosive eruptions settled in the lake, creating thick layers of volcanic glass in water-rich, anoxic (low-oxygen) conditions.
The volcanic glass-rich tuff interacted with alkaline lake waters that were rich in dissolved silica, sodium, potassium, and calcium. As the lake water infiltrated the tuff, the volcanic glass dissolved and reprecipitated as zeolite minerals, such as clinoptilolite, chabazite, and analcime. This process occurred under low temperatures and pressures (less than 200°C), typical of shallow burial environments. The lake waters were typically alkaline to saline, with high concentrations of dissolved ions, promoting zeolite formation. The lake likely experienced fluctuating water levels, which influenced the distribution and thickness of the zeolite-rich layers.
The zeolite minerals found in the Cache Valley formation near Worm Creek include clinoptilolite, a common zeolite in altered volcanic tuffs, particularly associated with alkaline environments, analcime, which forms in more saline conditions, especially in closed-basin lakes, and chabazite, another zeolite often found under similar environmental conditions.
The thin, laminated ash-rich layers suggest deposition in quiet waters, typical of a lacustrine environment. The sediments and pore waters show high levels of silica and alkalinity, consistent with closed-basin lakes. Additionally, trace element and isotopic studies indicate that the volcanic material underwent diagenetic alteration into zeolites under lacustrine conditions. Fossilized remains of freshwater organisms found in the same strata further support the interpretation of a lake setting during deposition.
|
|
|
| GeoGRAFX GIS Services | July 2, 2025 |
| Bear River Zeolite Project | Page: 80 |
| Franklin County, USA |
|
6.3.3 Structure
The zeolite-bearing green tuff at the Bear River property has undergone minor structural deformation. Given its presumed Tertiary age of deposition, the deposit remains relatively undisturbed. Notably, the few identifiable structural features trend in a North-Northwest direction, with an eastward dip angle that progressively increases to the East (Adamson R. D., 1955). While these features are mentioned in his Thesis, they are not included in his map shown in Figure 6.2-2 above.
Adamson (1955) describes an anticline, or upward fold, in the region’s rock structure. Viewing the Bear River property from the north, it appears situated on the eastern limb of this anticline, with the local rock strata dipping eastward accordingly. Adamson identified an outcropping hill of Paleozoic origin (540–250 Ma) roughly one mile east of the BRZ processing mill. This Paleozoic exposure aligns with the north-south axis of the anticline, suggesting that older rock layers were uplifted, deforming the overlying, younger rocks and causing the zeolite-bearing tuff on the Bear River property to dip at an average angle of approximately 30 degrees east.
A noteworthy regional structure, the Worm Creek fault, intersects this part of the Bear River Mountains. This fault contributes to the isolated, lobed cluster of 1,000-foot mountains that make up the Bear River Zeolite property, standing above the surrounding valley. Observations indicate that the Worm Creek fault cuts through even the Paleozoic anticline-forming rocks, as the mountain structures to the south of Worm Creek Valley show a similar trend to those on the northern side, where the Bear River property is located.
6.3.4 Mineralization
Mineralogically, the Bear River Zeolite consists of approximately 77 to 85% clinoptilolite with the remainder consisting primarily of opaline silica. Clinoptilolite is a natural zeolite mineral, primarily composed of hydrated aluminosilicates of sodium, potassium, and calcium with the chemical formula (Na, K, Ca)2-3Al3(Al, Si)2Si13O.12H2O. Its unique, porous crystal structure enables it to absorb and exchange ions, making it valuable in filtering, detoxifying, and nutrient exchange applications.
The BRZ zeolite originated from volcanic ash that settled in a fresh water lake and solidified into rock over thousands of years. The distinct character of this zeolite is a function of (1) the temperature of the air-fall tuff at the time of deposition in lake water, (2) the intrinsic geochemistry of the felsic tuff, and (3) the chemistry of the lake water in which the tuff was deposited. The primary alkali component— whether calcium, sodium, or potassium—is largely determined by the chemical composition of these waters.
The BRZ™ clinoptilolite zeolite samples exhibit a high cation exchange capacity (CEC) of 98–178 meq/100 grams, low sodium content (under 0.5%), high potassium content, a hardness of 3.5–4, and a consistent, uniform composition.
6.3.5 Deposit Dimensions
Currently, zeolite has been sampled over a vertical extent of over 800 feet and on more than 700 acres of surface area. The current pit covers more than 3 acres. Within the pit, the zeolite beds are remarkably homogeneous (Brewer, 2015).
|
|
|
| GeoGRAFX GIS Services | July 2, 2025 |
| Bear River Zeolite Project | Page: 81 |
| Franklin County, USA |
|
6.4 Geological Model and Deposit Type
The Tertiary Cache Valley Formation of the Salt Lake Group contains the zeolite mineralization mined at the Bear River property. The zeolite mineralization encountered in the Cache Valley Formation is stratigraphic in nature and the deposit type is considered an example of a sedimentary zeolite in tuffs deposited in a saline alkaline lake of a closed hydrologic system.
|
Figure 6.4-1 Alteration mineral zoning in saline, alkaline lake environment.
|
| According to (Marantos, Christidis, & Ulmanu, 2012) saline alkaline lakes deposits are hydrologic closed systems, typical of arid or semiarid areas, in which evaporation exceeds inflow (Sheppard, DESCRIPTIVE MODEL OF SEDIMENTARY ZEOLITES - Deposit subtype: Zeolites in tuffs of saline, alkaline-lake deposits - Model 25o.2, 1991). Saline or saline-alkaline brines may develop by evaporation, depending on parent waters composition and chemical evolution (Hardie & Eugester, 1971).
Modern closed basins are classified into two distinct geological environments a) a playa lake complex in which a broad flat valley is surrounded by a high mountain range and b) a rift system, which is a steep walled, flat, narrow valley (Surdam R. , 1977). In saline, alkaline lake environments, silicic glass is rapidly altered to zeolite minerals, clay minerals, opaline silica and K-feldspar because of the high pH values, often higher than 9.
|
|
|
|
| GeoGRAFX GIS Services | July 2, 2025 |
| Bear River Zeolite Project | Page: 82 |
| Franklin County, USA |
|
Clinoptilolite, analcime, chabazite, mordenite, phillipsite and erionite are typical zeolite minerals forming in saline alkaline lakes. The deposits exhibit lateral zonal distribution of alteration mineral assemblages, due to zonation of the lake water chemistry from the margins to the center of the lake. A fresh glass zone develops at the margins of the basin, where fresh water is trapped in the interstitial pore water of the volcaniclastics. The zones bearing zeolite minerals occur in the interiors of the lake, whereas in the innermost parts where higher pH values prevail, a K-feldspar zone is developed. Figure 6.4-1 shows the alteration mineral zoning in saline alkaline lake environment (1. Fresh glass zone; 2 zeolite zone; 3 K-feldspar zone). In such systems the formation of zeolites from reaction of volcanic glass with alkaline solutions takes place in two steps (Mariner & Surdam, 1970). First a gel forms, with a Si/Al ratio controlled by the Si/Al ratio of the solution followed by nucleation of zeolites from the gel. The Si/Al ratio of the zeolites is then controlled by the composition of the gel.
This type of zeolite deposits is relatively common throughout the world. Typical examples among others include the Pleistocene lake Tecopa, the Pliocene Big Sandy Formation and the Miocene Barstow Formation in USA (Sheppard, 1973), the Pleistocene lake Olduvai Gorge in Tanzania (Hay, Silicate Reactions in Three Lithofacies of a Semiarid Basin, Olduvai Gorge, 1970), the Pleistocene – Holocene Lake Magadi in Kenya (Surdam & Eugaster, 1976), Lake Natron in Tanzania (Hay, 1966), and the Neogene saline alkaline lake of Karlovassi, Samos Island, Greece (Stamatakis, 1987). Zeolite minerals may also form in saline environments of low alkalinity. In these cases, saline minerals indicative of alkaline waters are absent, Ca-rich zeolites form, and the reaction of Ca-zeolites to form K-feldspar suggests mobility of Ca (Boles & Surdam, 1977).
|
|
|
| GeoGRAFX GIS Services | July 2, 2025 |
| Bear River Zeolite Project | Page: 83 |
| Franklin County, USA |
|
7 Exploration
Since 2002, when the mine started production, the primary focus of the company has been on mining currently identified zeolite material, not on expanding the existing resource. With the change of management in 2023, to facilitate planning for future production increases, the decision was made to conduct a definition drilling program and have a reserve estimate prepared by a Qualified Person in compliance with the recently enacted SEC SK regulations subpart 1300.
7.1 Exploration (Other Than Drilling)
This Item discusses the nature of all relevant historical and current exploration work for the Bear River Zeolite Project that are the focus of this Technical Report. Non-drilling exploration data evaluated as part of the current study includes:
|
| a) | Topographic survey work |
|
| b) | Geologic mapping in the zeolite pit area |
|
| c) | Surface geochemical sampling. |
The following discussion presents a summary of the methods and procedures for data collection, any potential biases that may impact the representativeness and reliability of the data, and a discussion of any significant results and interpretations derived from the non-drilling exploration data.
7.1.1 Topographic Surveying
In May 2024, Barr Engineering Co. of Salt Lake City, Utah conducted a high-resolution drone photogrammetry survey over the project area. The survey covered the leased private land, including the active mine pit and plant site, as well as portions of the federal claims to the north. Imagery resolution was 3.82 cm/pixel.
Ground control was established by Brian J. Allen of Allen Land Surveying using Trimble GNSS equipment. The deliverables included a two-foot contour topographic map and an orthorectified, georeferenced aerial image. All products were delivered in Idaho East NAD83 US Survey Feet (EPSG: 2241) coordinate system.
The 2024 topographic surface formed the foundational base for the geological model and was also used to support Mineral Resource and Mineral Reserve estimation activities.
|
|
|
| GeoGRAFX GIS Services | July 2, 2025 |
| Bear River Zeolite Project | Page: 84 |
| Franklin County, USA |
|
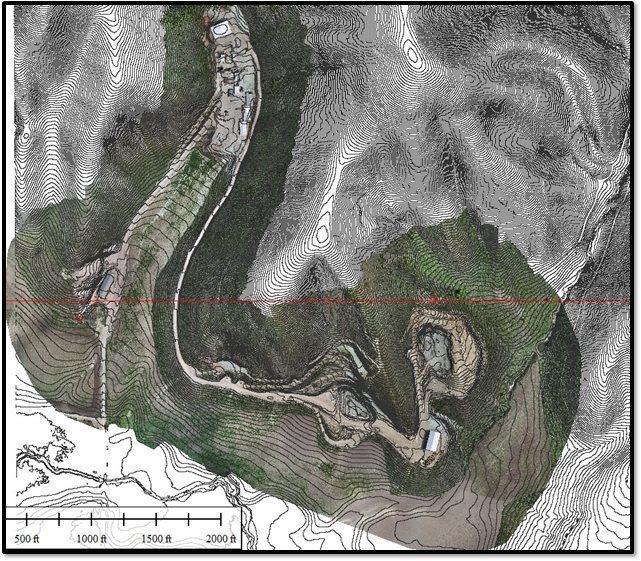
Figure 7.1-1 2024 Surface Topography and Imagery
7.1.2 Geological Mapping
To support interpretation of the stratigraphy and structural geometry of the deposit, regional- and property-scale geological maps were reviewed. These included:
|
| · | USGS Preston Quadrangle maps (1:62,500 scale) – used to identify broad structural trends and major fault zones within the Bear River Range. |
|
|
|
|
|
| · | Prior BRZ mapping efforts – informed contact locations between zeolite-bearing units, overburden, and surrounding lithologies. |
A detailed geologic map of the deposit area, derived from prior mapping efforts, is included in Section 6 – Geological Setting, Mineralization, and Deposit (see Figure 6.4-1). The map and associated cross- sections focused on the zeolite horizons, interbedded limestone, tuffaceous limestone, volcanic ash and overburden units
|
|
|
| GeoGRAFX GIS Services | July 2, 2025 |
| Bear River Zeolite Project | Page: 85 |
| Franklin County, USA |
|
While these regional datasets informed general interpretations, they were not used directly for model construction due to their coarse resolution.
Within the active mine pit, limited deposit-scale surface mapping was carried out in 2024 by independent consulting geologist Troy Blackledge. This mapping focused on delineating the zeolite horizon, “limey shale” marker beds, and overburden zones. Although formal blasthole logging was not conducted, BRZ engineering staff recorded basic lithologic observations during blast pattern development.
7.1.3 Surface Geochemistry
Historically, exploration within the BRZ project area was limited to reconnaissance sampling of surface outcrops. Results from earlier work, including USGS investigations, are no longer available. Prior analyses by Lawrence (2009) indicated that nearby deposits were typically lower grade due to elevated silica content.
In June 2024, a focused surface sampling program was carried out under the supervision of Mr. Troy Blackledge, an independent contract geologist for BRZ. A total of eight (8) rock samples were collected from zeolite-bearing outcrops within the project area. These samples targeted favorable exposures of the Cache Valley Formation, and all were submitted for cation exchange capacity (CEC) analysis—a key geochemical indicator of zeolite quality.
Samples returned cation exchange capacity (CEC) values ranging from 106 to 172 meq/100g, with an average CEC value of 133 (Table 7-1) which is consistent with previously reported BRZ zeolite grades. The identification of one non-zeolitized rhyolitic tuff sample with a low CEC value (4.2 meq/100g) helped distinguish unmineralized intervals and supports ongoing stratigraphic refinement.
Sampling methodologies and preparation procedures are described in more detail in Section 8.1.1 – Sample Method and Approach.
Table 7-1 2024 Surface Rock Sample Results – CEC Analysis
| Sample |
Easting |
Northing |
Sample Type | CEC Value meq/100g |
| 1782859 | 436118 | 4667627 | Zeolite | 140 |
| 1782860 | 434597 | 4668265 | Rhyolitic Tuff | 4.2 |
| 1782861 | 436394 | 4667648 | Zeolite | 106 |
| 1782862 | 436325 | 4667228 | Zeolite | 172 |
| 1782863 | 436390 | 4666982 | Zeolite | 127 |
| 1782864 | 436472 | 4666749 | Zeolite | 125 |
| 1782865 | 436373 | 4666504 | Zeolite | 136 |
| 1782866 | 436131 | 4666497 | Zeolite | 124 |
The locations and CEC results of the outcrop samples are shown in Figure 7.1-2.
|
|
|
| GeoGRAFX GIS Services | July 2, 2025 |
| Bear River Zeolite Project | Page: 86 |
| Franklin County, USA |
|
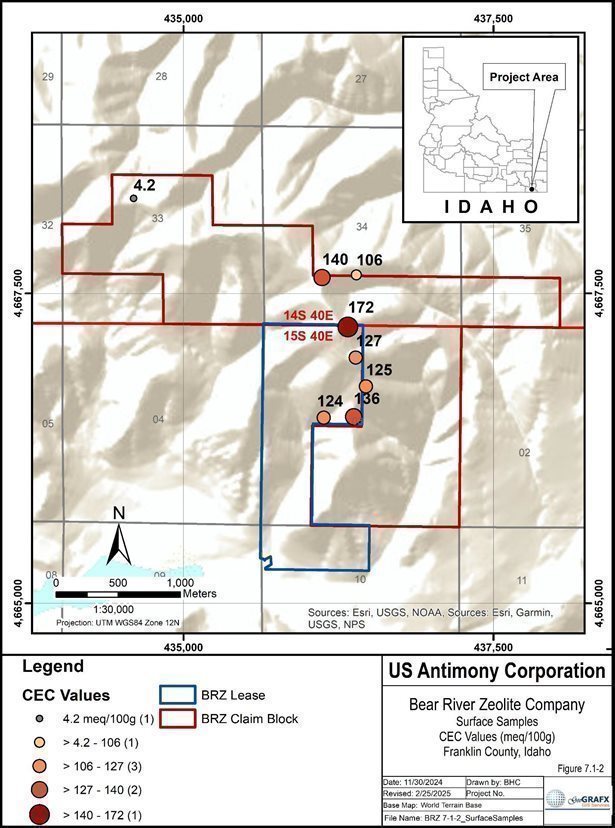
Figure 7.1-2 Surface Sample Locations and CEC Results
|
|
|
| GeoGRAFX GIS Services | July 2, 2025 |
| Bear River Zeolite Project | Page: 87 |
| Franklin County, USA |
|
The authors are not aware of any sampling or analytical factors that would materially affect the accuracy or reliability of the CEC results. While limited in number, the surface samples are considered representative of the outcropping mineralization in this stage of the exploration program.
7.1.4 Qualified Person’s Interpretation of the Exploration Information
The 2024 non-drilling exploration program provided reliable and representative data to support geological modeling and Mineral Resource estimation at the Bear River Zeolite Project.
|
| · | The high-resolution topographic survey forms a robust base surface for modeling. |
|
|
|
|
|
| · | Surface mapping and field observations helped delineate stratigraphic contacts and overburden zones. |
|
|
|
|
|
| · | Geochemical sampling confirmed the presence of moderate- to high-grade zeolitized tuffs, with CEC values ranging from 106 to 172 meq/100g. One low-CEC sample confirmed the ability to distinguish unmineralized rhyolitic tuff. |
In the opinion of the Qualified Person, the exploration data acquired in 2024 are reliable, representative, and appropriate to support continued evaluation and development of the Bear River Zeolite deposit.
7.2 Drilling
7.2.1 Overview
No historical drilling is known to have been completed within the Bear River Zeolite Project area prior to the current work. In June 2024, Bear River Zeolite (BRZ) commenced a definition drilling program to systematically evaluate and delineate a Reserve for its zeolite deposit (Figure 7.2-1). The objective of this program is to establish a comprehensive geological model, refine resource estimations, and support future mine planning efforts.
As of the effective date of this report, the drilling database consists of 80 completed vertical drill holes totaling approximately 6,713 feet (2,046 meters). Drill holes were spaced at 100-foot intervals along existing access roadways, optimizing accessibility while minimizing environmental impact.
A detailed description of the sampling methodology, logging procedures, and quality assurance/quality control (QA/QC) protocols employed in this drilling program is provided in Section 8 of this report.
|
|
|
| GeoGRAFX GIS Services | July 2, 2025 |
| Bear River Zeolite Project | Page: 88 |
| Franklin County, USA |
|
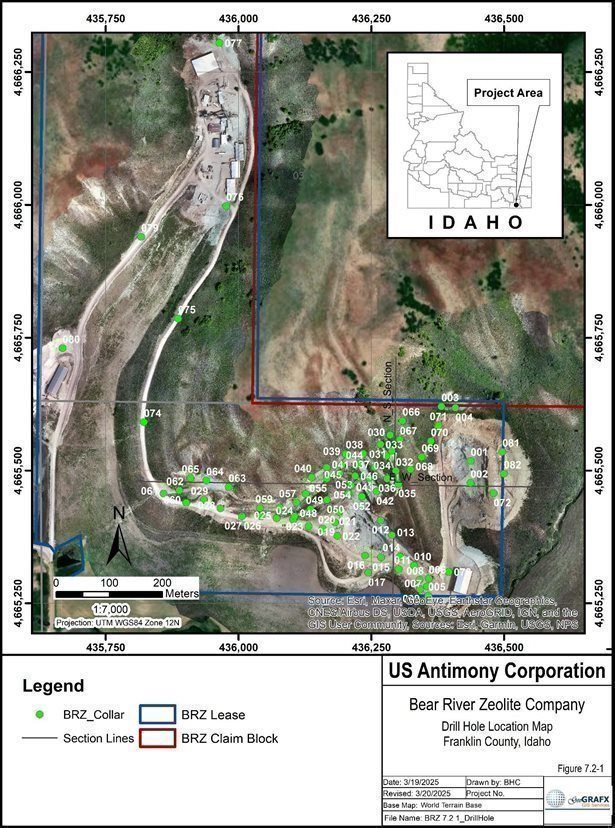
Figure 7.2-1 Drill Hole Location Map
|
|
|
| GeoGRAFX GIS Services | July 2, 2025 |
| Bear River Zeolite Project | Page: 89 |
| Franklin County, USA |
|
7.2.2 Drill Methods
Drilling was performed by McCallum Rock Drilling (MRD) from Chehalis, Washington, using a Furukawa HRC 1450 ED2 hydraulic percussion drill rig, as shown inf Figure 7.2-2. The hydraulic percussion rig drilled 82 shallow vertical holes with a diameter of 3.5 inches, reaching a depth of 84 feet each. Of these, 80 holes were successfully completed, totaling 6,713 feet (2,046 meters) of drilling.
The drill was equipped with 12-foot drill rods. Samples were collected at 6-foot intervals—halfway and at each drill rod change—yielding 14 samples at 6 feet spacing per hole.
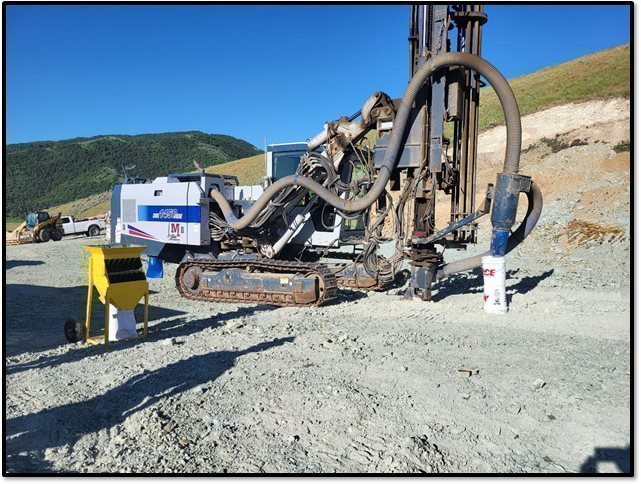
Figure 7.2-2 Furukawa HRC 1450 ED2 Hydraulic Percussion Drill
The drilling was well supervised, the drill sites were clean and safe, and the work was efficiently completed. Drill operational safety inspections were conducted at the drill rig at various times throughout the drilling programs by the drilling contractor.
7.2.3 Logging
Logging was conducted by contract geologist Troy Blackledge using washed representative chip samples collected from each 6-foot interval. Chips were stored in labeled plastic trays with corresponding hole and interval information (Figure 7.2-3). Logging data were initially recorded on paper and later entered into electronic spreadsheets.
|
|
|
| GeoGRAFX GIS Services | July 2, 2025 |
| Bear River Zeolite Project | Page: 90 |
| Franklin County, USA |
|
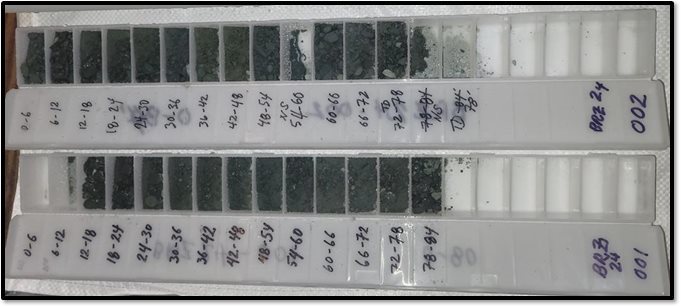
Figure 7.2-3 Chip Trays from 2024 Hydraulic percussion Drilling Program
7.2.4 Recovery
Recovery was not recorded for hydraulic percussion drilling.
7.2.5 Collar Surveys
Initial drill collar locations were established using handheld GPS (Bad Elf Pro, model BE-GPS-2200, 2.5 m accuracy). Locations were marked with wooden stakes and labeled. Upon completion, holes were plugged with 9 50# bags of 3/8" bentonite chips and flagged metal stakes were installed at each collar. Coordinates were recorded manually and logged in an Excel spreadsheet. The drill hole collars have not been re-surveyed.
Drill collar locations are included in Appendix C of this report.
7.2.6 Down Hole Surveys
No downhole surveys were conducted due to the shallow nature of the vertical holes (maximum depth: 84 feet).
7.2.7 Drilling Results
Drilling confirmed that the BRZ zeolite mineralization is hosted within ash-fall tuff units of the Cache Valley Formation. The primary mineralized unit, termed "zeo1," shows strong lateral continuity and high cation exchange capacity (CEC) values, making it the primary target for resource delineation and extraction.
The 2024 drilling data indicates that the distribution of zeolite mineralization is largely controlled by specific lithic compositions and their underlying physical properties. The extent of the deposit remains open at depth, as the current drilling program reached a maximum depth of 84 feet (25.6 meters), with several drill holes terminating while still within mineralization. This suggests that the deposit may extend further below the currently tested interval.
|
|
|
| GeoGRAFX GIS Services | July 2, 2025 |
| Bear River Zeolite Project | Page: 91 |
| Franklin County, USA |
|
The mineralized zone trends along an azimuth of 22° and dips 18° southeast. Mineralization is laterally continuous within the preferred lithology, though CEC grades vary perpendicular to stratigraphy.
Multiple parallel stratigraphic horizons of higher-grade zeolite mineralization have been identified, indicating a predictable depositional framework.
7.2.7.1 Cross Sections
To further illustrate the geological characteristics and mineralization trends, two lithogeochemical cross- sections have been developed through the Mine Site (Figure 7.2-1).
|
| · | Figure 7.2-4 presents a North-South cross-section, viewed towards the East. |
|
|
|
|
|
| · | Figure 7.2-5 presents an East-West cross-section, viewed towards the North. |
Both cross-sections reveal a strong lateral continuity of high-CEC mineralization within the zeo1 lithology, further supporting the potential for consistent and predictable resource extraction.
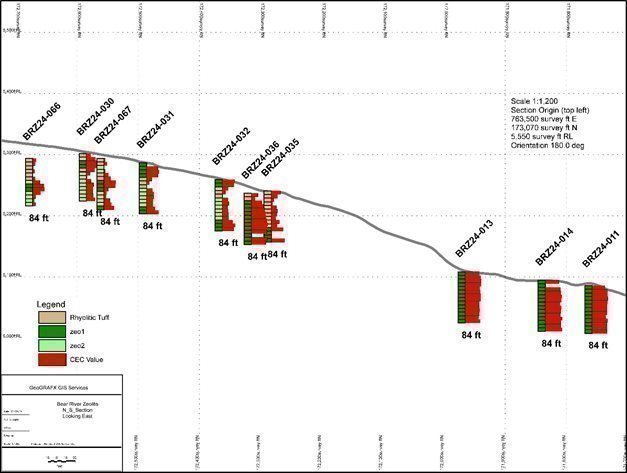
Figure 7.2-4 N-S Cross Section
|
|
|
| GeoGRAFX GIS Services | July 2, 2025 |
| Bear River Zeolite Project | Page: 92 |
| Franklin County, USA |
|

Figure 7.2-5 E-W Cross Section
7.2.7.2 Summary Statistics
Statistical analysis of the 938 CEC results for the logged lithology from the 2024 drilling indicates there is a clear distinction between the lithologic units as shown in the Summary Statistics Table 7-2 below.
Table 7-2 Summary Statistics for CEC Results Grouped by Lithology
|
| Clay | Fill | Rhyolite tuff | Zeo1 | Zeo2 |
| Count | 8 | 3 | 155 | 559 | 213 |
| Minimum | 13.9 | 63.90 | 2.59 | 40.90 | 2.42 |
| Maximum | 88.5 | 82.90 | 143.00 | 197.00 | 110.00 |
| Mean | 50.3875 | 71.53 | 33.92 | 137.21 | 51.52 |
| Range | 74.6 | 19.00 | 140.41 | 156.10 | 107.58 |
| Std. Dev. | 24.49 | 10.04 | 31.09 | 26.14 | 28.17 |
| Variance | 599.67 | 100.70 | 966.29 | 683.23 | 793.82 |
7.2.7.3 Histograms
A bar chart or histogram is a graphical representation used to compare categories by displaying rectangular bars, where the length or height of each bar is proportional to the value it represents. This type of chart provides a clear visual summary of differences between categories, making it easy to identify trends, patterns, and outliers at a glance.
|
|
|
| GeoGRAFX GIS Services | July 2, 2025 |
| Bear River Zeolite Project | Page: 93 |
| Franklin County, USA |
|
Comparing the lithologies shown in Figure 7.2-6 below shows that rhyolitic tuff and zeo2 units tend to have low CEC values while zeo1 units have higher CEC values. There are too few values for either clay or fill to be able to predict their results.
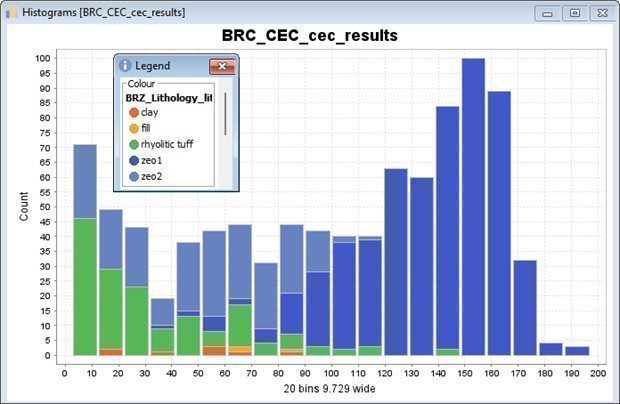
Figure 7.2-6 Histogram of CEC Results Grouped by Lithology
7.2.7.4 Split Probability Diagram
A split probability plot is a visualization tool for analyzing the distribution and likelihood of certain characteristics, such as cation exchange capacity (CEC), across different lithologies. When applied to CEC values, this type of plot can help identify thresholds, trends, and classification probabilities for distinct geological units.
| 1. | Identifying CEC Variability Across Lithologies |
|
| · | By plotting CEC values against lithologies, a split probability plot can show how different rock units exhibit varying CEC distributions. |
|
|
|
|
|
| · | This helps determine which lithologies retain and exchange cations more efficiently, which is crucial for applications in agriculture, water filtration, and industrial processes. |
| 2. | Defining Decision Boundaries for Lithologies |
|
|
|
| GeoGRAFX GIS Services | July 2, 2025 |
| Bear River Zeolite Project | Page: 94 |
| Franklin County, USA |
|
|
| · | If CEC values differ significantly between lithologies, the split probability function can highlight transition zones where the probability shifts from one lithology to another. |
|
|
|
|
|
| · | This can be useful in defining cut-off grades or classification boundaries for mineralogical studies. |
| 3. | Evaluating Lithological Control on Zeolite Quality |
|
| · | Since zeolitized tuff units often exhibit higher CEC due to increased ion-exchange sites, split probability plots can help distinguish high-grade zones from low-grade zones within a deposit. |
|
|
|
|
|
| · | Multiple parallel high-CEC zones could indicate preferred stratigraphic horizons for resource extraction. |
|
|
|
|
| 4. | Predicting CEC Trends in Undrilled Areas |
|
| · | By using existing drill hole data, a split probability model can be used to predict CEC values for areas that haven't been sampled, aiding in resource estimation and exploration planning. |
Reviewing the CEC values for the different lithologies in Figure 7.2-7 shows a marked preference for the zeo1 logged lithology
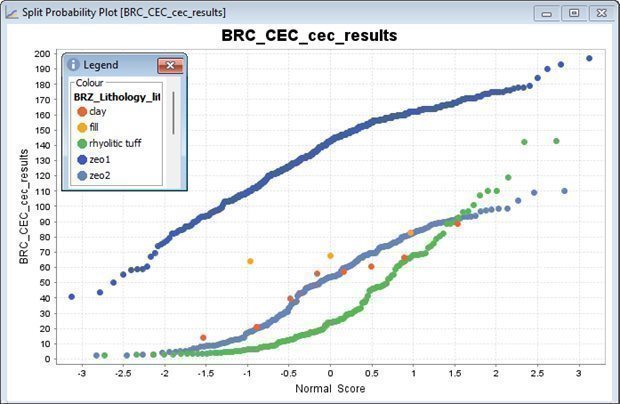
Figure 7.2-7 Split Probability Plots of CEC Results Grouped by Lithology
7.2.7.5Tukey Box Plot
Tukey Box Plots, also known as box-and-whisker plots, are a useful tool for visualizing the distribution of data, especially when comparing multiple datasets across different categories. In the context of analyzing Cation Exchange Capacity (CEC) values for different lithologies (rock types), Tukey Box Plots can help in the following ways:
|
|
|
| GeoGRAFX GIS Services | July 2, 2025 |
| Bear River Zeolite Project | Page: 95 |
| Franklin County, USA |
|
|
| 1. | Median and Central Tendency: The median line in the box indicates the typical CEC for each lithology. This helps in understanding the typical CEC value for each rock type. By comparing the medians of different lithologies, you can determine which lithology tends to have higher or lower CEC values. |
|
|
|
|
|
| 2. | Variability: The interquartile range (IQR) shows how spread out the CEC values are within each lithology. This range indicates how spread out the CEC values are within each lithology. A narrow IQR suggests low variability, while a wide IQR suggests high variability in CEC values within that lithology. |
|
|
|
|
|
| 3. | Outliers: Data points beyond 1.5 times the IQR are marked as outliers, revealing extreme values. This helps identify any extreme CEC values that may be atypical for a specific lithology, which might indicate unusual mineralogical composition or sample anomalies. |
|
|
|
|
|
| 4. | Comparisons: Multiple box plots allow side-by-side comparison of CEC distributions across lithologies. You can assess whether certain lithologies consistently have higher or lower CEC values and observe any overlap or separation between the distributions of CEC for different lithologies. |
|
|
|
|
|
| 5. | Symmetry/Skewness: The plot shape indicates whether CEC values are symmetrical or skewed. If the median is near the center of the box and the whiskers are about the same length, the CEC values for that lithology are roughly symmetrical. If the median is closer to one end or the whiskers are uneven, the data might be skewed. |
In summary, Tukey Box Plots provide a compact yet comprehensive way to analyze the distribution of CEC values across different lithologies, highlighting key statistical aspects like central tendency, variability, outliers, and potential trends.
Reviewing the CEC values for the different lithologies in Figure 7.2-8 displayers outliers for both the rhyolitic tuff and zeo1 lithologies, indicating they may be misclassified in a small number of intervals.
|
|
|
| GeoGRAFX GIS Services | July 2, 2025 |
| Bear River Zeolite Project | Page: 96 |
| Franklin County, USA |
|
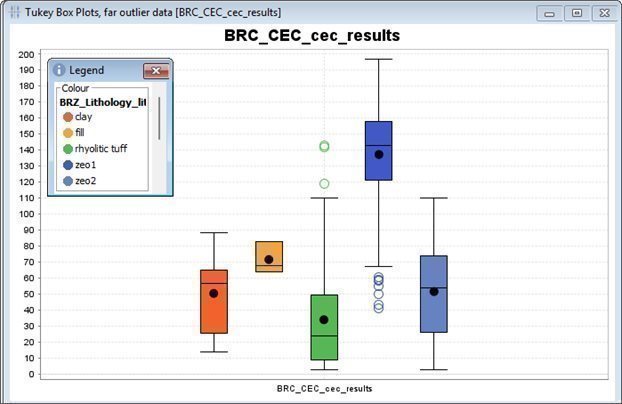
Figure 7.2-8 Tukey Box Plots for CEC Results Grouped by Lithology
7.2.8 Comment on Material Results and Interpretation
The Qualified Persons (QPs) confirm that the drilling, logging, and analytical procedures adhere to industry standards and are sufficient to support the Mineral Resource Estimation discussed in Section
11. The following observations are noted:
|
| · | Drill Hole Spacing and Methodology: The drill hole spacing, sampling methods, and grade analyses were specifically designed to evaluate the structural and grade continuity of the targeted zeolite beds at the deposit scale. |
|
|
|
|
|
| · | Collar and Survey Accuracy: The collar and survey methods employed provide reliable sample locations. |
|
|
|
|
|
| · | 2024 Drilling Program: The 2024 drilling program focused on near-surface portions of the deposit, enabling shorter drillhole depths. In many cases, the holes are terminated in ore. |
|
|
|
|
|
| · | True Thickness: Currently, there is insufficient data to determine the true thickness of the intercepted beds from drill holes. |
|
|
|
|
|
| · | Logging Procedures: Logging procedures were consistent and ensured reliable descriptions. |
|
|
|
|
|
| · | Stratigraphic Considerations: The 2024 drill program was designed with the stratigraphic nature of the mineralization in mind. |
|
|
|
|
|
| · | Data Spacing and Distribution: The data spacing and distribution are adequate to establish the level of geological and grade continuity necessary for mineral resource estimation. |
|
|
|
| GeoGRAFX GIS Services | July 2, 2025 |
| Bear River Zeolite Project | Page: 97 |
| Franklin County, USA |
|
The collected data are suitable for both mineral resource and mineral reserve estimation. The QPs are not aware of any drilling factors that could materially affect the accuracy or reliability of the results.
7.3 Hydrogeology
No formal hydrogeological investigations or groundwater characterization studies have been conducted to date at the Bear River Zeolite Project. As the operation is located on private land and has minimal water demand, hydrogeological assessments have not been required under current regulatory permits.
The project utilizes a leased well for limited industrial use, including dust suppression. No dewatering has been necessary for mining activities to date.
While baseline groundwater data are currently unavailable, future exploration and development activities may include hydrogeologic monitoring to evaluate water table fluctuations, aquifer properties, and any potential hydraulic connectivity between mine workings and local water resources.
Any future hydrogeological studies will be conducted in accordance with applicable state and federal water management requirements to ensure environmental compliance.
7.4 Geotechnical
No historical records are available documenting geotechnical sampling methods, rock strength testing, or slope stability assessments at the Bear River Zeolite Project. Additionally, the 2024 hydraulic percussion drilling program was not designed to collect geotechnical data, and as such, no rock quality or structural information was recorded during that campaign.
Visual assessments of pit walls and highwalls from previous mining activities indicate that the zeolitized tuff units exhibit competent geomechanical behavior. Vertical faces up to 40 feet high have remained intact for several years without signs of significant instability or failure. Based on these field observations, a final pit wall angle of 50 degrees has been adopted and is considered a conservative and stable design for continued surface mining operations.
Future geotechnical investigations may include targeted core drilling, laboratory testing of rock strength and deformation properties, and slope stability modeling. These studies, if undertaken, will follow industry best practices and applicable regulatory guidance to support safe mine design and long-term operational planning.
7.5 Exploration Potential
Exploration efforts at the Bear River Zeolite Project have, to date, been limited in spatial extent and scope. The 2024 drone survey and drilling program covered only a portion of the 320 acres (129.5 hectares) of private land currently leased by BRZ. No exploration has been conducted on the adjacent 994 acres (402.3 hectares) of BLM-managed federal land, and this area remains unpermitted.
Deposit-scale geological mapping has not yet been completed across the full project area, and historical sampling records are unavailable. Surface geochemical sampling has been minimal, with reconnaissance samples collected only within the immediate mine vicinity.
|
|
|
| GeoGRAFX GIS Services | July 2, 2025 |
| Bear River Zeolite Project | Page: 98 |
| Franklin County, USA |
|
The 2024 drilling program, which employed hydraulic percussion methods, delineated near-surface zeolite mineralization across approximately 10% of the leased private ground. These efforts confirm the presence of laterally continuous zeolitized tuff within the Cache Valley Formation.
Given the limited area investigated to date and the favorable geologic setting, the Bear River Zeolite property is considered to have substantial exploration potential. Advancing this potential will require expanded geologic mapping, systematic surface sampling, and staged exploration drilling across both private and federal land holdings. These activities will be necessary to assess the broader extent of mineralization and evaluate the potential for future Mineral Resource definition.
7.6 Qualified Person’s Conclusions on Exploration
In the opinion of the Qualified Persons (QPs), the exploration work completed to date at the Bear River Zeolite Project is adequate to support Mineral Resource and Mineral Reserve estimation within the currently drilled area. The following conclusions are noted:
|
| · | Geological Setting and Mineralization: Exploration results support BRZ's interpretation of the geological setting and mineralization. |
|
|
|
|
|
| · | Data Quality: Data collection, including geological logging and collar surveying, adhered to industry standards and is suitable for use in resource modeling. |
|
|
|
|
|
| · | Mineral Resource and Reserve Estimation: The style and setting of mineralization in the Bear River Zeolite Mine area are sufficiently well understood to support Mineral Resource and Mineral Reserve estimation. |
|
|
|
|
|
| · | Adequacy of Drilling: The 2024 drilling program is adequate to support Mineral Resource and Mineral Reserve estimation in limited areas of the property. |
|
|
|
|
|
| · | Exploration Methods: The exploration methods employed —including geological mapping, surface sampling, and hydraulic percussion drilling— are consistent with industry practices and are sufficient to support ongoing exploration and Mineral Resource estimation. |
|
|
|
|
|
| · | Future Exploration Potential: Continued exploration efforts may uncover additional mineralization, which could lead to an expanded Mineral Resource estimate. |
Drill hole orientations were appropriately aligned with the orientation of stratigraphy and mineralization in the target zones. Representative examples are provided in cross-sections shown in Section 7.2.7.1 and Section 11.9.
Based on the quality and distribution of the data collected to date, the QPs consider the drilling and supporting exploration data to be sufficient to support the Mineral Resource and Mineral Reserve estimates disclosed in this Technical Report.
|
|
|
| GeoGRAFX GIS Services | July 2, 2025 |
| Bear River Zeolite Project | Page: 99 |
| Franklin County, USA |
|
8 Sample Preparation, Analyses, and Security
This section summarizes the information known to the authors relating to sample preparation, analysis, and security, as well as quality assurance/quality control procedures and results, which pertain to the Bear River Zeolite project.
No formal documentation regarding the BRZ project’s sampling methods, analytical processes, or
sample security (chain of custody) procedures is available prior to the 2024 information.
8.1 Sampling Methods
8.1.1 Surface Samples
Mr. Troy Blackledge, contract geologist for BRZ, collected representative rock-chip samples from rock outcrops or sub outcrops. The samples generally ranged in weight from 0.92 to 1.26 kg and were placed in 7"X10" Protexo cotton sample bags marked with the sample number corresponding to the number from a Legend sample book. A perforated tag was placed into the sample bag for further quality control. Sample locations were recorded using a handheld Bad Elf GPS unit. Detailed notes were recorded in field books. Flagging was placed on the ground at the sample site. The samples were transported by the geologist to the BRZ mill where they were recorded and placed in a 5-gallon bucket that was sealed for shipment to the assay lab. The buckets were transported by commercial carrier to the ALS Minerals laboratory located in North Vancouver, British Columbia for processing. Workorders and Chain of Custody forms completed by the geologist accompanied the shipment.
8.1.2 Hydraulic Percussion Drill Rig
The drill rig was equipped with a carousel for adding the 12-foot-long T-51 drill rods. Cuttings from the drill rig were collected by the suction action of the hydraulically powered fan in the dust collector unit in 6-foot intervals (once when each drill rod was added to the string and again at the mid-point of every rod. The suction hose was eight inches in diameter, flexible fabric, smooth inside, and corrugated exterior. One hundred percent (100%) of the cuttings were discharged from the bottom port of the dust collector suction cannister and collected in a 5-gallon bucket.
Samples were collected in a 5-gallon bucket located beneath the sample cannister, usually resulting in a bucket two-thirds-3/4 full. Bucket, with sample was then poured into a Westernex 3-tier sample splitter. This splitter resulted in two samples collected. The sample for analysis was split through all three tiers, resulting in a 1/eighth sample split. The duplicate sample, split only once, resulted in half sample. The duplicate split resulted in a much larger sample. A paint brush and rubber mallet were applied at the end of each sample collection to clear the sample splitter of any retained residue to prevent cross contamination. Both sample bags, the sample for assay and the duplicate, were identified with the hole number and footage interval marked on the bag. The duplicate sample was distinguished from the analytic sample with a large letter “D” after the sample footage interval marked on the bag. Additionally, a Legend Inc. 7-digit unique ID number sample tag was affixed to both of the resulting samples. A duplicate tag of the same ID number was also placed in the bag along with the sample.
|
|
|
| GeoGRAFX GIS Services | July 2, 2025 |
| Bear River Zeolite Project | Page: 100 |
| Franklin County, USA |
|
8.2 Sample Security Methods
All samples were kept under the direct supervision of BRZ staff and its contractors or within secured facilities at the mine site.
Samples were delivered to the analytical laboratory by commercial carrier in the numbered bags, along with a transmittal sheet with the list of sample numbers, the total sample count, and codes for sample type. The lab has no knowledge of the spatial reference of the individual samples, beyond knowing the footage of a particular hole.
The chain of custody was established by transmittal sheets, sample receipt documents from the lab and by work orders and certificates. Changes in custody were documented with signed and dated Chain of Custody (COC) forms.
Coarse reject material and sample pulps were returned to the BRZ Mine by laboratory staff and stored on site for future reference. The storage facility is fenced, gated with padlock access, and under 24-hour video surveillance.
8.3 Density Determinations
Representative samples for bulk density measurements were collected by the contract geologist from three main excavations on the mine site. Samples were processed using the water displacement method with dried, paraffin-coated samples. The results were averaged to obtain a measurement for the zeolite material. Table 8-1 presents the descriptive statistics for bulk density by mineralized zone.
Table 8-1 Descriptive Statistics for Bulk Density by Mineralized Zone
| Zone | Count | Min | Max | Mean | Median | Std Dev | CV |
| Zeo1 | 13 | 2.0 | 2.3 | 2.18 | 2.2 | 0.10 | 0.01 |
| Zeo2 | 1 |
|
| 2.60 |
|
|
|
8.4 Analytical and Test Laboratories
A total of 1,006 samples were submitted for analysis as part of the 2024 surface sampling and drilling program. These included eleven surface samples, 944 hydraulic percussion drill cutting samples, twenty- five duplicates, and twenty-six blanks. The sample material was analyzed by ALS Global for its cation exchange capacity (CEC) and SGS Canada for its mineralogical composition.
Table 8.2 summarizes the laboratories used by BRZ for sample analysis for the 2024 program.
Table 8-2 Analytical Laboratories used by BRZ.
| Laboratory | Location | Certification/Accreditation | Use |
| ALS Global (ALS) | North Vancouver, BC, Canada | ISO/IEC 17025:2017 | Sample Prep (CRU-31, SPL-21, PUL-43) |
| ALS Global (ALS) | ALS Environmental, Saskatoon, SK, Canada | ISO/IEC 17025:2017 | Ammonium Acetate CEC in Soil by colorimetry (E407) |
| SGS Canada, Inc. | Lakefield, Ontario, Canada | ISO/IEC 17025:2017 | Whole rock, XRD analysis |
|
|
|
| GeoGRAFX GIS Services | July 2, 2025 |
| Bear River Zeolite Project | Page: 101 |
| Franklin County, USA |
|
Both ALS Global and SGS Canada, Inc. are independent, ISO-certified laboratories that are independent of Bear River Zeolite Co. and their parent company United States Antimony Corporation.
8.5 Sample Preparation
Samples were submitted to the ALS laboratory in North Vancouver, British Columbia for processing. Once the samples were received at the ALS facility, they were sorted, bar-coded, and logged into the ALS tracking system. The samples were then dried and weighed.
The samples were then crushed using method CRU‐31, consisting of fine crushing to better than 70% of the sample passing 2 mm (Tyler 9 mesh) and split using a riffle splitter (SPL-21). A crushed sample split of up to 250g is coarse pulverized in a ring mill using a chrome steel ring set to at least 85% of the ground material passing through a 425μm screen (Tyler 150 mesh, method PUL-43). Pulverized splits are sent to the ALS Environmental Lab (“ALS”) in Saskatoon, SK, Canada for analysis.
8.6 Analysis
8.6.1 ALS
A pulp from each of the prepared samples was sent to the ALS Environmental Lab in Saskatoon, Saskatchewan, Canada for Cation Exchange Capacity (“CEC”) determination (ALS Code: E407). Cation Exchange Capacity was determined by ammonium acetate (NH4Oac) extraction procedures. The ammonium ions will displace cations present on exchange sites in the sample. Samples were soaked in ammonium acetate solution for 16 hours to allow ammonium ions (NH₄⁺) to displace exchangeable cations bound to negatively charged sites on the mineral surfaces. The ammonium acetate solution is then flushed from the sample using alcohol. The treated sample is then extracted using potassium chloride (KCl) where potassium ions displace the ammonium on the active sites in the sample. The ammonium ions in solution are then analyzed by the colorimetric method using a discrete analyzer. The ammonium concentration in the extract is a direct representation of the cation exchange capacity of the sample. Values were reported in milliequivalents per one hundred grams (meq/100 g).
Method limitations: Due to the high pH of the extraction solution, aluminum is not as readily displaced compared to other CEC methods and may cause the CEC result to be biased low.
8.6.2 SGS
Using the CEC analytical results, fourteen representative samples were sent to SGS Canada, Inc. in Lakefield, Ontario, each weighing up to 250 g. Upon receipt, each sample was weighed, and sample information is logged into a Laboratory Information Management System (LIMS) where all sample processing data is stored.
Representative subsamples were riffled and pulverized for assay and XRD analysis. The remaining material was stored for probable future use.
Mineralogy - Semi-Quantitative XRD Analysis – RIR Method
The Semi-Quantitative Mineral Identification by XRD (ME-LR-MIN-MET-MN-D03) method used by SGS Natural Resources is accredited to the requirements of ISO/IEC 17025.
|
|
|
| GeoGRAFX GIS Services | July 2, 2025 |
| Bear River Zeolite Project | Page: 102 |
| Franklin County, USA |
|
Mineral identification and interpretation involve matching the diffraction pattern of a test sample material to patterns of single-phase reference materials. The reference patterns are compiled by the Joint Committee on Powder Diffraction Standards-International Center for Diffraction Data (JCPDS-ICDD) and released on software as a database of Powder Diffraction Files (PDF).
Interpretations do not reflect the presence of non-crystalline and/or amorphous compounds. Mineral proportions are based on relative peak heights and may be strongly influenced by crystallinity, structural group, or preferred orientations. Interpretations and relative proportions should be accompanied by supporting petrographic and geochemical data (Whole Rock Analysis, Inductively Coupled Plasma - Optical Emission Spectroscopy, etc.).
The Semi-Quantitative analysis (RIR method) is performed based on each mineral's relative peak heights and of their respective I/Icor values, which are available from the PDF database. Mineral abundances for the bulk sample (in weight %) are generated by Bruker-EVA Software. These data are reconciled with a bulk chemistry (e.g., whole rock analysis including SiO2, Al2O3, Na2O, K2O, CaO, MgO, Fe2O3, Cr2O3, MnO, TiO2, P2O5, V2O5 or other chemical data). A chemical balance table shows the difference between the assay results and elemental concentrations determined by XRD.
Trace Mineral Analysis
Trace element analyses were conducted by SGS Canada Laboratory, located in Burnaby, British Columbia. The SGS Burnaby facility did not undertake sample preparation, as it received previously prepared pulp samples from ALS Laboratory.
All samples underwent analysis by aqua regia digestion coupled with Inductively Coupled Plasma– Atomic Emission Spectroscopy/Mass Spectrometry (ICP-AES/MS), utilizing SGS methods GE_ICP21B20 and GE_IMS21B20. Aqua regia, a mixture composed of hydrochloric and nitric acids in an approximate 3:1 ratio, provides a partial digestion suitable for preliminary geochemical assessments and initial site exploration. However, this method has limitations as it does not fully digest silicates and other refractory minerals, resulting in partial analytical outcomes for many elements. Calcium (Ca) concentrations that exceeded the upper detection limits of ICP methods were further analyzed using a Borate Fusion with X-Ray Fluorescence Spectroscopy (XRF) employing the Ore Grade method (GO_XRF72).
SGS Burnaby laboratory maintains stringent quality control standards and currently holds both ISO 9001 and ISO/IEC 17025 accreditations, ensuring the reliability and consistency of analytical results.
8.7 Quality Assurance and Quality Control
The following control measures have been implemented by BRZ to monitor both the precision and accuracy of sampling, preparation, and assaying. The Company’s QA/QC program normally includes a routine insertion of blanks, standards, and field duplicate samples. For the 2024 project, commercial standards were not available for zeolite material and could not be included in the sample stream.
QA/QC samples were inserted and numbered sequentially with the primary drill samples prior to transport to ALS. On average, one coarse blank and one field duplicate were inserted for every twenty drill samples. Field duplicate samples were collected at the rig at the same time as the corresponding primary sample. A total of twenty-six blanks, and twenty-five duplicates were analyzed representing 5.4% of the total number of assayed intervals. Assay results of the duplicates and blanks were monitored for accuracy. Blanks assaying greater than ten times the detection limit were considered analytical busts.
|
|
|
| GeoGRAFX GIS Services | July 2, 2025 |
| Bear River Zeolite Project | Page: 103 |
| Franklin County, USA |
|
Table 8-3 summarizes the types and quantities of QA/QC materials that were submitted to the laboratories with drill samples for the 2024 BRZ drilling project.
Table 8-3 Summary Counts of 2024 BRZ QA/QC Analyses
| Deposit | Drill Hole Assays | Blank | Standard (CRM) | Field Duplicates | Total % |
| Bear River | 944 | 26 2.75% | NA | 25 2.65% |
|
|
|
|
| 5.40% |
NOTE: The table does not include samples that were part of the internal QA/QC protocols of the laboratories.
8.7.1 Certified Reference Materials (Standards)
Certified reference materials (“CRM”) or standards are a special classification of control samples. These are high quality materials that have been subjected to rigorous international testing, usually at more than twenty laboratories. They are always accompanied by a certificate that specifies the source rock, preparation method, details of the collaborative study and the statistics used to calculate acceptance criteria or performance range.
Standards are used to detect sample contamination and to ensure laboratory uniformity. The majority of the time, they are submitted as a pulp sample and are either a Certified Reference Material (“CRM”) or a site-specific standard that may or may not be certified.
Commercial standards were not available for zeolite material and could not be included in the sample stream. The authors relied on the quality control procedures of the ALS Environmental Lab in Saskatoon. It is recommended that BRZ investigate creating custom CRMs for their zeolite material.
8.7.2 Blank Samples
Blanks are samples of barren material that are used to detect potential contamination, which is most common during the sample preparation stages. Blank failures can also occur during laboratory analysis or as the result of a sample mix-up. Blanks must be coarse enough to require the same crushing and pulverizing stages as the drill samples in order for the analyses to be meaningful. It is also important to include blanks in the sample stream within a series of mineralized samples, which would be the source of the majority of contamination issues.
Non-certified in-house blanks were composed of locally sourced, unmineralized marble, quartzite, basalt, or granite. The upper tolerance for results is usually set at 10 times the detection limit of the method if using a material like silica sand.
CEC values of 0.8 meq/100g were selected as a control limit for blanks based on background values. Upon evaluation, blanks reporting values below 8 meq/100g CEC, a limit consistent with assay lab protocols, were considered satisfactory. Blank results that are greater than ten times the lower detection limit are typically considered failures that require further investigation and possible re-assay of associated drill.
|
|
|
| GeoGRAFX GIS Services | July 2, 2025 |
| Bear River Zeolite Project | Page: 104 |
| Franklin County, USA |
|
The non-certified in-house blank samples reported all values under this limit. Table 8-4 provides a summary of the blank reference material submitted by BRZ in the sample stream.
Table 8-4 Summary of Blank material submitted by the Company in sample submissions.
| Standard Material | CEC (meq/100g) | |
|
| ||
| BRZ.BLANK | 0.8 | Commercial Marble |
The results from the analysis of CEC values in blank reference materials are summarized in Table 8-5 CEC in blank reference materials.
Table 8-5 CEC in blank reference materials
| Blank | N | Failures | Maximum CEC (meq/100g) | Observed CEC (meq/100g) | Percent of Maximum |
| BRZ.BLANK | 26 | - | 8.000 | -0.137 | -1.7% |
| Total | 26 |
|
|
|
|
For the 2024 drilling program, a total of twenty-six blanks were inserted with the 944 samples collected. There were no failures for the twenty-six blank samples that were submitted. The cumulative failures account for approximately 0% of the total CRM samples analyzed. Results of the testing of the blank material are included in Figure 8.7-1.
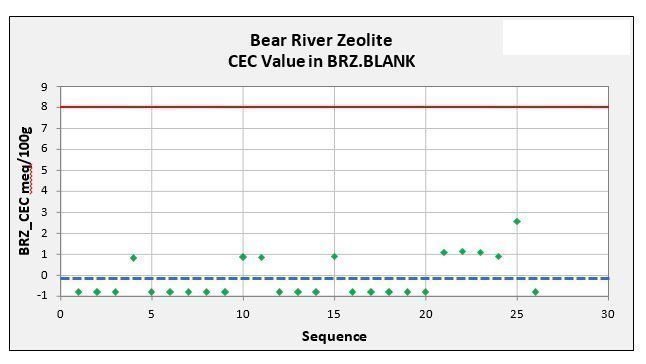
Figure 8.7-1 CEC values in Blanks reference material control chart.
|
|
|
| GeoGRAFX GIS Services | July 2, 2025 |
| Bear River Zeolite Project | Page: 105 |
| Franklin County, USA |
|
8.7.3 Field Duplicates
Field Duplicates are samples taken from the first split of the original bulk hydraulic percussion drill samples, without any previous crushing. The field duplicates are mainly used to assess the quality of the sample collection, sample preparation and analytical precision of the hydraulic percussion drill samples. Duplicate samples are also used to monitor potential mix-up of samples and variability of data due to laboratory error or the lack of homogeneity of the samples.
In order to ensure repeatability conditions, both the original and the field duplicate samples are taken from the same splitting step, submitted to the same laboratory (the primary laboratory), in the same sample batch, and under a different sample number, so that preparation and assaying follow similar procedures. The inclusion of duplicate samples and their comparative analysis is essential in determining the level of precision, or reproducibility of the assay using a particular sampling method and analytical method.
The simplest initial analysis is accomplished using an X - Y scatter plot to gain a general view of the repeatability of results and to identify obvious errors in samples; these can be generated both with normal axis and log axis. The normal scatter plot aptly demonstrates correlation above 1ppm, however due to the skew of the data set towards <1 ppm values the Log scatter plot is required to assess values at the lower grade end of the distribution.
When original and duplicates samples are plotted in a scatterplot, perfect analytical precision will plot on x=y (45°) slope. Cutting duplicates are expected to perform within ±30% of the x=y slope, coarse preparation duplicates should perform within ±20% of the x=y slope while pulp duplicates are expected to perform within ±10% of the x=y slope on a scatterplot.
R-squared is the coefficient of determination and a measure of the goodness-of-fit of the equation to the data. A perfect fit has a value of 1.000. In simple terms, R-squared*one hundred tells you the percentage of the variation of the y-variable due to the variation of the x-variable.
BRZ routinely inserted field duplicate samples every twentieth sample in the sample stream. The sampling methodology is described in section 8.1.2.
|
|
|
| GeoGRAFX GIS Services | July 2, 2025 |
| Bear River Zeolite Project | Page: 106 |
| Franklin County, USA |
|
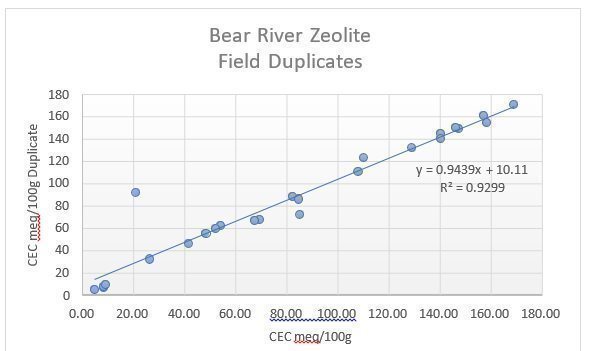
Figure 8.7-2 BRZ Field Duplicate Graph
A total of twenty-five field duplicates were selected and analyzed to assess sample reproducibility. Figure 8.7-2 shows the results of these duplicate analyses. The mean of the field duplicate assays was
88.09 meq/100g, whereas the mean of the original assays was 82.62 meq/100g with a correlation coefficient of 93%. This graph supports a correlation between the primary and secondary assays; however, there was one observed outlier.
8.7.4 Laboratory Quality Control
Both ALS and SGS also undertake their own internal coarse and pulp duplicate analysis to ensure proper sample preparation and equipment calibration.
8.7.4.1ALS Global
The ALS Global analytical laboratories are accredited by the Standards Council of Canada (SCC) for specific tests listed in the Scopes of Accreditation to ISO/IEC 17025, the General Requirements for the Competence of Testing and Calibration Laboratories, and the PALCAN Handbook (CAN-P-1570). Their global quality program includes internal and external inter-laboratory test programs and regularly scheduled internal audits that meet all requirements of ISO/IEC 17025:2017 and ISO 9001:2015.
As reported on their website, standard operating procedures at ALS include the analysis of quality control samples (reference materials, duplicates, blanks) along with all sample batches. As part of the assessment of every dataset, results from the control samples are examined to ensure they meet set standards determined by the precision and accuracy requirements of the method. In the event that any reference material or duplicate result falls outside the established control limits, an error report is automatically generated. This ensures that the person evaluating the sample set for data release is made aware that a problem may exist with the data set, and an investigation can be initiated.
As part of routine procedures at ALS, barren wash material was used between batches during sample preparation and, when requested, between highly mineralized samples as well. This cleaning material is tested before use to ensure that no contaminants are present, and the results are retained for reference. In addition, logs are maintained for all sample preparation activities. In the event that a problem with a prep batch is identified, these logs can be used to trace the sample batch preparation procedure and initiate appropriate action.
|
|
|
| GeoGRAFX GIS Services | July 2, 2025 |
| Bear River Zeolite Project | Page: 107 |
| Franklin County, USA |
|
8.7.4.2 SGS Canada, Inc
SGS Canada is an independent, ISO-certified analytical laboratory serving the global mining industry. The company operates under a robust Corporate Quality Assurance Program, which provides the foundation for the quality systems implemented at each SGS facility. Their laboratories adhere to a stringent quality control framework, incorporating analytical blanks, standards, and duplicates into their processes.
Additionally, SGS conducts internal coarse and pulp duplicate analyses to ensure accurate sample preparation and precise equipment calibration.
SGS Natural Resources Minerals Lakefield is accredited to the requirements of ISO/IEC 17025 for specific tests as listed on our scope of accreditation, including geochemical, mineralogical and trade mineral tests. ISO/IEC addresses both the quality management system and the technical aspects of operating a testing laboratory. Additional details are listed on the SCC website https://scc-ccn.ca/search/accredited- organizations.
8.8 Qualified Person’s Opinion on Sample Preparation, Security, and Analytical Procedures
The sampling methods are acceptable, meet industry standard practices, and are adequate for mineral resource and mineral reserve estimation and mine planning purposes, based on the following:
|
| · | Sampling was conducted by appropriately qualified personnel under the direct supervision of appropriately qualified geologists. |
|
|
|
|
|
| · | Sample collection procedures used meet industry best practices. |
|
|
|
|
|
| · | Security procedures are consistent with industry standards. |
|
|
|
|
|
| · | Sample preparation procedures meet industry best practices. |
|
|
|
|
|
| · | QA/ QC results produce acceptable results. However, commercial certified reference materials were not available for zeolite material. It is recommended that BRZ create standards specific to their deposit. |
|
|
|
|
|
| · | Internal QAQC protocols implemented by the assay laboratories meet industry standards. |
|
|
|
| GeoGRAFX GIS Services | July 2, 2025 |
| Bear River Zeolite Project | Page: 108 |
| Franklin County, USA |
|
9 Data Verification
9.1 Internal Data Verification
9.1.1 Drill Hole Database Audit
GeoGRAFX Consulting LLC, under the supervision of Principal Geologist Barbara Carroll, conducted a detailed audit of the Bear River Zeolite Project drill hole database. The review focused on key database components, including the collar, lithology, and assay tables. Data validation and visualization were performed using Datamine Discover Version 2024 (build 23.0.268) and Leapfrog Geo software.
A visual inspection of drill hole collar elevations and downhole traces was conducted to confirm spatial consistency within the geologic model. No major discrepancies were identified.
As part of the audit, Ms. Cassandra Hall, a contractor working with GeoGRAFX, performed an independent verification of 182 Cation Exchange Capacity (CEC) assay values recorded in the resource database. These values, expressed in milliequivalents per 100 grams (meq/100g), were compared directly against the original digital assay certificates provided by ALS Global, the analytical laboratory contracted during the 2024 drilling program. The review found no significant discrepancies between reported and source values.
In addition to the assay checks, Ms. Carroll completed a series of database integrity and validation procedures, including:
|
| · | Collar Table Checks: Mismatched collar objects, duplicate collar locations, duplicate collars, field null values for northing, easting, elevation, depth (EOH), special characters in holeid field. |
|
| · | Survey Table Checks: Duplicate survey entries, depth inconsistencies (e.g., surveys deeper than EOH), dip value ranges, and collar name mismatches, out of range values. |
|
| · | Downhole Table Checks: Overlapping sample intervals, sample intervals extending beyond EOH, duplicate sample numbers, gaps in sampling, and sample-to-collar ID mismatches. |
The audit identified one instance of an overlapping CEC interval in a single drill hole. This error was corrected in the database prior to resource estimation.
The QPs consider the drill hole database to be accurate, internally consistent, and suitable for use in Mineral Resource and Reserve estimation.
9.2 External Data Verification
9.2.1 Independent CEC Analysis
As part of external data verification, a subset of ten samples from the 2024 drilling program were selected at random from archived coarse reject material currently stored at ALS Global. New pulps were prepared from these rejects and submitted to the ALS Saskatoon laboratory for independent check analysis.
Cation Exchange Capacity (CEC) was determined using ALS Method Code E407, which involves ammonium acetate (NH₄OAc) extraction at pH 7. This is the same analytical procedure employed during initial analysis of the original drilling samples.
|
|
|
| GeoGRAFX GIS Services | July 2, 2025 |
| Bear River Zeolite Project | Page: 109 |
| Franklin County, USA |
|
Results from the original drilling program were compared with the 2024 re-analysis check assays to evaluate analytical precision and reproducibility. Summary results are provided in Table 9-1.
To minimize potential bias, both the original and check analyses were conducted by the same accredited laboratory using identical sample preparation and analytical procedures. This approach was deemed appropriate by the Qualified Person to confirm the accuracy and consistency of the CEC values reported in the resource database.
Table 9-1 Check assay results for 2024 air track drilling.
| Sample_No | CECmeq/100g Original | CECmeq/100g Duplicate |
| BRZ24-056-54-60-1940986 | 179 | 159 |
| BRZ24-033-72-78-1941967 | 178 | 148 |
| BRZ24-002-54-60-1941519 | 169 | 146 |
| BRZ24-043-6-12-1940696 | 163 | 136 |
| BRZ24-082-78-84-1769854 | 121 | 114 |
| BRZ24-074-60-66-1782638 | 110 | 98.8 |
| BRZ24-005-30-36-1941563 | 66.4 | 62.0 |
| BRZ24-071-54-60-1796594 | 24.2 | 20.7 |
| BRZ24-040-6-12-1940654 | 16.1 | 16.4 |
| BRZ24-080-54-60-1782822 | 7.59 | 7.61 |
The comparison of assay values is shown in a scatter plot shown in Figure 9.2-1 below.
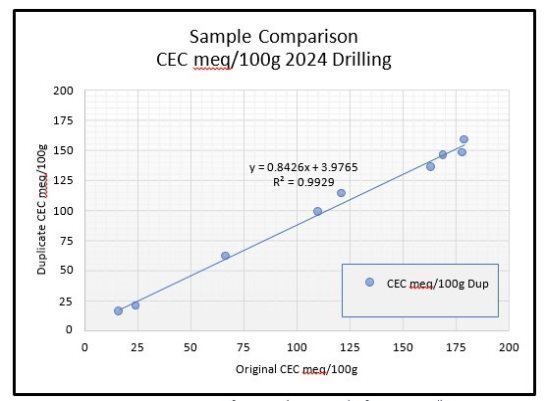
Figure 9.2-1 Comparison of CEC meq/100g Samples from 2024 Drilling
|
|
|
| GeoGRAFX GIS Services | July 2, 2025 |
| Bear River Zeolite Project | Page: 110 |
| Franklin County, USA |
|
The results of the re-analysis demonstrate a 99% correlation between the original ALS assays from the 2024 drilling program and the independent check assays submitted by the Qualified Person. The samples from mineralized zones are not indicative of the extent of mineralization on the property and cannot be used to confirm the assay results in the drill hole database. However, the samples provide confirmation that zeolite mineralization is present at the Bear River Zeolite Project.
Independent CEC analytical results are included in Appendix D of this report.
These verification results support the Qualified Person’s conclusion that the analytical data underpinning the Mineral Resource estimate are accurate within acceptable limits of precision.
9.3 Data Verified by Qualified Person
9.3.1 Data and Document Examination
In support of this Technical Report, the authors reviewed a range of historical and current technical information provided by Bear River Zeolite (BRZ). Unrestricted access was granted to all available documentation, including geological and geochemical reports, maps, exploration records, and land tenure files related to the Bear River Zeolite Project.
While some information was limited or incomplete, the available documentation was prepared by technically competent individuals and is considered to be credible and of generally good quality. Where inconsistencies or gaps were identified, efforts were made to reconcile the information through cross- checking with original sources, supplemental field verification, or direct communication with BRZ staff. All data were reviewed to the satisfaction of the Qualified Person (QP).
BRZ implemented a comprehensive QA/QC program for its 2024 drilling initiative. Samples were submitted to the ALS laboratory in North Vancouver, British Columbia, for processing. The samples were crushed to ensure over 70% passed through a 2 mm (Tyler 9 mesh) sieve and then split using a riffle splitter (SPL-21). A portion of the crushed sample, up to 250g, was coarse-pulverized in a ring mill with a chrome steel ring set, ensuring at least 85% of the material passed through a 425 μm (Tyler 150 mesh) screen. Pulverized splits were then sent to the ALS Environmental Laboratory in Saskatoon, Saskatchewan for Cation Exchange Capacity (CEC) analysis via ammonium acetate extraction (ALS Code: E407).
As part of BRZ’s internal QA/QC program, one coarse blank and one field duplicate were inserted for approximately every 20 primary samples. While certified reference materials (CRMs) were not available for zeolite material and thus not included in the sample stream, the blank and duplicate results were reviewed and found to be within acceptable limits. QA/QC samples were labeled and included in the sample sequence prior to shipment to the laboratory.
Additional detail on sampling, analytical methods, and QA/QC procedures is provided in Section 8 – Sample Preparation, Analysis, and Security.
9.3.2 Unpatented Claim Status
On July 18, 2024, Ms. Carroll, Principal Geologist at GeoGRAFX Consulting LLC, conducted an independent verification of the unpatented placer mining claims associated with the Bear River Zeolite Project. The review was performed using the Bureau of Land Management's Mineral & Land Records System (MLRS), a publicly accessible database for BLM-managed land and mineral use authorizations, conveyances, and claims (https://www.blm.gov/services/land-records/mlrs).
|
|
|
| GeoGRAFX GIS Services | July 2, 2025 |
| Bear River Zeolite Project | Page: 111 |
| Franklin County, USA |
|
The search confirmed that the unpatented placer claims held by Bear River Zeolite Company, a wholly owned subsidiary of United States Antimony Corporation (USAC), are active and in good standing. The results of the MLRS database query are consistent with the list of “BRZ” unpatented Placer Mining Claims provided in Appendix B of this report.
9.3.3 Site Visit
Ms. Carroll conducted a site visit to the Bear River Zeolite Project on November 5, 2024, as part of her Qualified Person duties related to data verification and due diligence. She was accompanied by Jeff Fink, BRZ Vice President and General Manager, and Nick O’Neill, Plant Superintendent.
The site visit included:
|
| · | A property overview and briefing by BRZ site management |
|
| · | A tour of the active mine pit and surrounding project area |
|
| · | Observation of ongoing drilling activities and recent blast patterns |
|
| · | Review of plant facilities, including processing and bagging operations |
|
| · | Discussions of site security, permitting, and operational procedures |
Zeolite mineralization was readily identifiable in both outcrop and drill cuttings by its characteristic green coloration. Exposures in active blast pits offered clear three-dimensional views of mineralized horizons, particularly when wet. Figure 9.3-1 shows the green mineralized material in the Old Pit.
|
|
|
| GeoGRAFX GIS Services | July 2, 2025 |
| Bear River Zeolite Project | Page: 112 |
| Franklin County, USA |
|
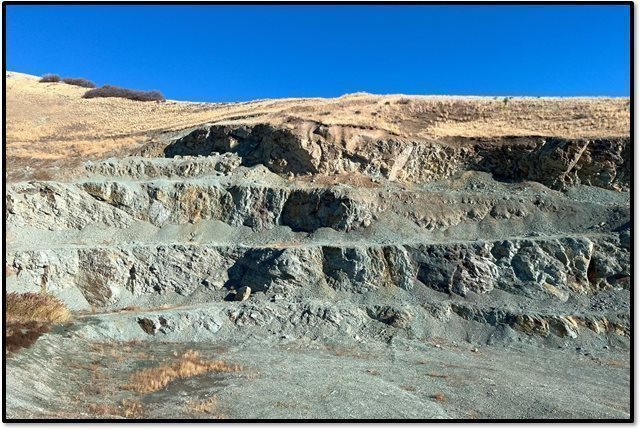
Figure 9.3-1 Mineralized Zeolite Material in the Old Pit
9.3.4 Field Collar Verification
As part of the November 2024 site visit, Ms. Barbara Carroll and BRZ personnel conducted a field verification of selected drill hole collar locations using a Garmin Montana 750i handheld differential GPS (DGPS) unit.
Several collar locations within the vicinity of the BRZ mine pit were visited. Some sites were inaccessible due to wet ground conditions and surface disturbance from subsequent mining activities. Nonetheless, collar verification was successfully completed at accessible locations.
Although the handheld GPS does not provide survey-grade accuracy, it is suitable for general positional verification. The verified collar locations fell within 5.0 to 6.8 meters of the coordinates recorded in the project’s drill hole database. These results are consistent with the expected horizontal accuracy of the DGPS unit used.
Based on these results, the Qualified Person is satisfied that the collar locations in the database reasonably reflect the physical locations of the drill holes in the field.
|
|
|
| GeoGRAFX GIS Services | July 2, 2025 |
| Bear River Zeolite Project | Page: 113 |
| Franklin County, USA |
|
Table 9-2 Check Coordinates for Drill Collar Locations
|
|
| Original Coordinates | Check Coordinates | ||
| Hole ID | Image | Easting | Northing | Easting | Northing |
| BRZ24-065 |
| 435,910 | 4,665,486 | 435,908 | 4,665,481 |
| BRZ24-064 |
| 435,939 | 4,665,481 | 435,939 | 4,665,475 |
9.4 Data Adequacy for Mineral Resource and Reserve Estimation
The Qualified Person (QP) responsible for this section of the report has conducted a detailed review of the data verification process for the Bear River Zeolite Project. This review included validation of the drill hole database, independent check assays of CEC values, assessment of QA/QC procedures, assessment of relevant reports, confirmation of mineral tenure, and field verification of collar locations.
Based on this review, the QP concludes that a reasonable level of verification has been achieved, and that no significant errors or omissions are evident in the data used to support this Technical Report.
The QP considers the quality of geological, geochemical, and spatial data to be adequate for use in developing the geological model and for the estimation of Mineral Resources and Mineral Reserves. Furthermore, the verified data is suitable for use in mine planning and future technical evaluations.
|
|
|
| GeoGRAFX GIS Services | July 2, 2025 |
| Bear River Zeolite Project | Page: 114 |
| Franklin County, USA |
|
10 Mineral Processing and Metallurgical Testing
The Bear River Zeolite (BRZ) Project does not involve conventional metallurgical recovery of a metal commodity. Instead, the value of the deposit is based on the physical and chemical properties of the natural zeolite mineral—primarily clinoptilolite—which is mined, crushed, and screened into various grain sizes for industrial use. As such, traditional metallurgical testwork (e.g., flotation, leaching, or smelting) is not applicable.
| |
| Bear River Zeolite (BRZ) specializes in mining, crushing, screening and packaging high-grade natural clinoptilolite zeolite, with CEC (Cation Equivalent Capacity) levels ranging from 77% to 85%. This high-purity zeolite is valued for its exceptional adsorption capacity, ion-exchange properties, and structural stability, making it a versatile material across numerous industries.
The processing methods employed by BRZ are designed to preserve the natural crystalline structure of clinoptilolite while maximizing quality and yield. These methods involve careful extraction, crushing, drying, and sizing to produce zeolite in various granular and powdered forms, ensuring consistency and effectiveness for different applications. |
BRZ does not attempt to concentrate or separate different minerals in their processing plant. Quality control is exercised by selecting high quality zeolite during the mining operation and in preventing contamination from other minerals, organics or foreign matter from entering the material flow through the crushing, screening and packaging operations.
BRZ zeolite is widely utilized in agriculture, industrial processes, environmental remediation, and household products. In agriculture, it serves as a soil conditioner, fertilizer additive, and livestock feed supplement, enhancing nutrient retention and reducing ammonia levels. Industrially, it is used in filtration systems, chemical catalysis, and odor control. Its environmental applications include water purification, heavy metal remediation, and gas absorption, while household uses range from pet litter additives to air purification products.
10.1 Physical and Chemical Characteristics of Clinoptilolite Zeolite
Bear River Zeolite (BRZ) is composed of high purity clinoptilolite, a naturally occurring zeolite mineral with a negatively charged lattice structure. This structure enables it to loosely retain and exchange cations such as calcium (Ca2+), sodium (Na+), ammonium (NH4+), and potassium(K+), making it highly effective for adsorption, filtration, and ion-exchange applications. The ability to collect metal ions makes it an ideal material for water filtration and purification applications.
General Formula:
|
|
|
| GeoGRAFX GIS Services | July 2, 2025 |
| Bear River Zeolite Project | Page: 115 |
| Franklin County, USA |
|
(Na, K, Ca)2-3Al3(Al, Si)2Si13O.12H2O
Key Properties:
|
| · | Content: 77 to 85% Clinoptilolite |
|
| · | Sodium Content: Less than 0.5% (non- water soluble) |
|
| · | Cation Exchange Capacity (CEC): average 146 meq/100 grams* |
|
| · | Water Retention: Absorbs over 55% of its weight in water |
|
| · | Surface area: ~24.9 m²/g, providing excellent adsorption efficiency |
|
| · | Specific Gravity: 2.1 - 2.2 |
|
| · | Bulk Density: ~55 – 60 lbs./ft³ (Varies by product) |
|
| · | Hardness: 3.5 – 4, with low clay content |
|
| · | pH Level: 8.64, indicating mild alkalinity |
|
| · | Color: Naturally pale green |
*average grade of Bear River Zeolite deposit.
Safety & Regulatory Compliance:
BRZ zeolite’s chemical composition is GRAS(Generally Recognized as Safe) and approved as an anti- caking agent under CFR Title 21, Sec. 182.2729 and Sec. 582.2729, thereby allowing use as a feed additive.
10.2 Mineralogy
“Zeolite” refers to a group of approximately 40 minerals that are basically hydrated calcium potassium sodium aluminosilicates, in which the water is held in cavities in the lattice. The Bear River Zeolite is a clinoptilolite zeolite that has the ability to exchange one cation for another, known as “cation-exchange capacity” or “CEC”. Cation exchange capacity is a measure of the number of cations per unit weight available for exchange, usually expressed as milliequivalents per 100 grams of material.
10.2.1 Cation Exchange Capacity Analysis
A total of 945 hydraulic percussion drill cutting samples from the 2024 drilling program were submitted to the ALS Environmental Lab in Saskatoon, Saskatchewan, Canada for Cation Exchange Capacity (“CEC”) determination (ALS Code: E407). Cation Exchange Capacity was determined by ammonium acetate (NH4Oac) extraction procedures. The ammonium ions will displace cations present on exchange sites in the sample. Samples were soaked in ammonium acetate solution for 16 hours to allow ammonium ions (NH₄⁺) to displace exchangeable cations bound to negatively charged sites on the mineral surfaces. The ammonium acetate solution is then flushed from the sample using alcohol. The treated sample is then extracted using potassium chloride (KCl) where potassium ions displace the ammonium on the active sites in the sample. The ammonium ions in solution are then analyzed by the colorimetric method using a discrete analyzer. The ammonium concentration in the extract is a direct representation of the cation exchange capacity of the sample.
Method limitations: Due to the high pH of the extraction solution, aluminum is not as readily displaced compared to other CEC methods and may cause the CEC result to be biased low.
|
|
|
| GeoGRAFX GIS Services | July 2, 2025 |
| Bear River Zeolite Project | Page: 116 |
| Franklin County, USA |
|
Clinoptilolite exhibits a slightly higher selectivity for the ammonium ion over the potassium ion. In the CEC test, the ammonia ion is not able to completely replace all of the potassium. This explains the observed 146 CEC test value (Table 10-2) versus the 178 CEC value based on the 81% clinoptilolite content and 220 CEC for 100% clinoptilolite. Longer soak times and multiple soaking will get the CEC closer to 178 (P. Bunger PhD, personal communication, March 24, 2025).
ALS Global is an independent, ISO-certified laboratory that is independent of Bear River Zeolite Co. and their parent company United States Antimony Corporation. Sample preparation and Analytical Methods are covered in Section 8 - Sample Preparation, Analyses, and Security. Of those samples, 559 were classified as the Bear Rever Zeolite logged as zeo1.
The cation exchange capacity (CEC) for Bear River Zeolite classified as Zeo1 lithology in the 2024 drilling program shows a wide range of values, from 40.90 to 197.00, with an average of 137.21 as shown in Table 7-2. The standard deviation (26.14) and variance (683.23) indicate moderate variability in the dataset, suggesting some degree of heterogeneity in the material. With 559 samples analyzed, the data provides a robust representation of the zeolite’s exchange properties.
Table 10-1 Summary Statistics for CEC Results for Zeo1
|
| Zeo1 |
| Count | 559 |
| Minimum | 40.90 |
| Maximum | 197.00 |
| Mean | 137.21 |
| Range | 156.10 |
| Std. Dev. | 26.14 |
| Variance | 683.23 |
The spatial distribution of the values is shown in Figure 10.2-1 shows the CEC values cover a wide range, from moderate (40.9) to exceptionally high (197.0), which suggests significant variability in the sample composition. The mean value of 137.21 indicates that most samples have high CEC, but the presence of a wide standard deviation (26.14) means there's a fair amount of spread in the data. The histogram suggests that most values cluster around 120-150 meq/100g, but the presence of outliers above 190 suggests a few highly reactive samples with extreme cation exchange properties.
|
|
|
| GeoGRAFX GIS Services | July 2, 2025 |
| Bear River Zeolite Project | Page: 117 |
| Franklin County, USA |
|
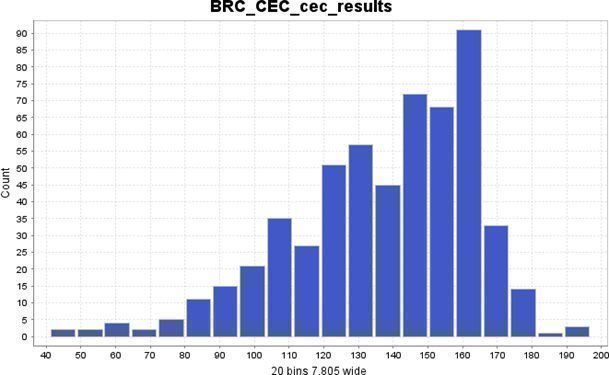
Figure 10.2-1 Histogram of CEC values for zeo1
The cumulative frequency distribution of the CEC values for zeo1 are displayed in Figure 10.2-2. This plot shows how the CEC values accumulate across the dataset. The curve starts at 40.9 meq/100g and gradually increases towards the maximum 197.0 meq/100g. A steeper slope in the middle of the curve suggests that most of the samples fall within a specific range (likely between ~120 and 165 meq/100g). The upper tail (above ~170 meq/100g) indicates the presence of high-CEC values.
|
|
|
| GeoGRAFX GIS Services | July 2, 2025 |
| Bear River Zeolite Project | Page: 118 |
| Franklin County, USA |
|
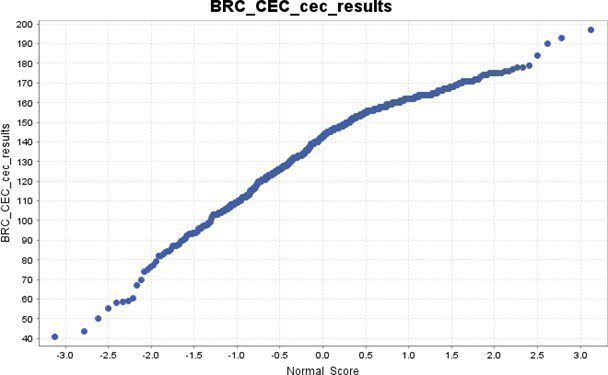
Figure 10.2-2 Probability Plot of CEC values for zeo1
The Tukey Box Plot of the CEC values for zeo1 are displayed in Figure 10.2-3. The box plot analysis highlights this central tendency while also revealing potential outliers, particularly for values above 170 and below 100 meq/100g. These high CEC samples may indicate zones of increased zeolitization, unique mineral compositions, or post-depositional geochemical alterations that enhanced cation exchange capacity.
The whiskers in the box plot extend to values within 1.5 times the interquartile range (IQR), representing the expected variability. However, samples outside this range suggest possible anomalies, whether due to mineralogical variations, misclassified lithologies, or analytical inconsistencies. Some lower-CEC values may stem from impurities such as feldspars or quartz, indicating potential errors in lithological classification. Additionally, variability in grain size, degree of alteration, or sampling methods may contribute to the dataset’s spread, as reflected in the high standard deviation (26.14 meq/100g).
Despite these variations, the overall CEC distribution suggests that Zeo1 is highly reactive and well- suited for applications requiring strong ion exchange properties. However, the presence of both high and low outliers indicates that further investigation into lithology, mineralogy, and sampling consistency may refine the understanding of Zeo1’s performance and ensure accurate resource characterization.
|
|
|
| GeoGRAFX GIS Services | July 2, 2025 |
| Bear River Zeolite Project | Page: 119 |
| Franklin County, USA |
|
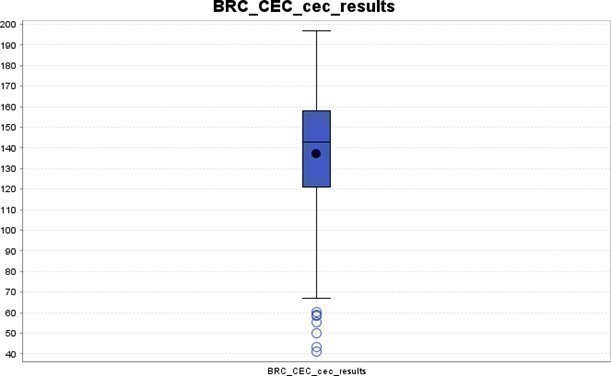
Figure 10.2-3 Tukey Box Plot of CEC values for zeo1
The presence of outliers in the CEC (Cation Exchange Capacity) results for the Bear River Zeolite (Zeo1) samples can be attributed to several geological, mineralogical, and laboratory factors. One major cause is mineralogical variation, as different zeolite species (such as clinoptilolite, mordenite, and chabazite) have varying CEC capacities. Samples with a higher percentage of high-CEC zeolites can lead to extreme values. Additionally, the presence of impurities or mixed lithologies may contribute to fluctuations in CEC values. High-CEC minerals like smectite clays (montmorillonite) or phyllosilicates can increase exchange capacity, whereas lower-CEC impurities, such as quartz or feldspars, can lead to lower values.
Another significant factor is textural and structural differences. Zeolites with a finer grain size or more open crystal structure have greater surface areas available for ion exchange, resulting in higher CEC values, whereas coarser-grained samples tend to exhibit lower exchange capacities. The degree of zeolitization also plays a role, as samples that have undergone stronger hydrothermal alteration are more likely to contain higher concentrations of zeolite, thereby increasing CEC. Conversely, partially altered samples that include a mix of zeolitized and unaltered material may show lower CEC values.
Geochemical and environmental conditions at the time of formation may have also influenced the dataset's variability. Differences in volcanic ash composition or diagenetic alteration could create localized zones of zeolite with enhanced reactivity. Additionally, variations in pH, temperature, and groundwater chemistry during or after formation might have modified the mineral properties, affecting their cation exchange capacity. Some samples may have also been exposed to hydrothermal fluids or groundwater that further altered their structure, increasing their CEC.
|
|
|
| GeoGRAFX GIS Services | July 2, 2025 |
| Bear River Zeolite Project | Page: 120 |
| Franklin County, USA |
|
Another potential factor contributing to these outliers is misclassification of lithologies. Given the complexity of zeolitic deposits, some of the chip samples may have been incorrectly categorized due to visual misidentification, overlapping mineralogical characteristics, or inconsistencies in field descriptions. If certain samples were mistakenly classified as Zeo1 but actually contained a mix of different lithologies (such as higher or lower CEC-bearing phases), this could artificially inflate or deflate their measured CEC values. Such misclassification could also explain why some samples deviate significantly from the expected CEC range.
Lastly, sampling and analytical factors could contribute to the presence of outliers. Heterogeneous sample collection may have led to some drill core samples capturing highly concentrated zeolite zones, while others contained more impurities, leading to variability in measured values. Laboratory testing variability, such as differences in sample preparation, grinding, or testing methods, may also introduce inconsistencies in results. Errors in analytical procedures, including incomplete ion saturation or measurement inconsistencies, could further exaggerate extreme CEC values.
In conclusion, the CEC outliers in the dataset likely result from a combination of factors, including mineralogical composition, grain size, porosity, geological alteration history, and potential lab or sampling variations. Additionally, the possibility of lithological misclassification may have led to incorrect associations between CEC values and specific rock types, further contributing to the observed data variability. Understanding these influences is key to interpreting the results accurately and ensuring consistency in future analyses.
10.2.2 XRD Analysis
Using the CEC analytical results, fourteen (14) representative samples were sent to SGS Canada, Inc. in Lakefield, Ontario, for assay and XRD analysis for its mineralogical composition. All bulk crystalline minerals identified by X-ray diffraction analysis were processed using RIR method and reported in weight %. Mineral abundances generated by RIR method XRD analysis were reconciled with a Whole Rock Analysis plus any other major elements contained in the sample and reported (Whole Rock Analysis by x-ray fluorescence spectroscopy includes SiO2, Al2O3, Na2O, K2O, CaO, MgO, Fe2O3, Cr2O3, MnO, TiO2, P2O5, V2O5 and LOI). SGS Canada is an independent, ISO-certified laboratory that is independent of Bear River Zeolite Co. and their parent company United States Antimony Corporation.
Sample preparation and Analytical Methods are covered in Section 8 - Sample Preparation, Analyses, and Security.
This histogram shown below in Figure 10.2-4 illustrates the distribution of Cation Exchange Capacity (CEC) values for different lithologies in the Bear River dataset. It includes data for Zeo1, Zeo2, and Rhyolitic Tuff, with each lithology represented as a separate frequency distribution. The figure provides a visual comparison of how CEC values vary among the lithologies, highlighting differences in their ion- exchange capacities.
|
|
|
| GeoGRAFX GIS Services | July 2, 2025 |
| Bear River Zeolite Project | Page: 121 |
| Franklin County, USA |
|
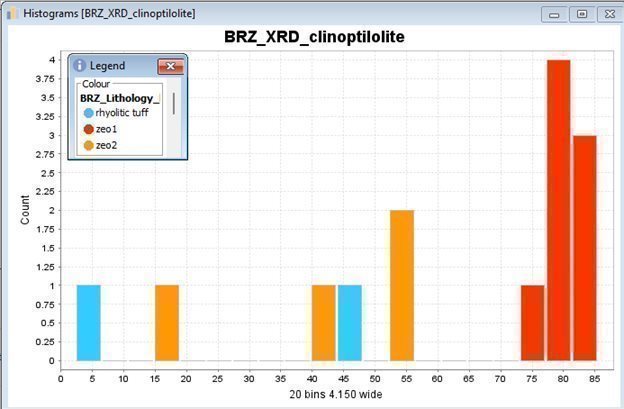
Figure 10.2-4 Histogram of Cation Exchange Capacity (CEC) Values for Bear River Lithologies
The analysis of Cation Exchange Capacity (CEC) values across different lithologies in the Bear River dataset reveals distinct trends that correspond to mineralogical variations. Zeolitic lithologies exhibit the highest CEC values, with Zeo1 standing out as the most reactive unit. Zeo1 samples have an average CEC of 146.45 meq/100g, reaching a maximum of 178.0 meq/100g. This confirms its strong ion-exchange capacity, likely due to its high clinoptilolite content. In contrast, Zeo2 exhibits lower CEC values, with an average of 56.2 meq/100g and a maximum of 89.3 meq/100g, indicating that it may contain a lower proportion of zeolitic minerals or different zeolite phases with less exchange potential. Rhyolitic tuff shows the lowest CEC values, with an average of 20.1 meq/100g and a maximum of 36.9 meq/100g, consistent with its composition being dominated by non-reactive volcanic glass, feldspars, and quartz.
These findings suggest that Zeo1 represents the most promising lithology in terms of cation exchange applications, while Zeo2 still retains some exchange potential but at a significantly lower level. The rhyolitic tuff, with its limited CEC values, is not expected to contribute significantly to ion-exchange processes for this deposit.
10.2.3 XRD Analysis of Zeo1 lithology
The image below (Figure 10.2-5) is an example of an X-ray Diffraction (XRD) pattern for sample 1941507, illustrating the mineralogical composition of the Zeo1 lithology in the Bear River deposit based on its diffraction peaks. The x-axis (2-Theta Scale) represents the diffraction angle (2θ), which corresponds to the atomic spacing within crystalline minerals, while the y-axis (Lin (Counts)) represents intensity, indicating the strength of X-ray diffraction for each mineral present. Peaks in the graph correspond to specific minerals, identified by comparing the sample’s diffraction pattern to reference patterns from a mineral database.
|
|
|
| GeoGRAFX GIS Services | July 2, 2025 |
| Bear River Zeolite Project | Page: 122 |
| Franklin County, USA |
|
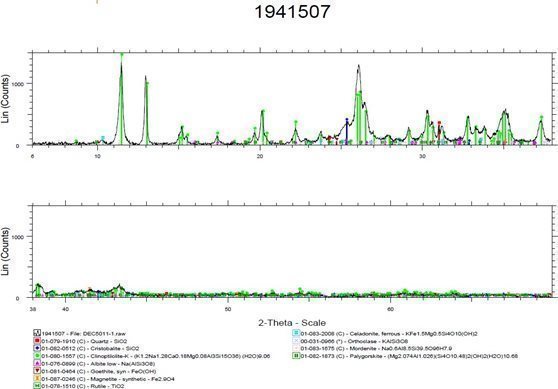
Figure 10.2-5 X-ray Diffraction (XRD) Pattern of Sample 1941507 – Bear River Zeolite Deposit
The analysis reveals that the sample is dominated by zeolite minerals, particularly clinoptilolite-K, which is a key indicator of zeolitization. Other major components include quartz (SiO₂) and cristobalite (a high- temperature silica polymorph), both of which likely originate from the volcanic ash precursor of the deposit. Minor feldspar phases, such as orthoclase (K-feldspar) and albite (Na-feldspar), are also present, reflecting incomplete alteration of the original volcanic material. Additionally, mordenite, another zeolite type, appears in trace amounts, further supporting the highly altered nature of the deposit.
The sample also contains secondary alteration minerals, including celadonite (a ferrous mica) and palygorskite (a Mg-rich fibrous clay), which indicate specific geochemical conditions during zeolite formation. Iron-bearing phases such as goethite (Fe-hydroxide) and magnetite (Fe₃O₄) are detected in small amounts, suggesting minor oxidation. The presence of rutile (TiO₂), a common accessory mineral, further characterizes the sample’s mineralogical complexity.
Overall, the XRD results confirm that sample 1941507 is from a highly zeolitized volcanic ash deposit, composed primarily of clinoptilolite, quartz, feldspars, and minor iron oxides and clays. This composition aligns with the mineralogical profile expected for the Bear River Zeolite deposit, reinforcing its potential for industrial applications requiring high cation exchange capacity and adsorption properties.
|
|
|
| GeoGRAFX GIS Services | July 2, 2025 |
| Bear River Zeolite Project | Page: 123 |
| Franklin County, USA |
|
In summarizing the results of the XRD analysis, the table (Table 10-2) below presents the X-ray Diffraction (XRD) analysis of eight Zeo1 lithology samples from the Bear River deposit, detailing the mineralogical composition and its variability. It provides the average, minimum, and maximum concentrations of key minerals, highlighting clinoptilolite as the dominant phase (81.16% on average), with minor amounts of quartz, orthoclase, cristobalite, albite, and celadonite. The table also indicates the absence of carbonate minerals (calcite, dolomite) and sulfides (pyrite, hematite, gypsum, ankerite), suggesting a relatively pure zeolitic composition. Additionally, trace amounts of magnetite, goethite, and mordenite are present, contributing to the deposit’s overall mineralogical characteristics. The data provides valuable insight into the mineralogical consistency and potential variations within the Zeo1 lithology.
Table 10-2 X-ray Diffraction (XRD) Analysis of Zeo1 Lithology in the Bear River Deposit
|
| Average | Min | Max |
| BRC_CEC_cec_results | 146.45 | 97.6 | 178 |
| BRZ_XRD_clinoptilolite | 81.1625 | 76.6 | 85.4 |
| BRZ_XRD_quartz | 4.0125 | 2.3 | 6.2 |
| BRZ_XRD_orthoclase | 3.775 | 0.8 | 5 |
| BRZ_XRD_calcite | 0 | 0 | 0 |
| BRZ_XRD_cristobalite | 3.625 | 2.5 | 5 |
| BRZ_XRD_albite | 1.325 | 0.1 | 3.2 |
| BRZ_XRD_muscovite | 0 | 0 | 0 |
| BRZ_XRD_celadonite | 2.85 | 2 | 5.1 |
| BRZ_XRD_magnetite | 0.9125 | 0.7 | 1.4 |
| BRZ_XRD_dolomite | 0 | 0 | 0 |
| BRZ_XRD_goethite | 0.8875 | 0.4 | 1.7 |
| BRZ_XRD_magnesite | 0.1125 | 0 | 0.9 |
| BRZ_XRD_pyrite | 0 | 0 | 0 |
| BRZ_XRD_mordenite | 0.8125 | 0.2 | 3.2 |
| BRZ_XRD_rutile | 0.325 | 0.3 | 0.4 |
| BRZ_XRD_palygorskite | 0.1625 | 0 | 0.7 |
| BRZ_XRD_hematite | 0 | 0 | 0 |
| BRZ_XRD_gypsum | 0 | 0 | 0 |
| BRZ_XRD_ankerite | 0 | 0 | 0 |
| BRZ_XRD_clinochlore | 0 | 0 | 0 |
The eight Zeo1 samples from the Bear River Zeolite deposit exhibit a strong clinoptilolite dominance, with an average content of 81.16%, ranging from 76.6% to 85.4%. This high concentration confirms that these samples are primarily composed of zeolite minerals, reinforcing their strong cation exchange capacity (CEC), which averages 146.45 meq/100g (ranging from 97.6 to 178 meq/100g). The variability in CEC values correlates with slight differences in the purity and crystallinity of the clinoptilolite.
Quartz is the second most prevalent mineral, averaging 4.01% (range: 2.3% to 6.2%). The presence of quartz, though minor, could indicate detrital input or original volcanic ash components that were not fully altered to zeolite. Similarly, orthoclase (feldspar) is present in small amounts (0.8% to 5%), which may also contribute to variations in CEC values by slightly reducing the reactive surface area available for ion exchange.
|
|
|
| GeoGRAFX GIS Services | July 2, 2025 |
| Bear River Zeolite Project | Page: 124 |
| Franklin County, USA |
|
Other detected phases include cristobalite (2.5% to 5%) and celadonite (2% to 5.1%), both of which suggest secondary alteration processes that might have influenced the geochemical environment of the deposit. Cristobalite, a high-temperature silica polymorph, may represent remnants of the original volcanic material. Celadonite, a mica group mineral, is often associated with zeolitized tuffs and could play a minor role in influencing exchange properties.
Notably, the samples contain trace amounts of magnetite (0.7% to 1.4%) and goethite (0.4% to 1.7%), indicating minor iron-bearing phases. The presence of these minerals suggests slight oxidative alteration, but their low concentrations are likely to have a minimal impact on the overall CEC. The dataset also shows small but variable amounts of mordenite (0.2% to 3.2%), another zeolite mineral that could contribute to the overall ion-exchange properties.
Calcite, dolomite, muscovite, hematite, gypsum, pyrite, ankerite, and clinochlore are completely absent in these samples, reinforcing the high purity of the Zeo1 samples. This absence of carbonate phases (calcite, dolomite) suggests a lack of secondary carbonate precipitation, which could otherwise impact porosity and reactivity.
Overall, these Zeo1 samples exhibit high purity and strong CEC potential, making them highly suitable for applications requiring strong ion exchange capacity, such as water filtration, heavy metal remediation, and soil amendments.
The scatter plot shown below in Figure 10.2-6 comparing Cation Exchange Capacity (CEC) and % Clinoptilolite for the Bear River lithologies shows a clear trend where higher clinoptilolite content corresponds to higher CEC values.
|
|
|
| GeoGRAFX GIS Services | July 2, 2025 |
| Bear River Zeolite Project | Page: 125 |
| Franklin County, USA |
|
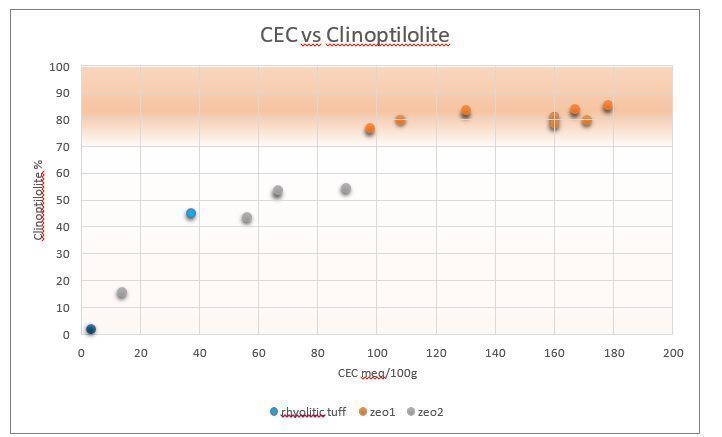
Figure 10.2-6 Scatter Plot of CEC vs. % Clinoptilolite for Bear River Lithologies
The lithologies exhibit distinct groupings in their CEC and clinoptilolite distributions:
|
| · | Zeo1 has the highest CEC values, averaging 146.45 meq/100g, and also the highest clinoptilolite content, with a mean of 81.16% and a maximum of 85.4%. This confirms its strong ion-exchange potential, as expected from its high zeolite concentration. |
|
|
|
|
|
| · | Zeo2 exhibits moderate CEC values, averaging 56.2 meq/100g, with a mean clinoptilolite content of 41.85%. This suggests a lower proportion of clinoptilolite compared to Zeo1, resulting in a weaker ion-exchange capacity. |
|
|
|
|
|
| · | Rhyolitic Tuff has the lowest CEC values, averaging 20.1 meq/100g, and the lowest clinoptilolite content at an average of 23.9%, reinforcing its minimal ion-exchange properties. |
The correlation between CEC and % clinoptilolite supports the hypothesis that clinoptilolite-rich lithologies exhibit higher cation exchange capacity. Zeo1 stands out as the most promising unit for applications requiring high ion exchange properties, while Zeo2 still retains some potential. In contrast, rhyolitic tuff is not a significant contributor to ion-exchange processes.
10.2.4 Whole Rock Analysis
Whole Rock Analysis was performed by SGS Canada, Inc. in Lakefield, Ontario.
The table (Table 10-3) below presents the whole rock geochemical composition of the Zeo1 lithology in the Bear River deposit, based on the analysis of eight samples. It details the concentrations of major oxides such as SiO₂, Al₂O₃, Fe₂O₃, MgO, CaO, Na₂O, and K₂O, along with trace oxides like TiO₂, P₂O₅, MnO, Cr₂O₃, V₂O₅, and LOI providing average, minimum, and maximum values to highlight the elemental variability and mineralogical consistency of the deposit.
|
|
|
| GeoGRAFX GIS Services | July 2, 2025 |
| Bear River Zeolite Project | Page: 126 |
| Franklin County, USA |
|
Table 10-3 Whole Rock Geochemistry of Zeo1 Lithology in the Bear River Deposit
|
| Average | Min | Max |
| SiO2_pct | 67.2125 | 65.9 | 68.5 |
| Al2O3_pct | 10.55 | 10.3 | 10.8 |
| Fe2O3_pct | 2.3325 | 1.99 | 3.1 |
| MgO_pct | 0.56 | 0.28 | 1.08 |
| CaO_pct | 1.8325 | 0.62 | 2.68 |
| Na2O_pct | 1.1575 | 0.23 | 2.7 |
| K2O_pct | 4.16625 | 2.66 | 4.84 |
| TiO2_pct | 0.29875 | 0.27 | 0.35 |
| P2O5_pct | 0.03375 | 0.03 | 0.04 |
| MnO_pct | 0.04125 | 0.005 | 0.11 |
| Cr2O3_pct | 0.005 | 0.005 | 0.005 |
| V2O5_pct | 0.005 | 0.005 | 0.005 |
| LOI_pct | 14.2 | 9.4 | 29.3 |
The whole rock geochemistry of the Zeo1 lithology in the Bear River deposit reflects its dominant siliciclastic and aluminosilicate composition, characteristic of zeolitized volcanic tuffs. The SiO₂ content averages 67.21% (ranging from 65.9% to 68.5%), confirming the silica-rich nature of the deposit. This high silica content aligns with the presence of quartz (4.01% average in XRD analysis) and zeolite minerals such as clinoptilolite, which typically retain a high proportion of silica from the original volcanic ash precursor.
Aluminum oxide (Al₂O₃) levels are moderate, averaging 10.55% (10.3%–10.8%), reflecting the high aluminosilicate mineral content, primarily from zeolite minerals, feldspars (orthoclase, albite), and clays such as celadonite. This Al₂O₃ concentration is typical of clinoptilolite-rich zeolites, which form through alteration of volcanic glass in a reactive environment.
Iron oxide (Fe₂O₃) content is relatively low (1.99%–3.1%), averaging 2.33%, suggesting minimal iron- bearing minerals. This is consistent with the low magnetite (0.91%) and goethite (0.89%) content observed in XRD results. The low Fe₂O₃ levels indicate that the deposit has undergone limited oxidation and does not contain significant iron sulfides or iron-rich phases, making it favorable for applications requiring low impurity content.
The MgO content is relatively low (0.28%–1.08%, avg. 0.56%), which aligns with the absence of significant Mg-bearing minerals such as dolomite, chlorite, or serpentine in XRD analysis. The CaO content is variable (0.62%–2.68%, avg. 1.83%), suggesting differences in alteration intensity and possible localized secondary carbonate precipitation. However, the absence of calcite and dolomite in XRD data suggests that most calcium is present within the zeolite framework or as minor feldspar components.
Sodium (Na₂O) and potassium (K₂O) levels are relatively high, averaging 1.16% and 4.17%, respectively. The K₂O content (2.66%–4.84%) is consistent with the presence of potassium feldspars (orthoclase, albite) and celadonite, which contribute to the exchange capacity of the zeolite. The wide Na₂O range (0.23%–2.7%) suggests variability in zeolitization, with sodium possibly being retained within the clinoptilolite structure.
|
|
|
| GeoGRAFX GIS Services | July 2, 2025 |
| Bear River Zeolite Project | Page: 127 |
| Franklin County, USA |
|
Titanium dioxide (TiO₂) is present in minor amounts (0.27%–0.35%), suggesting the presence of trace rutile (~0.32% in XRD analysis) or other accessory heavy minerals. Phosphorus (P₂O₅, 0.03%–0.04%) is extremely low, indicating a lack of significant phosphate-bearing minerals. Manganese oxide (MnO) levels are very low (0.005%–0.11%), in line with the low Mn-bearing mineral content observed in XRD.
Overall, the whole rock geochemistry of Zeo1 confirms that the Bear River deposit is a highly zeolitized, silica-rich tuff, with favorable chemical properties for industrial applications requiring high CEC (cation exchange capacity) and low impurity levels.
10.2.5 Elemental Analysis
A total of fourteen (14) trace element analyses were conducted by SGS Canada Laboratory, located in Burnaby, British Columbia. All samples underwent analysis by aqua regia digestion coupled with Inductively Coupled Plasma–Atomic Emission Spectroscopy/Mass Spectrometry (ICP-AES/MS), utilizing SGS methods GE_ICP21B20 and GE_IMS21B20 Calcium (Ca) concentrations that exceeded the upper detection limits of ICP methods were further analyzed using a Borate Fusion with X-Ray Fluorescence Spectroscopy (XRF) employing the Ore Grade method (GO_XRF72).
SGS Burnaby laboratory maintains stringent quality control standards and currently holds both ISO 9001 and ISO/IEC 17025 accreditations. The laboratory is independent of Bear River Zeolite Co. and their parent company United States Antimony Corporation. Sample preparation and Analytical Methods are covered in Section 8 - Sample Preparation, Analyses, and Security.
The table (Table 10-4) presents the elemental composition of the Zeo1 lithology in the Bear River deposit, based on eight samples, detailing the average, minimum, and maximum concentrations of major and trace elements. The dataset includes essential rock-forming elements such as Al, Fe, Ca, Mg, Na, and K, along with trace elements like Ba, Sr, Li, and Zn, which provide insights into the mineralogical and geochemical characteristics of the deposit. The variation in element concentrations highlights potential differences in alteration intensity, mineralogical composition, and elemental substitution within the zeolite framework.
Table 10-4 Elemental Analysis of Zeo1 Lithology in the Bear River Deposit
| 8 rows - Univariate | Zeo1: Count Numeric | Zeo1: Minimum | Zeo1: Maximum | Zeo1: Mean | Zeo1: Range | Zeo1: Standard Deviation | Zeo1: Variance |
| Al_pct | 8 | 3.02 | 3.78 | 3.56875 | 0.76 | 0.235277 | 0.055355 |
| Ba_ppm | 8 | 740 | 940 | 855.25 | 200 | 68.79109 | 4732.214 |
| Ca_pct | 8 | 0.36 | 1.72 | 1.1975 | 1.36 | 0.460799 | 0.212336 |
| Cr_ppm | 8 | 1 | 4 | 2 | 3 | 1.069045 | 1.142857 |
| Cu_ppm | 8 | 12.1 | 30.6 | 18.4625 | 18.5 | 5.896473 | 34.76839 |
| Fe_pct | 8 | 0.52 | 1.5 | 0.88375 | 0.98 | 0.286453 | 0.082055 |
| K_pct | 8 | 1.6 | 3.08 | 2.57875 | 1.48 | 0.509662 | 0.259755 |
| Li_ppm | 8 | 6 | 12 | 8.5 | 6 | 2.203893 | 4.857143 |
| Mg_pct | 8 | 0.07 | 0.41 | 0.21875 | 0.34 | 0.138609 | 0.019213 |
|
|
|
| GeoGRAFX GIS Services | July 2, 2025 |
| Bear River Zeolite Project | Page: 128 |
| Franklin County, USA |
|
| 8 rows - Univariate | Zeo1: Count Numeric | Zeo1: Minimum | Zeo1: Maximum | Zeo1: Mean | Zeo1: Range | Zeo1: Standard Deviation | Zeo1: Variance |
| Mn_ppm | 8 | 40 | 879 | 309.875 | 839 | 259.931 | 67564.13 |
| Na_pct | 8 | 0.12 | 1.68 | 0.7075 | 1.56 | 0.539226 | 0.290764 |
| P_pct | 8 | 0.005 | 0.01 | 0.00875 | 0.005 | 0.002315 | 5.36E-06 |
| S_pct | 8 | 0.005 | 0.32 | 0.09 | 0.315 | 0.112948 | 0.012757 |
| Sr_ppm | 8 | 50.4 | 237 | 117.8375 | 186.6 | 68.26174 | 4659.666 |
| Ti_pct | 8 | 0.02 | 0.04 | 0.02875 | 0.02 | 0.008345 | 6.96E-05 |
| V_ppm | 8 | 0.5 | 4 | 1.875 | 3.5 | 1.217433 | 1.482143 |
| Zn_ppm | 8 | 35 | 51 | 42.375 | 16 | 6.823018 | 46.55357 |
| Zr_ppm | 8 | 42.1 | 101 | 65.2125 | 58.9 | 20.07418 | 402.9727 |
| Ag_ppm | 8 | 0.03 | 0.06 | 0.04375 | 0.03 | 0.011877 | 1.41E-04 |
| As_ppm | 8 | 2 | 10 | 3.875 | 8 | 2.695896 | 7.267857 |
| Be_ppm | 8 | 1.6 | 2.7 | 2.0625 | 1.1 | 0.346152 | 0.119821 |
| Bi_ppm | 8 | 0.23 | 0.91 | 0.5675 | 0.68 | 0.272593 | 0.074307 |
| Cd_ppm | 8 | 0.09 | 0.74 | 0.2475 | 0.65 | 0.224293 | 0.050307 |
| Ce_ppm | 8 | 137 | 150 | 144.75 | 13 | 4.652188 | 21.64286 |
| Co_ppm | 8 | 0.9 | 2 | 1.375 | 1.1 | 0.345378 | 0.119286 |
| Cs_ppm | 8 | 2.37 | 3.93 | 3.09 | 1.56 | 0.613142 | 0.375943 |
| Ga_ppm | 8 | 7.1 | 10.2 | 8.6625 | 3.1 | 1.105748 | 1.222679 |
| Ge_ppm | 8 | 0.05 | 0.05 | 0.05 | 0 | 0 | 0 |
| Hf_ppm | 8 | 1.54 | 2.58 | 2.075 | 1.04 | 0.384187 | 0.1476 |
| Hg_ppm | 8 | 0.005 | 0.02 | 0.008125 | 0.015 | 0.005303 | 2.81E-05 |
| In_ppm | 8 | 0.06 | 0.09 | 0.07625 | 0.03 | 0.011877 | 1.41E-04 |
| La_ppm | 8 | 69 | 77.4 | 74.1625 | 8.4 | 2.851034 | 8.128393 |
| Lu_ppm | 8 | 0.2 | 0.57 | 0.3225 | 0.37 | 0.122095 | 0.014907 |
| Mo_ppm | 8 | 0.29 | 3.01 | 1.005 | 2.72 | 0.913955 | 0.835314 |
| Nb_ppm | 8 | 0.44 | 1.27 | 0.6175 | 0.83 | 0.272069 | 0.074021 |
| Ni_ppm | 8 | 0.7 | 13 | 3.2 | 12.3 | 4.091105 | 16.73714 |
| Pb_ppm | 8 | 21.4 | 26.8 | 24.5375 | 5.4 | 1.818899 | 3.308393 |
| Rb_ppm | 8 | 90.4 | 132 | 116.8 | 41.6 | 12.66175 | 160.32 |
| Sb_ppm | 8 | 0.23 | 0.56 | 0.37125 | 0.33 | 0.113822 | 0.012955 |
| Sc_ppm | 8 | 1.3 | 2.6 | 1.85 | 1.3 | 0.469042 | 0.22 |
| Se_ppm | 8 | 0.5 | 0.5 | 0.5 | 0 | 0 | 0 |
| Sn_ppm | 8 | 2 | 3.3 | 2.8625 | 1.3 | 0.45336 | 0.205536 |
| Ta_ppm | 8 | 0.025 | 0.025 | 0.025 | 0 | 0 | 0 |
| Tb_ppm | 8 | 1.24 | 1.45 | 1.3775 | 0.21 | 0.068609 | 0.004707 |
| Te_ppm | 8 | 0.025 | 0.025 | 0.025 | 0 | 0 | 0 |
| Th_ppm | 8 | 21.9 | 26.4 | 24 | 4.5 | 1.653568 | 2.734286 |
| Tl_ppm | 8 | 0.32 | 1.44 | 0.8025 | 1.12 | 0.355156 | 0.126136 |
|
|
|
| GeoGRAFX GIS Services | July 2, 2025 |
| Bear River Zeolite Project | Page: 129 |
| Franklin County, USA |
|
| 8 rows - Univariate | Zeo1: Count Numeric | Zeo1: Minimum | Zeo1: Maximum | Zeo1: Mean | Zeo1: Range | Zeo1: Standard Deviation | Zeo1: Variance |
| U_ppm | 8 | 1.57 | 4.29 | 2.85625 | 2.72 | 0.951509 | 0.90537 |
| W_ppm | 8 | 0.05 | 0.05 | 0.05 | 0 | 0 | 0 |
| Y_ppm | 8 | 32.15 | 44.34 | 35.5925 | 12.19 | 3.868125 | 14.96239 |
| Yb_ppm | 8 | 1.5 | 4.1 | 2.4375 | 2.6 | 0.838259 | 0.702679 |
The Zeo1 lithology in the Bear River deposit is characterized by moderate aluminum (Al) content (~3.57% average), reflecting the dominance of aluminosilicate minerals, particularly clinoptilolite. The calcium (Ca) concentration (0.36%–1.72%) varies significantly, indicating potential differences in alteration intensity or secondary mineral contributions. Iron (Fe) levels (0.52%–1.5%) are relatively low, consistent with the low presence of iron oxides (magnetite and goethite) in XRD analysis, suggesting minimal oxidation.
The deposit contains notable potassium (K) concentrations (1.6%–3.08%), which aligns with the presence of feldspar minerals (orthoclase, albite, and celadonite). The sodium (Na) content (0.12%– 1.68%) also exhibits a broad range, likely related to variations in zeolite composition and feldspar weathering. Magnesium (Mg) levels (0.07%–0.41%) are relatively low, reinforcing the limited presence of Mg-rich minerals such as dolomite or chlorite.
Trace element concentrations provide further insights into the deposit's geochemical history. Barium (Ba) levels (740–940 ppm) and strontium (Sr) content (50.4–237 ppm) suggest an association with feldspars and zeolite exchange sites, as these elements commonly substitute for calcium in mineral structures. Lithium (Li) levels (6–12 ppm) and rubidium (Rb) levels (90.4–132 ppm) indicate interactions with potassium-bearing phases like celadonite and feldspars. The manganese (Mn) content is highly variable (40–879 ppm), likely reflecting localized oxidation or trace mineral inclusions.
Rare earth elements (REEs) such as cerium (Ce: 137–150 ppm) and lanthanum (La: 69–77.4 ppm) are present in moderate amounts, while elements like thorium (Th: 21.9–26.4 ppm) and uranium (U: 1.57– 4.29 ppm) suggest minor input from accessory minerals. Zirconium (Zr: 42.1–101 ppm) and hafnium (Hf: 1.54–2.58 ppm) suggest minor contributions from detrital heavy minerals, possibly from the original volcanic ash precursor.
The low sulfur (S: 0.005%–0.32%) and phosphorus (P: 0.005%–0.01%) contents indicate minimal influence from sulfide mineralization or phosphate-bearing minerals. The absence of significant heavy metals such as lead (Pb: 21.4–26.8 ppm), nickel (Ni: 0.7–13 ppm), and cadmium (Cd: 0.09–0.74 ppm) suggests a relatively clean deposit with low contamination potential, making it ideal for industrial applications such as water filtration and soil amendments.
Overall, the Zeo1 lithology in the Bear River deposit exhibits a composition highly favorable for ion exchange applications, with minimal impurities and a well-preserved zeolite-dominated mineralogy.
|
|
|
| GeoGRAFX GIS Services | July 2, 2025 |
| Bear River Zeolite Project | Page: 130 |
| Franklin County, USA |
|
10.3 Applications
The Cation Exchange Capacity (CEC) values can help classify the lithologies in terms of their potential applications. Based on common CEC classification guidelines, the Bear River lithologies may be categorized:
10.3.1 CEC Classification and Potential Uses
CEC is typically classified as follows:
|
| · | Low CEC (< 20 meq/100g) → Limited ion-exchange potential |
|
|
|
|
|
| · | Moderate CEC (20–50 meq/100g) → Some ion-exchange capacity, suitable for specific applications |
|
|
|
|
|
| · | High CEC (50–100 meq/100g) → Good ion-exchange properties, useful in industrial and agricultural applications |
|
|
|
|
|
| · | Very High CEC (>100 meq/100g) → Strong ion-exchange potential, ideal for specialized applications |
10.3.2 Classification of Bear River Lithologies
The table below (Table 10-5) summarizes the potential applications of the Bear River lithologies based on their Cation Exchange Capacity (CEC) classification and clinoptilolite content. The Zeo1 lithology, with the highest CEC values (~146.45 meq/100g), is best suited for high-performance applications such as water filtration, industrial adsorption, and advanced soil conditioning. Zeo2, with a moderate CEC (~56.2 meq/100g), is primarily useful for soil amendments, wastewater treatment, and fertilizer retention.
Rhyolitic Tuff, with the lowest CEC (~20.1 meq/100g), is best utilized in construction materials, geotechnical applications, and as an industrial filler.
Table 10-5 Bear River Lithology Applications
| Lithology | CEC Classification | Primary Application | Best Uses |
| Zeo1 | Very High CEC (~146.45 meq/100g) | Water filtration, soil amendment, animal feed additive, industrial adsorption | Heavy metal removal, hydroponics, molecular sieves, odor control |
| Zeo2 | High CEC (~56.2 meq/100g) | Soil amendment, fertilizer carrier, wastewater treatment, livestock bedding | Turf management, erosion control, ammonium filtration |
| Rhyolitic Tuff | Low CEC (~20.1 meq/100g) | Construction materials, soil aeration, geotechnical uses, industrial filler | Lightweight concrete, ceramics, insulation, road base |
Details of the specific potential applications and best uses for the Bear River lithologies are included below.
|
|
|
| GeoGRAFX GIS Services | July 2, 2025 |
| Bear River Zeolite Project | Page: 131 |
| Franklin County, USA |
|
1. Zeo1 (CEC ~146.45 meq/100g, 81.16% clinoptilolite)
Zeo1 is the most versatile and valuable for industrial, agricultural, and environmental applications due to its high CEC and zeolite content.
|
| o | Classification: Very High CEC |
|
|
|
|
|
| o | Potential Uses: |
|
| ■ | Ideal for high-performance applications such as water filtration, heavy metal adsorption, and industrial catalyst support. |
|
| ■ | Excellent for soil conditioning and remediation, helping to retain nutrients and improve soil structure. |
|
| ■ | Potentially useful in gas separation, molecular sieves, or advanced adsorption processes due to its high clinoptilolite content. |
|
| o | Best Uses: |
|
| ■ | Water Treatment & Filtration |
|
| 1. | Removes heavy metals (e.g., lead, arsenic, ammonia) from drinking water and wastewater. |
|
| 2. | Used in stormwater management and industrial filtration systems. |
|
| ■ | Soil Amendment & Agriculture |
|
| 1. | Improves soil nutrient retention, reducing leaching of fertilizers. |
|
| 2. | Enhances plant growth by holding essential cations (K+, Ca²+, Mg²+). |
|
| 3. | Used in hydroponic and greenhouse growing mediums. |
|
| ■ | Animal Feed Additive |
|
| 1. | Acts as a toxin binder to reduce ammonia and mycotoxin levels in livestock feed. |
|
| 2. | Improves digestion efficiency in poultry, cattle, and swine. |
|
| ■ | Odor and Moisture Control |
|
| 1. | Used in cat litter, barn stall absorbents, and composting to reduce odors and moisture buildup. |
|
| ■ | Industrial & Chemical Adsorption |
|
| 1. | Used in gas purification (removing CO₂, H₂S, NH₃). |
|
| 2. | Molecular sieves for petroleum refining and chemical processing. |
2. Zeo2 (CEC ~56.2 meq/100g, 41.85% clinoptilolite)
Zeo2 is useful for agricultural applications but has lower ion-exchange efficiency than Zeo1.
|
| o | Classification: High CEC |
|
|
|
|
|
| o | Potential Uses: |
|
| ■ | Suitable for moderate ion-exchange applications, such as water purification, slow-release fertilizers, or livestock feed additives. |
|
| ■ | Could be used in soil amendments to improve nutrient retention and water- holding capacity. |
|
| o | Best Uses: |
|
| ■ | Moderate Soil Amendment |
|
| 1. | Increases water-holding capacity and nutrient retention in sandy soils. |
|
| 2. | Used in golf course greens, turf management, and erosion control. |
|
|
|
| GeoGRAFX GIS Services | July 2, 2025 |
| Bear River Zeolite Project | Page: 132 |
| Franklin County, USA |
|
|
| · | Fertilizer Carrier & Slow-Release Medium |
|
| 1. | Helps retain nutrients in agricultural fields, reducing the need for frequent fertilization. |
|
| · | Wastewater Treatment (Less Intensive Systems) |
|
| 1. | Can be used in biofiltration systems to remove ammonium and phosphorus. |
|
| · | Poultry & Livestock Bedding Additive |
|
| 1. | Absorbs moisture and reduces odors in animal housing. |
3. Rhyolitic Tuff (CEC ~20.1 meq/100g, 23.9% clinoptilolite)
Rhyolitic tuff is not ideal for ion-exchange applications but is valuable in construction, geotechnical uses, and as an inert filler.
|
| o | Classification: Low to Moderate CEC |
|
|
|
|
|
| o | Potential Uses: |
|
| ■ | Limited capacity for ion exchange, making it unsuitable for high-performance filtration or soil enhancement. |
|
| ■ | Could be used as an inert filler in construction materials or as a minor component in blended soil amendments. |
|
| o | Best Uses: |
|
| ■ | Construction Materials & Lightweight Aggregate |
|
| 1. | Used in concrete blends, lightweight bricks, and road base materials. |
|
| ■ | Soil Amendment (Structural Improvement Only) |
|
| 1. | Improves soil aeration and drainage but offers minimal nutrient retention benefits. |
|
| ■ | Filler in Industrial Products |
|
| 1. | Can be used in ceramics, cement, and insulation materials. |
|
| ■ | Geotechnical & Erosion Control |
|
| 1. | Applied in land reclamation and slope stabilization due to its stable structure. |
10.4 Registrations and Certifications
BRZ’s zeolite meets industry standards and certifications for various applications, ensuring safety, effectiveness, and regulatory compliance:
|
| · | GRAS (generally regarded as safe) anti-caking agent, CFR Title 21, Sec. 182.2729 & Sec. 582.2729* |
|
| · | CFIA (Canadian Animal Feed Inspection Agency), Registration No. 990643* |
|
| · | OMRI NOP: Minerals- Feed, Livestock feed ingredients, Product No.: ber-7707 |
|
| · | OMRI COR: Minerals, trace minerals, elements, non-synthetic- Livestock feed ingredients, Product No.: ber-7708 |
|
|
|
| GeoGRAFX GIS Services | July 2, 2025 |
| Bear River Zeolite Project | Page: 133 |
| Franklin County, USA |
|
|
| · | OMRI NOP: Mined minerals- unprocessed, crop fertilizers and soli amendments, Product No: ber-3083 |
|
| · | OMRI NOP: Grimy Grip, Mined minerals- unprocessed, Crop fertilizers and soil amendments, Product No.: ber- 11309 |
|
| · | ANSI/NSF: Standard 61 - Drinking Water Systems Components (ChemSorb Filter Granules) |
|
| · | ANSI/NSF: Standard 60-Drinking Water Treatment (ChemSorb Sorbent Powder) |
|
| · | ANSI/NSF: Standard 50-Equipment for Pools, Spas, Hot Tubs (ZeoSand Natural Zeolite Filter Media) |
|
| · | DOT Class 50: Non-hazardous |
10.5 Qualified Person’s Opinion on Data Adequacy
The mineral processing and metallurgical testing data provided for the Bear River Zeolite (BRZ) deposit appears to be adequate for the purposes of this technical report summary, with a robust dataset supporting the characterization of Bear River Zeolite - Zeo1 lithology. The Cation Exchange Capacity (CEC) testing is comprehensive, covering 559 Zeo1 samples analyzed by ALS Environmental Lab, an independent and ISO-certified facility.
In addition to CEC testing, mineralogical characterization via X-ray Diffraction (XRD) analysis has been conducted on 14 representative samples at SGS Canada, Inc., another independent, ISO-certified laboratory. The XRD results confirm that the Zeo1 lithology is dominantly clinoptilolite-rich (76.6%– 85.4%), with minor components including quartz, feldspars, cristobalite, celadonite, and trace iron oxides. The absence of deleterious minerals such as calcite, dolomite, and sulfides further support the deposit’s suitability for industrial applications requiring high-purity zeolite.
The whole rock and elemental analyses conducted on eight Zeo1 samples provide additional confidence in the geochemical consistency of the deposit. These analyses confirm a silica-rich, aluminosilicate- dominated composition, in line with expectations for zeolitized volcanic tuffs. Elemental concentrations (Al, Ca, K, Na, Fe, and trace elements) have been evaluated, with standard deviations and variance calculations providing insights into compositional homogeneity.
Overall, the data is considered sufficient to support the conclusions presented in this report, with laboratory testing conducted by accredited facilities and robust analytical methodologies applied.
It is advisable to supplement visual lithologic inspection with geochemical analysis derived from multiple spatially distributed samples when determining cation exchange capacity (CEC) values. A single sample is insufficient to characterize the inherent geochemical variability of a lithologic unit and may lead to inaccurate or non-representative CEC assignments. Incorporating data from multiple sampling depths and lateral positions within the same unit provides a more robust statistical basis for characterizing CEC, thereby reducing analytical discrepancies and improving the reliability and reproducibility of results during mineral processing and deposit evaluation.
|
|
|
| GeoGRAFX GIS Services | July 2, 2025 |
| Bear River Zeolite Project | Page: 134 |
| Franklin County, USA |
|
11 Mineral Resource Estimate
The following constitutes the Qualified Person’s formal Mineral Resource Statement for the Bear River Zeolite Project, effective as of May 22, 2024, and prepared in accordance with SEC Regulation S-K 1300. This statement summarizes the total in-situ Mineral Resources using a cutoff grade of 100 meq/100g cation exchange capacity (CEC) and includes both resource quantities inclusive of reserves and those reported exclusive of reserves for regulatory clarity.
The SEC definition of a Mineral Resource (S-K 1300, Subpart 229.1300) is as follows:
“Mineral resource is a concentration or occurrence of material of economic interest in or on the Earth’s crust in such form, grade or quality, and quantity that there are reasonable prospects for economic extraction. A mineral resource is a reasonable estimate of mineralization, taking into account relevant factors such as cut-off grade, likely mining dimensions, location or continuity, that, with the assumed and justifiable technical and economic conditions, is likely to, in whole or in part, become economically extractable. It is not merely an inventory of all mineralization drilled or sampled.”
11.1 Summary of Mineral Resources
As of the effective date of May 22, 2024, the Bear River Zeolite Project contains an in-situ Mineral Resource of approximately 5.47 million short tons in the Measured and Indicated categories, with an average cation exchange capacity (CEC) of 146.16 meq/100g. An additional 426,000 short tons are classified as Inferred. These estimates are based on a cutoff grade of 100 meq/100g CEC and reflect the total Mineral Resource inclusive of Mineral Reserves, in accordance with SEC Regulation S-K 1300. For clarity and compliance, Mineral Resources reported exclusive of Mineral Reserves are presented in Section 11.13 of this report. All estimates have been prepared by a Qualified Person using industry- standard methods and are supported by detailed geological modeling and statistical analysis. The Mineral Resource estimate is based on all drilling, sampling, and technical data available through December 31, 2024. The Qualified Person completed and signed off on this resource estimate as of May 13, 2025, and the effective date is May 22, 2024, as stated herein.
11.2 Data Used in the Estimate
The drillhole database is made up of 80 drillholes, comprising a total drilled length of 6,574 feet, drilled to a maximum depth of 84’ using 6’ average interval lengths. Statistics for the drillhole lengths and intervals are provided in Table 11-1. The drillhole positions can be seen spatially in plan view in Figure 11.3-1: Plan View of Drillhole Collars (Yellow) Relative to Lease Boundary (Red Overlay) and Aerial Photo relative to the lease boundary and aerial photo.
Table 11-1 Drillhole Collar and Interval Statistics

The data was reviewed for fundamental errors such as crossing interval and non-numeric grade values using Leapfrog Geo’s database validation tools. No database errors were identified in that examination. Additional data verification details are provided in Section 9 of this report.
|
|
|
| GeoGRAFX GIS Services | July 2, 2025 |
| Bear River Zeolite Project | Page: 135 |
| Franklin County, USA |
|
Leapfrog Geo software was used for all project modeling, and Leapfrog Edge software was used for resource estimation and reporting.
11.3 Exploratory Data Analysis (EDA)
Exploratory Data Analysis was done on the drilling data to identify trends and populations, as well as to get a general sense of CEC grades and distribution. The first statistics examined were general tabulated statistics as well as a histogram distribution of the CEC values. Table 11-2 General CEC Statistics for the Drilling Database provides the general statistics, while the overall population histogram is shown in Figure 11.3-2. At least three dominant populations can be seen in the histogram – one group from 0-30 CEC, the next from 30-100 CEC, and then a group above 100 CEC.
Table 11-2 General CEC Statistics for the Drilling Database
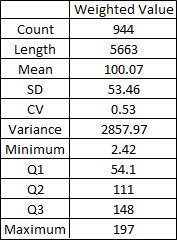
|
|
|
| GeoGRAFX GIS Services | July 2, 2025 |
| Bear River Zeolite Project | Page: 136 |
| Franklin County, USA |
|
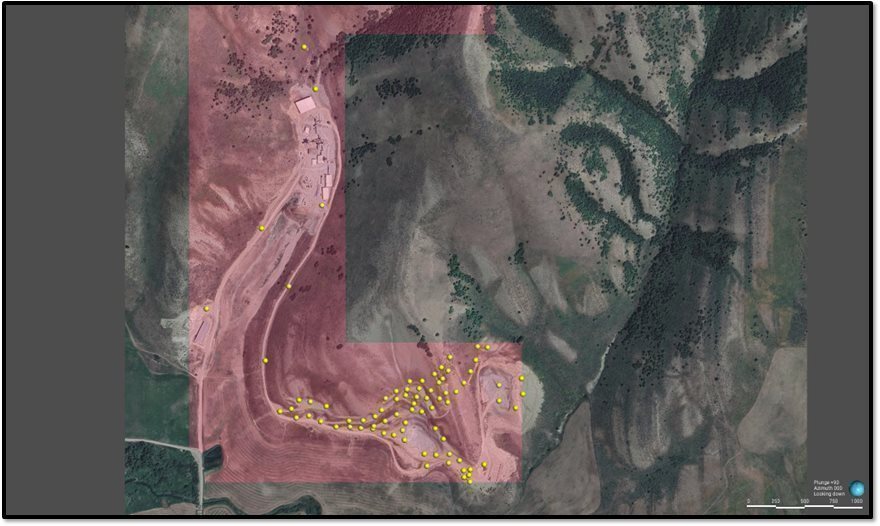
Figure 11.3-1: Plan View of Drillhole Collars (Yellow) Relative to Lease Boundary (Red Overlay) and Aerial Photo
|
|
|
| GeoGRAFX GIS Services | July 2, 2025 |
| Bear River Zeolite Project | Page: 137 |
| Franklin County, USA |
|
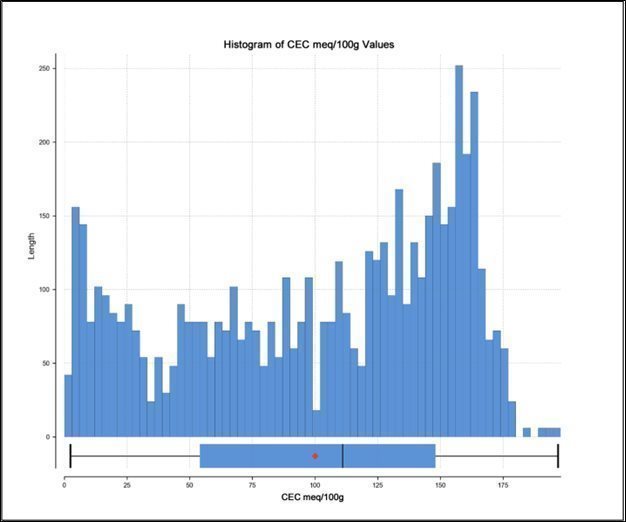
Figure 11.3-2: Histogram of CEC Grade Distribution, All Drilling
The histogram was also examined with the lithologic codes projected onto the bars to verify the expected grade distributions between the primary lithologic types of Rhyolite and Zeolite recorded in the database – in the database, Zeolite is broken into Zeo1 which is of higher grade, while Zeo2 is lower grade material. Figure 11.3-3 provides the lithologic histogram – as expected, the Zeo1 occupies the highest-grade population, while Zeo2 and Rhyolite are on the low end of the distribution. Of note, there are 11 total intervals of Clay and Fill that were not consequential to the model and were generally ignored for the purposes of geological and resource modeling.
Table 11-3 provides detailed statistics of the CEC values broken down by lithologic code.
|
|
|
| GeoGRAFX GIS Services | July 2, 2025 |
| Bear River Zeolite Project | Page: 138 |
| Franklin County, USA |
|
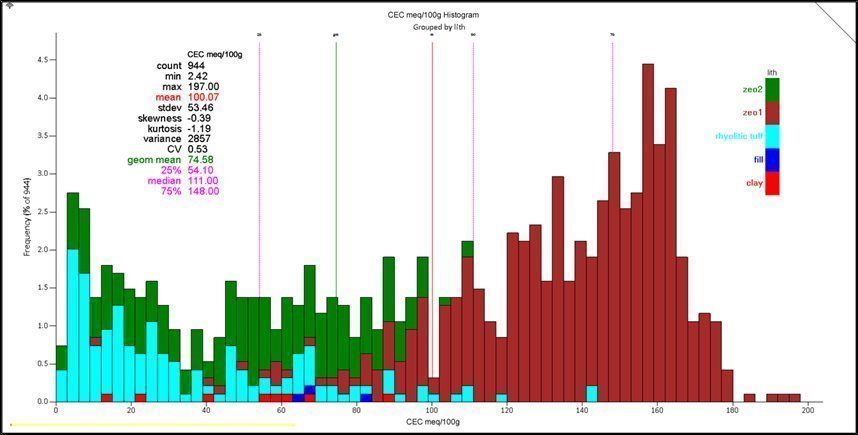
Figure 11.3-3: CEC Histogram Broken Down by Lithologic Code, All Drilling Samples
Table 11-3: General CEC Drilling Statistics Broken Down by Lithologic Code
|
|
|
| GeoGRAFX GIS Services | July 2, 2025 |
| Bear River Zeolite Project | Page: 139 |
| Franklin County, USA |
|
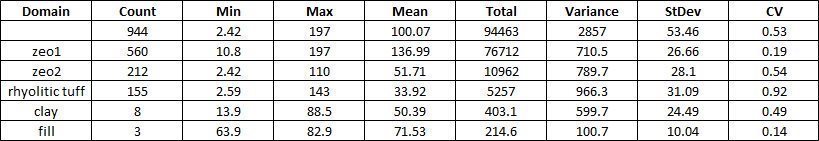
|
|
|
| GeoGRAFX GIS Services | July 2, 2025 |
| Bear River Zeolite Project | Page: 140 |
| Franklin County, USA |
|
Finally, Cumulative Frequency and Box Plots were reviewed to compare the CEC distributions by lithologic code. As expected, the Zeo1 is clearly the lithologic code of interest in this model. However, for the geological model the Zeo1 and Zeo2 material were not differentiated; rather, the high-grade material was isolated using a Mineralized Envelope as described in the following Section 11.4. The Cumulative Frequency and Box plots are provided in Figure 11.4-1 and Figure 11.4-2.
11.4 Geological and Mineralization Interpretation
The geological model is comprised of three main units:
|
| · | Zeolite-bearing Salt Lake Formation, |
|
| · | Interbedded non-zeolitic Rhyolite, and |
|
| · | Topsoil. |
The geological model was built in Leapfrog Geo software using industry standard methodology. The overall trend for the Rhyolite and Zeolite beds was identified using satellite imagery draped on the topographic surface; as seen in Figure 11.4-3, the layered bedding is clearly identifiable along the hillside above the mining area. A plane was fit to the orientation of the beds and became the basis for the anisotropic trends for the geological model, mineralized envelope, and grade estimations.
The laminar Rhyolite beds were modeled by using an extremely high degree of anisotropy along the aforementioned bedding plane orientation to differentiate the material from the Zeolitic layers in a stratified sequence.
Topsoil wasn’t specifically logged in the drilling data, but many of the holes did not have lithologic logs starting at the collar, as they did not log the topsoil that was encountered in the holes. As such, the “missing” intervals were treated as topsoil intercepts and modeled accordingly. The topsoil layer, along with the non-zeolitic Rhyolite, were used to limit the extents of the mineralization where it geologically shouldn’t exist.
No other lithologic units were identified in the drilling nor modeled in the geological model; the zeolite bearing Salt Lake Formation was assumed to be present wherever the Topsoil and Rhyolite did not exist. A cross-sectional example of the geological model is provided in Figure 11.4-4.
|
|
|
| GeoGRAFX GIS Services | July 2, 2025 |
| Bear River Zeolite Project | Page: 141 |
| Franklin County, USA |
|
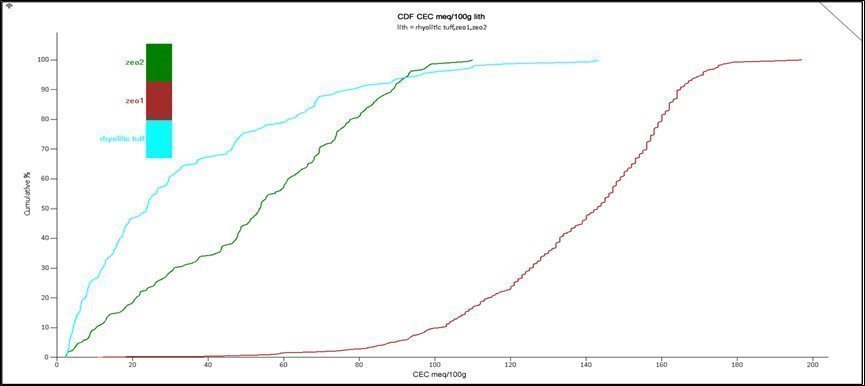
Figure 11.4-1: Cumulative Frequency Plot of CEC within Rhyolite and Zeolite Lithologic Codes
Figure 11.4 1 shows the cumulative distribution frequency (CDF) of cation exchange capacity (CEC) values for three lithologic units: Zeo1 (red), Zeo2 (green), and Rhyolitic Tuff (cyan). Each curve represents the cumulative percentage of samples from that unit that fall below a given CEC value.
The CDF plot demonstrates strong lithologic control over zeolite quality as measured by cation exchange capacity. Zeo1 contains nearly all high- grade material, with CEC values overwhelmingly above 100 meq/100g, while Zeo2 is predominantly subeconomic but may have marginal potential. Rhyolitic tuff does not meet the threshold for resource inclusion and is excluded from the estimate. These distributions support the use of a lithology-constrained model and a CEC-based cutoff grade.
|
|
|
| GeoGRAFX GIS Services | July 2, 2025 |
| Bear River Zeolite Project | Page: 142 |
| Franklin County, USA |
|
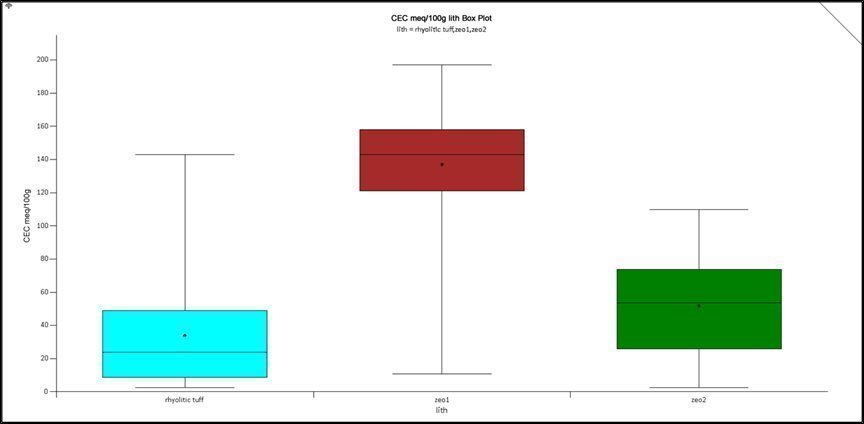
Figure 11.4-2: Box Plot of CEC within Rhyolite and Zeolite Lithologic Codes
Figure 11.4 2 displays the distribution of cation exchange capacity (CEC) values (in meq/100g) across three lithologic units: Rhyolitic tuff, Zeo1, and Zeo2. Each colored box represents the interquartile range (IQR) for that lithology, showing the spread of the middle 50% of CEC values. Whiskers indicate variability outside the upper and lower quartiles, and the black dot in each box represents the mean value.
|
|
|
| GeoGRAFX GIS Services | July 2, 2025 |
| Bear River Zeolite Project | Page: 143 |
| Franklin County, USA |
|
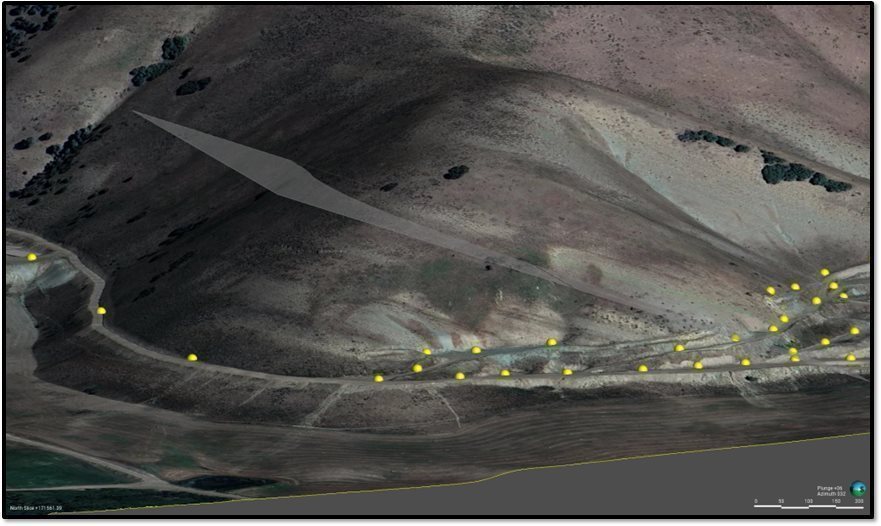
Figure 11.4-3: Inclined View of Topography with Aerial Image Overlay Showing Zeolite/Rhyolite Bedding Relative to Reference Plane for Geological and Mineralization Modeling
|
|
|
| GeoGRAFX GIS Services | July 2, 2025 |
| Bear River Zeolite Project | Page: 144 |
| Franklin County, USA |
|
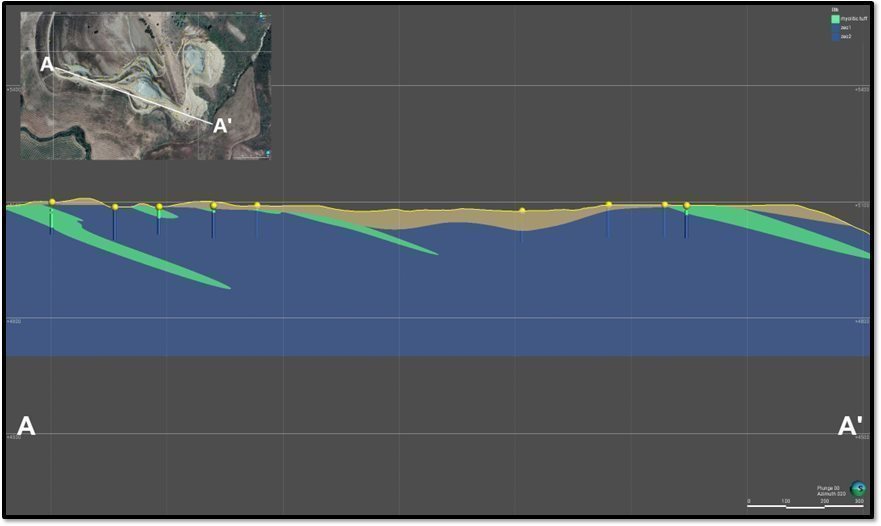
Figure 11.4-4: Representative Cross-Sectional View of the Geologic Model and Drilling, Looking North-Northeast, with Rhyolite in Green, Topsoil in Tan, and Zeolite in Blue
|
|
|
| GeoGRAFX GIS Services | July 2, 2025 |
| Bear River Zeolite Project | Page: 145 |
| Franklin County, USA |
|
Ore-grade zeolite was ultimately constrained by a mineralized envelope to differentiate the mineable zeolite from the sub-economic and non-zeolitic Salt Lake Formation. The mineralized envelope was constructed as an Indicator Interpolant, which considers samples above a given cutoff to be “inside” the domain, but converts grade values to binary 0 and 1 values below and above the cutoff respectively, thereby removing the influence of high-grade outliers on the shape of the final envelope. The Indicator shell utilizes an additional “Probability” parameter, which effectively specifies the probability that all material within an indicator is at or above the cutoff. The Probability value was set at 0.7 (70% probability) for the indicator in order to sufficiently constrain the mineralized zone without expanding significantly beyond the ore-grade samples. The cutoff itself was set to a 100 CEC value, based on the current mining cutoff grade.
Statistics for the samples inside and outside the mineralized envelope are provided in Table 11-4, while histogram distributions of the populations are shown in Figure 11.4-5 and Figure 11.4-6. The mineralized envelope wireframe can be seen in plan view in Figure 11.4-7, an oblique aerial view in Figure 11.4-8, and a cross-sectional view in Figure 11.4-9.
|
|
|
| GeoGRAFX GIS Services | July 2, 2025 |
| Bear River Zeolite Project | Page: 146 |
| Franklin County, USA |
|
Table 11-4 Mineralized Envelope Statistics
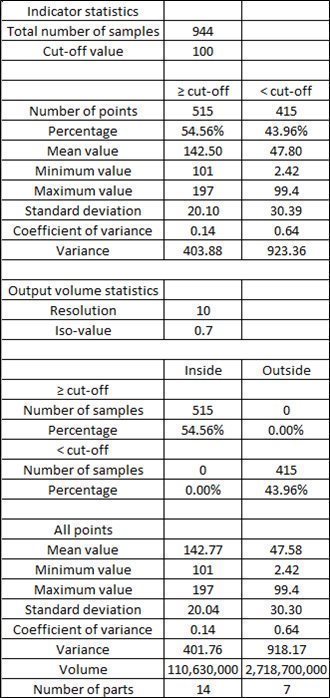
|
|
|
| GeoGRAFX GIS Services | July 2, 2025 |
| Bear River Zeolite Project Franklin County, USA | Page: 147 |
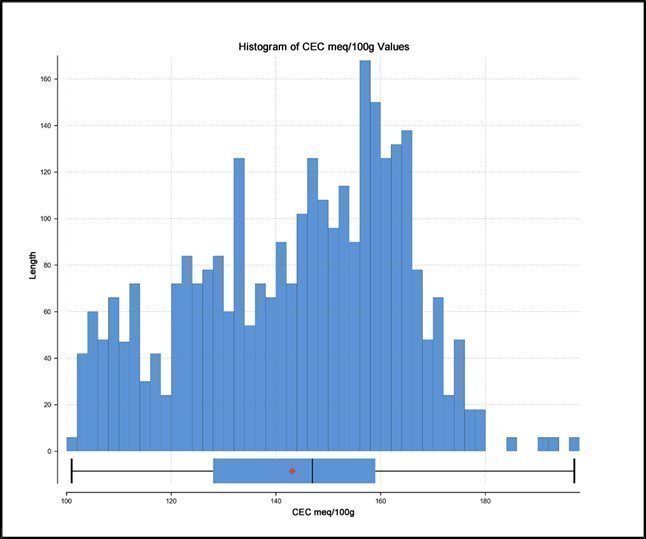
Figure 11.4-5: Histogram of CEC Values Inside the Mineralized Envelope
| GeoGRAFX GIS Services | July 2, 2025 |
| Bear River Zeolite Project Franklin County, USA | Page: 148 |
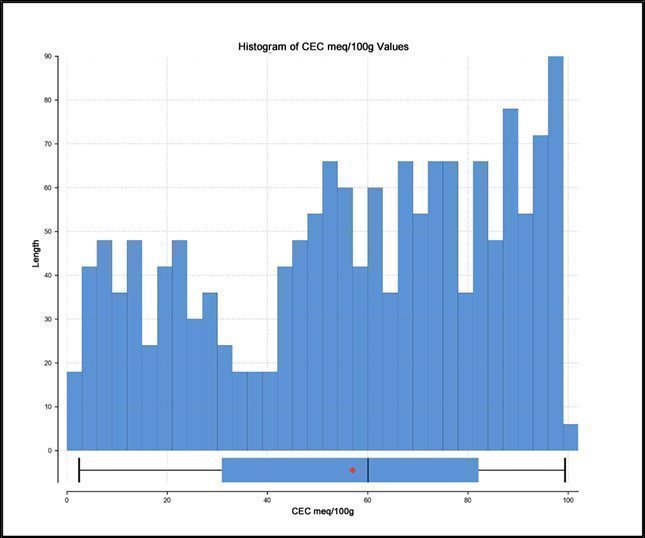
Figure 11.4-6: Histogram of CEC Values Outside the Mineralized Envelope
| GeoGRAFX GIS Services | July 2, 2025 |
| Bear River Zeolite Project Franklin County, USA | Page: 149 |
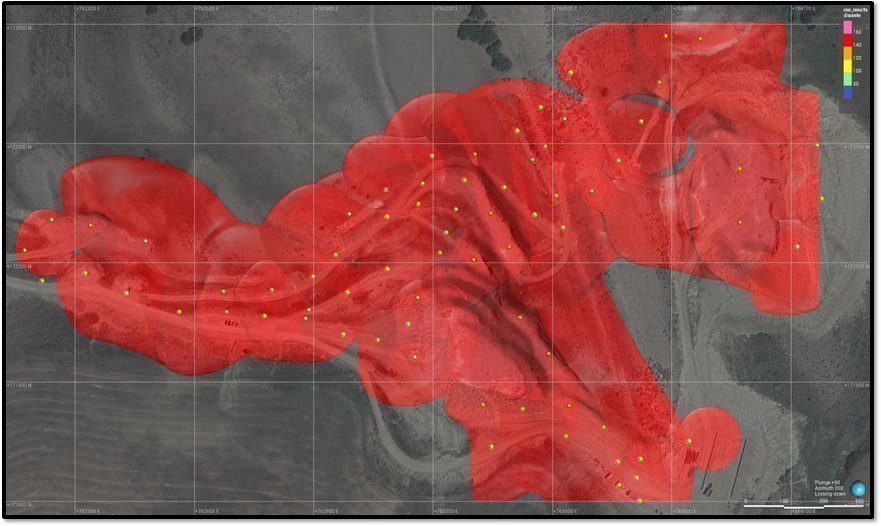
Figure 11.4-7: 100 CEC Mineralized Envelope with CEC Drillhole Values, Plan View
| GeoGRAFX GIS Services | July 2, 2025 |
| Bear River Zeolite Project Franklin County, USA | Page: 150 |
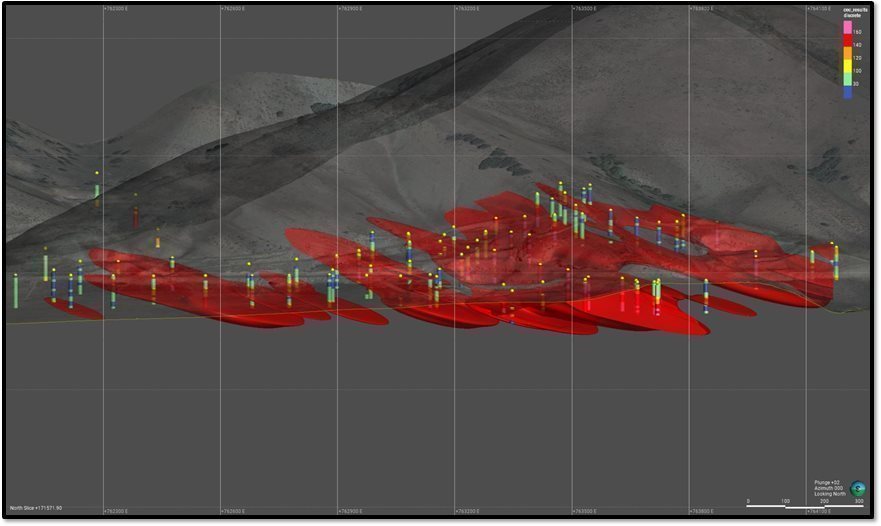
Figure 11.4-8: 100 CEC Mineralized Envelope with CEC Drillhole Values, Rotated Aerial View Looking North
| GeoGRAFX GIS Services | July 2, 2025 |
| Bear River Zeolite Project Franklin County, USA | Page: 151 |
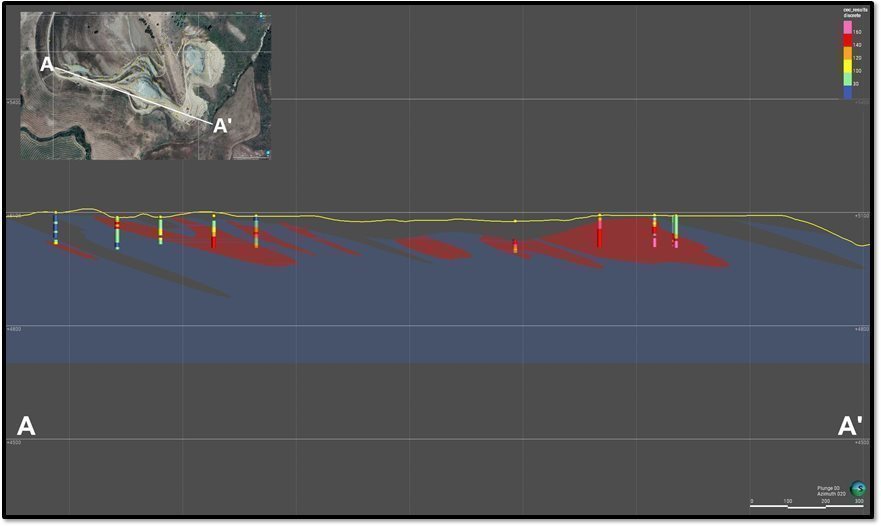
Figure 11.4-9: 100 CEC Mineralized Envelope with CEC Drillhole Values, Representative Cross-Sectional View Looking North-Northeast
| GeoGRAFX GIS Services | July 2, 2025 |
| Bear River Zeolite Project Franklin County, USA | Page: 152 |
11.5 Compositing and Capping
Compositing was not done on the drillhole samples for the following reasons:
| 1. | Given the extremely uniform 6’ interval lengths in the drillholes, compositing was not necessary to try to produce consistent intervals within the mineralized domain. Likewise, the mineralized domain was built to encompass complete intervals rather than partial intervals, so there was a low risk of marginal change-of-support issues that could arise from split intervals. | |
| 2. | The data within the mineralized envelope is relatively well-behaved as a slightly negatively skewed normal distribution, as seen in Figure 11.4-5. Thus, compositing was not necessary to attempt to “smooth” the data to achieve a normal distribution. | |
| 3. | There are already relatively few samples available in the drillhole database, and compositing them would inherently reduce the number available for variography and estimation. |
Capping was also deemed unnecessary due to the negative skewness of the mineralized population – there are very few high-grade outliers, and none are more than three standard deviations from the mean of the data population.
11.6 Variography and Geostatistics
Variography was done on Zeolite samples within and outside the mineralized envelope to identify an overall mineralization trend, to provide inputs for the Ordinary Kriging estimations, and to provide range values for categorization purposes. Only samples inside or outside the Mineralized Envelope were used for the respective variography study. The parameters for the resulting variogram models are provided in Table 11-5. The variograms themselves are shown in Figure 11.6-1 and Figure 11.6-2.
Three estimation types were used for the Bear River Zeolite resource model; Ordinary Krige (OK), Inverse Distance Squared (ID2), and Nearest Neighbor (NN). The Ordinary Krige estimation was used for the final resource report, while the ID2 and NN estimations were used for model validation. The three estimators were run inside and outside the mineralized envelope, resulting in 6 total estimations. Parameters for the estimations are provided in Table 11-6.
| GeoGRAFX GIS Services | July 2, 2025 |
| Bear River Zeolite Project Franklin County, USA | Page: 153 |
Table 11-5: Variogram Parameters for Samples Inside and Outside the Mineralized Envelope

Table 11-6: Estimation Parameters for OK, ID2, and NN Estimators Inside and Outside Mineralized Envelope
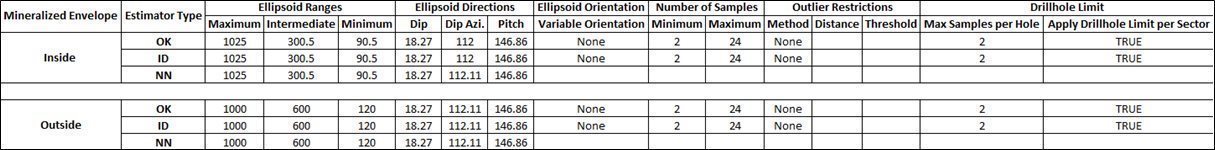
| GeoGRAFX GIS Services | July 2, 2025 |
| Bear River Zeolite Project Franklin County, USA | Page: 154 |
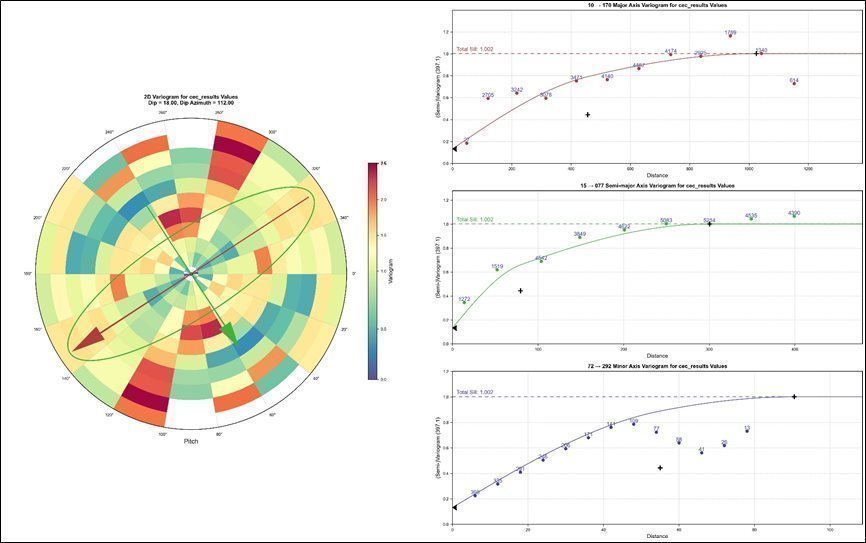
Figure 11.6-1: Variograms Inside the Mineralized Envelope
| GeoGRAFX GIS Services | July 2, 2025 |
| Bear River Zeolite Project Franklin County, USA | Page: 155 |
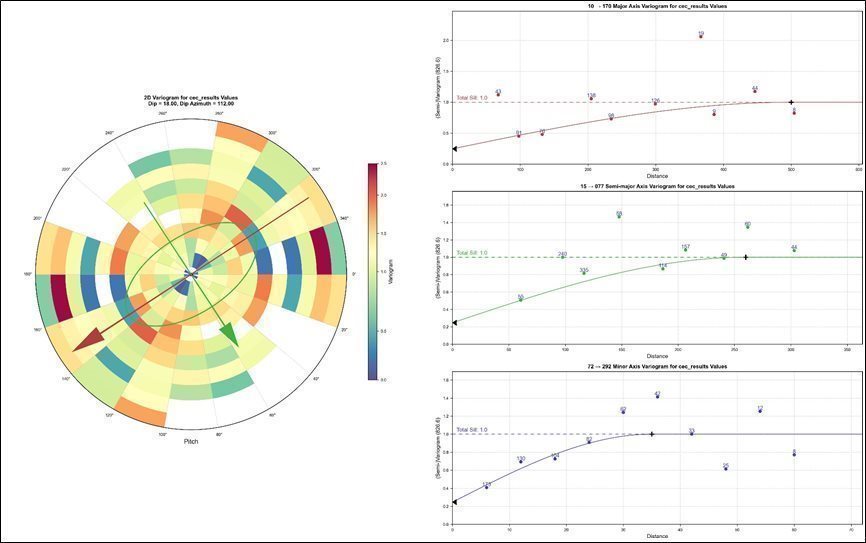
Figure 11.6-2: Variograms Outside the Mineralized Envelope
| GeoGRAFX GIS Services | July 2, 2025 |
| Bear River Zeolite Project Franklin County, USA | Page: 156 |
11.7 Block Model Parameters
The block model is constructed of regular 18’x18’x12’ blocks, which were sized to correspond with a reasonable Selective Mining Unit (SMU). Orientation and dimensions of the block model are provided in Table 11-7.
Table 11-7: Block Construction Parameters
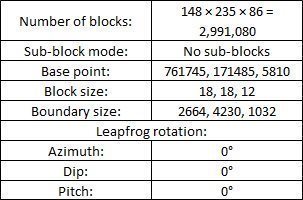
The blocks were assigned values from the geological model (Topsoil, Rhyolite, and Zeolite) as well as their mineralized status (inside or outside the mineralized envelope). The block estimations were done using the parameters provided in Table 11-6 for each of the OK, ID2, and NN estimations.
A bulk density of 137.34 lb/ft3 (2.2 g/cm3) was assigned to the blocks, based on the average of an internal density study of 14 samples ranging from 124.86 lb/ft3 (2.0 g/cm3) to 162.31 lb/ft3 (2.6 g/cm3). An earlier density study from 2009 suggested a much lower average of 55-60 lb/ft3 (0.93 g/cm3) but was not clear if the material used in the study was intact or broken; there is a reference to broken material in the report, suggesting that is not an in-situ density measurement. As such, the lower density was not considered for the model.
11.8 Classification Criteria
Measured and Indicated resources are defined based on drillhole spacing, geological continuity, and grade distribution supported by variography. Inferred resources extend beyond areas of tight drill control and are assigned where grade and geology are interpreted with lower confidence. For this project, classification was done using three criteria: average distance to the samples used per block, number of drillholes used per block, and number of samples used per block.
The average distance requirement was calculated as a function of the variography range; blocks to be considered for Measured categorization would need to have the average sample distance within 50% of the variogram range, while the Indicated categorization would have the average sample distance within 70% of the variogram range, as illustrated in Figure 11.8-1. The ranges were set based on the Major axis range analysis, so the semi-major and minor ranges have the potential to be overly generous; this was resolved through the other categorization criteria.
| GeoGRAFX GIS Services | July 2, 2025 |
| Bear River Zeolite Project Franklin County, USA | Page: 157 |
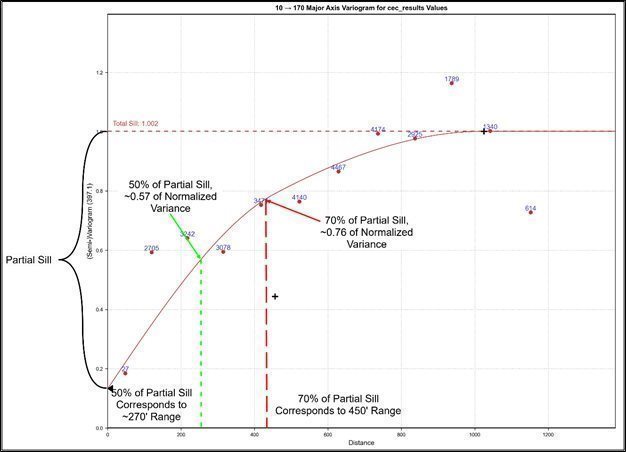
Figure 11.8-1: Method for Obtaining the Average Distances Required for Measured and Indicated Categorizations from Variography
In addition to the average distance, a relatively stringent requirement for included drillholes and samples was imposed on the categories. Table 11-8 provides the sample and drillhole count requirements for Measured and Indicated categorization. The counts were selected due to the large variography range and the availability of samples and drillholes within that range, while also attempting to avoid “spotted dog” scenarios where a single drillhole or small cluster of drillholes has an isolated population of high-confidence blocks around it.
Table 11-8 Categorization Parameters for Measured and Indicated Blocks
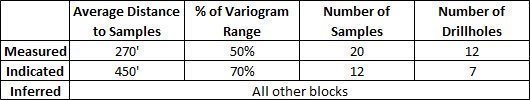
| GeoGRAFX GIS Services | July 2, 2025 |
| Bear River Zeolite Project Franklin County, USA | Page: 158 |
The Measured, Indicated, and Inferred resource blocks are shown in plan view and cross-section in Figure 11.8-2 and Figure 11.8-3, respectively. Figure 11.8-2 displays a horizontal slice through the block model at the 5060 ft elevation, illustrating the distribution of classified resource blocks: Measured (red), Indicated (green), and Inferred (blue). This figure represents the lateral extent of mineralization at that specific elevation and corresponds to the location of cross-section B–B′ as shown in Figure 11.8-3. The B–B′ cross-section is oriented looking north. Drill collars are indicated by yellow circles, and the lease boundary is outlined in blue.
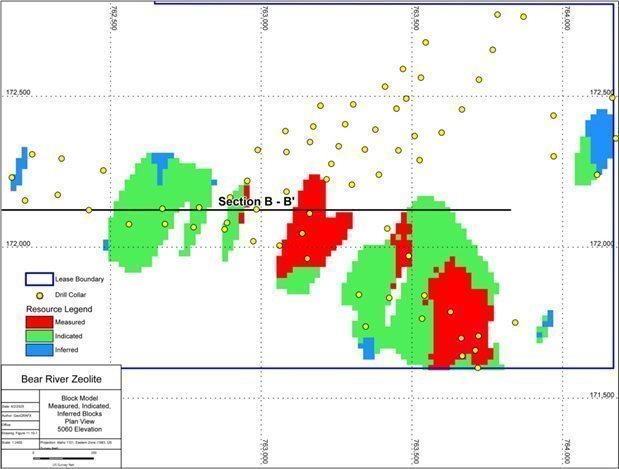
Figure 11.8-2: Measured (Red), Indicated (Green), and Inferred (Blue) Resource Blocks, Plan View 5060 Level
| GeoGRAFX GIS Services | July 2, 2025 |
| Bear River Zeolite Project Franklin County, USA | Page: 159 |
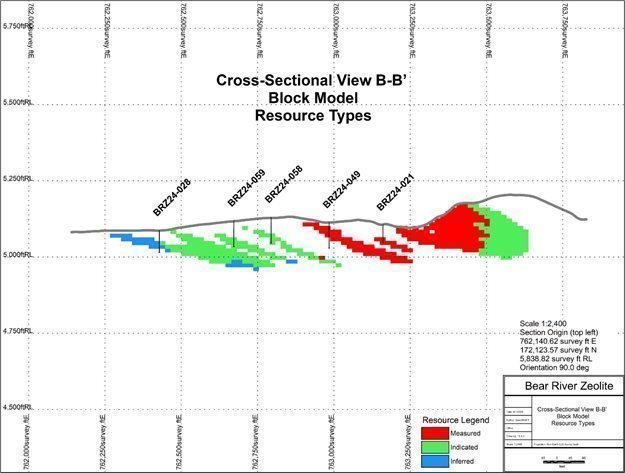
Figure 11.8-3: Measured (Red), Indicated (Green), and Inferred (Blue) Blocks, Cross Section B-B’
The cutoff grade applied to the Bear River Zeolite Mineral Resource estimate is based on cation exchange capacity (CEC), a key indicator of zeolite quality and ion-exchange performance. A CEC cutoff of 100 meq/100g was selected for both the mineralized envelope and the final reported resource, consistent with industry classifications that define this level as "Very High" with "Strong ion-exchange potential" (see Section 10.3.1). The average CEC grade above this cutoff is 145.69 meq/100g, with an associated average clinoptilolite content of 81.16%.
The selected cutoff grade reflects both technical performance and market-driven criteria, as customer acceptance and product pricing are directly tied to the functional quality of the zeolite — particularly its CEC value and mineral purity. Zeolite products below 100 meq/100g are generally considered lower quality and may not meet specifications required in agricultural, environmental, or industrial applications. Therefore, the economic value of the resource is dictated primarily by end-use performance, not head-grade metal value as in metallic deposits.
Operating cost assumptions for mining, crushing, screening, and loading were evaluated based on BRZ's historical records. Although detailed cost modeling was not performed at the resource stage, preliminary economics suggest that material meeting or exceeding the 100 meq/100g threshold can be produced and marketed profitably under typical operating conditions at BRZ. Cost structure validation is further supported by the site's long production history and existing customer base.
| GeoGRAFX GIS Services | July 2, 2025 |
| Bear River Zeolite Project Franklin County, USA | Page: 160 |
The Mineral Resource is further constrained by lithologic boundaries interpreted from drillhole logging and surface mapping, ensuring that only zeolite-bearing units are included in the estimate. No geologic or spatial constraints (e.g., pit shells or stope shapes) were applied to the model at this stage. The reported resource is constrained only by the selected grade cutoff and host lithology. Economic pit limits and additional modifying factors are addressed separately in Section 12 (Mineral Reserves), where a floating cone pit model and forward-looking economics were applied to support the conversion of Resources to Reserves.
Given the selected cutoff, mineralogical constraints, market-driven product specifications, and the Bear River Zeolite Mine’s active production history, the Qualified Person is of the opinion that the reported Mineral Resources clearly demonstrate reasonable prospects for continued economic extraction, consistent with the standards of SEC Regulation S-K 1300.
11.9 Validation of the Estimate
The block model was validated using the following methods:
| 1. | Visual examination – the blocks were reviewed in vertical sections in multiple directions against the drillhole samples and mineralized envelope to ensure reasonable grade continuity and propagation in all directions from known data. A plan view of the block model is shown in Figure 11.9-1, displaying estimated CEC values across the 5060 ft elevation. This figure highlights the spatial distribution of modeled CEC grades and includes drill collars and lease boundaries for context. Example cross-sections along B–B′ and C–C′, showing the same estimated CEC values, are provided in Figure 11.9-2 and Figure 11.9-3. The B–B′ cross-section is oriented looking north, while the C–C′ section is oriented to the northeast. | |
| 2. | Swath plots were reviewed in all directions to compare the original samples to the estimated blocks. The smoothness of the estimations was apparent in the OK and ID2 estimations, while the NN estimators were somewhat more erratic as expected. No abnormal behavior was observed in any of the directions reviewed. The swaths for the material in the Mineralized Envelope are provided in Figure 11.9-4 through Figure 11.9-6. | |
| 3. | Scatter plots of the different estimators were evaluated, as shown in Figure 11.9-7 and Figure 11.9-8. The comparison of grades between the OK and ID2 estimators are particularly well- behaved, with a Correlation Coefficient (R value) of 0.97, indicating a high correlation between pairs. |
| GeoGRAFX GIS Services | July 2, 2025 |
| Bear River Zeolite Project Franklin County, USA | Page: 161 |
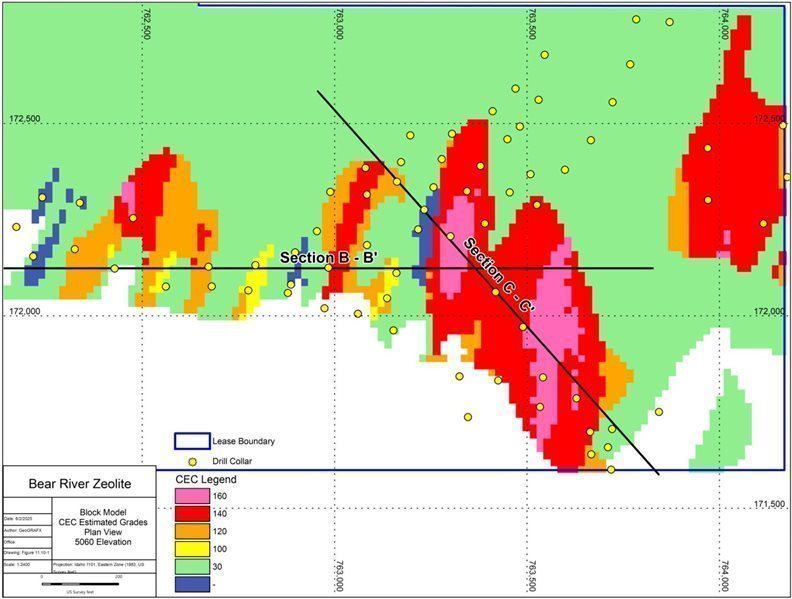
Figure 11.9-1: Plan View of Block Model with Estimated CEC Grades, 5060 Level
| GeoGRAFX GIS Services | July 2, 2025 |
| Bear River Zeolite Project Franklin County, USA | Page: 162 |
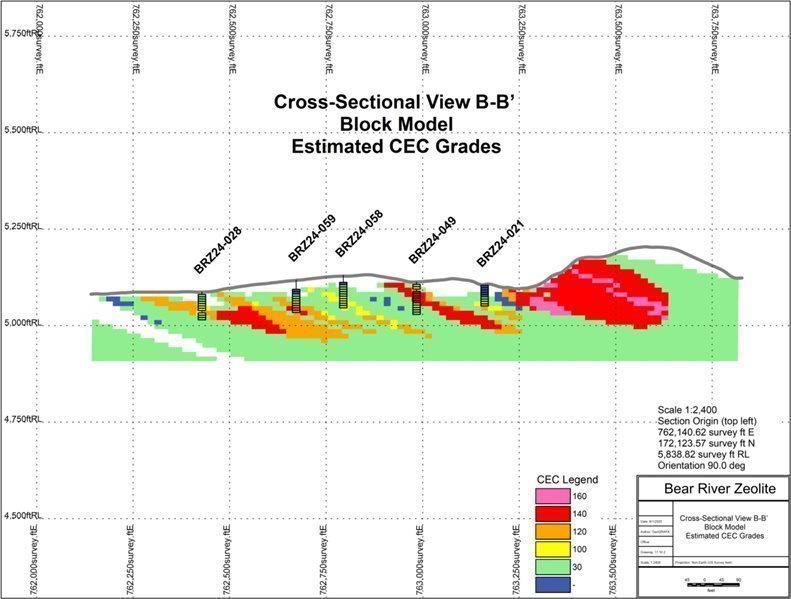
Figure 11.9-2: Cross-Sectional View B-B’ of Block Model with Estimated CEC Grades
| GeoGRAFX GIS Services | July 2, 2025 |
| Bear River Zeolite Project Franklin County, USA | Page: 163 |
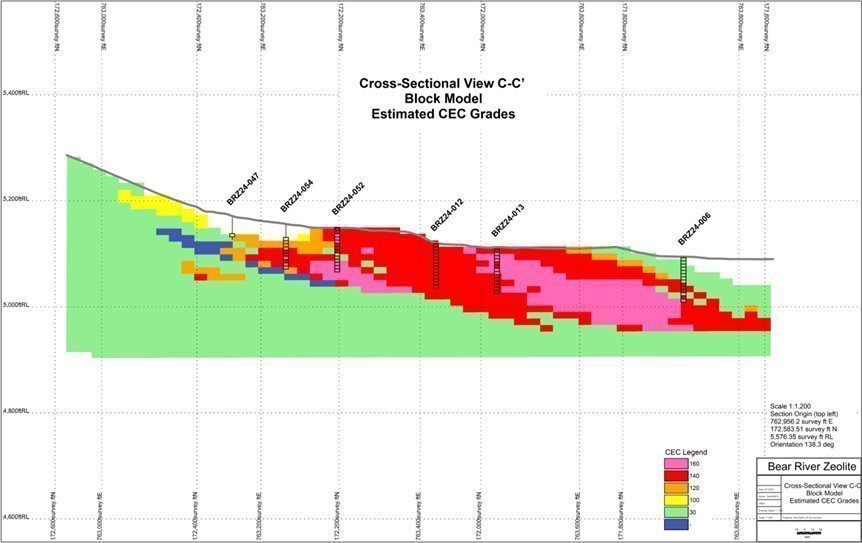
Figure 11.9-3: Cross-Sectional View C-C’ of Block Model with Estimated CEC Grades
| GeoGRAFX GIS Services | July 2, 2025 |
| Bear River Zeolite Project Franklin County, USA | Page: 164 |

Figure 11.9-4: Swath Plot in X (East) Direction, with OK (Blue), ID2 (Orange), and NN(Green) Block Grades Compared with Original Samples (Green)
| GeoGRAFX GIS Services | July 2, 2025 |
| Bear River Zeolite Project Franklin County, USA | Page: 165 |
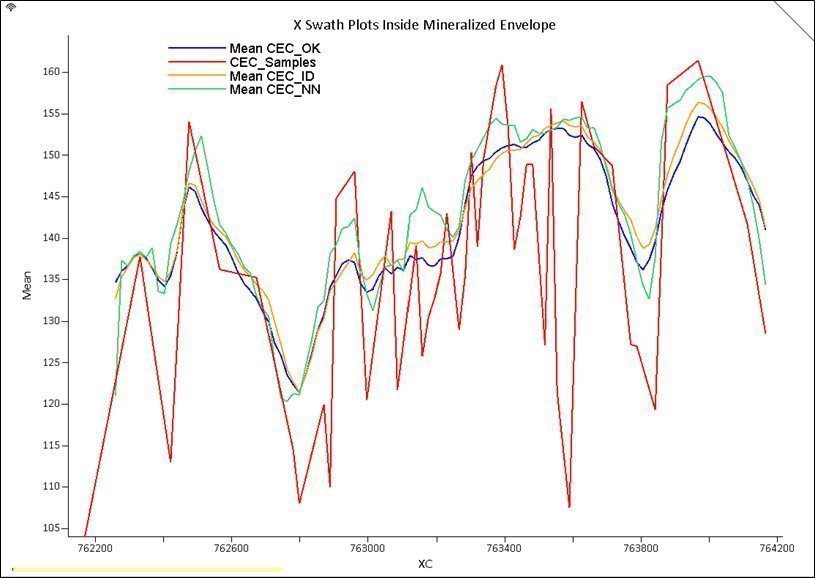
Figure 11.9-5: Swath Plot in Y (North) Direction, with OK (Blue), ID2 (Orange), and NN(Green) Block Grades Compared with Original Samples (Green)
| GeoGRAFX GIS Services | July 2, 2025 |
| Bear River Zeolite Project Franklin County, USA | Page: 166 |
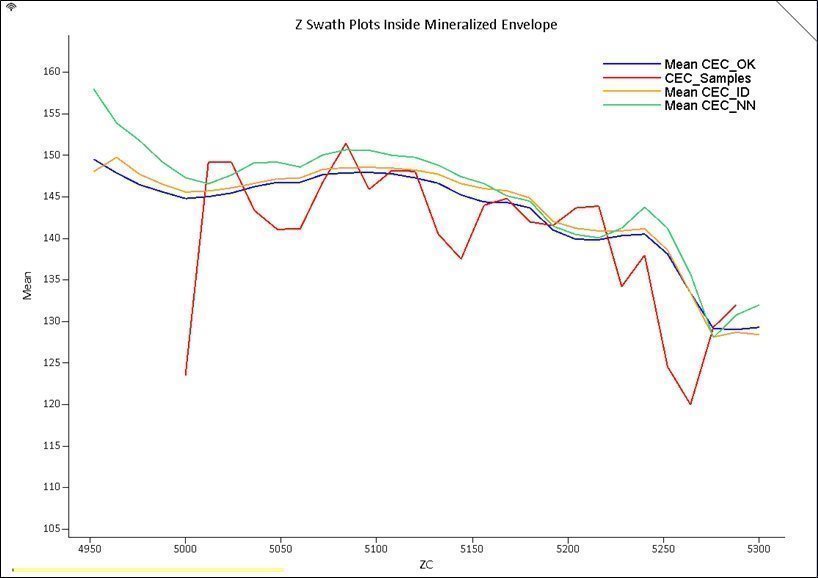
Figure 11.9-6: Swath Plot in Z (Vertical) Direction, with OK (Blue), ID2 (Orange), and NN(Green) Block Grades Compared with Original Samples (Green)
| GeoGRAFX GIS Services | July 2, 2025 |
| Bear River Zeolite Project Franklin County, USA | Page: 167 |
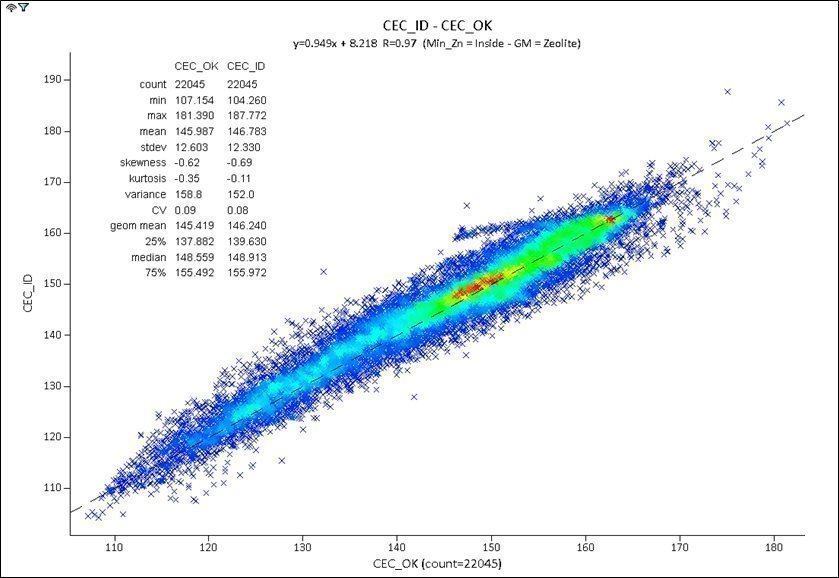
Figure 11.9-7: Scatter Plot OK vs ID2 Block Grades in Mineralized Envelope
| GeoGRAFX GIS Services | July 2, 2025 |
| Bear River Zeolite Project Franklin County, USA | Page: 168 |
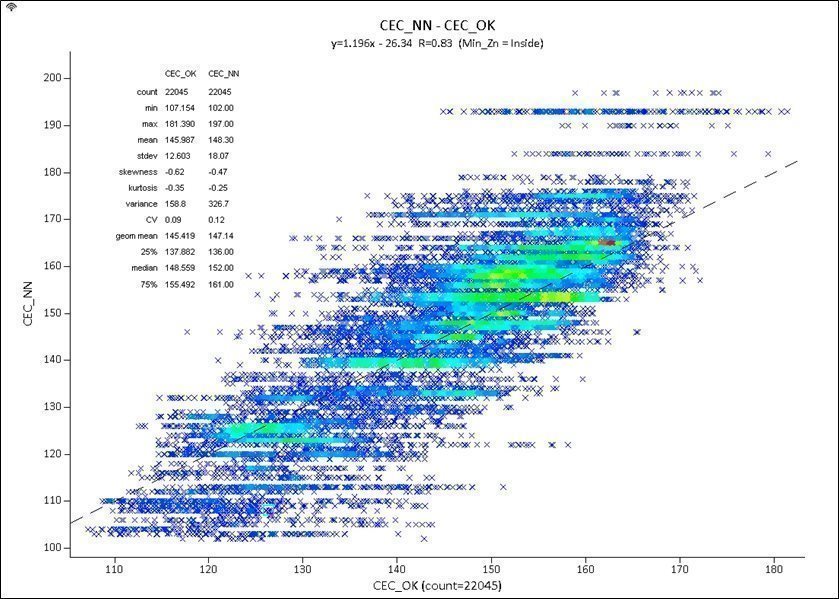
Figure 11.9-8: Scatter Plot OK vs NN Block Grades in Mineralized Envelope
| GeoGRAFX GIS Services | July 2, 2025 |
| Bear River Zeolite Project Franklin County, USA | Page: 169 |
11.10 Mineral Resource Sensitivity Analysis
A grade-tonnage graph and report were generated to examine the resource at various cut-off grades and are provided in Figure 11.10-1 and Table 11-9 respectively. It’s important to note that the mineralized envelope was not changed in conjunction with grade cutoffs used in the grade-tonnage report; as such, there is a relative plateau in the tonnage and grade lines around the 100 CEC cutoff grade where the transition from blocks outside the mineralized envelope to inside the mineralized envelope occurs.
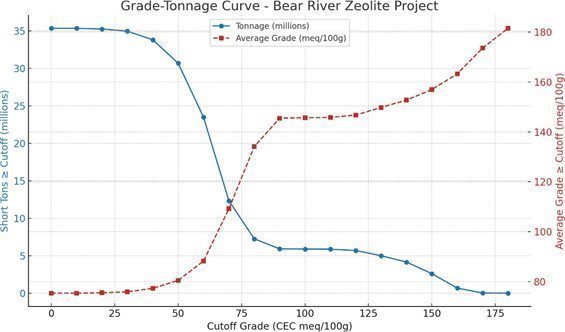
Figure 11.10-1 Grade Tonnage Curve of OK Estimations Showing the Effect of Various CEC Cutoffs, All Blocks
| GeoGRAFX GIS Services | July 2, 2025 |
| Bear River Zeolite Project Franklin County, USA | Page: 170 |
Table 11-9 Grade-Tonnage Report Providing Short Tons and Average Grade of Various CEC Cutoffs, All Blocks Considered
| Cut-off grade CEC meq/100g | Short tons ≥ cut- off (millions) | Average grade ≥ cut-off |
| 0 | 35.33 | 75.38 |
| 10 | 35.33 | 75.39 |
| 20 | 35.24 | 75.53 |
| 30 | 34.95 | 75.94 |
| 40 | 33.80 | 77.31 |
| 50 | 30.68 | 80.49 |
| 60 | 23.48 | 88.23 |
| 70 | 12.33 | 109.18 |
| 80 | 7.25 | 134.10 |
| 90 | 5.91 | 145.49 |
| 100 | 5.89 | 145.69 |
| 110 | 5.87 | 145.81 |
| 120 | 5.69 | 146.75 |
| 130 | 4.99 | 149.80 |
| 140 | 4.15 | 152.76 |
| 150 | 2.60 | 156.97 |
| 160 | 0.68 | 163.27 |
| 170 | 0.02 | 173.61 |
| 180 | 0.00 | 181.51 |
11. 11 QP Statement
The estimate of Mineral Resources presented herein for the Bear River Zeolite Project has been prepared by the undersigned Qualified Person (QP) in accordance with the definitions set forth in S-K 1300. The QP has extensive experience in geological modeling, resource estimation methodologies, and technical evaluation for a variety of deposit types.
In preparing this estimate, the QP has relied on information provided by Bear River Zeolite (BRZ) site management regarding the mining, processing, and product quality characteristics of the zeolite mineralization, as well as financial information including historical operating costs, processing recoveries, and market pricing assumptions.
Based on the data available as of May 22, 2024, it is the QP’s opinion that the Mineral Resource estimate is suitable for public disclosure, subject to the normal risks associated with geological interpretation, deposit variability, market demand, and operational and economic factors typical of industrial mineral operations.
Additional drilling, sampling, economic evaluation, and market analysis may support refinement or expansion of the resource estimate in the future.
| GeoGRAFX GIS Services | July 2, 2025 |
| Bear River Zeolite Project Franklin County, USA | Page: 171 |
11.12 Mineral Resource Statement
The Mineral Resource estimate for the Bear River Zeolite Project is effective as of May 22, 2024, and has been prepared in accordance with the requirements of SEC Regulation S-K 1300. The Mineral Resource is reported on an in situ basis, using a reference point at the deposit prior to mining or processing losses.
Table 11-10 presents the full in-situ Mineral Resource, which includes all material estimated to meet or exceed the cutoff grade of 100 meq/100g cation exchange capacity (CEC), irrespective of whether the material was subsequently converted to Mineral Reserves. This inclusive view provides readers with the complete scope of the deposit as estimated by the Qualified Person. See Section 12 for a breakdown of Mineral Reserves derived from these figures.
Table 11-10 Total In-Situ Mineral Resource Estimate (Inclusive of Reserves) – Bear River Zeolite Project
| Geologic Model | Category | Mass thousand sh. Ton | Average Value All Material OK CEC |
| Zeolite | Measured | 2,321 | 147.16 |
| Indicated | 3,145 | 145.41 | |
| Measured + Indicated | 5,466 | 146.16 | |
| Inferred | 426 | 139.71 | |
| Differences may occur in totals due to rounding | |||
These figures are based on block estimation within the 100 meq/100g mineralized envelope, using Leapfrog Edge software and supported by drillhole data and lithological modeling. The Qualified Person notes that only a portion of the Measured and Indicated Mineral Resources have been converted to Mineral Reserves in accordance with applicable economic and modifying factors (see Section 12).
In accordance with SEC Regulation S-K 1300, Mineral Resources are also presented exclusive of Mineral Reserves in the following tables. These estimates have been classified as Measured, Indicated, or Inferred based on the Qualified Person’s assessment of geological continuity, estimation confidence, and supporting data quality.
Measured and Indicated Mineral Resources, reported exclusive of Mineral Reserves, are summarized in Table 11-11 in compliance with SEC Regulation S-K 1300. Inferred Mineral Resources are summarized separately in Table 11-12 below.
| GeoGRAFX GIS Services | July 2, 2025 |
| Bear River Zeolite Project Franklin County, USA | Page: 172 |
Table 11-11 Measured and Indicated Mineral Resources (Exclusive of Reserves)
| Geologic Model | Category | Mass thousand sh. Ton | Average Value All Material OK CEC |
| Zeolite | Measured | 54 | 147.16 |
| Indicated | 285 | 145.41 | |
| Measured + Indicated | 339 | 146.16 | |
| Differences may occur in totals due to rounding | |||
Table 11-12 Inferred Mineral Resources (Exclusive of Reserves)
| Geologic Model | Category | Mass thousand sh. Ton | Average Value All Material OK CEC |
| Zeolite | Inferred | 426 | 139.71 |
| Differences may occur in totals due to rounding | |||
Cautionary Statement:
Inferred Mineral Resources are subject to a high degree of uncertainty. They may not be upgraded to a higher classification through further exploration and cannot be assumed to be economically viable.
The Qualified Person for the resource estimate is Mr. Patrick J. Hollenbeck, CPG, who is independent of the Bear River Zeolite Company.
11.13 Uncertainties (Factors) That May Affect the Mineral Resource Estimate
The Mineral Resource estimate for the Bear River Zeolite Project is subject to the normal risks associated with industrial mineral operations. Specific uncertainties that could materially impact the quantity, quality, or economic viability of the Mineral Resources include:
| · | Geological continuity: While drilling and mapping provide reasonable confidence, variability in lithology, mineralization thickness, and quality across the deposit could impact recoverable volumes. | |
| · | Product quality and specifications: Variations in the zeolite’s chemical and physical properties (e.g., cation exchange capacity, absorption characteristics) may affect marketability and pricing for different end-use applications. | |
| · | Market demand and pricing: The economic evaluation relies on current and projected demand for zeolite products. Significant changes in industrial, agricultural, or environmental applications could influence product pricing and sales volume assumptions. | |
| · | Processing efficiency: Assumptions regarding crushing, screening, and final product recovery may vary with material characteristics over time. | |
| · | Permitting and regulatory conditions: Changes in environmental permitting, mining regulations, or reclamation requirements could affect the timing or cost of operations. |
| Bear River Zeolite Project Franklin County, USA | Page: 173 |
| · | Land access, mineral rights, and permitting: The continued ability to access the site, retain mineral and surface rights, maintain required environmental and operational permits, and uphold the social license to operate may impact future development and production activities. | |
| · | Cost inflation: Increases in fuel, labor, and maintenance costs could impact operating margins and overall economic viability. | |
| · | Additional drilling and sampling: Further exploration may refine or alter the current interpretation of the deposit, impacting tonnage, grade, or classification. | |
| · | Drillhole termination within mineralization: Of the 80 drillholes used in the estimate, 61 bottomed in mineralized zeolitic material. This suggests the mineralization remains open at depth in many areas and that the current model may underestimate the full vertical extent of the deposit. |
While the Qualified Person believes that the Mineral Resource estimate appropriately reflects the available data and reasonable assumptions as of the effective date, these factors could influence future development, economic performance, or potential conversion of Resources to Reserves.
The Qualified Person considers the Mineral Resource estimate presented herein to be a reasonable representation of the Bear River Zeolite Project based on available data and technical inputs as of the effective date.
| GeoGRAFX GIS Services | July 2, 2025 |
| Bear River Zeolite Project Franklin County, USA | Page: 174 |
12 Mineral Reserve Estimate
12.1 Introduction
The Mineral Reserve estimate presented herein was prepared by Randall K. Martin, SME RM, an independent Qualified Person as defined under SEC Regulation S-K 1300. Mr. Martin is the Qualified Person responsible for the Mineral Reserve disclosure for the Bear River Zeolite Project. The estimate has been completed in accordance with the definitions and disclosure standards of SEC Regulation S-K 1300.
The estimate is based on all drilling, sampling, and technical data available through May 22, 2024, which corresponds to the date of the most recent topographic survey (digital elevation model) for the project. The Qualified Person completed and signed off on this Mineral Reserve estimate as of May 31, 2025, and the effective date of the estimate is May 22, 2024, as stated herein. The block model and pit shell supporting this estimate incorporate the May 22, 2024, topographic survey.
The Reserve estimate is based on the Measured and Indicated portions of the Mineral Resource model described in Section 11, after application of appropriate modifying factors. The inputs used reflect both current operational parameters and assumptions derived from the site’s continuous mining and processing history since the early 2000s.
The point of reference for the Mineral Reserve estimate is in situ tonnage at the pit crest, prior to dilution or mining losses, but after application of economic and geotechnical constraints.
12.2 Reserve Classification Confidence
Mineral Reserves have been classified as Proven or Probable based on the level of confidence in the underlying resource classification, geologic continuity, data quality, and the application of modifying factors. Measured Resources converted within the pit design are classified as Proven Reserves. Indicated Resources converted within the pit design are classified as Probable Reserves.
12.3 Reserve Estimation Methodology
A 3-D pit shell analysis using Colorado School of Mines MineFlow™ program was performed using the Mineral Resource block model to define an economically mineable pit. The pit geometry was based on geotechnical parameters, economic inputs, and operating assumptions provided by BRZ management and validated by the QP.
Reserve blocks were selected within the maximum profit pit shell. The Reserve excludes inferred material and any blocks outside the company property boundaries.
12.4 Modifying Factors
The following inputs were applied:
| · | Long-term zeolite product price: $287.93/ton | |
| · | Specific Gravity of Zeolite 2.2 g/cc (14.57 cu ft/ton) (See Section 11.7) | |
| · | Specific Gravity of Rhyolite Tuff 2.6 g/cc (12.33 cu ft/ton) Midpoint of common range of specific gravity for this rock type found through internet research (2.4-2.8 g/cc) |
| GeoGRAFX GIS Services | July 2, 2025 |
| Bear River Zeolite Project Franklin County, USA | Page: 175 |
| · | Specific Gravity of Topsoil 2.6 g/cc (12.33 cu ft/con) low end of common range of mineral based topsoil (2.6-2.8 g/cc) | |
| · | Mining cost: $7.50/ton mined | |
| · | Processing cost: $159.24/ton processed | |
| · | General & administrative (G&A): $76.19/ton processed | |
| · | Processing recovery: 100% | |
| · | Mining dilution and loss: 0% dilution, 100% recovery | |
| · | Slope angles and geotechnical criteria: 45 degree average slope | |
| · | Property Boundary Limits: No mining allowed beyond company boundary |
Note: Long term product price, Mining cost, processing cost, and G&A cost were taken from an email written by Jeff Fink (VP and General Manager of Bear River Zeolite) to Joe Bardswich on May 16, 2025.
12.5 Ore Selection Analysis
For this deposit, zeolite ore is considered to be any model blocks which exceed a CEC value of 100. Because of the way the grade model was constructed, there are no zeolite blocks below a grade of 100 CEC. In practice, zeolite is mined based on visual appearance, and no grade controls are currently in effect. The overall average CEC value for the zeolite being extracted is approximately 146. As long as gross revenue per ton exceeds the cost of mining and processing, the zeolite grading 100 CEC or greater, is considered “ore.”
The factor which ultimately controls which blocks of zeolite can be mined for profit is the strip ratio (tons of waste mined per ton of zeolite_. For this particular deposit, most of the zeolite is located very close to the surface, and the strip ratio is very low. There are a few zones of zeolite that are somewhat thin, or relatively deep, for which the cost of removing waste in order to extract the zeolite is so great as to make these blocks uneconomic. There are also portions of the zeolite which can’t be mined because they would require the removal of waste rock that is beyond the company boundary.
12.6 Mineral Reserve Estimate
The Mineral Reserves for the Bear River Zeolite Project are summarized in Table 12-1 below:
Table 12-1 Mineral Reserve for Bear River Zeolite Project
| Classification | Tonnage (kt) | Grade (CEC meq/100g) | Recovery (%) | Saleable Product (kt) |
| Proven | 2,267 | 147.0 | 100 | 2,267 |
| Probable | 2,860 (*) | 145.5 | 100 | 2,860 |
| Total | 5,127 (*) | 146.2 | 100 | 5,127 |
(*)The Probable tonnage has been reduced by the estimated amount of ore production for the one year period from May 22, 2024 (topography survey date) to May 31, 2025 (effective date of this report. The estimated production is 12,600 tons (Based on memo from Jeff Fink to Joe Bardswich dated May 22, 2025. Number was rounded up to the nearest 100 tons from 12,550) . It has been removed from the probable category because all of the ore on the current production benches was classified as probable.
| GeoGRAFX GIS Services | July 2, 2025 |
| Bear River Zeolite Project Franklin County, USA | Page: 176 |
All values are reported as dry, in situ tons, exclusive of Mineral Resources, and rounded to reflect the level of accuracy appropriate for a Pre-Feasibility-level reserve estimate.
At current average annual production rates, the Proven and Probable Reserve could theoretically support operations for more than 400 years. This extended mine life reflects the modest scale of current throughput relative to the size of the reserve. Should production be scaled up significantly — e.g., by a factor of 20—the Reserve would still support operations for over 20 years, demonstrating the project's flexibility and longevity under a range of development scenarios.
No Inferred Resources were included in the Reserve estimate. All material classified as Reserve lies within the Measured and Indicated portions of the block model and within the Mineflow ™ ultimate shell based on a 100% revenue factor and limiting mined blocks to be within the company property lines.
Figure 12.6-1 presents a plan view of the 100% revenue factor pit shell generated using MineFlow™ software. The pit shell outlines the limits of economically mineable material based on input parameters such as commodity pricing, mining and processing costs, and recovery factors. Overlaid on the figure is the Bear River Zeolite Company’s ownership boundary (blue line), which was used to constrain the ultimate pit shape. The pit shell respects both economic viability and surface ownership and serves as the basis for reporting Mineral Reserves within the project area.
| GeoGRAFX GIS Services | July 2, 2025 |
| Bear River Zeolite Project Franklin County, USA | Page: 177 |
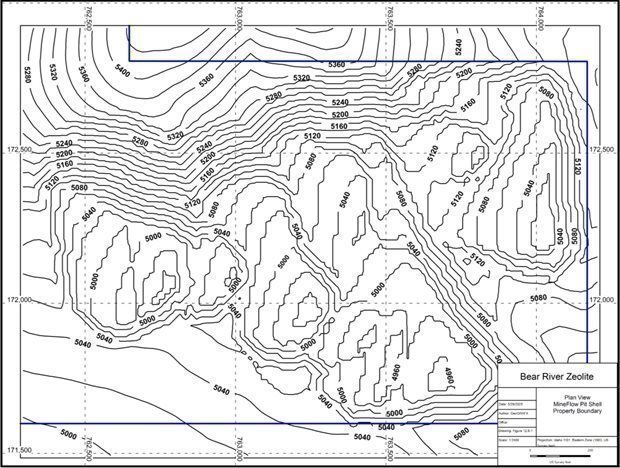
Figure 12.6-1 Plan view of Mineflow™ 100% profit shell and ownership boundary
Figure 12.6-2 provides an isometric view looking north, highlighting the distribution of modeled zeolite ore blocks (in red) that fall within the 100% revenue factor pit shell generated using MineFlow™. This figure illustrates the three-dimensional geometry, spatial continuity, and volume of mineable material classified as Mineral Reserves. It provides a visual representation of how the reserve estimate aligns with geologic modeling and economic constraints applied during pit optimization.
| GeoGRAFX GIS Services | July 2, 2025 |
| Bear River Zeolite Project Franklin County, USA | Page: 178 |
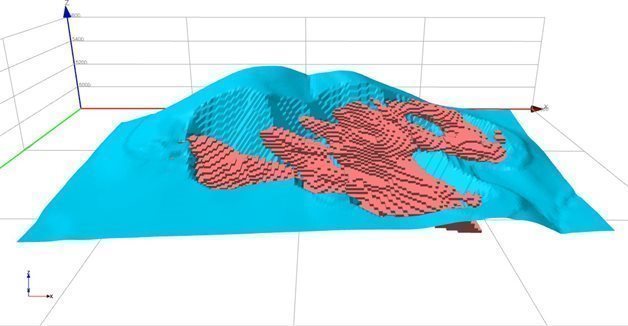
Figure 12.6-2 Isometric view of zeolite ore blocks within pit shell
12.7 Design Pit
To demonstrate medium to long term viability of this project, a pit was designed with the intention of mining 15 to 20 years of ore at the present production rate of 12,600 tons per year. The 3-D optimized shell was used as a guide. A 40 foot wide ramp was inserted for the last few levels to provide access. This width is sufficient for 2-way traffic for the Cat 740 articulated haul truck currently used on the property. Pit slope angle was 45 degrees.
Because the 3-D grade model was based on 12 foot benches, the design was made using 12 foot benches. After the design pit was evaluated on 12 foot bench intervals, results were re-apportioned to fit the operations current use of 20 foot bench heights, with 5150 toe elevation being one of the bench levels.
12,600 ore tons were removed from the upper benches in order to account for production that has occurred during the period from when the project topography was analyzed with a flyover on May 22, 2024.
All ore contained within this pit is of the Probable category. There is no proven ore, based on the mineral resource. By inspecting the drillhole collar locations in the area of the pit design, it can be seen that only two drillholes are within 150 feet (BRZ24-001 and BRZ24-002). There are six other holes within 300 feet, but these are all over 200 feet away.
Table 12-2 below summarizes the distribution of ore and waste tonnage by 20-foot pit bench intervals within the designed reserve pit. For each bench, the average cation exchange capacity (CEC) grade is reported for ore blocks, along with the calculated waste-to-ore ratio. These data support the reserve estimate by detailing the vertical distribution of mineable material and associated waste. The bench-by- bench breakdown aids in evaluating pit phasing, scheduling, and equipment planning.
| GeoGRAFX GIS Services | July 2, 2025 |
| Bear River Zeolite Project Franklin County, USA | Page: 179 |
Table 12-2 Ore and waste tonnage by pit bench elevation
| Bench Toe (Ft) | Ore Tons(1) | CEC meq/100g | Waste Tons | Total Tons | W:O Ratio |
| 5190 | 0 | 0 | 1,274 | 1,274 | 99.90 |
| 5170 | 0 | 0 | 5,551 | 5,551 | 99.90 |
| 5150 | 0 | 0 | 10,059 | 10,059 | 99.90 |
| 5130 | 15,511 | 155 | 19,732 | 35,243 | 1.27 |
| 5110 | 72,453 | 154 | 9,538 | 81,992 | 0.13 |
| 5090 | 73,762 | 153 | 8,585 | 82,346 | 0.12 |
| 5070 | 51,858 | 149 | 3,736 | 55,594 | 0.07 |
| 5050 | 19,391 | 146 | 534 | 19,925 | 0.03 |
| Total | 232,975 | 152 | 59,008 | 291,983 | 0.25 |
| (1) | 12,600 tons of ore were removed from the upper benches to account for one year of production. |
Figure 12.7-1 presents a top-down contour map of the final pit design, based on the 100% revenue factor shell, with 12-foot elevation intervals. This visualization highlights the pit geometry, bench layout, and depth progression across the deposit. The map serves as a spatial reference for evaluating access, haulage planning, and mine scheduling considerations.
| GeoGRAFX GIS Services | July 2, 2025 |
| Bear River Zeolite Project Franklin County, USA | Page: 180 |
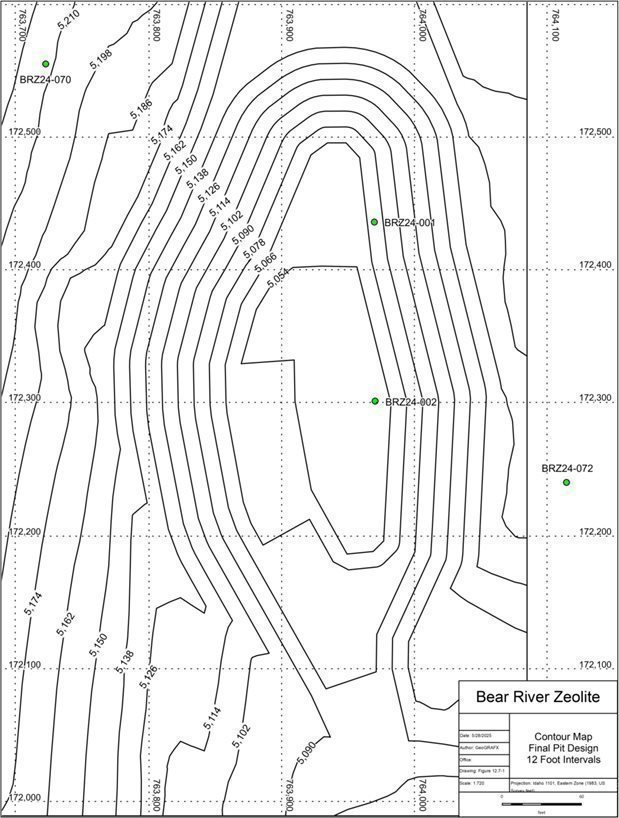
Figure 12.7-1 Contour map of final pit design at 12-foot elevation intervals.
| GeoGRAFX GIS Services | July 2, 2025 |
| Bear River Zeolite Project Franklin County, USA | Page: 181 |
12.8 Risk Factors Affecting Reserves
The QP considers the following risk factors could materially affect the Reserve estimate:
| · | Market price volatility for zeolite products | |
| · | Variability in mineralogy or quality (e.g., CEC, % clinoptilolite, absorbency) | |
| · | Cost escalation in mining, fuel, haulage, or processing | |
| · | Environmental or permitting risks | |
| · | Transport and logistics bottlenecks | |
| · | Geological variability not captured by current drilling |
12.9 Recommendations
The QP recommends that additional holes be drilled in the vicinity of the current pit. Eight holes can be added in this area which will create an approximate 100x100 foot grid. This increased drillhole density should be enough to allow the conversion of most material in the current pit area from Probable to Proven.
12.10 Qualified Person’s Statement
In the opinion of the undersigned Qualified Person, the Reserve estimate presented herein is valid and reflects reasonable assumptions regarding modifying factors, economic inputs, and geotechnical constraints. This estimate supports the classification of the Bear River Zeolite Project as a production- stage property under SEC Regulation S-K 1300, based on ongoing operations and the demonstrated viability of extracting and processing the material under current conditions.
Randall K Martin, SME Registered Member 4063888
May 31, 2025
| GeoGRAFX GIS Services | July 2, 2025 |
| Bear River Zeolite Project Franklin County, USA | Page: 182 |
13 Mining Methods
131 Introduction
The Bear River Zeolite operations have used conventional truck and loader, open-pit mining methods to provide feed for the crushing- screening-packaging plant. Figure 13.1-1 provides an aerial view of the Bear River Zeolite mine site as it appeared in May 2024, showing the active pit, surrounding topography, and haul roads in relation to the stockpile storage facilities.
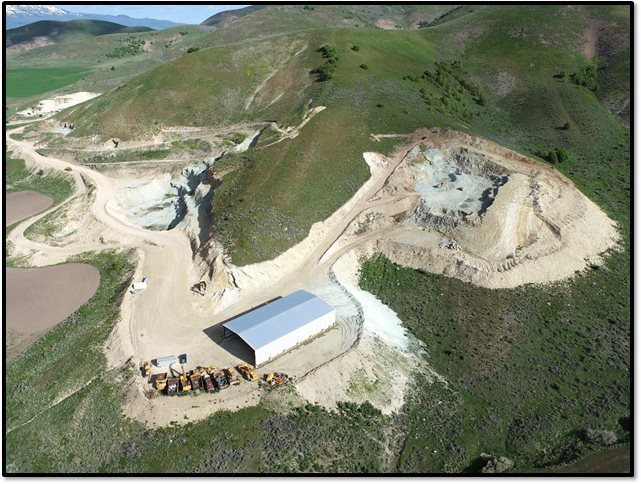
Figure 13.1-1 Drone image of Bear River Zeolite mine site, haul roads, and stockpile shelter (May 2024).
The mine has been in continuous operation since 2002. Up until 2024 there have been no formal reports detailing resources/reserves, no formal mining plan existed, and no reclamation plan had been developed. Areas to be mined appear to have been chosen on the basis of the whims of the driller or the loader operator. No surveys of pre or post mining operations were conducted, leading to accidental trespass onto adjacent property (owned by the lessor) and investigations by the Bureau of Land Management (BLM) into possible trespass onto federal land administered by the BLM. (BRZ surveys in 2024 show there was no trespass onto BLM lands). In the past, operations appear to have been negatively affected by a lack of working capital. Equipment appears to have been chosen and purchased based on what used equipment dealers had available at low prices. Substantially more equipment that has been parked on the mine site and at the plant site was in a non-operable state (or unsafe operating condition) as compared to operable equipment for several years. A salvage sale was held during the summer of 2024, and this boneyard of junk equipment was removed from the mine and plant sites. Improvements in planning and operations have been made in 2024, and additional improvements are planned for 2025. Both a mining plan and a reclamation plan need to be developed to minimize duplication of work and reduce costs.
| GeoGRAFX GIS Services | July 2, 2025 |
| Bear River Zeolite Project Franklin County, USA | Page: 183 |
13.2 Geotechnical Considerations
The zeolite bearing rock of the Salt Lake Formation is remarkably consistent on the BRZ leased properties. There are no faults or other structures leading to dangerous or unsafe mining conditions. Topography is favorable, allowing the mining operation to be continued from the lower (south) end without requiring operations to be conducted beneath high pit walls. The ore body is of sufficient size that pit wall slope angles can be very conservative without materially affecting mining costs.
13.3 Hydrogeological Considerations
The present BRZ zeolite mining operations occupy the lower edge of a significant hill side of zeolite. The water table is estimated to be at least two hundred and fifty (250) feet below the mine floor based on the nearby Glendale Reservoir elevation of 1509 feet and the reservoir is approximately three thousand feet west-southwest of the active pit and 2200 feet southwest of the original pit. The 2024 drill program indicated that there is water in fractures in several locations within the orebody. This water is attributed to rainwater and snow-melt water that has accumulated in cracks and fractures, well above the water table. There is a small flow of water indicated in the glory hole (original pit) that has been excavated in the south-central portion of the mine. It is recommended elsewhere in this report that the glory hole should be backfilled with waste rock material to enhance safety and provide a start on the reclamation program. This flow of water should be addressed prior to backfilling so that the water can continue to flow southerly without ponding or becoming a potential hazard to ongoing operations. This can be managed by creation of a “French Drain” by using coarse zeolite from the stockpiled blasted rock in the quarry.
13.4 Mine Design
The recommended design consists of quarry benches of twenty (20) feet in height. On the sloping ground the initial cuts will probably range from 10 to 25 feet in height. Subsequent benches should be twenty feet in height. Critical to the design and operation of an efficient quarry, it is imperative that bench floor elevations be chosen for each lift and that survey control be exercised such that pit floors will be flat, without humps, dips, or areas of deep broken material. Proper floors will reduce tire and track wear, improve machine operation on flat surfaces and eliminate ponding which will cause wet material to end up in the process plant.
It is anticipated that it will be several decades before “final pit walls” need to be established as it is envisaged that the “high wall” will be the north wall and will retreat northerly as the zeolite is mined. For increased safety, it is recommended that a maximum 45-degree slope “semi-final” wall be maintained by offsetting the next lower bench of the excavation twenty (20) feet to the south. There is no financial incentive to make this wall steeper.
| GeoGRAFX GIS Services | July 2, 2025 |
| Bear River Zeolite Project Franklin County, USA | Page: 184 |
13.5 Dilution and Recovery Factors
No mining dilution factor has been applied to the Mineral Reserve estimate. Due to the exceptional visual contrast between ore and waste at the Bear River Zeolite site, selective mining techniques and straightforward deposit geometry allow for clean separation of mineralized material.
Mining recovery is assumed to be 100%, reflecting the operational ability to extract blasted ore from the muckpile with minimal loss, based on historical practices and current pit floor control. The Qualified Person considers this assumption reasonable given the deposit characteristics, mining methods, and operating scale.
13.6 Mining Method
In previous years, BRZ drilled and blasted small areas using 2.5-inch to 3-inch diameter holes with pneumatic crawler drills (Ingersoll Rand LM 200) powered by diesel air compressors. Hole depths ranged from 10 to 30 feet and were drilled on a tight 3- to 4-foot spacing, which is unusually dense for this rock type. Poor blasting practices are suspected to have contributed to issues such as incomplete explosive column placement, backbreak, and irregular pit floors. These conditions resulted in oversize material, accelerated equipment wear, and frequent breakdowns. The company later adopted hydraulic drilling and, at times, experimented with ripping the ore using a large dozer. While ripping was occasionally successful, it placed significant strain on the equipment and often led to downtime and oversized boulders.
Since mid-2024, BRZ has adopted a more professional and consistent approach by contracting a drill and blast specialist. This method has proven more efficient for achieving proper fragmentation and floor control. Moving forward, Phase III of the mine plan is expected to utilize conventional quarry-style drilling and blasting on 20-foot benches using 4-inch diameter holes on a 9-foot x 9-foot pattern. The Phase III area lies between the former glory hole excavation and the eastern zone previously blasted by McCallum Rock Drilling. This area corresponds to the northern edge of the 2024 drill-defined Proven and Probable Mineral Reserve, where the MineFlow modeling effort (see Section 12) estimated approximately 5.127 million short tons of quality-grade zeolite. The projected mine life is based on these currently delineated Reserves and assumes an average annual production rate of 12,600 short tons.
Under these conditions, the Reserve could theoretically support operations for more than 400 years. Although this marks the current limit of Reserve classification, the north wall of Phase III is not considered a final pit boundary. Future drilling to the north may delineate additional mineralized material that could expand the mine plan.
13.7 Stripping and Backfilling
The proposed Phase III mining area is currently covered by a shaly limestone overburden that will need to be stripped prior to ore extraction. Overburden removal will be conducted using either a Caterpillar D8K dozer or an excavator, depending on terrain and equipment availability. The material will be stripped from a ridge of higher ground located between the former “glory hole” excavation and the eastern portion of the property that has already been drilled and blasted.
Stripped overburden is planned for progressive backfilling of the historical excavation area (glory hole) to eliminate this safety hazard and as part of an early-stage reclamation initiative. This strategy is intended to enhance site safety, reduce the volume of material requiring future reclamation handling, and limit the project's long-term environmental footprint. Even though resource modeling has confirmed the presence of significant zeolite mineralization below the current mining depth, extending beneath the glory hole and surrounding areas, the extensive quantities of zeolite above this elevation dictates that backfilling will not adversely affect the quantity of zeolite available to be mined for more than 100 years.
| GeoGRAFX GIS Services | July 2, 2025 |
| Bear River Zeolite Project Franklin County, USA | Page: 185 |
The stripping operation will be preceded by construction of a high-quality haul road, designed to provide safe and efficient access to the ridge for equipment and personnel. The road will also facilitate future access to elevated areas to the north, where additional zeolite resources may be outlined through subsequent exploration.
13.8 Blasting and Explosives
In the earlier years at the BRZ pit the company hired employees to drill and blast, originally utilizing pneumatic “air-trac” type crawler units powered by 600 or 750 CFM (cubic feet per minute) diesel powered compressors, progressing to self-contained diesel-powered hydraulic drill units. Equipment downtime, high repair costs, skilled labor shortages (driller and blaster, realizing how critical they were to production were often difficult to manage) and other factors pressured the company to assess ripping using large bulldozers. Ripping met with limited success, depending on rock quality factors, equipment operator skills and downtime of the bulldozer. In some cases, large boulders were created by the ripping operation and then became a handling problem in that they were too large for the crusher.
Starting in July 2024, BRZ contracted with a drill and blast contractor (McCallum Rock Drilling, Chehalis, WA) to drill and blast 34,463 cubic yards (63,400 tons) of zeolite, in a single blast, sufficient zeolite material for four (4) to five (5) years of production at current rates of 12,000 tons per year. The cost was $126,824 for 34,463 cubic yards. At measured Specific Gravity of 2.18, one bank cubic yard of zeolite weighs 1.84 US short tons (2000 pounds per ton) so 34,463 cubic yards equal 63,412 tons blasted. McCallum drilled the shot off utilizing a modern Furukawa 1450 diesel-powered hydraulic crawler drill rig to drill 4-inch diameter holes on a 9-foot x 9-foot pattern to a nominal depth of twenty-three feet. The blast was designed to be a 20-foot cut with three feet of sub-drill, however, variations in the pit floor elevations required extensive adjustments for the uneven floor topography. The blast was designed so that all the holes terminated at the same elevation so that a flat pit floor would be realized. Sufficient explosives for the blast were trucked in by McCallum, their personnel loaded and shot the blast and then trucked all their explosives off site. BRZ management has been satisfied with the fragmentation and ease of “mucking out” and loading into the low-profile articulated CAT 940 dump truck. It is recommended that BRZ no longer stores explosives on site and returns the existing explosives and magazines to the supplier.
13.9 Explosives Storage and Handling
All explosives used in the BRZ operation have been transported to the mine site utilizing approved US Department of Transportation (DOT) methods and handling procedures. Once on site, all explosive materials have been stored in the Bureau of Alcohol, Tobacco, and Firearms (BATF) approved explosives magazines, which were designed and comply with all applicable fire codes, BATF security standards and industry safety standards. With the very successful results from the contract with McCallum, it was recommended that BRZ continue to contract out their blasting requirements, terminate the storage of explosives on site and suspend or cancel the magazine licenses that are issued, administered and inspected by the Dept. of Homeland Security, Bureau of Alcohol, Tobacco and Firearms (ATF).
| GeoGRAFX GIS Services | July 2, 2025 |
| Bear River Zeolite Project Franklin County, USA | Page: 186 |
13.10 Grade Control and Production Monitoring
The quality of this zeolite deposit is such that visual identification of the green zeolite by geologists and lay persons alike has been sufficient, in the past, to control the grade being delivered to the plant. The 2024 drill program, after involving over one thousand assay determinations, verified the consistency of visual examinations being able to select the green zeolite material with high Cation Equivalent Capacity. Apparently, in previous years the determination was usually made by the two-man mining crew. With the completion of the 2024 drill program, it is now possible to identify buried zeolite, formulate a mining plan and proceed with overburden stripping, access road construction and the preparation of large areas for future blasting in a professional manner.
13.11 Production Schedule
Mining rates in previous years were dependent on the level of sales and plant availability. It is acknowledged by the company that some sales have been lost because of an inability to supply due to plant or mine breakdowns. The company is now confident that the plant, after a string of six months with plant availability in the +90% range, can operate reliably for extended periods with minimal downtime for maintenance, without the history of failures which have resulted in extended periods of downtime in the past. With the large stockpile of blasted ore in the pit and in the two storage sheds, downtime caused by mine failures should be eliminated. Even if the truck and loader were to go down the excavator and a day rental highway dump truck could be utilized to restock the storage shed adjacent to the jaw crusher to keep the plant running at capacity.
13.12 Mining Fleet
Mining operations at the Bear River Zeolite site are supported by a small but functional fleet of mobile equipment owned and operated by the company. The fleet is composed of Caterpillar and Komatsu units for excavation, hauling, and support activities. While most major production tasks are handled by the articulated haul truck, loader, excavator, and dozer, a range of support vehicles—including a grader, water truck, forklift, and crane—are also present on site. The equipment varies in age and usage hours, with some units approaching or exceeding 10,000 operating hours.
Table 13-1 summarizes the primary mobile equipment fleet used in active mine operations.
Table 13-1 Mobile Equipment Fleet Supporting Bear River Zeolite Operations
| Equip Type | Manuf. | Model | Hours |
| Skidsteer | CAT | CAT 262D | 9,105 |
| Skidsteer | CAT | CAT 262D | 9,588 |
| Loader | CAT | CAT 928G | 13,843 |
| Dozer | CAT | CAT D8T | 12,505 |
| Excavator | CAT | CAT 336FL | 7,784 |
| Articulated Truck | CAT | CAT 740 | 11,198 |
| Grader | CAT | CAT 12H | 9,576 |
| Forklift | CAT | P5000C | 6,198 |
| GeoGRAFX GIS Services | July 2, 2025 |
| Bear River Zeolite Project Franklin County, USA | Page: 187 |
| Equip Type | Manuf. | Model | Hours |
| Loader | Komatsu | KOM WA-475-10 | 1,390 |
| Crane | Link Belt | LINKBELT HSP-18 | unknown |
| Water Truck | Freightliner | 2000 gal tank | unknown |
| Pickup | Dodge | with 100 gal fuel tank | unknown |
The listed equipment supports all key site activities, including mining, haulage, road maintenance, materials handling, and minor construction. While some units have high accumulated operating hours, they are maintained as needed by the site crew, with contractor or rental support available as contingency. All equipment is diesel-powered and refueled on site using dyed #2 diesel, which is stored in an aboveground storage tank (AST) located near the mine site (see Section 15 – Infrastructure). As operations continue, the company may consider rotating out older equipment in favor of more reliable or cost-effective replacements.
13.13 Personnel
The mine operating personnel consists of an operator and a truck driver. The two-man crew loads the blasted rock with either the loader or excavator and hauls it to one of the storage sheds. The cycle time is approximately 30 minutes to the shed near the jaw crusher. The priority is to keep the shed at the jaw crusher supplied with a ready source of dry ore for feeding into the plant with the secondary shed being used as a backup in the event of wet weather.
At a production rate of 1500 tons per 22-day month, an average of seventy tons per day is required. This is equivalent to four truckloads. The two miners also assist in access road maintenance, dust control utilizing the water truck, snow plowing when required and as welders, fabricators and mechanics at the plant when required.
13.14 Operations
The active pit, on the southeastern edge of the leased property, is approximately five thousand feet via mine road to the jaw crusher and ore storage building in a north westerly direction. Zeolite is excavated from the “muckpile” of previously blasted ore in the south-eastern pit. The general layout of the current and former zeolite pits, site infrastructure (including ore storage and support buildings), haul roads is shown in Figure 13.14-1
| GeoGRAFX GIS Services | July 2, 2025 |
| Bear River Zeolite Project Franklin County, USA | Page: 188 |
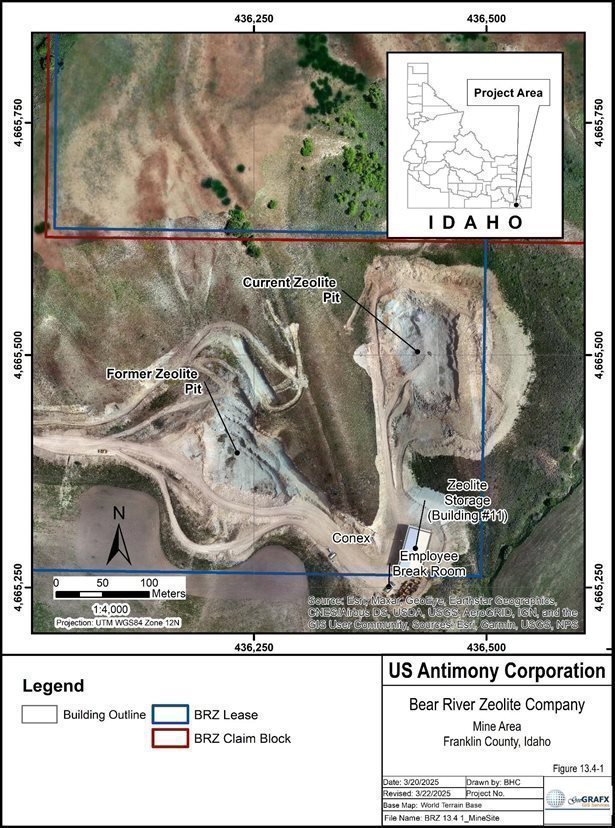
Figure 13.14-1 Bear River Mine Site Layout
| GeoGRAFX GIS Services | July 2, 2025 |
| Bear River Zeolite Project Franklin County, USA | Page: 189 |
13.15 Recommendations
The Qualified Person offers the following recommendations to enhance mining efficiency, safety, and operational planning at the Bear River Zeolite site:
| 1. | Formalize Mine Planning Practices | |
| It is recommended that BRZ develop and maintain an annually updated mine plan that incorporates current survey data, ore modeling, and planned production sequencing. This will help avoid unplanned pit advancement and ensure more efficient use of resources. | ||
| 2. | Implement Survey Control and Floor Design Standards | |
| Consistent use of survey control and elevation targets should be used during blasting and mucking to maintain flat pit floors, reduce equipment wear, and prevent water ponding. | ||
| 3. | Continue Use of Contract Drilling and Blasting Services | |
| Professional blasting conducted by third-party specialists has significantly improved fragmentation and pit floor quality. It is recommended that BRZ continue with this approach to avoid the operational inefficiencies previously associated with in-house drilling and blasting. | ||
| 4. | Prioritize Haul Road Design and Construction | |
| Safe, durable haul roads with proper drainage and geometry should be prioritized as part of pit expansion to reduce maintenance costs and improve cycle times. Future road designs should also allow for potential pit expansion to the north. | ||
| 5. | Advance Backfilling of Legacy Excavations | |
| As overburden is stripped during Phase III development, backfilling of the legacy “glory hole” should continue to reduce the long-term reclamation footprint and improve site safety. However, permanent backfilling will be deferred to preserve access to underlying mineralized material identified in the current resource model. | ||
| 6. | Evaluate Equipment Condition and Fleet Renewal | |
| With several units nearing or exceeding 10,000 operating hours, periodic review of equipment condition and strategic replacement or supplementation (via rental or purchase) is recommended to reduce the risk of extended downtime. |
| GeoGRAFX GIS Services | July 2, 2025 |
| Bear River Zeolite Project Franklin County, USA | Page: 190 |
14 Process and Recovery Methods
The Bear River Zeolite (BRZ) operation utilizes a conventional crushing and screening process to produce a range of zeolite products. This method is widely used in the industrial minerals industry and does not involve any chemical processing, flotation, or concentration techniques. No reagents, additives, or solvents are used in the processing circuit.
Construction of the operating plant commenced in 2000 to produce basically two zeolite products 14 x 40 (a-14 mesh +40 mesh granule) and minus 40 mesh (a powder). Limited sales began in the fourth quarter of 2001. Since its inception, the processing facilities have undergone routine upgrades to ensure they meet increased demand, accommodate additions to the product line, and minimize operational costs. These continuous improvements have been essential in keeping pace with the evolving market and technological advances.
Production has seen a steady increase from 100 tons in 2001 to over 10,000 tons in 2023. Production for the 12 months ending December 31, 2024, totaled 11,095 tons, an increase of 950 tons from the same time period in 2023.
14.1 Process Flowsheet and Equipment Description
Processing is conducted at the BRZ Processing Facility (Figure 14.1-1). The overall plant flow diagram is shown in Figure 14.2-1, with Line 1 and Line 2 screening circuits illustrated in Figure 14.2-2 and Figure 14.2-3, respectively.
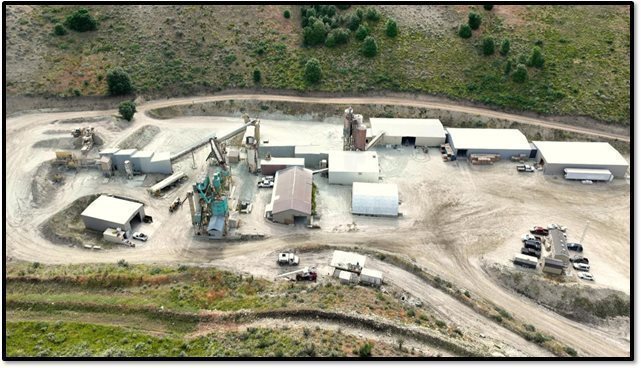
Figure 14.1-1 Bear River Processing Facility
| GeoGRAFX GIS Services | July 2, 2025 |
| Bear River Zeolite Project Franklin County, USA | Page: 191 |
Major processing steps include:
| · | Primary crushing: Zeolite is fed via a Stephens-Adamson 42” x 12’ apron feeder into a Pioneer 30” x 42” jaw crusher. | |
| · | Secondary crushing: The material passes through a Sepro 3’ standard cone crusher to produce a -¾” product. | |
| · | Screening and classification: Material is screened using multiple high-frequency screen decks and separated into coarse and fine product lines. |
| o | Line 1: Closed-circuit with a Jeffrey/Indresco 100 HP hammer mill and 4’ x 8’ Midwestern triple-deck screen. | |
| o | Line 2: Includes a 30” x 24” Jeffrey hammer mill in closed circuit with two 5’ x 7’ Midwestern Multi Vibe triple-deck screens. |
| · | Fine product screening: Final screening is conducted in Building 4 using Derrick twin-deck high- frequency screens and Midwest rotary screens to produce powder-grade material. | |
| · | Raymond Mill Circuit: Includes a 6058 high-side Raymond mill with dust collector and associated conveying/packaging infrastructure. |
| GeoGRAFX GIS Services | July 2, 2025 |
| Bear River Zeolite Project Franklin County, USA | Page: 192 |
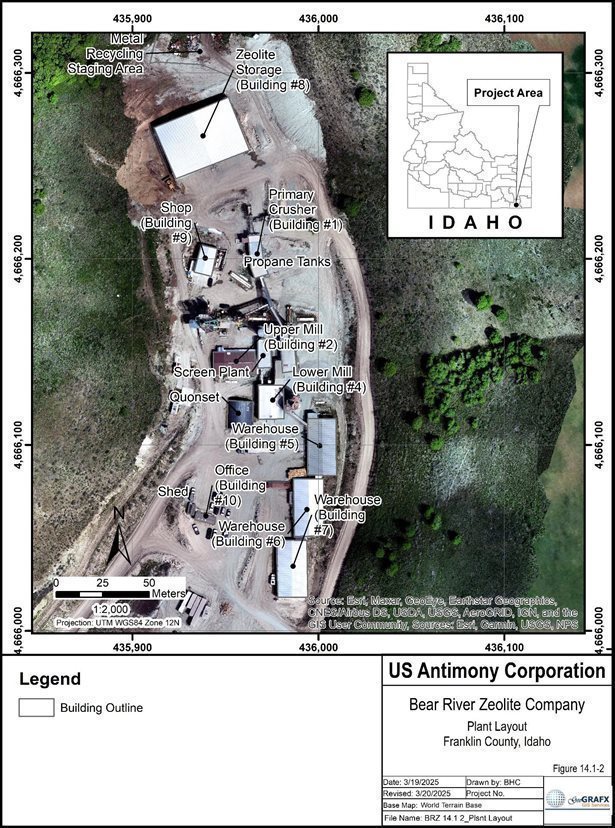
Figure 14.1-2 Processing Facility
| GeoGRAFX GIS Services | July 2, 2025 |
| Bear River Zeolite Project Franklin County, USA | Page: 193 |
14.2 Flowsheet
A flow diagram for the crushing and screening circuit is provided in Figure 14.2-1. The Line 1 screening circuit flowsheet is included as Figure 14.2-2. A simplified diagram showing the Line 2 screening circuit flowsheet is shown in Figure 14.2-3.
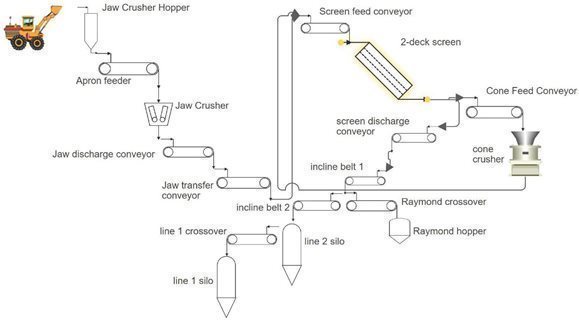
Figure 14.2-1 BRZ Crushing and Screening Circuit Flowsheet
| GeoGRAFX GIS Services | July 2, 2025 |
| Bear River Zeolite Project Franklin County, USA | Page: 194 |
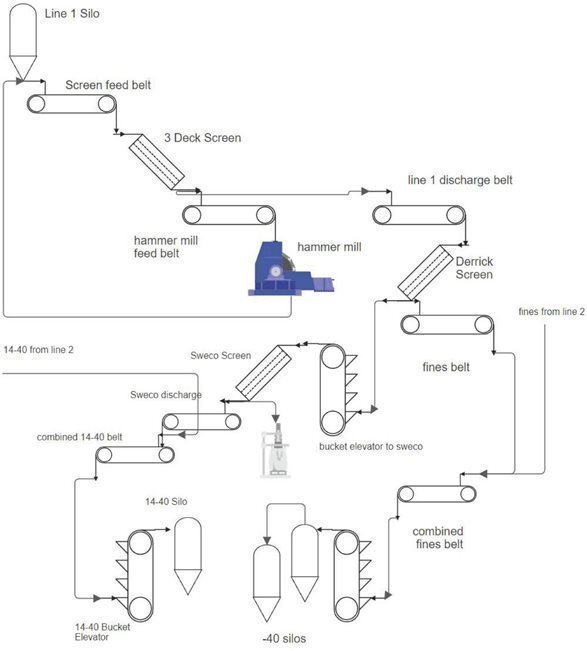
Figure 14.2-2 BRZ Line 1 Screening Circuit Flowsheet
| GeoGRAFX GIS Services | July 2, 2025 |
| Bear River Zeolite Project Franklin County, USA | Page: 195 |
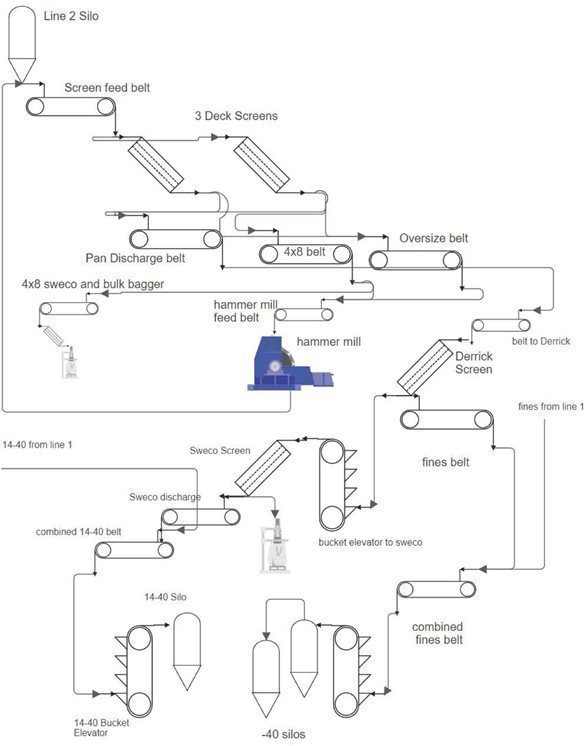
Figure 14.2-3 BRZ Line 2 Screening Circuit Flowsheet
| GeoGRAFX GIS Services | July 2, 2025 |
|
|
| Bear River Zeolite Project Franklin County, USA | Page: 196 |
14.3 Plant Throughput and Design
The processing facility has expanded in recent years to accommodate higher demand. Throughput rates have increased from approximately 4 tons per hour to 10 tons per hour, with further upgrades projected to reach 14–18 tons per hour by year-end 2025.
Improvements under the current operations team include:
|
| · | Reassembly and repair of the cone crusher and jaw crusher liner replacement. |
|
|
|
|
|
| · | Reinforcement of the cone crusher base and recommissioning by the OEM. |
|
|
|
|
|
| · | Implementation of preventative maintenance protocols. |
|
|
|
|
|
| · | Debottlenecking and process refinements. |
As of the most recent reporting period (Fiscal Year 2024), the Bear River Zeolite plant produced 11,095 short tons of zeolite product, representing an increase of 950 short tons over 2023. A comparison of first quarter production results shows continued growth, with 2,271 short tons produced in Q1 2024 and 3,797 short tons in Q1 2025—an increase of 1,526 short tons. The plant currently operates at a throughput rate of approximately 12,600 short tons per year, consistent with current market demand and sales volume.
14.3.1 Overview
Operations begin at the mine with drilling and blasting, followed by hauling material to one of the two storage sheds where dryness of the material is maintained during periods of inclement weather. The one shed is close to the plant and the material can be easily fed by a rubber-tired loader. The crushing screening operation is as described above in section 14.1 and detailed in the flowsheet diagrams Figure 14.2-1through Figure 14.2-3.
14.3.2 Packaging
Product from the silos can be loaded into bulk trucks, bulk bags, or transported to a semi-automatic packaging machine for packaging into. bags varying in size from 25 to 55 pounds. The packaging process involves manually loading an empty bag into the machine, which then automatically fills it to the correct weight before placing it onto a conveyor belt. On the conveyor, the bag is heat-sealed, date-stamped, and manually stacked onto pallets.
The packaging line for small bags operates at an average rate of approximately 4 tons per hour, depending on bag size and whether the product is boxed. Bulk bag packaging, in contrast, operates at a higher rate of approximately 10 tons per hour.
14.4 Process Facility Performance
As demand for products has grown over the years, the facility has expanded and enhanced its operations to maintain efficiency and scale production with customer needs. This includes optimizing equipment, improving workflows, and investing in newer technologies to handle larger volumes.
Since the arrival of a new General Manager in February 2024, the facility has made significant strides in reliability and performance. Major equipment failures were resolved, maintenance practices were overhauled, and operational efficiencies were improved, transforming the facility from frequent downtime to a stable and reliable operation.
| GeoGRAFX GIS Services | July 2, 2025 |
| Bear River Zeolite Project Franklin County, USA | Page: 197 |
A primary challenge was the cone crusher, which required reassembly and repairs due to installation issues and oversized rock caused by worn jaw crusher liners. In early March, the cone crusher was repaired and reassembled, and the jaw crusher liners were replaced, significantly reducing unplanned downtime. In April, the cone crusher was reinstalled on a professionally engineered base and recommissioned by the manufacturer, ensuring full reliability. Since then, there have been no major unplanned downtime events.
Additionally, general maintenance practices were enhanced through the implementation of preventative maintenance protocols and timely corrective repairs, many of which had been deferred. These improvements have increased overall efficiency and equipment longevity.
Optimization efforts, including process refinements and debottlenecking, have already increased screening and crushing rates from approximately 4 tons per hour to 10 tons per hour. With further planned improvements, including an upcoming outage on the Line 1 hammermill, throughput is expected to reach 14-18 tons per hour by year-end.
These enhancements are reflected in a production increase from 10,145 tons in 2023 to 11,095 tons in 2024. First quarter 2025 production totaled 3,802 short tons, up from 2,273 short tons in Q1 2024—an increase of 1,529 short tons year-over-year. This growth underscores the effectiveness of recent equipment and operational enhancements.
14.5 Equipment Specifications
A full inventory of major processing equipment by building is provided below.
|
| · | Primary Crusher: A 1979 Portec Inc. jaw crusher with a maximum capacity of 300 tons per hour, replacing an older 1973 model. |
|
|
|
|
|
| · | Building No. 1: |
|
| o | Cone Crusher: A 2022 Sepro Mineral Systems BH100 cone crusher, capacity of 100 tons per hour, replacing a 1958 Nordberg crusher. |
|
|
|
|
|
| o | Kohlberg Screen: A 1981 Kolberg 2D-612 screen, 5 ft. by 12 ft., capacity of 254 tons per hour. |
|
| · | Building No. 2: |
|
| o | Hammer Mill: A 1993 Jeffrey/Indresco WB-Hog 34-SS hammer mill, capacity of 10 tons per hour, replacing an older Philadelphia hammer mill. |
|
|
|
|
|
| o | Midwest Screen: A 1991 Midwestern MEV48.3 screen, 4 ft. by 8 ft., capacity of 154 tons per hour. |
|
|
|
|
|
| · | Building No. 3: |
|
| o | Hammer Mill: A 1994 Jeffrey Swinghammer Shredder 30x24 hammer mill, capacity of 10 tons per hour. |
|
|
|
|
|
| o | Two (2) Midwest Multi Vibe Screens: 1985 Midwestern MTV 57-3V86 5 ft. by 7 ft. Multi Vibe Screens |
|
|
|
|
|
| o | Midwest Screen (Sweco Copy): A Midwestern (Sweco copy) 4 ft. diameter screen. |
| GeoGRAFX GIS Services | July 2, 2025 |
| Bear River Zeolite Project Franklin County, USA | Page: 198 |
|
| · | Building No. 4 (Fine Products Mill): |
|
| o | Midwest Screen (Sweco Copy): A 2023 Midwestern (Sweco copy) MR60C88 60 in. diameter screen. |
|
|
|
|
|
| o | Midwest Screen (Sweco Copy): A 2022 Midwestern (Sweco copy) 48 in. diameter screen. |
|
|
|
|
|
| o | Derrick Screen: A 1995 Derrick K36-1280-3DD 3 ft. by 10 ft. screen. |
|
|
|
|
|
| o | Derrick Screen: A 1995 Derrick K36-1280-3DD 3 ft. by 10 ft. screen. |
|
|
|
|
|
| o | Alston Power – Roller Mill: A 1979 Alstom Power 6058 roller mill, capacity of 15 tons per hour. |
14.6 Power, Water, and Process Materials
14.6.1 Power
BRZ is currently utilizing power from a 750 KVA transformer. This transformer is capable of providing power to the existing equipment and systems within its rated capacity. At present, the total power demand is approximately 50% of the transformer’s full capacity when all equipment is running simultaneously. The existing power infrastructure can accommodate the ongoing load with room for expansion or fluctuations.
In addition to the 750 KVA transformer, there is an extra 2000 KVA of available power that can be utilized if demand increases in the future. This extra 2000 KVA provides a substantial buffer for scaling up operations without the immediate need for additional transformers or power infrastructure, allowing for flexibility in future expansion.
14.6.2 Water
The current operations are entirely dry and do not require water. The only water used is for dust control on site roads, utilizing the water truck, which is sourced from a pond located on the farm property where the site is leased.
Future upgrades to produce high-margin specialty products would require water. A well, approximately 500 feet deep, is available for this purpose, with an estimated installation cost of $95,000. Additionally, water rights would be required for any consumption exceeding 2,500 gallons per day, but should be reasonably priced.
14.6.3 Consumables
The processes have minimal need for consumables. The primary consumables required are maintenance wear parts, such as crusher hammers and liners, along with packaging materials, including bags, pallets, and plastic wrap.
| GeoGRAFX GIS Services | July 2, 2025 |
| Bear River Zeolite Project Franklin County, USA | Page: 199 |
14.7 Personnel
The plant currently employs 22 hourly and 2 salaried employees across two shifts. There is a readily accessible local labor market for general workers.
14.8 Conclusion
The crushing and screening methods used at Bear River Zeolite are proven, well-established, and appropriate for the mineralization type. No experimental methods are in use. The facility is stable, efficient, and capable of further expansion to meet market demand.
| GeoGRAFX GIS Services | July 2, 2025 |
| Bear River Zeolite Project Franklin County, USA | Page: 200 |
15 Infrastructure
15.1 Overview
All infrastructure necessary to support operations at the Bear River Zeolite Mine has been fully installed or constructed, has been operational since the mine commenced production in 2021, and has been upgraded as necessary to meet production objectives. The operation includes a primary open pit mine located to the east of the processing facility. A previous pit, closer to the plant was previously mined until access problems arose. The processing facility comprises the Primary and Secondary Crushing circuit, two tertiary crushing circuits, final screening, and packaging.
To ensure safety and security, access to active mining and processing areas is restricted by fencing, locked gates, and topographical barriers. The mine site is supported by essential utilities, including electricity, telephone, internet, and radio communications.
On-site infrastructure encompasses administrative offices, maintenance facilities, a warehouse, two ore storage sheds and various ancillary structures. The site also includes open pit mining areas, crushing and conveying systems, and the process facility.
A detailed layout of the site infrastructure is presented in Figure 15.1-1– BRZ Site Infrastructure, showing roads, pit boundaries, plant facilities, and support buildings. Additional layout references include Figure 14.1-2 (Production Facilities) and Figure 13.4-1 (Mine Site Layout).
This extensive infrastructure is integral to Bear River Zeolite’s ability to efficiently mine, crush, screen, package, and distribute zeolite products to a broad range of clients.
| GeoGRAFX GIS Services | July 2, 2025 |
| Bear River Zeolite Project Franklin County, USA | Page: 201 |
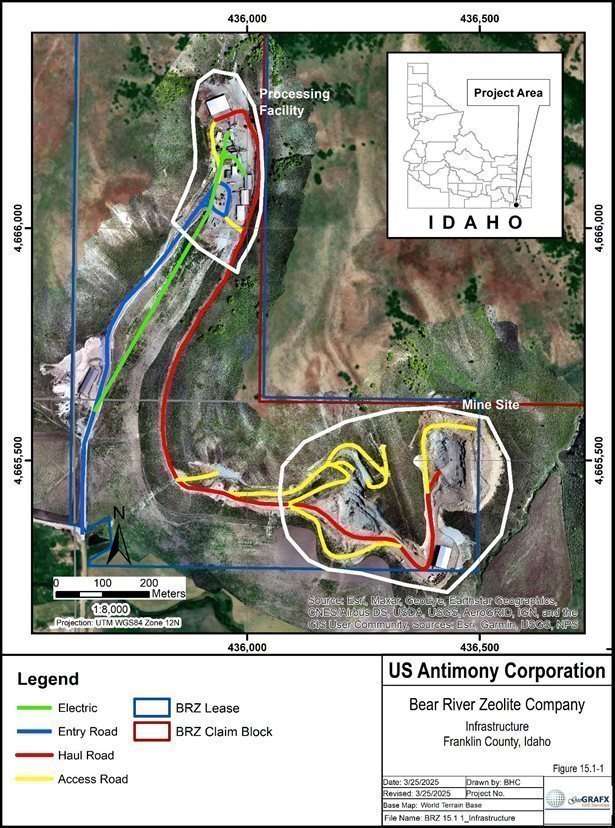
Figure 15.1-1 BRZ Site Infrastructure
| GeoGRAFX GIS Services | July 2, 2025 |
| Bear River Zeolite Project Franklin County, USA | Page: 202 |
15.2 Roads and Logistics
The Bear River Zeolite mine, located near Preston, Idaho, is strategically positioned near major interstate highways, providing efficient access to key regional and national transportation networks. The town of Preston is in close proximity to Interstate 15, a vital north-south corridor linking Salt Lake City, Utah and Pocatello, Idaho and only twenty-seven miles north of Logan, Utah via US Highway 91.
The primary access route to the Bear River Zeolite plant from Preston is via paved Highway ID-34, traveling 1.8 miles north to East Glendale Road. From this point, continue east on the paved Glendale Road for four miles until reaching the intersection with gravel road N2200 E. Turn left and proceed north for 0.5 miles to reach the processing plant, warehouses, and office building. This access route is amenable for highway flat-bed and van transport trucks.
Mine operations areas are accessible via the mine access road that begins at the office parking lot. In addition, various unpaved roads within and surrounding the Mine Operations area are regularly maintained by Bear River Zeolite to facilitate the movement of both light vehicles and heavy mobile equipment. Highway semi-trucks access
15.3 Rail and Transport
Preston, Idaho, is served by two major rail lines that provide essential connectivity for freight transport. The first is the Union Pacific Railroad, a prominent railroad operating throughout the western United States. The Rocky Mountain division of Union Pacific, via the Cache Valley branch, offers rail access to Preston. This branch runs 51.1 miles northward from Cache Junction, Utah, and terminates in Preston, facilitating transportation to key regions.
The second rail service is provided by Burlington Northern Santa Fe (BNSF) Railway, another major U.S. railroad that connects industrial and commercial centers across the country. Although BNSF does not directly serve Preston, its primary routes run through other parts of Idaho, including the city of Pocatello, a significant transportation hub. From Pocatello, freight can be transferred to regional lines or trucks for delivery to and from the BRZ plant at Preston, ensuring efficient access to broader markets.
Both Union Pacific and BNSF are integral to the region's transportation infrastructure, linking Preston to national and international markets.
In 2019, United States Antimony Corporation (USAC) announced plans to provide rail delivery of bulk zeolite from the Bear River Zeolite mine (Yahoo Finance, 2019).
15.4 Stockpiles
There is currently no active top-soil stockpiles maintained at the site beyond those used in daily operations. If topsoil stripping becomes necessary in future expansions, stockpiles will be established near stripping and reclamation areas and seeded with approved interim seed mixes to prevent erosion and weed encroachment.
15.5 Waste Rock Storage Facilities
Due to the bulk nature and low strip ratio of the zeolite deposit, BRZ generates minimal waste. Waste Rock Storage Facilities (WRSFs) common to most open pit mines are located and designed to minimize environmental impact and prevent contamination (e.g., Acid Mine Drainage from sulphides in the waste rock) of nearby water sources. Waste rock generated during mining is inert and not subject to acid rock drainage (ARD). It is primarily used for road construction and site reclamation. No large-scale Waste Rock Storage Facilities (WRSFs) have been constructed or are required at this time.
| GeoGRAFX GIS Services | July 2, 2025 |
| Bear River Zeolite Project Franklin County, USA | Page: 203 |
15.6 Water Management
Industrial water for dust suppression and general site use is sourced from a well located on the least private property under lease agreements with the private landowner. A water truck is used to distribute water where needed to control dust emissions and maintain operational safety.
Surface water runoff is managed through engineered drainage channels to prevent uncontrolled discharge and minimize environmental impact. The site operates under a valid Air Quality Permit to Construct (PTC), which includes provisions for water usage and dust control.
15.7 Water Supply
Potable water is delivered to mine site by Culligan. Water for dust suppression is sourced from a well located on leased private property, in accordance with agreements between BRZ and the landowner. Water is stored and distributed using site tanks and a water truck as required.
15.8 Site Buildings and Facilities
Bear River Zeolite (BRZ) has developed a robust infrastructure to support its mining operations, as depicted in Figure 14.1.2. The central administration and office facilities are strategically located near the processing areas to facilitate operational efficiency, including the loading of highway transport trucks and issuance of documents and Bills of Lading. Most of the buildings on-site are constructed with slab-on-grade concrete foundations, featuring steel framing and durable steel or aluminum siding and roofing, ensuring structural integrity and longevity. Additionally, the site includes several Conex shipping containers, which are primarily utilized for storage purposes.
The mine site also includes an employee break room. Nearby, Zeolite Storage Building #11 is situated in close proximity to the operation, providing essential storage capacity for the materials associated with the mining process.
To ensure proper sanitation, the site is equipped with 4-stall portable bathroom trailer as well as multiple portable toilets, which are regularly serviced by a local waste management company. This system ensures that the site maintains operational efficiency while adhering to environmental and health standards.
15.9 Camps and Accommodation
There is no on-site accommodation available for employees at the Bear River Operations. Instead, employees reside in nearby communities, where they have access to local housing and amenities. This arrangement ensures that the workforce can live in close proximity to the operation (with their family in most instances) while maintaining access to essential services and facilities in the surrounding area.
| GeoGRAFX GIS Services | July 2, 2025 |
| Bear River Zeolite Project Franklin County, USA | Page: 204 |
15.10 Power and Electrical
Electric power is provided by Rocky Mountain Power via a 12,470 V transmission line entering the site from Glendale Road. The current plant is served by a 750 KVA transformer, which operates at approximately 50% capacity during peak load.
Rocky Mountain Power has confirmed capacity for an additional 2,000 KVA of transformer capacity, which can provide all the power needed for future expansion.
15.11 Communications
The site is equipped with reliable internet and communication systems:
|
| · | Internet: Dual connections via Rise Broadband (point-to-point wireless) and Starlink satellite. These are managed through a SonicWall firewall configured to automatically failover between services. |
|
| · | Wi-Fi: Distributed across site buildings using Ubiquiti switches and access points with 2.4/5 GHz bridges. WiFi is also supplied through 4 buildings via Ubiquiti AP’s. |
|
| · | VoIP phone system: Operates over the site's internet network. In the event of a total internet outage, VoIP phones become non-functional. |
|
| · | Cellular: A Verizon signal booster improves reception within the main office. Wi-Fi calling is enabled on most devices. |
|
| · | Radio A site-wide radio system, including a repeater and dedicated frequencies, provides consistent communication between field personnel and mobile equipment. |
All network systems are protected with battery backups to ensure communication continuity during short-term outages.
Power and Communication Outage Contingency
All networking and communications equipment is supported by uninterruptible power supplies (UPS), providing at least 15 minutes of backup power during short-duration outages.
In the event of a total internet failure, two-way radios provide the primary means of intra-site communication. If a critical incident occurs alongside a total communications loss, personnel can reach Verizon cellular signal hotspots located on-site.
15.12 Fuel Storage
Fuel infrastructure includes:
|
| · | One 2,000-gallon aboveground storage tank (AST) for dyed #2 diesel located in proximity to the mine site |
|
|
|
|
|
| · | One 200-gallon mobile tank mounted on a pickup for in-field refueling |
|
|
|
|
|
| · | One skid-mounted unleaded gasoline tank for small engines on welders and pumps |
These systems ensure a consistent fuel supply for mobile equipment and generators.
| GeoGRAFX GIS Services | July 2, 2025 |
| Bear River Zeolite Project Franklin County, USA | Page: 205 |
15.13 Qualified Person’s Opinion
The Qualified Person has reviewed all available information on infrastructure at the Bear River Zeolite site and confirms that the infrastructure necessary to support the life-of-mine (LOM) plan is in place and fully operational. No material infrastructure gaps have been identified that would impede current or planned operations.
| Bear River Zeolite Project Franklin County, USA | Page: 206 |
16 Market Studies and Contracts
16.1 Market Overview
Natural zeolites are crystalline, microporous minerals formed over thousands of years through the interaction of volcanic ash and non-saline water. Known for their exceptional adsorption capacity, ion exchange efficiency, molecular sieve capabilities, and filtration properties, they are integral to industries such as agriculture, construction, and water treatment. Among the various types, clinoptilolite is the most widely utilized, accounting for 40% of global market revenue in 2023, with key applications in soil conditioning, environmental remediation, and improving the durability of construction materials.
According to Acumen Research and Consulting, the global natural zeolite market was valued at USD 7.3 billion in 2023 and is projected to reach USD 9.4 billion by 2032, reflecting a compound annual growth rate (CAGR) of 2.9% from 2024 to 2032. This growth is driven by rising demand in agriculture, water treatment, and environmental sectors, alongside a global shift toward sustainable and eco-friendly industrial inputs.
The Bear River Zeolite Mine is a fully developed and operating mine and processing facility. Bear River Zeolite (BRZ) holds an estimated 22% share of the North American natural zeolite market, underscoring its strategic role as a regional supplier. Table 16-1summarizes BRZ’s market share by application.
Table 16-1 Bear River Zeolite Market Share by Application
| Application Area | Market Share (%) | Description |
| Agriculture | 30% | Soil conditioners, water retention, and nutrient delivery in crop production. |
| Animal Feed | 25% | Feed additives for improved digestion and toxin absorption in livestock. |
| Water Treatment | 20% | Removal of heavy metals, ammonia, and contaminants from water supplies. |
| Environmental Cleanup | 15% | Cleanup of hazardous waste and remediation of contaminated soils. |
| Odor Control | 10% | Zeolite-based solutions for controlling odors in industrial and residential areas. |
Figure 16.1-1 Displays the distribution of Bear River Zeolite's market share across key application areas. Agriculture leads with 30%, followed by animal feed and water treatment.
| GeoGRAFX GIS Services | July 2, 2025 |
| Bear River Zeolite Project Franklin County, USA | Page: 207 |
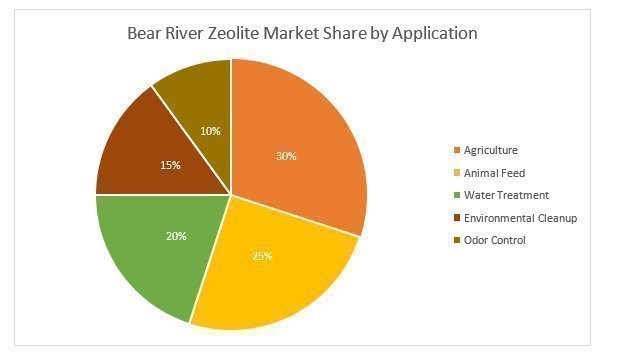
Figure 16.1-1 Bear River Zeolite Market Share by Application
In August 2024, BRZ introduced "CattleMax™," a zeolite-based feed additive targeting the livestock industry. This product is designed to enhance animal health and productivity by leveraging zeolite's properties. At that time, the animal feed sector contributed approximately 25% to BRZ's revenue, and the company sought to increase its market share in this segment.
To meet rising demand across its customer base, BRZ anticipates the need to increase production capacity and throughput at its facility, including expanded crushing, screening, and packaging operations.
16.2 Product Portfolio
Bear River Zeolite (BRZ) produces a range of clinoptilolite-based natural zeolite products designed for diverse industry applications. The BRZ clinoptilolite is ultra-pure natural zeolite with high adsorption capacities and is recognized as one of the highest quality products on the market. Their product portfolio includes:
|
| · | Granular Zeolite: Coarse-grain zeolite available in various mesh sizes used for water filtration, including industrial and mine discharge water, soil conditioning in agriculture, and managing livestock odor and waste. |
|
|
|
|
|
| · | Powdered Zeolite: Fine, micronized zeolite powder. Key applications include animal feed additives to improve digestion and toxin absorption, environmental remediation such as heavy metal and toxin removal from water, and as an additive in lightweight concrete and construction materials. |
|
|
|
|
|
| · | Zeolite for Soil Amendment: Tailored grades of zeolite for agricultural use. This product enhances water retention, nutrient delivery in soils, and reduces fertilizer runoff, contributing to improved plant growth. |
| GeoGRAFX GIS Services | July 2, 2025 |
| Bear River Zeolite Project Franklin County, USA | Page: 208 |
|
| · | Zeolite for Animal Feed: Food-grade zeolite formulations for livestock. These products act as toxin binders to support animal health and reduce ammonia and odors in manure. |
|
|
|
|
|
| · | Specialized Zeolite Blends: Custom blends of zeolite for specific purposes. These include applications in cat litter for odor control, absorbents for industrial spills, and wastewater treatment to remove ammonia, heavy metals, and other contaminants. |
Bear River continues to emphasize the diverse applications of its clinoptilolite zeolite, which boasts a high cation-exchange capacity and minimal clay content. The company's product portfolio caters to sectors such as agriculture, industrial processes, and household uses, underscoring zeolite's versatility.
16.3 Commodity Price Forecasts
The price of natural zeolite has historically varied based on quality, application, and market conditions. Table 16-2 presents historical price data compiled from U.S. Geological Survey Mineral Commodity Summaries and industry sources.
Table 16-2 Historical Natural Zeolite Price Range
| Year | Price Range (USD per Tonne) | Notes on Usage and Market Trends |
| 2013 | $50–300 | Used mainly for animal feed, odor control, and water purification. |
| 2014 | $50–300 | Demand remained stable in pet litter and construction applications. |
| 2015 | $50–300 | Increased use in synthetic turf and filtration media. |
| 2016 | $50–300 | Competitive products started influencing sales for pet litter. |
| 2017 | $100–300 | Prices rose slightly due to refined applications like soil amendments. |
| 2018 | $100–3,300 | Larger variability based on quality; average price ~$160/ton. |
| 2019 | $100–3,300 | Similar to 2018; higher-priced materials were used in niche markets. |
| 2020 | $50–300 | Steady demand in filtration and agricultural applications. |
| 2021 | $50–300 | Growth in synthetic turf and odor control applications. |
| 2022 | $50–300 | Continued stable prices despite increased usage in new markets. |
Price variability reflects differences in particle size, purity, and application. Lower-end prices are typical of bulk uses such as soil amendments, while higher-end pricing corresponds to specialty or industrial uses.
16.4 BRZ Product Pricing
BRZ’s average sales price per ton has remained relatively stable over the last decade, after adjusting for inflation. Table 16-3 summarizes BRZ’s average sales price per ton from 2013 through 2024. For the twelve months ending December 31, 2024, BRZ’s average sales price increased to $264 per ton, reflecting improved product quality, packaging customization, and increased demand.
Table 16-3 BRZ Average Sale Price per Ton Sold (2013-2024)
| Year | Avg. Price (USD/t) |
| 2013 | $197 |
| 2014 | $196 |
| 2015 | $173 |
| GeoGRAFX GIS Services | July 2, 2025 |
| Bear River Zeolite Project Franklin County, USA | Page: 209 |
| Year | Avg. Price (USD/t) |
| 2016 | $188 |
| 2017 | $183 |
| 2018 | $186 |
| 2019 | $192 |
| 2020 | $199 |
| 2021 | $221 |
| 2022 | $242 |
| 2023 | $243 |
| 2024 | $264 |
Average zeolite prices vary depending on product grade, particle size, and packaging requirements. Premium pricing is typically associated with granular and blended grades due to higher production and handling costs, as well as different packaging requirements requested by the customer.
BRZ anticipates a 10% price increase in 2025 across most product categories, excluding lower-value byproducts. The projected increase is supported by growing market demand and operational improvements implemented in 2024.
16.5 Mining, Processing, and Cost Structure
BRZ benefits from a large, easily mined zeolite deposit with a low strip ratio, enabling cost-effective open-pit mining. In July 2024, a contractor drilled and blasted 63,300 tons of zeolite at a unit cost of $2.00 per ton. Mining is currently handled by a two-person crew, with haulage to the processing plant or temporary ore sheds. Daily truck activity is minimal, and production could be scaled significantly without increasing manpower or equipment.
The bulk of BRZ’s production costs are associated with crushing, screening, and packaging to produce the size ranges required by customers. Prior to 2024, the operation was impacted by downtime due to aging equipment, limited maintenance, and operational inefficiencies. In 2024, corrective actions included:
|
| · | Replacing or repairing critical plant equipment |
|
|
|
|
|
| · | Implementing a preventive maintenance system |
|
|
|
|
|
| · | Hiring qualified plant and site management personnel |
These actions resulted in higher operating costs in 2024 but are expected to improve efficiency and reduce costs in subsequent years.
16.6 Contracts
BRZ has been selling zeolite products on the open market since 2001. Sales are transacted under short- term or spot-market purchase agreements, with pricing determined through direct negotiation between BRZ and its customers.
| GeoGRAFX GIS Services | July 2, 2025 |
| Bear River Zeolite Project Franklin County, USA | Page: 210 |
No long-term offtake, transportation, or hedging agreements are currently in place. All commercial terms are confidential but are consistent with standard industry practices
16.7 Qualified Person Statement
The Qualified Persons (QPs) have reviewed the marketing, pricing, sales, and contract information provided by BRZ. This information has been verified against internal records and aligns with publicly available market and industry data. The QPs consider the market assumptions and associated data presented herein to be reasonable and suitable for use in mine planning, economic analysis, and financial projections for the Bear River Mine as presented in this Report.
| GeoGRAFX GIS Services | July 2, 2025 |
| Bear River Zeolite Project Franklin County, USA | Page: 211 |
17 Environmental Studies, Permitting, and Plans, Negotiations, or Agreements with Local Individuals or Groups
17.1 Introduction
The Bear River Zeolite property includes both private leased ground and adjacent federal (BLM- managed) mining claims. Current mining and processing operations are located entirely on the privately leased portion of the property. No baseline or supporting environmental studies were required for the Bear River Zeolite Mine. All necessary permits to operate have been obtained and are detailed below. Each permit application addresses the potential environmental impacts of the operation, includes provisions for monitoring, and incorporates a reclamation or closure plan where applicable.
17.2 Baseline and Supporting Studies
In Idaho, the requirement for baseline studies in surface mining operations became effective on May 31, 1972, with the enactment of the Idaho Surface Mining Act. This act mandates that all surface mining operations affecting land after this date must comply with its provisions, including conducting necessary baseline studies Minerals Regulatory Program Procedures.
Additionally, the Idaho Administrative Code requires that operators submit a complete application package for each separate mine or mine panel before a reclamation plan will be approved. This package must include a map or maps of the proposed mining operation, among other requirements.
Existing correspondence with government agencies regarding permitting the Bear River Zeolite Mine in 2000 makes no reference to baseline studies being required for permitting.
Although no comprehensive baseline and supporting studies were required for the Bear River Zeolite Mine, which is located on private land, all necessary permits to operate have been obtained and are detailed below. Since the mine operates on private property, the permitting requirements are primarily governed by state regulations rather than federal land use regulations. The permitting process has been conducted in full compliance with applicable state and local laws, with relevant authorities, such as the Idaho Department of Lands (IDL) and the Idaho Department of Environmental Quality (DEQ), reviewing and approving all necessary operational, environmental, and reclamation plans. While baseline environmental impact studies were not mandated for the project, the mine is fully permitted and adheres to the required environmental standards, ensuring that operations are conducted in an environmentally responsible manner.
Although the Bear River Zeolite mine site is located entirely on private land and not subject to federal permitting triggers, baseline environmental information was compiled in accordance with SEC Regulation S-K 1300 requirements. This assessment serves to inform stakeholders and support responsible project planning. No field studies have been conducted.
17.2.1 Land Use
A baseline data review of the land use and history within the Bear River Project area was performed in March 2025. The review included summarizing the past and present land uses and coalescing of information from historic reports and studies. A summary is included below.
| GeoGRAFX GIS Services | July 2, 2025 |
| Bear River Zeolite Project Franklin County, USA | Page: 212 |
The Bear River Zeolite Mine in Franklin County, Idaho, is situated on land that has undergone significant transformations over the past 140 years. Originally settled in the late 19th century by members of The Church of Jesus Christ of Latter-day Saints (LDS Church), the region was primarily used for agriculture and livestock grazing. Early settlers introduced irrigation, allowing for wheat, barley, and alfalfa cultivation, while cattle and sheep ranching became prominent in the early 20th century. By the mid- 1900s, mechanized farming and improved irrigation further expanded agricultural productivity, solidifying Franklin County’s reputation as an agricultural hub.
In the late 20th and early 21st centuries, land use diversified with the discovery and mining of zeolite, a valuable industrial mineral. The Bear River Zeolite Mine, established in the early 2000s, marked a shift from solely agricultural land use to a combination of mining and agriculture. The mine has played a role in economic growth, employment, and industrial development while adhering to state environmental regulations. Given that the mine operates on private land, baseline environmental studies were not explicitly required during permitting. However, best management practices (BMPs) have been implemented to mitigate environmental impacts, ensuring sustainable operations. Franklin County’s land use planning continues to balance industrial development with environmental and agricultural preservation, reflecting the region’s dynamic economic and technological progress.
17.2.2 Climatology
BRZ has commissioned the installation of a meteorological weather station to be installed at the mine site to monitor and record weather conditions in real-time and compile the data into an online accessible database. The installation should be completed by Q2 2025.
17.2.2.1 Site Weather Station Data
The meteorological weather station will be equipped with wireless communication technology, enabling seamless data transmission from the station’s data logger to the central monitoring system. This system continuously collects and records key meteorological parameters, including temperature, precipitation, wind speed and direction, and atmospheric pressure.
The collected weather data is systematically reviewed, analyzed, and compiled into monthly, quarterly, and annual reports to ensure accurate environmental monitoring and compliance with regulatory requirements. The station operates as part of an integrated remote monitoring system, which includes a rain gauge, temperature and wind sensors, and compatibility with Wunderground and other meteorological networks to enhance data accuracy and accessibility.
17.2.2.2 Surrounding Stations for Historic Record
There are more than six weather stations located within a 20 mile radius of the mine site that monitor snowpack and meteorological conditions, providing valuable data for water resource management and weather forecasting in the region. Several stations may be used to approximate the historic meteorological conditions at the Bear River Mine Site.
The months of April, May, and July typically receive the highest precipitation, with average monthly depths of 2.00 inches, 3.15 inches, and 2.47 inches, respectively. In contrast, the driest months tend to be December, January, and February, with average monthly precipitation depths of 0.77 inches, 0.60 inches, and 0.82 inches, respectively. The average annual precipitation for the area is estimated to be 17.74 inches.
| GeoGRAFX GIS Services | July 2, 2025 |
| Bear River Zeolite Project Franklin County, USA | Page: 213 |
17.2.3 Air Quality
In Idaho, the Idaho Department of Environmental Quality (DEQ) regulates air emissions through permits such as the Permit to Construct (PTC) for new or modified sources and the Tier I (Title V) and Tier II Operating Permits for larger facilities. These permits ensure compliance with state and federal air quality regulations, including the Clean Air Act. The DEQ reviews applications, evaluates emission controls, and monitors compliance to protect air quality in the state.
DEQ issued Bear River Zeolite Company (BRZ) an Air Quality Permit to Construct (PTC) No. P-2007.0025, on June 8, 2007 for their facility near Preston, Idaho, authorizing the installation and operation of specific equipment and outlines operational requirements to ensure compliance with air quality standards. The permit was revised on January 29, 2025, to reflect updates and modifications to BRZ's operations.
17.2.3.1 Crushing Operation
Zeolite ore is transported from the mine site to the primary crusher where it is routed through a series of Jaw crushers, mills, and screens to be processed to the desired size. Emissions from any vent, stack, or functionally equivalent opening associated with crushing operations must not exceed 20% opacity for a period or periods aggregating more than three minutes in any 60-minute period as required by IDAPA 58.01.01.625. Opacity must be determined by the procedures contained in IDAPA 58.01.01.625.
The crushing operation air quality plan must contain measures to control and minimize emissions from material processing activities. It includes details on permitted equipment, such as crushers, screens, and conveyors, along with their capacities and emission control systems. The plan outlines dust suppression methods, including water sprays, enclosures, and baghouses, to prevent airborne particulate matter. It also establishes monitoring requirements to track emissions, equipment performance, and compliance with air quality standards. Additionally, the plan includes recordkeeping procedures, maintenance schedules for emission control devices, and staff training to ensure proper implementation. Contingency measures for equipment malfunctions and high-dust conditions are also addressed, ensuring compliance with Idaho Department of Environmental Quality (DEQ) regulations.
According to the permit, BRZ must not produce more than 480 tons per day of bagged zeolite. BRZ must operate a baghouse on the primary crushing building, the secondar crushing building, the coarse crushing building, and the fine products building to control PM emissions from the crushing, milling, and screening operations in those buildings.
Permitted Equipment:
|
| · | Primary Crusher: A 1979 Portec Inc. jaw crusher with a maximum capacity of 300 tons per hour, replacing an older 1973 model. |
|
|
|
|
|
| · | Building No. 1 Equipment: |
|
| o | Cone Crusher: A 2022 Sepro Mineral Systems BH100 cone crusher, capacity of 100 tons per hour, replacing a 1958 Nordberg crusher. |
|
|
|
|
|
| o | Kohlberg Screen: A 1981 Kolberg 2D-612 screen, 5 ft. by 12 ft., capacity of 254 tons per hour. |
| Bear River Zeolite Project Franklin County, USA | Page: 214 |
|
| · | Building No. 2 Equipment: | |
|
|
|
|
|
|
|
| o | Hammer Mill: A 1993 Jeffrey/Indresco WB-Hog 34-SS hammer mill, capacity of 10 tons per hour, replacing an older Philadelphia hammer mill. |
|
|
|
|
|
|
|
| o | Midwest Screen: A 1991 Midwestern MEV48.3 screen, 4 ft. by 8 ft., capacity of 154 tons per hour. |
|
|
|
|
|
|
| · | Building No. 3 Equipment: | |
|
|
|
|
|
|
|
| o | Hammer Mill: A 1994 Jeffrey Swinghammer Shredder 30x24 hammer mill, capacity of 10 tons per hour. |
|
|
|
|
|
|
|
| o | Two (2) Midwest Multi Vibe Screens: 1985 Midewestern MTV 57-3V86 5 ft. by 7 ft. Multi Vibe Screens |
|
|
|
|
|
|
|
| o | Midwest Screen (Sweco Copy): A Midwestern (Sweco copy) 4 ft. diameter screen. |
|
|
|
|
|
|
| · | Building No. 4 (Fine Products Mill) Equipment: | |
|
|
|
|
|
|
|
| o | Midwest Screen (Sweco Copy): A 2023 Midwestern (Sweco copy) MR60C88 60 in. diameter screen. |
|
|
|
|
|
|
|
| o | Midwest Screen (Sweco Copy): A 2022 Midwestern (Sweco copy) 48 in. diameter screen. |
|
|
|
|
|
|
|
| o | Derrick Screen: A 1995 Derrick K36-1280-3DD 3 ft. by 10 ft. screen. |
|
|
|
|
|
|
|
| o | Derrick Screen: A 1995 Derrick K36-1280-3DD 3 ft. by 10 ft. screen. |
|
|
|
|
|
|
|
| o | Alstom Power – Roller Mill: A 1979 Alstom Power 6058 roller mill, capacity of 15 tons per hour. |
As required, BRZ performs regular inspections and maintenance of emission control systems as mandated to ensure optimal performance and compliance with air quality standards. BRZ maintains detailed records of equipment operations, emissions data, and maintenance activities. These records are available for review by the Idaho Department of Environmental Quality (DEQ) upon request. Contingency measures are in place for equipment malfunctions and high-dust conditions ensuring compliance with Idaho Department of Environmental Quality (DEQ) regulations.
17.2.3.2 Mining Operation
The mining operations consist of drilling, blasting, truck loading, and transporting of zeolite ore. According to the permit, visible fugitive emissions must not be observed leaving the property boundaries exceeding a period or periods aggregating more than three minutes in any 60-minute period. This visual determination is to be conducted using Method 22, 40 CFR 60, Appendix A.
BRZ has a Fugitive Dust Control plan in place, containing specific measures to prevent and reduce airborne dust emissions from the mining operation. It includes dust control strategies such as water application, chemical stabilizers, wind barriers, and proper material handling to minimize dust generation. The plan identifies sources of fugitive dust, including unpaved roads, stockpiles, and disturbed surfaces, and establishes monitoring procedures to ensure compliance with air quality standards. It also outlines recordkeeping requirements, staff training protocols, and contingency measures for high-wind events or equipment malfunctions. Additionally, the plan includes regular reporting guidelines and adherence to Idaho Department of Environmental Quality (DEQ) regulations to maintain compliance with state air quality standards.
| GeoGRAFX GIS Services | July 2, 2025 |
| Bear River Zeolite Project Franklin County, USA | Page: 215 |
17.2.4 Geochemistry
Zeolites, including those at the Bear River Zeolite Mine, typically do not produce acid mine drainage (AMD). Acid mine drainage is commonly associated with mining operations involving sulfur-containing minerals, such as pyrite, which can react with oxygen and water to form sulfuric acid. Since zeolites are a group of hydrated aluminosilicate minerals that do not contain sulfur-bearing minerals, they are generally not prone to generating AMD during extraction.
However, the potential for acid mine drainage at any mine site can depend on the specific geology of the area, the minerals present, and how the materials are processed. In the case of the Bear River Zeolite Mine, since the zeolites are typically non-acid-forming, they do not present the same risks for acid mine drainage as many other types of ore bodies.
17.2.5 Surface Water
17.2.5.1 Regional Hydrology
The Bear River Zeolite (BRZ) Project is located in southeastern Idaho, within the Bear River hydrologic basin. The Bear River itself lies approximately 10–15 miles southeast of the project area and is the principal surface water feature in the broader region. Local topography is characterized by rugged terrain and semi-arid uplands, with minimal perennial surface water.
The property is located within two separate sub-watersheds: Station Creek-Bear River to the north, and Worm Creek Watershed to the south (see Figure 17.2-1). The Station Creek–Bear River Watershed (HUC 160102020103) spans approximately 36,160 acres, while the Worm Creek Watershed (HUC 160102020104), located to the south, covers 34,720 acres.
This watershed includes the drainage area of Station Creek, a tributary that flows directly into the Bear River mainstem, just south of the Worm Creek confluence. The landscape is a mix of volcanic foothills, broad alluvial flats, and riparian corridors along Station Creek and the Bear River. Land uses in the watershed include grazing, irrigation agriculture, and residential development near the community of Preston. Station Creek is an intermittent stream, with hydrology dominated by spring runoff and shallow groundwater contributions. Portions of the Bear River Zeolite property lie within this watershed’s northern upland boundary. The area is not subject to federal hydrologic permitting but forms part of the larger Bear River basin that eventually discharges into the Great Salt Lake in Utah.
The project area is intersected by minor ephemeral drainage channels, typically dry for most of the year. These drainages may briefly carry surface runoff during spring snowmelt or following localized precipitation events.
Nearby intermittent watercourses, such as Maple Creek and Dry Creek, are hydrologically disconnected from the project site under normal flow conditions.
| GeoGRAFX GIS Services | July 2, 2025 |
| Bear River Zeolite Project Franklin County, USA | Page: 216 |
Surface drainage features are illustrated in Figure 17.2-11, which shows ephemeral and intermittent channels originating within the BRZ Project boundary and flowing southeastward toward the Bear River Basin. No perennial surface water features are present within the immediate vicinity of the mine.
17.2.5.2 Site Drainage and Water Management
There are no perennial surface water features on or immediately adjacent to the active mine or processing areas. The mining operation is conducted entirely as a dry process, with no use of chemical reagents or wet tailings.
Surface water management is addressed through the following:
|
| · | Stormwater control measures including berms, ditches, and grading to divert runoff away from disturbance areas. |
|
| · | Sediment control structures such as silt fences and straw wattles in areas susceptible to erosion. |
|
| · | Routine inspection and maintenance to ensure BMPs remain effective during storm events. |
The site does not discharge process water, and as such, no National Pollutant Discharge Elimination System (NPDES) permit is currently required or in place.
| GeoGRAFX GIS Services | July 2, 2025 |
| Bear River Zeolite Project Franklin County, USA | Page: 217 |
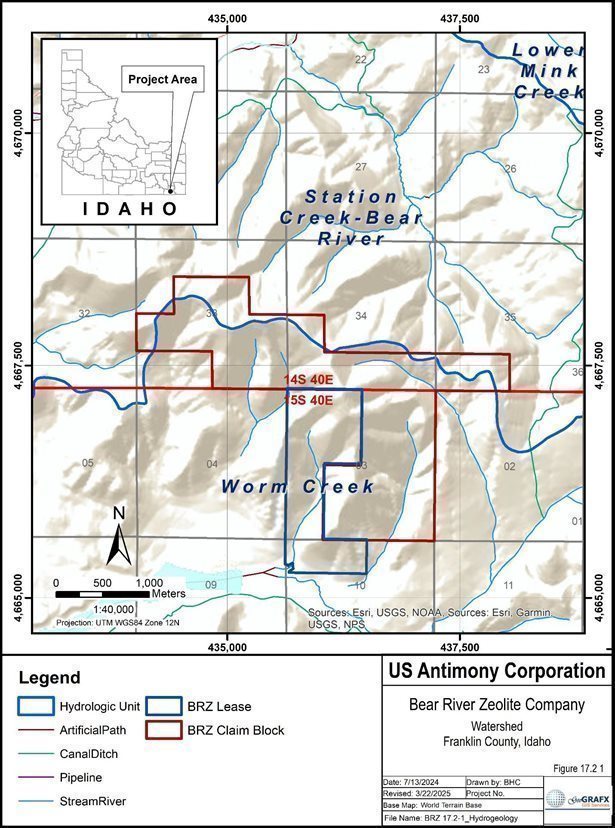
Figure 17.2-1 Surface Water
| GeoGRAFX GIS Services | July 2, 2025 |
| Bear River Zeolite Project Franklin County, USA | Page: 218 |
17.2.5.3 Surface Water Quality
There are no perennial water bodies on or immediately adjacent to the BRZ mine site. The site's arid to semi-arid climate means runoff is minimal for most of the year, and surface flows are typically limited to short-duration events.
Due to the absence of perennial water bodies within the project footprint, no baseline surface water sampling program has been required to date. Visual inspections during and after precipitation events have shown no evidence of runoff or sedimentation leaving the site boundaries.
There is no known contamination or discharge from the BRZ operation into nearby watercourses. The mining and processing activities are conducted in a manner that minimizes runoff, and existing infrastructure such as berms, silt fences, and catchment basins help control potential sediment transport.
If needed in the future, water quality monitoring could be established at designated low points or ephemeral drainage crossings as part of an adaptive management approach.
17.2.5.4 Regulatory Status and Compliance
|
| · | The site operates under Idaho Department of Environmental Quality (IDEQ) jurisdiction. |
|
| · | The operation is not located within a designated watershed protection area and is not known to affect any protected surface water resources. |
|
| · | No National Pollutant Discharge Elimination System (NPDES) permit has been required to date due to the absence of process water discharge to surface waters. |
|
| · | The mine operates as a dry mining operation; no tailings ponds or process effluent discharges are used that could impact nearby creeks or rivers. |
17.2.5.5 Potential Environmental Impacts and Mitigation
|
| · | The lack of continuous surface water limits the risk of direct discharge impacts. |
|
| · | During storm events, sediment transport is the primary concern. The company has implemented erosion and sediment control measures to address this. |
|
| · | Surface water protection is managed via BMPs (Best Management Practices) including grading, stormwater routing, and inspection/maintenance schedules. |
|
| · | A Stormwater Pollution Prevention Plan (SWPPP) is maintained as part of the mine's operational environmental management system. The SWPPP is currently being updated to reflect changes in management personnel and improvements to response procedures. |
17.2.5.6 Wetlands and Aquatic Resources
The National Wetlands Inventory (NWI) is a publicly available geospatial dataset developed and maintained by the U.S. Fish and Wildlife Service (USFWS) to provide a consistent, nationwide mapping of wetlands and surface water features. The NWI program classifies wetlands using the Cowardin system, which organizes wetland types based on hydrology, vegetation, and substrate. These data support land management, environmental permitting, conservation planning, and regulatory compliance, and are commonly used in early-stage environmental assessments.
| GeoGRAFX GIS Services | July 2, 2025 |
| Bear River Zeolite Project Franklin County, USA | Page: 219 |
Impacts to the National Wetlands Inventory (NWI) wetlands and other aquatic habitats may be subject to regulation under Section 404 of the Clean Water Act, or other State/Federal statutes. The project location overlaps the following wetlands shown in Figure 17.2-2 Bear River Project Wetland Areas.
NWI data are compiled through aerial imagery interpretation and limited field verification and are not intended to replace on-site delineation when required for regulatory purposes. However, they offer valuable baseline context in areas where wetland permitting is not triggered.
Although the Bear River Zeolite (BRZ) mine site is located entirely on private land and does not currently require federal permitting, a review of the NWI dataset was conducted in February 2025 as part of the baseline environmental studies to meet the requirements of SEC Regulation S-K 1300.
The NWI geospatial review identified three wetland types overlapping the BRZ property outline:
| Wetland Type | NWI Code | Cowardin Classification | Typical Description |
| Freshwater Emergent Wetland | PEM1C | Palustrine, Emergent, Persistent, Seasonally Flooded | Herbaceous wetlands dominated by grasses, sedges, or forbs. Found in low-lying areas or ephemeral drainages. |
| Freshwater Pond | PAB4F | Palustrine, Aquatic Bed, Algal, Semi- permanently Flooded | Small shallow ponds often filled by seasonal runoff and dominated by algal or submerged aquatic vegetation. |
| Riverine (Intermittent Stream) | R4SBC | Riverine, Intermittent, Streambed, Seasonally Flooded, Excavated | Ephemeral stream channels that convey surface flow seasonally. Often dry during summer and early fall. |
Figure 17.2-1 illustrates wetland features identified within and surrounding the Bear River Zeolite (BRZ) property boundary based on data from the U.S. Fish and Wildlife Service’s National Wetlands Inventory (NWI). The map displays the spatial relationship between NWI-classified wetlands and the BRZ project area, which includes the active lease boundary (outlined in blue) and the full claim block (outlined in red).
| GeoGRAFX GIS Services | July 2, 2025 |
| Bear River Zeolite Project Franklin County, USA | Page: 220 |
The wetlands shown are predominantly located south and west of the BRZ lease boundary, with portions of Riverine and Emergent wetlands extending into the southern portion of the project area. To clarify, the mine operating level is approximately 85 feet higher than the cultivated fields and associated wetland areas to the south, providing a clear topographic separation between operations and mapped hydrologic features. There are no active mining operations adjacent to the southwest corner of the property where the wetland hydrologic unit is located, and current site conditions do not present any direct surface water connectivity that would fall under U.S. Army Corps of Engineers jurisdiction. These features are non-jurisdictional under current site conditions but are documented here as part of SEC Regulation S-K 1300 baseline reporting.
| Bear River Zeolite Project | Page: 221 |
| Franklin County, USA |
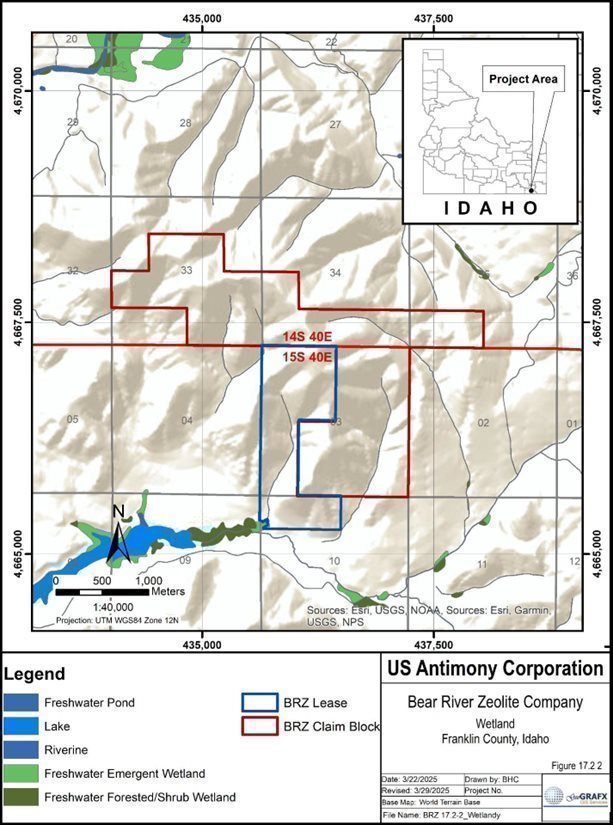
Figure 17.2-2 Bear River Project Wetland Areas
| GeoGRAFX GIS Services | July 2, 2025 |
| Bear River Zeolite Project | Page: 222 |
| Franklin County, USA |
17.2.6 Groundwater Resources
As part of the environmental baseline review for the Bear River Zeolite (BRZ) Project, available hydrogeologic data were reviewed to characterize groundwater occurrence, aquifer systems, and general groundwater use in the project vicinity. While the BRZ site is located on private land and is not currently subject to federal or state permitting, this information is provided in accordance with SEC Regulation S-K 1300 to inform stakeholders and support responsible resource development.
17.2.6.1 Regional Hydrogeology
The BRZ Project lies within the Bear River Basin, a structurally complex area underlain by a mixture of volcanic tuff, ash flows, basalt, and sedimentary units, along with unconsolidated alluvial and colluvial deposits in valley bottoms. Groundwater occurrence in the region varies by geologic formation:
|
| · | Shallow unconfined aquifers occur in alluvial materials near drainages and low-lying basins |
|
| · | Deeper confined or semi-confined aquifers may exist in fractured volcanic rock units |
|
| · | Local recharge occurs from precipitation, snowmelt, and mountain front runoff, with groundwater flow typically following topographic gradients toward the Bear River |
According to Idaho Department of Water Resources (IDWR) well log records and regional USGS hydrogeologic studies, most wells in the region are drilled to depths between 100 and 300 feet, with variable yields depending on geologic unit and fracture distribution.
17.2.6.2 Groundwater Use in the Vicinity
Groundwater use in the BRZ area is limited and primarily associated with:
|
| · | Domestic and agricultural wells on nearby private lands |
|
| · | Livestock watering and irrigation in valley areas |
|
| · | Occasional use for dust suppression and equipment washing by small-scale operations |
There are no known groundwater wells currently located within the BRZ project boundary. During the 2024 mineral exploration drilling program, boreholes were advanced to a maximum depth of 84 feet. No significant groundwater inflow was encountered in any of the drillholes, indicating that the shallow subsurface materials at the site are predominantly unsaturated under normal conditions. Some drillholes exhibited limited water accumulation at shallow depths, typically perched above clay-rich horizons that act as low-permeability barriers. These conditions are interpreted as isolated, near-surface moisture zones rather than indicators of a continuous or regional groundwater system. As such, no interaction with the regional aquifer system is anticipated, and mining operations are not expected to encounter groundwater under current or planned operating depths.
17.2.6.3 Groundwater Quality
Publicly available groundwater quality data from USGS and IDWR suggest that water in this region generally meets state and federal primary drinking water standards for major ions and trace metals. While hardness levels may be elevated due to the volcanic origin of local geology, arsenic has not been detected at concerning levels in samples collected from the 2024 BRZ drilling program. Localized variability in nitrate concentrations may occur in shallow agricultural areas, though no water quality sampling has been conducted onsite to date.
| GeoGRAFX GIS Services | July 2, 2025 |
| Bear River Zeolite Project | Page: 223 |
| Franklin County, USA |
17.2.7 Soil Map Units and Composition
The Natural Resources Conservation Service (NRCS), an agency within the U.S. Department of Agriculture (USDA), provides comprehensive soil information through various tools and programs designed to support landowners, farmers, scientists, and policymakers in understanding soil characteristics, classification, and management. As part of its mission, the NRCS conducts soil surveys to classify, describe, and map soil types across diverse regions. The soil surveys covering the property were mapped at a scale of 1:24,000.
According to the NRCS, a baseline desktop review in February 2025 of the soils within the Bear River Zeolite Mine indicates that the area primarily consists of widespread alluvium and colluvium, with rock outcrops present at the land surface. The Bear River Zeolite property encompasses nine distinct soil map units or associations (Figure 17.2-1). Topsoil horizons within these nine soil map units and associations generally range from thin layers (0–6 inches below ground surface [bgs]) along hills and ridges to significantly thicker deposits (+12 feet bgs) in draws and valley bottoms.
The BRZ project boundary encompasses approximately 1,311.3 acres, which include nine NRCS-defined soil map units derived from volcanic tuff, loess, colluvium, and alluvium. These soils reflect the region’s complex volcanic and sedimentary history and range from shallow, steep upland complexes to deeper, well-drained deposits in valley bottoms and draws.
The most prevalent map units are:
|
| · | Wormcreek-Lonigan complex (Map Unit 157) – 36.6% of site area |
|
|
|
|
|
| · | Sanyon-Staberg-Kabear complex (Map Unit 128) – 35.3% of site area |
These dominant soils are generally derived from volcanic ash and colluvium over residuum, with slopes ranging from 15 to 55 percent. They are well-drained and exhibit moderate to high erosion potential, especially on steeper aspects.
Other significant units include:
|
| · | Smidale-Staberg complex (15.3%) and Smidale very channery silt loam (5.6%) – both formed from shale-derived colluvium, characterized by high surface rock content and moderate depth to bedrock. |
|
|
|
|
|
| · | Iphil-Lonigan and Wormcreek-Copenhagen complexes, which are found on moderate slopes and may exhibit seasonal wetness or shallow rooting depth constraints. |
Rare and isolated units (each <1%) include:
|
| · | Windernot-Lewnot-Stinkcreek complex, found in nearly flat areas with fine alluvium |
|
|
|
|
|
| · | Manila-Broadhead complexes on low and mid-slope loess hills |
Topsoil depths across the site vary substantially, ranging from 0–6 inches on upper ridges to over 12 feet in depositional areas.
Map unit distributions and descriptions are provided in Table 17-1, with spatial context shown on Figure 17.2-3.
| GeoGRAFX GIS Services | July 2, 2025 |
| Bear River Zeolite Project | Page: 224 |
| Franklin County, USA |
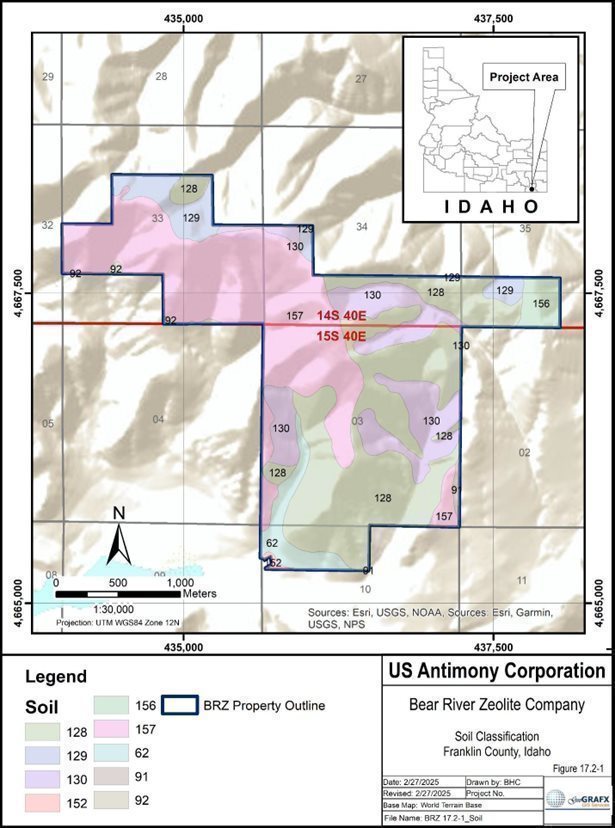
Figure 17.2-3 NRCS Soil Classification
| GeoGRAFX GIS Services | July 2, 2025 |
| Bear River Zeolite Project | Page: 225 |
| Franklin County, USA |
Table 17-1. Soil Map Units within the Bear River Zeolite Project Area (NRCS, ID714). Map unit colors correspond to those shown in Figure 17.2-3 NRCS Soil Classification.
Table 17-1 NRCS Soil Map Units Within the Bear River Zeolite Property
Summary by Map Unit — Franklin County Area, Idaho (ID714)
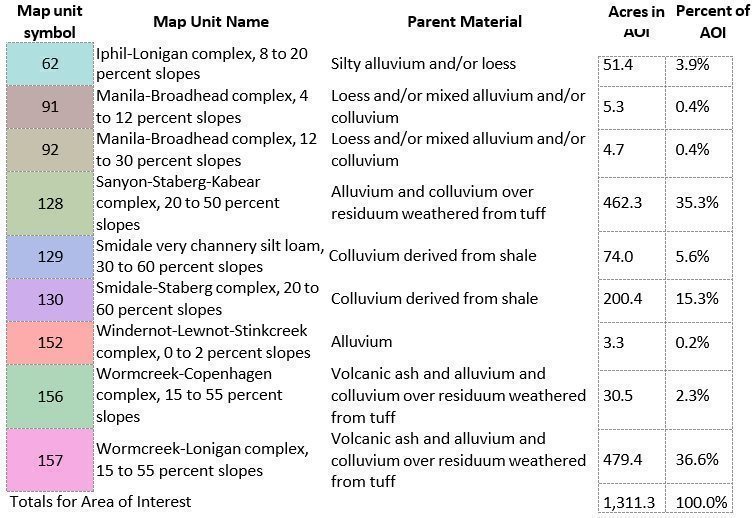
Source: NRCS Web Soil Survey, Franklin County Area, Idaho (ID714), accessed February 2025
Soil properties across the BRZ site may influence surface mine design and reclamation success. Key considerations include:
|
| · | Erosion Potential: Many units exhibit moderate to high erodibility, especially where slopes exceed 30 percent and surface cover is disturbed. |
|
|
|
|
|
| · | Drainage and Permeability: Soils are generally well-drained but vary in permeability; finer- textured or compacted areas may slow infiltration. |
|
|
|
|
|
| · | Foundation Suitability: Shallow soils, lithic inclusions, and steep slopes may limit certain construction activities (e.g., pads, laydown areas). |
|
|
|
|
|
| · | Reclamation Planning: Presence of volcanic ash and fine-grained colluvium may support vegetative recovery where topsoil is preserved and redistributed. |
Field verification of NRCS soil mapping has not been conducted to date; all information is based on desktop analysis of official survey data.
| GeoGRAFX GIS Services | July 2, 2025 |
| Bear River Zeolite Project | Page: 226 |
| Franklin County, USA |
17.2.8 Vegetation
The Bear River Zeolite (BRZ) Project lies within the Northern Basin and Range ecoregion, specifically within Major Land Resource Area (MLRA) 25 – Owyhee High Plateau. Vegetation across this region reflects a transitional semi-arid environment, shaped by elevation, precipitation gradients, volcanic soils, and historical disturbance patterns. As part of the environmental baseline review for SEC Regulation S-K 1300, vegetation characteristics were assessed through NRCS soil-vegetation crosswalks and regional ecological site descriptions.
Vegetation within the BRZ project area is strongly correlated with mapped soil units. Based on the NRCS SSURGO database and associated Ecological Site Descriptions (ESDs), the site is characterized by sagebrush steppe plant communities dominated by a mix of perennial grasses, low- to mid-height shrubs, and seasonal forbs.
The following table summarizes the dominant soil units at the BRZ site and their corresponding ecological site vegetation types:
|
| · | Wormcreek-Lonigan complex → Loamy 12–16” P.Z. – Wyoming Big Sagebrush/Bluebunch Wheatgrass |
|
| · | Sanyon-Staberg-Kabear complex → Loamy 10–14” P.Z. – Wyoming Big Sagebrush/Bluebunch Wheatgrass |
|
| · | Smidale-Staberg complex → Shallow Loamy 10–14” P.Z. – Wyoming Big Sagebrush |
|
| · | Iphil-Lonigan complex → Silty 10–14” P.Z. – Mountain Big Sagebrush/Idaho Fescue |
These ecological sites support plant communities that are adapted to the region’s dry summers, cold winters, and precipitation ranging from 10 to 16 inches annually, primarily as snow and spring rain.
Vegetation cover typically includes:
|
| · | Shrubs: Artemisia tridentata wyomingensis, A. tridentata vaseyana, Purshia tridentata |
|
| · | Grasses: Pseudoroegneria spicata (bluebunch wheatgrass), Festuca idahoensis, Elymus elymoides |
|
| · | Forbs: Seasonal wildflowers and native herbs (Balsamorhiza, Lupinus, Erigeron, etc.) |
The BRZ site lies entirely on private rangeland, historically used for grazing and low-intensity land management. Vegetation in the area likely reflects a mix of reference community elements (near- natural sagebrush steppe) and altered conditions due to historic grazing, localized erosion, or invasive species presence (e.g., Bromus tectorum).
No intensive agriculture, mechanical clearing, or development has occurred within the current BRZ boundary based on aerial imagery and land use history.
Vegetation considerations are important for:
|
| · | Surface disturbance and erosion control |
|
| · | Wildlife habitat value |
|
| · | Post-mining reclamation planning |
| GeoGRAFX GIS Services | July 2, 2025 |
| Bear River Zeolite Project | Page: 227 |
| Franklin County, USA |
Vegetation types identified through ecological site descriptions provide a baseline for developing seed mixes, revegetation targets, and monitoring criteria consistent with NRCS and state-level rangeland management guidelines.
Mapped vegetation classifications are illustrated in Figure 17.2-4, which reflects generalized cover types inferred from NRCS SSURGO soil map units and dominant component associations. Vegetation types were interpreted from the major soil components within each unit and cross-referenced with ecological site descriptions. Mapped classes include sagebrush-steppe, mixed shrub–grassland, and shallow upland vegetation types commonly found in southeastern Idaho.
| GeoGRAFX GIS Services | July 2, 2025 |
| Bear River Zeolite Project | Page: 228 |
| Franklin County, USA |
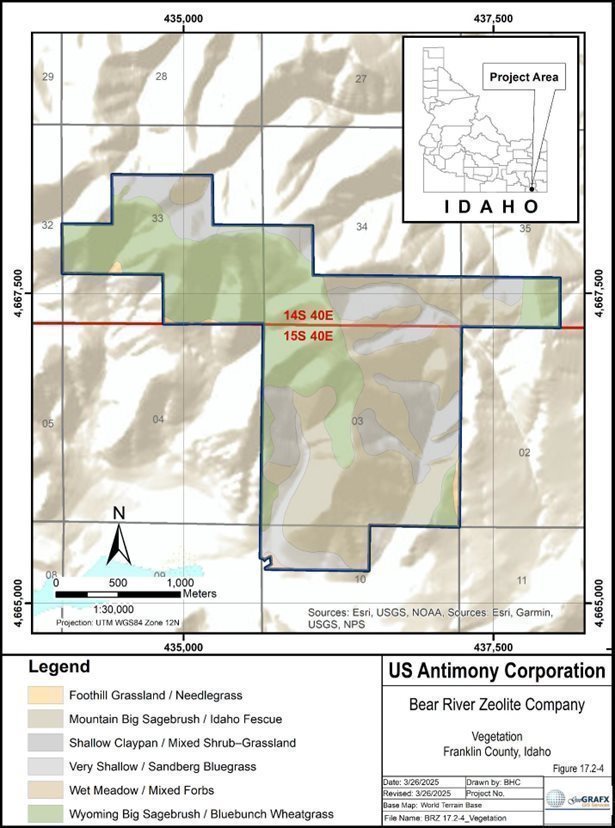
Figure 17.2-4 Vegetation Classification Based on NRCS SSURGO Soil Units
| GeoGRAFX GIS Services | July 2, 2025 |
| Bear River Zeolite Project | Page: 229 |
| Franklin County, USA |
17.2.9 Wildlife Resources
The Bear River Zeolite (BRZ) Project is located within the Northern Basin and Range ecoregion, characterized by sagebrush steppe and mixed shrubland ecosystems that support a diverse array of terrestrial wildlife. A desktop study was conducted in March 2025 to evaluate potential wildlife resources in the vicinity of the Bear River Zeolite (BRZ) project area in Franklin County, Idaho. The assessment included a review of publicly available data sources from the Idaho Department of Fish and Game (IDFG), the U.S. Fish and Wildlife Service (USFWS), and the U.S. Geological Survey (USGS).
Although the Idaho Department of Fish and Game (IDFG) has mapped seasonal ranges for big game species statewide, such as mule deer and pronghorn antelope, these GIS data were not accessible at the time of this review. Based on available regional habitat information and species occurrence data, the BRZ project area does not overlap any designated wildlife refuges, wilderness areas, or critical wildlife movement corridors.
The BRZ project area is situated in a region characterized by sagebrush-steppe uplands, intermittent drainages, and low-elevation foothills, which support a variety of native wildlife species. No designated wildlife refuges, state preserves, or federally designated critical habitats occur within or immediately adjacent to the project boundary. The site does not fall within a known wildlife management unit or protected corridor.
Table 17-2 Likely Wildlife Species Observed or Expected in the BRZ Area
| Species Group | Common Species | Habitat Preference |
| Large Mammals | Mule Deer | Sagebrush hillsides, draws, seasonal browse areas |
| Large Mammals | Pronghorn Antelope | Open rangelands, grasslands, transitional habitat |
| Small Mammals | Black-tailed Jackrabbit, Ground Squirrels, Coyote | Open shrublands, disturbed edges |
| Birds of Prey | Red-tailed Hawk, American Kestrel, Golden Eagle | Rock outcrops, powerlines, ridgelines |
| Songbirds & Upland Birds | Sparrows, Meadowlarks, Northern Harrier | Riparian corridors, sagebrush flats, wetlands |
Although the Idaho Department of Fish and Game has mapped seasonal ranges for big game species, those data were not accessible at the time of this review. Based on available regional information, the BRZ project does not overlap any designated wildlife refuges, wilderness areas, or critical wildlife corridors.
Wildlife use is expected to be seasonal and opportunistic, with elevated activity near water features and vegetated drainages. If development proceeds beyond current operations or includes new surface disturbance, additional coordination with state or federal wildlife agencies may be warranted to ensure avoidance or minimization of potential impacts.
A desktop review of publicly available wildlife data sources was conducted in February 2025 to evaluate the potential presence of protected or sensitive wildlife species within the Bear River Zeolite (BRZ) Project area. The Idaho Department of Fish and Game’s (IDFG) Wildlife Observations and Species of Greatest Conservation Need (SGCN) layers were reviewed using the Idaho Fish and Wildlife Information System (IFWIS) mapping tool. This review identified the BRZ project area as occurring within seasonal habitat ranges for mule deer (Odocoileus hemionus) and pronghorn antelope (Antilocapra americana), which commonly utilize sagebrush steppe and open rangelands in the region.
| GeoGRAFX GIS Services | July 2, 2025 |
| Bear River Zeolite Project | Page: 230 |
| Franklin County, USA |
17.2.10 Habitat Setting
The project area is composed of undeveloped rangeland located entirely on private property. Soils, vegetation, and elevation are consistent with ecological sites supporting Wyoming and Mountain Big Sagebrush plant communities, interspersed with perennial grasses and seasonal forbs. These habitats provide important resources for a variety of wildlife species, including forage, cover, breeding areas, and movement corridors.
There are no mapped wildlife preserves, state refuges, or designated critical habitat areas within or immediately adjacent to the BRZ site.
17.2.10.1 Mammals
Species commonly associated with the region’s sagebrush and upland environments include:
|
| · | Mule deer (Odocoileus hemionus) – year-round residents and seasonal migrators |
|
| · | Pronghorn antelope (Antilocapra americana) – observed in open areas and flats |
|
| · | Coyote (Canis latrans), badger (Taxidea taxus), and bobcat (Lynx rufus) – generalist carnivores |
|
| · | Small mammals including black-tailed jackrabbit, ground squirrels, and voles, which serve as prey for larger predators |
17.2.10.2 Birds
The BRZ site supports habitat suitable for sagebrush-obligate and grassland bird species, including:
|
| · | Greater sage-grouse (Centrocercus urophasianus) – not known to lek within the project area, but regionally present (see Section 17.2.11.4) |
|
| · | Sage thrasher (Oreoscoptes montanus) and Brewer’s sparrow (Spizella breweri) – nesting in dense sagebrush |
|
| · | Raptors such as golden eagle, red-tailed hawk, and northern harrier – foraging across open terrain |
|
| · | Various migratory species protected under the Migratory Bird Treaty Act (MBTA) |
Seasonal presence of birds will vary, with spring and early summer representing peak breeding and nesting activity.
17.2.10.3 Reptiles and Amphibians
Reptilian fauna likely to occur in the area include:
|
| · | Sagebrush lizard (Sceloporus graciosus) – often found on rocky outcrops and shrubby hillsides |
|
| · | Western rattlesnake (Crotalus oreganus) – occasional sightings in sun-warmed areas |
|
| · | Gopher snake (Pituophis catenifer) – non-venomous, commonly found in dry uplands |
Amphibian use is expected to be low, limited to intermittent streams or spring areas in wetter years.
| GeoGRAFX GIS Services | July 2, 2025 |
| Bear River Zeolite Project | Page: 231 |
| Franklin County, USA |
17.2.10.4 Wildlife Use and Potential Impacts
The site provides foraging, shelter, and movement habitat for a variety of native wildlife, particularly small mammals, birds, and reptiles. Due to its location on private land and absence of surface water features or sensitive habitat types, wildlife use is considered typical for the region and no special-status species are known to rely on the project area for critical life stages.
Mining and processing activities may result in localized disturbance through:
|
| · | Temporary habitat loss from surface disturbance |
|
| · | Increased vehicle traffic or human activity |
|
| · | Elevated dust or noise levels during active operations |
These impacts are expected to be minor and localized, given the limited footprint of the operation, absence of chemical processing, and phased nature of material extraction.
Mitigation measures include:
|
| · | Avoiding peak nesting season for ground-nesting birds where feasible |
|
| · | Revegetation of disturbed areas with native species |
|
| · | Minimizing surface disturbance to the smallest area necessary for safe operations |
This approach is consistent with responsible environmental stewardship and supports the project’s compliance with best management practices.
17.2.11 Endangered Species and Critical Habitat
The Federal Endangered Species Act of 1973 (ESA) (16 U.S.C.A. §§ 1531 et seq.) provides a program for the conservation of threatened and endangered plants and animals and the habitats in which they are found. Under the ESA, species may be listed as either endangered or threatened. "Endangered" means a species is in danger of extinction throughout all or a significant portion of its range. "Threatened" means a species is likely to become endangered within the foreseeable future. All species of plants and animals, except pest insects, are eligible for listing as endangered or threatened. For the purposes of the ESA, Congress defined species to include subspecies, varieties, and, for vertebrates, distinct population segments.
The ESA is administered by the U.S. Fish and Wildlife Service (FWS) and the Commerce Department's National Marine Fisheries Service (NMFS). The Service has primary responsibility for terrestrial and freshwater organisms, while the responsibilities of NMFS are mainly marine wildlife such as whales and anadromous fish such as salmon. These agencies may list a species on their own initiative, or any interested person may submit a petition to have a species considered for listing. In either case, the ESA requires that the decision to include a species be based solely on the “best scientific and commercial data available,” following a review of the status of the species that takes into account any conservation efforts being made to protect the species (§ 1533 (b)(1)(A)).
The law requires federal agencies, in consultation with the U.S. Fish and Wildlife Service and/or the NOAA Fisheries Service, to ensure that actions they authorize, fund, or carry out are not likely to jeopardize the continued existence of any listed species or result in the destruction or adverse modification of designated critical habitat of such species. The law also prohibits any action that causes a "taking" of any listed species of endangered fish or wildlife. Likewise, import, export, interstate, and foreign commerce of listed species are all generally prohibited.
| GeoGRAFX GIS Services | July 2, 2025 |
| Bear River Zeolite Project | Page: 232 |
| Franklin County, USA |
Information for Planning and Consultation (IPaC) https://ecos.fws.gov/ipac/ is a project planning tool provided by the Environmental Conservation Online System (ECOS) operated by the U.S. Fish and Wildlife Service (USFWS) which identifies potential issues in a project area such as migratory birds, species proposed or listed under the Endangered Species Act, inter-jurisdiction fishes, specific marine mammals, wetlands, and Service National Wildlife Refuge lands.
A desktop review of IPaC search results indicates that for the Bear River Project area as of 29 November 2024, the following species are potentially affected by activities in this location (ECOS: Home, 2020)
17.2.11.1 Endangered Species
Listed species and their critical habitats are managed by the Ecological Services Program of the U.S. Fish and Wildlife Service (USFWS. The following species are potentially affected by activities in this location:
| Species | Name | Status* |
| Mammals | North American Wolverine | Threatened |
| Insects | Monarch Butterfly | Proposed Threatened |
|
| Suckley's Cuckoo Bumble Bee | Proposed Endangered |
| Flowering Plants | Ute Ladies'-tresses | Threatened |
* Endangered: A species in danger of extinction throughout all or a significant portion of its range; Threatened; A species likely to become endangered within the foreseeable future throughout all or a significant portion of its range; Candidate; A species under consideration for official listing for which there is sufficient information to support listing.
Critical Habitats:
There are no critical habitats in the project area as defined under the Endangered Species Act (ESA) (USFWS, 2015) (31).
17.2.11.2 Bald & Golden Eagles
Bald and Golden Eagles are protected under the Bald and Golden Eagle Protection Act and the Migratory Bird Treaty Act. There are likely bald eagles present in the project area.
| Species | Level of Concern | Breeding Season |
| Bald Eagle | Non BBC Vulnerable | Breeds Dec 1 to Aug 31 |
17.2.11.3 Migratory Birds
Certain birds are protected under the Migratory Bird Treaty Act and the Bald and Golden Eagle Protection Act. The birds listed below are birds of particular concern either because they occur on the USFWS Birds of Conservation Concern (BCC) list or warrant special attention in the project location.
| Species | Level of Concern | Breeding Season |
| American White Pelican | BCC - BCR | Breeds April 1 to Aug 31 |
| Bald Eagle | Non BBC Vulnerable | Breeds Dec 1 to Aug 31 |
| Broad-tailed Hummingbird` | BCC Rangewide (CON) | Breeds May 25 to Aug 21 |
| California Gull | BCC Rangewide (CON) | Breeds Mar 1 to Jul 31 |
| GeoGRAFX GIS Services | July 2, 2025 |
| Bear River Zeolite Project | Page: 233 |
| Franklin County, USA |
| Species | Level of Concern | Breeding Season |
| Cassin's Finch | BCC Rangewide (CON) | Breeds May 15 to Jul 15 |
| Clark's Grebe | BCC Rangewide (CON) | Breeds Jun 1 to Aug 31 |
| Franklin's Gull | BCC Rangewide (CON) | Breeds May 1 to Jul 31 |
| Northern Harrier | BCC - BCR | Breeds Apr to Sep 15 |
| Western Grebe | BCC Rangewide (CON) | Breeds Jun 1 to Aug 13 |
BCC – BCR: Bird of Conservation Concern (BCC) only in particular Bird Conservation Regions (BCRs) in the continental USA; Non BBC Vulnerable: Bird of Conservation Concern (BCC) in this area, but warrants attention because of the Eagle Act or for potential susceptibilities in offshore areas from certain types of development or activities; BCC Rangewide (CON): Bird of Conservation Concern (BCC) throughout its range in the continental USA and Alaska.
17.2.11.4 Greater Sage Grouse Habitat
Greater sage-grouse (Centrocercus urophasianus) are a sagebrush-obligate species whose populations have been declining across the western United States due to habitat loss and fragmentation. In Idaho, sage-grouse conservation is governed under a combination of state-level strategies and federal land management planning efforts.
The Idaho Sage-Grouse Management Plan, originally adopted in 2006 and updated in coordination with the Bureau of Land Management (BLM), identifies two key categories of habitat:
|
| · | Priority Habitat Management Areas (PHMA): highest-value sage-grouse habitat with breeding, nesting, and wintering functions |
|
| · | General Habitat Management Areas (GHMA): habitat that supports seasonal or peripheral use |
These classifications are used by both the Idaho Governor’s Office of Species Conservation and BLM to guide project review, conservation planning, and mitigation strategies on both public and private lands.
As of the February 2025 review, a desktop spatial analysis of BLM habitat datasets and lek distribution mapping indicates that the Bear River Zeolite project area is located outside of both PHMA and GHMA designated habitats. Additionally, no active or historic sage-grouse leks are located within the BRZ site boundary or within a 4-mile buffer a standard avoidance distance used in state and federal guidance for development near leks.
While the BRZ project is not situated within mapped sage-grouse habitat, sage-grouse conservation remains a broader landscape-scale issue in Idaho. Agencies such as the Idaho Department of Fish and Game, Idaho Governor’s Office of Species Conservation, and BLM continue to support regulatory and voluntary habitat protection measures to address long-term sage-grouse population viability in the state.
17.3 Environmental Considerations/Monitoring Programs
17.3.1 Waste Rock and Tailings Management
Due to the nature of the mineral resource, the Bear River Zeolite (BRZ) operation generates minimal waste. Ore is processed using physical separation methods, without chemical reagents or flotation agents. Waste rock generated during stripping or pit expansion is composed of non-mineralized volcanic material and is stored in designated Waste Rock Storage Facilities (WRSFs). These areas are sited and managed to:
| GeoGRAFX GIS Services | July 2, 2025 |
| Bear River Zeolite Project | Page: 234 |
| Franklin County, USA |
|
| · | Minimize erosion |
|
| · | Prevent offsite sediment transport |
|
| · | Avoid potential interaction with surface water features |
Tailings management involves dry stacking or containment within engineered storage areas, which ensures stability. Tailings or ultrafine materials are not produced in significant volumes. Any fines from crushing or screening are either contained within engineered settling or storage areas, or reincorporated into product stockpiles or on-site reclamation. All handling complies with Idaho Department of Environmental Quality (IDEQ) best practices for small-scale industrial mineral operations.
17.3.2 Site Monitoring
No formal water, soil, or biological monitoring programs are required at the BRZ site, as the project is located on private land, does not involve chemical processing, and has no discharge or groundwater extraction activities. However, BRZ operates under IDEQ Air Quality Permit to Construct No. P- 2007.0025, revised in January 2025, which contains enforceable monitoring and recordkeeping provisions related to:
|
| · | Crushing and screening operations, including opacity limits, equipment-specific emission controls (e.g., baghouses), and daily production limits (480 tons/day) |
|
| · | Mining operations, with visual monitoring of fugitive dust under Method 22 (40 CFR 60, Appendix A) |
|
| · | Dust control plans, including water application, wind barriers, and material handling protocols |
|
| · | Maintenance and inspection schedules for emission control equipment |
|
| · | Recordkeeping and reporting requirements, with logs available for IDEQ review upon request |
BRZ maintains a Fugitive Dust Control Plan that outlines:
|
| · | Dust sources (unpaved roads, stockpiles, disturbed areas) |
|
| · | Mitigation measures (water trucks, chemical stabilizers, wind curtains) |
|
| · | Monitoring protocols and contingency responses (e.g., high winds or malfunctions) |
|
| · | Training and compliance procedures for site staff |
17.3.3 Water Management
Water used for operations is sourced from a privately owned on-site well, accessed under a lease agreement with the landowner. This water is used primarily for:
|
| · | Dust suppression on roads and pads |
|
| · | Moisture control in material handling areas |
Water is distributed by a mobile truck on an as-needed basis. No surface water withdrawals are conducted, and no process water is generated or discharged.
Surface water runoff is managed passively using:
| GeoGRAFX GIS Services | July 2, 2025 |
| Bear River Zeolite Project | Page: 235 |
| Franklin County, USA |
|
| · | Graded slopes |
|
| · | Roadside berms |
|
| · | Engineered channels to direct flow away from operational areas |
These features minimize sediment transport and reduce the potential for ponding or erosion during storm events.
The site operates under an Air Quality Permit to Construct (PTC) that includes conditions for water use and dust mitigation.
17.4 Project Permitting Requirements and Status
The Bear River Zeolite Mine operates on private land and is regulated primarily by Idaho state agencies and federal environmental laws. For mining on private land, oversight falls under the Idaho Department of Lands (IDL) through the Idaho Mined Land Reclamation Act of 1971, which requires an approved Reclamation Plan (RP-2330) and bonding to ensure post-mining land restoration in accordance with IDAPA 20.03.02. Additionally, the Idaho Department of Environmental Quality (DEQ) enforces compliance with air and water quality standards, including regulations under the Clean Water Act (CWA) and the Safe Drinking Water Act (SDWA) if water usage or discharge is involved. Operational standards and Best Management Practices were established to maintain compliance with applicable state and federal regulatory standards and permits.
If mining activities were to extend onto Bureau of Land Management (BLM) lands, additional federal permits would be required under the Federal Land Policy and Management Act (FLPMA) and the Surface Mining Control and Reclamation Act (SMCRA). This would involve obtaining a Plan of Operations from the BLM and undergoing National Environmental Policy Act (NEPA) review, which includes environmental impact assessments and public comment periods.
Regardless of land ownership, the mine operates under Mine Safety and Health Administration (MSHA) Permit #1001993, which regulates workplace safety under 30 CFR Part 56. This includes routine MSHA inspections, mandatory safety protocols, and compliance with health and hazard mitigation standards. The Bear River Zeolite Mine ensures full adherence to state and federal environmental laws while maintaining comprehensive safety compliance under MSHA.
17.4.1 Permitting Requirements
The Idaho Department of Lands (IDL) regulates mine reclamation through the Idaho Mined Land Reclamation Act of 1971 and the Rules Governing Mined Land Reclamation (IDAPA 20.03.02). Prior to commencing operations, Bear River Zeolite (BRZ) submitted a Reclamation Plan (RP-2330), which was approved in February 2001. In compliance with IDL and MSHA requirements, BRZ obtained the necessary operating and environmental permits, including:
|
| · | Mine Safety and Health Administration (MSHA) Permit #1001993 for surface mining operations. |
|
| · | Reclamation Bonding as per the Idaho Surface Mining Act, with an initial amount of $1,500, later increased to a minimum of $7,500. |
|
| · | Water Rights and Dust Control Permitting, with industrial-use water sourced from an on-site well under a lease agreement. |
| GeoGRAFX GIS Services | July 2, 2025 |
| Bear River Zeolite Project | Page: 236 |
| Franklin County, USA |
|
| · | Environmental and Land Use Permits, including compliance with federal and state environmental regulations governing waste management and air quality. |
|
| · | Air Quality Permit to Construct (PTC) No. P-2007.0025, issued by the Idaho Department of Environmental Quality (DEQ) on June 8, 2007, for the Bear River Zeolite facility near Preston, Idaho. This permit authorized the installation and operation of specific equipment and outlined operational requirements to ensure compliance with state and federal air quality standards. The permit was revised on January 29, 2025, to reflect updates and modifications to BRZ's operations. |
17.4.2 Status of Permit Applications
The Bear River Zeolite Mine is fully permitted and operational, with all necessary approvals in place to continue mining, processing, and reclamation activities. The site remains in compliance with MSHA regulations, and workplace inspections are conducted per 30 CFR Part 56 requirements. As part of its compliance obligations, BRZ continues to engage with regulatory agencies to ensure ongoing adherence to safety, environmental, and reclamation standards.
As of December 31, 2023, BRZ has recorded a retirement and reclamation obligation accrual of $670,886, reflecting anticipated closure and remediation costs as required by regulatory authorities and lease agreements. BRZ will continue to monitor and update its permitting and reclamation obligations, as necessary.
This comprehensive permitting framework ensures that BRZ meets all regulatory requirements, supporting responsible mine operations and long-term environmental stewardship.
17.5 Social Considerations, Plans, Negotiations and Agreements
US Antimony's Bear River Operations in Franklin County, Idaho, maintains a strong and collaborative relationship with the local communities. The company recognizes the importance of being an active, responsible participant in the region, and its operations are deeply integrated into the local economic, social, and cultural fabric. Mining has long been a significant part of the region’s economy, and US Antimony strives to ensure its presence continues to benefit Franklin County’s residents while respecting local social values.
17.5.1 Local Workforce and Economic Impact:
A cornerstone of US Antimony’s approach in Franklin County is its local workforce. The Bear River Operations prioritize hiring from the local community, ensuring that the benefits of the mining activity directly impact the residents of Franklin County. By providing stable, well-paying jobs, the company contributes to the ongoing economic development of the area. The company understands the long- standing role that mining has played in Franklin County’s history and works to ensure that its operations continue to support the economic health of the region.
US Antimony is also committed to offering training and development opportunities to its workforce, ensuring that employees can improve their skills and advance in their careers. This commitment helps raise the standard of living for local residents and provides long-term job security within the community.
| GeoGRAFX GIS Services | July 2, 2025 |
| Bear River Zeolite Project | Page: 237 |
| Franklin County, USA |
17.5.2 Support for Local Businesses:
In addition to employing a local workforce, US Antimony actively supports local businesses in Franklin County through its procurement processes. The Bear River Operations work with a variety of regional suppliers and contractors, ensuring that local businesses are part of the company’s supply chain. This creates a mutually beneficial relationship that strengthens the overall economy of the area and helps foster a positive relationship between the company and the surrounding community.
US Antimony is mindful of its social responsibility in fostering local entrepreneurship, and by contracting with local vendors, the company helps promote economic diversification within the region.
17.5.3 Community Engagement and Support:
As the Bear River Operations continue to grow, US Antimony is committed to maintaining strong communication with the Franklin County community. The company recognizes the importance of local support, particularly during permitting processes or public engagement activities. As the company moves forward with any future expansion or changes, including permit actions or community-facing events, it anticipates continued collaboration with local stakeholders.
US Antimony is committed to ensuring that the voices of Franklin County residents are heard and respected. The company actively engages with local groups, attends community meetings, and takes the time to listen to concerns or feedback from those impacted by the operations. This approach helps maintain a transparent and supportive environment for all parties involved, with a particular emphasis on addressing the social needs and concerns of the local community.
17.5.4 Social Considerations:
Beyond economic engagement, US Antimony places high importance on the social impacts of its operations on the Franklin County community. The company recognizes that mining activities can affect local communities in various ways, including quality of life, public health, and cultural heritage. US Antimony works closely with local residents, organizations, and leaders to ensure that any social concerns are addressed and that the company contributes positively to the community’s well-being.
The company is committed to promoting a safe, inclusive, and respectful working environment for all its employees. US Antimony also supports local social programs, including educational initiatives, community events, and other activities that improve the quality of life in Franklin County.
17.5.5 Environmental and Social Responsibility:
In keeping with the company’s broader commitment to environmental, social, and governance (ESG) principles, US Antimony works to ensure that its operations at Bear River are not only profitable but also responsible. The company continues to prioritize environmental protection and sustainability of the area, ensuring that its operations comply with all regulatory standards and are aligned with the community’s values. Social responsibility is integrated into every aspect of the company’s operations, from employee welfare to community engagement. Furthermore, US Antimony aims to foster a positive relationship with the local community by supporting local initiatives and contributing to the region’s overall well-being.
| GeoGRAFX GIS Services | July 2, 2025 |
| Bear River Zeolite Project | Page: 238 |
| Franklin County, USA |
17.5.6 Future Plans and Local Collaboration:
Looking ahead, US Antimony plans to continue its successful partnership with the Franklin County community. Future expansions and operational developments at the Bear River site will include ongoing discussions with local stakeholders, government bodies, and community organizations. This collaboration ensures that US Antimony’s growth aligns with the long-term interests of the region, promoting not only the company’s success but also the continued prosperity and well-being of the local community.
The company is committed to enhancing its social footprint through ongoing dialogue with local communities, ensuring that the social impacts of its operations are continually monitored and improved upon.
17.6 Closure and Reclamation Considerations
The Idaho Department of Lands (IDL) oversees mine reclamation under the Idaho Mined Land Reclamation Act of 1971, which mandates that all lands impacted by mining activities be restored to a productive state. To comply with these regulations, Bear River Zeolite (BRZ) submitted a Reclamation Plan (RP-2330), which was approved by IDL in February 2001. In accordance with IDAPA 20.03.02, Section 080, BRZ obtained a reclamation bond with an initial amount of $1,500, later increased to a minimum of $7,500, ensuring financial assurance for reclamation obligations. BRZ continues to operate in compliance with the approved reclamation bond and all regulatory requirements.
17.6.1 Closure Plan and Regulatory Compliance
During continuing operations and upon cessation of mining operations, BRZ will implement a structured mine closure and reclamation program that aligns with the requirements of IDL, the Idaho Surface Mining Act, and the Lease Agreement with Zeolite, LLC. The plan includes:
|
| · | Surface Restoration: Returning the site to its original condition to the extent reasonably practicable, including the placement of topsoil and revegetation to restore native ecosystems. |
|
|
|
|
|
| · | Infrastructure Removal: All buildings, mills, equipment, and facilities installed by BRZ will be dismantled and removed within one year of mine closure, in accordance with the lease agreement, unless the lessor requests certain buildings remain to be used for hay storage, warehousing, or maintenance shops. |
|
|
|
|
|
| · | Waste Management: The proper closure and reclamation of waste rock storage areas and process residue facilities to prevent environmental contamination. |
|
|
|
|
|
| · | Water Resource Protection: Implementation of groundwater and surface water protection measures, including erosion control and ongoing water quality monitoring. |
17.6.2 Reclamation and Asset Retirement Obligations
The Lease Agreement between Bear River Zeolite (BRZ) and Zeolite, LLC stipulates that upon termination of mining activities, BRZ must restore the surface, remove all improvements, and rehabilitate the site in accordance with the approved reclamation plan. As of December 31, 2023, BRZ has recorded a retirement and reclamation obligation accrual of $670,886, reflecting anticipated closure and remediation costs (United States Antimony Corporation, 2024). These costs are based on lease requirements, regulatory obligations, and site-specific reclamation needs and appear to be more than adequate to cover these projected costs. Going forward, the costs will be adjusted as necessary to reflect updated cost estimates and regulatory changes.
| GeoGRAFX GIS Services | July 2, 2025 |
| Bear River Zeolite Project | Page: 239 |
| Franklin County, USA |
The approved Reclamation Plan RP-2330 (2021) outlines the restoration strategy for the Bear River Zeolite Mine, including the rehabilitation of disturbed areas such as the open pit (2 acres), haul road (1 acre), and crusher site (2 acres), totaling 5 acres. Since mining operations are confined to privately owned land (Webster Farm, LLC), reclamation is subject primarily to Idaho state regulations rather than federal oversight, simplifying permitting requirements.
The reclamation plan emphasizes sustainable land use and environmental responsibility. The site will undergo phased reclamation during the operating phases, insuring minimal long-term environmental impact.
The reclamation plan includes:
|
| · | Erosion and Drainage Control: Silt fencing will be installed where necessary to mitigate erosion, and the haul road will be regraded to approximate original contours. |
|
|
|
|
|
| · | Surface Rehabilitation: The open pit will be contoured to a final 3:1 slope, consistent with stability requirements. Stockpiled topsoil, primarily sand- and gravel-sized zeolite, will be replaced and supplemented with fertilizer to support vegetation regrowth. |
|
|
|
|
|
| · | Seeding and Vegetation: A seed mix and fertilizer type, as determined by the Idaho Department of Lands, will be applied in the fall using mechanical broadcasting to facilitate long-term site stabilization. |
|
|
|
|
|
| · | Waste and Tailings Management: No external or internal waste rock stockpiles, tailings, or sediment ponds are present at the site, minimizing post-mining environmental liabilities. |
The estimated cost of initial reclamation efforts, including mobilization, regrading, seeding, fertilization, and erosion control measures, is $7,500. However, the total closure liability of $670,886 accounts for broader site remediation, regulatory compliance, and any potential modifications to the reclamation plan over the mine’s lifecycle.
17.6.3 Financial Assurance and Bonding
BRZ maintains financial security for mine closure through reclamation bonding in compliance with IDL regulations and the Idaho Surface Mining Act. The bond amount ($7,500) is subject to periodic review and adjustment to ensure adequate financial coverage for all required reclamation activities or reduction as reclamation is accomplished.
17.6.4 Post-Closure Monitoring and Reporting
BRZ will implement a post-closure monitoring program to ensure the long-term stability of the reclaimed site. This includes:
|
| · | Erosion and vegetation monitoring to assess the effectiveness of reclamation efforts. |
| GeoGRAFX GIS Services | July 2, 2025 |
| Bear River Zeolite Project | Page: 240 |
| Franklin County, USA |
|
| · | Groundwater and surface water testing to confirm compliance with environmental standards. |
|
|
|
|
|
| · | Annual reporting to regulatory authorities detailing reclamation progress, monitoring results, and any necessary corrective actions. |
This comprehensive mine closure and reclamation plan ensures BRZ’s compliance with regulatory obligations, and lease requirements while supporting a responsible transition to post-mining land use.
17.7 Qualified Person’s Opinion on Adequacy of Current Plans to Address Issues
Based on the information provided to the Qualified Person (QP) by BRZ, there are no known material concerns that would necessitate mitigation measures, or the allocation of remediation costs related to environmental compliance, permitting requirements, site closure obligations, or social license considerations.
| GeoGRAFX GIS Services | July 2, 2025 |
| Bear River Zeolite Project | Page: 241 |
| Franklin County, USA |
18 Capital and Operating Costs
This section presents the capital and operating cost estimates used to demonstrate the economic viability of the Mineral Reserves for the Bear River Zeolite Project. The estimates have been prepared in accordance with SEC Regulation S-K 1300 requirements and support the Qualified Person’s conclusions regarding the project’s economic viability.
18.1 Basis of Estimate
The capital and operating cost estimates presented in this section are based on actual recorded expenditures from the Bear River Zeolite site, which has been in continuous commercial production since the early 2000s. Forward-looking estimates reflect projections developed from this historical cost base, adjusted for known and anticipated changes in key cost drivers such as fuel, labor, and processing consumables.
The Qualified Person has reviewed the basis of these capital and operating cost estimates. The forward- looking estimates were prepared using actual recorded site costs as the primary basis, with appropriate adjustments to reflect expected operational conditions and current market trends. Given the mature nature of the operation and the availability of direct production cost data, the Qualified Person considers these estimates to be reasonable and sufficiently representative of the site’s expected cost structure to support the Mineral Reserve estimate presented in this report.
18.2 Capital Costs
Capital expenditures at Bear River Zeolite have focused on sustaining and improving the plant and equipment needed to support ongoing operations. Major capital items include equipment replacement, mill upgrades, packaging facility improvements, and infrastructure maintenance.
Capital cost projections are summarized in Table 18-1 Bear River Zeolite Mine & Processing Capital Costs (Actual 2021-2024, Estimated 2025, 2026, USD$).
Table 18-1 Bear River Zeolite Mine & Processing Capital Costs
| Year | Total Capital Cost |
| 2021 | $758,000 |
| 2022 | $1,464,000 |
| 2023 | $1,285,000 |
| 2024 | $291,000 |
| 2025 | $100,000 |
| 2026 | $100,000 |
Capital costs for the Bear River Zeolite Project are reported on an aggregate annual basis, consistent with the format of available site-level financial records. While no further category breakdown was provided, the Qualified Person has reviewed these capital expenditures and considers them reasonable and sufficient to support the reserve declaration. The reported totals reflect the actual and projected expenditures necessary to maintain and operate the facility over the stated period. Projections beyond 2026 are not included, as no site-specific data was provided for those periods.
| GeoGRAFX GIS Services | July 2, 2025 |
| Bear River Zeolite Project | Page: 242 |
| Franklin County, USA |
18.3 Operating Costs
Operating costs have been compiled based on historical site-level expenditures from 2019 through 2024, combined with projections for 2025. The cost structure reflects current mining and processing methods, including haulage, crushing, screening, packaging, and loadout.
Operating cost projections are summarized in Table 18-2. Table 18-2 summarizes estimated annual unit operating costs expressed in U.S. dollars per short ton of product sold.
Table 18-2 Operating Cost Summary
| Category | 2021 | 2022 | 2023 | 2024 | 2025 |
| Mining Operations | 23.58/t | 22.83/t | 21.15/t | 24.44/t | 25.27/t |
| Processing | 21.48/t | 22.13/t | 22.50/t | 25.49/t | 26.30/t |
| General & Admin | 9.78/t | 8.56/t | 9.16/t | 9.85/t | 10.17/t |
| Total Operating Cost | 54.84/t | 53.52/t | 52.81/t | 59.78/t | 61.74/t |
Environmental and compliance-related costs are included within the Processing and G&A cost categories shown in Table 18-2. The operating cost projections reflect current packaging capacity and mix ratios. No changes to plant capacity or packaging throughput are assumed in these forward-looking estimates.
18.4 Economic Assumptions
Cost estimates incorporate adjustments for inflation and current trends in key cost drivers:
|
| · | Fuel costs are forecast to range between $3.25 and $3.50 per gallon. |
|
|
|
|
|
| · | Processing chemical and packaging material costs are based on current vendor pricing. |
|
|
|
|
|
| · | Labor costs reflect site wage structures with a 4% annual inflation adjustment. |
|
|
|
|
|
| · | No changes to packaging capacity or product mix are assumed. |
|
|
|
|
|
| · | A 10% contingency is applied to capital costs; operating costs are based on recent trends and do not include an explicit contingency. |
The Qualified Person has reviewed recent sales tonnage and pricing data provided by site management. Sales volumes for zeolite products in recent years have averaged approximately 12,600 short tons per year, with an average realized sales price of $266.84 per ton. Forward-looking cost assumptions presented in this section are based on maintaining current packaging capacity and a stable sales mix consistent with recent performance.
The Qualified Person considers the cost estimates presented in this section to be reasonable and suitable for demonstrating the economic viability of the Bear River Zeolite Project’s Mineral Reserves under the current mine plan.
| GeoGRAFX GIS Services | July 2, 2025 |
| Bear River Zeolite Project | Page: 243 |
| Franklin County, USA |
19 Economic Analysis
An economic analysis was performed to demonstrate the economic viability of the Proven and Probable Mineral Reserves for the Bear River Zeolite Project. The analysis was prepared in accordance with SEC Regulation S-K 1300 and is based on actual site operating performance and cost structure, as documented in Sections 12 and 18, and forward-looking projections consistent with current site practices and market conditions.
19.1 Assumptions
This analysis is forward-looking in nature and is intended solely to support the Reserve classification. It does not constitute a detailed financial forecast or feasibility study. The analysis is based on a simplified cash flow model using the following assumptions:
|
| · | Mineral Reserve basis: 5.127 million short tons Proven and Probable (Section 12) |
|
|
|
|
|
| · | Production rate: 12,600 short tons per year (based on current or planned production rate) |
|
|
|
|
|
| · | Mine life: 407 years, (based on current Reserve and production assumptions) |
|
|
|
|
|
| · | Average sales price: $267USD per short ton (rounded, based on recent actuals and used for forward-looking analysis) |
|
|
|
|
|
| · | Operating cost: $61.74USD per short ton (per Section 18 Table 18-2, most recent year or projected) |
|
|
|
|
|
| · | Capital costs: Annual expenditures $100,000 per Section 18 Table 18-1 |
|
|
|
|
|
| · | Royalties: Combined royalties on zeolite product sales range from approximately 8% to 13%, based on graduated schedules and contractual agreements (as described in Section 3.4). These royalties have been considered in assessing economic viability. |
|
|
|
|
|
| · | Inflation/escalation: Not explicitly modeled; operating and capital costs are considered reasonable for current and near-term operations. |
|
|
|
|
|
| · | Taxes and financing: Taxes and financing costs are not included in this analysis. Royalties are included as described above. |
19.2 Cash Flow Summary
A simplified pre-tax cash flow projection was prepared to demonstrate the project’s ability to generate positive cash flow under the stated assumptions. The cash flow analysis incorporates a royalty burden of 10% of product sales revenue for calculation purposes, consistent with the combined royalty range of approximately 8% to 13% disclosed in Section 3.4 and in the assumptions above. Taxes and financing costs are not included in this analysis.
For simplicity and consistency with current site performance, the 2025 operating and economic assumptions have been carried forward unchanged in subsequent years of the cash flow projection.
Salvage value of equipment has not been included in this analysis, consistent with SEC Regulation S-K 1300 requirements.
The results are summarized Table 19-1.
| GeoGRAFX GIS Services | July 2, 2025 |
| Bear River Zeolite Project | Page: 244 |
| Franklin County, USA |
Table 19-1 Simplified Pre-Tax Cash Flow Summary
| Year | Tons Sold | Revenue ($) | Operating Costs ($) | Capital Costs ($) | Royalties ($) | Pre-Tax Cash Flow ($) |
| 2025 | 12,600 | $3,364,200 | $777,924 | $100,000 | $336,420 | $2,149,856 |
| 2026 | 12,600 | $3,364,200 | $777,924 | $100,000 | $336,420 | $2,149,856 |
| 2027 | 12,600 | $3,364,200 | $777,924 | $100,000 | $336,420 | $2,149,856 |
| 2028 | 12,600 | $3,364,200 | $777,924 | $100,000 | $336,420 | $2,149,856 |
| 2029 | 12,600 | $3,364,200 | $777,924 | $100,000 | $336,420 | $2,149,856 |
Note: Five-year projection shown for illustration. Actual production life extends well beyond this period based on current Reserves.
19.3 Sensitivity Analysis
A sensitivity analysis was conducted to evaluate the impact of variations in key parameters on project economics. The project is most sensitive to changes in realized sales price and packaging mix, followed by variations in processing costs.
The results of the sensitivity analysis are illustrated in Table 19-2 and Figure 19.3-1. The project demonstrates robust positive cash flow across the tested range of Sales Price and Operating Cost assumptions.
Table 19-2 Sensitivity of Pre-Tax Cash Flow to Sales Price and Operating Cost Assumptions (2025 Example)
| Scenario | Sales Price ($/ton) | Operating Cost ($/ton) | Pre-Tax Cash Flow ($) |
| Base Case | 267.00 | 61.74 | 2,149,856.00 |
| Sales Price -10% | 240.30 | 61.74 | 1,716,894.40 |
| Sales Price +10% | 293.70 | 61.74 | 2,582,827.60 |
| Operating Cost +10% | 267.00 | 67.91 | 2,067,711.60 |
| Operating Cost -10% | 267.00 | 55.57 | 2,232,000.40 |
| GeoGRAFX GIS Services | July 2, 2025 |
| Bear River Zeolite Project | Page: 245 |
| Franklin County, USA |
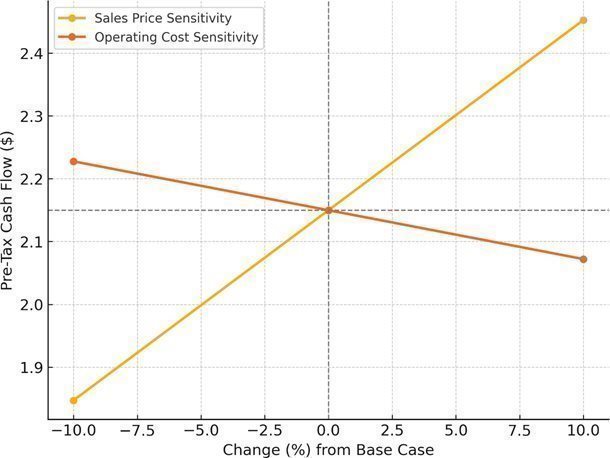
Figure 19.3-1 Pre-Tax Cash Flow Sensitivity to Sales Price and Operating Cost (2025 Example)
The following indicative sensitivities highlight the relative impact of sales price and operating cost variations on project cash flow, based on the scenarios tested.
Indicative sensitivities:
|
| · | ±10% change in sales price: Significant impact on cash flow. |
|
|
|
|
|
| · | ±10% change in operating cost: Moderate impact on cash flow. |
|
|
|
|
|
| · | ±20% change in sales price: Project remains viable under all tested scenarios. |
|
|
|
|
|
| · | ±20% change in operating cost: Project remains viable under all tested scenarios. |
Based on current market trends and long-term demand for zeolite products, the Qualified Person considers the price and cost assumptions used in this analysis to be reasonable.
19.4 Conclusion
The results of the economic analysis demonstrate that the Proven and Probable Mineral Reserves for the Bear River Zeolite Project can be economically extracted under the stated assumptions. The Qualified Person considers this sufficient to support the Mineral Reserve classification presented in Section 12.
| GeoGRAFX GIS Services | July 2, 2025 |
| Bear River Zeolite Project | Page: 246 |
| Franklin County, USA |
20 Adjacent Properties
No adjacent mineral properties are known to exist within the immediate area surrounding the Bear River Zeolite Mine. The Bear River Zeolite property includes both private and federally managed BLM land; however, the active mine site itself is located entirely on private ground.
To the knowledge of the Qualified Person, there are no known active or historical mineral exploration or mining operations on adjacent lands that would be considered relevant to the interpretation of the Mineral Resource or Mineral Reserve estimates disclosed in this report.
| GeoGRAFX GIS Services | July 2, 2025 |
| Bear River Zeolite Project | Page: 247 |
| Franklin County, USA |
21 Other Relevant Data and Information
As of the date of this report, the Qualified Persons are not aware of any other data or information relevant to the Bear River Zeolite Project that is material to the interpretation of the Mineral Resource, Mineral Reserve, or overall conclusions of this Technical Report Summary that has not already been disclosed herein.
| GeoGRAFX GIS Services | July 2, 2025 |
| Bear River Zeolite Project | Page: 248 |
| Franklin County, USA |
22 Interpretation and Conclusions
22.1 Introduction
This section summarizes the key interpretations and conclusions derived from the technical work completed on the Bear River Zeolite Project, as documented in the preceding sections of this Technical Report Summary. It integrates the Qualified Persons’ findings related to geology, resources, reserves, mining, processing, infrastructure, markets, and economic analysis to provide an overall assessment of the project’s current status and future potential.
22.2 Mineral Tenure, Surface Rights, Water Rights, Royalties and Agreements
The Bear River Zeolite (BRZ) Project consists of a combination of unpatented federal placer mining claims and private land leased under a long-term mining agreement. The Project is located in Franklin County, Idaho, and is controlled by Bear River Zeolite Company, a wholly owned subsidiary of United States Antimony Corporation (USAC).
22.2.1 Mineral Tenure and Land Control
The mineral tenure includes 50 contiguous unpatented federal placer mining claims, each approximately 20 acres, located on lands administered by the U.S. Bureau of Land Management (BLM). These claims cover a total of approximately 994 acres and are held directly by Bear River Zeolite Company. All claims were staked in October 2020, recorded with the BLM, and are currently active and valid through August 31, 2025, with annual maintenance fees fully paid. The claims conform to BLM regulations and Idaho Code § 47-6, with required Notices of Intent to Hold filed with Franklin County.
In addition to federal mining claims, BRZ holds a long-term lease agreement with Zeolite, LLC for approximately 320 acres of private ground, which includes the active open pit, mill site, access infrastructure, and adjacent undisturbed areas. This lease was renewed effective January 1, 2025, and extends through December 31, 2034, with automatic annual renewal provisions unless terminated with 180 days’ written notice. There are no known encumbrances, disputes, or conflicting claims associated with the lease, and BRZ maintains exclusive operational control over the leased property.
22.2.2 Surface Rights and Access
Surface rights are controlled by the BLM on the mining claims and by Zeolite, LLC on the leased ground. The lease grants BRZ broad surface use rights, including construction of roads, mills, utilities, and related facilities; excavation; storage of materials; and exclusive easement access. Use of the surface is subject to environmental safeguards, spill prevention, and reclamation responsibilities, in accordance with Idaho DEQ regulations.
Access to the site is supported by county roads and utility easements, with no restrictions known that would affect the life-of-mine (LOM) plan.
22.2.3 Water Rights
Water for operations is sourced from onsite wells located on the leased private land. This water is used for dust suppression and cleaning purposes. Although no separate water right has been adjudicated under state law, water use is covered under the lease with Zeolite, LLC and is considered adequate to support the life-of-mine (LOM) plan.
| GeoGRAFX GIS Services | July 2, 2025 |
| Bear River Zeolite Project | Page: 249 |
| Franklin County, USA |
No additional water rights are anticipated to be required to support the LOM operations as currently envisioned.
22.2.4 Royalties and Agreements
The project is subject to a structured production royalty schedule under the lease with Zeolite, LLC, with rates ranging from $9.00/ton to $12.00/ton depending on annual tonnage. A minimum annual royalty payment of $100,000 is guaranteed under the lease terms.
Additional royalty obligations include:
| · | Nick Raymond and the Estate of George Desborough: sliding scale royalty of $1.00 to $5.00 per ton, depending on the sale price |
| · | Delaware Royalty Company, Inc. (controlled by a USAC shareholder): 3% royalty on gross proceeds from all zeolite sales |
On a combined basis, BRZ pays total royalties ranging from 8% to 13% of zeolite product revenue. According to United States Antimony Corporation’s (USAC) filings, Bear River Zeolite (BRZ) accrued royalties payable of $133,434 as of December 31, 2024, and $153,429 as of December 31, 2023.
22.2.5 Encumbrances and Legal Considerations
The Bear River Zeolite operations are fully permitted for ongoing extraction and processing activities. All necessary authorizations from the Idaho Department of Environmental Quality and the Mine Safety and Health Administration (MSHA) are in place. No pending legal actions or unresolved land access issues are known.
While past MSHA inspections resulted in citations, these were resolved, and site safety upgrades were implemented in 2024. To the extent known by the Qualified Person, no other significant factors or risks are present that would materially impact BRZ’s ability to access or work the property as described in the LOM plan.
22.3 Geology and Mineralization
The Bear River Zeolite Project is situated within the southeast portion of the Basin and Range Province, on the western slope of the Bear River Range in Franklin County, Idaho. The geologic setting is structurally complex and reflects a multi-phase tectonic history that includes both compressional deformation from the Sevier and Laramide orogenies and later Basin and Range extensional faulting.
Regionally, the project area is positioned along the margin of the Cordilleran overthrust belt and near the Wasatch Fault Zone, a prominent north-trending high-angle normal fault system associated with Basin and Range extension.
The zeolite mineralization at the project is hosted within the Tertiary Cache Valley Formation of the Salt Lake Group. This unit consists of tuffaceous sedimentary rocks deposited in lacustrine environments, along with interbedded limestones, conglomerates, siltstones, and sandstones. Deposition occurred during the Miocene and Pliocene in a low-energy, closed-basin hydrologic setting following significant regional extension. The formation was subsequently overlain by alluvial deposits and weathered tuffaceous soil.
Mineralization at the Bear River property is stratiform and laterally continuous, with the zeolite-rich beds reaching cumulative thicknesses of over 93 feet. The host rocks include altered air-fall tuffs interbedded with thin limestone layers, interpreted as having been deposited in shallow freshwater lake environments. A thin to moderately thick overburden of rhyolitic tuff (“limey shale”) locally caps the zeolitic units and forms a durable protective layer that controls surface erosion and ridge formation. In areas where this caprock is thin or absent, the underlying zeolitic material is more susceptible to weathering.
| GeoGRAFX GIS Services | July 2, 2025 |
| Bear River Zeolite Project | Page: 250 |
| Franklin County, USA |
The principal zeolite mineral is clinoptilolite, comprising approximately 85% of the mineralized zone. The remaining constituents include opaline silica and minor clay minerals. Clinoptilolite is a naturally occurring hydrated alkali and alkaline-earth aluminosilicate with a high cation exchange capacity (CEC).
The BRZ™ clinoptilolite zeolite samples exhibit a high cation exchange capacity (CEC) of 98–178 meq/100 grams, low sodium content (under 0.5%), high potassium content, a Mohs hardness of 3.5–4, and a consistent geochemical composition across the deposit. The consistency of CEC values across the deposit supports the robustness of the geologic model and contributes to predictable product performance.
The unique mineralogy and performance properties of the zeolite are influenced by the temperature of the original ash at deposition, the intrinsic geochemistry of the felsic source tuff, and the chemistry of the lacustrine waters into which it settled.
Zeolite formation in this environment reflects diagenetic alteration of glassy volcanic ash under mildly alkaline to saline lake water conditions. The resulting mineral assemblage is consistent with other known sedimentary zeolite deposits formed in a closed basin lacustrine systems. The continuity, mineral purity, and favorable physical characteristics of the Bear River zeolite deposit support its ongoing use in a wide range of industrial and environmental applications.
22.4 Exploration, Drilling, and Sampling
Since initiating production in 2002, Bear River Zeolite (BRZ) has focused primarily on mining currently identified zeolite material rather than expanding the resource. Following a change in management in 2023, the company initiated a formal exploration and definition drilling program in 2024 to support future mine planning and to facilitate the development of Mineral Resource and Reserve estimates in compliance with SEC Regulation S-K 1300.
24.4.1 Exploration (Other Than Drilling)
Relevant exploration work has included high-resolution drone photogrammetry, geologic mapping, and surface geochemical sampling.
A photogrammetric topographic survey was conducted in May 2024 by Barr Engineering Co. The drone- based survey produced orthophotos and a 2-foot contour surface covering the leased mine area and portions of adjacent federal claims. Ground control was established using GNSS survey methods, and outputs were delivered in NAD83 Idaho East (EPSG:2241). This base surface formed the foundation for geological modeling and resource estimation.
Geological mapping focused on the mine pit area and was led by consulting geologist Troy Blackledge. This work helped delineate stratigraphic contacts between zeolitized tuff, overburden, and marker horizons such as the “limey shale.” Prior mapping by BRZ and regional USGS data were also referenced but not used directly in model construction due to resolution constraints.
| GeoGRAFX GIS Services | July 2, 2025 |
| Bear River Zeolite Project | Page: 251 |
| Franklin County, USA |
Surface sampling was completed in June 2024. Eight rock samples were collected from zeolite-bearing outcrops and submitted for cation exchange capacity (CEC) testing. CEC values ranged from 106 to 172 meq/100g, confirming the presence of high-grade zeolitized material. One sample of unaltered rhyolitic tuff returned a low CEC of 4.2 meq/100g, helping distinguish unmineralized units. These results align well with earlier observations from mined areas, confirming that surface exposures reflect the quality and extent of subsurface mineralization.
24.4.2 Drilling Program
The first modern drilling at BRZ was conducted in June 2024 by McCallum Rock Drilling (MRD). The campaign consisted of 80 vertical hydraulic percussion holes totaling 6,713 feet. Drill holes were spaced on 100-foot centers along access roads to minimize surface disturbance. Each hole was drilled to 84 feet and sampled at 6-foot intervals, generating 14 samples per hole.
Representative chip samples were logged and stored in trays. Logging was performed by a contract geologist using consistent protocols. While recovery was not recorded, sample integrity was maintained. Collars were located using handheld GPS and plugged with bentonite upon completion. No downhole surveys were conducted due to the shallow, vertical nature of the holes.
Drilling confirmed strong lateral continuity of zeolite-rich beds within the Cache Valley Formation, particularly within a unit designated "zeo1". This unit, identified during geologic modeling based on CEC values, stratigraphic position, and visual mineralogy, exhibited the most favorable characteristics and is now the primary target horizon for mining and resource modeling. The consistent CEC values observed in zeo1—averaging 137.2 meq/100g—support the robustness of the geologic model and validate prior interpretations based on pit mapping and historical production. Drilling results showed multiple stratigraphic layers with favorable CEC values. Several holes terminated in mineralization, indicating the deposit remains open at depth.
Statistical analysis of 938 drill samples grouped by lithology showed that zeo1 had the highest mean CEC (137.2 meq/100g), compared to lower values in zeo2 and rhyolitic tuff. Data visualization using cross sections, histograms, and box plots helped define the distribution and variability of CEC values.
24.4.3 Sampling Quality and Data Confidence
Sampling, logging, and analysis were conducted in accordance with industry standards. While true thickness has not yet been determined from drill data, the program was well-aligned with the project’s stratigraphy. Collar coordinates, spacing, and lithologic boundaries are appropriate to support Mineral Resource and Reserve estimation.
The Qualified Person considers the data quality and distribution sufficient to characterize geological and grade continuity in the drilled area. No sampling or recovery issues are known that would materially affect the reliability of the data.
24.4.4 Exploration Potential
To date, exploration has been limited to approximately 10% of the 320-acre private lease area. The remaining land—including 994 acres of adjacent BLM claims—has not yet been drilled and only sparsely sampled. Given the consistency of the geologic setting and the results of the 2024 program, the property is considered to have strong exploration potential. Future work will involve expanded mapping, surface sampling, and drilling.
| GeoGRAFX GIS Services | July 2, 2025 |
| Bear River Zeolite Project | Page: 252 |
| Franklin County, USA |
22.5 Data Verification
The Qualified Person (QP) conducted a comprehensive data verification program for the Bear River Zeolite Project in 2024. This included an audit of the drill hole database, QA/QC review, collar location field checks, and confirmation of mineral tenure.
Under the direction of GeoGRAFX Consulting LLC, the collar, lithology, and assay tables were validated using Datamine Discover and Leapfrog Geo. A visual inspection confirmed spatial integrity of the drill hole data, and only one overlapping sample interval was identified and corrected.
The QP conducted site inspections of the active mine and processing plant, observed drill collar locations in the field, and held discussions with mine personnel regarding drilling, sampling, and operational procedures. Lithologic logs were reviewed and found to align with observed geology and the established deposit model. Sampling intervals, labeling practices, and physical condition of stored samples were consistent with accepted industry practices.
Independent check assays of ten archived samples submitted to ALS Saskatoon using identical methods demonstrated a 99% correlation with original results, confirming analytical precision. The QP also reviewed all sampling, preparation, and laboratory procedures. While certified reference materials were not available for zeolite, BRZ’s internal QA/QC included blanks and field duplicates at a frequency of 1:20, which returned results within acceptable limits.
Field verification of drill collars during the November 2024 site visit confirmed positional accuracy within the expected range of the handheld GPS. A review of unpatented claim status through the BLM’s MLRS system confirmed all claims are active and in good standing.
Based on this verification process, the QP considers the geologic, geochemical, and spatial data to be reliable, internally consistent, and suitable for use in Mineral Resource and Reserve estimation. No material errors or limitations were identified that would affect the conclusions of this technical report. This level of confidence in the verified data directly supports the validity of the Mineral Resource and Reserve classifications presented herein.
22.6 Mineral Processing and Metallurgical Testing
The Bear River Zeolite (BRZ) deposit consists primarily of high-purity clinoptilolite, and no conventional metallurgical concentration or recovery processes are employed. Instead, the value of the material is derived from the natural physical and chemical properties of the natural zeolite, primarily clinoptilolite, specifically its Cation Exchange Capacity (CEC) and mineralogical composition. The clinoptilolite is mined, crushed, and screened into various grain sizes for industrial use.
As such, traditional metallurgical recovery methods (e.g., flotation, leaching, or smelting) are not applicable. Instead, BRZ and external laboratories have conducted extensive product characterization and performance testing focused on:
|
| · | Cation Exchange Capacity (CEC), a key indicator of zeolite quality |
|
| · | Particle size distribution |
| GeoGRAFX GIS Services | July 2, 2025 |
| Bear River Zeolite Project | Page: 253 |
| Franklin County, USA |
|
| · | Absorption characteristics |
|
| · | Specific surface area |
|
| · | Bulk density |
|
| · | Color consistency and moisture content |
Additional product specifications are tested internally and externally to support sales into various markets, including environmental remediation, agriculture, animal feed, filtration, and industrial absorbents.
No chemical reagents or metallurgical processing are used at the site. All mineral processing consists of dry mechanical crushing, screening, and bagging. The plant includes baghouses for dust control, and final product quality is determined by grain size and chemical composition, with no further beneficiation required.
The Qualified Person is satisfied that the historical and ongoing product testing is sufficient to confirm the physical and performance characteristics of the zeolite, and that the data supports continued commercial sale of BRZ products into established end-user markets.
22.6.1 Testwork Overview
In 2024, extensive analytical testing was conducted to characterize the zeolitic material. A total of 945 chip samples from percussion drilling were submitted to ALS Environmental Laboratory (Saskatoon, Canada), an independent and ISO/IEC 17025-certified facility. CEC determinations were performed using Method E407, based on ammonium acetate extraction. The dataset includes 559 samples classified as Zeo1 lithology, which forms the basis of the current resource model.
CEC values for Zeo1 material ranged from 40.9 to 197.0 meq/100g, with an average of 137.21 meq/100g. Variability in the data reflects changes in mineral content, degree of alteration, and potential lithologic misclassifications. The results support a strong ion exchange capacity and suitability for commercial use in agriculture, water filtration, and industrial applications.
To confirm mineralogy, fourteen representative samples of the different lithologies were analyzed at SGS Canada Inc. (Lakefield, Ontario), another independent and ISO/IEC 17025-accredited laboratory. X- Ray Diffraction (XRD) analysis of the eight Zeo1 samples exhibit a strong clinoptilolite dominance, with an average content of 81.16%, ranging from 76.6% to 85.4%. This high concentration confirms that these samples are primarily composed of zeolite minerals, reinforcing their strong cation exchange capacity (CEC), which averages 146.45 meq/100g (ranging from 97.6 to 178 meq/100g). The variability in CEC values correlates with slight differences in the purity and crystallinity of the clinoptilolite.
Additional whole rock geochemical analysis and elemental assays were conducted at SGS Burnaby using XRF, ICP-AES, and ICP-MS methods. These confirm a silica-rich aluminosilicate composition with minimal deleterious elements. Trace elements (e.g., Ba, Sr, Li, Zn) were consistent with expected mineralogy, and no elevated levels of heavy metals or contaminants were observed.
22.6.2 Processing Methods
BRZ’s operation includes dry mechanical crushing, screening, and bagging. No chemical reagents or water-based beneficiation are used. Product quality is maintained by selective mining and physical classification. Final product size, moisture content, and CEC are used to determine suitability for market- specific applications.
| GeoGRAFX GIS Services | July 2, 2025 |
| Bear River Zeolite Project | Page: 254 |
| Franklin County, USA |
22.6.3 Certifications
BRZ zeolite is registered and compliant with several regulatory frameworks, including:
|
| · | GRAS anti-caking agent under CFR Title 21, Sections 182.2729 and 582.2729 |
|
| · | OMRI-certified for use in organic livestock and crop applications |
|
| · | NSF/ANSI Standards 50, 60, and 61 for drinking water and filtration uses |
|
| · | DOT Class 50: Non-hazardous |
22.6.4 Qualified Person’s Opinion
The QP considers the metallurgical and mineralogical data generated in 2024 to be sufficient for use in resource classification and technical disclosure. Laboratory methods were conducted by ISO-certified independent facilities using accepted analytical standards. No deleterious elements have been identified that would impair the marketability of BRZ zeolite. Future sampling programs should continue to incorporate spatially distributed geochemical analyses to support classification and maintain product quality. No additional beneficiation is considered necessary, as the material’s inherent purity and performance characteristics meet market specifications with only mechanical processing.
22.7 Mineral Resource Estimate
The Mineral Resource estimate for the Bear River Zeolite Project is effective as of May 22, 2024, and was prepared in accordance with the disclosure requirements of SEC Regulation S-K 1300. The estimate is based on all drilling, sampling, and technical data available through December 31, 2024. The Qualified Person finalized and signed off on this Mineral Resource estimate as of May 13, 2025. The estimate was developed using a geologic block model constrained by a 100 meq/100g cation exchange capacity (CEC) cutoff grade and includes Measured, Indicated, and Inferred Mineral Resources.
Resources were classified based on data density, confidence in geological continuity, and quality of supporting assay and lithologic information. The estimation process relied on three-dimensional modeling of zeolite-bearing tuffs and incorporated data from 69 vertical drill holes distributed across the deposit. Visual confirmation of zeolite mineralization in drill logs, supported by CEC analysis and geologic mapping, informed the resource boundaries and classification.
The total in-situ Mineral Resource, inclusive of all material above the cutoff grade, is estimated at approximately 765,000 short tons. This includes 339,000 short tons of Measured and Indicated material with an average CEC value of 146 meq/100g, and 426,000 short tons of Inferred material averaging 140 meq/100g. These figures reflect the full modeled inventory and were used as the basis for defining the Mineral Reserve presented in Section 12.
In compliance with SEC requirements, the portion of Measured and Indicated material not converted to Mineral Reserves is reported separately. Mineral Resources are presented exclusive of Reserves in the main resource summary tables in Section 11. The Qualified Person cautions that Inferred Resources are considered too speculative for use in mine planning and cannot be converted to Mineral Reserves.
| GeoGRAFX GIS Services | July 2, 2025 |
| Bear River Zeolite Project | Page: 255 |
| Franklin County, USA |
The geologic model demonstrates continuity of mineralization both laterally and at depth. The current estimate is supported by a conservative modeling approach and incorporates validated input data and classification standards consistent with S-K 1300. No known legal, environmental, or permitting issues were identified that would materially impact the stated Mineral Resource.
As of May 22, 2024, the Bear River Zeolite Project hosts the following in-situ Mineral Resources, reported above a cutoff grade of 100 meq/100g CEC and exclusive of Mineral Reserves. Measured and Indicated Mineral Resources, reported exclusive of Mineral Reserves, are summarized in Table 11-11 in compliance with SEC Regulation S-K 1300. Inferred Mineral Resources are summarized separately in Table 11-12 below.
Table 22-1 Measured and Indicated Mineral Resources (Exclusive of Reserves)
| Geologic Model | Category | Mass short. tons | Average Value All Material OK CEC |
| Zeolite | Measured | 54,000 | 147.16 |
| Indicated | 285,000 | 145.41 | |
| Measured + Indicated | 339,000 | 146.16 | |
| Differences may occur in totals due to rounding | |||
Table 22-2 Inferred Mineral Resources (Exclusive of Reserves)
| Geologic Model | Category | Mass short tons | Average Value All Material OK CEC |
| Zeolite | Inferred | 426,000 | 139.71 |
| Differences may occur in totals due to rounding | |||
These estimates are based on validated drill data and block modeling of zeolite-bearing tuffs and reflect the tonnage and grade of material with reasonable prospects for economic extraction under current conditions.
These figures reflect the Mineral Resource inventory exclusive of reserves, as required by SEC Regulation S-K 1300, and represent only the material not converted to Mineral Reserves under the economic assumptions applied in Section 12. No known legal, environmental, or permitting issues have been identified that would materially impact the stated Mineral Resource.
22.8 Mineral Reserve Estimates
The Mineral Reserves for the Bear River Zeolite Project have been defined and classified in accordance with SEC Regulation S-K 1300, based on a mine plan, economic assumptions, and modifying factors deemed appropriate by the Qualified Person. The estimate is based on all drilling, sampling, and technical data available through December 31, 2024. The overall Technical Report Summary (TRS) has an effective date of March 31, 2025; however, no additional data collected after December 31, 2024 was incorporated into the Mineral Reserve estimate presented in this section.
| GeoGRAFX GIS Services | July 2, 2025 |
| Bear River Zeolite Project | Page: 256 |
| Franklin County, USA |
22.8.1 Summary
The Mineral Reserve estimate for the Bear River Zeolite Project was developed using a block model constrained by a 3-D pit shell generated with MineFlow™ software, incorporating validated modifying factors and geotechnical constraints. The estimate is based on Measured and Indicated Resources only, with no inclusion of Inferred material. The block model and pit design reflect all drilling, sampling, and technical data available through December 31, 2024, and incorporate the most recent topographic survey completed on May 22, 2024. The Reserve estimate, as finalized and reported in Section 12 of this report, supports the demonstration of economic viability under the current mine plan and production scenario. The Mineral Reserves for the Bear River Zeolite Project are summarized in Table 12-1 below:
Table 22-3 Mineral Reserve for Bear River Zeolite Project
| Classification | Tonnage (short tons) | Grade (CEC meq/100g) | Recovery (%) | Saleable Product (short tons) |
| Proven | 2,267,000 | 147.0 | 100 | 2,267,000 |
| Probable | 2,860,000 (*) | 145.5 | 100 | 2,860,000 |
| Total | 5,127,000 (*) | 146.2 | 100 | 5,127,000 |
(*)The Probable tonnage has been reduced by 12,600 short tons to account for estimated ore mined between the last topographic survey (May 22, 2024) and the report effective date (May 31, 2025), based on internal production data (Memo from Jeff Fink to Joe Bardswich, May 22, 2025. The number was rounded up to the nearest 100 tons from 12,550). All ore mined during this period came from Probable Reserves on active benches.
These Reserves are considered dry, in situ, and exclusive of Mineral Resources. All estimated ore is above the cut-off (CEC >100) and lies within property boundaries.
22.8.2 Geological and Economic Viability
The pit shell and final design pit demonstrate that most of the zeolite lies close to the surface, resulting in an extremely favorable average waste-to-ore (W:O) ratio of 0.25, which is significantly lower than typical ratios for industrial mineral operations. This contributes to highly economic conditions for sustained long-term operations. The current low production rate (~12,600 tons/year) implies a potential mine life exceeding 400 years; however, the deposit could support expanded operations at substantially higher production rates for 20+ years, contingent on infrastructure and market demand.
The economic viability is supported by:
|
| · | High CEC grades (~146) |
|
| · | 100% processing recovery |
|
| · | No dilution or mining losses applied (visual grade control mining) |
|
| · | Simple geology with minimal overburden |
22.8.3 Risk Factors
Despite the strong reserve base, the Qualified Person notes several risk factors that could materially impact reserve viability:
|
| · | Market risks: Zeolite pricing fluctuations |
|
| · | Geological uncertainty: Limited drill density in current pit area |
| GeoGRAFX GIS Services | July 2, 2025 |
| Bear River Zeolite Project | Page: 257 |
| Franklin County, USA |
|
| · | Cost risks: Fuel, labor, and processing inflation |
|
| · | Permitting/environmental: Potential regulatory changes |
|
| · | Logistics: Haulage constraints or infrastructure limits |
While these factors warrant continued monitoring, none are currently expected to materially affect the viability of the Mineral Reserve.
22.8.4 Opportunities for Enhancement
There is a clear opportunity to upgrade Probable to Proven Reserves through infill drilling. The QP recommends an 8-hole program to achieve a 100x100 ft grid spacing within the current pit area, enhancing confidence and potentially supporting future feasibility studies.
22.9 Mining Methods
The Bear River Zeolite operation employs conventional open-pit mining using a truck-and-loader configuration with controlled drilling and blasting. As of 2025, the mine design incorporates 20-foot-high benches, which offer a practical balance between excavation efficiency and selective ore recovery.
Mining is conducted using visual ore control, enabled by the strong lithological contrast between zeolite ore and surrounding waste, eliminating the need for grade control drilling or blending strategies.
No dilution factor is applied, and mining recovery is assumed to be 100%, based on historical production performance and the ease of distinguishing ore from waste in the field. These assumptions are considered reasonable based on operational results to date.
The mine is advanced in phases, with overburden stripping conducted as required and infrastructure configured to support ongoing pit development.
The current mining method supports the production schedule and Reserve classification described elsewhere in this report and is consistent with the physical and operational characteristics of the Bear River Zeolite deposit. It is appropriate for the selective extraction of zeolite at the current production scale.
22.10 Processing and Recovery Methods
The Bear River Zeolite Project employs a well-established and proven crushing and screening process suitable for the site's mineralization. No chemical treatment or flotation is required. The current facility produces a range of coarse and powder zeolite products using mechanical processing equipment, including jaw and cone crushers, hammer mills, high-frequency screens, and a Raymond mill circuit.
Production increased to 11,095 tons in 2024, up from 10,145 tons in 2023, reflecting operational improvements made under the current management team. These upgrades included repairs to key equipment (notably the cone and jaw crushers), implementation of preventative maintenance protocols, and process debottlenecking, which raised throughput from 4 to 10 tons per hour, with a target of 14–18 tons/hour by late 2025.
First quarter 2025 production totaled 3,802 short tons, up from 2,273 short tons in Q1 2024—an increase of 1,529 short tons year-over-year equal to 67%. This growth underscores the effectiveness of recent equipment upgrades and operational enhancements. The plant currently operates at a sustained throughput rate of approximately 12,600 short tons per year, consistent with prevailing market demand and sales volume.
| GeoGRAFX GIS Services | July 2, 2025 |
| Bear River Zeolite Project | Page: 258 |
| Franklin County, USA |
All products are packaged on site, either in bulk bags or small bags, with packaging rates of 4–10 tons/hour depending on format. The current operations do not require water or chemical reagents, and the existing 750 KVA transformer infrastructure meets current energy demands. With low consumable use and proven performance, the processing operation is stable, scalable, and appropriately aligned with the Mineral Reserve and market outlook for BRZ products.
22.11 Infrastructure
The Bear River Zeolite Project benefits from established infrastructure that supports ongoing mining and mineral processing operations. The project is located approximately 8 miles northeast of Preston, Idaho, with all-season access via maintained county roads and a short private haul road connecting to the mine site.
22.11.1 Site Facilities
The site includes an open pit mine, crushing and screening facilities, storage yards, office space, and a small maintenance area. The processing plant consists of multiple enclosed buildings equipped with jaw and cone crushers, hammer mills, roller mills, vibratory screens, and associated conveyors. Final zeolite products are bagged onsite and transported by truck to customers or regional distribution hubs.
The mine has sufficient internal roadways and stockpile areas to support efficient material movement and phased pit development. Designated laydown areas for equipment, as well as well-defined waste rock and overburden stockpiles, are located adjacent to the pit rim.
22.11.2 Power and Utilities
The mine site is serviced by a rural electric utility with overhead power lines extending to the mill buildings. No natural gas service is available. Onsite diesel storage is used for mobile equipment. Water for dust suppression and minor processing is sourced from a private well located on the leased land, and water is distributed via water truck. There are no known limitations associated with power or water availability at current operational scale.
22.11.3 Communications
Basic phone and internet services are available through cellular signal in the area, sufficient to support operations, monitoring, and communications with company headquarters.
22.11.4 Personnel and Logistics
The operation is staffed by local personnel and accessed daily by light trucks. The proximity to Preston and other nearby communities provides reliable labor access and consistent delivery of supplies and equipment. There is no camp or onsite housing, and the operation is conducted on a day-shift basis.
22.11.5 Limitations and Expansion Potential
The current infrastructure is fully sufficient to support the existing and near-term life-of-mine (LOM) plan. There is sufficient land within the lease boundary to accommodate additional stockpiles, product storage, or mill expansion if required. No known infrastructure, environmental, or permitting constraints would prevent continued operations or modest facility upgrades in line with future production needs.
| GeoGRAFX GIS Services | July 2, 2025 |
| Bear River Zeolite Project | Page: 259 |
| Franklin County, USA |
22.12 Market Studies
Bear River Zeolite (BRZ) produces high-purity natural clinoptilolite zeolite for industrial, agricultural, environmental, and consumer markets. With an estimated 22% share of the North American natural zeolite market, BRZ is a recognized regional supplier. Key applications include agriculture (30%), animal feed (25%), water treatment (20%), environmental remediation (15%), and odor control (10%).
Global demand for natural zeolite is projected to grow at a CAGR of 2.9% from 2024 through 2032, driven by sustainable agriculture, environmental regulations, and the expansion of green technologies. BRZ’s product line includes granular, powdered, and blended zeolite tailored to end-user specifications. The company launched a new animal feed product, CattleMax™, in 2024 to expand market share in livestock nutrition.
Sales are conducted on a spot or short-term contract basis. No long-term offtake agreements or hedging instruments are in place. BRZ's pricing ranges from $50 to $300 per ton depending on product type and packaging, with a reported 2024 average sales price of $264 per ton. The company anticipates a 10% price increase in 2025 based on current customer demand forecasts and internal cost assessments.
Production costs remain competitive, supported by low stripping ratios, straightforward open-pit mining, and a scalable process plant. While prior operational inefficiencies increased costs in 2024, corrective maintenance and staffing upgrades are expected to reduce costs in future years. [BRZ plans to maintain and grow market share through continued development of specialty product lines and expansion into targeted end-use markets.
The Qualified Persons have reviewed BRZ’s internal pricing, sales, and market data and consider the
information reliable and appropriate for use in economic projections and mine planning.
22.13 Environmental, Permitting and Social Considerations
The Bear River Zeolite property includes both private leased ground and adjacent federal (BLM- managed) mining claims. Current mining and processing operations are located entirely on the privately leased portion of the property. No baseline or supporting environmental studies were required for the Bear River Zeolite Mine. All necessary permits to operate have been obtained and are detailed below. Each permit application addresses the potential environmental impacts of the operation, includes provisions for monitoring, and incorporates a reclamation or closure plan where applicable.
Although the project is not subject to federal land use permits or NEPA review, Bear River Zeolite Company (BRZ) has undertaken baseline environmental studies and permitting activities in accordance with applicable state regulations and to fulfill SEC S-K 1300 disclosure requirements.
22.13.1 Permitting
The project operates under an Air Quality Permit to Construct (No. P-2007.0025) issued by the Idaho Department of Environmental Quality (IDEQ), most recently revised in January 2025. This permit governs dust control, permitted equipment usage, and production limits. Water used for dust suppression is supplied from a leased private well. No chemical reagents or wastewater discharge occurs onsite, and there are no federal NPDES or groundwater permits in place or required.
| GeoGRAFX GIS Services | July 2, 2025 |
| Bear River Zeolite Project | Page: 260 |
| Franklin County, USA |
22.13.2 Environmental Studies
Baseline environmental studies were conducted voluntarily to support responsible mine planning. These include:
|
| · | A wetland desktop survey using the U.S. Fish and Wildlife Service’s National Wetlands Inventory (NWI), identifying isolated emergent wetlands, freshwater ponds, and riverine features near but not materially affected by the mine area. |
|
|
|
|
|
| · | A soils and vegetation assessment based on NRCS SSURGO data, which identifies ecological sites typical of sagebrush-grassland communities. |
|
|
|
|
|
| · | A desktop endangered species review using the USFWS IPaC tool, which identified potential habitat for species such as the North American wolverine, monarch butterfly, and Ute ladies'- tresses. No designated critical habitats are present within the project boundary. |
|
|
|
|
|
| · | A review of wildlife usage, noting seasonal presence of mule deer and pronghorn, as well as sagebrush-obligate birds. No state or federal wildlife corridors or conservation easements overlap the site. |
22.13.3 Closure and Reclamation
Reclamation of disturbed areas is conducted on an ongoing basis using locally sourced native seed. While no formal closure bond is required for private land operations in Idaho, BRZ maintains and implements a mine plan that includes final grading, erosion control, and revegetation.
22.13.4 Community and Social Engagement
The project operates on leased private land, and landowner coordination is ongoing and cooperative. The project has no known adverse social or cultural impacts. No formal tribal consultation or community impact assessments have been required to date. Site access is controlled via locked gates and fencing, and there is no public use of the mine area.
22.13.5 Qualified Person’s Opinion
The Qualified Person is of the opinion that environmental and permitting considerations have been adequately addressed for the current scope of operations. No material environmental risks, liabilities, or unresolved regulatory issues are known that would adversely impact the viability of the project.
22.14 Capital and Operating Costs
Capital and operating cost estimates for the Bear River Zeolite Project have been prepared using site- specific data from ongoing operations, which have been in continuous production since the early 2000s. The estimates are based on actual recorded site-level expenditures from 2019 through 2024, with forward-looking projections developed by site management for 2025 and 2026.
Adjustments were applied to reflect documented changes in fuel, labor, processing inputs, and other key cost drivers.
Capital costs are reported annually in aggregate, consistent with the structure of site-level records, and include allowances for infrastructure maintenance, equipment replacement, and plant upgrades. No major expansion capital is currently budgeted.
| GeoGRAFX GIS Services | July 2, 2025 |
| Bear River Zeolite Project | Page: 261 |
| Franklin County, USA |
Operating costs are expressed on a per-ton mined and processed basis and reflect the cost of mining, processing, packaging, and general administration. Environmental compliance and permitting costs are included within the reported categories. Reported costs support the economic assumptions used in the Mineral Reserve analysis and are considered representative of actual site performance.
The Qualified Person considers the capital and operating cost estimates to be reasonable and appropriate for the current production scale, and sufficiently representative of the site’s expected cost structure to support the Mineral Reserve estimate presented in Section 12.
22.15 Economic Analysis
An economic analysis was performed to demonstrate the viability of the Proven and Probable Mineral Reserves for the Bear River Zeolite Project, in accordance with SEC Regulation S-K 1300. The analysis supports the Reserve classification disclosed in Section 12 and is based on site-specific production rates, cost structures, and revenue assumptions previously detailed in Section 18.
The cash flow model is forward-looking in nature and uses a simplified approach consistent with current site operations. Assumptions include:
|
| · | Reserve basis: 5.127 million short tons Proven and Probable |
|
|
|
|
|
| · | Production rate: 12,600 short tons per year |
|
|
|
|
|
| · | Mine life: 407 years at current production rate |
|
|
|
|
|
| · | Average sales price: $267/ton |
|
|
|
|
|
| · | Operating cost: $61.74/ton |
|
|
|
|
|
| · | Annual capital cost: $100,000 |
|
|
|
|
|
| · | Royalty burden: Assumed 10% of revenue (within the 8–13% contractual range) |
|
|
|
|
|
| · | Taxes and financing: Not modeled |
These inputs result in a pre-tax cash flow of $2,149,856 per year, totaling approximately $10.75 million over the 5-year projection, as shown in Table 19-1. The analysis demonstrates strong positive cash flow under base-case conditions and confirms the Project’s ability to operate profitably using conservative, documented production and cost data. Based on the current production rate, the mine life supported by the defined Mineral Reserve exceeds 400 years.
Table 22-4 Simplified Pre-Tax Cash Flow Summary
| Year | Tons Sold | Revenue ($) | Operating Costs ($) | Capital Costs ($) | Royalties ($) | Pre-Tax Cash Flow ($) |
| 2025 | 12,600 | $3,364,200 | $777,924 | $100,000 | $336,420 | $2,149,856 |
| 2026 | 12,600 | $3,364,200 | $777,924 | $100,000 | $336,420 | $2,149,856 |
| 2027 | 12,600 | $3,364,200 | $777,924 | $100,000 | $336,420 | $2,149,856 |
| 2028 | 12,600 | $3,364,200 | $777,924 | $100,000 | $336,420 | $2,149,856 |
| 2029 | 12,600 | $3,364,200 | $777,924 | $100,000 | $336,420 | $2,149,856 |
Note: Five-year projection shown for illustration. Actual production life extends well beyond this period based on current Reserves.
| GeoGRAFX GIS Services | July 2, 2025 |
| Bear River Zeolite Project | Page: 262 |
| Franklin County, USA |
A sensitivity analysis was performed to evaluate the impact of changes in sales price and operating costs. The project remains economically robust under sensitivity scenarios of up to ±20% in both price and cost variables.
|
| · | A ±10% change in sales price results in a significant impact on cash flow |
|
|
|
|
|
| · | A ±10% change in operating costs has a moderate impact |
|
|
|
|
|
| · | The project maintains robust economics under ±20% changes in either variable |
Based on this analysis, the Qualified Person considers the Bear River Zeolite Project’s Mineral Reserves to be economically extractable under the stated assumptions. The analysis confirms that current operational practices and market conditions are sufficient to support long-term production.
Note: All assumptions were developed in consultation with BRZ management and reflect current operational practices and internal forecasts.
22.16 Risks and Opportunities
The following combined assessment of risks and opportunities highlights key factors that may influence the long-term performance, economic viability, and development potential of the Bear River Zeolite Project.
22.16.1 Risks
Several potential risks could materially affect the Mineral Resource and Mineral Reserve estimates, economic assumptions, or long-term viability of the Bear River Zeolite Project:
|
| · | Market Risk: Zeolite markets are niche and price-sensitive. A significant decline in demand or sales price—due to changes in agricultural, environmental, or industrial applications—could reduce project margins or delay return on investment. |
|
|
|
|
|
| · | Production Risk: The current production rate is modest (~12,600 tons/year). Although the reserve base supports scale-up, expanding production would require capital investment, staffing, and possible infrastructure upgrades that may introduce operational or financial risk. |
|
|
|
|
|
| · | Geological Risk: While the deposit is well understood, some areas within the current pit shell are supported by widely spaced drilling. Additional infill drilling may be needed to reduce uncertainty in local grade distribution and lithologic continuity. No material inconsistencies have been observed to date, but areas of limited data density present modest risk for small-scale variability. |
|
|
|
|
|
| · | Cost Risk: Inflationary pressure on fuel, labor, packaging, and consumables may increase operating costs beyond current assumptions. Although historical costs have been stable, future price volatility could impact profitability. |
|
|
|
|
|
| · | Permitting and Environmental Risk: The project is located on private land and currently operates under existing permits. However, changes in environmental regulations or permitting requirements at the federal, state, or local level could impose new compliance obligations or restrict future expansion. |
| GeoGRAFX GIS Services | July 2, 2025 |
| Bear River Zeolite Project | Page: 263 |
| Franklin County, USA |
|
| · | Infrastructure and Logistics Risk: The project relies on haulage and packaging infrastructure with limited excess capacity. Disruptions due to equipment failure, labor shortages, or third- party service constraints could affect product delivery timelines. Seasonal weather-related constraints may also affect access and shipping schedules. |
|
|
|
|
|
| · | Royalty Risk: The project is subject to a tiered royalty schedule and multiple overlapping royalty agreements (see Section 3.4). Although these have been incorporated into the economic analysis, any disputes or contractual amendments could affect net cash flows. |
22.16.2 Opportunities
Several opportunities exist to enhance the value and confidence of the Bear River Zeolite Project:
|
| · | Resource-to-Reserve Conversion: Portions of the Measured and Indicated Resources currently reported as exclusive of Reserves could potentially be converted to Mineral Reserves, subject to supporting technical and economic studies. |
|
|
|
|
|
| · | Inferred Resource Upgrading: Additional drilling and sampling could upgrade Inferred Resources to higher-confidence categories (Indicated or Measured), enabling their inclusion in future reserve estimates. |
|
|
|
|
|
| · | Pit Optimization: Independent evaluations have suggested that final-stage pit slopes could be steepened without compromising stability, potentially reducing the overall stripping ratio and lowering operating costs. Further geotechnical work would be needed to validate any changes. |
|
|
|
|
|
| · | Processing Enhancements: Opportunities may exist to improve plant throughput, recovery efficiency, or cost per ton through selective upgrades to crushing, screening, and packaging infrastructure. Recent maintenance improvements and equipment reconfiguration indicate potential gains from targeted investment. |
|
|
|
|
|
| · | Market Expansion: Continued development of domestic and export markets for zeolite could support higher sales volumes and improved pricing, particularly in agriculture, water filtration, and industrial absorbent applications. |
|
|
|
|
|
| · | Scalable Production: The deposit has the physical characteristics and tonnage potential to support production rates significantly higher than current output. A formal study evaluating plant and logistics expansion could support long-term growth. |
|
|
|
|
|
| · | Extended Mine Life: At the current production rate of approximately 12,600 tons per year, the existing Mineral Reserve supports a mine life in excess of 400 years, providing long-term operational flexibility and optionality for future development strategies. This extended reserve horizon underpins strategic stability and marketing leverage. |
22.17 Conclusions
Under the assumptions in this Report, the operations evaluated show a positive cash flow over the remaining LOM. The mine plan is achievable under the set of assumptions and parameters used.
| GeoGRAFX GIS Services | July 2, 2025 |
| Bear River Zeolite Project | Page: 264 |
| Franklin County, USA |
The Qualified Persons conclude that there are no known fatal flaws and that all critical technical disciplines—including geology, mining, processing, permitting, and economics—have been adequately addressed.
This Report has been prepared in accordance with SEC Regulation S-K 1300 and is suitable to support
disclosure in the Company’s 10-K filing.
| GeoGRAFX GIS Services | July 2, 2025 |
| Bear River Zeolite Project | Page: 265 |
| Franklin County, USA |
23 Recommendations
As the Bear River Operation is an active and ongoing mining operation with established infrastructure and current production, the Qualified Persons have no material recommendations for additional exploration work at this time.
It is recommended that mine planning, operational optimization, and resource development activities become a more formalized procedure, and that reclamation planning and practices are included as part of routine mining operations. Waste material that is removed when stripping, to uncover ore, should be placed in those areas designated to be reclaimed, thereby contributing to the reclamation efforts and plans. Areas meeting final plan contours should be covered with topsoil and re-seeded with appropriate seed mix.
A large quantity of excellent grade zeolite has been outlined in the 2024 exploration drill program. Future technical or exploration work is not required in the short to medium term to outline additional ore. Future exploration drilling will be determined based on operational needs, market conditions, and strategic planning by management.
There are no phased work programs or associated cost estimates to report under this section.
| GeoGRAFX GIS Services | July 2, 2025 |
| Bear River Zeolite Project | Page: 266 |
| Franklin County, USA |
24 References
Adamson, R. D. (1955). The Salt Lake Group in Cache Valley, Utah and Idaho. All Graduate Theses and Dissertations, Spring 1920 to Spring 2023. 6621. Retrieved from https://digitalcommons.usu.edu/etd/6621
Adamson, R., Hardy, C., & Williams, J. (1955). Tertiary Rocks of Cache Valley, Utah and Idaho. In Tertiary and Quaternary Geology of the Eastern Bonneville Basin; Guidebook to the Geology of Utah 10 (pp. 1-22). Utah Geological Association.
Bear River Zeolite Company, Inc. (2009). Bear River Zeolite Company, Inc. unpuplished company report.
Blackledge, T. (2024). Geology Pertaining to Bear River Zeolite. Unpublished report for Bear River Zeolite.
BLM Manual 1613. (1988). Bureau of Land Management, Department of the Interior.
Boles, J. R., & Surdam, R. G. (1977). Diagenesis of volcanogenic sediments in a Tertiary saline lake; Wagon Bed formation, Wyoming. Amer. Journal Sci, 279, 832-853.
Brewer, B. T. (2015). Bear River Zeolite Mine, Franklin County, Idaho, Proposed Mine Expansion. Unpublished report for Bear River Zeolite Co., Inc.
Coulter, H. W. (1956). Geology of the Southeast Portion of the Preston Quadrangle, Idaho. Idaho Bureau of Mines and Geology, Pamphlet No. 107.
Crangle, R. (2018). Zeolite. 2018 Minerals Yearbook. US Geological Survey.
Danzl, R. (1985). Depositional and diagenetic environment of the Salt Lake Group at Oneida Narrows, southeastern Idaho: Pocatello, Idaho. M.S. thesis, Idaho State University.
Griffith, G. O. (2014). Ecoregions of Arizona (poster). U.S. Geological Survey Open-File Report 2014-1141, with map, scale 1:1,325,000. Retrieved from http://dx.doi.org/10.3133/ofr20141141
Hardie, L. A., & Eugester, H. P. (1971). The evolution of closed basin brines. Mineral. Soc. Amer. Spec. Paper, 273-290.
Hauser, B., & Rains, R. (1988). Mineral Resources of the Worm Creek Wilderness Study Area, Bear Lake County Idaho. U.S. Geological Survey Open File Report 88-353.
Hay, R. L. (1966). Zeolites and Zeolitic Reactions in Sedimentary Rocks. Special Paper 85, Geological Society of America.
Hay, R. L. (1970). Silicate Reactions in Three Lithofacies of a Semiarid Basin, Olduvai Gorge. Tanzania.
Mineralogical Society of America Special Paper 3.
Industrial Minerals. (2006a, August). Bear River Zeolite grinding plant. p. 14. Industrial Minerals, no. 467. Industrial Minerals. (2006b, November). BRZ sell limited zeolite marketing rights. p. 16. Industrial
Minerals, no. 470.
Industrial Specialities News. (2023, August 11). News in Brief. p. 8. Blendon Information Services, v. 17, no. 15.
| GeoGRAFX GIS Services | July 2, 2025 |
| Bear River Zeolite Project | Page: 267 |
| Franklin County, USA |
Keller, A. S. (1952). Geology of the Mink Creek Region, Idaho. (M. S. thesis, Dept. of Geology) University of Utah.
Lawrence, J. (2009). Bear River Zeolite Company, Inc. Unpublished report for Bear River Zeolite Company.
Lewis, R., Link, P. K., Stanford, L. R., & Long, S. P. (2012). Geologic Map of Idaho. Idaho Geological Survey, Geologic Map 9.
Marantos, I., Christidis, G., & Ulmanu, M. (2012). Zeolite Formation and Deposits. In V. Inglezakis, & A. Zorpas, Handbook of Natural Zeolites (pp. 28-51). Bentham Science Publishers.
Mariner, R., & Surdam, R. (1970). Alkalinity and Formation of Zeolites in Saline Alkaline Lakes. Science, 170: 977-980.
Oriel, S., & Platt, L. (1980). Geologic map of the Preston 1 degree x 2 degrees quadrangle, southeastern Idaho and western Wyoming. U.S. Geological Survey; Miscellaneous Investigations Series Map I- 1127; SCALE 1:250,000.
Sheppard, R. A. (1973). Zeolites in sedimentary rocks. U.S. Geol. Survey Prof. Paper., 820.
Sheppard, R. A. (1991). DESCRIPTIVE MODEL OF SEDIMENTARY ZEOLITES - Deposit subtype: Zeolites in tuffs of saline, alkaline-lake deposits - Model 25o.2. In G. Orris, & J. Bliss, Some Industrial Mineral Deposit Models Descriptive Deposit Models (pp. 19-21). USGS Open-File Report 91-11A.
Stamatakis, M. G. (1987). Boron distribution in hot springs, volcanic emanations, marine evaporites and volcanic and sedimentary rocks of Cainozoic age in Greece. PhD thesis, Athens University.
Surdam, R. (1977). Zeolites in closed hydrologic systems. In F. Mupton, Mineralogy and Geology of Natural Zeolites (pp. 65-91). Reviews in Mineralogy, Mineral. Soc. Amer., Washington, DC.
Surdam, R. C., & Eugaster, H. P. (1976). Mineral Reactions in the Sedimentary Deposits of the Lake Magadi, Kenya (Vol. 87). Bulletin, Geological Society of America.
U.S. Antimony Corp. (2015). U.S. Antimony provides update on operations. U.S. Antimony Corp. press release, September 14.
United States Antimony Corp. (2007, August 27). U.S. Antimony announces Bear River Zeolite progress on grinding circuit. 1 p. United States Antimony Corp. press release.
United States Antimony Corporation. (2022). 10-Q (Quarterly report filed 2022-11-14) reporting for 2022-09-30. p. 23. Securities and Exchange Commission. Retrieved from https://www.sec.gov/Archives/edgar/data/101538/000165495422015241/uamy_10q.htm
United States Antimony Corporation. (2022a). Form 10-K for the fiscal year ending 2021. Secyrity and Exchange Comission. Retrieved from https://www.sec.gov/Archives/edgar/data/101538/000165495422004564/uamy_10ka.htm
United States Antimony Corporation. (2023). US Antimony Provides November – December Operations Details [Press release]. THOMPSON FALLS, MT: United States Antimony Corporation. Retrieved from https://www.accessnewswire.com/newsroom/en/metals-and-mining/us-antimony- provides-november-december-operations-details-736166
| GeoGRAFX GIS Services | July 2, 2025 |
| Bear River Zeolite Project | Page: 268 |
| Franklin County, USA |
United States Antimony Corporation. (2024). Form 10-K Annual Report for the fiscal year ending December 31, 2023. Securities and Exchange Commission. Retrieved from https://www.usantimony.com/sec-filings?utm_source=chatgpt.com
United States Antimony Corporation. (2024). Form 10-K For the fiscal year ended December 31, 2023.
U.S. Securities and Exchange Comission. Retrieved from https://www.sec.gov/Archives/edgar/data/101538/000165495424004576/uamy_10k.htm
United States Antimony Corporation. (2024b). Exhibit 95 to the 2024 Annual Report. Securities and Exchange Commission. Retrieved from https://www.sec.gov/Archives/edgar/data/101538/000165495425003048/uamy_ex95.htm
Williams, J. (1964). The age of the Salt Lake Group in Cache Valley, Utah-Idaho. Utah Academy of Science, Arts and Letters Proceedings V41, No2, 269-277.
Williams, J. S. (1948). Geology of the Paleozoic rocks, Logan Quadrangle, Utah. Bull . Geol. Soc. Am., Vol.
49, pp. 1121-1164.
Yahoo Finance. (2019, July 22). U.S. Antimony announces rail delivery of zeolite. Retrieved from Yahoo Finance: https://finance.yahoo.com/news/u-antimony-announces-rail-zeolite-130000529.html
| GeoGRAFX GIS Services | July 2, 2025 |
| Bear River Zeolite Project | Page: 269 |
| Franklin County, USA |
25 Reliance on Information Provided by the Registrant
The Qualified Person (QP) has relied upon information provided by United States Antimony Corporation ("USAC" or the "Registrant"), through its wholly owned subsidiary Bear River Zeolite, LLC ("BRZ"), for certain aspects of this Technical Report Summary that are outside the Qualified Person’s area of expertise, as permitted under Item 1302(b)(2) of Regulation S-K.
Specifically, reliance has been placed on the Registrant for the following:
|
| · | Section 3: Property Description: Details regarding royalties, leases, and other agreements applicable to the property were provided by USAC personnel. |
|
|
|
|
|
| · | Section 5: History – Historical production records, ownership transitions, and prior operational data were sourced from BRZ’s internal archives and corporate history summaries maintained by USAC. |
|
|
|
|
|
| · | Section 10: Drilling – Drilling program details, including drill collar locations, depths, drilling methods, and logging data, were based on field records, chip trays, and logs maintained by BRZ contract geologists. Collar coordinates and drilling metrics were accepted as provided. |
|
|
|
|
|
| · | Section 11: Mineral Resource Estimates - The QP relied on information provided by Bear River Zeolite (BRZ) site management regarding the mining, processing, and product quality characteristics of the zeolite mineralization, as well as financial information including historical operating costs, processing recoveries, and market pricing assumptions. |
|
|
|
|
|
| · | Section 12: Mineral Reserve Estimates - Long term product price, Mining cost, processing cost, and G&A cost were provided by BRZ’s mine operations team. |
|
|
|
|
|
| · | Section 13: Mining Methods - Operational procedures, mining equipment specifications, mine scheduling, and haulage systems were documented by BRZ staff and reviewed during the QP’s site visit. Descriptions reflect ongoing operations as explained by BRZ mine personnel. |
|
|
|
|
|
| · | Section 14: Processing and Recovery Methods – The QP relied on BRZ’s description of plant flowsheets, throughput capacity, equipment, and packaging processes. Observations from the site visit were used to confirm general plant layout and recovery logic. |
|
|
|
|
|
| · | Section 15: Infrastructure – Information on site infrastructure, including access roads, utilities, processing plant layout, support facilities, and ore handling systems, was provided by Bear River Zeolite Company (BRZ). The details reflect current site conditions as observed during the QP’s site visit and are consistent with operating practices in place as of the report’s effective date. |
|
|
|
|
|
| · | Section 17: Environmental Studies, Permitting, and Social or Community Impact – Permitting status, regulatory history, and compliance documentation were provided by BRZ and USAC. |
|
|
|
|
|
| · | Section 18: Capital and Operating Costs – Cost inputs were based on actual BRZ production data, adjusted to reflect long-term projections. Estimates were developed by BRZ personnel with operating responsibility for the site, and the QP relied on their documentation and internal models to support economic assumptions. |
| GeoGRAFX GIS Services | July 2, 2025 |
| Bear River Zeolite Project | Page: 270 |
| Franklin County, USA |
|
| · | Section 19: Economic Analysis - The information was based on actual site operating performance and cost structure, as documented in Sections 12 and 18, and forward-looking projections consistent with current site practices and market conditions site provided by the Registrant’s internal financial personnel. |
The Qualified Persons have reviewed the information provided by BRZ and USAC and consider it reasonable for the purposes of this Technical Report Summary, consistent with the project’s level of study and the scope of SEC Regulation S-K 1300. They have not independently verified legal, title, financial or regulatory documentation.
| GeoGRAFX GIS Services | July 2, 2025 |
| Bear River Zeolite Project | Page: 271 |
| Franklin County, USA |
26 Date and Signature Page
The following Qualified Persons, each of whom meets the definition of a Qualified Person under SEC Regulation S-K 1300, have prepared portions of this Technical Report Summary entitled: “Bear River Zeolite Project, Franklin County, Idaho, United States – Technical Report Summary”.
This Technical Report Summary is filed in support of United States Antimony Corporation's 2024 Annual Report (Form 10-K) in accordance with SEC Regulation S-K 1300.
The full delineation of Qualified Person responsibilities is provided in Section 2 of this report.
The Qualified Person(s) confirm that the information contained in this Technical Report Summary is current as of the applicable effective dates stated herein, and that the report has been prepared in full compliance with the requirements of Item 1302 of Regulation S-K.
|
|
|
| /s/ Barbara Carroll |
|
| Ms. Barbara Carroll, CPG, RM SME (Independent) Qualified Person |
|
|
|
|
| /s/ PJ Hollenbeck |
|
| Mr. PJ Hollenbeck, CPG (Independent) Qualified Person |
|
|
|
|
| /s/ Randall K. Martin |
|
| Mr. Randall K. Martin, RM SME (Independent) Qualified Person |
|
|
|
|
| /s/ LJ Bardswich |
|
| Mr. LJ Bardswich, P.E. (United States Antimony Corporation) Qualified Person |
|
|
|
Note: Each signatory has executed a signed authentication document consistent with 17 CFR 230.402(e) and 17 CFR 240.12b-11(d), which is retained on file by the registrant.
| GeoGRAFX GIS Services | July 2, 2025 |
| Bear River Zeolite Project | Page: 272 |
| Franklin County, USA |
APPENDIX
E. Certificate of Qualified Person
F. BRZ Unpatented Placer Mining Claims
G. Drilling Collar Table
H. Independent CEC Analysis
| GeoGRAFX GIS Services | July 2, 2025 |
| Bear River Zeolite Project | Page: 273 |
| Franklin County, USA |
| APPENDIX A - CERTIFICATE OF QUALIFIED PERSON |
| GeoGRAFX GIS Services | July 2, 2025 |
| Bear River Zeolite Project | Page: 274 |
| Franklin County, USA |
Certificate of Qualified Person
Barbara Carroll, BSc CPG
President of GeoGRAFX Consulting LLC
8600 N. Burke Dr. • Tucson, AZ 85742
Telephone: 520-744-4457
Email: bcarroll@geografxworld.com
I, Barbara Carroll, BSc CPG of Tucson, Arizona do hereby certify that:
|
| · | I am a Certified Professional Geologist (#10987) in good standing with the American Institute of Professional Geologists and a registered member of the Society of Mining Metallurgy & Exploration (4100964RM). |
|
| · | I am a Qualified Person as defined by SEC Regulation S-K 1300. |
|
| · | At the time of signing, I am currently president of GeoGRAFX Consulting LLC, Tucson, AZ, a position I have held since 1992. |
|
| · | I have been retained by United States Antimony Corporation to prepare or contribute to the Technical Report Summary titled: "SEC Technical Report Summary for the Bear River Zeolite Project, Franklin County, Idaho, United States", prepared in accordance with SEC Regulation S-K 1300, Effective Date: March 31, 2025. This Technical Report Summary is filed in support of United States Antimony Corporation's 2024 Annual Report (Form 10-K) under SEC Regulation S-K 1300. |
|
| · | The specific sections of the Technical Report Summary for which I am responsible are identified in Section 2.3 of this Report. |
|
| · | I have visited the Bear River Zeolite property on November 5, 2024, for the purposes of data verification, inspection of mining and processing facilities, and review of site conditions. |
|
| · | I have had no prior involvement with the Bear River Zeolite Project outside the scope of work disclosed in this Technical Report Summary, and I am independent of United States Antimony Corporation and its subsidiaries, as defined under SEC Regulation S-K 1300. |
|
| · | I have read SEC Regulation S-K 1300, and this Technical Report Summary has been prepared in compliance with its requirements. |
|
| · | As of the date of this certificate, to the best of my knowledge, information, and belief, the information provided in this Technical Report Summary is accurate, complete, and not misleading. |
Signed and dated this 28th day of June 2025.
| /s/ Barbara Carroll |
|
|
Barbara Carroll, BSc, CPG
| GeoGRAFX GIS Services | July 2, 2025 |
| Bear River Zeolite Project | Page: 275 |
| Franklin County, USA |
Certificate of Qualified Person
Patrick J. Hollenbeck, CPG
Blue Goo Enterprises, LLC
1624 Culebra Place, Colorado Springs, CO 80907, USA
Telephone: 719.357.5498
Email: pj@bluegooenterprises.com
I, Patrick J. Hollenbeck, hereby certify that:
|
| · | I am a member in good standing of the American Institute of Professional Geologists (AIPG) as Certified Professional Geologist #11436. |
|
| · | I am a Qualified Person as defined by SEC Regulation S-K 1300. |
|
| · | At the time of signing, I am a Contract Geologist for Blue Goo Enterprises, LLC, a position I have held since 2009. |
|
| · | I have been retained by United States Antimony Corporation to prepare or contribute to the Technical Report Summary titled: "SEC Technical Report Summary for the Bear River Zeolite Project, Franklin County, Idaho, United States", prepared in accordance with SEC Regulation S-K 1300, Effective Date: March 31, 2025. This Technical Report Summary is filed in support of United States Antimony Corporation's 2024 Annual Report (Form 10-K) under SEC Regulation S-K 1300. |
|
| · | The specific sections of the Technical Report Summary for which I am responsible are identified in Section 2.3 of this Report. |
|
| · | I have not personally visited the Bear River Zeolite property. My conclusions and opinions are based on review of technical data, verified reports, communications with on-site personnel, and other information as outlined in this Technical Report Summary. |
|
| · | I have had no prior involvement with the Bear River Zeolite Project outside the scope of work disclosed in this Technical Report Summary, and I am independent of United States Antimony Corporation and its subsidiaries, as defined under SEC Regulation S-K 1300. |
|
| · | I have read SEC Regulation S-K 1300, and this Technical Report Summary has been prepared in compliance with its requirements. |
|
| · | As of the date of this certificate, to the best of my knowledge, information, and belief, the information provided in this Technical Report Summary is accurate, complete, and not misleading. |
Signed this 2nd day of July, 2025.
| /s/ Patrick J. Hollenbeck |
|
|
Patrick J. Hollenbeck, CPG
| GeoGRAFX GIS Services | July 2, 2025 |
| Bear River Zeolite Project | Page: 276 |
| Franklin County, USA |
Certificate of Qualified Person
Randall K Martin, BSc, MSc, SME-RM
President of R K Martin & Associates, Inc.
8985 W Jefferson Ave • Denver, CO 80235
Telephone: 303-989-3455
Email: rkmassoc@comcast.net
I, Randall K Martin, BSc MSc SME-RM of Denver, Colorado do hereby certify that:
|
| · | I am a registered member of the Society of Mining Metallurgy & Exploration (4063888RM). |
|
| · | I am a Qualified Person as defined by SEC Regulation S-K 1300. |
|
| · | At the time of signing, I am currently president of Randall K Martin and Associates Inc, Denver, CO, a position I have held since 1999. |
|
| · | I have been retained by United States Antimony Corporation to prepare or contribute to the Technical Report Summary titled: "SEC Technical Report Summary for the Bear River Zeolite Project, Franklin County, Idaho, United States", prepared in accordance with SEC Regulation S-K 1300, Effective Date: March 31, 2025. This Technical Report Summary is filed in support of United States Antimony Corporation's 2024 Annual Report (Form 10-K) under SEC Regulation S-K 1300. |
|
| · | The specific sections of the Technical Report Summary for which I am responsible are identified in Section 2.3 of this Report. |
|
| · | I have not personally visited the Bear River Zeolite property. My conclusions and opinions are based on review of technical data, verified reports, communications with on-site personnel, and other information as outlined in this Technical Report Summary. |
|
| · | I have had no prior involvement with the Bear River Zeolite Project outside the scope of work disclosed in this Technical Report Summary, and I am independent of United States Antimony Corporation and its subsidiaries, as defined under SEC Regulation S-K 1300. |
|
| · | I have read SEC Regulation S-K 1300, and this Technical Report Summary has been prepared in compliance with its requirements. |
|
| · | As of the date of this certificate, to the best of my knowledge, information, and belief, the information provided in this Technical Report Summary is accurate, complete, and not misleading. |
Signed and dated this 28th day of June 2025.
| /s/ Randall K Martin |
|
|
Randall K Martin, BSc, MSc, CPG
| GeoGRAFX GIS Services | July 2, 2025 |
| Bear River Zeolite Project | Page: 277 |
| Franklin County, USA |
Certificate of Author
This certificate applies to the technical report titled SEC Technical Report Summary for the Bear River Zeolite Project, Franklin County, Idaho, United States and dated March 31, 2025.
I, Lloyd Joseph Bardswich, do hereby certify that:
|
| · | I am self employed as a mining consultant, with office located at 6285 S Lago Grande Drive, Fort Mohave, AZ 86426 as to 40% of my business time. |
|
| · | I am employed as Executive Vice President of United States Antimony Corporation as to 60% of my business time and therefore am not an independent author of this report. |
|
| · | I graduated from the University of Windsor, Windsor, Ontario Canada with the degree of Bachelor of Applied Science – Civil Engineering. |
|
| · | I graduated from McGill University, Montreal, Canada with the degree of M.Eng. (Mining) |
|
| · | I am a member (#2357010) of Professional Engineers Ontario and registered as a Professional Engineer (P. Eng.) in Ontario. I am registered (#60891) as a Professional Engineer- Mining (P. E.) with the Arizona Board of Technical Registration |
|
| · | I am a life member of the Canadian Institute of Mining & Metallurgy (#89744). |
|
| · | I have worked as a mining engineer in the mining and heavy civil industries in the United States, Canada, Europe, and Africa for a period of 50 years since my graduation from McGill University. |
|
| · | I am a Qualified Person (QP) and the author of the following sections of the Technical Report Summary identified in Section 2.3 of this Report. |
|
| · | I have visited the Bear River Zeolite operations in Franklin County, Idaho on numerous occasions in the past three years. |
|
| · | As of the date of this certificate, to the best of my knowledge, information and belief, this report contains all scientific and technical information that is required to be disclosed to make this report not misleading. |
|
| · | I consent to the use of this Technical Report by United States Antimony Corporation to fulfill the SK 1300 reporting requirements of the Securities and Exchange Commission for the mineral resources and reserves statement for the Bear River Zeolite property. |
Signed and dated June 30, 2025
| /s/ Lloyd Joseph Bardswich |
|
|
Lloyd Joseph Bardswich, M.Eng. (Mining) P.E.
| GeoGRAFX GIS Services | July 2, 2025 |
| Bear River Zeolite Project | Page: 278 |
| Franklin County, USA |
| APPENDIX B - BRZ UNPATENTED PLACER MINING CLAIMS |
| GeoGRAFX GIS Services | July 2, 2025 |
| Bear River Zeolite Project | Page: 279 |
| Franklin County, USA |
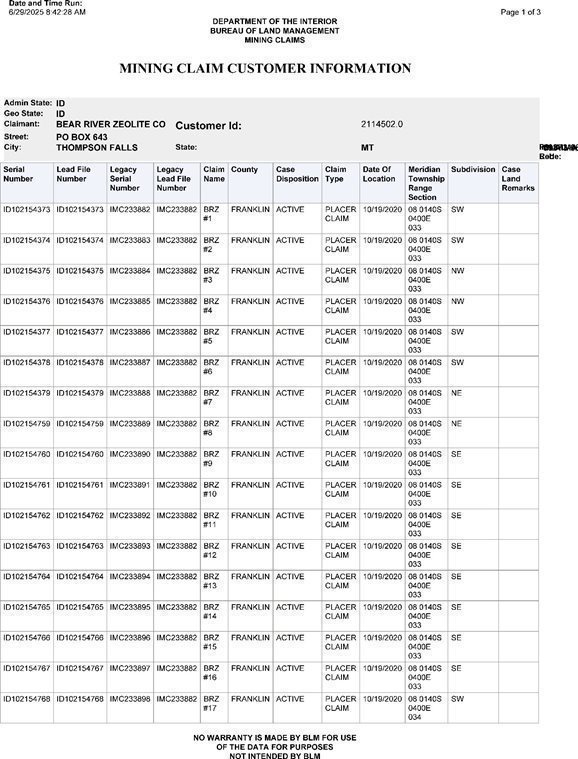
| GeoGRAFX GIS Services | July 2, 2025 |
| Bear River Zeolite Project | Page: 280 |
| Franklin County, USA |
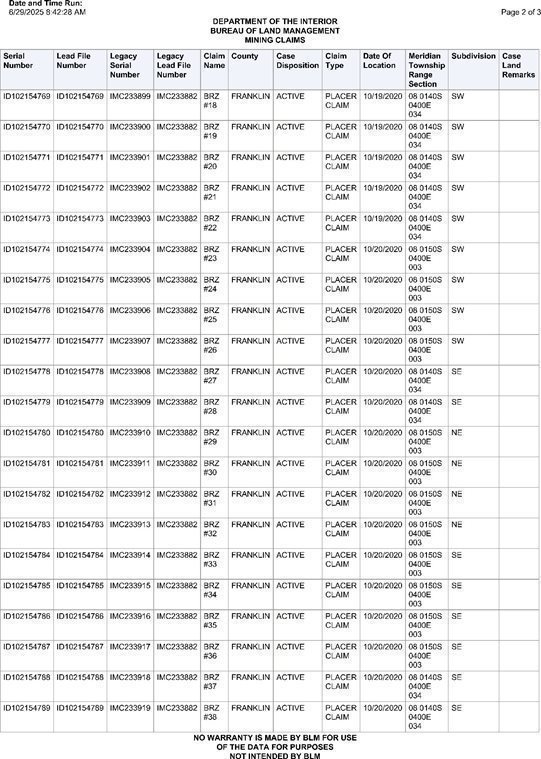
| GeoGRAFX GIS Services | July 2, 2025 |
| Bear River Zeolite Project | Page: 281 |
| Franklin County, USA |
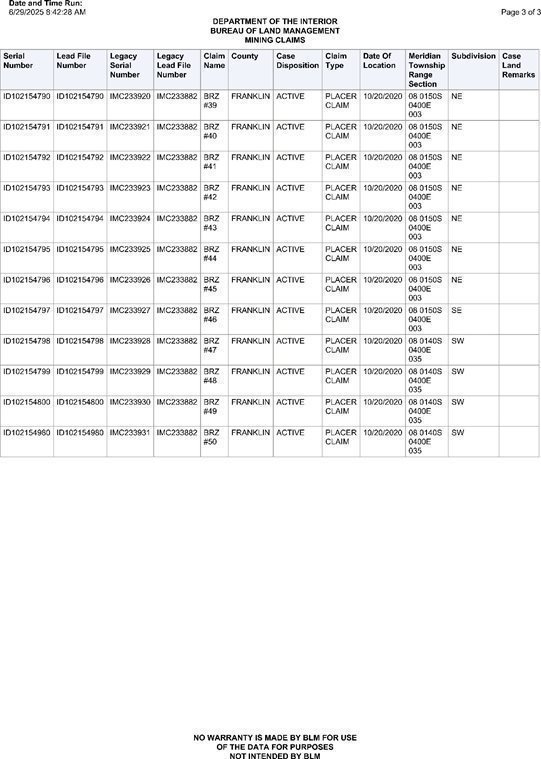
| GeoGRAFX GIS Services | July 2, 2025 |
| Bear River Zeolite Project | Page: 282 |
| Franklin County, USA |
| APPENDIX C - DRILLING COLLAR TABLE |
| GeoGRAFX GIS Services | July 2, 2025 |
| Bear River Zeolite Project | Page: 283 |
| Franklin County, USA |
Current Drilling
| Hole_ID | Easting | Northing | Elev | Azimuth | Dip | TD | Year | Company |
|
| SPID_ft | SPID_ft | ft |
|
| ft |
|
|
| BRZ24-001 | 763969.9 | 172436.1 | 5138.0 | 0 | -90 | 84 | 2024 | BRZ |
| BRZ24-002 | 763970.6 | 172301.3 | 5130.0 | 0 | -90 | 84 | 2024 | BRZ |
| BRZ24-003 | 763783.9 | 172770.5 | 5218.1 | 0 | -90 | 84 | 2024 | BRZ |
| BRZ24-004 | 763870.8 | 172763.7 | 5200.8 | 0 | -90 | 84 | 2024 | BRZ |
| BRZ24-005 | 763718.9 | 171600.5 | 5089.8 | 0 | -90 | 84 | 2024 | BRZ |
| BRZ24-006 | 763721.1 | 171706.2 | 5092.8 | 0 | -90 | 84 | 2024 | BRZ |
| BRZ24-007 | 763710.5 | 171658.8 | 5090.0 | 0 | -90 | 84 | 2024 | BRZ |
| BRZ24-008 | 763664.2 | 171698.6 | 5091.8 | 0 | -90 | 84 | 2024 | BRZ |
| BRZ24-009 | 763667.1 | 171640.3 | 5090.0 | 0 | -90 | 84 | 2024 | BRZ |
| BRZ24-010 | 763628.5 | 171785.9 | 5094.0 | 0 | -90 | 84 | 2024 | BRZ |
| BRZ24-011 | 763533.7 | 171763.6 | 5092.0 | 0 | -90 | 84 | 2024 | BRZ |
| BRZ24-012 | 763418.4 | 172061.9 | 5119.0 | 0 | -90 | 84 | 2024 | BRZ |
| BRZ24-013 | 763489.3 | 171971.1 | 5108.8 | 0 | -90 | 84 | 2024 | BRZ |
| BRZ24-014 | 763541.5 | 171840.2 | 5095.1 | 0 | -90 | 84 | 2024 | BRZ |
| BRZ24-015 | 763424.9 | 171832.4 | 5083.0 | 0 | -90 | 84 | 2024 | BRZ |
| BRZ24-016 | 763324.5 | 171842.8 | 5076.0 | 0 | -90 | 84 | 2024 | BRZ |
| BRZ24-017 | 763346.6 | 171737.2 | 5064.0 | 0 | -90 | 84 | 2024 | BRZ |
| BRZ24-019 | 763136.4 | 172046.0 | 5093.7 | 0 | -90 | 84 | 2024 | BRZ |
| BRZ24-020 | 763060.6 | 172005.6 | 5092.0 | 0 | -90 | 84 | 2024 | BRZ |
| BRZ24-021 | 763160.5 | 172111.7 | 5104.7 | 0 | -90 | 54 | 2024 | BRZ |
| BRZ24-022 | 763153 | 171962.3 | 5092.0 | 0 | -90 | 84 | 2024 | BRZ |
| BRZ24-023 | 762973.8 | 172019.8 | 5093.0 | 0 | -90 | 60 | 2024 | BRZ |
| BRZ24-024 | 762878.6 | 172059.4 | 5093.0 | 0 | -90 | 84 | 2024 | BRZ |
| BRZ24-025 | 762775.6 | 172066.2 | 5091.1 | 0 | -90 | 84 | 2024 | BRZ |
| BRZ24-026 | 762680.6 | 172076.7 | 5090.0 | 0 | -90 | 84 | 2024 | BRZ |
| BRZ24-027 | 762561.3 | 172076.2 | 5090.0 | 0 | -90 | 84 | 2024 | BRZ |
| BRZ24-028 | 762428.1 | 172122.9 | 5087.0 | 0 | -90 | 72 | 2024 | BRZ |
| BRZ24-029 | 762324.8 | 172173.5 | 5086.0 | 0 | -90 | 84 | 2024 | BRZ |
| BRZ24-030 | 763470.2 | 172590.5 | 5308.0 | 0 | -90 | 84 | 2024 | BRZ |
| BRZ24-031 | 763481.5 | 172492.2 | 5287.0 | 0 | -90 | 84 | 2024 | BRZ |
| BRZ24-032 | 763509.2 | 172368.4 | 5259.4 | 0 | -90 | 84 | 2024 | BRZ |
| BRZ24-033 | 763410.8 | 172532.0 | 5283.0 | 0 | -90 | 84 | 2024 | BRZ |
| BRZ24-034 | 763449.1 | 172459.3 | 5272.0 | 0 | -90 | 84 | 2024 | BRZ |
| BRZ24-035 | 763525.8 | 172288.3 | 5241.0 | 0 | -90 | 84 | 2024 | BRZ |
| BRZ24-036 | 763455.2 | 172320.8 | 5237.0 | 0 | -90 | 84 | 2024 | BRZ |
| BRZ24-037 | 763378.9 | 172389.7 | 5229.8 | 0 | -90 | 84 | 2024 | BRZ |
| BRZ24-038 | 763305.3 | 172473.2 | 5222.0 | 0 | -90 | 84 | 2024 | BRZ |
| GeoGRAFX GIS Services | July 2, 2025 |
| Bear River Zeolite Project | Page: 284 |
| Franklin County, USA |
| Hole_ID | Easting | Northing | Elev | Azimuth | Dip | TD | Year | Company |
|
| SPID_ft | SPID_ft | ft |
|
| ft |
|
|
| BRZ24-039 | 763196.8 | 172469.0 | 5200.2 | 0 | -90 | 84 | 2024 | BRZ |
| BRZ24-040 | 762988.7 | 172322.3 | 5191.0 | 0 | -90 | 84 | 2024 | BRZ |
| BRZ24-041 | 763080.6 | 172384.7 | 5186.8 | 0 | -90 | 84 | 2024 | BRZ |
| BRZ24-042 | 763390.4 | 172240.3 | 5188.2 | 0 | -90 | 84 | 2024 | BRZ |
| BRZ24-043 | 763343.9 | 172323.9 | 5192.0 | 0 | -90 | 84 | 2024 | BRZ |
| BRZ24-044 | 763278.5 | 172407.4 | 5191.0 | 0 | -90 | 84 | 2024 | BRZ |
| BRZ24-045 | 763172.7 | 172399.7 | 5183.0 | 0 | -90 | 84 | 2024 | BRZ |
| BRZ24-046 | 763257.1 | 172334.5 | 5171.0 | 0 | -90 | 84 | 2024 | BRZ |
| BRZ24-047 | 763162.1 | 172348.6 | 5168.0 | 0 | -90 | 40 | 2024 | BRZ |
| BRZ24-048 | 762886.7 | 172081.3 | 5105.0 | 0 | -90 | 84 | 2024 | BRZ |
| BRZ24-049 | 762984.1 | 172125.5 | 5113.0 | 0 | -90 | 84 | 2024 | BRZ |
| BRZ24-050 | 763084.2 | 172184.2 | 5122.9 | 0 | -90 | 84 | 2024 | BRZ |
| BRZ24-052 | 763301.1 | 172207.1 | 5149.9 | 0 | -90 | 84 | 2024 | BRZ |
| BRZ24-053 | 763216.9 | 172225.0 | 5138.9 | 0 | -90 | 84 | 2024 | BRZ |
| BRZ24-054 | 763232.9 | 172276.1 | 5155.0 | 0 | -90 | 84 | 2024 | BRZ |
| BRZ24-055 | 763083.6 | 172315.4 | 5167.6 | 0 | -90 | 84 | 2024 | BRZ |
| BRZ24-056 | 762953.8 | 172220.1 | 5149.0 | 0 | -90 | 84 | 2024 | BRZ |
| BRZ24-057 | 762897.2 | 172165.2 | 5138.2 | 0 | -90 | 84 | 2024 | BRZ |
| BRZ24-058 | 762794.2 | 172131.9 | 5130.1 | 0 | -90 | 84 | 2024 | BRZ |
| BRZ24-059 | 762672.2 | 172127.7 | 5118.1 | 0 | -90 | 84 | 2024 | BRZ |
| BRZ24-060 | 762216.4 | 172154.8 | 5088.2 | 0 | -90 | 84 | 2024 | BRZ |
| BRZ24-061 | 762075.2 | 172208.8 | 5086.0 | 0 | -90 | 84 | 2024 | BRZ |
| BRZ24-062 | 762172.7 | 172231.1 | 5099.0 | 0 | -90 | 84 | 2024 | BRZ |
| BRZ24-063 | 762476.4 | 172254.3 | 5128.8 | 0 | -90 | 84 | 2024 | BRZ |
| BRZ24-064 | 762337.8 | 172293.8 | 5117.8 | 0 | -90 | 84 | 2024 | BRZ |
| BRZ24-065 | 762240.2 | 172307.9 | 5118.0 | 0 | -90 | 84 | 2024 | BRZ |
| BRZ24-066 | 763545.7 | 172678.3 | 5300.0 | 0 | -90 | 84 | 2024 | BRZ |
| BRZ24-067 | 763530 | 172561.7 | 5294.1 | 0 | -90 | 84 | 2024 | BRZ |
| BRZ24-068 | 763598.6 | 172379.8 | 5246.1 | 0 | -90 | 84 | 2024 | BRZ |
| BRZ24-069 | 763666.1 | 172456.6 | 5223.0 | 0 | -90 | 84 | 2024 | BRZ |
| BRZ24-070 | 763722.6 | 172555.3 | 5209.0 | 0 | -90 | 84 | 2024 | BRZ |
| BRZ24-071 | 763768.2 | 172653.9 | 5207.0 | 0 | -90 | 84 | 2024 | BRZ |
| BRZ24-072 | 764114.6 | 172240.1 | 5145.0 | 0 | -90 | 84 | 2024 | BRZ |
| BRZ24-073 | 763842.9 | 171750.5 | 5090.1 | 0 | -90 | 84 | 2024 | BRZ |
| BRZ24-074 | 761948.4 | 172649.1 | 5094.1 | 0 | -90 | 84 | 2024 | BRZ |
| BRZ24-075 | 762151.6 | 173291.4 | 5115.0 | 0 | -90 | 84 | 2024 | BRZ |
| BRZ24-076 | 762438.5 | 173992.4 | 5139.0 | 0 | -90 | 48 | 2024 | BRZ |
| BRZ24-077 | 762382.4 | 174997.9 | 5188.0 | 0 | -90 | 84 | 2024 | BRZ |
| BRZ24-078 | 762283.1 | 175361.9 | 5230.0 | 0 | -90 | 84 | 2024 | BRZ |
| GeoGRAFX GIS Services | July 2, 2025 |
| Bear River Zeolite Project | Page: 285 |
| Franklin County, USA |
| Hole_ID | Easting | Northing | Elev | Azimuth | Dip | TD | Year | Company |
|
| SPID_ft | SPID_ft | ft |
|
| ft |
|
|
| BRZ24-079 | 761916 | 173793.2 | 5089.9 | 0 | -90 | 84 | 2024 | BRZ |
| BRZ24-080 | 761439.2 | 173098.7 | 5046.0 | 0 | -90 | 84 | 2024 | BRZ |
| BRZ24-081 | 764164.9 | 172495.4 | 5156.7 | 0 | -90 | 84 | 2024 | BRZ |
| BRZ24-082 | 764176.4 | 172360.6 | 5152.2 | 0 | -90 | 84 | 2024 | BRZ |
| GeoGRAFX GIS Services | July 2, 2025 |
| Bear River Zeolite Project | Page: 286 |
| Franklin County, USA |
| APPENDIX D – INDEPENDENT CEC ANALYSIS |
| GeoGRAFX GIS Services | July 2, 2025 |
| Bear River Zeolite Project | Page: 287 |
| Franklin County, USA |
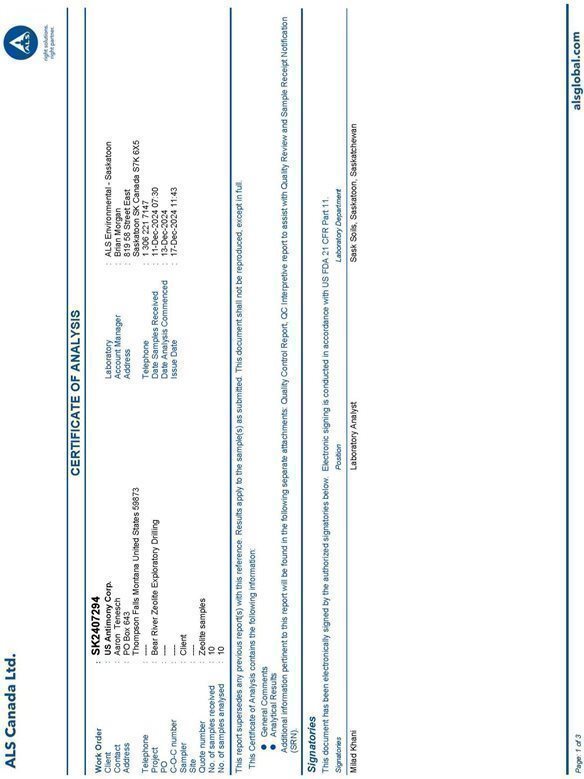
| GeoGRAFX GIS Services | July 2, 2025 |
| Bear River Zeolite Project | Page: 288 |
| Franklin County, USA |
| GeoGRAFX GIS Services | July 2, 2025 |
| Bear River Zeolite Project | Page: 289 |
| Franklin County, USA |
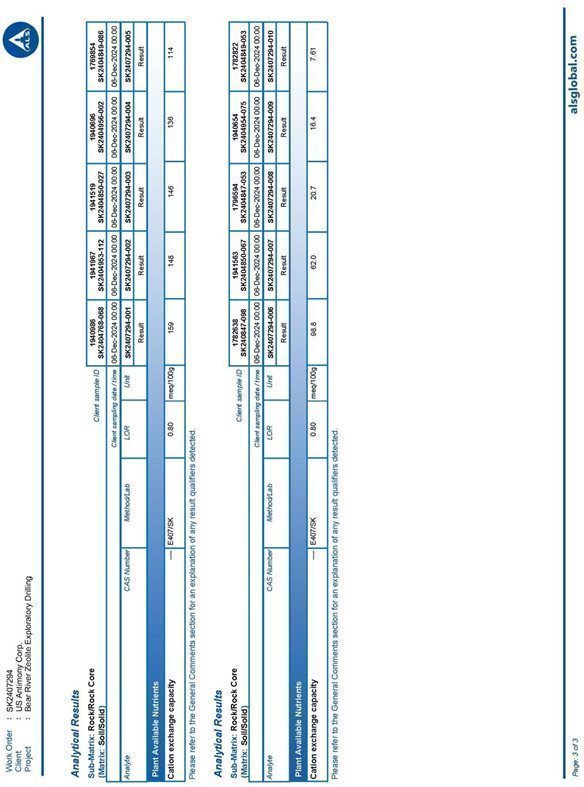
| GeoGRAFX GIS Services | July 2, 2025 |
| Bear River Zeolite Project | Page: 290 |
| Franklin County, USA |
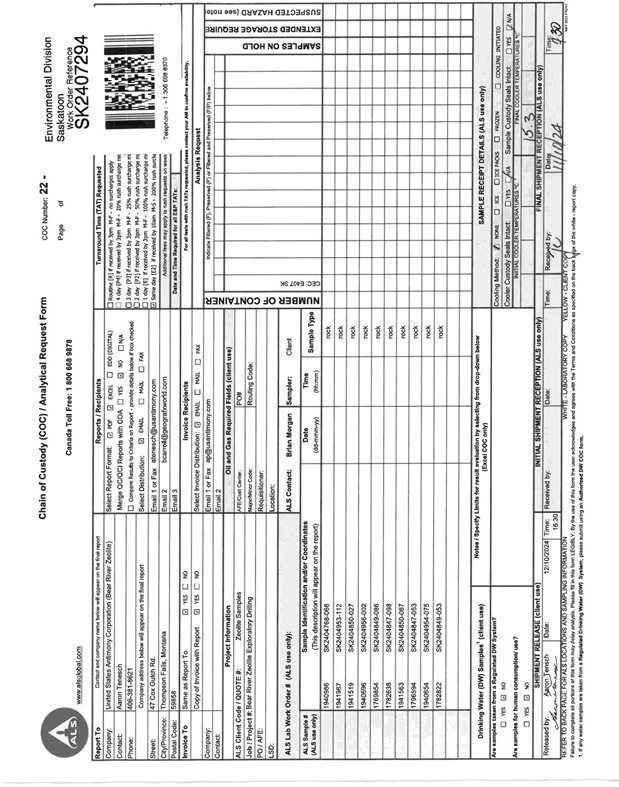
| GeoGRAFX GIS Services | July 2, 2025 |
| Bear River Zeolite Project | Page: 291 |
| Franklin County, USA |
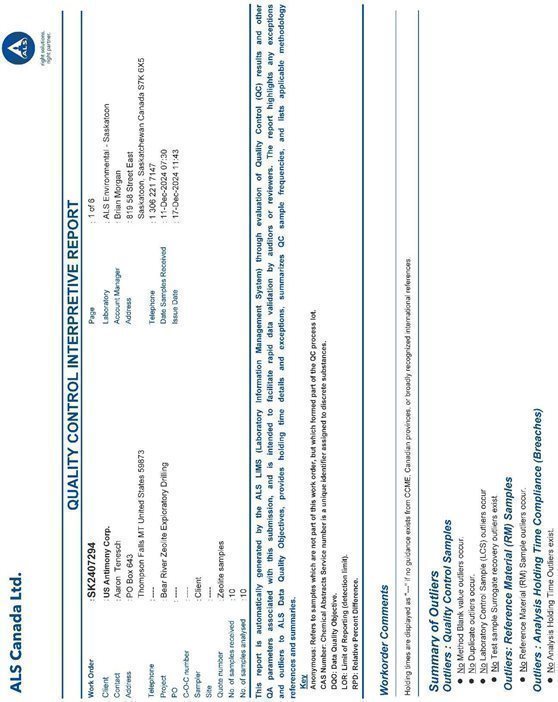
| GeoGRAFX GIS Services | July 2, 2025 |
| Bear River Zeolite Project | Page: 292 |
| Franklin County, USA |
| GeoGRAFX GIS Services | July 2, 2025 |
| Bear River Zeolite Project | Page: 293 |
| Franklin County, USA |
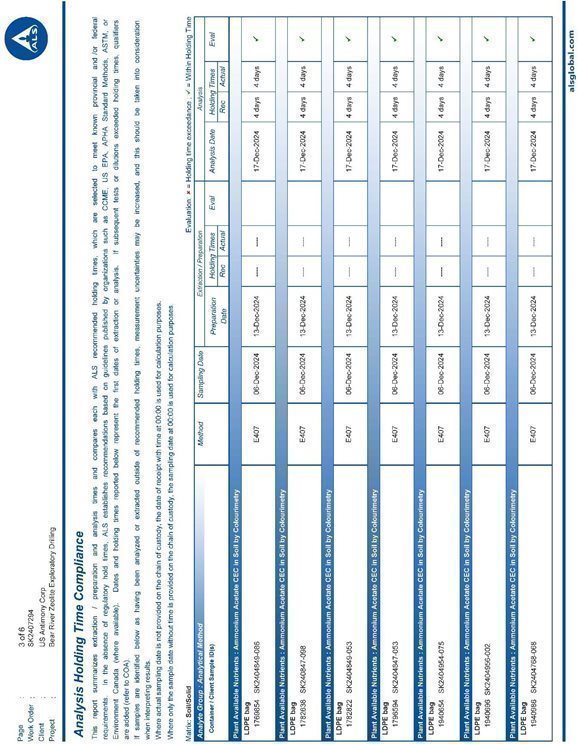
| GeoGRAFX GIS Services | July 2, 2025 |
| Bear River Zeolite Project | Page: 294 |
| Franklin County, USA |
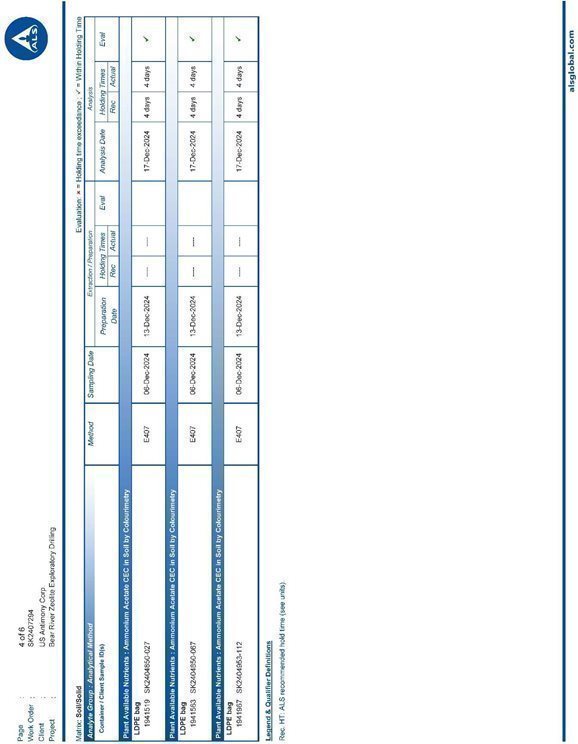
| GeoGRAFX GIS Services | July 2, 2025 |
| Bear River Zeolite Project | Page: 295 |
| Franklin County, USA |
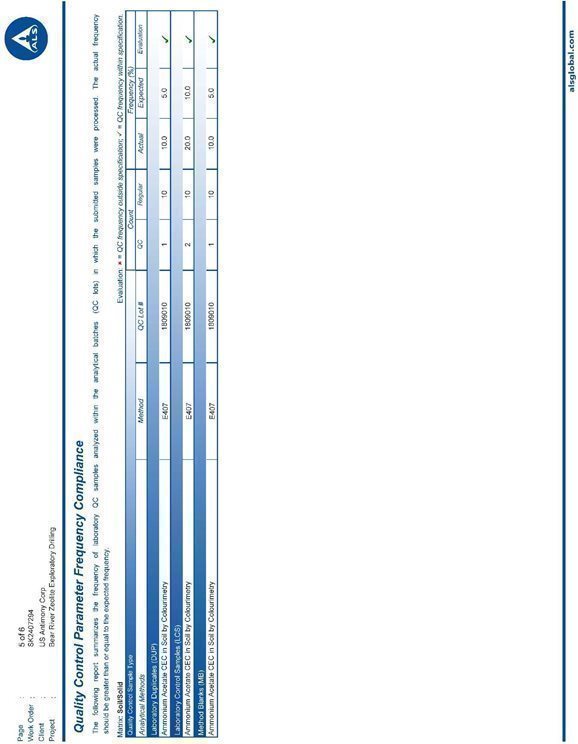
| GeoGRAFX GIS Services | July 2, 2025 |
| Bear River Zeolite Project | Page: 296 |
| Franklin County, USA |
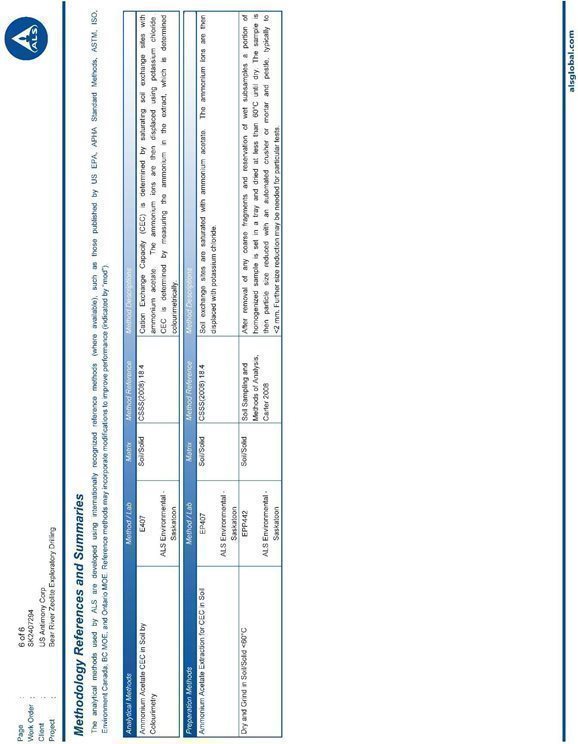
| GeoGRAFX GIS Services | July 2, 2025 |