Shareholder Report
|
12 Months Ended |
|
May 31, 2025
USD ($)
Holding
|
|---|
| Shareholder Report [Line Items] |
|
| Document Type |
N-CSR
|
| Amendment Flag |
false
|
| Registrant Name |
T. ROWE PRICE HIGH YIELD FUND, INC.
|
| Entity Central Index Key |
0000754915
|
| Entity Investment Company Type |
N-1A
|
| Document Period End Date |
May 31, 2025
|
| C000183992 |
|
| Shareholder Report [Line Items] |
|
| Fund Name |
U.S. High Yield Fund
|
| Class Name |
Investor Class
|
| Trading Symbol |
TUHYX
|
| Annual or Semi-Annual Statement [Text Block] |
This annual shareholder report contains important information about U.S. High Yield Fund (the "fund") for the period of June 1, 2024 to May 31, 2025. You can find the fund’s prospectus, financial information on Form N‑CSR (which includes required tax information for dividends), holdings, proxy voting information, and other information atwww.troweprice.com/prospectus. You can also request this information without charge by contacting T. Rowe Price at 1‑800‑638‑5660 or info@troweprice.com or contacting your intermediary.
|
| Shareholder Report Annual or Semi-Annual |
Annual Shareholder Report
|
| Additional Information [Text Block] |
You can find the fund’s prospectus, financial information on Form N‑CSR (which includes required tax information for dividends), holdings, proxy voting information, and other information atwww.troweprice.com/prospectus. You can also request this information without charge by contacting T. Rowe Price at 1‑800‑638‑5660 or info@troweprice.com or contacting your intermediary.
|
| Material Fund Change Notice [Text Block] |
|
| Additional Information Phone Number |
1‑800‑638‑5660
|
| Additional Information Email |
<span style="box-sizing: border-box; color: rgb(0, 0, 0); display: inline; flex-wrap: nowrap; font-size: 13.3333px; font-weight: 400; grid-area: auto; line-height: 17.3333px; margin: 0px; overflow: visible; text-align: justify; text-align-last: left; white-space-collapse: preserve-breaks;">info@troweprice.com</span>
|
| Additional Information Website |
www.troweprice.com/prospectus
|
| Expenses [Text Block] |
What were the fund costs for the last year? (based on a hypothetical $10,000 investment)
|
Costs of a $10,000 investment |
Costs paid as a percentage of a $10,000 investment |
U.S. High Yield Fund - Investor Class |
$78 |
0.75% | |
| Expenses Paid, Amount |
$ 78
|
| Expense Ratio, Percent |
0.75%
|
| Factors Affecting Performance [Text Block] |
What drove fund performance during the past 12 months?The high yield market posted solid gains in the year ended May 31, 2025, despite growing concerns about the Trump administration’s trade policies during the last few months of the period. The resilient economy, healthy equity returns, and mostly favorable technical conditions supported the asset class’s performance. Compared with the style-specific ICE BofA US High Yield Constrained Index, the fund’s strongest relative results were in the basic industry, capital goods, and transportation segments. By credit quality, our selection in the B rating tier contributed to relative results, as did our underweight to BBs. Relative to the style-specific benchmark, the fund’s weakest results were in the media, retail, and telecommunications industries. Our positioning in the CCC rating tier held back relative gains. Our overweight to the B rating tier and selection among BBs detracted. The fund seeks total return and, secondarily, current income by investing primarily in U.S. below investment-grade corporate debt securities. We expected more income-driven returns due to very tight spread levels and limited room for capital appreciation. As such, we sought to position the portfolio with a current yield advantage versus the index in an effort to outperform while being cognizant of risk as very tight spread levels did not justify excessive risk taking, in our view. Within the higher-quality rating tiers, we remained underweight BBs and overweight Bs in accordance with our emphasis on current yield. We continued to consider bank loans alongside bonds when looking to optimize our positioning within an issuer’s capital structure.
|
| Performance Past Does Not Indicate Future [Text] |
The fund’s past performance is not a good predictor of the fund’s future performance.
|
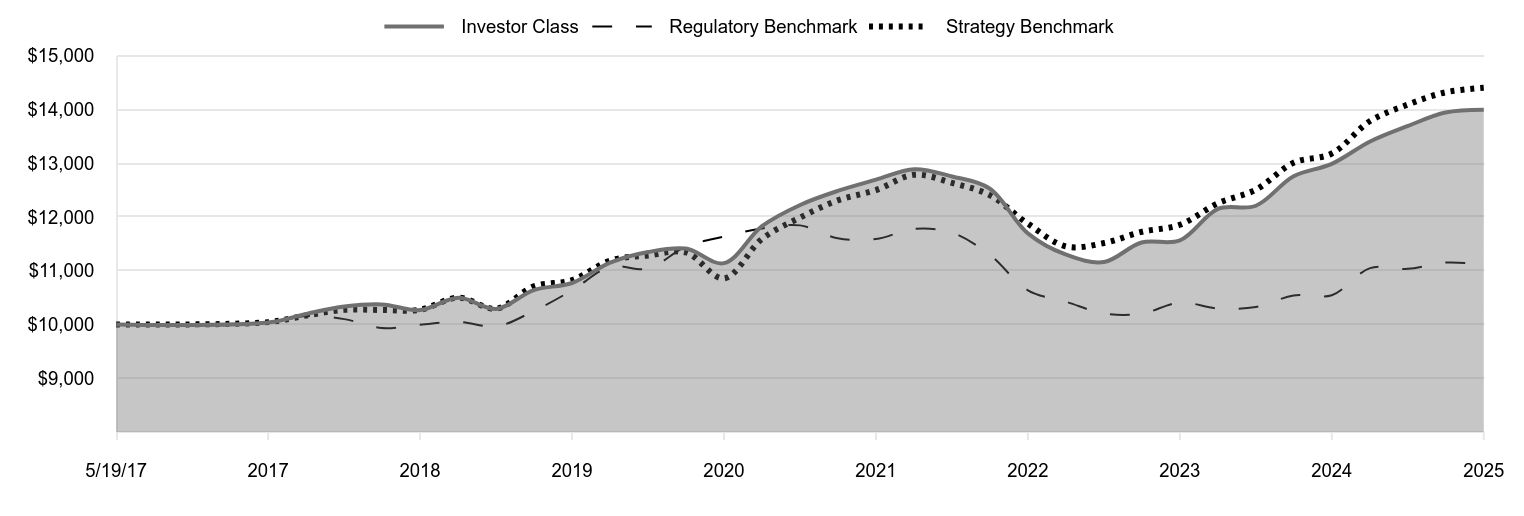
| Line Graph [Table Text Block] |
|
Investor Class |
Regulatory Benchmark |
Strategy Benchmark |
5/19/17 |
10,000 |
10,000 |
10,000 |
5/31/17 |
10,036 |
10,032 |
10,044 |
8/31/17 |
10,198 |
10,156 |
10,168 |
11/30/17 |
10,334 |
10,100 |
10,272 |
2/28/18 |
10,374 |
9,935 |
10,271 |
5/31/18 |
10,268 |
9,995 |
10,274 |
8/31/18 |
10,498 |
10,049 |
10,500 |
11/30/18 |
10,290 |
9,965 |
10,294 |
2/28/19 |
10,641 |
10,250 |
10,708 |
5/31/19 |
10,772 |
10,635 |
10,825 |
8/31/19 |
11,151 |
11,071 |
11,191 |
11/30/19 |
11,348 |
11,040 |
11,283 |
2/29/20 |
11,412 |
11,447 |
11,341 |
5/31/20 |
11,141 |
11,636 |
10,858 |
8/31/20 |
11,833 |
11,788 |
11,596 |
11/30/20 |
12,224 |
11,844 |
11,990 |
2/28/21 |
12,485 |
11,605 |
12,308 |
5/31/21 |
12,694 |
11,589 |
12,501 |
8/31/21 |
12,889 |
11,778 |
12,786 |
11/30/21 |
12,754 |
11,708 |
12,634 |
2/28/22 |
12,530 |
11,299 |
12,407 |
5/31/22 |
11,695 |
10,636 |
11,875 |
8/31/22 |
11,298 |
10,422 |
11,452 |
11/30/22 |
11,163 |
10,204 |
11,515 |
2/28/23 |
11,526 |
10,200 |
11,723 |
5/31/23 |
11,565 |
10,408 |
11,855 |
8/31/23 |
12,151 |
10,298 |
12,257 |
11/30/23 |
12,209 |
10,325 |
12,507 |
2/29/24 |
12,757 |
10,540 |
13,010 |
5/31/24 |
12,988 |
10,544 |
13,181 |
8/31/24 |
13,404 |
11,049 |
13,785 |
11/30/24 |
13,694 |
11,035 |
14,093 |
2/28/25 |
13,944 |
11,152 |
14,319 |
5/31/25 |
13,996 |
11,120 |
14,404 |
|
| Average Annual Return [Table Text Block] |
|
1 Year |
5 Years |
Since Inception 5/19/17 |
U.S. High Yield Fund (Investor Class) |
7.76% |
4.67% |
4.27% |
Bloomberg U.S. Aggregate Bond Index (Regulatory Benchmark) |
5.46 |
-0.90 |
1.33 |
ICE BofA US High Yield Constrained Index (Strategy Benchmark) |
9.28 |
5.81 |
4.65 | |
| Performance Inception Date |
May 19, 2017
|
| No Deduction of Taxes [Text Block] |
Neither the fund’s returns nor the index returns reflect the deduction of taxes that a shareholder would pay on fund distributions or redemptions of fund shares.
|
| Updated Performance Information Location [Text Block] |
Updated performance information can be found at www.troweprice.com.
|
| Distribution of Capital [Text Block] |
The fund's total return figures reflect the reinvestment of dividends and capital gains, if any.
|
| AssetsNet |
$ 516,024,000
|
| Holdings Count | Holding |
98
|
| Advisory Fees Paid, Amount |
$ 2,512,000
|
| InvestmentCompanyPortfolioTurnover |
88.10%
|
| Additional Fund Statistics Significance or Limits [Text Block] |
What are some fund statistics? - Total Net Assets (000s)$516,024
- Number of Portfolio Holdings98
|
| Holdings [Text Block] |
Corporate Bonds |
85.9% |
Bank Loans |
8.4 |
Preferred Stocks |
0.6 |
Short-Term and Other |
5.1 | |
| Largest Holdings [Text Block] |
CCO Holdings |
2.1% |
Cloud Software Group |
2.0 |
Osaic Holdings |
1.9 |
Enbridge |
1.9 |
Six Flags Entertainment |
1.9 |
Aretec Group |
1.8 |
DISH Network |
1.8 |
Heartland Dental |
1.8 |
HLF Financing |
1.6 |
Avis Budget Car Rental |
1.5 | |
| Material Fund Change [Text Block] |
|
| Updated Prospectus Web Address |
www.troweprice.com/paperless
|
| C000183993 |
|
| Shareholder Report [Line Items] |
|
| Fund Name |
U.S. High Yield Fund
|
| Class Name |
Advisor Class
|
| Trading Symbol |
TUHAX
|
| Annual or Semi-Annual Statement [Text Block] |
This annual shareholder report contains important information about U.S. High Yield Fund (the "fund") for the period of June 1, 2024 to May 31, 2025. You can find the fund’s prospectus, financial information on Form N‑CSR (which includes required tax information for dividends), holdings, proxy voting information, and other information atwww.troweprice.com/prospectus. You can also request this information without charge by contacting T. Rowe Price at 1‑800‑638‑5660 or info@troweprice.com or contacting your intermediary.
|
| Shareholder Report Annual or Semi-Annual |
Annual Shareholder Report
|
| Additional Information [Text Block] |
You can find the fund’s prospectus, financial information on Form N‑CSR (which includes required tax information for dividends), holdings, proxy voting information, and other information atwww.troweprice.com/prospectus. You can also request this information without charge by contacting T. Rowe Price at 1‑800‑638‑5660 or info@troweprice.com or contacting your intermediary.
|
| Material Fund Change Notice [Text Block] |
|
| Additional Information Phone Number |
1‑800‑638‑5660
|
| Additional Information Email |
<span style="box-sizing: border-box; color: rgb(0, 0, 0); display: inline; flex-wrap: nowrap; font-size: 13.3333px; font-weight: 400; grid-area: auto; line-height: 17.3333px; margin: 0px; overflow: visible; text-align: justify; text-align-last: left; white-space-collapse: preserve-breaks;">info@troweprice.com</span>
|
| Additional Information Website |
www.troweprice.com/prospectus
|
| Expenses [Text Block] |
What were the fund costs for the last year? (based on a hypothetical $10,000 investment)
|
Costs of a $10,000 investment |
Costs paid as a percentage of a $10,000 investment |
U.S. High Yield Fund - Advisor Class |
$93 |
0.90% | |
| Expenses Paid, Amount |
$ 93
|
| Expense Ratio, Percent |
0.90%
|
| Factors Affecting Performance [Text Block] |
What drove fund performance during the past 12 months?The high yield market posted solid gains in the year ended May 31, 2025, despite growing concerns about the Trump administration’s trade policies during the last few months of the period. The resilient economy, healthy equity returns, and mostly favorable technical conditions supported the asset class’s performance. Compared with the style-specific ICE BofA US High Yield Constrained Index, the fund’s strongest relative results were in the basic industry, capital goods, and transportation segments. By credit quality, our selection in the B rating tier contributed to relative results, as did our underweight to BBs. Relative to the style-specific benchmark, the fund’s weakest results were in the media, retail, and telecommunications industries. Our positioning in the CCC rating tier held back relative gains. Our overweight to the B rating tier and selection among BBs detracted. The fund seeks total return and, secondarily, current income by investing primarily in U.S. below investment-grade corporate debt securities. We expected more income-driven returns due to very tight spread levels and limited room for capital appreciation. As such, we sought to position the portfolio with a current yield advantage versus the index in an effort to outperform while being cognizant of risk as very tight spread levels did not justify excessive risk taking, in our view. Within the higher-quality rating tiers, we remained underweight BBs and overweight Bs in accordance with our emphasis on current yield. We continued to consider bank loans alongside bonds when looking to optimize our positioning within an issuer’s capital structure.
|
| Performance Past Does Not Indicate Future [Text] |
The fund’s past performance is not a good predictor of the fund’s future performance.
|
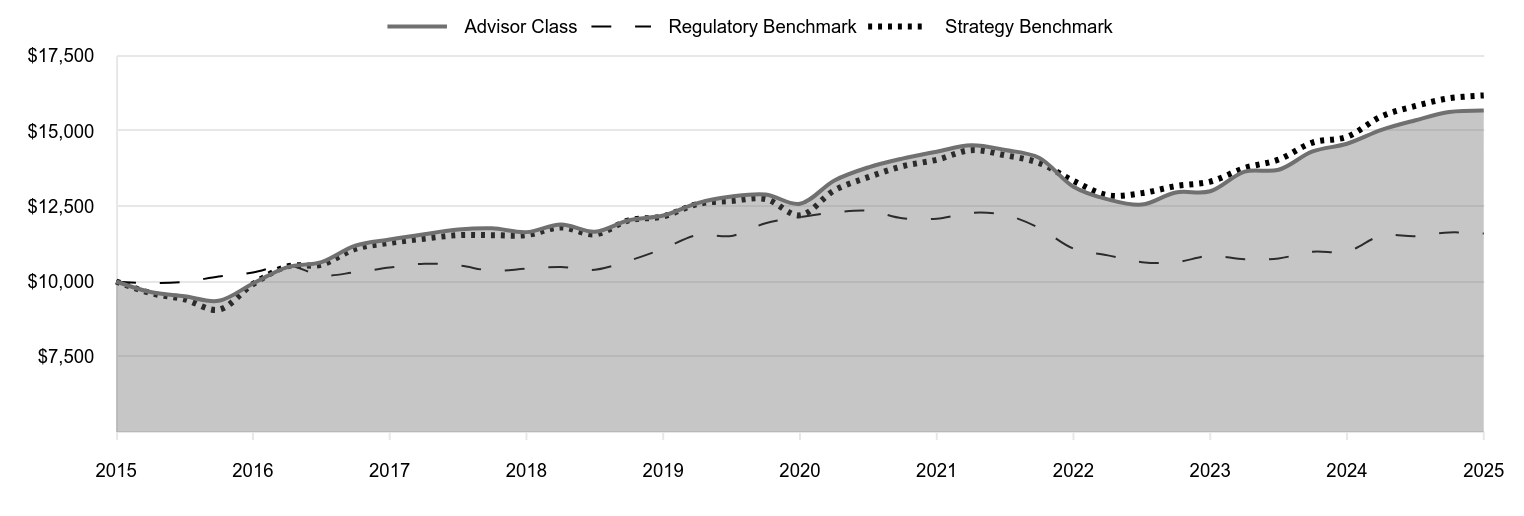
| Line Graph [Table Text Block] |
|
Advisor Class |
Regulatory Benchmark |
Strategy Benchmark |
2015 |
10,000 |
10,000 |
10,000 |
2015 |
9,649 |
9,945 |
9,614 |
2015 |
9,509 |
9,988 |
9,408 |
2016 |
9,358 |
10,164 |
9,062 |
2016 |
9,933 |
10,299 |
9,912 |
2016 |
10,478 |
10,539 |
10,501 |
2016 |
10,644 |
10,205 |
10,560 |
2017 |
11,190 |
10,308 |
11,082 |
2017 |
11,396 |
10,462 |
11,284 |
2017 |
11,572 |
10,591 |
11,423 |
2017 |
11,724 |
10,533 |
11,540 |
2018 |
11,765 |
10,360 |
11,539 |
2018 |
11,640 |
10,423 |
11,542 |
2018 |
11,896 |
10,480 |
11,797 |
2018 |
11,656 |
10,391 |
11,565 |
2019 |
12,037 |
10,689 |
12,030 |
2019 |
12,193 |
11,090 |
12,162 |
2019 |
12,605 |
11,546 |
12,573 |
2019 |
12,823 |
11,513 |
12,676 |
2020 |
12,891 |
11,937 |
12,741 |
2020 |
12,580 |
12,134 |
12,198 |
2020 |
13,357 |
12,293 |
13,028 |
2020 |
13,793 |
12,351 |
13,470 |
2021 |
14,082 |
12,102 |
13,828 |
2021 |
14,313 |
12,085 |
14,044 |
2021 |
14,527 |
12,283 |
14,364 |
2021 |
14,369 |
12,209 |
14,194 |
2022 |
14,111 |
11,782 |
13,939 |
2022 |
13,150 |
11,091 |
13,341 |
2022 |
12,728 |
10,868 |
12,866 |
2022 |
12,556 |
10,641 |
12,936 |
2023 |
12,958 |
10,637 |
13,171 |
2023 |
12,997 |
10,854 |
13,319 |
2023 |
13,652 |
10,738 |
13,770 |
2023 |
13,711 |
10,767 |
14,051 |
2024 |
14,321 |
10,991 |
14,616 |
2024 |
14,576 |
10,995 |
14,808 |
2024 |
15,037 |
11,522 |
15,487 |
2024 |
15,357 |
11,507 |
15,833 |
2025 |
15,631 |
11,629 |
16,086 |
2025 |
15,683 |
11,596 |
16,182 |
|
| Average Annual Return [Table Text Block] |
|
1 Year |
5 Years |
10 Years |
U.S. High Yield Fund (Advisor Class) |
7.60% |
4.51% |
4.60% |
Bloomberg U.S. Aggregate Bond Index (Regulatory Benchmark) |
5.46 |
-0.90 |
1.49 |
ICE BofA US High Yield Constrained Index (Strategy Benchmark) |
9.28 |
5.81 |
4.93 | |
| No Deduction of Taxes [Text Block] |
Neither the fund’s returns nor the index returns reflect the deduction of taxes that a shareholder would pay on fund distributions or redemptions of fund shares.
|
| Updated Performance Information Location [Text Block] |
Updated performance information can be found at www.troweprice.com.
|
| Distribution of Capital [Text Block] |
The fund's total return figures reflect the reinvestment of dividends and capital gains, if any.
|
| AssetsNet |
$ 516,024,000
|
| Holdings Count | Holding |
98
|
| Advisory Fees Paid, Amount |
$ 2,512,000
|
| InvestmentCompanyPortfolioTurnover |
88.10%
|
| Additional Fund Statistics Significance or Limits [Text Block] |
What are some fund statistics? - Total Net Assets (000s)$516,024
- Number of Portfolio Holdings98
|
| Holdings [Text Block] |
Corporate Bonds |
85.9% |
Bank Loans |
8.4 |
Preferred Stocks |
0.6 |
Short-Term and Other |
5.1 | |
| Largest Holdings [Text Block] |
CCO Holdings |
2.1% |
Cloud Software Group |
2.0 |
Osaic Holdings |
1.9 |
Enbridge |
1.9 |
Six Flags Entertainment |
1.9 |
Aretec Group |
1.8 |
DISH Network |
1.8 |
Heartland Dental |
1.8 |
HLF Financing |
1.6 |
Avis Budget Car Rental |
1.5 | |
| Material Fund Change [Text Block] |
|
| Updated Prospectus Web Address |
www.troweprice.com/paperless
|
| C000183994 |
|
| Shareholder Report [Line Items] |
|
| Fund Name |
U.S. High Yield Fund
|
| Class Name |
I Class
|
| Trading Symbol |
TUHIX
|
| Annual or Semi-Annual Statement [Text Block] |
This annual shareholder report contains important information about U.S. High Yield Fund (the "fund") for the period of June 1, 2024 to May 31, 2025. You can find the fund’s prospectus, financial information on Form N‑CSR (which includes required tax information for dividends), holdings, proxy voting information, and other information atwww.troweprice.com/prospectus. You can also request this information without charge by contacting T. Rowe Price at 1‑800‑638‑5660 or info@troweprice.com or contacting your intermediary.
|
| Shareholder Report Annual or Semi-Annual |
Annual Shareholder Report
|
| Additional Information [Text Block] |
You can find the fund’s prospectus, financial information on Form N‑CSR (which includes required tax information for dividends), holdings, proxy voting information, and other information atwww.troweprice.com/prospectus. You can also request this information without charge by contacting T. Rowe Price at 1‑800‑638‑5660 or info@troweprice.com or contacting your intermediary.
|
| Material Fund Change Notice [Text Block] |
|
| Additional Information Phone Number |
1‑800‑638‑5660
|
| Additional Information Email |
<span style="box-sizing: border-box; color: rgb(0, 0, 0); display: inline; flex-wrap: nowrap; font-size: 13.3333px; font-weight: 400; grid-area: auto; line-height: 17.3333px; margin: 0px; overflow: visible; text-align: justify; text-align-last: left; white-space-collapse: preserve-breaks;">info@troweprice.com</span>
|
| Additional Information Website |
www.troweprice.com/prospectus
|
| Expenses [Text Block] |
What were the fund costs for the last year? (based on a hypothetical $10,000 investment)
|
Costs of a $10,000 investment |
Costs paid as a percentage of a $10,000 investment |
U.S. High Yield Fund - I Class |
$62 |
0.60% | |
| Expenses Paid, Amount |
$ 62
|
| Expense Ratio, Percent |
0.60%
|
| Factors Affecting Performance [Text Block] |
What drove fund performance during the past 12 months?The high yield market posted solid gains in the year ended May 31, 2025, despite growing concerns about the Trump administration’s trade policies during the last few months of the period. The resilient economy, healthy equity returns, and mostly favorable technical conditions supported the asset class’s performance. Compared with the style-specific ICE BofA US High Yield Constrained Index, the fund’s strongest relative results were in the basic industry, capital goods, and transportation segments. By credit quality, our selection in the B rating tier contributed to relative results, as did our underweight to BBs. Relative to the style-specific benchmark, the fund’s weakest results were in the media, retail, and telecommunications industries. Our positioning in the CCC rating tier held back relative gains. Our overweight to the B rating tier and selection among BBs detracted. The fund seeks total return and, secondarily, current income by investing primarily in U.S. below investment-grade corporate debt securities. We expected more income-driven returns due to very tight spread levels and limited room for capital appreciation. As such, we sought to position the portfolio with a current yield advantage versus the index in an effort to outperform while being cognizant of risk as very tight spread levels did not justify excessive risk taking, in our view. Within the higher-quality rating tiers, we remained underweight BBs and overweight Bs in accordance with our emphasis on current yield. We continued to consider bank loans alongside bonds when looking to optimize our positioning within an issuer’s capital structure.
|
| Performance Past Does Not Indicate Future [Text] |
The fund’s past performance is not a good predictor of the fund’s future performance.
|
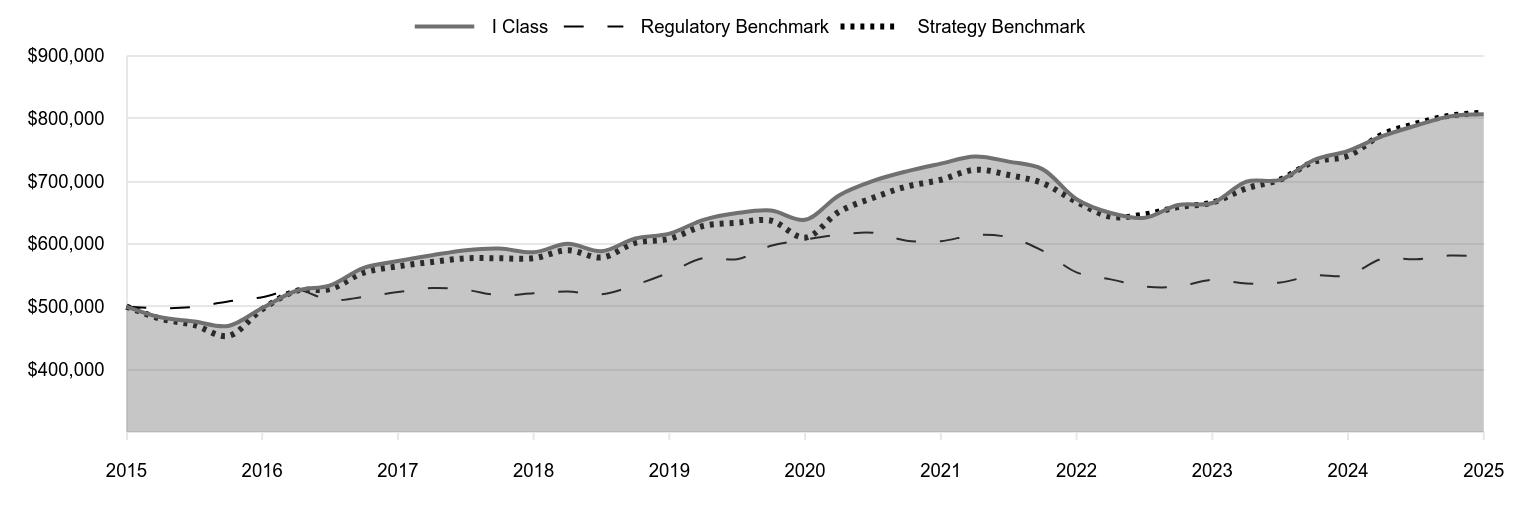
| Line Graph [Table Text Block] |
|
I Class |
Regulatory Benchmark |
Strategy Benchmark |
2015 |
500,000 |
500,000 |
500,000 |
2015 |
482,857 |
497,271 |
480,703 |
2015 |
476,228 |
499,395 |
470,378 |
2016 |
469,079 |
508,211 |
453,098 |
2016 |
497,634 |
514,974 |
495,582 |
2016 |
525,196 |
526,938 |
525,047 |
2016 |
533,863 |
510,240 |
528,004 |
2017 |
561,744 |
515,403 |
554,117 |
2017 |
572,556 |
523,104 |
564,185 |
2017 |
581,863 |
529,534 |
571,158 |
2017 |
589,982 |
526,640 |
576,989 |
2018 |
592,485 |
518,006 |
576,951 |
2018 |
586,595 |
521,144 |
577,122 |
2018 |
599,990 |
523,977 |
589,827 |
2018 |
588,229 |
519,572 |
578,238 |
2019 |
608,588 |
534,426 |
601,519 |
2019 |
616,304 |
554,499 |
608,082 |
2019 |
638,287 |
577,278 |
628,627 |
2019 |
649,137 |
575,640 |
633,811 |
2020 |
653,058 |
596,862 |
637,057 |
2020 |
638,340 |
606,708 |
609,922 |
2020 |
677,677 |
614,648 |
651,382 |
2020 |
700,398 |
617,569 |
673,495 |
2021 |
715,629 |
605,119 |
691,379 |
2021 |
727,941 |
604,252 |
702,204 |
2021 |
739,427 |
614,130 |
718,204 |
2021 |
731,144 |
610,445 |
709,709 |
2022 |
719,176 |
589,119 |
696,936 |
2022 |
671,204 |
554,570 |
667,063 |
2022 |
649,250 |
543,407 |
643,280 |
2022 |
641,629 |
532,067 |
646,824 |
2023 |
661,915 |
531,845 |
658,534 |
2023 |
665,166 |
542,687 |
665,936 |
2023 |
699,246 |
536,923 |
688,482 |
2023 |
701,911 |
538,344 |
702,568 |
2024 |
733,770 |
549,541 |
730,793 |
2024 |
748,253 |
549,772 |
740,411 |
2024 |
771,618 |
576,100 |
774,352 |
2024 |
788,616 |
575,355 |
791,637 |
2025 |
803,305 |
581,460 |
804,323 |
2025 |
806,500 |
579,783 |
809,091 |
|
| Average Annual Return [Table Text Block] |
|
1 Year |
5 Years |
10 Years |
U.S. High Yield Fund (I Class) |
7.78% |
4.79% |
4.90% |
Bloomberg U.S. Aggregate Bond Index (Regulatory Benchmark) |
5.46 |
-0.90 |
1.49 |
ICE BofA US High Yield Constrained Index (Strategy Benchmark) |
9.28 |
5.81 |
4.93 | |
| No Deduction of Taxes [Text Block] |
Neither the fund’s returns nor the index returns reflect the deduction of taxes that a shareholder would pay on fund distributions or redemptions of fund shares.
|
| Updated Performance Information Location [Text Block] |
Updated performance information can be found at www.troweprice.com.
|
| Distribution of Capital [Text Block] |
The fund's total return figures reflect the reinvestment of dividends and capital gains, if any.
|
| AssetsNet |
$ 516,024,000
|
| Holdings Count | Holding |
98
|
| Advisory Fees Paid, Amount |
$ 2,512,000
|
| InvestmentCompanyPortfolioTurnover |
88.10%
|
| Additional Fund Statistics Significance or Limits [Text Block] |
What are some fund statistics? - Total Net Assets (000s)$516,024
- Number of Portfolio Holdings98
|
| Holdings [Text Block] |
Corporate Bonds |
85.9% |
Bank Loans |
8.4 |
Preferred Stocks |
0.6 |
Short-Term and Other |
5.1 | |
| Largest Holdings [Text Block] |
CCO Holdings |
2.1% |
Cloud Software Group |
2.0 |
Osaic Holdings |
1.9 |
Enbridge |
1.9 |
Six Flags Entertainment |
1.9 |
Aretec Group |
1.8 |
DISH Network |
1.8 |
Heartland Dental |
1.8 |
HLF Financing |
1.6 |
Avis Budget Car Rental |
1.5 | |
| Material Fund Change [Text Block] |
|
| Updated Prospectus Web Address |
www.troweprice.com/paperless
|