Shareholder Report
May 31, 2025
USD ($)
Holding
What were the fund costs during the last year ?
(Based on a hypothetical $10,000 investment)
| Fund (Class) | Costs of a $10,000 investment | Costs paid as a percentage of a $10,000 investment |
| Bond Fund (Class A/JHNBX) |
$78 | 0.76% |
Management’s Discussion of Fund Performance
SUMMARY OF RESULTS
Bond Fund (Class A/JHNBX) returned 5.32% (excluding sales charges) for the year ended May 31, 2025. The U.S. bond market produced broad-based gains in the annual period, with positive price performance augmenting the contribution from income. Investors were cheered by the backdrop of falling inflation, moderate economic growth, and interest rate cuts by the U.S. Federal Reserve. Credit-oriented market segments generally outperformed, reflecting a hearty appetite for risk among market participants.
TOP PERFORMANCE CONTRIBUTORS
Agency mortgage-backed securities | The fund’s allocation to this area made the largest contribution to absolute performance due to the combination of positive total returns and a sizable portfolio weighting.
Investment-grade corporates | This segment of the fund also made a meaningful contribution, led by Charter Communications Operating LLC, Enbridge, Inc., and Paramount Global.
Other contributing sectors | An allocation to U.S. Treasuries and government debt also contributed, as did holdings in high-yield bonds, asset-backed securities, commercial mortgage-backed securities, and emerging-market corporate issues.
TOP PERFORMANCE DETRACTORS
A small number of individual securities | Although many of the fund’s positions registered positive absolute returns, certain holdings, including Occidental Petroleum Corp., finished with losses.
Saks Global Enterprises | A position in the bonds of the luxury retailer lost ground, as did holdings in specific longer-dated U.S. Treasury issues and U.S. Treasury futures.
The views expressed in this report are exclusively those of the portfolio management team at Manulife Investment Management (US) LLC, and are subject to change. They are not meant as investment advice.
Fund Performance
The following graph compares the initial and subsequent account values at the end of each of the most recently completed 10 fiscal years of the fund (or for the life of the fund, if shorter). It assumes a $10,000 initial investment in the fund and in an appropriate, broad-based securities market index for the same period.
GROWTH OF $10,000
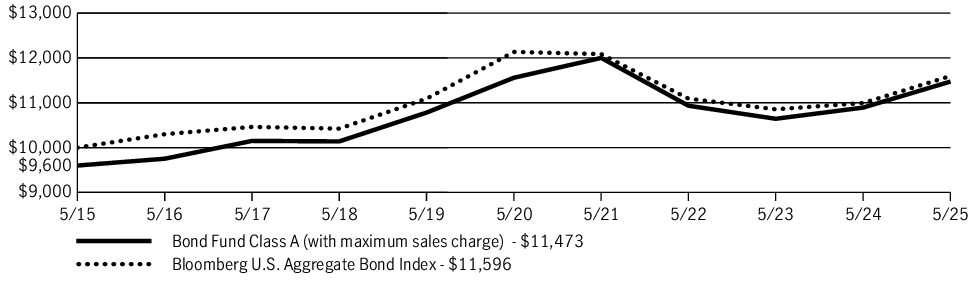
| AVERAGE ANNUAL TOTAL RETURN | 1 Year | 5 Years | 10 Years |
| Bond Fund (Class A/JHNBX) | 1.12% | (0.96)% | 1.38% |
| Bond Fund (Class A/JHNBX)—excluding sales charge | 5.32% | (0.15)% | 1.80% |
| Bloomberg U.S. Aggregate Bond Index | 5.46% | (0.90)% | 1.49% |
Fund Statistics
| Fund net assets | $26,129,016,250 |
| Total number of portfolio holdings | 1,107 |
| Total advisory fees paid (net) | $78,343,545 |
| Portfolio turnover rate | 100% |
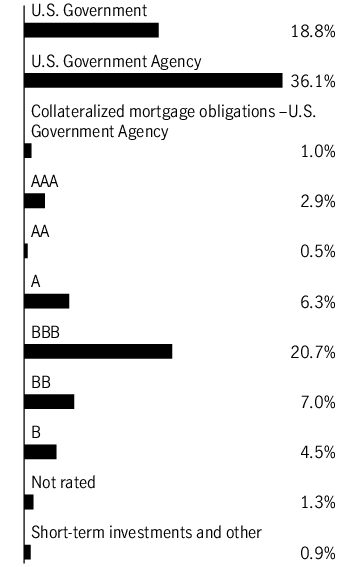
Graphical Representation of Holdings
The tables below show the investment makeup of the fund, representing a percentage of the total net assets of the fund.
Portfolio Composition
| U.S. Government Agency | 36.1% |
| Corporate bonds | 35.5% |
| U.S. Government | 18.8% |
| Asset-backed securities | 4.7% |
| Collateralized mortgage obligations – Commercial and residential | 2.6% |
| Collateralized mortgage obligations – U.S. Government Agency | 1.0% |
| Term loans | 0.3% |
| Preferred securities | 0.1% |
| Short-term investments and other | 0.9% |
Quality Composition

Ratings are from Moody’s Investors Service, Inc. If not available, we have used S&P Global Ratings. In the absence of ratings from these agencies, we have used Fitch Ratings, Inc. “Not rated” securities are those with no ratings available from these agencies. All ratings are as of 5-31-25 and do not reflect subsequent downgrades or upgrades, if any.
Holdings may not have been held by the fund for the entire period and are subject to change without notice. Portfolio composition is subject to review in accordance with the fund’s investment strategy and may vary in the future. Current and future portfolio holdings are subject to risk and may change at any time.
Ratings are from Moody’s Investors Service, Inc. If not available, we have used S&P Global Ratings. In the absence of ratings from these agencies, we have used Fitch Ratings, Inc. “Not rated” securities are those with no ratings available from these agencies. All ratings are as of 5-31-25 and do not reflect subsequent downgrades or upgrades, if any.
What were the fund costs during the last year ?
(Based on a hypothetical $10,000 investment)
| Fund (Class) | Costs of a $10,000 investment | Costs paid as a percentage of a $10,000 investment |
| Bond Fund (Class C/JHCBX) |
$149 | 1.46% |
Management’s Discussion of Fund Performance
SUMMARY OF RESULTS
Bond Fund (Class C/JHCBX) returned 4.59% (excluding sales charges) for the year ended May 31, 2025. The U.S. bond market produced broad-based gains in the annual period, with positive price performance augmenting the contribution from income. Investors were cheered by the backdrop of falling inflation, moderate economic growth, and interest rate cuts by the U.S. Federal Reserve. Credit-oriented market segments generally outperformed, reflecting a hearty appetite for risk among market participants.
TOP PERFORMANCE CONTRIBUTORS
Agency mortgage-backed securities | The fund’s allocation to this area made the largest contribution to absolute performance due to the combination of positive total returns and a sizable portfolio weighting.
Investment-grade corporates | This segment of the fund also made a meaningful contribution, led by Charter Communications Operating LLC, Enbridge, Inc., and Paramount Global.
Other contributing sectors | An allocation to U.S. Treasuries and government debt also contributed, as did holdings in high-yield bonds, asset-backed securities, commercial mortgage-backed securities, and emerging-market corporate issues.
TOP PERFORMANCE DETRACTORS
A small number of individual securities | Although many of the fund’s positions registered positive absolute returns, certain holdings, including Occidental Petroleum Corp., finished with losses.
Saks Global Enterprises | A position in the bonds of the luxury retailer lost ground, as did holdings in specific longer-dated U.S. Treasury issues and U.S. Treasury futures.
The views expressed in this report are exclusively those of the portfolio management team at Manulife Investment Management (US) LLC, and are subject to change. They are not meant as investment advice.
Fund Performance
The following graph compares the initial and subsequent account values at the end of each of the most recently completed 10 fiscal years of the fund (or for the life of the fund, if shorter). It assumes a $10,000 initial investment in the fund and in an appropriate, broad-based securities market index for the same period.
GROWTH OF $10,000
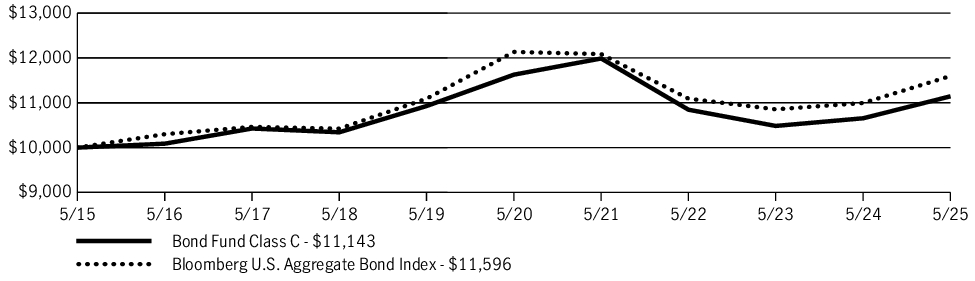
| AVERAGE ANNUAL TOTAL RETURN | 1 Year | 5 Years | 10 Years |
| Bond Fund (Class C/JHCBX) | 3.59% | (0.85)% | 1.09% |
| Bond Fund (Class C/JHCBX)—excluding sales charge | 4.59% | (0.85)% | 1.09% |
| Bloomberg U.S. Aggregate Bond Index | 5.46% | (0.90)% | 1.49% |
Fund Statistics
| Fund net assets | $26,129,016,250 |
| Total number of portfolio holdings | 1,107 |
| Total advisory fees paid (net) | $78,343,545 |
| Portfolio turnover rate | 100% |
Graphical Representation of Holdings
The tables below show the investment makeup of the fund, representing a percentage of the total net assets of the fund.
Portfolio Composition
| U.S. Government Agency | 36.1% |
| Corporate bonds | 35.5% |
| U.S. Government | 18.8% |
| Asset-backed securities | 4.7% |
| Collateralized mortgage obligations – Commercial and residential | 2.6% |
| Collateralized mortgage obligations – U.S. Government Agency | 1.0% |
| Term loans | 0.3% |
| Preferred securities | 0.1% |
| Short-term investments and other | 0.9% |
Quality Composition

Ratings are from Moody’s Investors Service, Inc. If not available, we have used S&P Global Ratings. In the absence of ratings from these agencies, we have used Fitch Ratings, Inc. “Not rated” securities are those with no ratings available from these agencies. All ratings are as of 5-31-25 and do not reflect subsequent downgrades or upgrades, if any.
Holdings may not have been held by the fund for the entire period and are subject to change without notice. Portfolio composition is subject to review in accordance with the fund’s investment strategy and may vary in the future. Current and future portfolio holdings are subject to risk and may change at any time.
Ratings are from Moody’s Investors Service, Inc. If not available, we have used S&P Global Ratings. In the absence of ratings from these agencies, we have used Fitch Ratings, Inc. “Not rated” securities are those with no ratings available from these agencies. All ratings are as of 5-31-25 and do not reflect subsequent downgrades or upgrades, if any.
What were the fund costs during the last year ?
(Based on a hypothetical $10,000 investment)
| Fund (Class) | Costs of a $10,000 investment | Costs paid as a percentage of a $10,000 investment |
| Bond Fund (Class I/JHBIX) |
$47 | 0.46% |
Management’s Discussion of Fund Performance
SUMMARY OF RESULTS
Bond Fund (Class I/JHBIX) returned 5.64% for the year ended May 31, 2025. The U.S. bond market produced broad-based gains in the annual period, with positive price performance augmenting the contribution from income. Investors were cheered by the backdrop of falling inflation, moderate economic growth, and interest rate cuts by the U.S. Federal Reserve. Credit-oriented market segments generally outperformed, reflecting a hearty appetite for risk among market participants.
TOP PERFORMANCE CONTRIBUTORS
Agency mortgage-backed securities | The fund’s allocation to this area made the largest contribution to absolute performance due to the combination of positive total returns and a sizable portfolio weighting.
Investment-grade corporates | This segment of the fund also made a meaningful contribution, led by Charter Communications Operating LLC, Enbridge, Inc., and Paramount Global.
Other contributing sectors | An allocation to U.S. Treasuries and government debt also contributed, as did holdings in high-yield bonds, asset-backed securities, commercial mortgage-backed securities, and emerging-market corporate issues.
TOP PERFORMANCE DETRACTORS
A small number of individual securities | Although many of the fund’s positions registered positive absolute returns, certain holdings, including Occidental Petroleum Corp., finished with losses.
Saks Global Enterprises | A position in the bonds of the luxury retailer lost ground, as did holdings in specific longer-dated U.S. Treasury issues and U.S. Treasury futures.
The views expressed in this report are exclusively those of the portfolio management team at Manulife Investment Management (US) LLC, and are subject to change. They are not meant as investment advice.
Fund Performance
The following graph compares the initial and subsequent account values at the end of each of the most recently completed 10 fiscal years of the fund (or for the life of the fund, if shorter). It assumes a $250,000 initial investment in the fund and in an appropriate, broad-based securities market index for the same period.
GROWTH OF $250,000
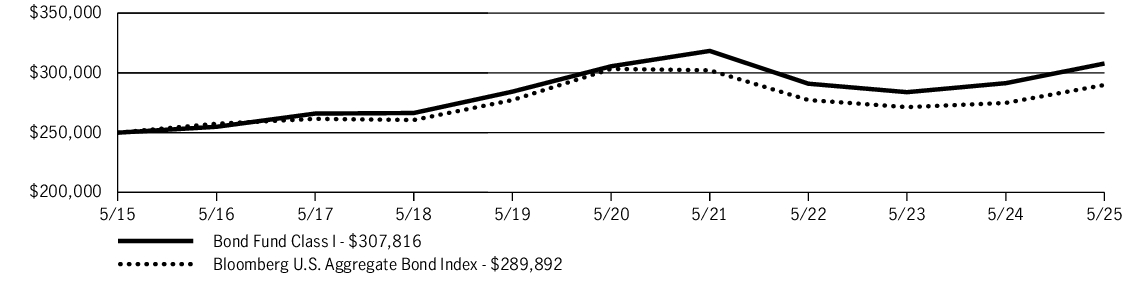
| AVERAGE ANNUAL TOTAL RETURN | 1 Year | 5 Years | 10 Years |
| Bond Fund (Class I/JHBIX) | 5.64% | 0.15% | 2.10% |
| Bloomberg U.S. Aggregate Bond Index | 5.46% | (0.90)% | 1.49% |
Fund Statistics
| Fund net assets | $26,129,016,250 |
| Total number of portfolio holdings | 1,107 |
| Total advisory fees paid (net) | $78,343,545 |
| Portfolio turnover rate | 100% |
Graphical Representation of Holdings
The tables below show the investment makeup of the fund, representing a percentage of the total net assets of the fund.
Portfolio Composition
| U.S. Government Agency | 36.1% |
| Corporate bonds | 35.5% |
| U.S. Government | 18.8% |
| Asset-backed securities | 4.7% |
| Collateralized mortgage obligations – Commercial and residential | 2.6% |
| Collateralized mortgage obligations – U.S. Government Agency | 1.0% |
| Term loans | 0.3% |
| Preferred securities | 0.1% |
| Short-term investments and other | 0.9% |
Quality Composition

Ratings are from Moody’s Investors Service, Inc. If not available, we have used S&P Global Ratings. In the absence of ratings from these agencies, we have used Fitch Ratings, Inc. “Not rated” securities are those with no ratings available from these agencies. All ratings are as of 5-31-25 and do not reflect subsequent downgrades or upgrades, if any.
Holdings may not have been held by the fund for the entire period and are subject to change without notice. Portfolio composition is subject to review in accordance with the fund’s investment strategy and may vary in the future. Current and future portfolio holdings are subject to risk and may change at any time.
Ratings are from Moody’s Investors Service, Inc. If not available, we have used S&P Global Ratings. In the absence of ratings from these agencies, we have used Fitch Ratings, Inc. “Not rated” securities are those with no ratings available from these agencies. All ratings are as of 5-31-25 and do not reflect subsequent downgrades or upgrades, if any.
What were the fund costs during the last year ?
(Based on a hypothetical $10,000 investment)
| Fund (Class) | Costs of a $10,000 investment | Costs paid as a percentage of a $10,000 investment |
| Bond Fund (Class NAV) |
$36 | 0.35% |
Management’s Discussion of Fund Performance
SUMMARY OF RESULTS
Bond Fund (Class NAV) returned 5.76% for the year ended May 31, 2025. The U.S. bond market produced broad-based gains in the annual period, with positive price performance augmenting the contribution from income. Investors were cheered by the backdrop of falling inflation, moderate economic growth, and interest rate cuts by the U.S. Federal Reserve. Credit-oriented market segments generally outperformed, reflecting a hearty appetite for risk among market participants.
TOP PERFORMANCE CONTRIBUTORS
Agency mortgage-backed securities | The fund’s allocation to this area made the largest contribution to absolute performance due to the combination of positive total returns and a sizable portfolio weighting.
Investment-grade corporates | This segment of the fund also made a meaningful contribution, led by Charter Communications Operating LLC, Enbridge, Inc., and Paramount Global.
Other contributing sectors | An allocation to U.S. Treasuries and government debt also contributed, as did holdings in high-yield bonds, asset-backed securities, commercial mortgage-backed securities, and emerging-market corporate issues.
TOP PERFORMANCE DETRACTORS
A small number of individual securities | Although many of the fund’s positions registered positive absolute returns, certain holdings, including Occidental Petroleum Corp., finished with losses.
Saks Global Enterprises | A position in the bonds of the luxury retailer lost ground, as did holdings in specific longer-dated U.S. Treasury issues and U.S. Treasury futures.
The views expressed in this report are exclusively those of the portfolio management team at Manulife Investment Management (US) LLC, and are subject to change. They are not meant as investment advice.
Fund Performance
The following graph compares the initial and subsequent account values at the end of each of the most recently completed 10 fiscal years of the fund (or for the life of the fund, if shorter). It assumes a $10,000 initial investment in the fund and in an appropriate, broad-based securities market index for the same period.
GROWTH OF $10,000
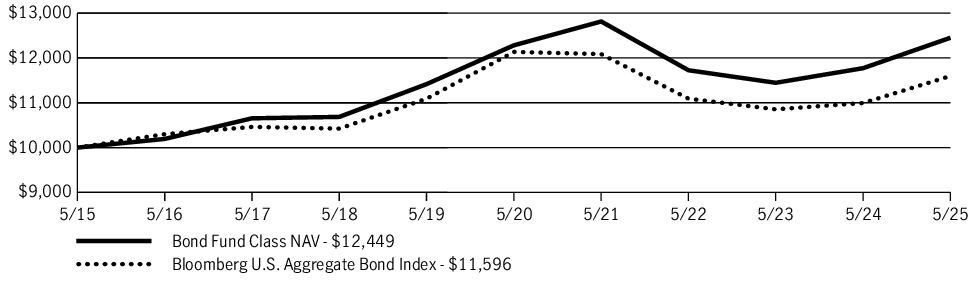
| AVERAGE ANNUAL TOTAL RETURN | 1 Year | 5 Years | 10 Years |
| Bond Fund (Class NAV) | 5.76% | 0.27% | 2.22% |
| Bloomberg U.S. Aggregate Bond Index | 5.46% | (0.90)% | 1.49% |
Fund Statistics
| Fund net assets | $26,129,016,250 |
| Total number of portfolio holdings | 1,107 |
| Total advisory fees paid (net) | $78,343,545 |
| Portfolio turnover rate | 100% |
Graphical Representation of Holdings
The tables below show the investment makeup of the fund, representing a percentage of the total net assets of the fund.
Portfolio Composition
| U.S. Government Agency | 36.1% |
| Corporate bonds | 35.5% |
| U.S. Government | 18.8% |
| Asset-backed securities | 4.7% |
| Collateralized mortgage obligations – Commercial and residential | 2.6% |
| Collateralized mortgage obligations – U.S. Government Agency | 1.0% |
| Term loans | 0.3% |
| Preferred securities | 0.1% |
| Short-term investments and other | 0.9% |
Quality Composition

Ratings are from Moody’s Investors Service, Inc. If not available, we have used S&P Global Ratings. In the absence of ratings from these agencies, we have used Fitch Ratings, Inc. “Not rated” securities are those with no ratings available from these agencies. All ratings are as of 5-31-25 and do not reflect subsequent downgrades or upgrades, if any.
Holdings may not have been held by the fund for the entire period and are subject to change without notice. Portfolio composition is subject to review in accordance with the fund’s investment strategy and may vary in the future. Current and future portfolio holdings are subject to risk and may change at any time.
Ratings are from Moody’s Investors Service, Inc. If not available, we have used S&P Global Ratings. In the absence of ratings from these agencies, we have used Fitch Ratings, Inc. “Not rated” securities are those with no ratings available from these agencies. All ratings are as of 5-31-25 and do not reflect subsequent downgrades or upgrades, if any.
What were the fund costs during the last year ?
(Based on a hypothetical $10,000 investment)
| Fund (Class) | Costs of a $10,000 investment | Costs paid as a percentage of a $10,000 investment |
| Bond Fund (Class R2/JHRBX) |
$87 | 0.85% |
Management’s Discussion of Fund Performance
SUMMARY OF RESULTS
Bond Fund (Class R2/JHRBX) returned 5.15% for the year ended May 31, 2025. The U.S. bond market produced broad-based gains in the annual period, with positive price performance augmenting the contribution from income. Investors were cheered by the backdrop of falling inflation, moderate economic growth, and interest rate cuts by the U.S. Federal Reserve. Credit-oriented market segments generally outperformed, reflecting a hearty appetite for risk among market participants.
TOP PERFORMANCE CONTRIBUTORS
Agency mortgage-backed securities | The fund’s allocation to this area made the largest contribution to absolute performance due to the combination of positive total returns and a sizable portfolio weighting.
Investment-grade corporates | This segment of the fund also made a meaningful contribution, led by Charter Communications Operating LLC, Enbridge, Inc., and Paramount Global.
Other contributing sectors | An allocation to U.S. Treasuries and government debt also contributed, as did holdings in high-yield bonds, asset-backed securities, commercial mortgage-backed securities, and emerging-market corporate issues.
TOP PERFORMANCE DETRACTORS
A small number of individual securities | Although many of the fund’s positions registered positive absolute returns, certain holdings, including Occidental Petroleum Corp., finished with losses.
Saks Global Enterprises | A position in the bonds of the luxury retailer lost ground, as did holdings in specific longer-dated U.S. Treasury issues and U.S. Treasury futures.
The views expressed in this report are exclusively those of the portfolio management team at Manulife Investment Management (US) LLC, and are subject to change. They are not meant as investment advice.
Fund Performance
The following graph compares the initial and subsequent account values at the end of each of the most recently completed 10 fiscal years of the fund (or for the life of the fund, if shorter). It assumes a $10,000 initial investment in the fund and in an appropriate, broad-based securities market index for the same period.
GROWTH OF $10,000
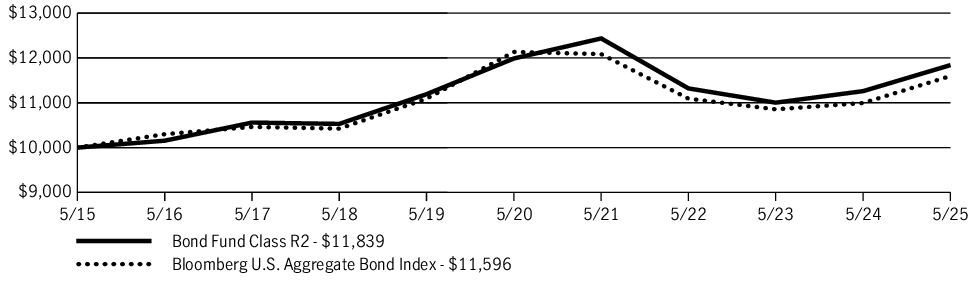
| AVERAGE ANNUAL TOTAL RETURN | 1 Year | 5 Years | 10 Years |
| Bond Fund (Class R2/JHRBX) | 5.15% | (0.25)% | 1.70% |
| Bloomberg U.S. Aggregate Bond Index | 5.46% | (0.90)% | 1.49% |
Fund Statistics
| Fund net assets | $26,129,016,250 |
| Total number of portfolio holdings | 1,107 |
| Total advisory fees paid (net) | $78,343,545 |
| Portfolio turnover rate | 100% |
Graphical Representation of Holdings
The tables below show the investment makeup of the fund, representing a percentage of the total net assets of the fund.
Portfolio Composition
| U.S. Government Agency | 36.1% |
| Corporate bonds | 35.5% |
| U.S. Government | 18.8% |
| Asset-backed securities | 4.7% |
| Collateralized mortgage obligations – Commercial and residential | 2.6% |
| Collateralized mortgage obligations – U.S. Government Agency | 1.0% |
| Term loans | 0.3% |
| Preferred securities | 0.1% |
| Short-term investments and other | 0.9% |
Quality Composition

Ratings are from Moody’s Investors Service, Inc. If not available, we have used S&P Global Ratings. In the absence of ratings from these agencies, we have used Fitch Ratings, Inc. “Not rated” securities are those with no ratings available from these agencies. All ratings are as of 5-31-25 and do not reflect subsequent downgrades or upgrades, if any.
Holdings may not have been held by the fund for the entire period and are subject to change without notice. Portfolio composition is subject to review in accordance with the fund’s investment strategy and may vary in the future. Current and future portfolio holdings are subject to risk and may change at any time.
Ratings are from Moody’s Investors Service, Inc. If not available, we have used S&P Global Ratings. In the absence of ratings from these agencies, we have used Fitch Ratings, Inc. “Not rated” securities are those with no ratings available from these agencies. All ratings are as of 5-31-25 and do not reflect subsequent downgrades or upgrades, if any.
What were the fund costs during the last year ?
(Based on a hypothetical $10,000 investment)
| Fund (Class) | Costs of a $10,000 investment | Costs paid as a percentage of a $10,000 investment |
| Bond Fund (Class R4/JBFRX) |
$62 | 0.60% |
Management’s Discussion of Fund Performance
SUMMARY OF RESULTS
Bond Fund (Class R4/JBFRX) returned 5.49% for the year ended May 31, 2025. The U.S. bond market produced broad-based gains in the annual period, with positive price performance augmenting the contribution from income. Investors were cheered by the backdrop of falling inflation, moderate economic growth, and interest rate cuts by the U.S. Federal Reserve. Credit-oriented market segments generally outperformed, reflecting a hearty appetite for risk among market participants.
TOP PERFORMANCE CONTRIBUTORS
Agency mortgage-backed securities | The fund’s allocation to this area made the largest contribution to absolute performance due to the combination of positive total returns and a sizable portfolio weighting.
Investment-grade corporates | This segment of the fund also made a meaningful contribution, led by Charter Communications Operating LLC, Enbridge, Inc., and Paramount Global.
Other contributing sectors | An allocation to U.S. Treasuries and government debt also contributed, as did holdings in high-yield bonds, asset-backed securities, commercial mortgage-backed securities, and emerging-market corporate issues.
TOP PERFORMANCE DETRACTORS
A small number of individual securities | Although many of the fund’s positions registered positive absolute returns, certain holdings, including Occidental Petroleum Corp., finished with losses.
Saks Global Enterprises | A position in the bonds of the luxury retailer lost ground, as did holdings in specific longer-dated U.S. Treasury issues and U.S. Treasury futures.
The views expressed in this report are exclusively those of the portfolio management team at Manulife Investment Management (US) LLC, and are subject to change. They are not meant as investment advice.
Fund Performance
The following graph compares the initial and subsequent account values at the end of each of the most recently completed 10 fiscal years of the fund (or for the life of the fund, if shorter). It assumes a $10,000 initial investment in the fund and in an appropriate, broad-based securities market index for the same period.
GROWTH OF $10,000
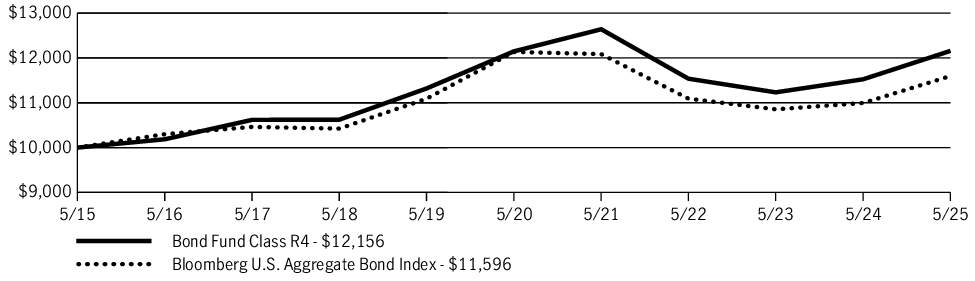
| AVERAGE ANNUAL TOTAL RETURN | 1 Year | 5 Years | 10 Years |
| Bond Fund (Class R4/JBFRX) | 5.49% | 0.02% | 1.97% |
| Bloomberg U.S. Aggregate Bond Index | 5.46% | (0.90)% | 1.49% |
Fund Statistics
| Fund net assets | $26,129,016,250 |
| Total number of portfolio holdings | 1,107 |
| Total advisory fees paid (net) | $78,343,545 |
| Portfolio turnover rate | 100% |
Graphical Representation of Holdings
The tables below show the investment makeup of the fund, representing a percentage of the total net assets of the fund.
Portfolio Composition
| U.S. Government Agency | 36.1% |
| Corporate bonds | 35.5% |
| U.S. Government | 18.8% |
| Asset-backed securities | 4.7% |
| Collateralized mortgage obligations – Commercial and residential | 2.6% |
| Collateralized mortgage obligations – U.S. Government Agency | 1.0% |
| Term loans | 0.3% |
| Preferred securities | 0.1% |
| Short-term investments and other | 0.9% |
Quality Composition

Ratings are from Moody’s Investors Service, Inc. If not available, we have used S&P Global Ratings. In the absence of ratings from these agencies, we have used Fitch Ratings, Inc. “Not rated” securities are those with no ratings available from these agencies. All ratings are as of 5-31-25 and do not reflect subsequent downgrades or upgrades, if any.
Holdings may not have been held by the fund for the entire period and are subject to change without notice. Portfolio composition is subject to review in accordance with the fund’s investment strategy and may vary in the future. Current and future portfolio holdings are subject to risk and may change at any time.
Ratings are from Moody’s Investors Service, Inc. If not available, we have used S&P Global Ratings. In the absence of ratings from these agencies, we have used Fitch Ratings, Inc. “Not rated” securities are those with no ratings available from these agencies. All ratings are as of 5-31-25 and do not reflect subsequent downgrades or upgrades, if any.
What were the fund costs during the last year ?
(Based on a hypothetical $10,000 investment)
| Fund (Class) | Costs of a $10,000 investment | Costs paid as a percentage of a $10,000 investment |
| Bond Fund (Class R6/JHBSX) |
$36 | 0.35% |
Management’s Discussion of Fund Performance
SUMMARY OF RESULTS
Bond Fund (Class R6/JHBSX) returned 5.67% for the year ended May 31, 2025. The U.S. bond market produced broad-based gains in the annual period, with positive price performance augmenting the contribution from income. Investors were cheered by the backdrop of falling inflation, moderate economic growth, and interest rate cuts by the U.S. Federal Reserve. Credit-oriented market segments generally outperformed, reflecting a hearty appetite for risk among market participants.
TOP PERFORMANCE CONTRIBUTORS
Agency mortgage-backed securities | The fund’s allocation to this area made the largest contribution to absolute performance due to the combination of positive total returns and a sizable portfolio weighting.
Investment-grade corporates | This segment of the fund also made a meaningful contribution, led by Charter Communications Operating LLC, Enbridge, Inc., and Paramount Global.
Other contributing sectors | An allocation to U.S. Treasuries and government debt also contributed, as did holdings in high-yield bonds, asset-backed securities, commercial mortgage-backed securities, and emerging-market corporate issues.
TOP PERFORMANCE DETRACTORS
A small number of individual securities | Although many of the fund’s positions registered positive absolute returns, certain holdings, including Occidental Petroleum Corp., finished with losses.
Saks Global Enterprises | A position in the bonds of the luxury retailer lost ground, as did holdings in specific longer-dated U.S. Treasury issues and U.S. Treasury futures.
The views expressed in this report are exclusively those of the portfolio management team at Manulife Investment Management (US) LLC, and are subject to change. They are not meant as investment advice.
Fund Performance
The following graph compares the initial and subsequent account values at the end of each of the most recently completed 10 fiscal years of the fund (or for the life of the fund, if shorter). It assumes a $1,000,000 initial investment in the fund and in an appropriate, broad-based securities market index for the same period.
GROWTH OF $1,000,000
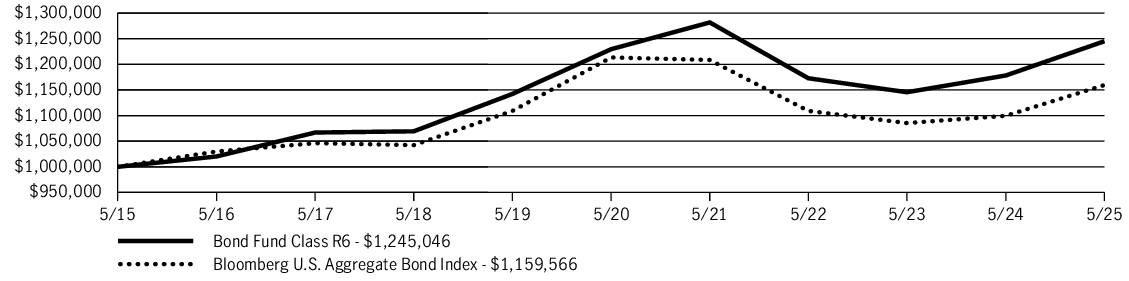
| AVERAGE ANNUAL TOTAL RETURN | 1 Year | 5 Years | 10 Years |
| Bond Fund (Class R6/JHBSX) | 5.67% | 0.25% | 2.22% |
| Bloomberg U.S. Aggregate Bond Index | 5.46% | (0.90)% | 1.49% |
Fund Statistics
| Fund net assets | $26,129,016,250 |
| Total number of portfolio holdings | 1,107 |
| Total advisory fees paid (net) | $78,343,545 |
| Portfolio turnover rate | 100% |
Graphical Representation of Holdings
The tables below show the investment makeup of the fund, representing a percentage of the total net assets of the fund.
Portfolio Composition
| U.S. Government Agency | 36.1% |
| Corporate bonds | 35.5% |
| U.S. Government | 18.8% |
| Asset-backed securities | 4.7% |
| Collateralized mortgage obligations – Commercial and residential | 2.6% |
| Collateralized mortgage obligations – U.S. Government Agency | 1.0% |
| Term loans | 0.3% |
| Preferred securities | 0.1% |
| Short-term investments and other | 0.9% |
Quality Composition
Ratings are from Moody’s Investors Service, Inc. If not available, we have used S&P Global Ratings. In the absence of ratings from these agencies, we have used Fitch Ratings, Inc. “Not rated” securities are those with no ratings available from these agencies. All ratings are as of 5-31-25 and do not reflect subsequent downgrades or upgrades, if any.
Holdings may not have been held by the fund for the entire period and are subject to change without notice. Portfolio composition is subject to review in accordance with the fund’s investment strategy and may vary in the future. Current and future portfolio holdings are subject to risk and may change at any time.
Ratings are from Moody’s Investors Service, Inc. If not available, we have used S&P Global Ratings. In the absence of ratings from these agencies, we have used Fitch Ratings, Inc. “Not rated” securities are those with no ratings available from these agencies. All ratings are as of 5-31-25 and do not reflect subsequent downgrades or upgrades, if any.