Shareholder Report
May 31, 2025
USD ($)
Holding
This report describes changes to the fund that occurred during the reporting period.
What were the fund costs during the last year ?
(Based on a hypothetical $10,000 investment)
| Fund (Class) | Costs of a $10,000 investment | Costs paid as a percentage of a $10,000 investment |
| High Yield Municipal Bond Fund (Class A/JHTFX) |
$89 | 0.88% |
Management’s Discussion of Fund Performance
SUMMARY OF RESULTS
High Yield Municipal Bond Fund (Class A/JHTFX) returned 2.94% (excluding sales charges) for the year ended May 31, 2025. The most significant factors affecting fund performance during the period included declining short- and intermediate-term municipal bond yields, rising longer-term municipal bond yields, record levels of new municipal bond supply, and three short-term interest rate cuts by the U.S. Federal Reserve. The outperformance of high-yield bonds within the municipal market was another key factor during the period.
TOP PERFORMANCE CONTRIBUTORS
Healthcare bonds | Bonds funding several smaller regional hospitals that were acquired by larger healthcare providers performed well during the period.
Special tax municipal bonds | The fund benefited from holdings of special tax bonds funding land development projects.
Education-related municipal bonds | Bonds funding charter schools and higher education contributed the most in this sector.
TOP PERFORMANCE DETRACTORS
Longer-term municipal bonds | The fund’s position in municipal bonds maturing in 10 or more years detracted from performance as this maturity sector declined.
Industrial development bonds | The fund’s holdings in this sector declined overall for the period.
The views expressed in this report are exclusively those of the portfolio management team at Manulife Investment Management (US) LLC, and are subject to change. They are not meant as investment advice.
Fund Performance
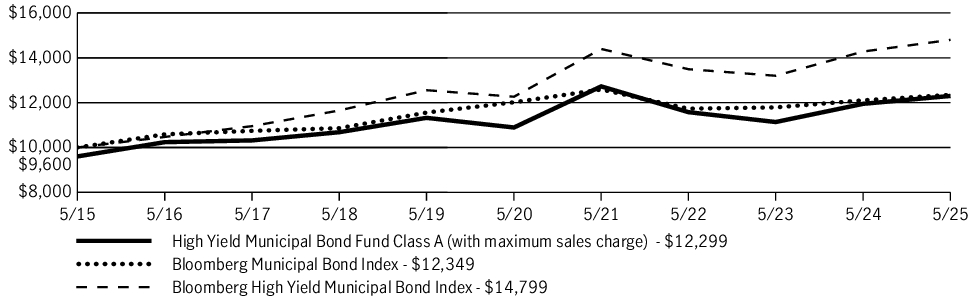
The following graph compares the initial and subsequent account values at the end of each of the most recently completed 10 fiscal years of the fund (or for the life of the fund, if shorter). It assumes a $10,000 initial investment in the fund and in an appropriate, broad-based securities market index for the same period.
GROWTH OF $10,000
| AVERAGE ANNUAL TOTAL RETURN | 1 Year | 5 Years | 10 Years |
| High Yield Municipal Bond Fund (Class A/JHTFX) | (1.12)% | 1.61% | 2.09% |
| High Yield Municipal Bond Fund (Class A/JHTFX)—excluding sales charge | 2.94% | 2.46% | 2.51% |
| Bloomberg Municipal Bond Index | 2.03% | 0.55% | 2.13% |
| Bloomberg High Yield Municipal Bond Index | 3.64% | 3.83% | 4.00% |
Fund Statistics
| Fund net assets | $336,882,048 |
| Total number of portfolio holdings | 374 |
| Total advisory fees paid (net) | $1,038,687 |
| Portfolio turnover rate | 34% |
Graphical Representation of Holdings
The tables below show the investment makeup of the fund, representing a percentage of the total investments of the fund.
Portfolio Composition
| General obligation bonds | 11.3% |
| Revenue bonds | 87.6% |
| Health care | 20.2% |
| Education | 16.6% |
| Development | 16.1% |
| Other revenue | 10.4% |
| Airport | 8.9% |
| Tobacco | 6.1% |
| Housing | 3.4% |
| Transportation | 3.0% |
| Facilities | 1.2% |
| Pollution | 1.1% |
| Water and sewer | 0.4% |
| Utilities | 0.2% |
| Corporate bonds | 0.6% |
| Short-term investments | 0.5% |
Quality Composition
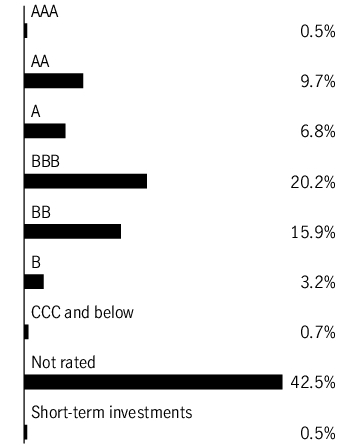
Ratings are from Moody’s Investors Service, Inc. If not available, we have used S&P Global Ratings. In the absence of ratings from these agencies, we have used Fitch Ratings, Inc. “Not rated” securities are those with no ratings available from these agencies. All ratings are as of 5-31-25 and do not reflect subsequent downgrades or upgrades, if any.
Holdings may not have been held by the fund for the entire period and are subject to change without notice. Portfolio composition is subject to review in accordance with the fund’s investment strategy and may vary in the future. Current and future portfolio holdings are subject to risk and may change at any time.
Ratings are from Moody’s Investors Service, Inc. If not available, we have used S&P Global Ratings. In the absence of ratings from these agencies, we have used Fitch Ratings, Inc. “Not rated” securities are those with no ratings available from these agencies. All ratings are as of 5-31-25 and do not reflect subsequent downgrades or upgrades, if any.
Material Fund Changes
Effective October 1, 2024, the Advisor has contractually agreed to reduce its management fee or, if necessary, make payment to the fund in an amount equal to the amount by which expenses of the fund exceed 0.45% of the fund’s average daily net assets.
This is a summary of certain changes to the fund since 6-1-24 . For more complete information, please refer to the fund’s prospectus. The currently effective prospectus is available at jhinvestments.com/documents or by calling 800-225-5291.
This report describes changes to the fund that occurred during the reporting period.
What were the fund costs during the last year ?
(Based on a hypothetical $10,000 investment)
| Fund (Class) | Costs of a $10,000 investment | Costs paid as a percentage of a $10,000 investment |
| High Yield Municipal Bond Fund (Class C/JCTFX) |
$165 | 1.63% |
Management’s Discussion of Fund Performance
SUMMARY OF RESULTS
High Yield Municipal Bond Fund (Class C/JCTFX) returned 2.17% (excluding sales charges) for the year ended May 31, 2025. The most significant factors affecting fund performance during the period included declining short- and intermediate-term municipal bond yields, rising longer-term municipal bond yields, record levels of new municipal bond supply, and three short-term interest rate cuts by the U.S. Federal Reserve. The outperformance of high-yield bonds within the municipal market was another key factor during the period.
TOP PERFORMANCE CONTRIBUTORS
Healthcare bonds | Bonds funding several smaller regional hospitals that were acquired by larger healthcare providers performed well during the period.
Special tax municipal bonds | The fund benefited from holdings of special tax bonds funding land development projects.
Education-related municipal bonds | Bonds funding charter schools and higher education contributed the most in this sector.
TOP PERFORMANCE DETRACTORS
Longer-term municipal bonds | The fund’s position in municipal bonds maturing in 10 or more years detracted from performance as this maturity sector declined.
Industrial development bonds | The fund’s holdings in this sector declined overall for the period.
The views expressed in this report are exclusively those of the portfolio management team at Manulife Investment Management (US) LLC, and are subject to change. They are not meant as investment advice.
Fund Performance
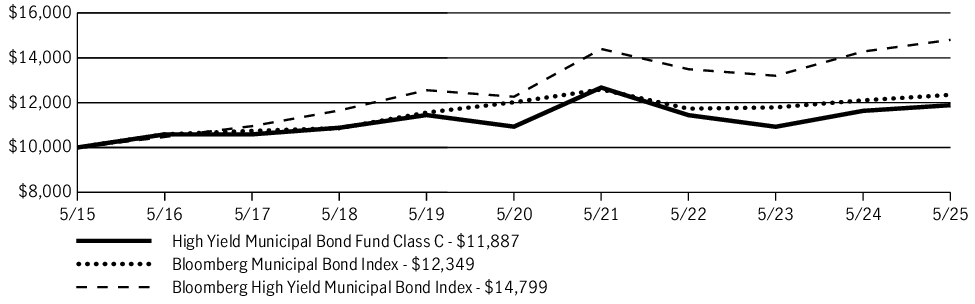
The following graph compares the initial and subsequent account values at the end of each of the most recently completed 10 fiscal years of the fund (or for the life of the fund, if shorter). It assumes a $10,000 initial investment in the fund and in an appropriate, broad-based securities market index for the same period.
GROWTH OF $10,000
| AVERAGE ANNUAL TOTAL RETURN | 1 Year | 5 Years | 10 Years |
| High Yield Municipal Bond Fund (Class C/JCTFX) | 1.19% | 1.69% | 1.74% |
| High Yield Municipal Bond Fund (Class C/JCTFX)—excluding sales charge | 2.17% | 1.69% | 1.74% |
| Bloomberg Municipal Bond Index | 2.03% | 0.55% | 2.13% |
| Bloomberg High Yield Municipal Bond Index | 3.64% | 3.83% | 4.00% |
Fund Statistics
| Fund net assets | $336,882,048 |
| Total number of portfolio holdings | 374 |
| Total advisory fees paid (net) | $1,038,687 |
| Portfolio turnover rate | 34% |
Graphical Representation of Holdings
The tables below show the investment makeup of the fund, representing a percentage of the total investments of the fund.
Portfolio Composition
| General obligation bonds | 11.3% |
| Revenue bonds | 87.6% |
| Health care | 20.2% |
| Education | 16.6% |
| Development | 16.1% |
| Other revenue | 10.4% |
| Airport | 8.9% |
| Tobacco | 6.1% |
| Housing | 3.4% |
| Transportation | 3.0% |
| Facilities | 1.2% |
| Pollution | 1.1% |
| Water and sewer | 0.4% |
| Utilities | 0.2% |
| Corporate bonds | 0.6% |
| Short-term investments | 0.5% |
Quality Composition

Ratings are from Moody’s Investors Service, Inc. If not available, we have used S&P Global Ratings. In the absence of ratings from these agencies, we have used Fitch Ratings, Inc. “Not rated” securities are those with no ratings available from these agencies. All ratings are as of 5-31-25 and do not reflect subsequent downgrades or upgrades, if any.
Holdings may not have been held by the fund for the entire period and are subject to change without notice. Portfolio composition is subject to review in accordance with the fund’s investment strategy and may vary in the future. Current and future portfolio holdings are subject to risk and may change at any time.
Ratings are from Moody’s Investors Service, Inc. If not available, we have used S&P Global Ratings. In the absence of ratings from these agencies, we have used Fitch Ratings, Inc. “Not rated” securities are those with no ratings available from these agencies. All ratings are as of 5-31-25 and do not reflect subsequent downgrades or upgrades, if any.
Material Fund Changes
Effective October 1, 2024, the Advisor has contractually agreed to reduce its management fee or, if necessary, make payment to the fund in an amount equal to the amount by which expenses of the fund exceed 0.45% of the fund’s average daily net assets.
This is a summary of certain changes to the fund since 6-1-24 . For more complete information, please refer to the fund’s prospectus. The currently effective prospectus is available at jhinvestments.com/documents or by calling 800-225-5291.
Effective October 1, 2024, the Advisor has contractually agreed to reduce its management fee or, if necessary, make payment to the fund in an amount equal to the amount by which expenses of the fund exceed 0.45% of the fund’s average daily net assets.
This is a summary of certain changes to the fund since 6-1-24 . For more complete information, please refer to the fund’s prospectus. The currently effective prospectus is available at jhinvestments.com/documents or by calling 800-225-5291.
This report describes changes to the fund that occurred during the reporting period.
What were the fund costs during the last year ?
(Based on a hypothetical $10,000 investment)
| Fund (Class) | Costs of a $10,000 investment | Costs paid as a percentage of a $10,000 investment |
| High Yield Municipal Bond Fund (Class R6/JCTRX) |
$69 | 0.68% |
Management’s Discussion of Fund Performance
SUMMARY OF RESULTS
High Yield Municipal Bond Fund (Class R6/JCTRX) returned 3.31% for the year ended May 31, 2025. The most significant factors affecting fund performance during the period included declining short- and intermediate-term municipal bond yields, rising longer-term municipal bond yields, record levels of new municipal bond supply, and three short-term interest rate cuts by the U.S. Federal Reserve. The outperformance of high-yield bonds within the municipal market was another key factor during the period.
TOP PERFORMANCE CONTRIBUTORS
Healthcare bonds | Bonds funding several smaller regional hospitals that were acquired by larger healthcare providers performed well during the period.
Special tax municipal bonds | The fund benefited from holdings of special tax bonds funding land development projects.
Education-related municipal bonds | Bonds funding charter schools and higher education contributed the most in this sector.
TOP PERFORMANCE DETRACTORS
Longer-term municipal bonds | The fund’s position in municipal bonds maturing in 10 or more years detracted from performance as this maturity sector declined.
Industrial development bonds | The fund’s holdings in this sector declined overall for the period.
The views expressed in this report are exclusively those of the portfolio management team at Manulife Investment Management (US) LLC, and are subject to change. They are not meant as investment advice.
Fund Performance
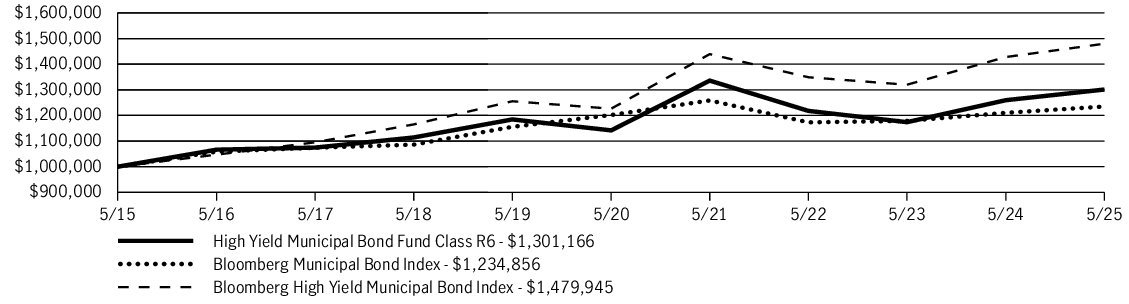
The following graph compares the initial and subsequent account values at the end of each of the most recently completed 10 fiscal years of the fund (or for the life of the fund, if shorter). It assumes a $1,000,000 initial investment in the fund and in an appropriate, broad-based securities market index for the same period.
GROWTH OF $1,000,000
| AVERAGE ANNUAL TOTAL RETURN | 1 Year | 5 Years | 10 Years |
| High Yield Municipal Bond Fund (Class R6/JCTRX) | 3.31% | 2.65% | 2.67% |
| Bloomberg Municipal Bond Index | 2.03% | 0.55% | 2.13% |
| Bloomberg High Yield Municipal Bond Index | 3.64% | 3.83% | 4.00% |
Fund Statistics
| Fund net assets | $336,882,048 |
| Total number of portfolio holdings | 374 |
| Total advisory fees paid (net) | $1,038,687 |
| Portfolio turnover rate | 34% |
Graphical Representation of Holdings
The tables below show the investment makeup of the fund, representing a percentage of the total investments of the fund.
Portfolio Composition
| General obligation bonds | 11.3% |
| Revenue bonds | 87.6% |
| Health care | 20.2% |
| Education | 16.6% |
| Development | 16.1% |
| Other revenue | 10.4% |
| Airport | 8.9% |
| Tobacco | 6.1% |
| Housing | 3.4% |
| Transportation | 3.0% |
| Facilities | 1.2% |
| Pollution | 1.1% |
| Water and sewer | 0.4% |
| Utilities | 0.2% |
| Corporate bonds | 0.6% |
| Short-term investments | 0.5% |
Quality Composition

Ratings are from Moody’s Investors Service, Inc. If not available, we have used S&P Global Ratings. In the absence of ratings from these agencies, we have used Fitch Ratings, Inc. “Not rated” securities are those with no ratings available from these agencies. All ratings are as of 5-31-25 and do not reflect subsequent downgrades or upgrades, if any.
Holdings may not have been held by the fund for the entire period and are subject to change without notice. Portfolio composition is subject to review in accordance with the fund’s investment strategy and may vary in the future. Current and future portfolio holdings are subject to risk and may change at any time.
Ratings are from Moody’s Investors Service, Inc. If not available, we have used S&P Global Ratings. In the absence of ratings from these agencies, we have used Fitch Ratings, Inc. “Not rated” securities are those with no ratings available from these agencies. All ratings are as of 5-31-25 and do not reflect subsequent downgrades or upgrades, if any.
Material Fund Changes
Effective October 1, 2024, the Advisor has contractually agreed to reduce its management fee or, if necessary, make payment to the fund in an amount equal to the amount by which expenses of the fund exceed 0.45% of the fund’s average daily net assets.
This is a summary of certain changes to the fund since 6-1-24 . For more complete information, please refer to the fund’s prospectus. The currently effective prospectus is available at jhinvestments.com/documents or by calling 800-225-5291.
Effective October 1, 2024, the Advisor has contractually agreed to reduce its management fee or, if necessary, make payment to the fund in an amount equal to the amount by which expenses of the fund exceed 0.45% of the fund’s average daily net assets.
This is a summary of certain changes to the fund since 6-1-24 . For more complete information, please refer to the fund’s prospectus. The currently effective prospectus is available at jhinvestments.com/documents or by calling 800-225-5291.
This report describes changes to the fund that occurred during the reporting period.
What were the fund costs during the last year ?
(Based on a hypothetical $10,000 investment)
| Fund (Class) | Costs of a $10,000 investment | Costs paid as a percentage of a $10,000 investment |
| High Yield Municipal Bond Fund (Class I/JHYMX) |
$75 | 0.74% |
Management’s Discussion of Fund Performance
SUMMARY OF RESULTS
High Yield Municipal Bond Fund (Class I/JHYMX) returned 3.09% for the year ended May 31, 2025. The most significant factors affecting fund performance during the period included declining short- and intermediate-term municipal bond yields, rising longer-term municipal bond yields, record levels of new municipal bond supply, and three short-term interest rate cuts by the U.S. Federal Reserve. The outperformance of high-yield bonds within the municipal market was another key factor during the period.
TOP PERFORMANCE CONTRIBUTORS
Healthcare bonds | Bonds funding several smaller regional hospitals that were acquired by larger healthcare providers performed well during the period.
Special tax municipal bonds | The fund benefited from holdings of special tax bonds funding land development projects.
Education-related municipal bonds | Bonds funding charter schools and higher education contributed the most in this sector.
TOP PERFORMANCE DETRACTORS
Longer-term municipal bonds | The fund’s position in municipal bonds maturing in 10 or more years detracted from performance as this maturity sector declined.
Industrial development bonds | The fund’s holdings in this sector declined overall for the period.
The views expressed in this report are exclusively those of the portfolio management team at Manulife Investment Management (US) LLC, and are subject to change. They are not meant as investment advice.
Fund Performance
The following graph compares the initial and subsequent account values at the end of each of the most recently completed 10 fiscal years of the fund (or for the life of the fund, if shorter). It assumes a $250,000 initial investment in the fund and in an appropriate, broad-based securities market index for the same period.
GROWTH OF $250,000
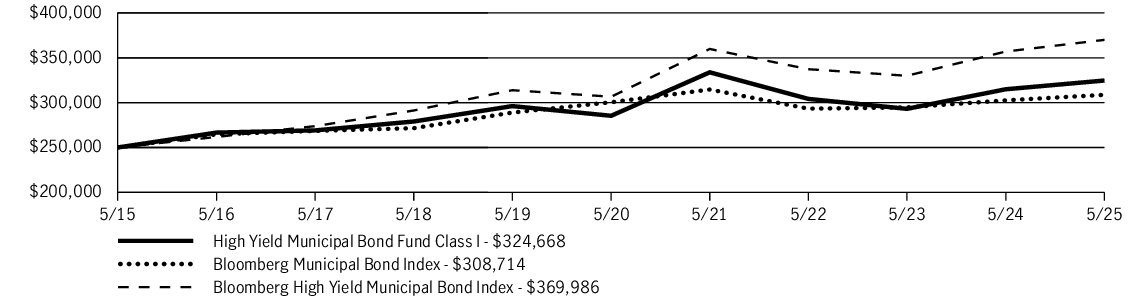
| AVERAGE ANNUAL TOTAL RETURN | 1 Year | 5 Years | 10 Years |
| High Yield Municipal Bond Fund (Class I/JHYMX) | 3.09% | 2.62% | 2.65% |
| Bloomberg Municipal Bond Index | 2.03% | 0.55% | 2.13% |
| Bloomberg High Yield Municipal Bond Index | 3.64% | 3.83% | 4.00% |
Fund Statistics
| Fund net assets | $336,882,048 |
| Total number of portfolio holdings | 374 |
| Total advisory fees paid (net) | $1,038,687 |
| Portfolio turnover rate | 34% |
Graphical Representation of Holdings
The tables below show the investment makeup of the fund, representing a percentage of the total investments of the fund.
Portfolio Composition
| General obligation bonds | 11.3% |
| Revenue bonds | 87.6% |
| Health care | 20.2% |
| Education | 16.6% |
| Development | 16.1% |
| Other revenue | 10.4% |
| Airport | 8.9% |
| Tobacco | 6.1% |
| Housing | 3.4% |
| Transportation | 3.0% |
| Facilities | 1.2% |
| Pollution | 1.1% |
| Water and sewer | 0.4% |
| Utilities | 0.2% |
| Corporate bonds | 0.6% |
| Short-term investments | 0.5% |
Quality Composition

Ratings are from Moody’s Investors Service, Inc. If not available, we have used S&P Global Ratings. In the absence of ratings from these agencies, we have used Fitch Ratings, Inc. “Not rated” securities are those with no ratings available from these agencies. All ratings are as of 5-31-25 and do not reflect subsequent downgrades or upgrades, if any.
Holdings may not have been held by the fund for the entire period and are subject to change without notice. Portfolio composition is subject to review in accordance with the fund’s investment strategy and may vary in the future. Current and future portfolio holdings are subject to risk and may change at any time.
Ratings are from Moody’s Investors Service, Inc. If not available, we have used S&P Global Ratings. In the absence of ratings from these agencies, we have used Fitch Ratings, Inc. “Not rated” securities are those with no ratings available from these agencies. All ratings are as of 5-31-25 and do not reflect subsequent downgrades or upgrades, if any.
Material Fund Changes
Effective October 1, 2024, the Advisor has contractually agreed to reduce its management fee or, if necessary, make payment to the fund in an amount equal to the amount by which expenses of the fund exceed 0.45% of the fund’s average daily net assets.
This is a summary of certain changes to the fund since 6-1-24 . For more complete information, please refer to the fund’s prospectus. The currently effective prospectus is available at jhinvestments.com/documents or by calling 800-225-5291.
Effective October 1, 2024, the Advisor has contractually agreed to reduce its management fee or, if necessary, make payment to the fund in an amount equal to the amount by which expenses of the fund exceed 0.45% of the fund’s average daily net assets.
This is a summary of certain changes to the fund since 6-1-24 . For more complete information, please refer to the fund’s prospectus. The currently effective prospectus is available at jhinvestments.com/documents or by calling 800-225-5291.
This report describes changes to the fund that occurred during the reporting period.
What were the fund costs during the last year ?
(Based on a hypothetical $10,000 investment)
| Fund (Class) | Costs of a $10,000 investment | Costs paid as a percentage of a $10,000 investment |
| Municipal Opportunities Fund (Class A/TAMBX) |
$74 | 0.73% |
Management’s Discussion of Fund Performance
SUMMARY OF RESULTS
Municipal Opportunities Fund (Class A/TAMBX) returned 2.55% (excluding sales charges) for the year ended May 31, 2025. The most significant factors affecting fund performance during the period included declining short- and intermediate-term municipal bond yields, rising longer-term municipal bond yields, record levels of new municipal bond supply, and three short-term interest rate cuts by the U.S. Federal Reserve.
TOP PERFORMANCE CONTRIBUTORS
Healthcare bonds | Bonds funding several smaller regional hospitals that were acquired by larger healthcare providers performed well during the period.
High-yield municipal bonds | The fund’s allocation in high-yield securities aided fund performance as high-yield bonds outperformed investment-grade securities.
Leasing-related municipal bonds | The fund’s holdings of bonds that finance leased equipment or facilities contributed positively to performance.
TOP PERFORMANCE DETRACTORS
Longer-term municipal bonds | A meaningful position in municipal bonds maturing in 10 to 20 years detracted from performance as this maturity sector declined.
Industrial development bonds | The fund’s holdings in this sector declined overall for the period.
The views expressed in this report are exclusively those of the portfolio management team at Manulife Investment Management (US) LLC, and are subject to change. They are not meant as investment advice.
Fund Performance
The following graph compares the initial and subsequent account values at the end of each of the most recently completed 10 fiscal years of the fund (or for the life of the fund, if shorter). It assumes a $10,000 initial investment in the fund and in an appropriate, broad-based securities market index for the same period.
GROWTH OF $10,000
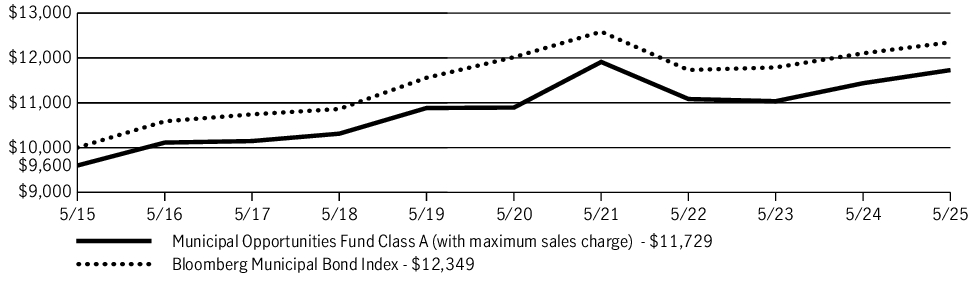
| AVERAGE ANNUAL TOTAL RETURN | 1 Year | 5 Years | 10 Years |
| Municipal Opportunities Fund (Class A/TAMBX) | (1.54)% | 0.66% | 1.61% |
| Municipal Opportunities Fund (Class A/TAMBX)—excluding sales charge | 2.55% | 1.49% | 2.02% |
| Bloomberg Municipal Bond Index | 2.03% | 0.55% | 2.13% |
Fund Statistics
| Fund net assets | $1,309,886,047 |
| Total number of portfolio holdings | 969 |
| Total advisory fees paid (net) | $5,679,876 |
| Portfolio turnover rate | 54% |
Graphical Representation of Holdings
The tables below show the investment makeup of the fund, representing a percentage of the total net assets of the fund.
Portfolio Composition
| General obligation bonds | 14.0% |
| Revenue bonds | 85.2% |
| Other revenue | 20.7% |
| Health care | 19.8% |
| Education | 10.4% |
| Airport | 10.2% |
| Development | 9.1% |
| Water and sewer | 4.0% |
| Utilities | 3.6% |
| Transportation | 3.1% |
| Housing | 2.2% |
| Pollution | 1.2% |
| Tobacco | 0.6% |
| Facilities | 0.3% |
| Corporate bonds | 0.3% |
| Closed-end funds | 0.2% |
| Short-term investments and other | 0.3% |
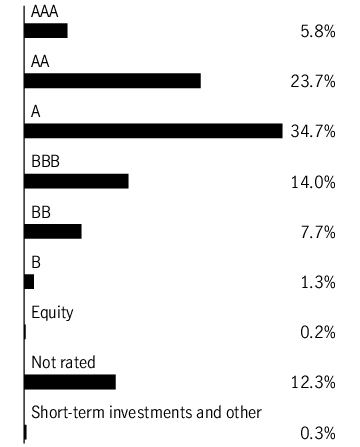
Quality Composition

Ratings are from Moody’s Investors Service, Inc. If not available, we have used S&P Global Ratings. In the absence of ratings from these agencies, we have used Fitch Ratings, Inc. “Not rated” securities are those with no ratings available from these agencies. All ratings are as of 5-31-25 and do not reflect subsequent downgrades or upgrades, if any.
Holdings may not have been held by the fund for the entire period and are subject to change without notice. Portfolio composition is subject to review in accordance with the fund’s investment strategy and may vary in the future. Current and future portfolio holdings are subject to risk and may change at any time.
Ratings are from Moody’s Investors Service, Inc. If not available, we have used S&P Global Ratings. In the absence of ratings from these agencies, we have used Fitch Ratings, Inc. “Not rated” securities are those with no ratings available from these agencies. All ratings are as of 5-31-25 and do not reflect subsequent downgrades or upgrades, if any.
Material Fund Changes
Effective October 1, 2024, the Advisor has contractually agreed to reduce its management fee or, if necessary, make payment to the fund in an amount equal to the amount by which expenses of the fund exceed 0.51% of the fund’s average daily net assets.
This is a summary of certain changes to the fund since 6-1-24 . For more complete information, please refer to the fund’s prospectus. The currently effective prospectus is available at jhinvestments.com/documents or by calling 800-225-5291.
This report describes changes to the fund that occurred during the reporting period.
What were the fund costs during the last year ?
(Based on a hypothetical $10,000 investment)
| Fund (Class) | Costs of a $10,000 investment | Costs paid as a percentage of a $10,000 investment |
| Municipal Opportunities Fund (Class R6/JTMRX) |
$53 | 0.52% |
Management’s Discussion of Fund Performance
SUMMARY OF RESULTS
Municipal Opportunities Fund (Class R6/JTMRX) returned 2.65% for the year ended May 31, 2025. The most significant factors affecting fund performance during the period included declining short- and intermediate-term municipal bond yields, rising longer-term municipal bond yields, record levels of new municipal bond supply, and three short-term interest rate cuts by the U.S. Federal Reserve.
TOP PERFORMANCE CONTRIBUTORS
Healthcare bonds | Bonds funding several smaller regional hospitals that were acquired by larger healthcare providers performed well during the period.
High-yield municipal bonds | The fund’s allocation in high-yield securities aided fund performance as high-yield bonds outperformed investment-grade securities.
Leasing-related municipal bonds | The fund’s holdings of bonds that finance leased equipment or facilities contributed positively to performance.
TOP PERFORMANCE DETRACTORS
Longer-term municipal bonds | A meaningful position in municipal bonds maturing in 10 to 20 years detracted from performance as this maturity sector declined.
Industrial development bonds | The fund’s holdings in this sector declined overall for the period.
The views expressed in this report are exclusively those of the portfolio management team at Manulife Investment Management (US) LLC, and are subject to change. They are not meant as investment advice.
Fund Performance
The following graph compares the initial and subsequent account values at the end of each of the most recently completed 10 fiscal years of the fund (or for the life of the fund, if shorter). It assumes a $1,000,000 initial investment in the fund and in an appropriate, broad-based securities market index for the same period.
GROWTH OF $1,000,000
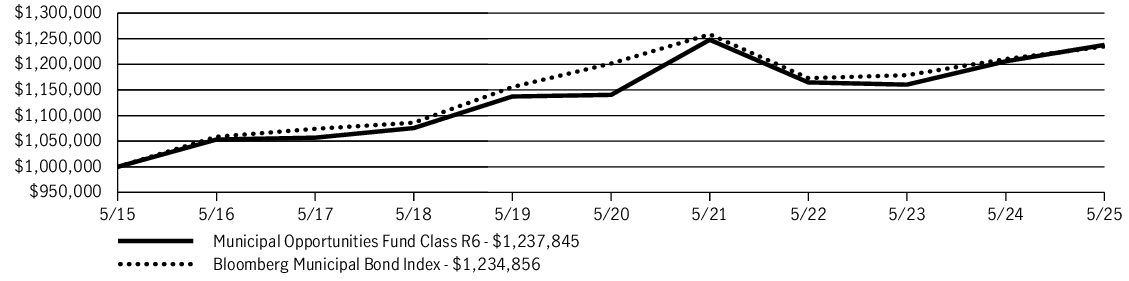
| AVERAGE ANNUAL TOTAL RETURN | 1 Year | 5 Years | 10 Years |
| Municipal Opportunities Fund (Class R6/JTMRX) | 2.65% | 1.65% | 2.16% |
| Bloomberg Municipal Bond Index | 2.03% | 0.55% | 2.13% |
Fund Statistics
| Fund net assets | $1,309,886,047 |
| Total number of portfolio holdings | 969 |
| Total advisory fees paid (net) | $5,679,876 |
| Portfolio turnover rate | 54% |
Graphical Representation of Holdings
The tables below show the investment makeup of the fund, representing a percentage of the total net assets of the fund.
Portfolio Composition
| General obligation bonds | 14.0% |
| Revenue bonds | 85.2% |
| Other revenue | 20.7% |
| Health care | 19.8% |
| Education | 10.4% |
| Airport | 10.2% |
| Development | 9.1% |
| Water and sewer | 4.0% |
| Utilities | 3.6% |
| Transportation | 3.1% |
| Housing | 2.2% |
| Pollution | 1.2% |
| Tobacco | 0.6% |
| Facilities | 0.3% |
| Corporate bonds | 0.3% |
| Closed-end funds | 0.2% |
| Short-term investments and other | 0.3% |
Quality Composition

Ratings are from Moody’s Investors Service, Inc. If not available, we have used S&P Global Ratings. In the absence of ratings from these agencies, we have used Fitch Ratings, Inc. “Not rated” securities are those with no ratings available from these agencies. All ratings are as of 5-31-25 and do not reflect subsequent downgrades or upgrades, if any.
Holdings may not have been held by the fund for the entire period and are subject to change without notice. Portfolio composition is subject to review in accordance with the fund’s investment strategy and may vary in the future. Current and future portfolio holdings are subject to risk and may change at any time.
Ratings are from Moody’s Investors Service, Inc. If not available, we have used S&P Global Ratings. In the absence of ratings from these agencies, we have used Fitch Ratings, Inc. “Not rated” securities are those with no ratings available from these agencies. All ratings are as of 5-31-25 and do not reflect subsequent downgrades or upgrades, if any.
Material Fund Changes
Effective October 1, 2024, the Advisor has contractually agreed to reduce its management fee or, if necessary, make payment to the fund in an amount equal to the amount by which expenses of the fund exceed 0.51% of the fund’s average daily net assets.
This is a summary of certain changes to the fund since 6-1-24 . For more complete information, please refer to the fund’s prospectus. The currently effective prospectus is available at jhinvestments.com/documents or by calling 800-225-5291.
Effective October 1, 2024, the Advisor has contractually agreed to reduce its management fee or, if necessary, make payment to the fund in an amount equal to the amount by which expenses of the fund exceed 0.51% of the fund’s average daily net assets.
This is a summary of certain changes to the fund since 6-1-24 . For more complete information, please refer to the fund’s prospectus. The currently effective prospectus is available at jhinvestments.com/documents or by calling 800-225-5291.
This report describes changes to the fund that occurred during the reporting period.
What were the fund costs during the last year ?
(Based on a hypothetical $10,000 investment)
| Fund (Class) | Costs of a $10,000 investment | Costs paid as a percentage of a $10,000 investment |
| Municipal Opportunities Fund (Class I/JTBDX) |
$59 | 0.58% |
Management’s Discussion of Fund Performance
SUMMARY OF RESULTS
Municipal Opportunities Fund (Class I/JTBDX) returned 2.71% for the year ended May 31, 2025. The most significant factors affecting fund performance during the period included declining short- and intermediate-term municipal bond yields, rising longer-term municipal bond yields, record levels of new municipal bond supply, and three short-term interest rate cuts by the U.S. Federal Reserve.
TOP PERFORMANCE CONTRIBUTORS
Healthcare bonds | Bonds funding several smaller regional hospitals that were acquired by larger healthcare providers performed well during the period.
High-yield municipal bonds | The fund’s allocation in high-yield securities aided fund performance as high-yield bonds outperformed investment-grade securities.
Leasing-related municipal bonds | The fund’s holdings of bonds that finance leased equipment or facilities contributed positively to performance.
TOP PERFORMANCE DETRACTORS
Longer-term municipal bonds | A meaningful position in municipal bonds maturing in 10 to 20 years detracted from performance as this maturity sector declined.
Industrial development bonds | The fund’s holdings in this sector declined overall for the period.
The views expressed in this report are exclusively those of the portfolio management team at Manulife Investment Management (US) LLC, and are subject to change. They are not meant as investment advice.
Fund Performance
The following graph compares the initial and subsequent account values at the end of each of the most recently completed 10 fiscal years of the fund (or for the life of the fund, if shorter). It assumes a $250,000 initial investment in the fund and in an appropriate, broad-based securities market index for the same period.
GROWTH OF $250,000
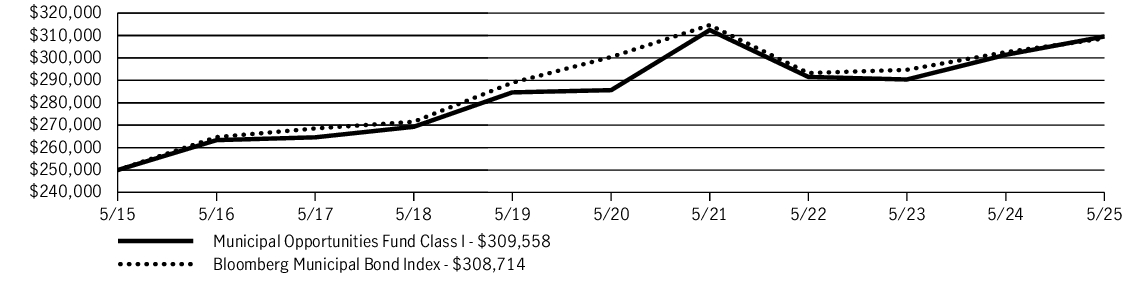
| AVERAGE ANNUAL TOTAL RETURN | 1 Year | 5 Years | 10 Years |
| Municipal Opportunities Fund (Class I/JTBDX) | 2.71% | 1.62% | 2.16% |
| Bloomberg Municipal Bond Index | 2.03% | 0.55% | 2.13% |
Fund Statistics
| Fund net assets | $1,309,886,047 |
| Total number of portfolio holdings | 969 |
| Total advisory fees paid (net) | $5,679,876 |
| Portfolio turnover rate | 54% |
Graphical Representation of Holdings
The tables below show the investment makeup of the fund, representing a percentage of the total net assets of the fund.
Portfolio Composition
| General obligation bonds | 14.0% |
| Revenue bonds | 85.2% |
| Other revenue | 20.7% |
| Health care | 19.8% |
| Education | 10.4% |
| Airport | 10.2% |
| Development | 9.1% |
| Water and sewer | 4.0% |
| Utilities | 3.6% |
| Transportation | 3.1% |
| Housing | 2.2% |
| Pollution | 1.2% |
| Tobacco | 0.6% |
| Facilities | 0.3% |
| Corporate bonds | 0.3% |
| Closed-end funds | 0.2% |
| Short-term investments and other | 0.3% |
Quality Composition
Ratings are from Moody’s Investors Service, Inc. If not available, we have used S&P Global Ratings. In the absence of ratings from these agencies, we have used Fitch Ratings, Inc. “Not rated” securities are those with no ratings available from these agencies. All ratings are as of 5-31-25 and do not reflect subsequent downgrades or upgrades, if any.
Holdings may not have been held by the fund for the entire period and are subject to change without notice. Portfolio composition is subject to review in accordance with the fund’s investment strategy and may vary in the future. Current and future portfolio holdings are subject to risk and may change at any time.
Ratings are from Moody’s Investors Service, Inc. If not available, we have used S&P Global Ratings. In the absence of ratings from these agencies, we have used Fitch Ratings, Inc. “Not rated” securities are those with no ratings available from these agencies. All ratings are as of 5-31-25 and do not reflect subsequent downgrades or upgrades, if any.
Material Fund Changes
Effective October 1, 2024, the Advisor has contractually agreed to reduce its management fee or, if necessary, make payment to the fund in an amount equal to the amount by which expenses of the fund exceed 0.51% of the fund’s average daily net assets.
This is a summary of certain changes to the fund since 6-1-24 . For more complete information, please refer to the fund’s prospectus. The currently effective prospectus is available at jhinvestments.com/documents or by calling 800-225-5291.
Effective October 1, 2024, the Advisor has contractually agreed to reduce its management fee or, if necessary, make payment to the fund in an amount equal to the amount by which expenses of the fund exceed 0.51% of the fund’s average daily net assets.
This is a summary of certain changes to the fund since 6-1-24 . For more complete information, please refer to the fund’s prospectus. The currently effective prospectus is available at jhinvestments.com/documents or by calling 800-225-5291.
This report describes changes to the fund that occurred during the reporting period.
What were the fund costs during the last year ?
(Based on a hypothetical $10,000 investment)
| Fund (Class) | Costs of a $10,000 investment | Costs paid as a percentage of a $10,000 investment |
| Municipal Opportunities Fund (Class C/TBMBX) |
$148 | 1.47% |
Management’s Discussion of Fund Performance
SUMMARY OF RESULTS
Municipal Opportunities Fund (Class C/TBMBX) returned 1.79% (excluding sales charges) for the year ended May 31, 2025. The most significant factors affecting fund performance during the period included declining short- and intermediate-term municipal bond yields, rising longer-term municipal bond yields, record levels of new municipal bond supply, and three short-term interest rate cuts by the U.S. Federal Reserve.
TOP PERFORMANCE CONTRIBUTORS
Healthcare bonds | Bonds funding several smaller regional hospitals that were acquired by larger healthcare providers performed well during the period.
High-yield municipal bonds | The fund’s allocation in high-yield securities aided fund performance as high-yield bonds outperformed investment-grade securities.
Leasing-related municipal bonds | The fund’s holdings of bonds that finance leased equipment or facilities contributed positively to performance.
TOP PERFORMANCE DETRACTORS
Longer-term municipal bonds | A meaningful position in municipal bonds maturing in 10 to 20 years detracted from performance as this maturity sector declined.
Industrial development bonds | The fund’s holdings in this sector declined overall for the period.
The views expressed in this report are exclusively those of the portfolio management team at Manulife Investment Management (US) LLC, and are subject to change. They are not meant as investment advice.
Fund Performance
The following graph compares the initial and subsequent account values at the end of each of the most recently completed 10 fiscal years of the fund (or for the life of the fund, if shorter). It assumes a $10,000 initial investment in the fund and in an appropriate, broad-based securities market index for the same period.
GROWTH OF $10,000
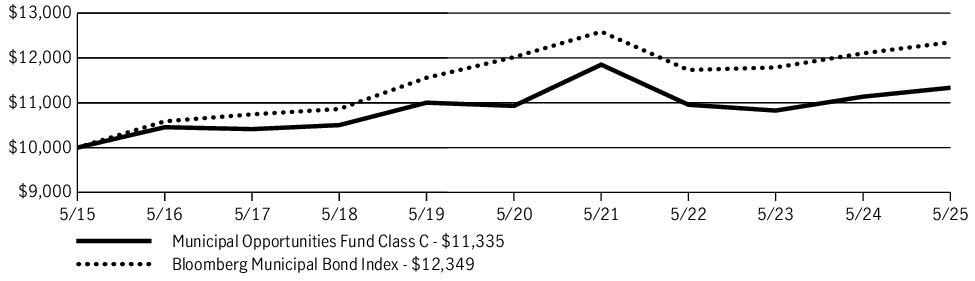
| AVERAGE ANNUAL TOTAL RETURN | 1 Year | 5 Years | 10 Years |
| Municipal Opportunities Fund (Class C/TBMBX) | 0.80% | 0.73% | 1.26% |
| Municipal Opportunities Fund (Class C/TBMBX)—excluding sales charge | 1.79% | 0.73% | 1.26% |
| Bloomberg Municipal Bond Index | 2.03% | 0.55% | 2.13% |
Fund Statistics
| Fund net assets | $1,309,886,047 |
| Total number of portfolio holdings | 969 |
| Total advisory fees paid (net) | $5,679,876 |
| Portfolio turnover rate | 54% |
Graphical Representation of Holdings
The tables below show the investment makeup of the fund, representing a percentage of the total net assets of the fund.
Portfolio Composition
| General obligation bonds | 14.0% |
| Revenue bonds | 85.2% |
| Other revenue | 20.7% |
| Health care | 19.8% |
| Education | 10.4% |
| Airport | 10.2% |
| Development | 9.1% |
| Water and sewer | 4.0% |
| Utilities | 3.6% |
| Transportation | 3.1% |
| Housing | 2.2% |
| Pollution | 1.2% |
| Tobacco | 0.6% |
| Facilities | 0.3% |
| Corporate bonds | 0.3% |
| Closed-end funds | 0.2% |
| Short-term investments and other | 0.3% |
Quality Composition

Ratings are from Moody’s Investors Service, Inc. If not available, we have used S&P Global Ratings. In the absence of ratings from these agencies, we have used Fitch Ratings, Inc. “Not rated” securities are those with no ratings available from these agencies. All ratings are as of 5-31-25 and do not reflect subsequent downgrades or upgrades, if any.
Holdings may not have been held by the fund for the entire period and are subject to change without notice. Portfolio composition is subject to review in accordance with the fund’s investment strategy and may vary in the future. Current and future portfolio holdings are subject to risk and may change at any time.
Ratings are from Moody’s Investors Service, Inc. If not available, we have used S&P Global Ratings. In the absence of ratings from these agencies, we have used Fitch Ratings, Inc. “Not rated” securities are those with no ratings available from these agencies. All ratings are as of 5-31-25 and do not reflect subsequent downgrades or upgrades, if any.
Material Fund Changes
Effective October 1, 2024, the Advisor has contractually agreed to reduce its management fee or, if necessary, make payment to the fund in an amount equal to the amount by which expenses of the fund exceed 0.51% of the fund’s average daily net assets.
This is a summary of certain changes to the fund since 6-1-24 . For more complete information, please refer to the fund’s prospectus. The currently effective prospectus is available at jhinvestments.com/documents or by calling 800-225-5291.
Effective October 1, 2024, the Advisor has contractually agreed to reduce its management fee or, if necessary, make payment to the fund in an amount equal to the amount by which expenses of the fund exceed 0.51% of the fund’s average daily net assets.
This is a summary of certain changes to the fund since 6-1-24 . For more complete information, please refer to the fund’s prospectus. The currently effective prospectus is available at jhinvestments.com/documents or by calling 800-225-5291.
This report describes changes to the fund that occurred during the reporting period.
What were the fund costs during the last year ?
(Based on a hypothetical $10,000 investment)
| Fund (Class) | Costs of a $10,000 investment | Costs paid as a percentage of a $10,000 investment |
| Short Duration Municipal Opportunities Fund (Class A/JHSFX) |
$62 | 0.61% |
Management’s Discussion of Fund Performance
SUMMARY OF RESULTS
Short Duration Municipal Opportunities Fund (Class A/JHSFX) returned 4.79% (excluding sales charges) for the year ended May 31, 2025. The most significant factors affecting fund performance during the period included declining short-term municipal bond yields, record levels of new municipal bond supply, and three short-term interest rate cuts by the U.S. Federal Reserve.
TOP PERFORMANCE CONTRIBUTORS
Duration (interest rate sensitivity) | Falling short-term municipal bond yields led to rising bond prices during the period.
Healthcare bonds | Bonds funding hospitals and continuing care retirement facilities added value.
Local general obligation (GO) bonds | The fund’s holdings among local GOs provided a boost to performance.
TOP PERFORMANCE DETRACTORS
Electric power bonds | Bonds funding municipal power utilities detracted from fund performance.
Longer-term municipal bonds | A small position in municipal bonds maturing in 5 to 10 years detracted from performance as this maturity sector declined overall during the period.
The views expressed in this report are exclusively those of the portfolio management team at Manulife Investment Management (US) LLC, and are subject to change. They are not meant as investment advice.
Fund Performance
The following graph compares the initial and subsequent account values at the end of each of the most recently completed 10 fiscal years of the fund (or for the life of the fund, if shorter). It assumes a $10,000 initial investment in the fund and in an appropriate, broad-based securities market index for the same period.
GROWTH OF $10,000
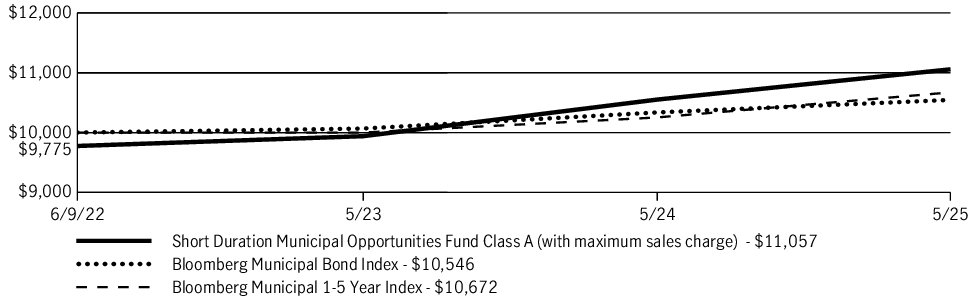
| AVERAGE ANNUAL TOTAL RETURN | 1 Year | Since inception |
| Short Duration Municipal Opportunities Fund (Class A/JHSFX) | 2.44% | 3.43% |
| Short Duration Municipal Opportunities Fund (Class A/JHSFX)—excluding sales charge | 4.79% | 4.23% |
| Bloomberg Municipal Bond Index | 2.03% | 1.80% |
| Bloomberg Municipal 1-5 Year Index | 4.09% | 2.21% |
Fund Statistics
| Fund net assets | $53,794,541 |
| Total number of portfolio holdings | 181 |
| Total advisory fees paid (net) | $0 |
| Portfolio turnover rate | 56% |
Graphical Representation of Holdings
The tables below show the investment makeup of the fund, representing a percentage of the total net assets of the fund.
Portfolio Composition
| General obligation bonds | 14.3% |
| Revenue bonds | 85.3% |
| Other revenue | 21.3% |
| Health care | 12.8% |
| Development | 12.1% |
| Airport | 11.9% |
| Education | 8.1% |
| Utilities | 6.3% |
| Housing | 3.9% |
| Water and sewer | 3.6% |
| Transportation | 2.8% |
| Pollution | 2.5% |
| Corporate bonds | 0.2% |
| Short-term investments and other | 0.2% |
Quality Composition
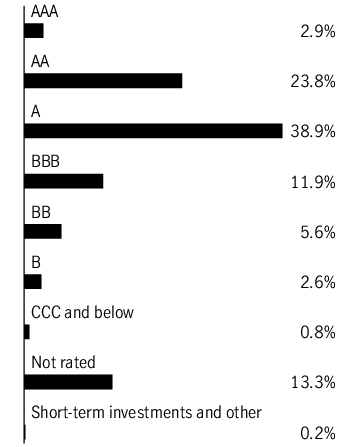
Ratings are from Moody’s Investors Service, Inc. If not available, we have used S&P Global Ratings. In the absence of ratings from these agencies, we have used Fitch Ratings, Inc. “Not rated” securities are those with no ratings available from these agencies. All ratings are as of 5-31-25 and do not reflect subsequent downgrades or upgrades, if any.
Holdings may not have been held by the fund for the entire period and are subject to change without notice. Portfolio composition is subject to review in accordance with the fund’s investment strategy and may vary in the future. Current and future portfolio holdings are subject to risk and may change at any time.
Ratings are from Moody’s Investors Service, Inc. If not available, we have used S&P Global Ratings. In the absence of ratings from these agencies, we have used Fitch Ratings, Inc. “Not rated” securities are those with no ratings available from these agencies. All ratings are as of 5-31-25 and do not reflect subsequent downgrades or upgrades, if any.
Material Fund Changes
Effective October 1, 2024, the Advisor has contractually agreed to reduce its management fee or, if necessary, make payment to the fund in an amount equal to the amount by which expenses of the fund exceed 0.39% of the fund’s average daily net assets.
This is a summary of certain changes to the fund since 6-1-24 . For more complete information, please refer to the fund’s prospectus. The currently effective prospectus is available at jhinvestments.com/documents or by calling 800-225-5291.
This report describes changes to the fund that occurred during the reporting period.
What were the fund costs during the last year ?
(Based on a hypothetical $10,000 investment)
| Fund (Class) | Costs of a $10,000 investment | Costs paid as a percentage of a $10,000 investment |
| Short Duration Municipal Opportunities Fund (Class C/JHSHX) |
$139 | 1.36% |
Management’s Discussion of Fund Performance
SUMMARY OF RESULTS
Short Duration Municipal Opportunities Fund (Class C/JHSHX) returned 4.12% (excluding sales charges) for the year ended May 31, 2025. The most significant factors affecting fund performance during the period included declining short-term municipal bond yields, record levels of new municipal bond supply, and three short-term interest rate cuts by the U.S. Federal Reserve.
TOP PERFORMANCE CONTRIBUTORS
Duration (interest rate sensitivity) | Falling short-term municipal bond yields led to rising bond prices during the period.
Healthcare bonds | Bonds funding hospitals and continuing care retirement facilities added value.
Local general obligation (GO) bonds | The fund’s holdings among local GOs provided a boost to performance.
TOP PERFORMANCE DETRACTORS
Electric power bonds | Bonds funding municipal power utilities detracted from fund performance.
Longer-term municipal bonds | A small position in municipal bonds maturing in 5 to 10 years detracted from performance as this maturity sector declined overall during the period.
The views expressed in this report are exclusively those of the portfolio management team at Manulife Investment Management (US) LLC, and are subject to change. They are not meant as investment advice.
Fund Performance
The following graph compares the initial and subsequent account values at the end of each of the most recently completed 10 fiscal years of the fund (or for the life of the fund, if shorter). It assumes a $10,000 initial investment in the fund and in an appropriate, broad-based securities market index for the same period.
GROWTH OF $10,000
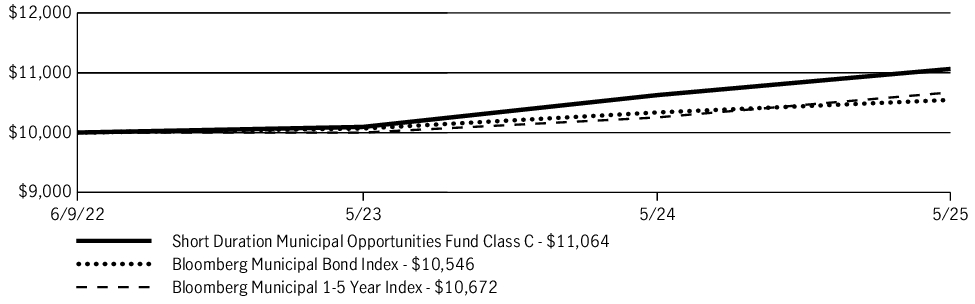
| AVERAGE ANNUAL TOTAL RETURN | 1 Year | Since inception |
| Short Duration Municipal Opportunities Fund (Class C/JHSHX) | 3.12% | 3.45% |
| Short Duration Municipal Opportunities Fund (Class C/JHSHX)—excluding sales charge | 4.12% | 3.45% |
| Bloomberg Municipal Bond Index | 2.03% | 1.80% |
| Bloomberg Municipal 1-5 Year Index | 4.09% | 2.21% |
Fund Statistics
| Fund net assets | $53,794,541 |
| Total number of portfolio holdings | 181 |
| Total advisory fees paid (net) | $0 |
| Portfolio turnover rate | 56% |
Graphical Representation of Holdings
The tables below show the investment makeup of the fund, representing a percentage of the total net assets of the fund.
Portfolio Composition
| General obligation bonds | 14.3% |
| Revenue bonds | 85.3% |
| Other revenue | 21.3% |
| Health care | 12.8% |
| Development | 12.1% |
| Airport | 11.9% |
| Education | 8.1% |
| Utilities | 6.3% |
| Housing | 3.9% |
| Water and sewer | 3.6% |
| Transportation | 2.8% |
| Pollution | 2.5% |
| Corporate bonds | 0.2% |
| Short-term investments and other | 0.2% |
Quality Composition

Ratings are from Moody’s Investors Service, Inc. If not available, we have used S&P Global Ratings. In the absence of ratings from these agencies, we have used Fitch Ratings, Inc. “Not rated” securities are those with no ratings available from these agencies. All ratings are as of 5-31-25 and do not reflect subsequent downgrades or upgrades, if any.
Holdings may not have been held by the fund for the entire period and are subject to change without notice. Portfolio composition is subject to review in accordance with the fund’s investment strategy and may vary in the future. Current and future portfolio holdings are subject to risk and may change at any time.
Ratings are from Moody’s Investors Service, Inc. If not available, we have used S&P Global Ratings. In the absence of ratings from these agencies, we have used Fitch Ratings, Inc. “Not rated” securities are those with no ratings available from these agencies. All ratings are as of 5-31-25 and do not reflect subsequent downgrades or upgrades, if any.
Material Fund Changes
Effective October 1, 2024, the Advisor has contractually agreed to reduce its management fee or, if necessary, make payment to the fund in an amount equal to the amount by which expenses of the fund exceed 0.39% of the fund’s average daily net assets.
This is a summary of certain changes to the fund since 6-1-24 . For more complete information, please refer to the fund’s prospectus. The currently effective prospectus is available at jhinvestments.com/documents or by calling 800-225-5291.
Effective October 1, 2024, the Advisor has contractually agreed to reduce its management fee or, if necessary, make payment to the fund in an amount equal to the amount by which expenses of the fund exceed 0.39% of the fund’s average daily net assets.
This is a summary of certain changes to the fund since 6-1-24 . For more complete information, please refer to the fund’s prospectus. The currently effective prospectus is available at jhinvestments.com/documents or by calling 800-225-5291.
This report describes changes to the fund that occurred during the reporting period.
What were the fund costs during the last year ?
(Based on a hypothetical $10,000 investment)
| Fund (Class) | Costs of a $10,000 investment | Costs paid as a percentage of a $10,000 investment |
| Short Duration Municipal Opportunities Fund (Class I/JHSJX) |
$48 | 0.47% |
Management’s Discussion of Fund Performance
SUMMARY OF RESULTS
Short Duration Municipal Opportunities Fund (Class I/JHSJX) returned 5.05% for the year ended May 31, 2025. The most significant factors affecting fund performance during the period included declining short-term municipal bond yields, record levels of new municipal bond supply, and three short-term interest rate cuts by the U.S. Federal Reserve.
TOP PERFORMANCE CONTRIBUTORS
Duration (interest rate sensitivity) | Falling short-term municipal bond yields led to rising bond prices during the period.
Healthcare bonds | Bonds funding hospitals and continuing care retirement facilities added value.
Local general obligation (GO) bonds | The fund’s holdings among local GOs provided a boost to performance.
TOP PERFORMANCE DETRACTORS
Electric power bonds | Bonds funding municipal power utilities detracted from fund performance.
Longer-term municipal bonds | A small position in municipal bonds maturing in 5 to 10 years detracted from performance as this maturity sector declined overall during the period.
The views expressed in this report are exclusively those of the portfolio management team at Manulife Investment Management (US) LLC, and are subject to change. They are not meant as investment advice.
Fund Performance
The following graph compares the initial and subsequent account values at the end of each of the most recently completed 10 fiscal years of the fund (or for the life of the fund, if shorter). It assumes a $250,000 initial investment in the fund and in an appropriate, broad-based securities market index for the same period.
GROWTH OF $250,000
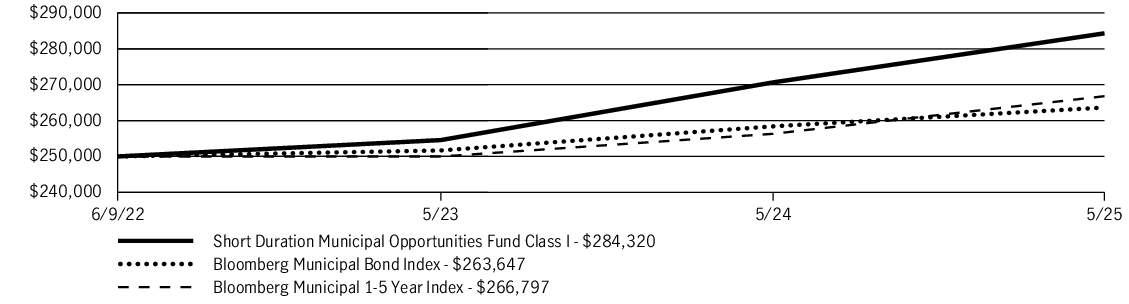
| AVERAGE ANNUAL TOTAL RETURN | 1 Year | Since inception |
| Short Duration Municipal Opportunities Fund (Class I/JHSJX) | 5.05% | 4.41% |
| Bloomberg Municipal Bond Index | 2.03% | 1.80% |
| Bloomberg Municipal 1-5 Year Index | 4.09% | 2.21% |
Fund Statistics
| Fund net assets | $53,794,541 |
| Total number of portfolio holdings | 181 |
| Total advisory fees paid (net) | $0 |
| Portfolio turnover rate | 56% |
Graphical Representation of Holdings
The tables below show the investment makeup of the fund, representing a percentage of the total net assets of the fund.
Portfolio Composition
| General obligation bonds | 14.3% |
| Revenue bonds | 85.3% |
| Other revenue | 21.3% |
| Health care | 12.8% |
| Development | 12.1% |
| Airport | 11.9% |
| Education | 8.1% |
| Utilities | 6.3% |
| Housing | 3.9% |
| Water and sewer | 3.6% |
| Transportation | 2.8% |
| Pollution | 2.5% |
| Corporate bonds | 0.2% |
| Short-term investments and other | 0.2% |
Quality Composition

Ratings are from Moody’s Investors Service, Inc. If not available, we have used S&P Global Ratings. In the absence of ratings from these agencies, we have used Fitch Ratings, Inc. “Not rated” securities are those with no ratings available from these agencies. All ratings are as of 5-31-25 and do not reflect subsequent downgrades or upgrades, if any.
Holdings may not have been held by the fund for the entire period and are subject to change without notice. Portfolio composition is subject to review in accordance with the fund’s investment strategy and may vary in the future. Current and future portfolio holdings are subject to risk and may change at any time.
Ratings are from Moody’s Investors Service, Inc. If not available, we have used S&P Global Ratings. In the absence of ratings from these agencies, we have used Fitch Ratings, Inc. “Not rated” securities are those with no ratings available from these agencies. All ratings are as of 5-31-25 and do not reflect subsequent downgrades or upgrades, if any.
Material Fund Changes
Effective October 1, 2024, the Advisor has contractually agreed to reduce its management fee or, if necessary, make payment to the fund in an amount equal to the amount by which expenses of the fund exceed 0.39% of the fund’s average daily net assets.
This is a summary of certain changes to the fund since 6-1-24 . For more complete information, please refer to the fund’s prospectus. The currently effective prospectus is available at jhinvestments.com/documents or by calling 800-225-5291.
Effective October 1, 2024, the Advisor has contractually agreed to reduce its management fee or, if necessary, make payment to the fund in an amount equal to the amount by which expenses of the fund exceed 0.39% of the fund’s average daily net assets.
This is a summary of certain changes to the fund since 6-1-24 . For more complete information, please refer to the fund’s prospectus. The currently effective prospectus is available at jhinvestments.com/documents or by calling 800-225-5291.
This report describes changes to the fund that occurred during the reporting period.
What were the fund costs during the last year ?
(Based on a hypothetical $10,000 investment)
| Fund (Class) | Costs of a $10,000 investment | Costs paid as a percentage of a $10,000 investment |
| Short Duration Municipal Opportunities Fund (Class R6/JHSKX) |
$42 | 0.41% |
Management’s Discussion of Fund Performance
SUMMARY OF RESULTS
Short Duration Municipal Opportunities Fund (Class R6/JHSKX) returned 5.11% for the year ended May 31, 2025. The most significant factors affecting fund performance during the period included declining short-term municipal bond yields, record levels of new municipal bond supply, and three short-term interest rate cuts by the U.S. Federal Reserve.
TOP PERFORMANCE CONTRIBUTORS
Duration (interest rate sensitivity) | Falling short-term municipal bond yields led to rising bond prices during the period.
Healthcare bonds | Bonds funding hospitals and continuing care retirement facilities added value.
Local general obligation (GO) bonds | The fund’s holdings among local GOs provided a boost to performance.
TOP PERFORMANCE DETRACTORS
Electric power bonds | Bonds funding municipal power utilities detracted from fund performance.
Longer-term municipal bonds | A small position in municipal bonds maturing in 5 to 10 years detracted from performance as this maturity sector declined overall during the period.
The views expressed in this report are exclusively those of the portfolio management team at Manulife Investment Management (US) LLC, and are subject to change. They are not meant as investment advice.
Fund Performance
The following graph compares the initial and subsequent account values at the end of each of the most recently completed 10 fiscal years of the fund (or for the life of the fund, if shorter). It assumes a $1,000,000 initial investment in the fund and in an appropriate, broad-based securities market index for the same period.
GROWTH OF $1,000,000
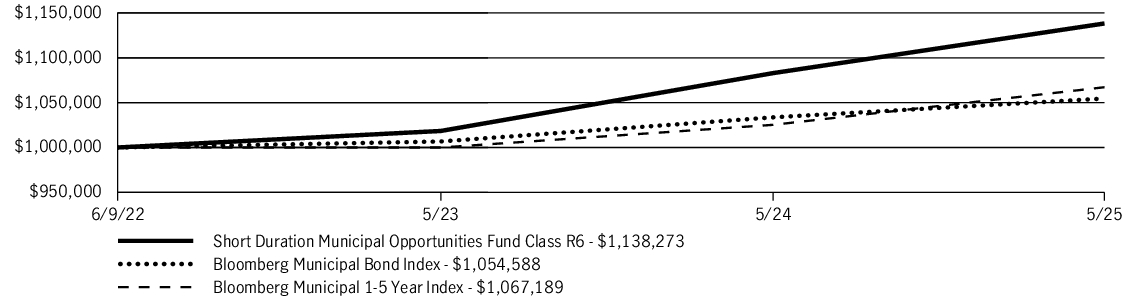
| AVERAGE ANNUAL TOTAL RETURN | 1 Year | Since inception |
| Short Duration Municipal Opportunities Fund (Class R6/JHSKX) | 5.11% | 4.44% |
| Bloomberg Municipal Bond Index | 2.03% | 1.80% |
| Bloomberg Municipal 1-5 Year Index | 4.09% | 2.21% |
Fund Statistics
| Fund net assets | $53,794,541 |
| Total number of portfolio holdings | 181 |
| Total advisory fees paid (net) | $0 |
| Portfolio turnover rate | 56% |
Graphical Representation of Holdings
The tables below show the investment makeup of the fund, representing a percentage of the total net assets of the fund.
Portfolio Composition
| General obligation bonds | 14.3% |
| Revenue bonds | 85.3% |
| Other revenue | 21.3% |
| Health care | 12.8% |
| Development | 12.1% |
| Airport | 11.9% |
| Education | 8.1% |
| Utilities | 6.3% |
| Housing | 3.9% |
| Water and sewer | 3.6% |
| Transportation | 2.8% |
| Pollution | 2.5% |
| Corporate bonds | 0.2% |
| Short-term investments and other | 0.2% |
Quality Composition

Ratings are from Moody’s Investors Service, Inc. If not available, we have used S&P Global Ratings. In the absence of ratings from these agencies, we have used Fitch Ratings, Inc. “Not rated” securities are those with no ratings available from these agencies. All ratings are as of 5-31-25 and do not reflect subsequent downgrades or upgrades, if any.
Holdings may not have been held by the fund for the entire period and are subject to change without notice. Portfolio composition is subject to review in accordance with the fund’s investment strategy and may vary in the future. Current and future portfolio holdings are subject to risk and may change at any time.
Ratings are from Moody’s Investors Service, Inc. If not available, we have used S&P Global Ratings. In the absence of ratings from these agencies, we have used Fitch Ratings, Inc. “Not rated” securities are those with no ratings available from these agencies. All ratings are as of 5-31-25 and do not reflect subsequent downgrades or upgrades, if any.
Material Fund Changes
Effective October 1, 2024, the Advisor has contractually agreed to reduce its management fee or, if necessary, make payment to the fund in an amount equal to the amount by which expenses of the fund exceed 0.39% of the fund’s average daily net assets.
This is a summary of certain changes to the fund since 6-1-24 . For more complete information, please refer to the fund’s prospectus. The currently effective prospectus is available at jhinvestments.com/documents or by calling 800-225-5291.
Effective October 1, 2024, the Advisor has contractually agreed to reduce its management fee or, if necessary, make payment to the fund in an amount equal to the amount by which expenses of the fund exceed 0.39% of the fund’s average daily net assets.
This is a summary of certain changes to the fund since 6-1-24 . For more complete information, please refer to the fund’s prospectus. The currently effective prospectus is available at jhinvestments.com/documents or by calling 800-225-5291.