Shareholder Report
|
12 Months Ended |
|
May 31, 2025
USD ($)
Holding
|
|---|
| Shareholder Report [Line Items] |
|
| Document Type |
N-CSR
|
| Amendment Flag |
false
|
| Registrant Name |
T. ROWE PRICE GLOBAL MULTI-SECTOR BOND FUND, INC.
|
| Entity Central Index Key |
0001447346
|
| Entity Investment Company Type |
N-1A
|
| Document Period End Date |
May 31, 2025
|
| C000072749 |
|
| Shareholder Report [Line Items] |
|
| Fund Name |
Global Multi-Sector Bond Fund
|
| Class Name |
Investor Class
|
| Trading Symbol |
PRSNX
|
| Annual or Semi-Annual Statement [Text Block] |
This annual shareholder report contains important information about Global Multi-Sector Bond Fund (the "fund") for the period of June 1, 2024 to May 31, 2025. You can find the fund’s prospectus, financial information on Form N‑CSR (which includes required tax information for dividends), holdings, proxy voting information, and other information atwww.troweprice.com/prospectus. You can also request this information without charge by contacting T. Rowe Price at 1‑800‑638‑5660 or info@troweprice.com or contacting your intermediary.
|
| Shareholder Report Annual or Semi-Annual |
Annual Shareholder Report
|
| Additional Information [Text Block] |
You can find the fund’s prospectus, financial information on Form N‑CSR (which includes required tax information for dividends), holdings, proxy voting information, and other information atwww.troweprice.com/prospectus. You can also request this information without charge by contacting T. Rowe Price at 1‑800‑638‑5660 or info@troweprice.com or contacting your intermediary.
|
| Material Fund Change Notice [Text Block] |
|
| Additional Information Phone Number |
1‑800‑638‑5660
|
| Additional Information Email |
<span style="box-sizing: border-box; color: rgb(0, 0, 0); display: inline; flex-wrap: nowrap; font-size: 13.3333px; font-weight: 400; grid-area: auto; line-height: 17.3333px; margin: 0px; overflow: visible; text-align: justify; text-align-last: left; white-space-collapse: preserve-breaks;">info@troweprice.com</span>
|
| Additional Information Website |
www.troweprice.com/prospectus
|
| Expenses [Text Block] |
What were the fund costs for the last year? (based on a hypothetical $10,000 investment)
|
Costs of a $10,000 investment |
Costs paid as a percentage of a $10,000 investment |
Global Multi-Sector Bond Fund - Investor Class |
$66 |
0.64% | |
| Expenses Paid, Amount |
$ 66
|
| Expense Ratio, Percent |
0.64%
|
| Factors Affecting Performance [Text Block] |
What drove fund performance during the past 12 months?Global fixed income markets generated positive total returns over the past 12 months as the Federal Reserve and other central banks began cutting interest rates, which broadly supported bond prices. Duration and yield curve positioning benefited the fund relative to the Bloomberg Global Aggregate Bond USD Hedged Index. Tactically, adjusting the fund’s U.S. duration posture and positioning the fund to benefit from a steepening U.S. Treasury yield curve at times contributed over the period. Active currency management, specifically in the euro, Egyptian pound, and Japanese yen, also added value as the U.S. dollar came under pressure in 2025. The fund’s allocations in corporate credit weighed on performance versus the benchmark. While investment-grade and high yield corporate bonds were generally supportive in the first half of the period, increased market volatility and economic uncertainty pressured credit sectors more recently. The fund seeks to provide high income and some capital appreciation through a broadly diversified portfolio of domestic and foreign debt instruments, including exposure to various bond sectors, countries, and currencies. By the end of the period, we had a more cautious and defensive positioning within corporate credit. The fund held derivatives during the period, including currency, interest rate, and credit derivatives. The fund’s derivatives exposure, including credit and currency derivatives, weighed on absolute performance. However, interest rate derivatives aided absolute returns.
|
| Performance Past Does Not Indicate Future [Text] |
The fund’s past performance is not a good predictor of the fund’s future performance.
|
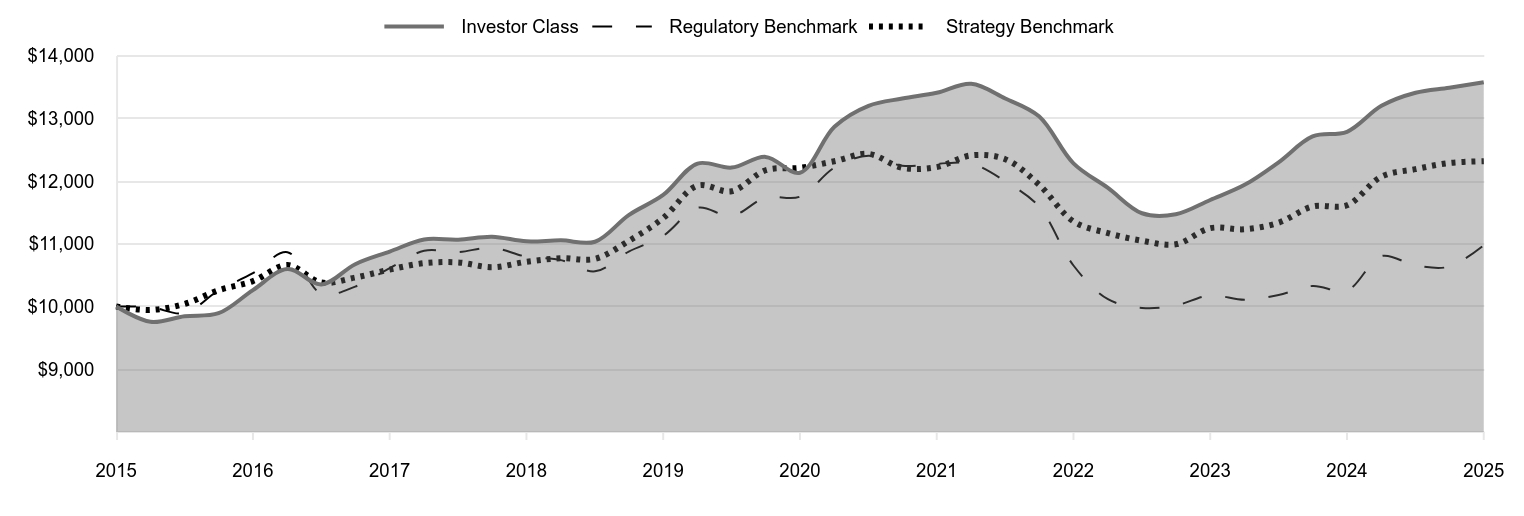
| Line Graph [Table Text Block] |
|
Investor Class |
Regulatory Benchmark |
Strategy Benchmark |
2015 |
10,000 |
10,000 |
10,000 |
2015 |
9,757 |
9,990 |
9,947 |
2015 |
9,847 |
9,896 |
10,043 |
2016 |
9,894 |
10,258 |
10,260 |
2016 |
10,263 |
10,532 |
10,406 |
2016 |
10,599 |
10,868 |
10,662 |
2016 |
10,353 |
10,203 |
10,383 |
2017 |
10,676 |
10,319 |
10,463 |
2017 |
10,877 |
10,613 |
10,590 |
2017 |
11,070 |
10,889 |
10,692 |
2017 |
11,066 |
10,869 |
10,704 |
2018 |
11,114 |
10,939 |
10,627 |
2018 |
11,040 |
10,796 |
10,715 |
2018 |
11,056 |
10,741 |
10,771 |
2018 |
11,034 |
10,562 |
10,761 |
2019 |
11,459 |
10,877 |
11,046 |
2019 |
11,780 |
11,129 |
11,412 |
2019 |
12,281 |
11,575 |
11,928 |
2019 |
12,216 |
11,446 |
11,838 |
2020 |
12,387 |
11,738 |
12,174 |
2020 |
12,135 |
11,752 |
12,213 |
2020 |
12,867 |
12,216 |
12,318 |
2020 |
13,201 |
12,405 |
12,435 |
2021 |
13,318 |
12,246 |
12,213 |
2021 |
13,410 |
12,277 |
12,224 |
2021 |
13,554 |
12,279 |
12,411 |
2021 |
13,319 |
11,997 |
12,350 |
2022 |
13,034 |
11,595 |
11,945 |
2022 |
12,283 |
10,655 |
11,358 |
2022 |
11,892 |
10,117 |
11,171 |
2022 |
11,488 |
9,979 |
11,050 |
2023 |
11,472 |
10,018 |
10,993 |
2023 |
11,700 |
10,178 |
11,250 |
2023 |
11,941 |
10,107 |
11,233 |
2023 |
12,301 |
10,184 |
11,338 |
2024 |
12,713 |
10,329 |
11,597 |
2024 |
12,787 |
10,256 |
11,615 |
2024 |
13,201 |
10,805 |
12,073 |
2024 |
13,410 |
10,656 |
12,191 |
2025 |
13,490 |
10,637 |
12,290 |
2025 |
13,578 |
10,978 |
12,319 |
|
| Average Annual Return [Table Text Block] |
|
1 Year |
5 Years |
10 Years |
Global Multi-Sector Bond Fund (Investor Class) |
6.18% |
2.27% |
3.11% |
Bloomberg Global Aggregate Bond Index (Regulatory Benchmark) |
7.03 |
-1.35 |
0.94 |
Bloomberg Global Aggregate Bond USD Hedged Index (Strategy Benchmark) |
6.06 |
0.17 |
2.11 | |
| No Deduction of Taxes [Text Block] |
Neither the fund’s returns nor the index returns reflect the deduction of taxes that a shareholder would pay on fund distributions or redemptions of fund shares.
|
| Updated Performance Information Location [Text Block] |
Updated performance information can be found at www.troweprice.com.
|
| Distribution of Capital [Text Block] |
The fund's total return figures reflect the reinvestment of dividends and capital gains, if any.
|
| AssetsNet |
$ 1,910,686,000
|
| Holdings Count | Holding |
442
|
| Advisory Fees Paid, Amount |
$ 7,232,000
|
| InvestmentCompanyPortfolioTurnover |
134.10%
|
| Additional Fund Statistics Significance or Limits [Text Block] |
What are some fund statistics? - Total Net Assets (000s)$1,910,686
- Number of Portfolio Holdings442
|
| Holdings [Text Block] |
Foreign Government Obligations & Municipalities |
42.5% |
Corporate Bonds |
25.2 |
Asset-Backed Securities |
12.0 |
U.S. Government Agency Obligations (Excluding Mortgage-Backed) |
8.3 |
Non-U.S. Government Mortgage-Backed Securities |
2.2 |
Securities Lending Collateral |
1.4 |
Municipal Securities |
1.3 |
Bank Loans |
1.0 |
Short-Term and Other |
6.1 | |
| Largest Holdings [Text Block] |
United Kingdom Gilt |
6.0% |
Government of Malaysia |
5.2 |
Republic of Korea |
4.5 |
U.S. Treasury Inflation-Indexed Notes |
4.3 |
Government of Japan, Inflation-Indexed |
4.3 |
U.S. Treasury Notes |
3.2 |
Bundesrepublik Deutschland Bundesanleihe |
2.3 |
Republic of Indonesia |
2.3 |
Government of Singapore |
2.0 |
Government of Japan |
1.7 | |
| Material Fund Change [Text Block] |
|
| Updated Prospectus Web Address |
www.troweprice.com/paperless
|
| C000072750 |
|
| Shareholder Report [Line Items] |
|
| Fund Name |
Global Multi-Sector Bond Fund
|
| Class Name |
Advisor Class
|
| Trading Symbol |
PRSAX
|
| Annual or Semi-Annual Statement [Text Block] |
This annual shareholder report contains important information about Global Multi-Sector Bond Fund (the "fund") for the period of June 1, 2024 to May 31, 2025. You can find the fund’s prospectus, financial information on Form N‑CSR (which includes required tax information for dividends), holdings, proxy voting information, and other information atwww.troweprice.com/prospectus. You can also request this information without charge by contacting T. Rowe Price at 1‑800‑638‑5660 or info@troweprice.com or contacting your intermediary.
|
| Shareholder Report Annual or Semi-Annual |
Annual Shareholder Report
|
| Additional Information [Text Block] |
You can find the fund’s prospectus, financial information on Form N‑CSR (which includes required tax information for dividends), holdings, proxy voting information, and other information atwww.troweprice.com/prospectus. You can also request this information without charge by contacting T. Rowe Price at 1‑800‑638‑5660 or info@troweprice.com or contacting your intermediary.
|
| Material Fund Change Notice [Text Block] |
|
| Additional Information Phone Number |
1‑800‑638‑5660
|
| Additional Information Email |
<span style="box-sizing: border-box; color: rgb(0, 0, 0); display: inline; flex-wrap: nowrap; font-size: 13.3333px; font-weight: 400; grid-area: auto; line-height: 17.3333px; margin: 0px; overflow: visible; text-align: justify; text-align-last: left; white-space-collapse: preserve-breaks;">info@troweprice.com</span>
|
| Additional Information Website |
www.troweprice.com/prospectus
|
| Expenses [Text Block] |
What were the fund costs for the last year? (based on a hypothetical $10,000 investment)
|
Costs of a $10,000 investment |
Costs paid as a percentage of a $10,000 investment |
Global Multi-Sector Bond Fund - Advisor Class |
$95 |
0.92% | |
| Expenses Paid, Amount |
$ 95
|
| Expense Ratio, Percent |
0.92%
|
| Factors Affecting Performance [Text Block] |
What drove fund performance during the past 12 months?Global fixed income markets generated positive total returns over the past 12 months as the Federal Reserve and other central banks began cutting interest rates, which broadly supported bond prices. Duration and yield curve positioning benefited the fund relative to the Bloomberg Global Aggregate Bond USD Hedged Index. Tactically, adjusting the fund’s U.S. duration posture and positioning the fund to benefit from a steepening U.S. Treasury yield curve at times contributed over the period. Active currency management, specifically in the euro, Egyptian pound, and Japanese yen, also added value as the U.S. dollar came under pressure in 2025. The fund’s allocations in corporate credit weighed on performance versus the benchmark. While investment-grade and high yield corporate bonds were generally supportive in the first half of the period, increased market volatility and economic uncertainty pressured credit sectors more recently. The fund seeks to provide high income and some capital appreciation through a broadly diversified portfolio of domestic and foreign debt instruments, including exposure to various bond sectors, countries, and currencies. By the end of the period, we had a more cautious and defensive positioning within corporate credit. The fund held derivatives during the period, including currency, interest rate, and credit derivatives. The fund’s derivatives exposure, including credit and currency derivatives, weighed on absolute performance. However, interest rate derivatives aided absolute returns.
|
| Performance Past Does Not Indicate Future [Text] |
The fund’s past performance is not a good predictor of the fund’s future performance.
|
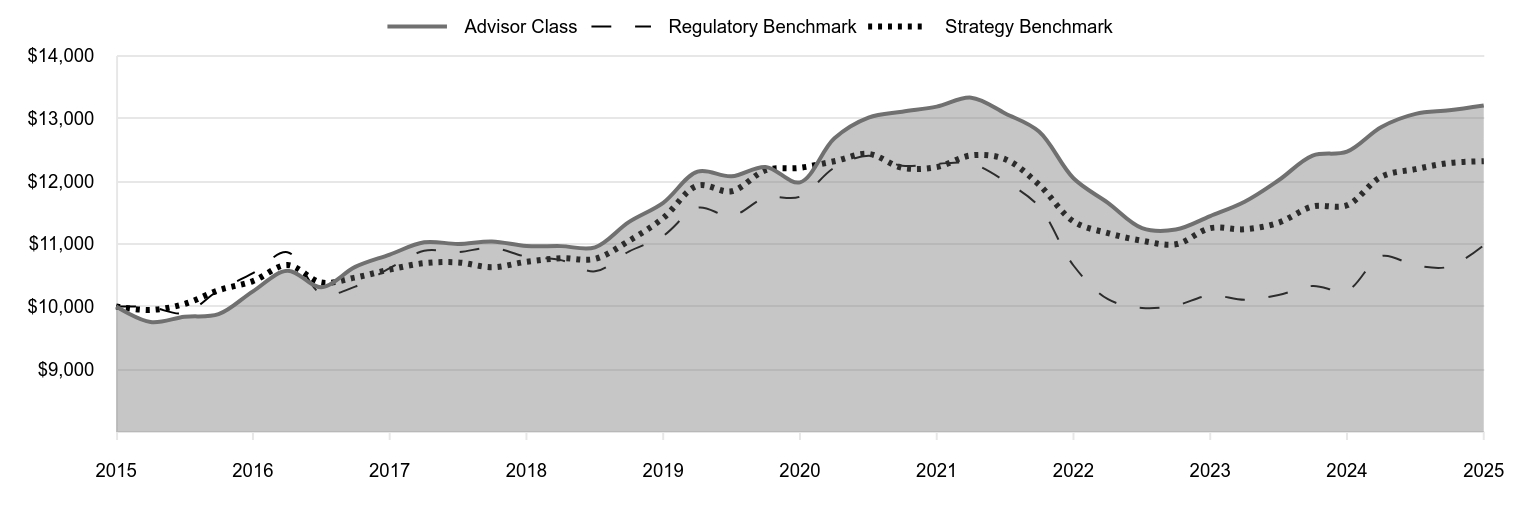
| Line Graph [Table Text Block] |
|
Advisor Class |
Regulatory Benchmark |
Strategy Benchmark |
2015 |
10,000 |
10,000 |
10,000 |
2015 |
9,753 |
9,990 |
9,947 |
2015 |
9,837 |
9,896 |
10,043 |
2016 |
9,879 |
10,258 |
10,260 |
2016 |
10,243 |
10,532 |
10,406 |
2016 |
10,571 |
10,868 |
10,662 |
2016 |
10,309 |
10,203 |
10,383 |
2017 |
10,633 |
10,319 |
10,463 |
2017 |
10,829 |
10,613 |
10,590 |
2017 |
11,025 |
10,889 |
10,692 |
2017 |
10,999 |
10,869 |
10,704 |
2018 |
11,038 |
10,939 |
10,627 |
2018 |
10,966 |
10,796 |
10,715 |
2018 |
10,964 |
10,741 |
10,771 |
2018 |
10,944 |
10,562 |
10,761 |
2019 |
11,347 |
10,877 |
11,046 |
2019 |
11,655 |
11,129 |
11,412 |
2019 |
12,151 |
11,575 |
11,928 |
2019 |
12,078 |
11,446 |
11,838 |
2020 |
12,227 |
11,738 |
12,174 |
2020 |
11,981 |
11,752 |
12,213 |
2020 |
12,683 |
12,216 |
12,318 |
2020 |
13,013 |
12,405 |
12,435 |
2021 |
13,108 |
12,246 |
12,213 |
2021 |
13,188 |
12,277 |
12,224 |
2021 |
13,331 |
12,279 |
12,411 |
2021 |
13,079 |
11,997 |
12,350 |
2022 |
12,791 |
11,595 |
11,945 |
2022 |
12,046 |
10,655 |
11,358 |
2022 |
11,655 |
10,117 |
11,171 |
2022 |
11,252 |
9,979 |
11,050 |
2023 |
11,228 |
10,018 |
10,993 |
2023 |
11,443 |
10,178 |
11,250 |
2023 |
11,671 |
10,107 |
11,233 |
2023 |
12,014 |
10,184 |
11,338 |
2024 |
12,407 |
10,329 |
11,597 |
2024 |
12,471 |
10,256 |
11,615 |
2024 |
12,865 |
10,805 |
12,073 |
2024 |
13,073 |
10,656 |
12,191 |
2025 |
13,129 |
10,637 |
12,290 |
2025 |
13,206 |
10,978 |
12,319 |
|
| Average Annual Return [Table Text Block] |
|
1 Year |
5 Years |
10 Years |
Global Multi-Sector Bond Fund (Advisor Class) |
5.89% |
1.96% |
2.82% |
Bloomberg Global Aggregate Bond Index (Regulatory Benchmark) |
7.03 |
-1.35 |
0.94 |
Bloomberg Global Aggregate Bond USD Hedged Index (Strategy Benchmark) |
6.06 |
0.17 |
2.11 | |
| No Deduction of Taxes [Text Block] |
Neither the fund’s returns nor the index returns reflect the deduction of taxes that a shareholder would pay on fund distributions or redemptions of fund shares.
|
| Updated Performance Information Location [Text Block] |
Updated performance information can be found at www.troweprice.com.
|
| Distribution of Capital [Text Block] |
The fund's total return figures reflect the reinvestment of dividends and capital gains, if any.
|
| AssetsNet |
$ 1,910,686,000
|
| Holdings Count | Holding |
442
|
| Advisory Fees Paid, Amount |
$ 7,232,000
|
| InvestmentCompanyPortfolioTurnover |
134.10%
|
| Additional Fund Statistics Significance or Limits [Text Block] |
What are some fund statistics? - Total Net Assets (000s)$1,910,686
- Number of Portfolio Holdings442
|
| Holdings [Text Block] |
Foreign Government Obligations & Municipalities |
42.5% |
Corporate Bonds |
25.2 |
Asset-Backed Securities |
12.0 |
U.S. Government Agency Obligations (Excluding Mortgage-Backed) |
8.3 |
Non-U.S. Government Mortgage-Backed Securities |
2.2 |
Securities Lending Collateral |
1.4 |
Municipal Securities |
1.3 |
Bank Loans |
1.0 |
Short-Term and Other |
6.1 | |
| Largest Holdings [Text Block] |
United Kingdom Gilt |
6.0% |
Government of Malaysia |
5.2 |
Republic of Korea |
4.5 |
U.S. Treasury Inflation-Indexed Notes |
4.3 |
Government of Japan, Inflation-Indexed |
4.3 |
U.S. Treasury Notes |
3.2 |
Bundesrepublik Deutschland Bundesanleihe |
2.3 |
Republic of Indonesia |
2.3 |
Government of Singapore |
2.0 |
Government of Japan |
1.7 | |
| Material Fund Change [Text Block] |
|
| Updated Prospectus Web Address |
www.troweprice.com/paperless
|
| C000169957 |
|
| Shareholder Report [Line Items] |
|
| Fund Name |
Global Multi-Sector Bond Fund
|
| Class Name |
I Class
|
| Trading Symbol |
PGMSX
|
| Annual or Semi-Annual Statement [Text Block] |
This annual shareholder report contains important information about Global Multi-Sector Bond Fund (the "fund") for the period of June 1, 2024 to May 31, 2025. You can find the fund’s prospectus, financial information on Form N‑CSR (which includes required tax information for dividends), holdings, proxy voting information, and other information atwww.troweprice.com/prospectus. You can also request this information without charge by contacting T. Rowe Price at 1‑800‑638‑5660 or info@troweprice.com or contacting your intermediary.
|
| Shareholder Report Annual or Semi-Annual |
Annual Shareholder Report
|
| Additional Information [Text Block] |
You can find the fund’s prospectus, financial information on Form N‑CSR (which includes required tax information for dividends), holdings, proxy voting information, and other information atwww.troweprice.com/prospectus. You can also request this information without charge by contacting T. Rowe Price at 1‑800‑638‑5660 or info@troweprice.com or contacting your intermediary.
|
| Material Fund Change Notice [Text Block] |
|
| Additional Information Phone Number |
1‑800‑638‑5660
|
| Additional Information Email |
<span style="box-sizing: border-box; color: rgb(0, 0, 0); display: inline; flex-wrap: nowrap; font-size: 13.3333px; font-weight: 400; grid-area: auto; line-height: 17.3333px; margin: 0px; overflow: visible; text-align: justify; text-align-last: left; white-space-collapse: preserve-breaks;">info@troweprice.com</span>
|
| Additional Information Website |
www.troweprice.com/prospectus
|
| Expenses [Text Block] |
What were the fund costs for the last year? (based on a hypothetical $10,000 investment)
|
Costs of a $10,000 investment |
Costs paid as a percentage of a $10,000 investment |
Global Multi-Sector Bond Fund - I Class |
$48 |
0.47% | |
| Expenses Paid, Amount |
$ 48
|
| Expense Ratio, Percent |
0.47%
|
| Factors Affecting Performance [Text Block] |
What drove fund performance during the past 12 months?Global fixed income markets generated positive total returns over the past 12 months as the Federal Reserve and other central banks began cutting interest rates, which broadly supported bond prices. Duration and yield curve positioning benefited the fund relative to the Bloomberg Global Aggregate Bond USD Hedged Index. Tactically, adjusting the fund’s U.S. duration posture and positioning the fund to benefit from a steepening U.S. Treasury yield curve at times contributed over the period. Active currency management, specifically in the euro, Egyptian pound, and Japanese yen, also added value as the U.S. dollar came under pressure in 2025. The fund’s allocations in corporate credit weighed on performance versus the benchmark. While investment-grade and high yield corporate bonds were generally supportive in the first half of the period, increased market volatility and economic uncertainty pressured credit sectors more recently. The fund seeks to provide high income and some capital appreciation through a broadly diversified portfolio of domestic and foreign debt instruments, including exposure to various bond sectors, countries, and currencies. By the end of the period, we had a more cautious and defensive positioning within corporate credit. The fund held derivatives during the period, including currency, interest rate, and credit derivatives. The fund’s derivatives exposure, including credit and currency derivatives, weighed on absolute performance. However, interest rate derivatives aided absolute returns.
|
| Performance Past Does Not Indicate Future [Text] |
The fund’s past performance is not a good predictor of the fund’s future performance.
|
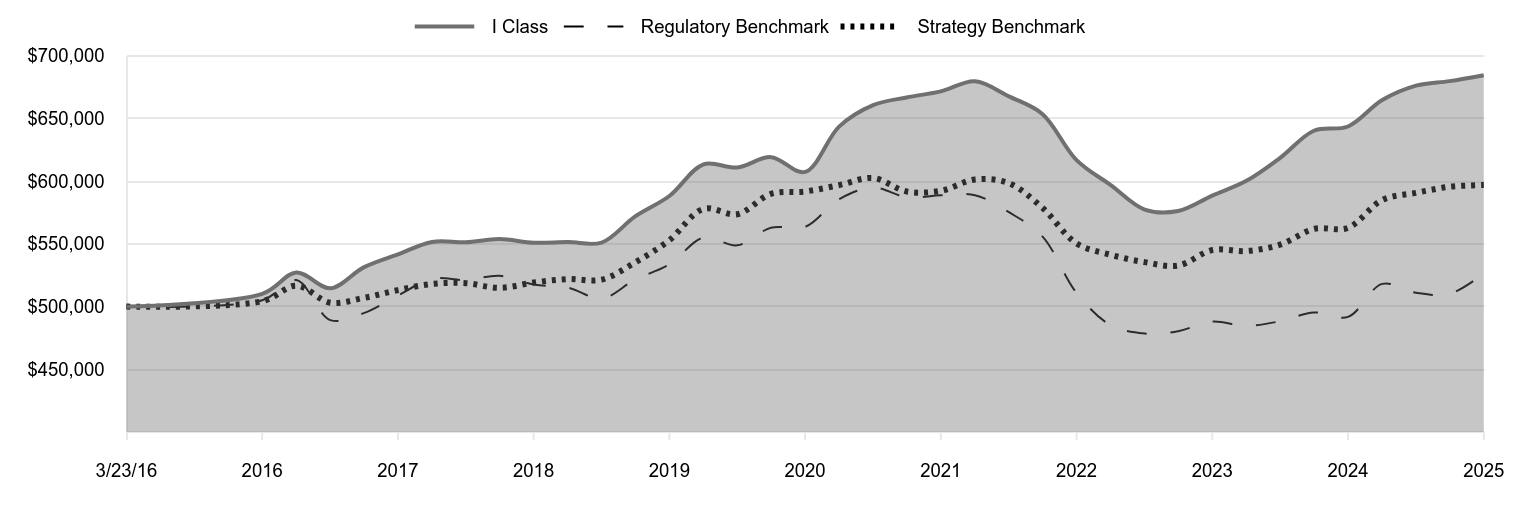
| Line Graph [Table Text Block] |
|
I Class |
Regulatory Benchmark |
Strategy Benchmark |
3/23/16 |
500,000 |
500,000 |
500,000 |
5/31/16 |
510,209 |
505,027 |
504,225 |
8/31/16 |
527,113 |
521,149 |
516,629 |
11/30/16 |
514,562 |
489,232 |
503,110 |
2/28/17 |
531,277 |
494,802 |
506,954 |
5/31/17 |
541,630 |
508,903 |
513,134 |
8/31/17 |
551,551 |
522,127 |
518,059 |
11/30/17 |
551,314 |
521,191 |
518,644 |
2/28/18 |
553,869 |
524,533 |
514,929 |
5/31/18 |
550,897 |
517,668 |
519,199 |
8/31/18 |
551,422 |
515,046 |
521,909 |
11/30/18 |
551,037 |
506,481 |
521,435 |
2/28/19 |
571,927 |
521,569 |
535,212 |
5/31/19 |
588,165 |
533,665 |
552,966 |
8/31/19 |
613,381 |
555,043 |
577,948 |
11/30/19 |
610,880 |
548,862 |
573,604 |
2/29/20 |
619,156 |
562,871 |
589,890 |
5/31/20 |
607,374 |
563,523 |
591,783 |
8/31/20 |
643,682 |
585,768 |
596,879 |
11/30/20 |
660,663 |
594,842 |
602,521 |
2/28/21 |
666,765 |
587,237 |
591,780 |
5/31/21 |
671,616 |
588,694 |
592,309 |
8/31/21 |
679,675 |
588,808 |
601,387 |
11/30/21 |
667,584 |
575,260 |
598,390 |
2/28/22 |
653,576 |
555,996 |
578,797 |
5/31/22 |
616,778 |
510,921 |
550,342 |
8/31/22 |
596,806 |
485,110 |
541,285 |
11/30/22 |
577,376 |
478,528 |
535,420 |
2/28/23 |
576,207 |
480,391 |
532,654 |
5/31/23 |
588,503 |
488,039 |
545,114 |
8/31/23 |
600,268 |
484,658 |
544,280 |
11/30/23 |
618,567 |
488,317 |
549,357 |
2/29/24 |
640,202 |
495,291 |
561,920 |
5/31/24 |
643,587 |
491,811 |
562,795 |
8/31/24 |
664,663 |
518,092 |
584,983 |
11/30/24 |
676,138 |
510,984 |
590,697 |
2/28/25 |
679,766 |
510,058 |
595,520 |
5/31/25 |
684,501 |
526,406 |
596,894 |
|
| Average Annual Return [Table Text Block] |
|
1 Year |
5 Years |
Since Inception 3/23/16 |
Global Multi-Sector Bond Fund (I Class) |
6.36% |
2.42% |
3.48% |
Bloomberg Global Aggregate Bond Index (Regulatory Benchmark) |
7.03 |
-1.35 |
0.56 |
Bloomberg Global Aggregate Bond USD Hedged Index (Strategy Benchmark) |
6.06 |
0.17 |
1.95 | |
| Performance Inception Date |
Mar. 23, 2016
|
| No Deduction of Taxes [Text Block] |
Neither the fund’s returns nor the index returns reflect the deduction of taxes that a shareholder would pay on fund distributions or redemptions of fund shares.
|
| Updated Performance Information Location [Text Block] |
Updated performance information can be found at www.troweprice.com.
|
| Distribution of Capital [Text Block] |
The fund's total return figures reflect the reinvestment of dividends and capital gains, if any.
|
| AssetsNet |
$ 1,910,686,000
|
| Holdings Count | Holding |
442
|
| Advisory Fees Paid, Amount |
$ 7,232,000
|
| InvestmentCompanyPortfolioTurnover |
134.10%
|
| Additional Fund Statistics Significance or Limits [Text Block] |
What are some fund statistics? - Total Net Assets (000s)$1,910,686
- Number of Portfolio Holdings442
|
| Holdings [Text Block] |
Foreign Government Obligations & Municipalities |
42.5% |
Corporate Bonds |
25.2 |
Asset-Backed Securities |
12.0 |
U.S. Government Agency Obligations (Excluding Mortgage-Backed) |
8.3 |
Non-U.S. Government Mortgage-Backed Securities |
2.2 |
Securities Lending Collateral |
1.4 |
Municipal Securities |
1.3 |
Bank Loans |
1.0 |
Short-Term and Other |
6.1 | |
| Largest Holdings [Text Block] |
United Kingdom Gilt |
6.0% |
Government of Malaysia |
5.2 |
Republic of Korea |
4.5 |
U.S. Treasury Inflation-Indexed Notes |
4.3 |
Government of Japan, Inflation-Indexed |
4.3 |
U.S. Treasury Notes |
3.2 |
Bundesrepublik Deutschland Bundesanleihe |
2.3 |
Republic of Indonesia |
2.3 |
Government of Singapore |
2.0 |
Government of Japan |
1.7 | |
| Material Fund Change [Text Block] |
|
| Updated Prospectus Web Address |
www.troweprice.com/paperless
|