| Investor Presentation July 2025 |

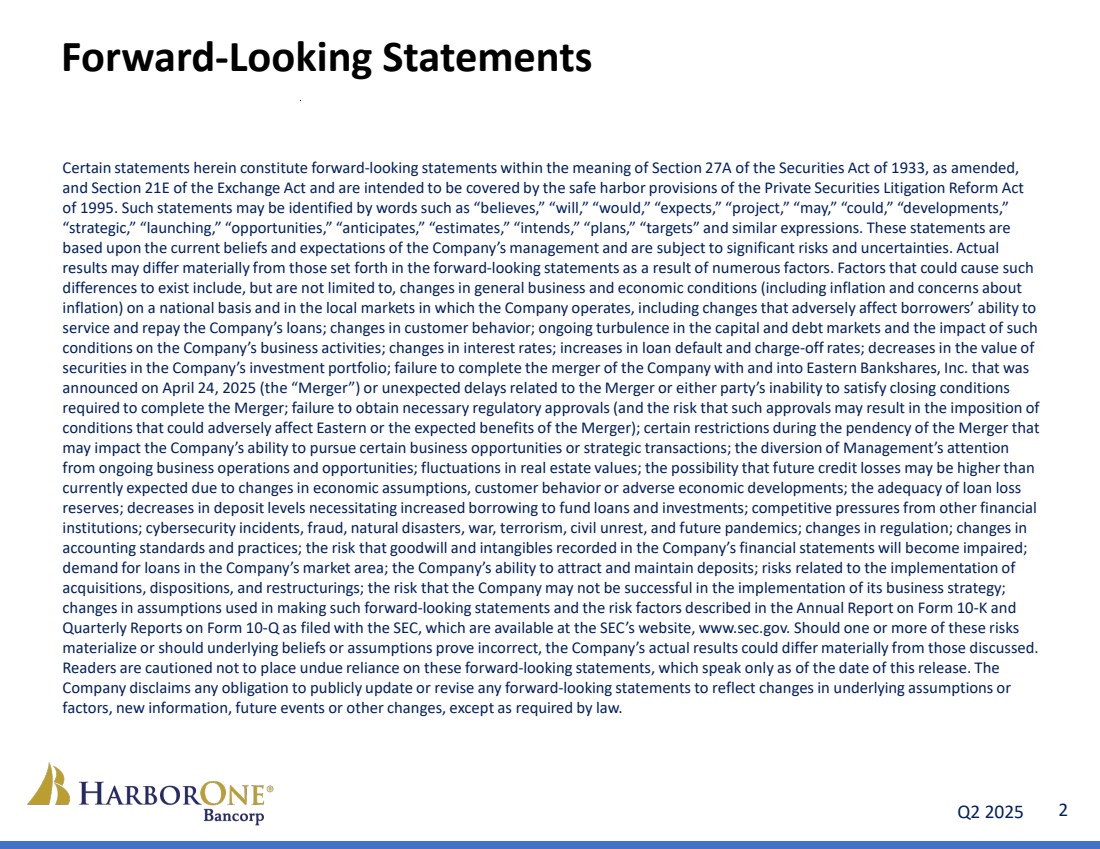
| Q2 2025 2 Forward-Looking Statements Certain statements herein constitute forward-looking statements within the meaning of Section 27A of the Securities Act of 1933, as amended, and Section 21E of the Exchange Act and are intended to be covered by the safe harbor provisions of the Private Securities Litigation Reform Act of 1995. Such statements may be identified by words such as “believes,” “will,” “would,” “expects,” “project,” “may,” “could,” “developments,” “strategic,” “launching,” “opportunities,” “anticipates,” “estimates,” “intends,” “plans,” “targets” and similar expressions. These statements are based upon the current beliefs and expectations of the Company’s management and are subject to significant risks and uncertainties. Actual results may differ materially from those set forth in the forward-looking statements as a result of numerous factors. Factors that could cause such differences to exist include, but are not limited to, changes in general business and economic conditions (including inflation and concerns about inflation) on a national basis and in the local markets in which the Company operates, including changes that adversely affect borrowers’ ability to service and repay the Company’s loans; changes in customer behavior; ongoing turbulence in the capital and debt markets and the impact of such conditions on the Company’s business activities; changes in interest rates; increases in loan default and charge-off rates; decreases in the value of securities in the Company’s investment portfolio; failure to complete the merger of the Company with and into Eastern Bankshares, Inc. that was announced on April 24, 2025 (the “Merger”) or unexpected delays related to the Merger or either party’s inability to satisfy closing conditions required to complete the Merger; failure to obtain necessary regulatory approvals (and the risk that such approvals may result in the imposition of conditions that could adversely affect Eastern or the expected benefits of the Merger); certain restrictions during the pendency of the Merger that may impact the Company’s ability to pursue certain business opportunities or strategic transactions; the diversion of Management’s attention from ongoing business operations and opportunities; fluctuations in real estate values; the possibility that future credit losses may be higher than currently expected due to changes in economic assumptions, customer behavior or adverse economic developments; the adequacy of loan loss reserves; decreases in deposit levels necessitating increased borrowing to fund loans and investments; competitive pressures from other financial institutions; cybersecurity incidents, fraud, natural disasters, war, terrorism, civil unrest, and future pandemics; changes in regulation; changes in accounting standards and practices; the risk that goodwill and intangibles recorded in the Company’s financial statements will become impaired; demand for loans in the Company’s market area; the Company’s ability to attract and maintain deposits; risks related to the implementation of acquisitions, dispositions, and restructurings; the risk that the Company may not be successful in the implementation of its business strategy; changes in assumptions used in making such forward-looking statements and the risk factors described in the Annual Report on Form 10-K and Quarterly Reports on Form 10-Q as filed with the SEC, which are available at the SEC’s website, www.sec.gov. Should one or more of these risks materialize or should underlying beliefs or assumptions prove incorrect, the Company’s actual results could differ materially from those discussed. Readers are cautioned not to place undue reliance on these forward-looking statements, which speak only as of the date of this release. The Company disclaims any obligation to publicly update or revise any forward-looking statements to reflect changes in underlying assumptions or factors, new information, future events or other changes, except as required by law. |
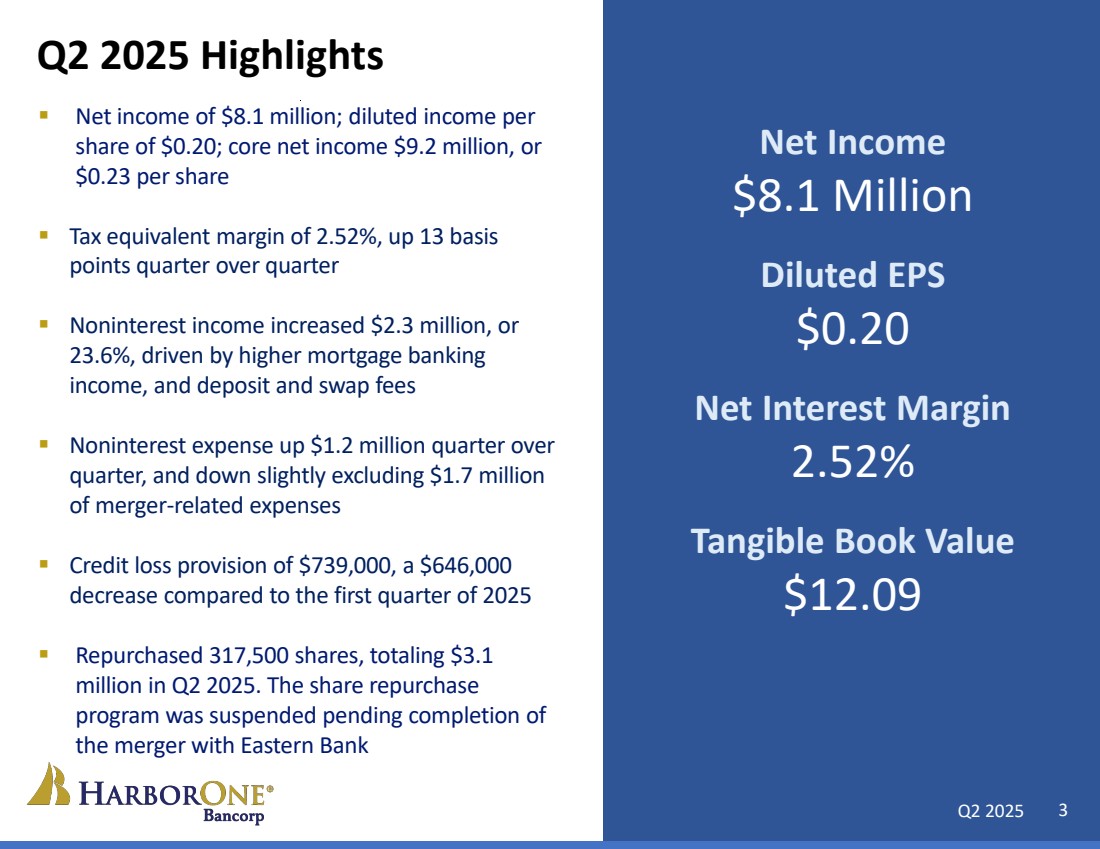
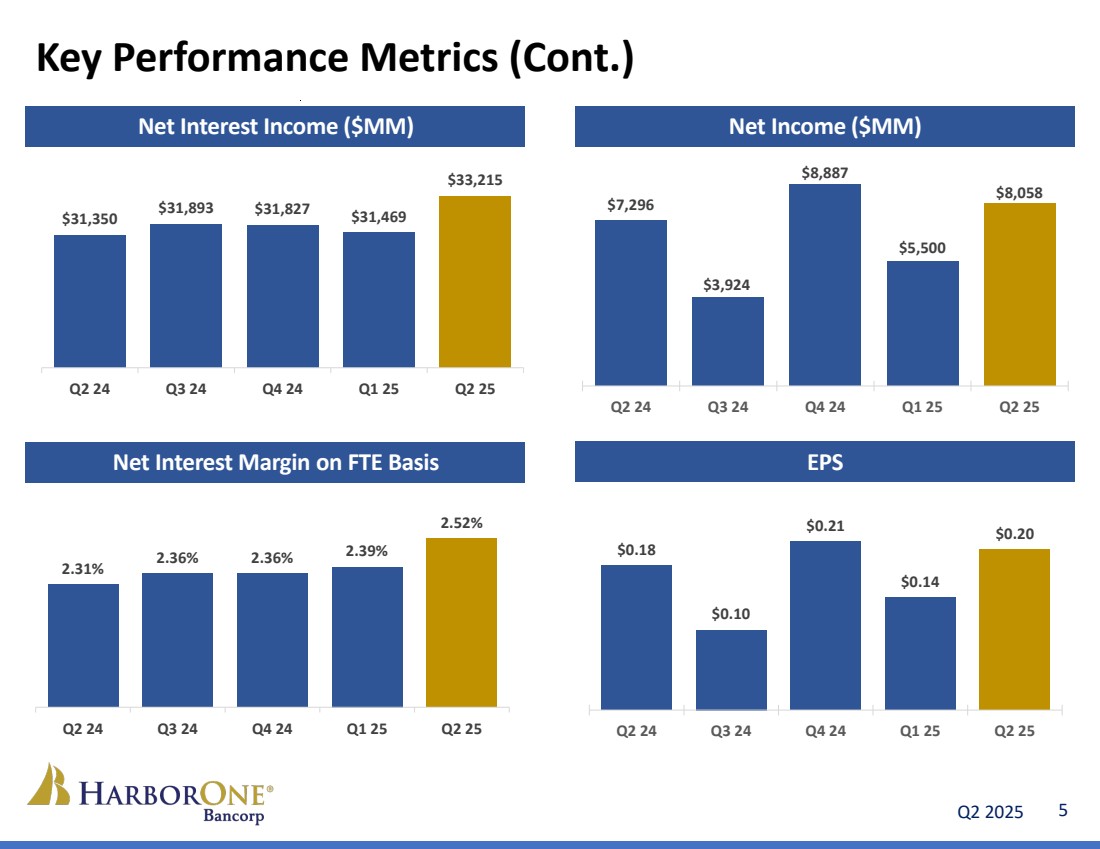
| 2023 Investor Report Q2 2025 3 Net income of $8.1 million; diluted income per share of $0.20; core net income $9.2 million, or $0.23 per share Tax equivalent margin of 2.52%, up 13 basis points quarter over quarter Noninterest income increased $2.3 million, or 23.6%, driven by higher mortgage banking income, and deposit and swap fees Noninterest expense up $1.2 million quarter over quarter, and down slightly excluding $1.7 million of merger-related expenses Credit loss provision of $739,000, a $646,000 decrease compared to the first quarter of 2025 Repurchased 317,500 shares, totaling $3.1 million in Q2 2025. The share repurchase program was suspended pending completion of the merger with Eastern Bank Q2 2025 Highlights Net Income $8.1 Million Diluted EPS $0.20 Net Interest Margin 2.52% Tangible Book Value $12.09 |
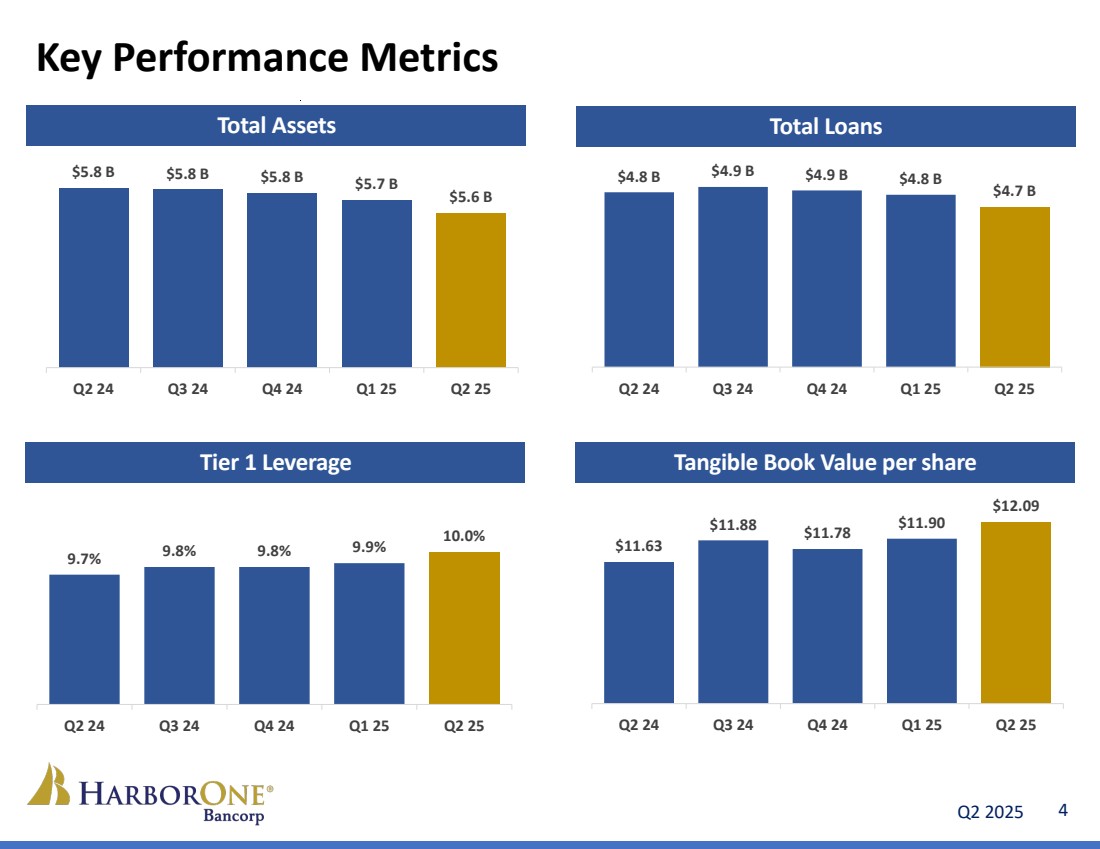
| Q2 2025 4 $5.8 B $5.8 B $5.8 B $5.7 B $5.6 B Q2 24 Q3 24 Q4 24 Q1 25 Q2 25 9.7% 9.8% 9.8% 9.9% 10.0% Q2 24 Q3 24 Q4 24 Q1 25 Q2 25 $4.8 B $4.9 B $4.9 B $4.8 B $4.7 B Q2 24 Q3 24 Q4 24 Q1 25 Q2 25 $11.63 $11.88 $11.78 $11.90 $12.09 Q2 24 Q3 24 Q4 24 Q1 25 Q2 25 Key Performance Metrics Total Assets Total Loans Tier 1 Leverage Tangible Book Value per share |
| Q2 2025 5 Key Performance Metrics (Cont.) EPS Net Income ($MM) Net Interest Margin on FTE Basis Net Interest Income ($MM) $0.18 $0.10 $0.21 $0.14 $0.20 Q2 24 Q3 24 Q4 24 Q1 25 Q2 25 2.31% 2.36% 2.36% 2.39% 2.52% Q2 24 Q3 24 Q4 24 Q1 25 Q2 25 $31,350 $31,893 $31,827 $31,469 $33,215 Q2 24 Q3 24 Q4 24 Q1 25 Q2 25 $7,296 $3,924 $8,887 $5,500 $8,058 Q2 24 Q3 24 Q4 24 Q1 25 Q2 25 |
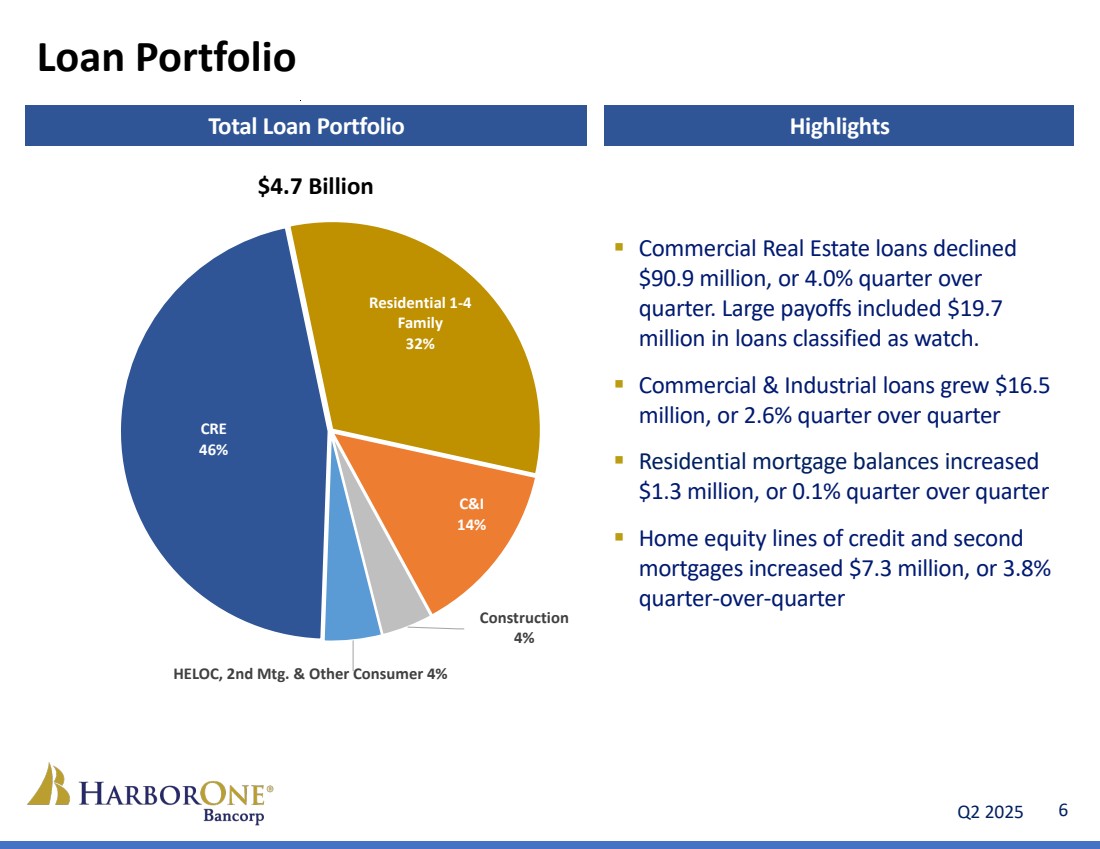
| Q2 2025 6 CRE 46% Residential 1-4 Family 32% C&I 14% Construction 4% HELOC, 2nd Mtg. & Other Consumer 4% Loan Portfolio $4.7 Billion Total Loan Portfolio Highlights Commercial Real Estate loans declined $90.9 million, or 4.0% quarter over quarter. Large payoffs included $19.7 million in loans classified as watch. Commercial & Industrial loans grew $16.5 million, or 2.6% quarter over quarter Residential mortgage balances increased $1.3 million, or 0.1% quarter over quarter Home equity lines of credit and second mortgages increased $7.3 million, or 3.8% quarter-over-quarter |
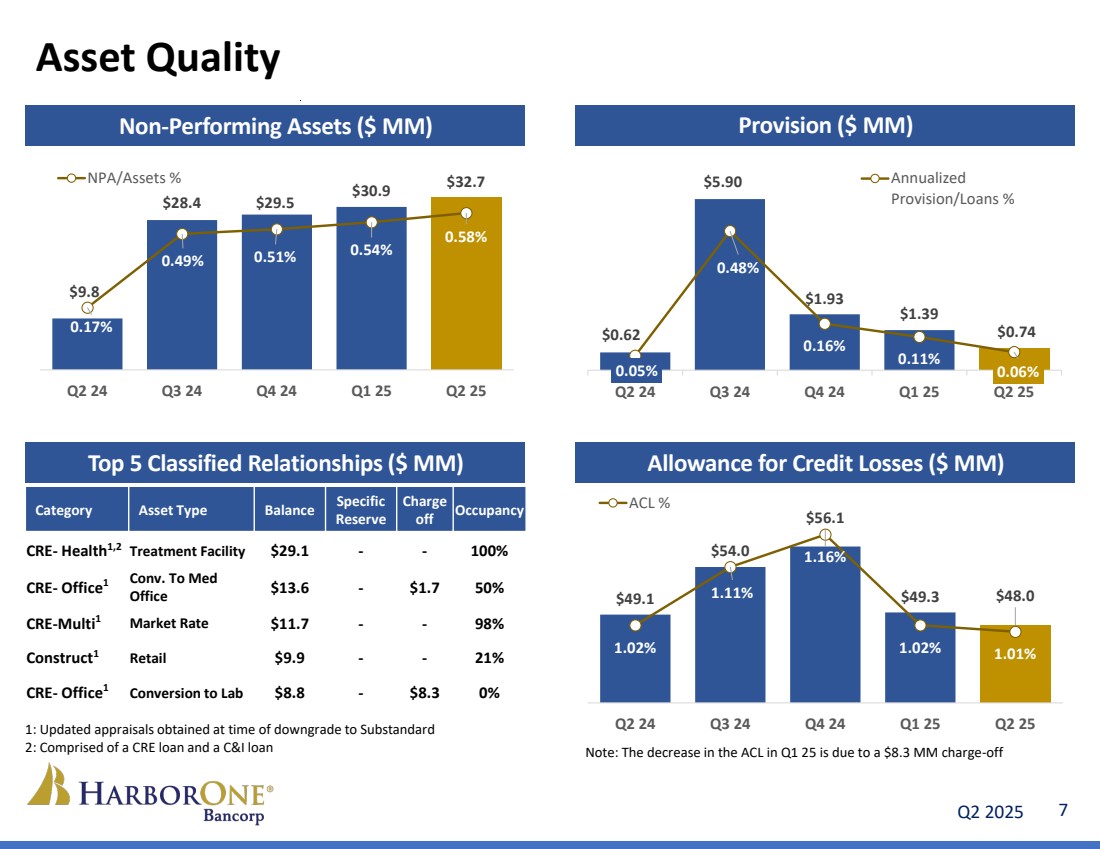
| Q2 2025 7 Asset Quality Non-Performing Assets ($ MM) Provision ($ MM) Top 5 Classified Relationships ($ MM) Allowance for Credit Losses ($ MM) $9.8 $28.4 $29.5 $30.9 $32.7 0.17% 0.49% 0.51% 0.54% 0.58% Q2 24 Q3 24 Q4 24 Q1 25 Q2 25 NPA/Assets % Category Asset Type Balance Specific Reserve Charge off Occupancy CRE- Health1,2 Treatment Facility $29.1 - - 100% CRE- Office1 Conv. To Med Office $13.6 - $1.7 50% CRE-Multi1 Market Rate $11.7 - - 98% Construct1 Retail $9.9 - - 21% CRE- Office1 Conversion to Lab $8.8 - $8.3 0% $0.62 $5.90 $1.93 $1.39 $0.74 0.05% 0.48% 0.16% 0.11% 0.06% Q2 24 Q3 24 Q4 24 Q1 25 Q2 25 Annualized Provision/Loans % $49.1 $54.0 $56.1 $49.3 $48.0 1.02% 1.11% 1.16% 1.02% 1.01% Q2 24 Q3 24 Q4 24 Q1 25 Q2 25 ACL % 1: Updated appraisals obtained at time of downgrade to Substandard 2: Comprised of a CRE loan and a C&I loan Note: The decrease in the ACL in Q1 25 is due to a $8.3 MM charge-off |
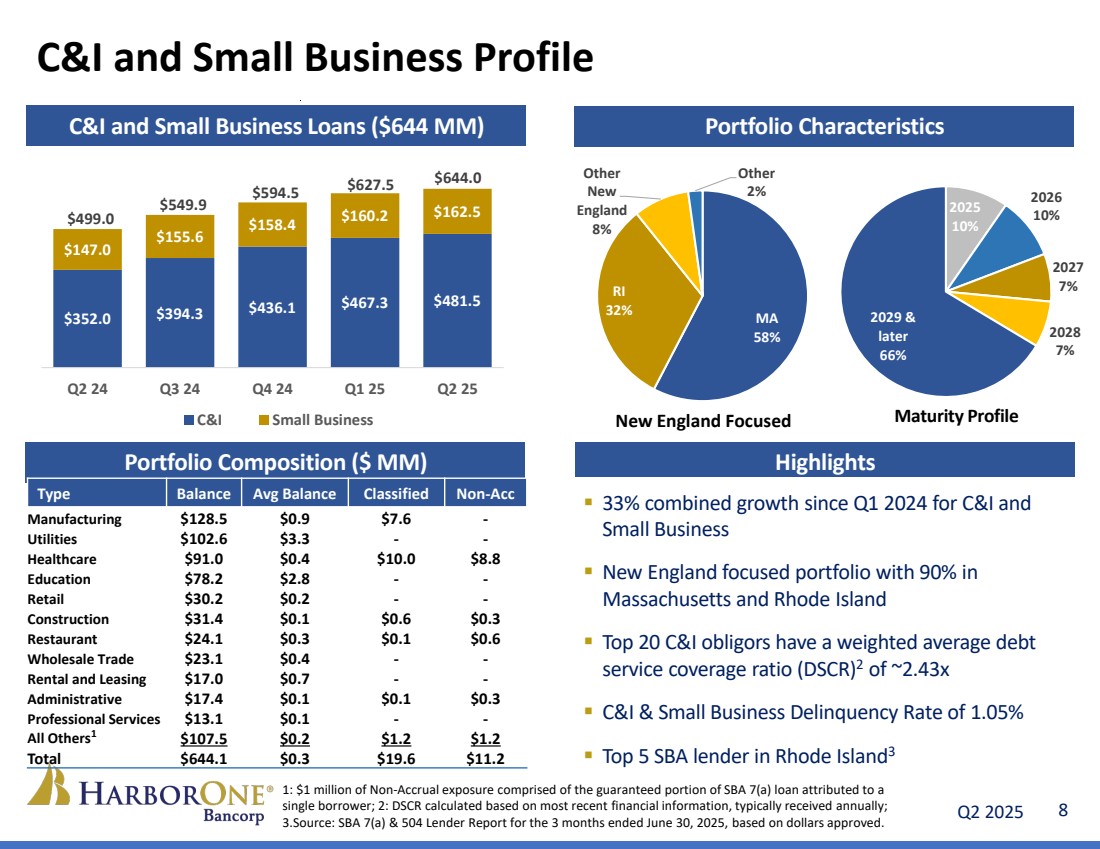
| Q2 2025 8 C&I and Small Business Profile New England Focused Maturity Profile C&I and Small Business Loans ($644 MM) Portfolio Characteristics Portfolio Composition ($ MM) Highlights 33% combined growth since Q1 2024 for C&I and Small Business New England focused portfolio with 90% in Massachusetts and Rhode Island Top 20 C&I obligors have a weighted average debt service coverage ratio (DSCR)2 of ~2.43x C&I & Small Business Delinquency Rate of 1.05% Top 5 SBA lender in Rhode Island3 MA 58% RI 32% Other New England 8% Other 2% 2025 10% 2026 10% 2027 7% 2028 7% 2029 & later 66% 1: $1 million of Non-Accrual exposure comprised of the guaranteed portion of SBA 7(a) loan attributed to a single borrower; 2: DSCR calculated based on most recent financial information, typically received annually; 3.Source: SBA 7(a) & 504 Lender Report for the 3 months ended June 30, 2025, based on dollars approved. Type Balance Avg Balance Classified Non-Acc Manufacturing $128.5 $0.9 $7.6 - Utilities $102.6 $3.3 - - Healthcare $91.0 $0.4 $10.0 $8.8 Education $78.2 $2.8 - - Retail $30.2 $0.2 - - Construction $31.4 $0.1 $0.6 $0.3 Restaurant $24.1 $0.3 $0.1 $0.6 Wholesale Trade $23.1 $0.4 - - Rental and Leasing $17.0 $0.7 - - Administrative $17.4 $0.1 $0.1 $0.3 Professional Services $13.1 $0.1 - - All Others1 $107.5 $0.2 $1.2 $1.2 Total $644.1 $0.3 $19.6 $11.2 $352.0 $394.3 $436.1 $467.3 $481.5 $147.0 $155.6 $158.4 $160.2 $162.5 $499.0 $549.9 $594.5 $627.5 $644.0 Q2 24 Q3 24 Q4 24 Q1 25 Q2 25 C&I Small Business |
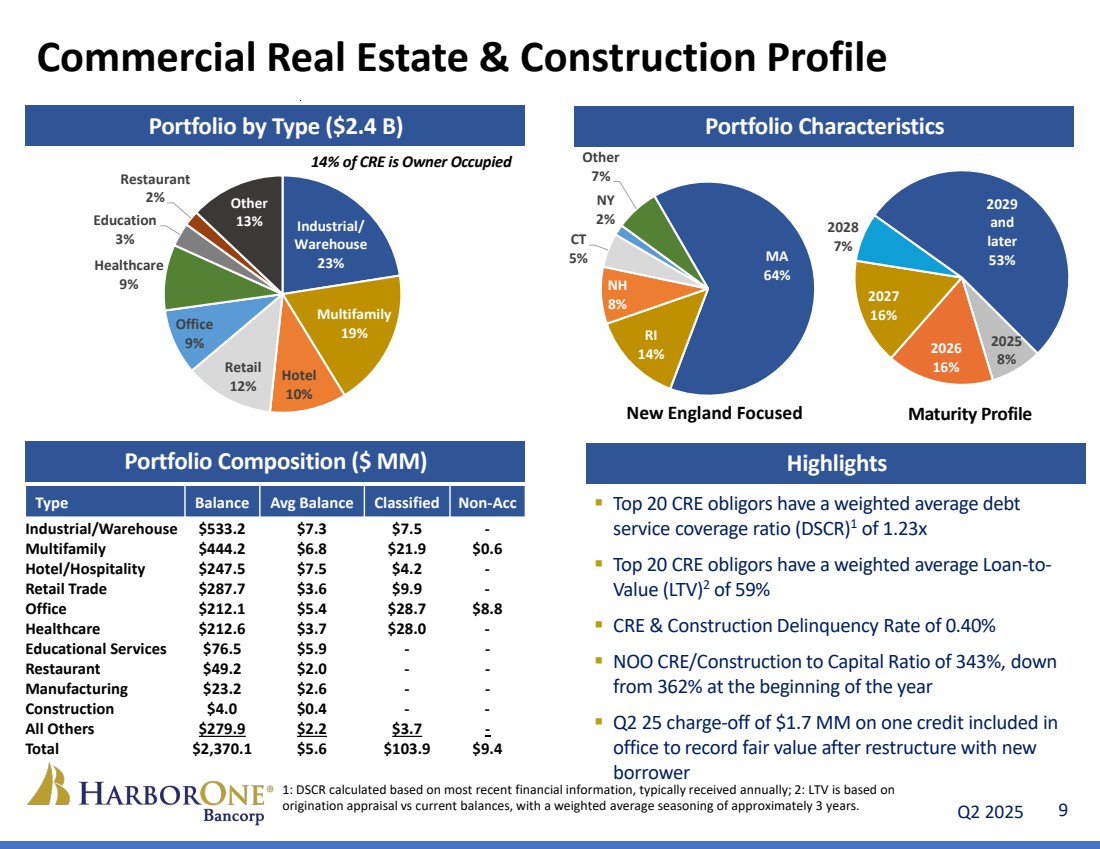
| Q2 2025 9 Commercial Real Estate & Construction Profile New England Focused Maturity Profile Portfolio by Type ($2.4 B) Portfolio Characteristics Portfolio Composition ($ MM) Highlights 1: DSCR calculated based on most recent financial information, typically received annually; 2: LTV is based on origination appraisal vs current balances, with a weighted average seasoning of approximately 3 years. 14% of CRE is Owner Occupied Top 20 CRE obligors have a weighted average debt service coverage ratio (DSCR)1 of 1.23x Top 20 CRE obligors have a weighted average Loan-to-Value (LTV)2 of 59% CRE & Construction Delinquency Rate of 0.40% NOO CRE/Construction to Capital Ratio of 343%, down from 362% at the beginning of the year Q2 25 charge-off of $1.7 MM on one credit included in office to record fair value after restructure with new borrower Type Balance Avg Balance Classified Non-Acc Industrial/Warehouse $533.2 $7.3 $7.5 - Multifamily $444.2 $6.8 $21.9 $0.6 Hotel/Hospitality $247.5 $7.5 $4.2 - Retail Trade $287.7 $3.6 $9.9 - Office $212.1 $5.4 $28.7 $8.8 Healthcare $212.6 $3.7 $28.0 - Educational Services $76.5 $5.9 - - Restaurant $49.2 $2.0 - - Manufacturing $23.2 $2.6 - - Construction $4.0 $0.4 - - All Others $279.9 $2.2 $3.7 - Total $2,370.1 $5.6 $103.9 $9.4 Industrial/ Warehouse 23% Multifamily 19% Hotel 10% Retail 12% Office 9% Healthcare 9% Education 3% Restaurant 2% Other 13% 2025 8% 2026 16% 2027 16% 2028 7% 2029 and later MA 53% 64% RI 14% NH 8% CT 5% NY 2% Other 7% |
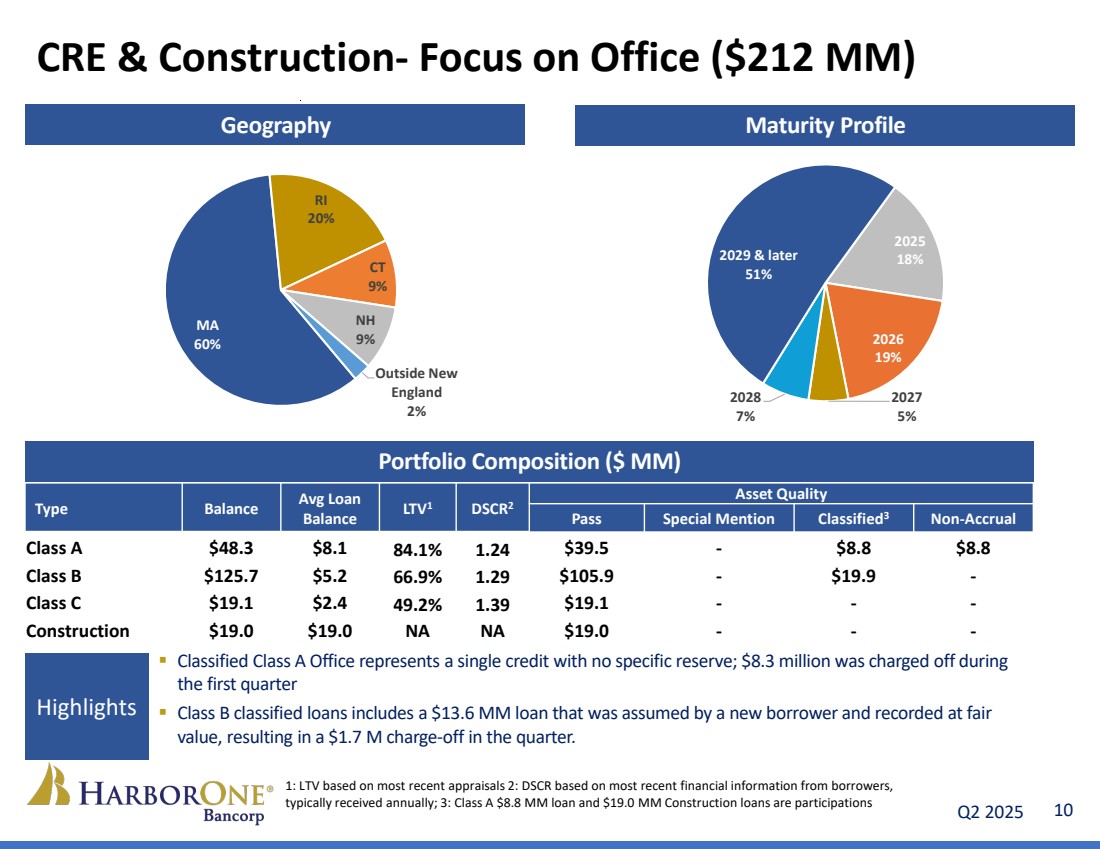
| Q2 2025 10 CRE & Construction- Focus on Office ($212 MM) Geography Maturity Profile Type Balance Avg Loan Balance LTV1 DSCR2 Asset Quality Pass Special Mention Classified3 Non-Accrual Class A $48.3 $8.1 84.1% 1.24 $39.5 - $8.8 $8.8 Class B $125.7 $5.2 66.9% 1.29 $105.9 - $19.9 - Class C $19.1 $2.4 49.2% 1.39 $19.1 - - - Construction $19.0 $19.0 NA NA $19.0 - - - Portfolio Composition ($ MM) 1: LTV based on most recent appraisals 2: DSCR based on most recent financial information from borrowers, typically received annually; 3: Class A $8.8 MM loan and $19.0 MM Construction loans are participations 2025 18% 2026 19% 2027 5% 2028 7% 2029 & later 51% MA 60% RI 20% CT 9% NH 9% Outside New England 2% Classified Class A Office represents a single credit with no specific reserve; $8.3 million was charged off during the first quarter Class B classified loans includes a $13.6 MM loan that was assumed by a new borrower and recorded at fair value, resulting in a $1.7 M charge-off in the quarter. Highlights |
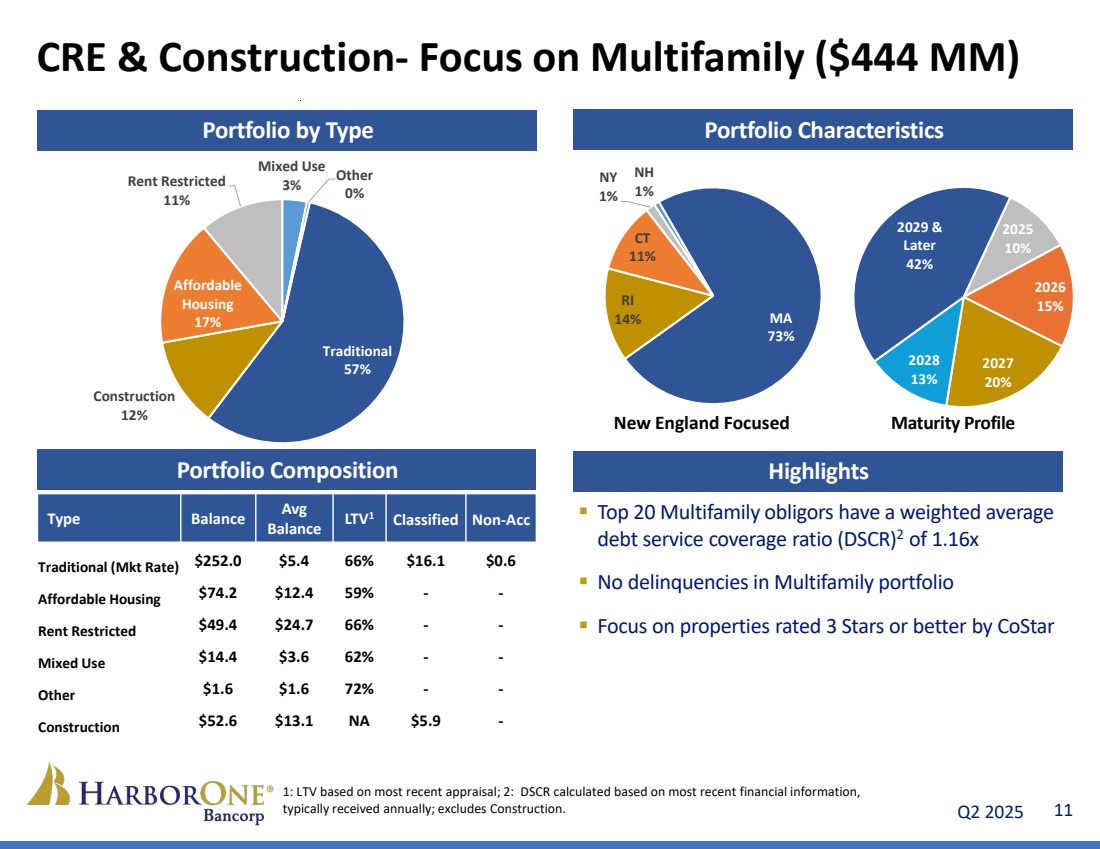
| Q2 2025 11 CRE & Construction- Focus on Multifamily ($444 MM) New England Focused Maturity Profile Portfolio by Type Portfolio Characteristics Portfolio Composition Highlights Top 20 Multifamily obligors have a weighted average debt service coverage ratio (DSCR)2 of 1.16x No delinquencies in Multifamily portfolio Focus on properties rated 3 Stars or better by CoStar 1: LTV based on most recent appraisal; 2: DSCR calculated based on most recent financial information, typically received annually; excludes Construction. Type Balance Avg Balance LTV1 Classified Non-Acc Traditional (Mkt Rate) $252.0 $5.4 66% $16.1 $0.6 Affordable Housing $74.2 $12.4 59% - - Rent Restricted $49.4 $24.7 66% - - Mixed Use $14.4 $3.6 62% - - Other $1.6 $1.6 72% - - Construction $52.6 $13.1 NA $5.9 - Traditional 57% Construction 12% Affordable Housing 17% Rent Restricted 11% Mixed Use 3% Other 0% MA 73% RI 14% CT 11% NY 1% NH 1% 2025 10% 2026 15% 2027 20% 2028 13% 2029 & Later 42% |
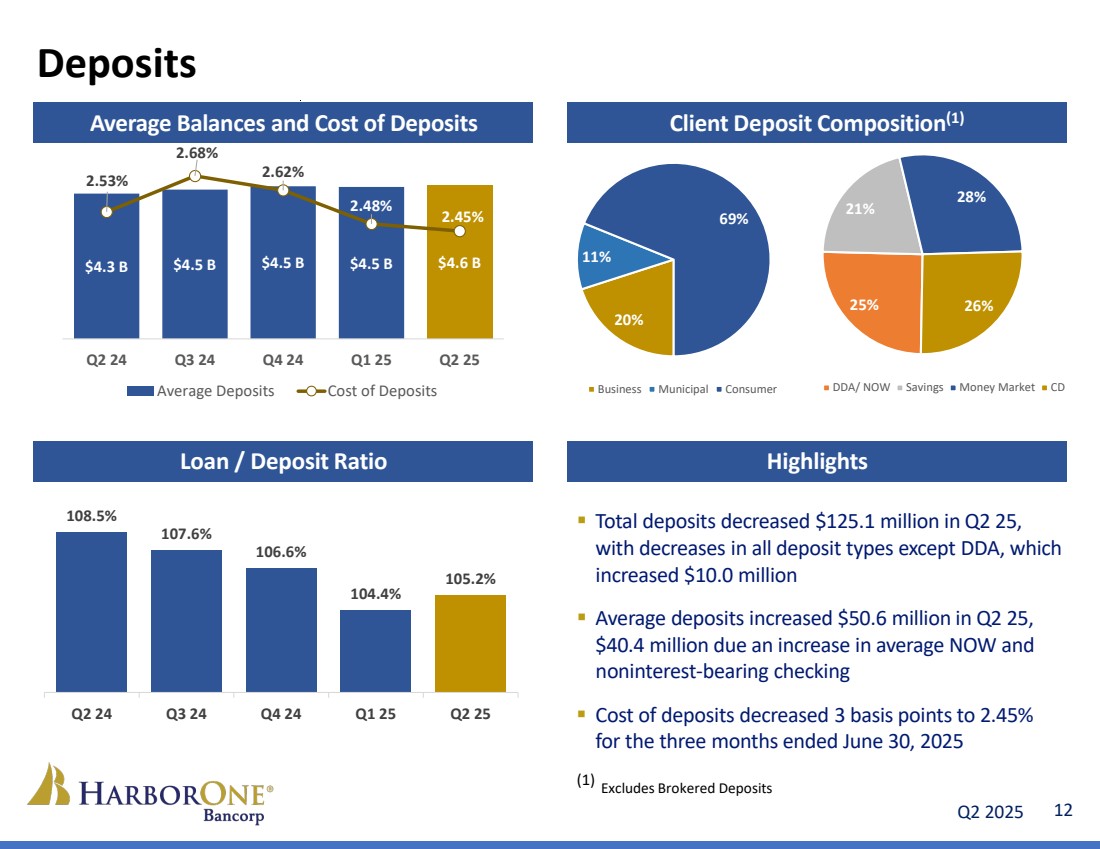
| Q2 2025 12 Client Deposit Composition(1) Deposits Average Balances and Cost of Deposits 20% 11% 69% Business Municipal Consumer 25% 21% 28% 26% DDA/ NOW Savings Money Market CD Loan / Deposit Ratio Highlights Total deposits decreased $125.1 million in Q2 25, with decreases in all deposit types except DDA, which increased $10.0 million Average deposits increased $50.6 million in Q2 25, $40.4 million due an increase in average NOW and noninterest-bearing checking Cost of deposits decreased 3 basis points to 2.45% for the three months ended June 30, 2025 (1) Excludes Brokered Deposits $4.3 B $4.5 B $4.5 B $4.5 B $4.6 B 2.53% 2.68% 2.62% 2.48% 2.45% Q2 24 Q3 24 Q4 24 Q1 25 Q2 25 Average Deposits Cost of Deposits 108.5% 107.6% 106.6% 104.4% 105.2% Q2 24 Q3 24 Q4 24 Q1 25 Q2 25 |
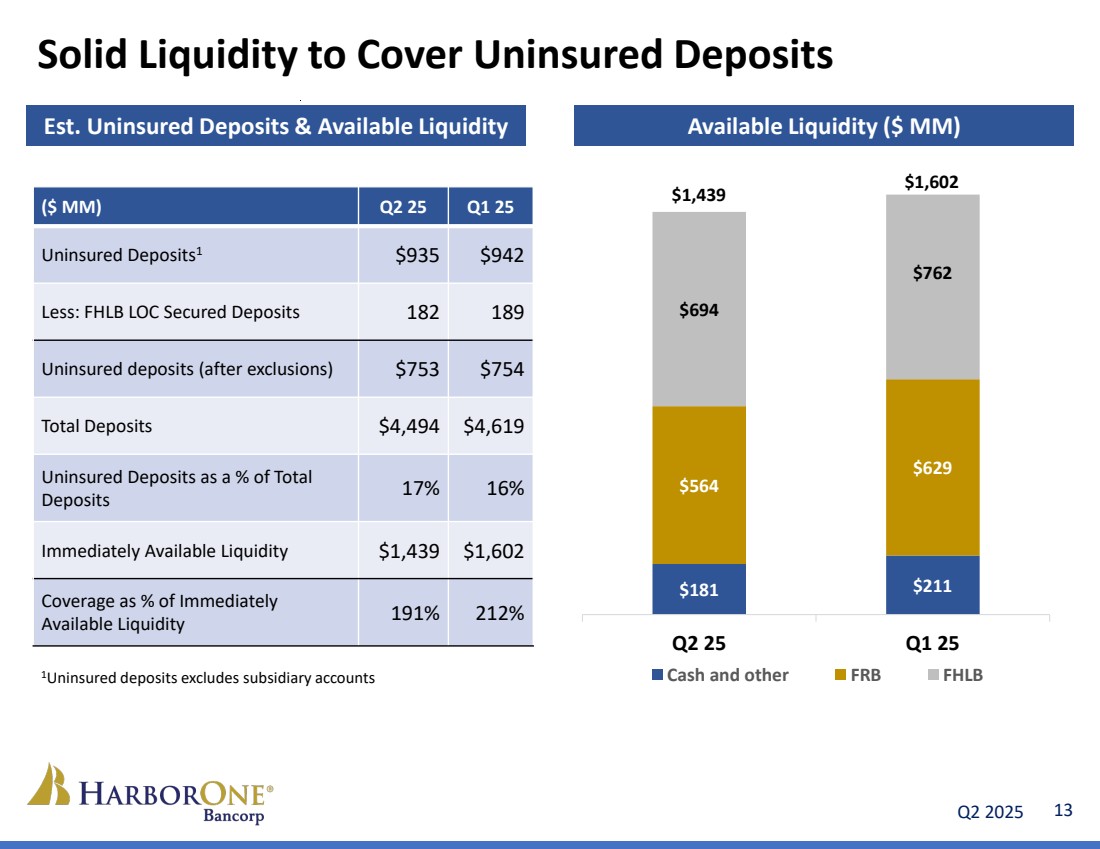
| Q2 2025 13 Est. Uninsured Deposits & Available Liquidity Available Liquidity ($ MM) Solid Liquidity to Cover Uninsured Deposits $181 $211 $564 $629 $694 $762 Q2 25 Q1 25 Cash and other FRB FHLB ($ MM) Q2 25 Q1 25 Uninsured Deposits1 $935 $942 Less: FHLB LOC Secured Deposits 182 189 Uninsured deposits (after exclusions) $753 $754 Total Deposits $4,494 $4,619 Uninsured Deposits as a % of Total Deposits 17% 16% Immediately Available Liquidity $1,439 $1,602 Coverage as % of Immediately Available Liquidity 191% 212% 1Uninsured deposits excludes subsidiary accounts $1,439 $1,602 |
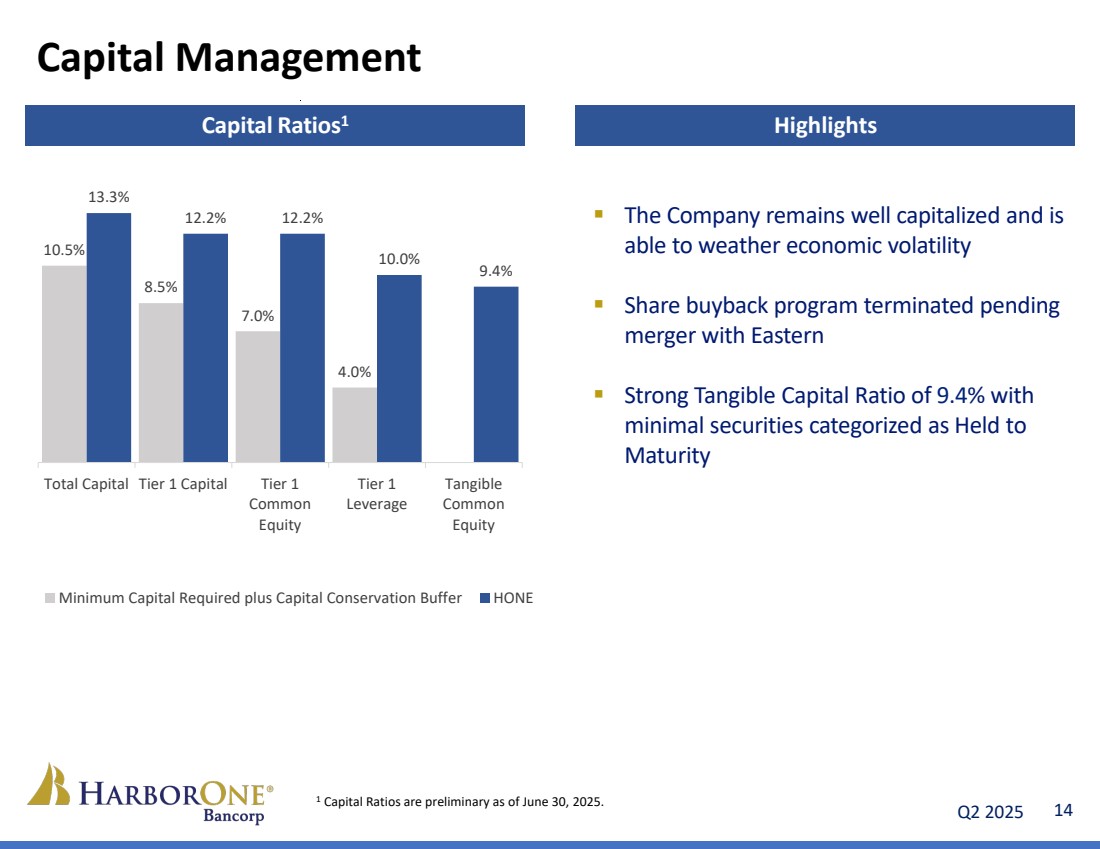
| Q2 2025 14 Capital Management The Company remains well capitalized and is able to weather economic volatility Share buyback program terminated pending merger with Eastern Strong Tangible Capital Ratio of 9.4% with minimal securities categorized as Held to Maturity 10.5% 8.5% 7.0% 4.0% 13.3% 12.2% 12.2% 10.0% 9.4% Total Capital Tier 1 Capital Tier 1 Common Equity Tier 1 Leverage Tangible Common Equity Minimum Capital Required plus Capital Conservation Buffer HONE 1 Capital Ratios are preliminary as of June 30, 2025. Capital Ratios1 Highlights |
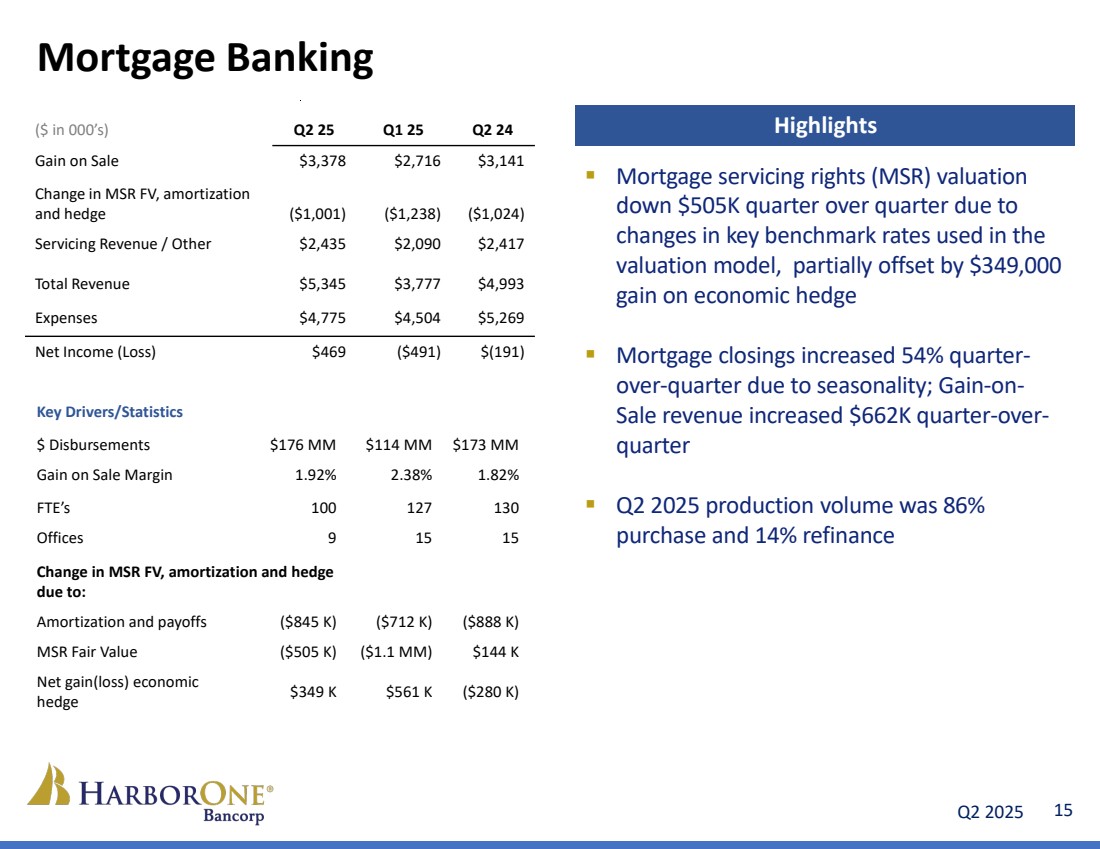
| Q2 2025 15 Mortgage Banking ($ in 000’s) Q2 25 Q1 25 Q2 24 Gain on Sale $3,378 $2,716 $3,141 Change in MSR FV, amortization and hedge ($1,001) ($1,238) ($1,024) Servicing Revenue / Other $2,435 $2,090 $2,417 Total Revenue $5,345 $3,777 $4,993 Expenses $4,775 $4,504 $5,269 Net Income (Loss) $469 ($491) $(191) Mortgage servicing rights (MSR) valuation down $505K quarter over quarter due to changes in key benchmark rates used in the valuation model, partially offset by $349,000 gain on economic hedge Mortgage closings increased 54% quarter-over-quarter due to seasonality; Gain-on-Sale revenue increased $662K quarter-over-quarter Q2 2025 production volume was 86% purchase and 14% refinance Highlights Key Drivers/Statistics $ Disbursements $176 MM $114 MM $173 MM Gain on Sale Margin 1.92% 2.38% 1.82% FTE’s 100 127 130 Offices 9 15 15 Change in MSR FV, amortization and hedge due to: Amortization and payoffs ($845 K) ($712 K) ($888 K) MSR Fair Value ($505 K) ($1.1 MM) $144 K Net gain(loss) economic hedge $349 K $561 K ($280 K) |
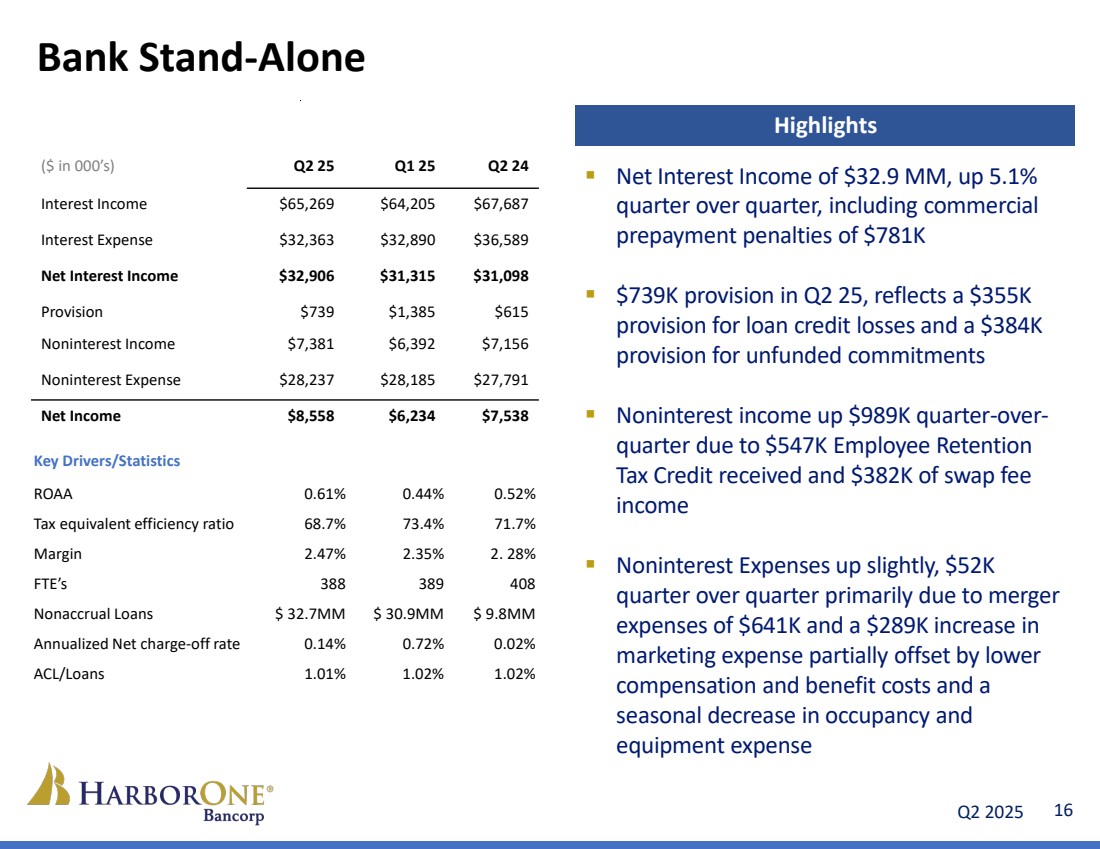
| Q2 2025 16 Bank Stand-Alone ($ in 000’s) Q2 25 Q1 25 Q2 24 Interest Income $65,269 $64,205 $67,687 Interest Expense $32,363 $32,890 $36,589 Net Interest Income $32,906 $31,315 $31,098 Provision $739 $1,385 $615 Noninterest Income $7,381 $6,392 $7,156 Noninterest Expense $28,237 $28,185 $27,791 Net Income $8,558 $6,234 $7,538 Key Drivers/Statistics ROAA 0.61% 0.44% 0.52% Tax equivalent efficiency ratio 68.7% 73.4% 71.7% Margin 2.47% 2.35% 2. 28% FTE’s 388 389 408 Nonaccrual Loans $ 32.7MM $ 30.9MM $ 9.8MM Annualized Net charge-off rate 0.14% 0.72% 0.02% ACL/Loans 1.01% 1.02% 1.02% Net Interest Income of $32.9 MM, up 5.1% quarter over quarter, including commercial prepayment penalties of $781K $739K provision in Q2 25, reflects a $355K provision for loan credit losses and a $384K provision for unfunded commitments Noninterest income up $989K quarter-over-quarter due to $547K Employee Retention Tax Credit received and $382K of swap fee income Noninterest Expenses up slightly, $52K quarter over quarter primarily due to merger expenses of $641K and a $289K increase in marketing expense partially offset by lower compensation and benefit costs and a seasonal decrease in occupancy and equipment expense Highlights |
| Q2 2025 17 HarborOne U - “Enriching lives through education” Original content, tools, templates, case studies, and calculators to help small businesses achieve financial success. A personalized education platform that helps individuals and families gain skills and build confidence in their financial choices. Consumer Small Business |
| Q2 2025 18 A Commitment to Doing What’s Right Mission Statement We provide a personalized experience while caring about every customer. We focus on understanding their financial goals for today and dreams for tomorrow. We are unwavering in our commitment to the communities that we serve. Vision Statement To be our customers’ most trusted financial partner. Our Values Integrity. Teamwork. Trust. Respect. Accountability. |