Shareholder Report
|
12 Months Ended |
|
May 31, 2025
USD ($)
Holding
|
|---|
| Shareholder Report [Line Items] |
|
| Document Type |
N-CSR
|
| Amendment Flag |
false
|
| Registrant Name |
T. ROWE PRICE GNMA FUND, INC.
|
| Entity Central Index Key |
0000779785
|
| Entity Investment Company Type |
N-1A
|
| Document Period End Date |
May 31, 2025
|
| C000005523 |
|
| Shareholder Report [Line Items] |
|
| Fund Name |
GNMA Fund
|
| Class Name |
Investor Class
|
| Trading Symbol |
PRGMX
|
| Annual or Semi-Annual Statement [Text Block] |
This annual shareholder report contains important information about GNMA Fund (the "fund") for the period of June 1, 2024 to May 31, 2025. You can find the fund’s prospectus, financial information on Form N‑CSR (which includes required tax information for dividends), holdings, proxy voting information, and other information atwww.troweprice.com/prospectus. You can also request this information without charge by contacting T. Rowe Price at 1‑800‑638‑5660 or info@troweprice.com or contacting your intermediary.
|
| Shareholder Report Annual or Semi-Annual |
Annual Shareholder Report
|
| Additional Information [Text Block] |
You can find the fund’s prospectus, financial information on Form N‑CSR (which includes required tax information for dividends), holdings, proxy voting information, and other information atwww.troweprice.com/prospectus. You can also request this information without charge by contacting T. Rowe Price at 1‑800‑638‑5660 or info@troweprice.com or contacting your intermediary.
|
| Material Fund Change Notice [Text Block] |
|
| Additional Information Phone Number |
1‑800‑638‑5660
|
| Additional Information Email |
<span style="box-sizing: border-box; color: rgb(0, 0, 0); display: inline; flex-wrap: nowrap; font-size: 13.3333px; font-weight: 400; grid-area: auto; line-height: 17.3333px; margin: 0px; overflow: visible; text-align: justify; text-align-last: left; white-space-collapse: preserve-breaks;">info@troweprice.com</span>
|
| Additional Information Website |
www.troweprice.com/prospectus
|
| Expenses [Text Block] |
What were the fund costs for the last year? (based on a hypothetical $10,000 investment)
|
Costs of a $10,000 investment |
Costs paid as a percentage of a $10,000 investment |
GNMA Fund - Investor Class |
$64 |
0.62% | |
| Expenses Paid, Amount |
$ 64
|
| Expense Ratio, Percent |
0.62%
|
| Factors Affecting Performance [Text Block] |
What drove fund performance during the past 12 months?Fixed income securities produced generally positive returns during the reporting period as the Federal Reserve began cutting interest rates and yields fell across most of the Treasury yield curve. Mortgage-backed securities, including GNMAs, produced positive returns and outperformed Treasuries. The yield generated by the fund’s cash holdings, which serve as collateral for our to-be-announced (TBA) positions, contributed to relative performance versus the style-specific Bloomberg U.S. GNMA Index. Relative results were also aided by an allocation to interest-only collateralized mortgage obligation positions, which benefited from higher mortgage rates that caused principal prepayments to slow, thereby sustaining interest payments. The fund’s use of TBA positions detracted from results versus the style-specific benchmark as these instruments generally underperformed cash bonds that offered more stable cash flows. The fund seeks high current income consistent with high overall credit quality and moderate price fluctuation by investing primarily in GNMA mortgage-backed securities and investments linked to these securities. At period-end, we were favoring GNMAs with higher coupons due to their potential to benefit from falling interest rate volatility.
|
| Performance Past Does Not Indicate Future [Text] |
The fund’s past performance is not a good predictor of the fund’s future performance.
|
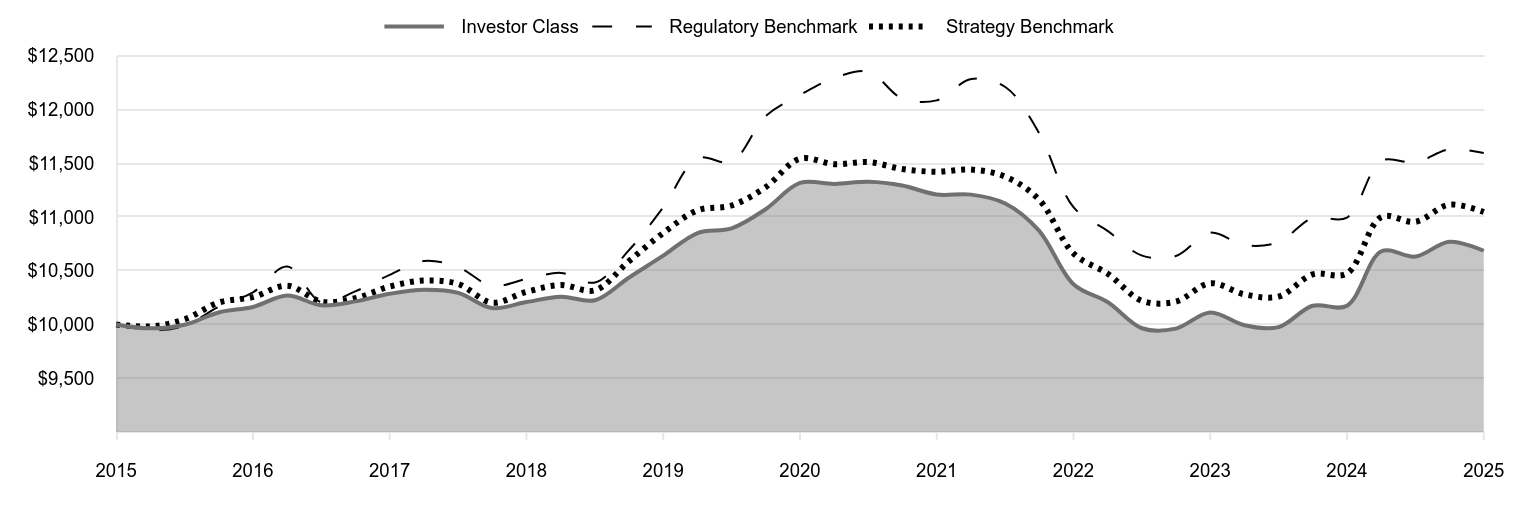
| Line Graph [Table Text Block] |
|
Investor Class |
Regulatory Benchmark |
Strategy Benchmark |
2015 |
10,000 |
10,000 |
10,000 |
2015 |
9,964 |
9,945 |
9,982 |
2015 |
9,997 |
9,988 |
10,048 |
2016 |
10,112 |
10,164 |
10,204 |
2016 |
10,163 |
10,299 |
10,255 |
2016 |
10,269 |
10,539 |
10,361 |
2016 |
10,178 |
10,205 |
10,213 |
2017 |
10,215 |
10,308 |
10,244 |
2017 |
10,286 |
10,462 |
10,353 |
2017 |
10,324 |
10,591 |
10,409 |
2017 |
10,294 |
10,533 |
10,377 |
2018 |
10,153 |
10,360 |
10,203 |
2018 |
10,209 |
10,423 |
10,304 |
2018 |
10,258 |
10,480 |
10,367 |
2018 |
10,226 |
10,391 |
10,318 |
2019 |
10,435 |
10,689 |
10,587 |
2019 |
10,640 |
11,090 |
10,851 |
2019 |
10,851 |
11,546 |
11,062 |
2019 |
10,894 |
11,513 |
11,107 |
2020 |
11,072 |
11,937 |
11,277 |
2020 |
11,317 |
12,134 |
11,542 |
2020 |
11,308 |
12,293 |
11,491 |
2020 |
11,328 |
12,351 |
11,511 |
2021 |
11,293 |
12,102 |
11,446 |
2021 |
11,209 |
12,085 |
11,421 |
2021 |
11,208 |
12,283 |
11,441 |
2021 |
11,126 |
12,209 |
11,375 |
2022 |
10,874 |
11,782 |
11,162 |
2022 |
10,375 |
11,091 |
10,661 |
2022 |
10,207 |
10,868 |
10,471 |
2022 |
9,965 |
10,641 |
10,220 |
2023 |
9,962 |
10,637 |
10,213 |
2023 |
10,112 |
10,854 |
10,384 |
2023 |
9,993 |
10,738 |
10,280 |
2023 |
9,976 |
10,767 |
10,260 |
2024 |
10,174 |
10,991 |
10,466 |
2024 |
10,175 |
10,995 |
10,475 |
2024 |
10,681 |
11,522 |
11,000 |
2024 |
10,632 |
11,507 |
10,955 |
2025 |
10,770 |
11,629 |
11,115 |
2025 |
10,686 |
11,596 |
11,047 |
|
| Average Annual Return [Table Text Block] |
|
1 Year |
5 Years |
10 Years |
GNMA Fund (Investor Class) |
5.02% |
-1.14% |
0.67% |
Bloomberg U.S. Aggregate Bond Index (Regulatory Benchmark) |
5.46 |
-0.90 |
1.49 |
Bloomberg U.S. GNMA Index (Strategy Benchmark) |
5.46 |
-0.87 |
1.00 | |
| No Deduction of Taxes [Text Block] |
Neither the fund’s returns nor the index returns reflect the deduction of taxes that a shareholder would pay on fund distributions or redemptions of fund shares.
|
| Updated Performance Information Location [Text Block] |
Updated performance information can be found at www.troweprice.com.
|
| Distribution of Capital [Text Block] |
The fund's total return figures reflect the reinvestment of dividends and capital gains, if any.
|
| AssetsNet |
$ 352,884,000
|
| Holdings Count | Holding |
616
|
| Advisory Fees Paid, Amount |
$ 900,000
|
| InvestmentCompanyPortfolioTurnover |
256.10%
|
| Additional Fund Statistics Significance or Limits [Text Block] |
What are some fund statistics? - Total Net Assets (000s)$352,884
- Number of Portfolio Holdings616
|
| Holdings [Text Block] |
U.S. Government & Agency Mortgage-Backed Securities |
104.1% |
Non-U.S. Government Mortgage-Backed Securities |
3.5 |
Short-Term and Other |
-7.6 | |
| Largest Holdings [Text Block] |
Government National Mortgage Assn. |
92.9% |
Federal National Mortgage Assn. |
6.1 |
Federal Home Loan Mortgage |
4.0 |
OBX Trust |
1.3 |
Sequoia Mortgage Trust |
0.6 |
RCKT Mortgage Trust |
0.5 |
Tricon American Homes Trust |
0.5 |
Angel Oak Mortgage Trust |
0.3 |
Finance of America HECM Buyout |
0.2 |
Morgan Stanley Residential Mortgage Loan Trust |
0.2 | |
| Material Fund Change [Text Block] |
|
| Updated Prospectus Web Address |
www.troweprice.com/paperless
|
| C000190558 |
|
| Shareholder Report [Line Items] |
|
| Fund Name |
GNMA Fund
|
| Class Name |
I Class
|
| Trading Symbol |
PRXAX
|
| Annual or Semi-Annual Statement [Text Block] |
This annual shareholder report contains important information about GNMA Fund (the "fund") for the period of June 1, 2024 to May 31, 2025. You can find the fund’s prospectus, financial information on Form N‑CSR (which includes required tax information for dividends), holdings, proxy voting information, and other information atwww.troweprice.com/prospectus. You can also request this information without charge by contacting T. Rowe Price at 1‑800‑638‑5660 or info@troweprice.com or contacting your intermediary.
|
| Shareholder Report Annual or Semi-Annual |
Annual Shareholder Report
|
| Additional Information [Text Block] |
You can find the fund’s prospectus, financial information on Form N‑CSR (which includes required tax information for dividends), holdings, proxy voting information, and other information atwww.troweprice.com/prospectus. You can also request this information without charge by contacting T. Rowe Price at 1‑800‑638‑5660 or info@troweprice.com or contacting your intermediary.
|
| Material Fund Change Notice [Text Block] |
|
| Additional Information Phone Number |
1‑800‑638‑5660
|
| Additional Information Email |
<span style="box-sizing: border-box; color: rgb(0, 0, 0); display: inline; flex-wrap: nowrap; font-size: 13.3333px; font-weight: 400; grid-area: auto; line-height: 17.3333px; margin: 0px; overflow: visible; text-align: justify; text-align-last: left; white-space-collapse: preserve-breaks;">info@troweprice.com</span>
|
| Additional Information Website |
www.troweprice.com/prospectus
|
| Expenses [Text Block] |
What were the fund costs for the last year? (based on a hypothetical $10,000 investment)
|
Costs of a $10,000 investment |
Costs paid as a percentage of a $10,000 investment |
GNMA Fund - I Class |
$42 |
0.41% | |
| Expenses Paid, Amount |
$ 42
|
| Expense Ratio, Percent |
0.41%
|
| Factors Affecting Performance [Text Block] |
What drove fund performance during the past 12 months?Fixed income securities produced generally positive returns during the reporting period as the Federal Reserve began cutting interest rates and yields fell across most of the Treasury yield curve. Mortgage-backed securities, including GNMAs, produced positive returns and outperformed Treasuries. The yield generated by the fund’s cash holdings, which serve as collateral for our to-be-announced (TBA) positions, contributed to relative performance versus the style-specific Bloomberg U.S. GNMA Index. Relative results were also aided by an allocation to interest-only collateralized mortgage obligation positions, which benefited from higher mortgage rates that caused principal prepayments to slow, thereby sustaining interest payments. The fund’s use of TBA positions detracted from results versus the style-specific benchmark as these instruments generally underperformed cash bonds that offered more stable cash flows. The fund seeks high current income consistent with high overall credit quality and moderate price fluctuation by investing primarily in GNMA mortgage-backed securities and investments linked to these securities. At period-end, we were favoring GNMAs with higher coupons due to their potential to benefit from falling interest rate volatility.
|
| Performance Past Does Not Indicate Future [Text] |
The fund’s past performance is not a good predictor of the fund’s future performance.
|
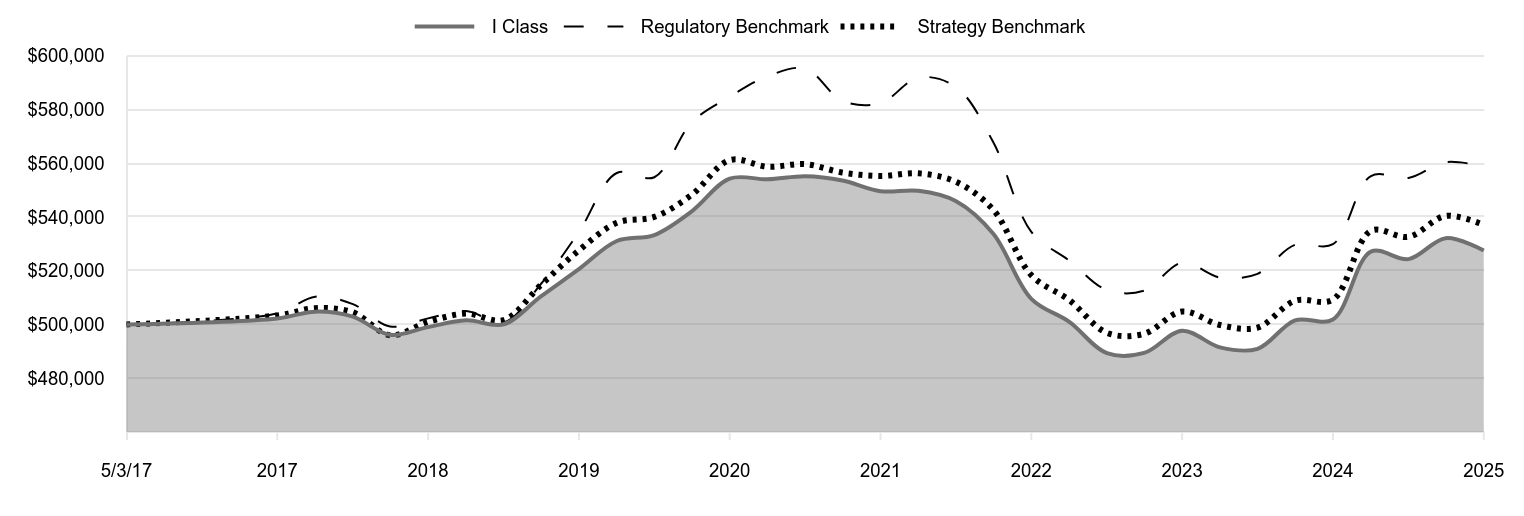
| Line Graph [Table Text Block] |
|
I Class |
Regulatory Benchmark |
Strategy Benchmark |
5/3/17 |
500,000 |
500,000 |
500,000 |
5/31/17 |
502,250 |
504,163 |
503,360 |
8/31/17 |
504,781 |
510,360 |
506,074 |
11/30/17 |
502,904 |
507,571 |
504,535 |
2/28/18 |
496,146 |
499,250 |
496,035 |
5/31/18 |
499,019 |
502,274 |
500,957 |
8/31/18 |
501,555 |
505,004 |
504,047 |
11/30/18 |
500,087 |
500,759 |
501,671 |
2/28/19 |
510,453 |
515,075 |
514,716 |
5/31/19 |
520,594 |
534,421 |
527,570 |
8/31/19 |
531,065 |
556,375 |
537,831 |
11/30/19 |
533,283 |
554,796 |
540,024 |
2/29/20 |
542,127 |
575,250 |
548,283 |
5/31/20 |
554,288 |
584,740 |
561,155 |
8/31/20 |
554,009 |
592,392 |
558,690 |
11/30/20 |
555,160 |
595,207 |
559,666 |
2/28/21 |
553,576 |
583,208 |
556,514 |
5/31/21 |
549,602 |
582,372 |
555,270 |
8/31/21 |
549,736 |
591,892 |
556,241 |
11/30/21 |
545,877 |
588,342 |
553,042 |
2/28/22 |
533,741 |
567,787 |
542,689 |
5/31/22 |
509,559 |
534,490 |
518,345 |
8/31/22 |
500,975 |
523,730 |
509,080 |
11/30/22 |
489,315 |
512,801 |
496,885 |
2/28/23 |
489,427 |
512,588 |
496,555 |
5/31/23 |
497,707 |
523,036 |
504,839 |
8/31/23 |
491,494 |
517,481 |
499,800 |
11/30/23 |
490,930 |
518,851 |
498,835 |
2/29/24 |
501,562 |
529,642 |
508,844 |
5/31/24 |
501,876 |
529,865 |
509,259 |
8/31/24 |
527,136 |
555,240 |
534,830 |
11/30/24 |
524,327 |
554,522 |
532,615 |
2/28/25 |
532,111 |
560,405 |
540,422 |
5/31/25 |
527,546 |
558,790 |
537,071 |
|
| Average Annual Return [Table Text Block] |
|
1 Year |
5 Years |
Since Inception 5/3/17 |
GNMA Fund (I Class) |
5.11% |
-0.98% |
0.67% |
Bloomberg U.S. Aggregate Bond Index (Regulatory Benchmark) |
5.46 |
-0.90 |
1.39 |
Bloomberg U.S. GNMA Index (Strategy Benchmark) |
5.46 |
-0.87 |
0.89 | |
| Performance Inception Date |
May 03, 2017
|
| No Deduction of Taxes [Text Block] |
Neither the fund’s returns nor the index returns reflect the deduction of taxes that a shareholder would pay on fund distributions or redemptions of fund shares.
|
| Updated Performance Information Location [Text Block] |
Updated performance information can be found at www.troweprice.com.
|
| Distribution of Capital [Text Block] |
The fund's total return figures reflect the reinvestment of dividends and capital gains, if any.
|
| AssetsNet |
$ 352,884,000
|
| Holdings Count | Holding |
616
|
| Advisory Fees Paid, Amount |
$ 900,000
|
| InvestmentCompanyPortfolioTurnover |
256.10%
|
| Additional Fund Statistics Significance or Limits [Text Block] |
What are some fund statistics? - Total Net Assets (000s)$352,884
- Number of Portfolio Holdings616
|
| Holdings [Text Block] |
U.S. Government & Agency Mortgage-Backed Securities |
104.1% |
Non-U.S. Government Mortgage-Backed Securities |
3.5 |
Short-Term and Other |
-7.6 | |
| Largest Holdings [Text Block] |
Government National Mortgage Assn. |
92.9% |
Federal National Mortgage Assn. |
6.1 |
Federal Home Loan Mortgage |
4.0 |
OBX Trust |
1.3 |
Sequoia Mortgage Trust |
0.6 |
RCKT Mortgage Trust |
0.5 |
Tricon American Homes Trust |
0.5 |
Angel Oak Mortgage Trust |
0.3 |
Finance of America HECM Buyout |
0.2 |
Morgan Stanley Residential Mortgage Loan Trust |
0.2 | |
| Material Fund Change [Text Block] |
|
| Updated Prospectus Web Address |
www.troweprice.com/paperless
|