Exhibit 99.2
EARNINGS PRESENTATION SECOND QUARTER 2025 NASDAQ: USCB USBC FINANCIAL HOLDINGS
FORWARD-LOOKING STATEMENTS This presentation may contain statements that are not historical in nature and are intended to be, and are hereby identified as, forward-looking statements for purposes of the safe harbor provided by Section 21E of the Securities Exchange Act of 1934, as amended. Forward-looking statements are those that are not historical facts. The words “may,” “will,” “anticipate,” “could,” “ should,” “would,” “believe,” “contemplate,” “expect,” “aim,” “plan,” “estimate,” “continue,” “seek,” and “intend,” the negative of these terms, as well as other similar words and expressions of the future, are intended to identify forward-looking statements. These forward-looking statements include, but are not limited to, statements related to our projected growth, anticipated future financial performance, and management’s long-term performance goals, as well as statements relating to the anticipated effects on our results of operations and financial condition from expected or potential developments or events, or business and growth strategies, including anticipated internal growth and balance sheet restructuring. These forward-looking statements involve significant risks and uncertainties that could cause our actual results to differ materially from those anticipated in such statements. Potential risks and uncertainties include, but are not limited to: the strength of the United States economy in general and the strength of the local economies in which we conduct operations; our ability to successfully manage interest rate risk, credit risk, liquidity risk, and other risks inherent to our industry; the accuracy of our financial statement estimates and assumptions, including the estimates used for our allowance for credit losses and deferred tax asset valuation allowance; the efficiency and effectiveness of our internal control procedures and processes; our ability to comply with the extensive laws and
regulations to which we are subject, including the laws for each jurisdiction where we operate; adverse changes or conditions in the capi tal and financial markets, including actual or potential stresses in the banking industry; deposit attrition and the level of our uninsured deposits; legislative or regulatory changes and changes in accounting principles, policies, practices or guidelines, including the on-going effects of the implementation of the Current Expected Credit Losses (“CECL”) standard; the lack of a significantly diversified loan portfolio and our concentration in the South Florida market, including the risks of geographic, depositor, and industry concentrations, including our concentration in loans secured by real estate, in particular, commercial real estate; the effects of climate change; the concentration of ownership of our common stock; fluctuations in the price of our common stock; our ability to fund or access the capital markets at attractive rates and terms and manage our growth, both organic growth as well as growth through other means, such as future acquisitions; inflation, interest rate, unemployment rate, and market and monetary fluctuations; the effects of potential new or increased tariffs and trade restrictions; the impact of international hostilities and geopolitical events; increased competition and its effect on the pricing of our products and services as well as our net interest rate spread and net interest margin; the loss of key employees; the effectiveness of our risk management strategies, including operational risks, including, but not limited to, client, employee, or third-party fraud and security breaches; and other risks described in this presentation and other filings we make with the Securities and Exchange Commission (“SEC”). All forward -looking statements are necessarily only estimates of future results, and there can be no assurance that actual results will not differ materially from
expectations. Therefore, you are cautioned not to place undue reliance on any forward-looking statements. Further, forward-looking statements included in this presentation are made only as of the date hereof, and we undertake no obligation to update or revise any forward -looking statements to reflect events or circumstances occurring after the date on which the statements are made or to reflect the occurrence of unanticipated events, unless required to do so under the federal securities laws. You should also review the risk factors described in the reports USCB Financial Holdings, Inc. filed or will file with the SEC. Non-GAAP Financial Measures This presentation includes financial information determined by methods other than in accordance with generally accepted accounting principles (“GAAP”). This financial information includes certain operating performance measures. Management has included these non-GAAP financial measures because it believes these measures may provide useful supplemental information for evaluating the Company’s expectations and underlying performance trends. Further, management uses these measures in managing and evaluating the Company’s business and intends to refer to them in discussions about our operations and performance. Operating performance measures should be viewed in addition to, and not as an alternative to or substitute for, measures determined in accordance with GAAP, and are not necessarily comparable to non-GAAP measures that may be presented by other companies. Reconciliations of these non-GAAP measures to the most directly comparable GAAP measures can be found in the Non-GAAP financial measures reconciliation tables included in this presentation. All numbers included in this presentation are unaudited unless otherwise noted. 2
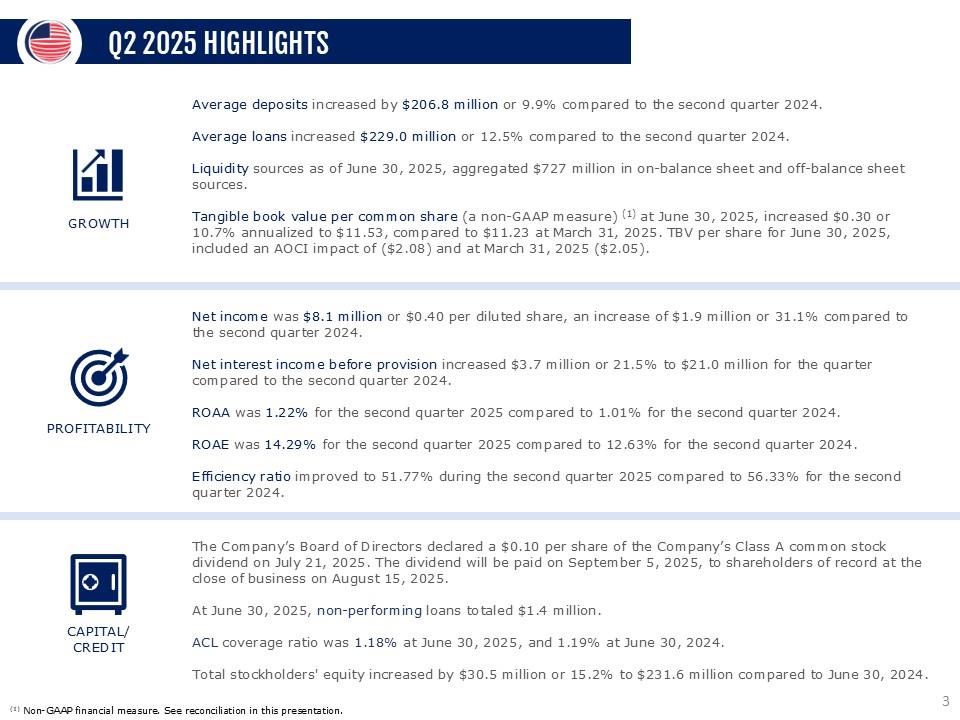
Q2 2025 HIGHLIGHTS GROWTH Average deposits increased by $206.8 million or 9.9% compared to the second quarter 2024. Average loans increased $229.0 million or 12.5% compared to the second quarter 2024. Liquidity sources as of June 30, 2025, aggregated $727 million in on-balance sheet and off-balance sheet sources. Tangible book value per common share (a non-GAAP measure) (1) at June 30, 2025, increased $0.30 or 10.7% annualized to $11.53, compared to $11.23 at March 31, 2025. TBV per share for June 30, 2025, included an AOCI impact of ($2.08) and at March 31, 2025 ($2.05). PROFITABILITY Net income was $8.1 million or $0.40 per diluted share, an increase of $1.9 million or 31.1% compared to the second quarter 2024. Net interest income before provision increase d $3.7 million or 21.5% to $21.0 million for the quarter compared to the second quarter 2024. ROAA was 1.22% for the second quarter 2025 compared to 1.01% for the second quarter 2024. ROAE was 14.29% for the second quarter 2025 compared to 12.63% for the second quarter 2024. Efficiency ratio improved to 51.77% during the second quarter 2025 compared to 56.33% for the second quarter 2024. CAPITAL/CREDIT The Company’s Board of Directors declared a $0.10 per share of the Company’s Class A common stock dividend on July 21, 2025. The dividend will be paid on September 5, 2025, to shareholders of record at the close of business on Augus t 15, 2025. At June 30, 2025, non-performing loans totaled $1.4 million. ACL coverage ratio was 1.18% at June 30, 2025, and 1.19% at June 30, 2024. Total stockholders' equity increased by $30.5 million or 15.2% to $231.6 million compared to June 30, 2024. (1) Non-GAAP financial measure. See reconciliation in this presentation. 3
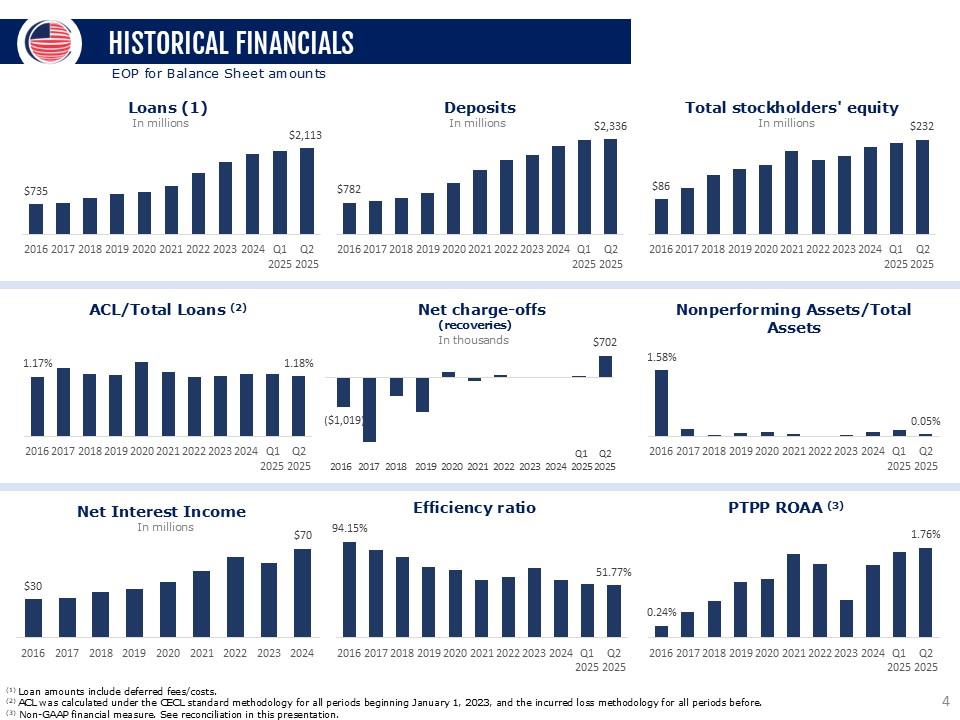
HISTORICAL FINANCIALS EOP for Balance Sheet amounts Loans In millions $735 $2,113 2016 2017 2018 2019 2020 2021 2022 2023 2024 Q1 Q2 2025 2025 Deposits In millions $782 $2,336 2016 2017 2018 2019 2020 2021 2022 2023 2024 Q1 Q2 2025 2025 Total stockholder’s equity In millions $86 $232 2016 2017 2018 2019 2020 2021 2022 2023 2024 Q1 Q2 2025 2025 ACL/Total Lonas 1.17% 1.18% 2016 2017 2018 2019 2020 2021 2022 2023 2024 Q1 Q2 2025 2025 Net charge-offs (recoveries) In millions ($1,019) $702 2016 2017 2018 2019 2020 2021 2022 2023 2024 Q1 Q2 2025 2025 Nonperforming Assets/Total Assets 1.58% 0.05% 2016 2017 2018 2019 2020 2021 2022 2023 2024 Q1 Q2 2025 2025 Net Interest Income In millions $30 $70 2016 2017 2018 2019 2020 2021 2022 2023 2024 Q1 Q2 2025 2025 Efficiency ratio 94.15% 51.77% 2016 2017 2018 2019 2020 2021 2022 2023 2024 Q1 Q2 2025 2025 PTPP ROAA 0.24% 1.76% 2016 2017 2018 2019 2020 2021 2022 2023 2024 Q1 Q2 2025 2025 (1) Loan amounts include deferred fees/costs. (2) ACL was calculated under the CECL standard methodology for all periods beginning January 1, 2023, and the incurred loss methodology for all periods before. (3) Non-GAAP financial measure. See reconciliation in this presentation. 4
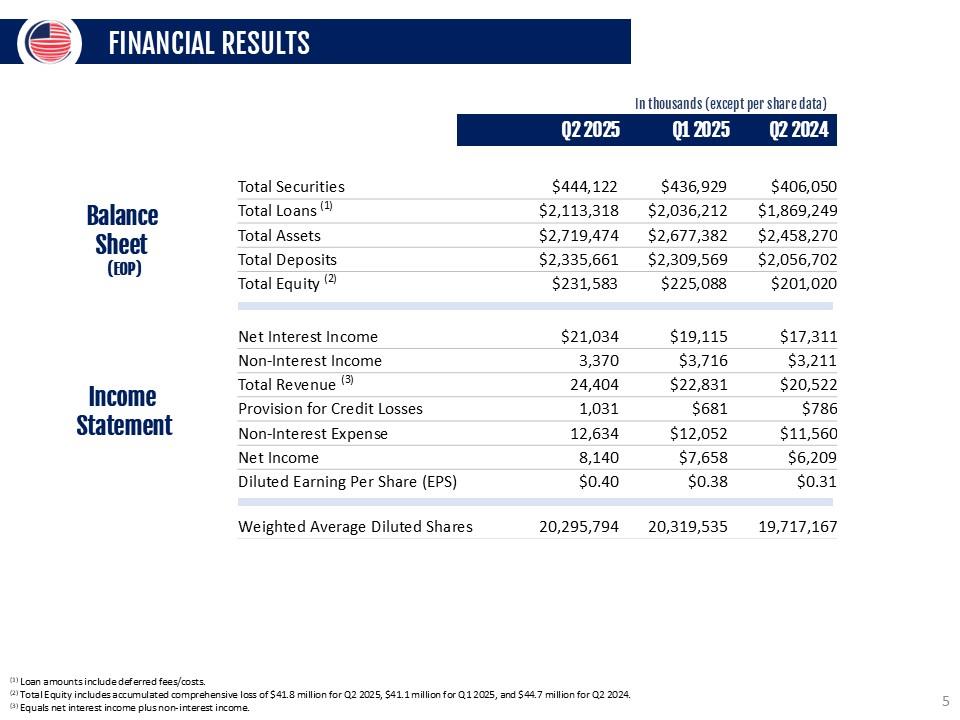
FINANCIAL RESULTS In thousands (except per share date) Q2 2025 Q1 2025 Q2 2024 Balance Sheet (EOP) Total Securities $444,122 $436,929 $406,050 Total Loans (1) $2,113,318 $2,036,212 $1,869,249 Total Assets $2,719,474 $2,677,382 $2,458,270 Total Deposits $2,335,661 $2,309,569 $2,056,702 Total Equity (2) $231,583 $225,088 $201,020 Income Statement Net Interest Income $21,034 $19,115 $17,311 Non-Interest Income 3,370 $3,716 $3,211 Total Revenue (3) 24,404 $22,831 $20,522 Provision for Credit Losses 1,031 $681 $786 Non-Interest Expense 12,634 $12,052 $11,560 Net Income 8,140 $7,658 $6,209 Diluted Earning Per Share (EPS) $0.40 $0.38 $0.31 Weighted Average Diluted Shares 20,295,794 20,319,535 19,717,167 (1) Loan amounts include deferred fees/costs. (2) Total Equity includes accumulated comprehensive loss of $41.8 million for Q2 2025, $41.1 million for Q1 2025, and $44.7 million for Q2 2024. (3) Equals net interest income plus non -interest income. 5
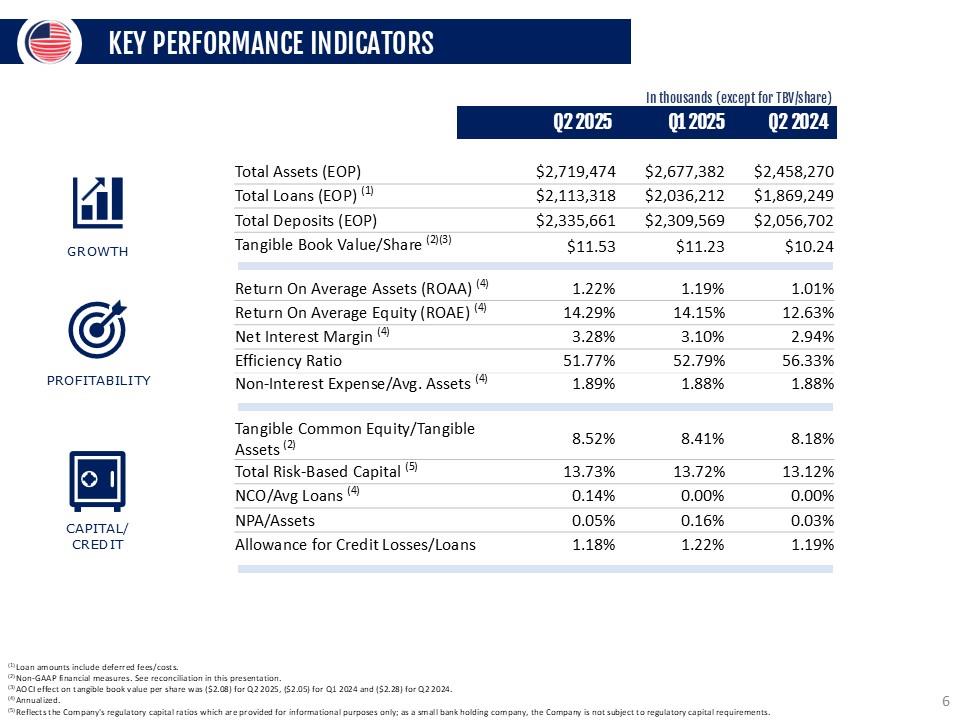
KEY PERFORMANCE INDICATORS In thousands (except for TBV/share) Q2 2025 Q1 2025 Q2 2024 GROWTH PROFITABILITY CAPITAL/CREDIT Total Assets (EOP) $2,719,474 $2,677,382 $2,458,270 Total Loans (EOP) (1) $2,113,318 $2,036,212 $1,869,249 Total Deposits (EOP) $2,335,661 $2,309,569 $2,056,702 Tangible Book Value/Share (2)(3) $11.53 $11.23 $10.24 Return On Average Assets (ROAA) (4) 1.22% 1.19% 1.01% Return On Average Equity (ROAE) (4) 14.29% 14.15% 12.63% Net Interest Margin (4) 3.28% 3.10% 2.94% Efficiency Ratio 51.77% 52.79% 56.33% Non-Interest Expense/Avg. Assets (4) 1.89% 1.88% 1.88% Tangible Common Equity/Tangible Assets (2) 8.52% 8.41% 8.18% Total Risk-Based Capital (5) 13.73% 13.72% 13.12% NCO/Avg Loans (4) 0.14% 0.00% 0.00% NPA/Assets 0.05% 0.16% 0.03% Allowance for Credit Losses/Loans 1.18% 1.22% 1.19% (1) Loan amounts include deferred fees/costs. (2) Non-GAAP financial measures. See reconciliation in this presentation. (3) AOCI effect on tangible book value per share was ($2.08) for Q2 2025, ($2.05) for Q1 2024 and ($2.28) for Q2 2024. (4) Annualized. (5) Reflects the Company's regulatory capital ratios which are provided for informational purposes only; as a small bank holding company, the Company is not subject to regulatory capital requirements. 6
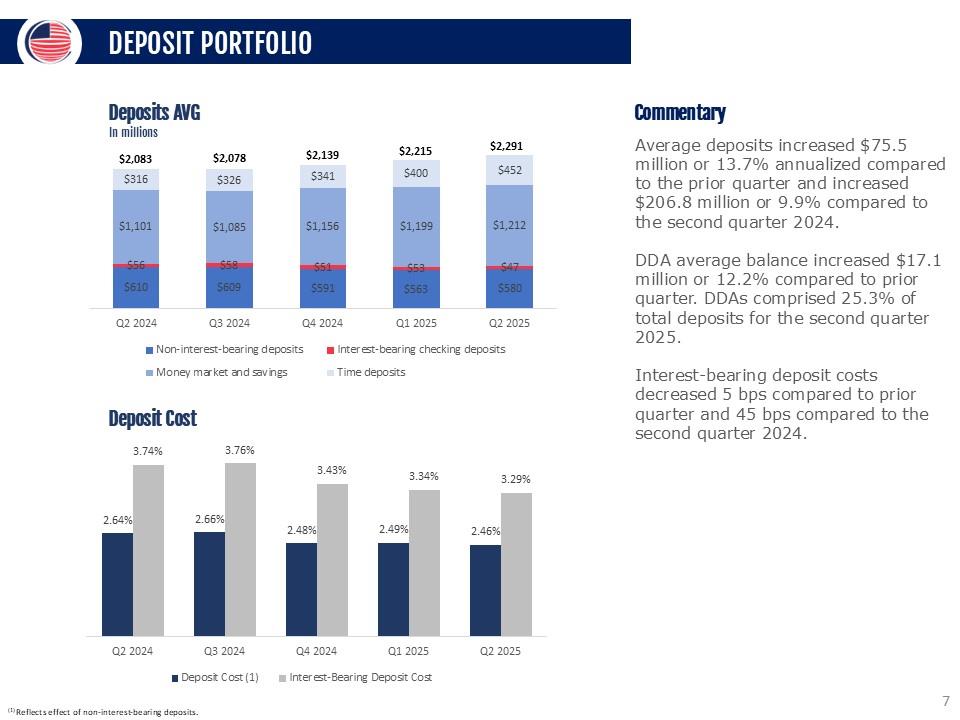
DEPOSIT PORTFOLIO Deposits AVG In millions $2,083 $2,078 $2,139 $2,215 $2,291 $316 $326 $341 $400 $452 $1,101 $1,085 $1,156 $1,199 $1,212 $56 $58 $51 $53 $47 $610 $690 $591 $563 $580 Q2 2024 Q3 2024 Q4 2024 Q1 2025 Q2 2025 Q2 Q3 Q4 Q1 Q2 Non-interest-bearing deposits Interest-bearing checking deposits Money market and savings Time deposits Deposit Cost 2.64% 33.74% 2.66% 3.76% 2.48% 3.43% 2.49% 3.34% 2.46% 3.29% Q2 2024 Q3 2024 Q4 2024 Q1 2025 Q2 2025 Q2 Q3 Q4 Q1 Q2 Deposit Cost Interest-Bearing Deposit cost Commentary Average deposits increased $75.5 million or 13.7% annualized compared to the prior quarter and increased $206.8 million or 9.9% compared to the second quarter 2024. DDA average balance increased $17.1 million or 12.2% compared to prior quarter. DDAs comprised 25.3% of total deposits for the second quarter 2025. Interest-bearing deposit costs decreased 5 bps compared to prior quarter and 45 bps compared to the second quarter 2024. (1) Reflects effect of non-interest-bearing deposits. 7
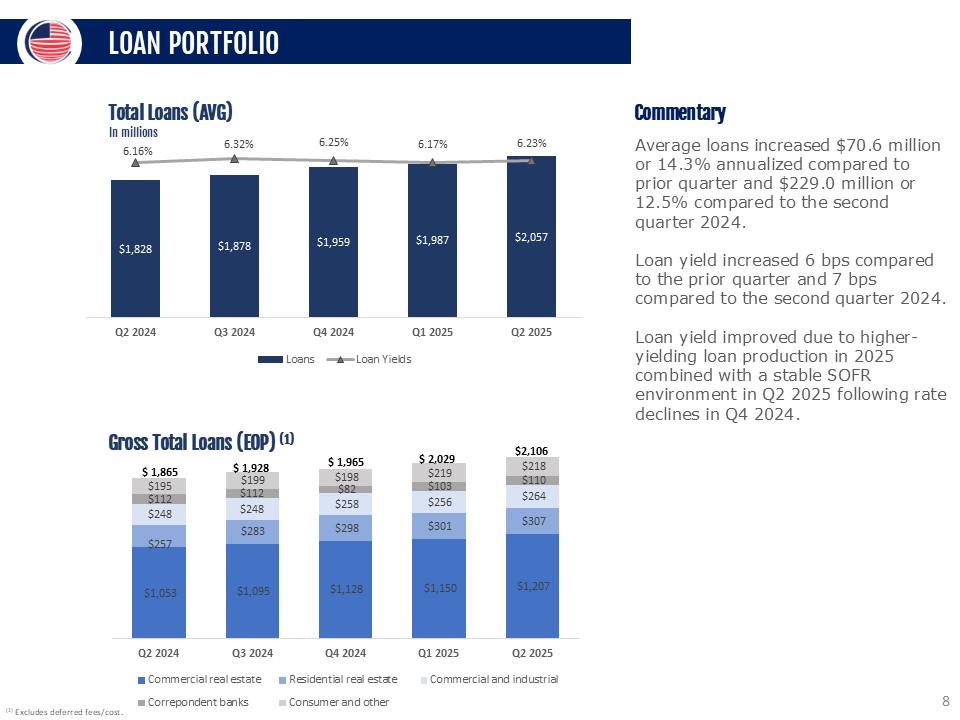
LOAN PORTFOLIO Total Loans (AVG) In millions 6.16% 6.32% 6.25% 6.17% 6.23% $1,828 $1,878 $1,959 $1,987 $2,057 Q2 2024 Q3 2024 Q4 2024 Q1 2025 Q2 2025 Loans Loan Yields Gross Total Loans (EOP) (1) $1,865 $1,928 $1,965 $2,029 $2,106 $195 $199 $198 $219 $218 $248 $248 $258 $256 $264 $257 $283 $298 $301 $307 $1,053 $1,095 $1,128 $1,150 $1,207 Q2 2024 Q3 2024 Q4 2024 Q1 2025 Q2 2025 Commercial real estate Residential real estate commercial real estate Correspondent banks Consumer and other Commentary Average loans increased $70.6 million or 14.3% annualized compared to prior quarter and $229.0 million or 12.5% compared to the second quarter 2024. Loan yield increased 6 bps compared to the prior quarter and 7 bps compared to the second quarter 2024. Loan yield improved due to higher-yielding loan production in 2025 combined with a stable SOFR environment in Q2 2025 following rate declines in Q4 2024. (1) Excludes deferre d fees/cost. 8
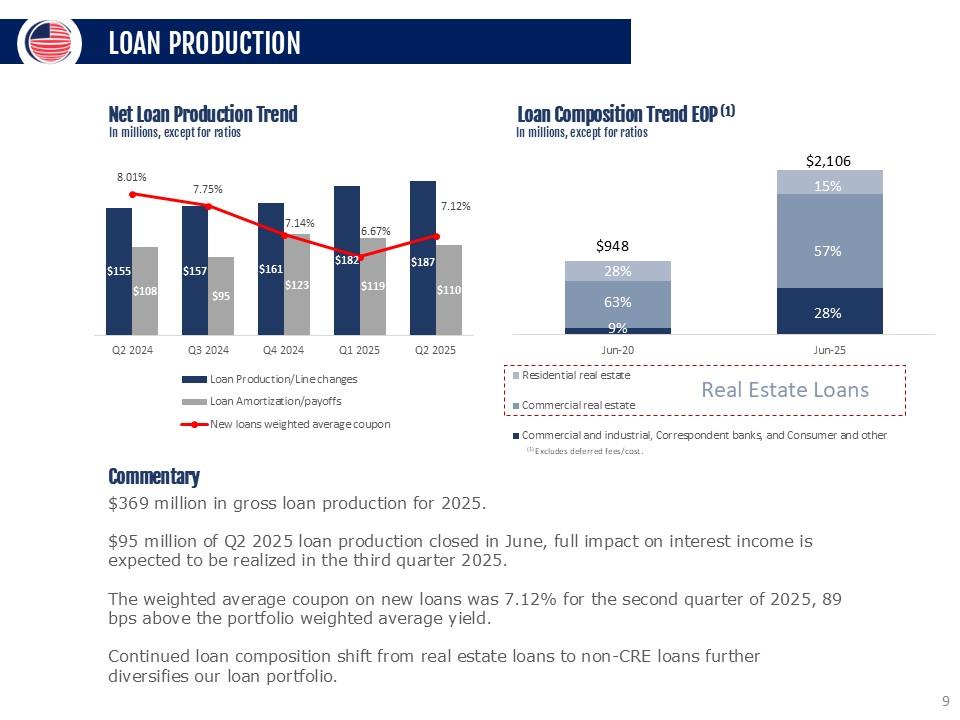
LOAN PRODUCTION Net Loan Production Trend In millions, except for ratios 8.01% 7.75% 7.14% 6.67% 7.12% $155 $108 $157 $95 $161 $123 $182 $119 $187 $110 Q2 2024 Q3 2024 Q4 2024 Q1 2025 Q2 2025 Loan Production/line changes Loan Amortiz ation/payoffs New loans weighted average coupon $948 $2,106 28% 15% 63% 57% $9 $28 Jun-20 Jun-25 Loan Composition Trend EOP (1) In millions, except for ratios Residential real estate Commercial real estate Real Estate Loans Commercial and industrial, corre spondent banks, and Consumer and other (1) Excludes deferred fees/cost. Commentary $369 million in gross loan production for 2025. $95 million of Q2 2025 loan production closed in June, full impact on interest income is expected to be realized in the third quarter 2025. The weighted average coupon on new loans was 7.12% for the second quarter of 2025, 89 bps above the portfolio weighted average yield. Continued loan composition shift from real estate loans to non-CRE loans further diversifies our loan portfolio. 9
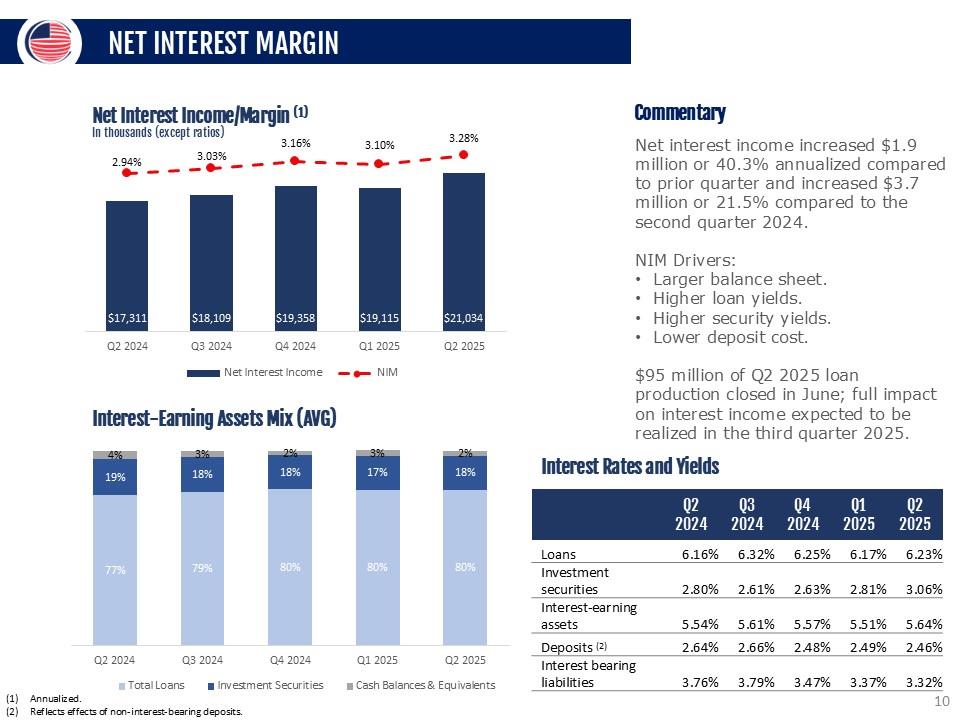
NET INTEREST MARGIN Net Interest Income/Margin (1) In thousands (except ratios) 2.94% 3.03% 3.16% 3.10% 3.28% $17,311 $18,109 $19,358 $19,115 $21,034 Q2 2024 Q3 2024 Q4 2024 Q1 2025 Q2 2025 Net Interest Income NIM 4% 3% 2% 3% 2% 19% 18% 18% 17% 18% 77% 79% 80% 80% 80% Q2 2024 Q3 2024 Q4 2024 Q1 2025 Q2 2025 Interest-Earning Assets Mix (AVG) Total Loans Investment Securities Cash Balances & Equivalents Commentary Net interest income increased $1.9 million or 40.3% annualized compared to prior quarter and increased $3.7 million or 21.5% compared to the second quarter 2024. NIM Drivers: Larger balance sheet. Higher loan yields. Higher security yields. Lower deposit cost. $95 million of Q2 2025 loan production closed in June; full impact on interest income expected to be realized in the third quarter 2025. Interest Rates and Yields Q2 2024 Q3 2024 Q4 2024 Q1 2025 Q2 2025 Loans 6.16% 6.32% 6.25% 6.17% 6.23% Investment securities 2.80% 2.61% 2.63% 2.81% 3.06% Interest-earning assets 5.54% 5.61% 5.57% 5.51% 5.64% Deposits (2) 2.64% 2.66% 2.48% 2.49% 2.46% Interest bearing liabilities 3.76% 3.79% 3.47% 3.37% 3.32% Annualized. Reflects effects of non-interest-bearing deposits. 10
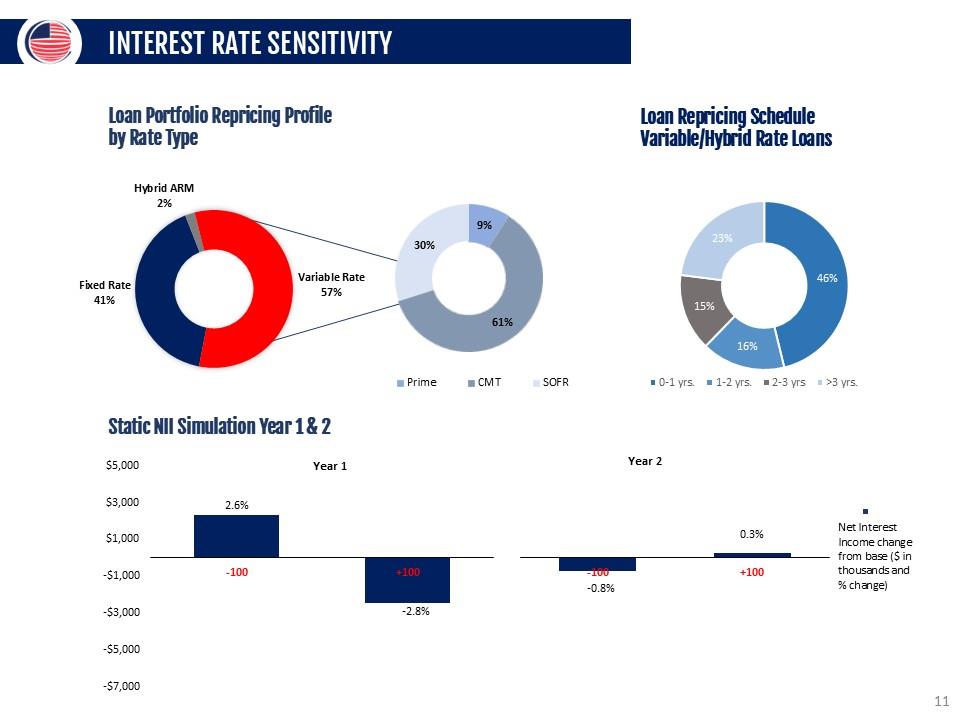
INTEREST RATE SENSITIVITY Loan Portfolio Profile By Rate Type Hybrid Arm 2% Fixed Rate 41% Variable Rate57% 30% 9% 61%
Prime CMT SOFR Loan Repricing Schedule Variable/Hybrid Rate Loans 23% 46% 16% 15% 0-1 yrs. 1-2 yrs. 2-3 yrs. >3 yrs. Static NII Simulation year 1&2 2.6% -100 +100 -2.8% -100 -0.8% 0.3% +100 Net interest income charge from base ($ in thousands and % change) 11
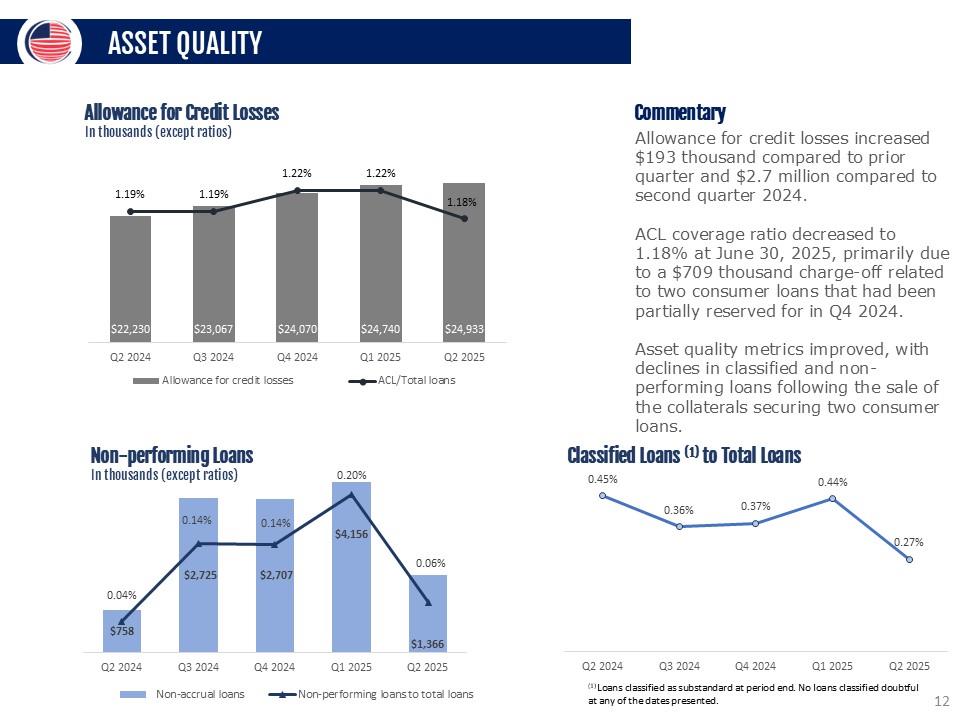
ASSET QUALITY Allowance for Credit Losses In thousands (except ratios) 1.19% 1.19% 1.22% 1.22% 1.18% $22,230 $23,067 $24,070 $24,740 $24,933 Q2 2024 Q3 2024 Q4 2024 Q1 2025 Q2 2025 Allowance for credit losses ACL/Total Loans Non-performing Loans In thousands (except ratios) 0.04% 0.14% 0.14% 0.20% 0.06% $758 $2,725 $2,707 $4,156 $1,366 Q2 2024 Q3 2024 Q4 2024 Q1 2025 Q2 2025 Non-accrual loans Non-performing loans total loans Commentary Allowance for credit losses increased $193 thousand compared to prior quarter and $2.7 million compared to second quarter 2024. ACL coverage ratio decreased to 1.18% at June 30, 2025, primarily due to a $709 thousand charge-off related to two consumer loans that had been partially reserved for in Q4 2024. Asset quality metrics improved, with declines in classified and non-performing loans following the sale of the collaterals securing two consumer loans. Classified Loans (1) to Total Loans 0.45% 0.36% 0.37% 0.44% 0.27% Q2 2024 Q3 2024 Q4 2024 Q1 2025 Q2 2025 (1) Loans classified as substandard at period end. No loans classified doubtful at any of the dates presented. 12
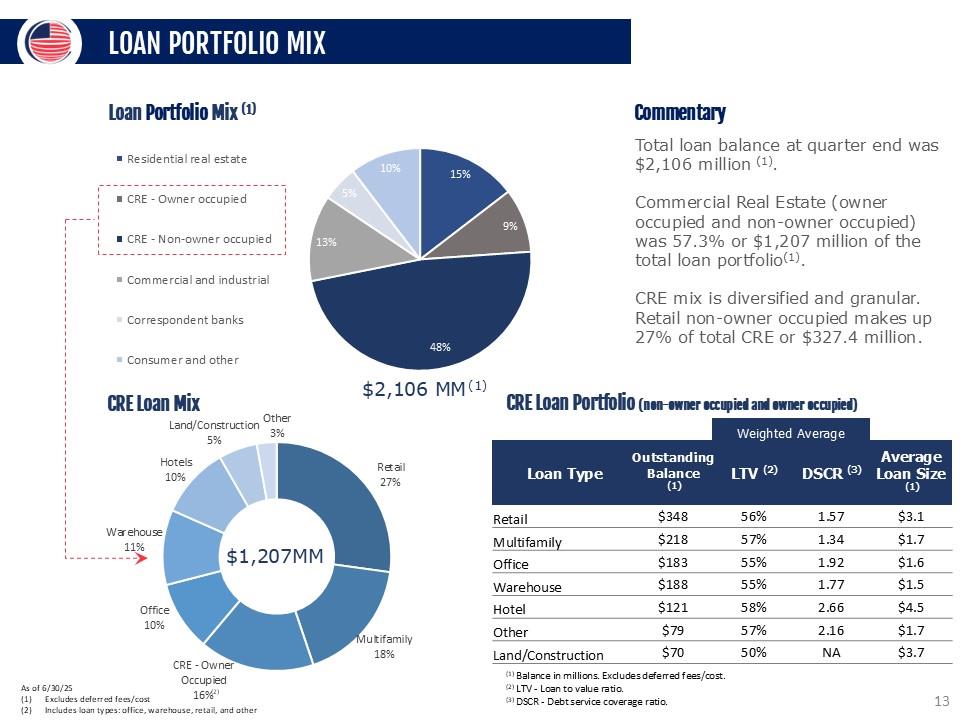
LOAN PORTFOLIO MIX Loan Portfolio Mix (1) Residential real estate CRE - Owner occupied CRE - Non-owner occupied Commercial and industrial Correspondent banks Consumer and other 10% 15% 9% 48% 13% 5% 10% $2,106 MM CRE Loan Mix Land/Construction 5% Other 3% Retail 27% Multifamily 18% CRE-Owner Occupied 16% Office 10% Warehouse 11% Hotels 10% $1,207MM Commentary Total loan balance at quarter end was $2,107 million (1). Commercial Real Estate (owner occupied and non-owner occupied) was 57.3% or $1,206 million of the total loan portfolio(1). CRE mix is diversified and granular. Retail non-owner occupied makes up 27% of total CRE or $327.4 million. CRE Loan Portfolio (non-owner occupied and owner occupied) Weighted Average Loan Type Outstanding Balance (1) LTV (2) DSCR (3) Average Loan Size (1) Retail $348 56% 1.57 $3.1 Multifamily $218 57% 1.34 $1.7 Office $183 55% 1.92 $1.6 Warehouse $188 55% 1.77 $1.5 Hotel $121 58% 2.66 $4.5 Other $79 57% 2.16 $1.7 Land/Construction $70 50% NA $3.7 As of 6/30/25 (1) Excludes deferred fees/cost (2) Includes loan types: office, warehouse, retail, and other (1) Balance in millions. Excludes deferred fees/cost. (2) LTV - Loan to value ratio. (3) DSCR - Debt service coverage ratio. 13
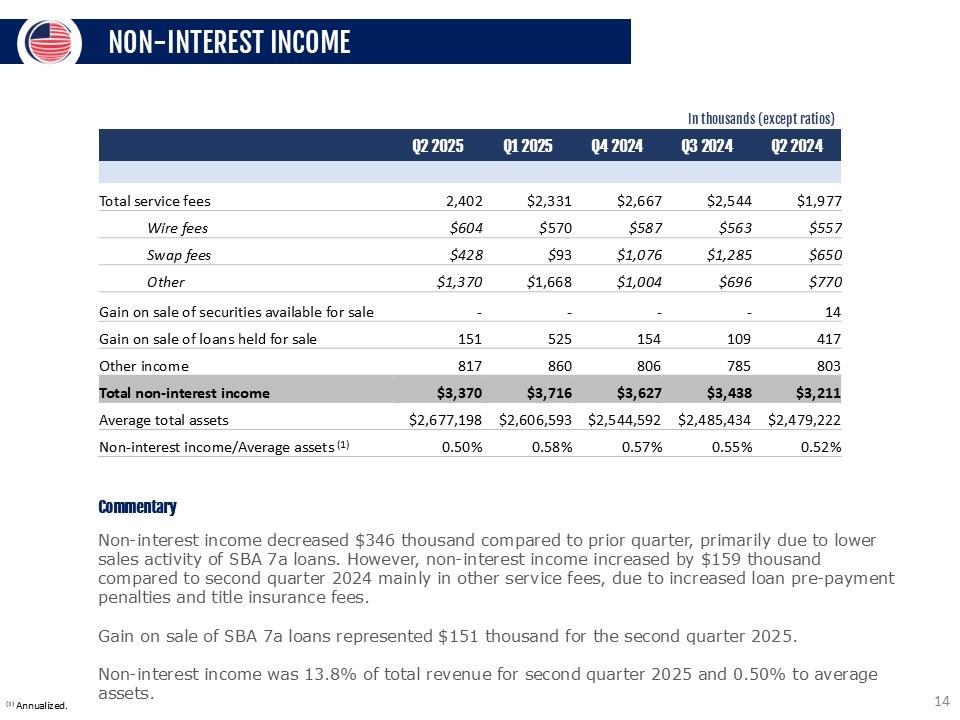
NON-INTEREST INCOME In thousands (except ratios) Q2 2025 Q1 2025 Q4 2024 Q3 2024 Q2 2024 Total service fees 2,402 $2,331 $2,667 $2,544 $1,977 Wire fees $604 $570 $587 $563 $557 Swap fees $428 $93 $1,076 $1,285 $650 Other $1,370 $1,668 $1,004 $696 $770 Gain on sale of securities available for sale - - - - 14 Gain on sale of loans held for sale 151 525 154 109 417 Other income 817 860 806 785 803 Total non-interest income $3,370 $3,716 $3,627 $3,438 $3,211 Average total assets $2,677,198 $2,606,593 $2,544,592 $2,485,434 $2,479,222 Non-interest income/Average assets (1) 0.50% 0.58% 0.57% 0.55% 0.52% Commentary Non-interest income decreased $346 thousand compared to prior quarter, primarily due to lower sales activity of SBA 7a loans. However, non-interest income increased by $159 thousand compared to second quarter 2024 mainly in other service fees, due to increased loan pre-payment penalties and title insurance fees. Gain on sale of SBA 7a loans represented $151 thousand for the second quarter 2025. Non-interest income was 13.8% of total revenue for second quarter 2025 and 0.50% to average assets. (1) Annualized. 14
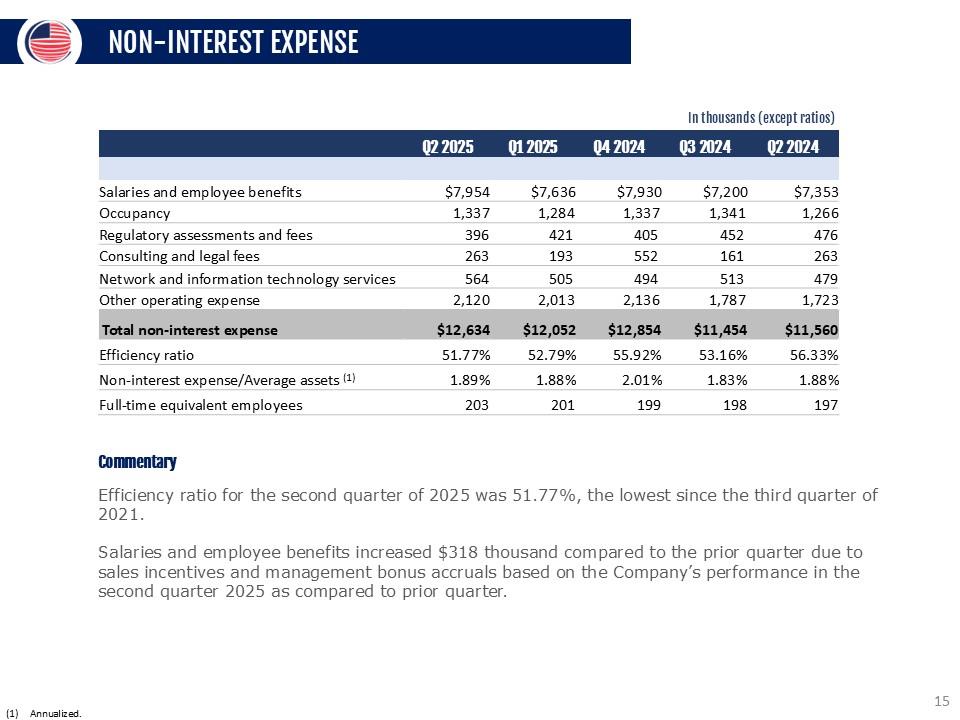
NON-INTEREST EXPENSE In thousands (except ratios) Q2 2025 Q1 2025 Q4 2024 Q3 2024 Q2 2024 Salaries and employee benefits $7,954 $7,636 $7,930 $7,200 $7,353 Occupancy 1,337 1,284 1,337 1,341 1,266 Regulatory assessments and fees 396 421 405 452 476 Consulting and legal fees 263 193 552 161 263 Network and information technology services 564 505 494 513 479 Other operating expense 2,120 2,013 2,136 1,787 1,723 Total non-interest expense $12,634 $12,052 $12,854 $11,454 $11,560 Efficiency ratio 51.77% 52.79% 55.92% 53.16% 56.33% Non-interest expense/Average assets (1) 1.89% 1.88% 2.01% 1.83% 1.88% Full-time equivalent employees 203 201 199 198 197 Commentary Efficiency ratio for the second quarter of 2025 was 51.77%, the lowest since the third quarter of 2021. Salaries and employee benefits increased $318 thousand compared to the prior quarter due to sales incentives and management bonus accruals based on the Company’s performance in the second quarter 2025 as compared to prior quarter. (1) Annualized. 15
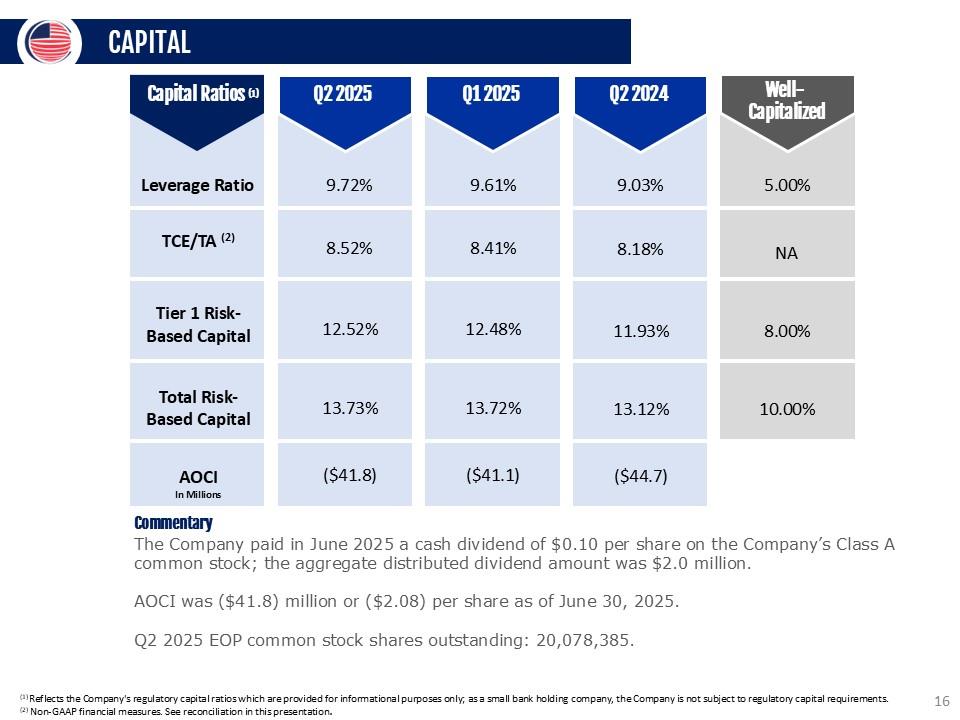
CAPITAL Capital Ratios (1) Leverage Ratio TCE/TA (2) Tier 1 Risk-Based Capital Total Risk-Based Capital AOCI In Millions Q2 2025 9.72% 8.52% 12.52% 13.73% ($41.8 Q1 2025 8.41% 12.48% 13.72% ($41.1 Q2 2024 9.03% 8.18% 11.93% 13.12% ($44.7 Well- Capitalized % NA 8.00% 10.00 Commentary The Company paid in June 2025 a cash dividend of $0.10 per share on the Company’s Class A common stock; the aggregate distributed dividend amount was $2.0 million. AOCI was ($41.8) million or ($2.08) per share as of June 30, 2025. Q2 2025 EOP common stock shares outstanding: 20,078,385. (1) Reflects the Company's regulatory capital ratios which are provided for informational purposes only; as a small bank holding company, the Company is not subject to regulatory capital requirements. (2) Non-GAAP financial measures. See reconciliation in this presentation. 16
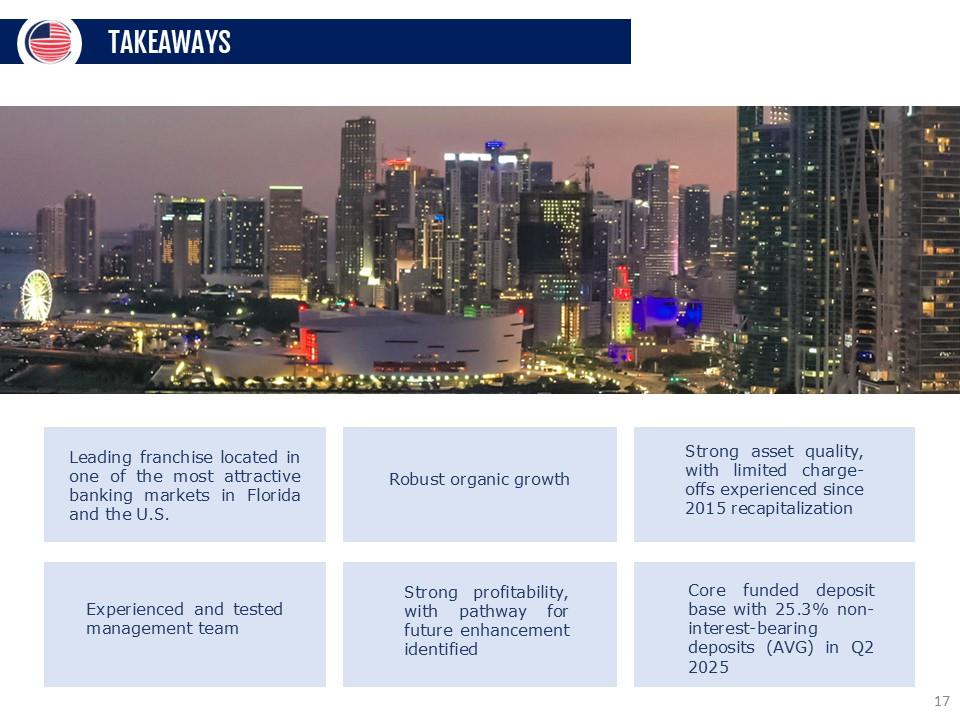
TAKEAWAYS Leading franchise located in one of the most attractive banking markets in Florida and the U.S. Robust organic growth Strong asset quality, with limited charge-offs experienced since 2015 recapitalization Experienced and tested management team Strong profitability, with pathway for future enhancement identified Core funded deposit base with 25.3% non-interest-bearing deposits (AVG) in Q2 2025 17
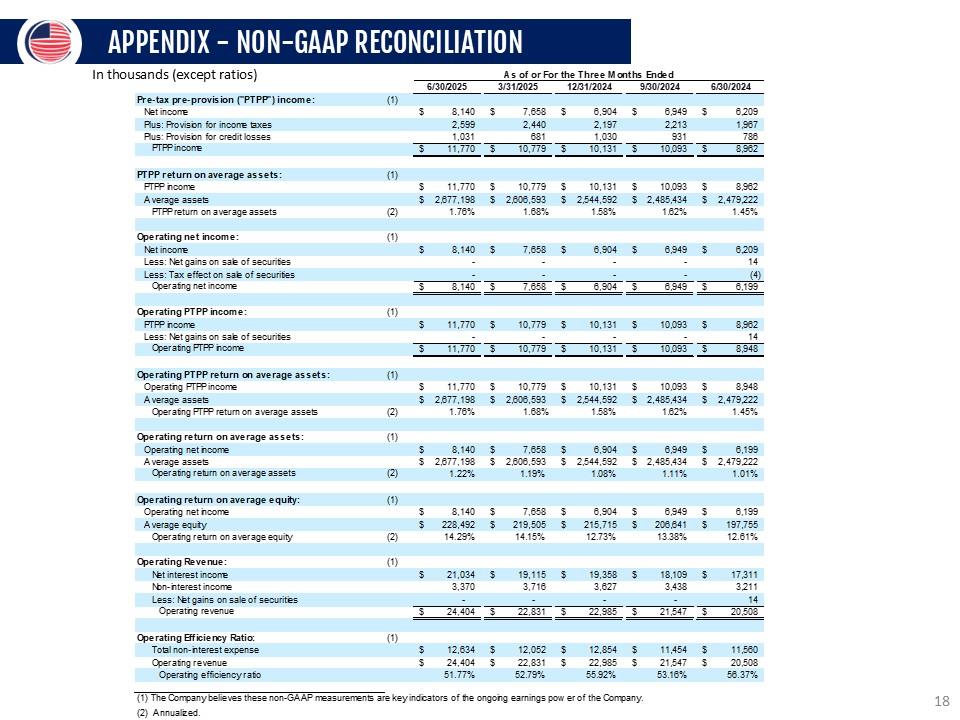
APPENDIX - NON-GAAP RECONCILIATION In thousands (except ratios) As of or For the Three Months Ended 6/30/2025 3/31/2025 12/31/2024 9/30/2024 6/30/2024 Pre-tax pre-provision ("PTPP") income: (1) Net in come s 8,140 s 7,658 s 6,904 s 6,949 s 6,209 Plus: Provision for in come taxes 2,599 2,440 2,197 2,213 1,967 Plus: Provision for credit losses 1,031 681 1,030 931 786 PTPP income s 11,770 s 10,779 s 10,131 s 10,093 s 8,962 PTPP return on average assets: (1) PTPP income s 11,770 s 10,779 s 10,131 s 10,093 s 8,9 62 Average assets S 2,677,198 S 2,606,593 S 2,544,592 S 2,485,434 S 2,479,222 PTPP return on average assets (2) 1.76% 1.68% 1.58% 1.62% 1.45% Operating net income: (1) Net in come s 8,140 s 7,658 s 6,904 s 6,949 s 6,209 Less: Net gains on sale of securities - - - - 14 Less: Tax effect on sale of securities - - - - (4) Operating net income S 8,140 S 7,658 S 6,904 S 6,949 S 6,199 Operating PTPP income: (1) PTPP income 1 c c c • 74 ran g An pels A c c- q q rrr 1. c s 11,770 s 10,779 s 10,131 s 10,093 s 8,962 1 A -S3. Ne- 9al13 01 Sale CI securities Operating PTPP income S 11,770 S 10,779 s 10,131 S 10,093 S 1 4 8,948 Operating PTPP return on average assets: (1) Operating PTPP income s 11,770 s 10,779 s 10,131 s 10,093 s 8,948 Average assets S 2,677,198 S 2,606,593 S 2,544,592 S 2,485,434 S 2,479,222 Operating PTPP return on average assets (2) 1.76% 1.68% 1.58% 1.62% 1.45% Operating return on average assets: (1) Operating net in come s 8,140 s 7,658 $ 6,904 s 6,949 s 6,199 Average assets S 2,677,198 S 2,606,593 S 2,544,592 s 2,485,434 S 2,479,222 Operating return on average assets (2) 1.22% 1.19% 1.08% 1.11% 1.01% Operating return on average equity: (1) Operating net in come S 8,140 S 7,658 S 6,90 4 S 6,949 S 6,199 Average equity S 228,492 S 219,505 S 21 5,715 S 206,641 S 197,755 Operatinq return on averaqe equity (2) 1 4.29% 14.15% 1
2.73% 13.38% 12.61% Operating Revenue: (a Ioave5% Io rmn. (1) c 2 1 09 A c 40 AAc c 1 o 2c o c 49A no s 17914 Ie. Ine.CS. "I come Non-interest income • — 1 ,‘9A 3,370 • o, 1 s 3,716 • 1 J,00C 3,627 • i •, i US 3,438 If,— 1 3,211 Less: Net gains on sale of securities - - - - 14 Operating revenue s 24,40 4 S 22,831 S 22,985 S 21,547 S 20,508 Operating Efficiency Ratio: (1) Total non-interest expense s 12,634 s 12,052 s 12,854 s 11,454 s 11,560 Operating revenue s 24,404 s 22,831 s 22,985 s 21,547 s 20,508 Operating efficiency ratio 51.77% 52.79% 55.92% 53.16% 56.37% (1)The Company believes these non-GAAP measurements are key indicators of the ongoing earnings power of the Company. (2) Annualized. 18
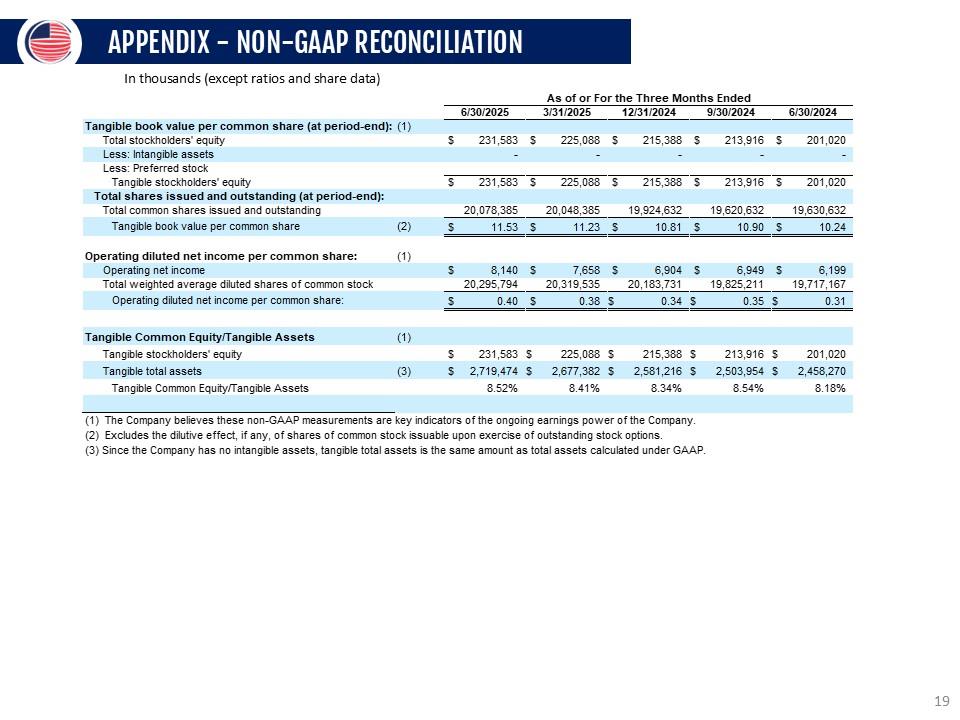
APPENDIX - NON-GAAP RECONCILIATION In thousands (except ratios and share data) As of or For the Three Months Ended 6/30/2025 3/31/2025 12/31/2024 9/30/2024 6/30/2024 Tangible book value per common share (at period-end): (1) Total stockholders’ equity s 231,583 s 225,088 s 215,388 s 213,916 s 201,020 Less: Intangible assets - - - - - Less: Preferred stock Tangible stockholders’ equity s 231,583 s 225,088 s 215,388 s 213,916 s 201,020 Total shares issued and outstanding (at period-end): Total common shares issued and outstanding 20,078,385 20,048,385 19,924,632 19,620,632 19,630,632 Tangible book value per common share (2) S 11.53 S 11.23 S 10.81 S 10.90 S 10.24 Operating diluted net income per common share: (1) Operating net income s 8,140 s 7,658 s 6,904 s 6,949 s 6,199 Total weighted average diluted shares of common stock 20,295,794 20,319,535 20,183,731 19,825,211 19,717,167 Operating diluted net income per common share: s 0.40 s 0.38 s 0.34 s 0.35 s 0.31 Tangible Com m on Equity/Tangible Assets (1) Tangible stockholders’ equity s 231,583 s 225,088 s 215,388 s 213,916 s 201,020 Tangible total assets (3) $ 2,719,474 $ 2,677,382 $ 2,581,216 $ 2,503,954 $ 2,458,270 Tangible Common Equity/Tangible Assets 8.52% 8.41% 8.34% 8.54% 8.18% 1. The Company believes these non-GAAP measurements are key indicators of the ongoing earnings pow er of the Company. 2. Excludes the dilutive effect if any, of shares of common stock Issuable upon exercise of outstanding stock options. 3. Since the Company has no intangible assets, tangible total assets is the same amount as total assets calculated under GAAP. 19
CONTACT INFORMATION LOU DE LA AGUILERA Chairman, President & CEO (305) 715-5186 laguilera@uscentury.com ROB ANDERSON EVP, Chief Financial Officer (305) 715-5393 rob.anderson@uscentury.com INVESTOR RELATIONS InvestorRelations@uscentury.com 20