Shareholder Report
|
12 Months Ended |
|
May 31, 2025
USD ($)
Holding
|
|---|
| Shareholder Report [Line Items] |
|
| Document Type |
N-CSR
|
| Amendment Flag |
false
|
| Registrant Name |
T. ROWE PRICE LIMITED-DURATION INFLATION FOCUSED BOND FUND, INC.
|
| Entity Central Index Key |
0001368135
|
| Entity Investment Company Type |
N-1A
|
| Document Period End Date |
May 31, 2025
|
| C000036131 |
|
| Shareholder Report [Line Items] |
|
| Fund Name |
Limited Duration Inflation Focused Bond Fund
|
| Class Name |
Investor Class
|
| Trading Symbol |
TRBFX
|
| Annual or Semi-Annual Statement [Text Block] |
This annual shareholder report contains important information about Limited Duration Inflation Focused Bond Fund (the "fund") for the period of June 1, 2024 to May 31, 2025. You can find the fund’s prospectus, financial information on Form N‑CSR (which includes required tax information for dividends), holdings, proxy voting information, and other information atwww.troweprice.com/prospectus. You can also request this information without charge by contacting T. Rowe Price at 1‑800‑638‑5660 or info@troweprice.com or contacting your intermediary.
|
| Shareholder Report Annual or Semi-Annual |
Annual Shareholder Report
|
| Additional Information [Text Block] |
You can find the fund’s prospectus, financial information on Form N‑CSR (which includes required tax information for dividends), holdings, proxy voting information, and other information atwww.troweprice.com/prospectus. You can also request this information without charge by contacting T. Rowe Price at 1‑800‑638‑5660 or info@troweprice.com or contacting your intermediary.
|
| Material Fund Change Notice [Text Block] |
|
| Additional Information Phone Number |
1‑800‑638‑5660
|
| Additional Information Email |
<span style="box-sizing: border-box; color: rgb(0, 0, 0); display: inline; flex-wrap: nowrap; font-size: 13.3333px; font-weight: 400; grid-area: auto; line-height: 17.3333px; margin: 0px; overflow: visible; text-align: justify; text-align-last: left; white-space-collapse: preserve-breaks;">info@troweprice.com</span>
|
| Additional Information Website |
www.troweprice.com/prospectus
|
| Expenses [Text Block] |
What were the fund costs for the last year? (based on a hypothetical $10,000 investment)
|
Costs of a $10,000 investment |
Costs paid as a percentage of a $10,000 investment |
Limited Duration Inflation Focused Bond Fund - Investor Class |
$50 |
0.48% | |
| Expenses Paid, Amount |
$ 50
|
| Expense Ratio, Percent |
0.48%
|
| Factors Affecting Performance [Text Block] |
What drove fund performance during the past 12 months?U.S. Treasury inflation protected securities (TIPS) generated positive performance for the 12-month reporting period as shorter-maturity break-even spreads widened and TIPS benefited from principal adjustments for inflation. Although price increases moderated during the period, inflation remained above the Federal Reserve’s 2% target. Positioning for a steepening of the two-year/10-year portion of the yield curve contributed to the fund’s performance versus the style-specific Bloomberg U.S. 1–5 Year Treasury TIPS Index as shorter-maturity Treasury yields fell more during the period than 10-year yields. The higher coupon income produced by the fund’s holdings was also a positive factor. The fund’s duration positioning hampered performance, including a long posture early in the fourth quarter as yields rose sharply, although this positioning was beneficial at other points in the period. Allocations to options on Treasury futures, which we use to help with interest rate management, also detracted versus the style-specific index. Security selection within the TIPS sector modestly hampered performance. The fund seeks a level of income that is consistent with the current rate of inflation by investing in a diversified portfolio of TIPS as well as short- and intermediate-term investment-grade corporate, government, mortgage-backed, and asset-backed securities. At period-end, our non-TIPS allocations were very low as the risk/reward trade-off of credit sectors appeared to be unappealing at this point in the economic cycle, while TIPS looked attractive amid potentially inflationary tariff policies.
|
| Performance Past Does Not Indicate Future [Text] |
The fund’s past performance is not a good predictor of the fund’s future performance.
|
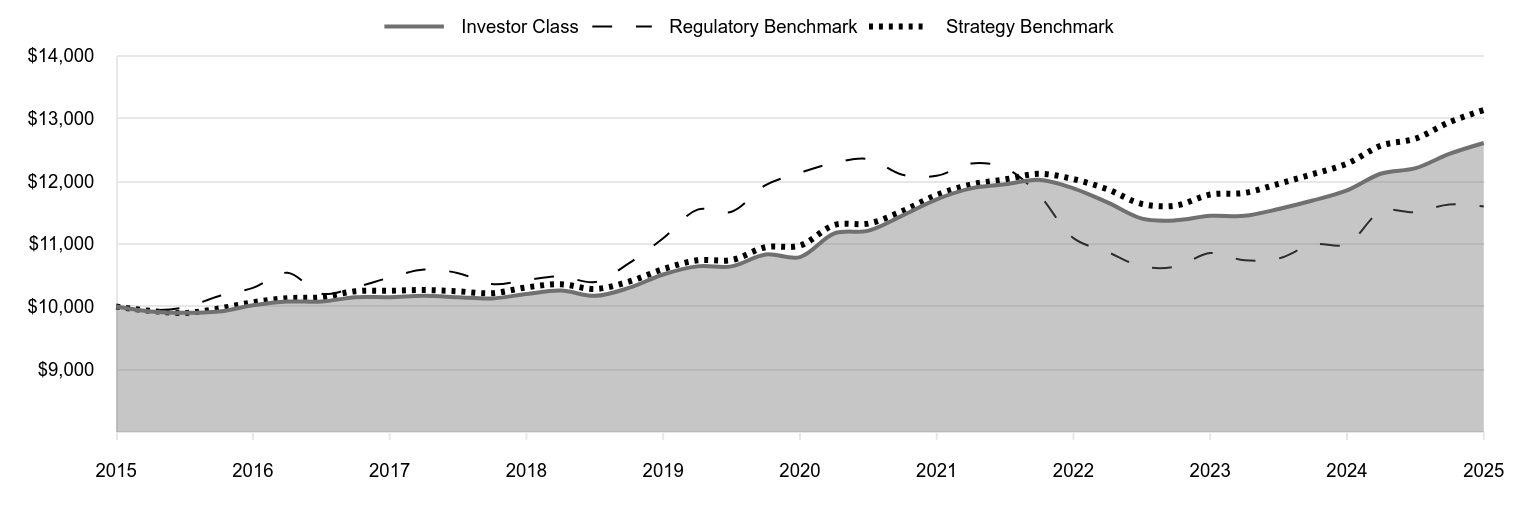
| Line Graph [Table Text Block] |
|
Investor Class |
Regulatory Benchmark |
Strategy Benchmark |
2015 |
10,000 |
10,000 |
10,000 |
2015 |
9,920 |
9,945 |
9,931 |
2015 |
9,900 |
9,988 |
9,899 |
2016 |
9,920 |
10,164 |
9,968 |
2016 |
10,020 |
10,299 |
10,068 |
2016 |
10,080 |
10,539 |
10,134 |
2016 |
10,080 |
10,205 |
10,148 |
2017 |
10,150 |
10,308 |
10,244 |
2017 |
10,150 |
10,462 |
10,252 |
2017 |
10,171 |
10,591 |
10,264 |
2017 |
10,150 |
10,533 |
10,242 |
2018 |
10,130 |
10,360 |
10,214 |
2018 |
10,200 |
10,423 |
10,306 |
2018 |
10,255 |
10,480 |
10,356 |
2018 |
10,171 |
10,391 |
10,281 |
2019 |
10,297 |
10,689 |
10,397 |
2019 |
10,512 |
11,090 |
10,597 |
2019 |
10,641 |
11,546 |
10,738 |
2019 |
10,641 |
11,513 |
10,743 |
2020 |
10,832 |
11,937 |
10,947 |
2020 |
10,789 |
12,134 |
10,973 |
2020 |
11,166 |
12,293 |
11,301 |
2020 |
11,212 |
12,351 |
11,324 |
2021 |
11,451 |
12,102 |
11,522 |
2021 |
11,711 |
12,085 |
11,779 |
2021 |
11,885 |
12,283 |
11,947 |
2021 |
11,950 |
12,209 |
12,029 |
2022 |
12,022 |
11,782 |
12,117 |
2022 |
11,886 |
11,091 |
12,032 |
2022 |
11,657 |
10,868 |
11,867 |
2022 |
11,402 |
10,641 |
11,636 |
2023 |
11,375 |
10,637 |
11,611 |
2023 |
11,447 |
10,854 |
11,786 |
2023 |
11,447 |
10,738 |
11,813 |
2023 |
11,556 |
10,767 |
11,958 |
2024 |
11,691 |
10,991 |
12,112 |
2024 |
11,854 |
10,995 |
12,280 |
2024 |
12,122 |
11,522 |
12,569 |
2024 |
12,207 |
11,507 |
12,679 |
2025 |
12,434 |
11,629 |
12,940 |
2025 |
12,608 |
11,596 |
13,136 |
|
| Average Annual Return [Table Text Block] |
|
1 Year |
5 Years |
10 Years |
Limited Duration Inflation Focused Bond Fund (Investor Class) |
6.36% |
3.17% |
2.34% |
Bloomberg U.S. Aggregate Bond Index (Regulatory Benchmark) |
5.46 |
-0.90 |
1.49 |
Bloomberg U.S. 1-5 Year Treasury TIPS Index (Strategy Benchmark) |
6.97 |
3.66 |
2.76 | |
| No Deduction of Taxes [Text Block] |
Neither the fund’s returns nor the index returns reflect the deduction of taxes that a shareholder would pay on fund distributions or redemptions of fund shares.
|
| Updated Performance Information Location [Text Block] |
Updated performance information can be found at www.troweprice.com.
|
| Distribution of Capital [Text Block] |
The fund's total return figures reflect the reinvestment of dividends and capital gains, if any.
|
| AssetsNet |
$ 8,629,639,000
|
| Holdings Count | Holding |
42
|
| Advisory Fees Paid, Amount |
$ 3,210,000
|
| InvestmentCompanyPortfolioTurnover |
40.90%
|
| Additional Fund Statistics Significance or Limits [Text Block] |
What are some fund statistics? - Total Net Assets (000s)$8,629,639
- Number of Portfolio Holdings42
|
| Holdings [Text Block] |
U.S. Government Agency Obligations (Excluding Mortgage-Backed) |
99.7% |
Non-U.S. Government Mortgage-Backed Securities |
0.0 |
U.S. Government & Agency Mortgage-Backed Securities |
0.0 |
Short-Term and Other |
0.3 | |
| Largest Holdings [Text Block] |
U.S. Treasury Inflation-Indexed Notes |
99.7% |
Sequoia Mortgage Trust |
0.0 |
GS Mortgage-Backed Securities Trust |
0.0 |
Federal National Mortgage Assn. |
0.0 |
Federal Home Loan Mortgage |
0.0 |
Government National Mortgage Assn. |
0.0 | |
| Material Fund Change [Text Block] |
|
| Updated Prospectus Web Address |
www.troweprice.com/paperless
|
| C000161061 |
|
| Shareholder Report [Line Items] |
|
| Fund Name |
Limited Duration Inflation Focused Bond Fund
|
| Class Name |
I Class
|
| Trading Symbol |
TRLDX
|
| Annual or Semi-Annual Statement [Text Block] |
This annual shareholder report contains important information about Limited Duration Inflation Focused Bond Fund (the "fund") for the period of June 1, 2024 to May 31, 2025. You can find the fund’s prospectus, financial information on Form N‑CSR (which includes required tax information for dividends), holdings, proxy voting information, and other information atwww.troweprice.com/prospectus. You can also request this information without charge by contacting T. Rowe Price at 1‑800‑638‑5660 or info@troweprice.com or contacting your intermediary.
|
| Shareholder Report Annual or Semi-Annual |
Annual Shareholder Report
|
| Additional Information [Text Block] |
You can find the fund’s prospectus, financial information on Form N‑CSR (which includes required tax information for dividends), holdings, proxy voting information, and other information atwww.troweprice.com/prospectus. You can also request this information without charge by contacting T. Rowe Price at 1‑800‑638‑5660 or info@troweprice.com or contacting your intermediary.
|
| Material Fund Change Notice [Text Block] |
|
| Additional Information Phone Number |
1‑800‑638‑5660
|
| Additional Information Email |
<span style="box-sizing: border-box; color: rgb(0, 0, 0); display: inline; flex-wrap: nowrap; font-size: 13.3333px; font-weight: 400; grid-area: auto; line-height: 17.3333px; margin: 0px; overflow: visible; text-align: justify; text-align-last: left; white-space-collapse: preserve-breaks;">info@troweprice.com</span>
|
| Additional Information Website |
www.troweprice.com/prospectus
|
| Expenses [Text Block] |
What were the fund costs for the last year? (based on a hypothetical $10,000 investment)
|
Costs of a $10,000 investment |
Costs paid as a percentage of a $10,000 investment |
Limited Duration Inflation Focused Bond Fund - I Class |
$31 |
0.30% | |
| Expenses Paid, Amount |
$ 31
|
| Expense Ratio, Percent |
0.30%
|
| Factors Affecting Performance [Text Block] |
What drove fund performance during the past 12 months?U.S. Treasury inflation protected securities (TIPS) generated positive performance for the 12-month reporting period as shorter-maturity break-even spreads widened and TIPS benefited from principal adjustments for inflation. Although price increases moderated during the period, inflation remained above the Federal Reserve’s 2% target. Positioning for a steepening of the two-year/10-year portion of the yield curve contributed to the fund’s performance versus the style-specific Bloomberg U.S. 1–5 Year Treasury TIPS Index as shorter-maturity Treasury yields fell more during the period than 10-year yields. The higher coupon income produced by the fund’s holdings was also a positive factor. The fund’s duration positioning hampered performance, including a long posture early in the fourth quarter as yields rose sharply, although this positioning was beneficial at other points in the period. Allocations to options on Treasury futures, which we use to help with interest rate management, also detracted versus the style-specific index. Security selection within the TIPS sector modestly hampered performance. The fund seeks a level of income that is consistent with the current rate of inflation by investing in a diversified portfolio of TIPS as well as short- and intermediate-term investment-grade corporate, government, mortgage-backed, and asset-backed securities. At period-end, our non-TIPS allocations were very low as the risk/reward trade-off of credit sectors appeared to be unappealing at this point in the economic cycle, while TIPS looked attractive amid potentially inflationary tariff policies.
|
| Performance Past Does Not Indicate Future [Text] |
The fund’s past performance is not a good predictor of the fund’s future performance.
|
| Line Graph [Table Text Block] |

|
I Class |
Regulatory Benchmark |
Strategy Benchmark |
9/29/15 |
500,000 |
500,000 |
500,000 |
11/30/15 |
498,994 |
498,692 |
499,443 |
2/29/16 |
500,000 |
507,495 |
502,888 |
5/31/16 |
505,030 |
514,249 |
507,945 |
8/31/16 |
508,048 |
526,197 |
511,268 |
11/30/16 |
508,048 |
509,522 |
511,988 |
2/28/17 |
512,609 |
514,678 |
516,820 |
5/31/17 |
512,609 |
522,367 |
517,259 |
8/31/17 |
513,626 |
528,788 |
517,856 |
11/30/17 |
512,609 |
525,899 |
516,723 |
2/28/18 |
512,592 |
517,277 |
515,333 |
5/31/18 |
515,246 |
520,411 |
519,957 |
8/31/18 |
518,229 |
523,239 |
522,505 |
11/30/18 |
514,153 |
518,841 |
518,712 |
2/28/19 |
520,679 |
533,674 |
524,564 |
5/31/19 |
532,765 |
553,719 |
534,639 |
8/31/19 |
539,452 |
576,466 |
541,759 |
11/30/19 |
538,563 |
574,830 |
542,017 |
2/29/20 |
549,456 |
596,021 |
552,305 |
5/31/20 |
546,405 |
605,854 |
553,588 |
8/31/20 |
566,758 |
613,783 |
570,149 |
11/30/20 |
569,255 |
616,699 |
571,332 |
2/28/21 |
581,311 |
604,268 |
581,310 |
5/31/21 |
595,596 |
603,401 |
594,261 |
8/31/21 |
603,289 |
613,265 |
602,738 |
11/30/21 |
607,684 |
609,586 |
606,900 |
2/28/22 |
610,912 |
588,290 |
611,344 |
5/31/22 |
603,996 |
553,790 |
607,030 |
8/31/22 |
593,622 |
542,642 |
598,723 |
11/30/22 |
581,277 |
531,318 |
587,040 |
2/28/23 |
579,864 |
531,097 |
585,787 |
5/31/23 |
584,841 |
541,923 |
594,610 |
8/31/23 |
584,841 |
536,167 |
595,981 |
11/30/23 |
590,515 |
537,586 |
603,290 |
2/29/24 |
597,697 |
548,768 |
611,082 |
5/31/24 |
606,201 |
548,998 |
619,531 |
8/31/24 |
620,127 |
575,290 |
634,125 |
11/30/24 |
624,581 |
574,546 |
639,675 |
2/28/25 |
637,944 |
580,641 |
652,854 |
5/31/25 |
645,847 |
578,967 |
662,718 |
|
| Average Annual Return [Table Text Block] |
|
1 Year |
5 Years |
Since Inception 9/29/15 |
Limited Duration Inflation Focused Bond Fund (I Class) |
6.54% |
3.40% |
2.68% |
Bloomberg U.S. Aggregate Bond Index (Regulatory Benchmark) |
5.46 |
-0.90 |
1.53 |
Bloomberg U.S. 1-5 Year Treasury TIPS Index (Strategy Benchmark) |
6.97 |
3.66 |
2.96 | |
| Performance Inception Date |
Sep. 29, 2015
|
| No Deduction of Taxes [Text Block] |
Neither the fund’s returns nor the index returns reflect the deduction of taxes that a shareholder would pay on fund distributions or redemptions of fund shares.
|
| Updated Performance Information Location [Text Block] |
Updated performance information can be found at www.troweprice.com.
|
| Distribution of Capital [Text Block] |
The fund's total return figures reflect the reinvestment of dividends and capital gains, if any.
|
| AssetsNet |
$ 8,629,639,000
|
| Holdings Count | Holding |
42
|
| Advisory Fees Paid, Amount |
$ 3,210,000
|
| InvestmentCompanyPortfolioTurnover |
40.90%
|
| Additional Fund Statistics Significance or Limits [Text Block] |
What are some fund statistics? - Total Net Assets (000s)$8,629,639
- Number of Portfolio Holdings42
|
| Holdings [Text Block] |
U.S. Government Agency Obligations (Excluding Mortgage-Backed) |
99.7% |
Non-U.S. Government Mortgage-Backed Securities |
0.0 |
U.S. Government & Agency Mortgage-Backed Securities |
0.0 |
Short-Term and Other |
0.3 | |
| Largest Holdings [Text Block] |
U.S. Treasury Inflation-Indexed Notes |
99.7% |
Sequoia Mortgage Trust |
0.0 |
GS Mortgage-Backed Securities Trust |
0.0 |
Federal National Mortgage Assn. |
0.0 |
Federal Home Loan Mortgage |
0.0 |
Government National Mortgage Assn. |
0.0 | |
| Material Fund Change [Text Block] |
|
| Updated Prospectus Web Address |
www.troweprice.com/paperless
|
| C000219321 |
|
| Shareholder Report [Line Items] |
|
| Fund Name |
Limited Duration Inflation Focused Bond Fund
|
| Class Name |
Z Class
|
| Trading Symbol |
TRPZX
|
| Annual or Semi-Annual Statement [Text Block] |
This annual shareholder report contains important information about Limited Duration Inflation Focused Bond Fund (the "fund") for the period of June 1, 2024 to May 31, 2025. You can find the fund’s prospectus, financial information on Form N‑CSR (which includes required tax information for dividends), holdings, proxy voting information, and other information atwww.troweprice.com/prospectus. You can also request this information without charge by contacting T. Rowe Price at 1‑800‑638‑5660 or info@troweprice.com or contacting your intermediary.
|
| Shareholder Report Annual or Semi-Annual |
Annual Shareholder Report
|
| Additional Information [Text Block] |
You can find the fund’s prospectus, financial information on Form N‑CSR (which includes required tax information for dividends), holdings, proxy voting information, and other information atwww.troweprice.com/prospectus. You can also request this information without charge by contacting T. Rowe Price at 1‑800‑638‑5660 or info@troweprice.com or contacting your intermediary.
|
| Material Fund Change Notice [Text Block] |
|
| Additional Information Phone Number |
1‑800‑638‑5660
|
| Additional Information Email |
<span style="box-sizing: border-box; color: rgb(0, 0, 0); display: inline; flex-wrap: nowrap; font-size: 13.3333px; font-weight: 400; grid-area: auto; line-height: 17.3333px; margin: 0px; overflow: visible; text-align: justify; text-align-last: left; white-space-collapse: preserve-breaks;">info@troweprice.com</span>
|
| Additional Information Website |
www.troweprice.com/prospectus
|
| Expenses [Text Block] |
What were the fund costs for the last year? (based on a hypothetical $10,000 investment)
|
Costs of a $10,000 investment |
Costs paid as a percentage of a $10,000 investment |
Limited Duration Inflation Focused Bond Fund - Z Class |
$0 |
0.00% | |
| Expenses Paid, Amount |
$ 0
|
| Expense Ratio, Percent |
0.00%
|
| Factors Affecting Performance [Text Block] |
What drove fund performance during the past 12 months?U.S. Treasury inflation protected securities (TIPS) generated positive performance for the 12-month reporting period as shorter-maturity break-even spreads widened and TIPS benefited from principal adjustments for inflation. Although price increases moderated during the period, inflation remained above the Federal Reserve’s 2% target. Positioning for a steepening of the two-year/10-year portion of the yield curve contributed to the fund’s performance versus the style-specific Bloomberg U.S. 1–5 Year Treasury TIPS Index as shorter-maturity Treasury yields fell more during the period than 10-year yields. The higher coupon income produced by the fund’s holdings was also a positive factor. The fund’s duration positioning hampered performance, including a long posture early in the fourth quarter as yields rose sharply, although this positioning was beneficial at other points in the period. Allocations to options on Treasury futures, which we use to help with interest rate management, also detracted versus the style-specific index. Security selection within the TIPS sector modestly hampered performance. The fund seeks a level of income that is consistent with the current rate of inflation by investing in a diversified portfolio of TIPS as well as short- and intermediate-term investment-grade corporate, government, mortgage-backed, and asset-backed securities. At period-end, our non-TIPS allocations were very low as the risk/reward trade-off of credit sectors appeared to be unappealing at this point in the economic cycle, while TIPS looked attractive amid potentially inflationary tariff policies.
|
| Performance Past Does Not Indicate Future [Text] |
The fund’s past performance is not a good predictor of the fund’s future performance.
|
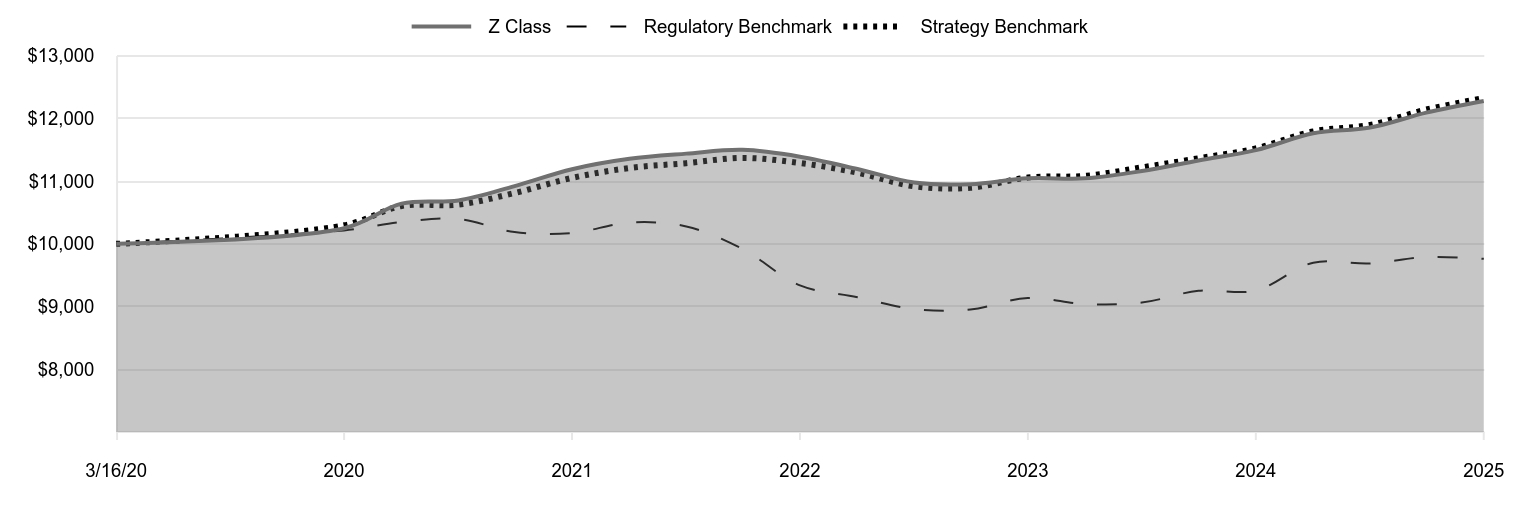
| Line Graph [Table Text Block] |
|
Z Class |
Regulatory Benchmark |
Strategy Benchmark |
3/16/20 |
10,000 |
10,000 |
10,000 |
5/31/20 |
10,250 |
10,215 |
10,296 |
8/31/20 |
10,641 |
10,349 |
10,604 |
11/30/20 |
10,693 |
10,398 |
10,626 |
2/28/21 |
10,921 |
10,188 |
10,811 |
5/31/21 |
11,190 |
10,173 |
11,052 |
8/31/21 |
11,356 |
10,340 |
11,210 |
11/30/21 |
11,439 |
10,278 |
11,287 |
2/28/22 |
11,499 |
9,919 |
11,370 |
5/31/22 |
11,390 |
9,337 |
11,289 |
8/31/22 |
11,194 |
9,149 |
11,135 |
11/30/22 |
10,977 |
8,958 |
10,918 |
2/28/23 |
10,951 |
8,954 |
10,894 |
5/31/23 |
11,045 |
9,137 |
11,058 |
8/31/23 |
11,045 |
9,040 |
11,084 |
11/30/23 |
11,161 |
9,064 |
11,220 |
2/29/24 |
11,330 |
9,252 |
11,365 |
5/31/24 |
11,495 |
9,256 |
11,522 |
8/31/24 |
11,763 |
9,700 |
11,793 |
11/30/24 |
11,855 |
9,687 |
11,897 |
2/28/25 |
12,093 |
9,790 |
12,142 |
5/31/25 |
12,278 |
9,762 |
12,325 |
|
| Average Annual Return [Table Text Block] |
|
1 Year |
5 Years |
Since Inception 3/16/20 |
Limited Duration Inflation Focused Bond Fund (Z Class) |
6.81% |
3.68% |
4.02% |
Bloomberg U.S. Aggregate Bond Index (Regulatory Benchmark) |
5.46 |
-0.90 |
-0.46 |
Bloomberg U.S. 1-5 Year Treasury TIPS Index (Strategy Benchmark) |
6.97 |
3.66 |
4.10 | |
| Performance Inception Date |
Mar. 16, 2020
|
| No Deduction of Taxes [Text Block] |
Neither the fund’s returns nor the index returns reflect the deduction of taxes that a shareholder would pay on fund distributions or redemptions of fund shares.
|
| Updated Performance Information Location [Text Block] |
Updated performance information can be found at www.troweprice.com.
|
| Distribution of Capital [Text Block] |
The fund's total return figures reflect the reinvestment of dividends and capital gains, if any.
|
| AssetsNet |
$ 8,629,639,000
|
| Holdings Count | Holding |
42
|
| Advisory Fees Paid, Amount |
$ 3,210,000
|
| InvestmentCompanyPortfolioTurnover |
40.90%
|
| Additional Fund Statistics Significance or Limits [Text Block] |
What are some fund statistics? - Total Net Assets (000s)$8,629,639
- Number of Portfolio Holdings42
|
| Holdings [Text Block] |
U.S. Government Agency Obligations (Excluding Mortgage-Backed) |
99.7% |
Non-U.S. Government Mortgage-Backed Securities |
0.0 |
U.S. Government & Agency Mortgage-Backed Securities |
0.0 |
Short-Term and Other |
0.3 | |
| Largest Holdings [Text Block] |
U.S. Treasury Inflation-Indexed Notes |
99.7% |
Sequoia Mortgage Trust |
0.0 |
GS Mortgage-Backed Securities Trust |
0.0 |
Federal National Mortgage Assn. |
0.0 |
Federal Home Loan Mortgage |
0.0 |
Government National Mortgage Assn. |
0.0 | |
| Material Fund Change [Text Block] |
|
| Updated Prospectus Web Address |
www.troweprice.com/paperless
|