Shareholder Report
|
6 Months Ended |
|
May 31, 2025
USD ($)
Holding
|
|---|
| Shareholder Report [Line Items] |
|
| Document Type |
N-CSR
|
| Amendment Flag |
false
|
| Registrant Name |
Federated Hermes Income Securities Trust
|
| Entity Central Index Key |
0000789281
|
| Entity Investment Company Type |
N-1A
|
| Document Period End Date |
May 31, 2025
|
| C000024648 |
|
| Shareholder Report [Line Items] |
|
| Fund Name |
Federated Hermes Capital Income Fund
|
| Class Name |
Class A Shares
|
| Trading Symbol |
CAPAX
|
| Annual or Semi-Annual Statement [Text Block] |
This semi-annual shareholder report contains important information about the Federated Hermes Capital Income Fund (the "Fund") for the period of December 1, 2024 to May 31, 2025.
|
| Shareholder Report Annual or Semi-Annual |
Semi-Annual Shareholder Report
|
| Additional Information [Text Block] |
You can find additional information at FederatedHermes.com/us/FundInformation. You can also request this information by contacting us at 1-800-341-7400, Option 4, or your financial advisor.
|
| Additional Information Phone Number |
1-800-341-7400
|
| Additional Information Website |
FederatedHermes.com/us/FundInformation
|
| Expenses [Text Block] |
What were the Fund costs for the last six months? (based on a hypothetical $10,000 investment) Class Name | Costs of a $10,000 investment | Costs paid as a percentage of a $10,000 investment |
|---|
Class A Shares | $44 | 0.88% |
|---|
|
| Expenses Paid, Amount |
$ 44
|
| Expense Ratio, Percent |
0.88%
|
| AssetsNet |
$ 647,966,334
|
| Holdings Count | Holding |
275
|
| InvestmentCompanyPortfolioTurnover |
14.00%
|
| Additional Fund Statistics [Text Block] |
- Net Assets$647,966,334
- Number of Investments275
- Portfolio Turnover14%
|
| Holdings [Text Block] |
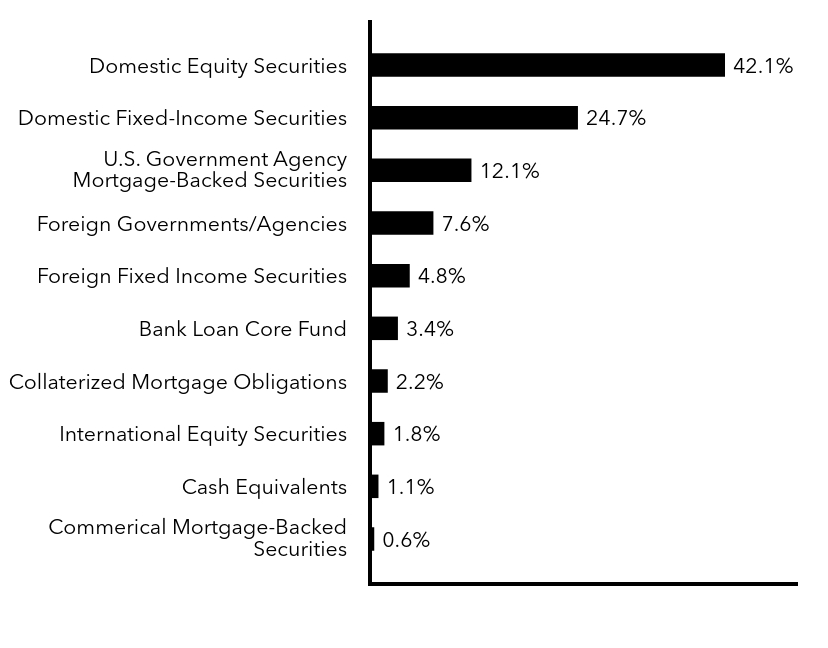
Top Security Types (% of Net Assets)Footnote Reference*Value | Value |
|---|
Commerical Mortgage-Backed Securities | 0.6% | Cash Equivalents | 1.1% | International Equity Securities | 1.8% | Collaterized Mortgage Obligations | 2.2% | Bank Loan Core Fund | 3.4% | Foreign Fixed Income Securities | 4.8% | Foreign Governments/Agencies | 7.6% | U.S. Government Agency Mortgage-Backed Securities | 12.1% | Domestic Fixed-Income Securities | 24.7% | Domestic Equity Securities | 42.1% |
| Footnote | Description | Footnote* | Reflects the pro rata portfolio composition of underlying affiliated investment companies (other than an affiliated money market mutual fund) in which the Fund invested greater than 10% of its net assets as of the date specified above. Accordingly, the percentages of total net assets shown in the table will differ from those presented on the Portfolio of Investments. |
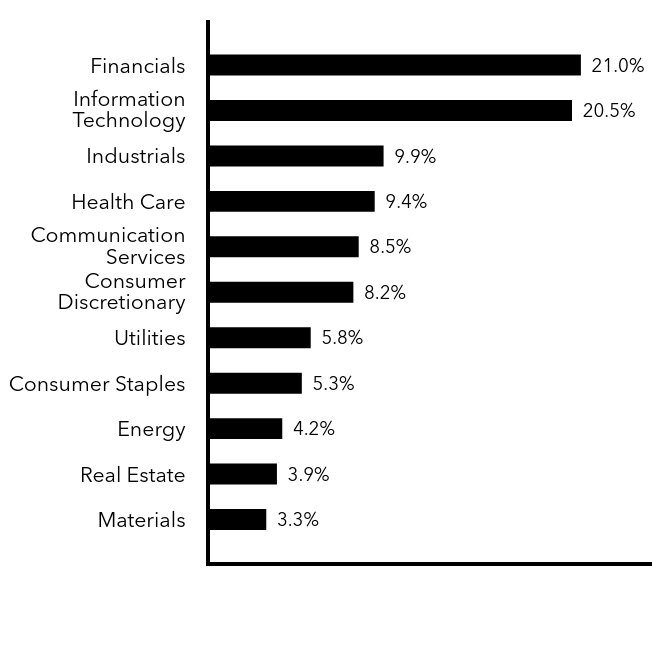
Top Sectors - Equity (% of Equity Securities)Value | Value |
|---|
Materials | 3.3% | Real Estate | 3.9% | Energy | 4.2% | Consumer Staples | 5.3% | Utilities | 5.8% | Consumer Discretionary | 8.2% | Communication Services | 8.5% | Health Care | 9.4% | Industrials | 9.9% | Information Technology | 20.5% | Financials | 21.0% |
|
| Material Fund Change [Text Block] |
|
| C000024650 |
|
| Shareholder Report [Line Items] |
|
| Fund Name |
Federated Hermes Capital Income Fund
|
| Class Name |
Class C Shares
|
| Trading Symbol |
CAPCX
|
| Annual or Semi-Annual Statement [Text Block] |
This semi-annual shareholder report contains important information about the Federated Hermes Capital Income Fund (the "Fund") for the period of December 1, 2024 to May 31, 2025.
|
| Shareholder Report Annual or Semi-Annual |
Semi-Annual Shareholder Report
|
| Additional Information [Text Block] |
You can find additional information at FederatedHermes.com/us/FundInformation. You can also request this information by contacting us at 1-800-341-7400, Option 4, or your financial advisor.
|
| Additional Information Phone Number |
1-800-341-7400
|
| Additional Information Website |
FederatedHermes.com/us/FundInformation
|
| Expenses [Text Block] |
What were the Fund costs for the last six months? (based on a hypothetical $10,000 investment) Class Name | Costs of a $10,000 investment | Costs paid as a percentage of a $10,000 investment |
|---|
Class C Shares | $85 | 1.72% |
|---|
|
| Expenses Paid, Amount |
$ 85
|
| Expense Ratio, Percent |
1.72%
|
| AssetsNet |
$ 647,966,334
|
| Holdings Count | Holding |
275
|
| InvestmentCompanyPortfolioTurnover |
14.00%
|
| Additional Fund Statistics [Text Block] |
- Net Assets$647,966,334
- Number of Investments275
- Portfolio Turnover14%
|
| Holdings [Text Block] |
Top Security Types (% of Net Assets)Footnote Reference*Value | Value |
|---|
Commerical Mortgage-Backed Securities | 0.6% | Cash Equivalents | 1.1% | International Equity Securities | 1.8% | Collaterized Mortgage Obligations | 2.2% | Bank Loan Core Fund | 3.4% | Foreign Fixed Income Securities | 4.8% | Foreign Governments/Agencies | 7.6% | U.S. Government Agency Mortgage-Backed Securities | 12.1% | Domestic Fixed-Income Securities | 24.7% | Domestic Equity Securities | 42.1% |
| Footnote | Description | Footnote* | Reflects the pro rata portfolio composition of underlying affiliated investment companies (other than an affiliated money market mutual fund) in which the Fund invested greater than 10% of its net assets as of the date specified above. Accordingly, the percentages of total net assets shown in the table will differ from those presented on the Portfolio of Investments. |
Top Sectors - Equity (% of Equity Securities)Value | Value |
|---|
Materials | 3.3% | Real Estate | 3.9% | Energy | 4.2% | Consumer Staples | 5.3% | Utilities | 5.8% | Consumer Discretionary | 8.2% | Communication Services | 8.5% | Health Care | 9.4% | Industrials | 9.9% | Information Technology | 20.5% | Financials | 21.0% |
|
| Material Fund Change [Text Block] |
|
| C000024651 |
|
| Shareholder Report [Line Items] |
|
| Fund Name |
Federated Hermes Capital Income Fund
|
| Class Name |
Class F Shares
|
| Trading Symbol |
CAPFX
|
| Annual or Semi-Annual Statement [Text Block] |
This semi-annual shareholder report contains important information about the Federated Hermes Capital Income Fund (the "Fund") for the period of December 1, 2024 to May 31, 2025.
|
| Shareholder Report Annual or Semi-Annual |
Semi-Annual Shareholder Report
|
| Additional Information [Text Block] |
You can find additional information at FederatedHermes.com/us/FundInformation. You can also request this information by contacting us at 1-800-341-7400, Option 4, or your financial advisor.
|
| Additional Information Phone Number |
1-800-341-7400
|
| Additional Information Website |
FederatedHermes.com/us/FundInformation
|
| Expenses [Text Block] |
What were the Fund costs for the last six months? (based on a hypothetical $10,000 investment) Class Name | Costs of a $10,000 investment | Costs paid as a percentage of a $10,000 investment |
|---|
Class F Shares | $44 | 0.89% |
|---|
|
| Expenses Paid, Amount |
$ 44
|
| Expense Ratio, Percent |
0.89%
|
| AssetsNet |
$ 647,966,334
|
| Holdings Count | Holding |
275
|
| InvestmentCompanyPortfolioTurnover |
14.00%
|
| Additional Fund Statistics [Text Block] |
- Net Assets$647,966,334
- Number of Investments275
- Portfolio Turnover14%
|
| Holdings [Text Block] |
Top Security Types (% of Net Assets)Footnote Reference*Value | Value |
|---|
Commerical Mortgage-Backed Securities | 0.6% | Cash Equivalents | 1.1% | International Equity Securities | 1.8% | Collaterized Mortgage Obligations | 2.2% | Bank Loan Core Fund | 3.4% | Foreign Fixed Income Securities | 4.8% | Foreign Governments/Agencies | 7.6% | U.S. Government Agency Mortgage-Backed Securities | 12.1% | Domestic Fixed-Income Securities | 24.7% | Domestic Equity Securities | 42.1% |
| Footnote | Description | Footnote* | Reflects the pro rata portfolio composition of underlying affiliated investment companies (other than an affiliated money market mutual fund) in which the Fund invested greater than 10% of its net assets as of the date specified above. Accordingly, the percentages of total net assets shown in the table will differ from those presented on the Portfolio of Investments. |
Top Sectors - Equity (% of Equity Securities)Value | Value |
|---|
Materials | 3.3% | Real Estate | 3.9% | Energy | 4.2% | Consumer Staples | 5.3% | Utilities | 5.8% | Consumer Discretionary | 8.2% | Communication Services | 8.5% | Health Care | 9.4% | Industrials | 9.9% | Information Technology | 20.5% | Financials | 21.0% |
|
| Material Fund Change [Text Block] |
|
| C000130424 |
|
| Shareholder Report [Line Items] |
|
| Fund Name |
Federated Hermes Capital Income Fund
|
| Class Name |
Class R Shares
|
| Trading Symbol |
CAPRX
|
| Annual or Semi-Annual Statement [Text Block] |
This semi-annual shareholder report contains important information about the Federated Hermes Capital Income Fund (the "Fund") for the period of December 1, 2024 to May 31, 2025.
|
| Shareholder Report Annual or Semi-Annual |
Semi-Annual Shareholder Report
|
| Additional Information [Text Block] |
You can find additional information at FederatedHermes.com/us/FundInformation. You can also request this information by contacting us at 1-800-341-7400, Option 4, or your financial advisor.
|
| Additional Information Phone Number |
1-800-341-7400
|
| Additional Information Website |
FederatedHermes.com/us/FundInformation
|
| Expenses [Text Block] |
What were the Fund costs for the last six months? (based on a hypothetical $10,000 investment) Class Name | Costs of a $10,000 investment | Costs paid as a percentage of a $10,000 investment |
|---|
Class R Shares | $48 | 0.97% |
|---|
|
| Expenses Paid, Amount |
$ 48
|
| Expense Ratio, Percent |
0.97%
|
| AssetsNet |
$ 647,966,334
|
| Holdings Count | Holding |
275
|
| InvestmentCompanyPortfolioTurnover |
14.00%
|
| Additional Fund Statistics [Text Block] |
- Net Assets$647,966,334
- Number of Investments275
- Portfolio Turnover14%
|
| Holdings [Text Block] |
Top Security Types (% of Net Assets)Footnote Reference*Value | Value |
|---|
Commerical Mortgage-Backed Securities | 0.6% | Cash Equivalents | 1.1% | International Equity Securities | 1.8% | Collaterized Mortgage Obligations | 2.2% | Bank Loan Core Fund | 3.4% | Foreign Fixed Income Securities | 4.8% | Foreign Governments/Agencies | 7.6% | U.S. Government Agency Mortgage-Backed Securities | 12.1% | Domestic Fixed-Income Securities | 24.7% | Domestic Equity Securities | 42.1% |
| Footnote | Description | Footnote* | Reflects the pro rata portfolio composition of underlying affiliated investment companies (other than an affiliated money market mutual fund) in which the Fund invested greater than 10% of its net assets as of the date specified above. Accordingly, the percentages of total net assets shown in the table will differ from those presented on the Portfolio of Investments. |
Top Sectors - Equity (% of Equity Securities)Value | Value |
|---|
Materials | 3.3% | Real Estate | 3.9% | Energy | 4.2% | Consumer Staples | 5.3% | Utilities | 5.8% | Consumer Discretionary | 8.2% | Communication Services | 8.5% | Health Care | 9.4% | Industrials | 9.9% | Information Technology | 20.5% | Financials | 21.0% |
|
| Material Fund Change [Text Block] |
|
| C000114947 |
|
| Shareholder Report [Line Items] |
|
| Fund Name |
Federated Hermes Capital Income Fund
|
| Class Name |
Institutional Shares
|
| Trading Symbol |
CAPSX
|
| Annual or Semi-Annual Statement [Text Block] |
This semi-annual shareholder report contains important information about the Federated Hermes Capital Income Fund (the "Fund") for the period of December 1, 2024 to May 31, 2025.
|
| Shareholder Report Annual or Semi-Annual |
Semi-Annual Shareholder Report
|
| Additional Information [Text Block] |
You can find additional information at FederatedHermes.com/us/FundInformation. You can also request this information by contacting us at 1-800-341-7400, Option 4, or your financial advisor.
|
| Additional Information Phone Number |
1-800-341-7400
|
| Additional Information Website |
FederatedHermes.com/us/FundInformation
|
| Expenses [Text Block] |
What were the Fund costs for the last six months? (based on a hypothetical $10,000 investment) Class Name | Costs of a $10,000 investment | Costs paid as a percentage of a $10,000 investment |
|---|
Institutional Shares | $31 | 0.63% |
|---|
|
| Expenses Paid, Amount |
$ 31
|
| Expense Ratio, Percent |
0.63%
|
| AssetsNet |
$ 647,966,334
|
| Holdings Count | Holding |
275
|
| InvestmentCompanyPortfolioTurnover |
14.00%
|
| Additional Fund Statistics [Text Block] |
- Net Assets$647,966,334
- Number of Investments275
- Portfolio Turnover14%
|
| Holdings [Text Block] |
Top Security Types (% of Net Assets)Footnote Reference*Value | Value |
|---|
Commerical Mortgage-Backed Securities | 0.6% | Cash Equivalents | 1.1% | International Equity Securities | 1.8% | Collaterized Mortgage Obligations | 2.2% | Bank Loan Core Fund | 3.4% | Foreign Fixed Income Securities | 4.8% | Foreign Governments/Agencies | 7.6% | U.S. Government Agency Mortgage-Backed Securities | 12.1% | Domestic Fixed-Income Securities | 24.7% | Domestic Equity Securities | 42.1% |
| Footnote | Description | Footnote* | Reflects the pro rata portfolio composition of underlying affiliated investment companies (other than an affiliated money market mutual fund) in which the Fund invested greater than 10% of its net assets as of the date specified above. Accordingly, the percentages of total net assets shown in the table will differ from those presented on the Portfolio of Investments. |
Top Sectors - Equity (% of Equity Securities)Value | Value |
|---|
Materials | 3.3% | Real Estate | 3.9% | Energy | 4.2% | Consumer Staples | 5.3% | Utilities | 5.8% | Consumer Discretionary | 8.2% | Communication Services | 8.5% | Health Care | 9.4% | Industrials | 9.9% | Information Technology | 20.5% | Financials | 21.0% |
|
| Material Fund Change [Text Block] |
|