Exhibit 99.2
Pinnacle and Synovus to Combine: Building The Southeast Growth Champion July
24, 2025
Forward-Looking Statements Forward-Looking Statements This communication
contains statements that constitute “forward-looking statements” within the meaning of, and subject to the protections of, Section 27A of the Securities Act of 1933, as amended, and Section 21E of the Securities Exchange Act of 1934, as
amended. All statements other than statements of historical fact are forward-looking statements. These forward-looking statements include, but are not limited to, statements about the benefits of the proposed transaction between Synovus
Financial Corp. (“Synovus”) and Pinnacle Financial Partners, Inc. (“Pinnacle”), including future financial and operating results (including the anticipated impact of the proposed transaction on Synovus’ and Pinnacle’s respective earnings and
tangible book value), statements related to the expected timing of the completion of the proposed transaction, the combined company’s plans, objectives, expectations and intentions, and other statements that are not historical facts. You can
identify these forward-looking statements through the use of words such as “believes,” “anticipates,” “expects,” “may,” “will,” “assumes,” “should,” “predicts,” “could,” “would,” “intends,” “targets,” “estimates,” “projects,” “plans,”
“potential” and other similar words and expressions of the future or otherwise regarding the outlook for Synovus’, Pinnacle’s or combined company’s future businesses and financial performance and/or the performance of the banking industry and
economy in general. Prospective investors are cautioned that any such forward-looking statements are not guarantees of future performance and involve known and unknown risks and uncertainties which may cause the actual results, performance
or achievements of Synovus, Pinnacle or the combined company to be materially different from the future results, performance or achievements expressed or implied by such forward-looking statements. Forward-looking statements are based on the
information known to, and current beliefs and expectations of, Synovus or Pinnacle and are subject to significant risks and uncertainties. Actual results may differ materially from those contemplated by such forward-looking statements. A
number of factors could cause actual results to differ materially from those contemplated by the forward-looking statements in this communication. Many of these factors are beyond Synovus’, Pinnacle’s or the combined company’s ability to
control or predict. These factors include, among others, (1) the risk that the cost savings and synergies from the proposed transaction may not be fully realized or may take longer than anticipated to be realized, (2) disruption to Synovus’
business and to Pinnacle’s business as a result of the announcement and pendency of the proposed transaction, (3) the risk that the integration of Pinnacle’s and Synovus’ respective businesses and operations will be materially delayed or will
be more costly or difficult than expected, including as a result of unexpected factors or events, (4) the failure to obtain the necessary approvals by the shareholders of Synovus or Pinnacle, (5) the amount of the costs, fees, expenses and
charges related to the transaction, (6) the ability by each of Synovus and Pinnacle to obtain required governmental approvals of the proposed transaction on the timeline expected, or at all, and the risk that such approvals may result in the
imposition of conditions that could adversely affect the combined company after the closing of the proposed transaction or adversely affect the expected benefits of the proposed transaction, (7) reputational risk and the reaction of each
company’s customers, suppliers, employees or other business partners to the proposed, (8) the failure of the closing conditions in the merger agreement to be satisfied, or any unexpected delay in closing the proposed transaction or the
occurrence of any event, change or other circumstances that could give rise to the termination of the merger agreement, (9) the dilution caused by the issuance of shares of the combined company’s common stock in the transaction, (10) the
possibility that the proposed transaction may be more expensive to complete than anticipated, including as a result of unexpected factors or events, (11) risks related to management and oversight of the expanded business and operations of the
combined company following the closing of the proposed transaction, (12) the possibility the combined company is subject to additional regulatory requirements as a result of the proposed transaction or expansion of the combined company’s
business operations following the proposed transaction, (13) the outcome of any legal or regulatory proceedings or governmental inquiries or investigations that may be currently pending or later instituted against Synovus, Pinnacle or the
combined company and (14) general competitive, economic, political and market conditions and other factors that may affect future results of Synovus and Pinnacle including changes in asset quality and credit risk; the inability to sustain
revenue and earnings growth; changes in interest rates and capital markets; inflation; customer borrowing, repayment, investment and deposit practices; the impact, extent and timing of technological changes; and capital management activities.
Additional factors which could affect future results of Synovus and Pinnacle can be found in Synovus’ or Pinnacle’s filings with the Securities and Exchange Commission (the “SEC”), including in Synovus’ Annual Report on Form 10-K for the year
ended December 31, 2024, under the captions “Forward-Looking Statements” and “Risk Factors,” and Synovus’ Quarterly Reports on Form 10-Q and Current Reports on Form 8-K, and Pinnacle’s Annual Report on Form 10-K for the year ended December
31, 2024, under the captions “Forward-Looking Statements” and “Risk Factors,” and in Pinnacle’s Quarterly Reports on Form 10-Q and Current Reports on Form 8-K. Undue reliance should not be placed on any forward-looking statements, which are
based on current expectations and speak only as of the date that they are made. Synovus and Pinnacle do not assume any obligation to update any forward-looking statements as a result of new information, future developments or otherwise,
except as otherwise may be required by law.
Important Information About the Merger Important Information About the Merger
and Where to Find It Steel Newco Inc. (“Newco”) intends to file a registration statement on Form S-4 with the SEC to register the shares of Newco common stock that will be issued to Pinnacle shareholders and Synovus shareholders in
connection with the proposed transaction. The registration statement will include a joint proxy statement of Synovus and Pinnacle that also constitutes a prospectus of Newco. The definitive joint proxy statement/prospectus will be sent to the
shareholders of each of Synovus and Pinnacle in connection with the proposed transaction. INVESTORS AND SECURITY HOLDERS ARE URGED TO READ THE REGISTRATION STATEMENT AND JOINT PROXY STATEMENT/PROSPECTUS WHEN THEY BECOME AVAILABLE (AND ANY
OTHER DOCUMENTS FILED WITH THE SEC IN CONNECTION WITH THE TRANSACTION OR INCORPORATED BY REFERENCE INTO THE JOINT PROXY STATEMENT/PROSPECTUS) BECAUSE SUCH DOCUMENTS WILL CONTAIN IMPORTANT INFORMATION REGARDING THE PROPOSED TRANSACTION AND
RELATED MATTERS. Investors and security holders may obtain free copies of these documents and other documents filed with the SEC by Synovus, Pinnacle or Newco through the website maintained by the SEC at http://www.sec.gov or by contacting
the investor relations department of Synovus or Pinnacle at: Synovus Financial Corp. Pinnacle Financial Partners, Inc. 33 West 14th Street 21 Platform Way South Columbus, GA 31901 Nashville, TN 37203 Attention: Investor
Relations Attention: Investor Relations InvestorRelations@synovus.com (706) 641-6500 investorrelations@pnfp.com (615) 743-8219 Before making any voting or investment decision, investors and security holders of Synovus and Pinnacle are
urged to read carefully the entire registration statement and joint proxy statement/prospectus when they become available, including any amendments thereto, because they will contain important information about the proposed transaction. Free
copies of these documents may be obtained as described above.
Additional Statements Participants in Solicitation Synovus and Pinnacle and
their respective directors and executive officers and other members of management and employees may be deemed to be participants in the solicitation of proxies from Synovus’ shareholders and Pinnacle’s shareholders in respect of the proposed
transaction under the rules of the SEC. Information regarding Synovus’ directors and executive officers is available in Synovus’ proxy statement for its 2025 annual meeting of shareholders, filed with the SEC on March 12, 2025 (and available
at https://www.sec.gov/ix?doc=/Archives/edgar/data/0000018349/000001834925000057/syn-20250312.htm) (the “Synovus 2025 Proxy”), under the headings “Corporate Governance and Board Matters,” “Director Compensation,” “Proposal 1 Election of
Directors,” “Executive Officers,” “Stock Ownership of Directors and Named Executive Officers,” “Executive Compensation,” “Compensation and Human Capital Committee Report,” “Summary Compensation Table,” and “Certain Relationships and Related
Transactions,” and in Synovus’ Annual Report on Form 10-K for the year ended December 31, 2024, filed with the SEC on February 21, 2025 (and available at
https://www.sec.gov/ix?doc=/Archives/edgar/data/0000018349/000001834925000049/syn-20241231.htm), and in other documents subsequently filed by Synovus with the SEC, which can be obtained free of charge through the website maintained by the SEC
at http://www.sec.gov. Any changes in the holdings of Synovus’ securities by Synovus’ directors or executive officers from the amounts described in the Synovus 2025 Proxy have been or will be reflected on Initial Statements of Beneficial
Ownership of Securities on Form 3 or on Statements of Change in Ownership on Form 4 filed with the SEC subsequent to the filing date of the Synovus 2025 Proxy and are available at the SEC’s website at www.sec.gov. Information regarding
Pinnacle’s directors and executive officers is available in Pinnacle’s proxy statement for its 2025 annual meeting of shareholders, filed with the SEC on March 3, 2025 (and available at
https://www.sec.gov/ix?doc=/Archives/edgar/data/1115055/000111505525000063/pnfp-20250303.htm) (the “Pinnacle 2025 Proxy”), under the headings “Environmental, Social and Corporate Governance,” “Proposal 1 Election of Directors,” “Information
About Our Executive Officers,” “Executive Compensation,” “Security Ownership of Certain Beneficial Owners and Management,” and “Certain Relationships and Related Transactions,” and in Pinnacle’s Annual Report on Form 10-K for the year ended
December 31, 2024, filed with the SEC on February 25, 2025 (and available at https://www.sec.gov/ix?doc=/Archives/edgar/data/1115055/000111505525000042/pnfp-20241231.htm), and in other documents subsequently filed by Pinnacle with the SEC,
which can be obtained free of charge through the website maintained by the SEC at http://www.sec.gov. Any changes in the holdings of Pinnacle’s securities by Pinnacle’s directors or executive officers from the amounts described in the
Pinnacle 2025 Proxy have been or will be reflected on Initial Statements of Beneficial Ownership of Securities on Form 3 or on Statements of Change in Ownership on Form 4 filed with the SEC subsequent to the filing date of the Pinnacle 2025
Proxy and are available at the SEC’s website at www.sec.gov. Additional information regarding the interests of such participants will be included in the joint proxy statement/prospectus and other relevant materials to be filed with the
SEC. No Offer or Solicitation This communication does not constitute an offer to sell or the solicitation of an offer to buy any securities or a solicitation of any vote or approval, nor shall there be any sale of securities in any
jurisdiction in which such offer, solicitation or sale would be unlawful prior to registration or qualification under the securities laws of any such jurisdiction. No offer of securities shall be made except by means of a prospectus meeting
the requirements of Section 10 of the Securities Act of 1933, as amended.
Terry Turner President and Chief Executive Officer Kevin Blair Chairman,
Chief Executive Officer and President Jamie Gregory Chief Financial Officer Harold Carpenter Chief Financial Officer Today’s Speakers
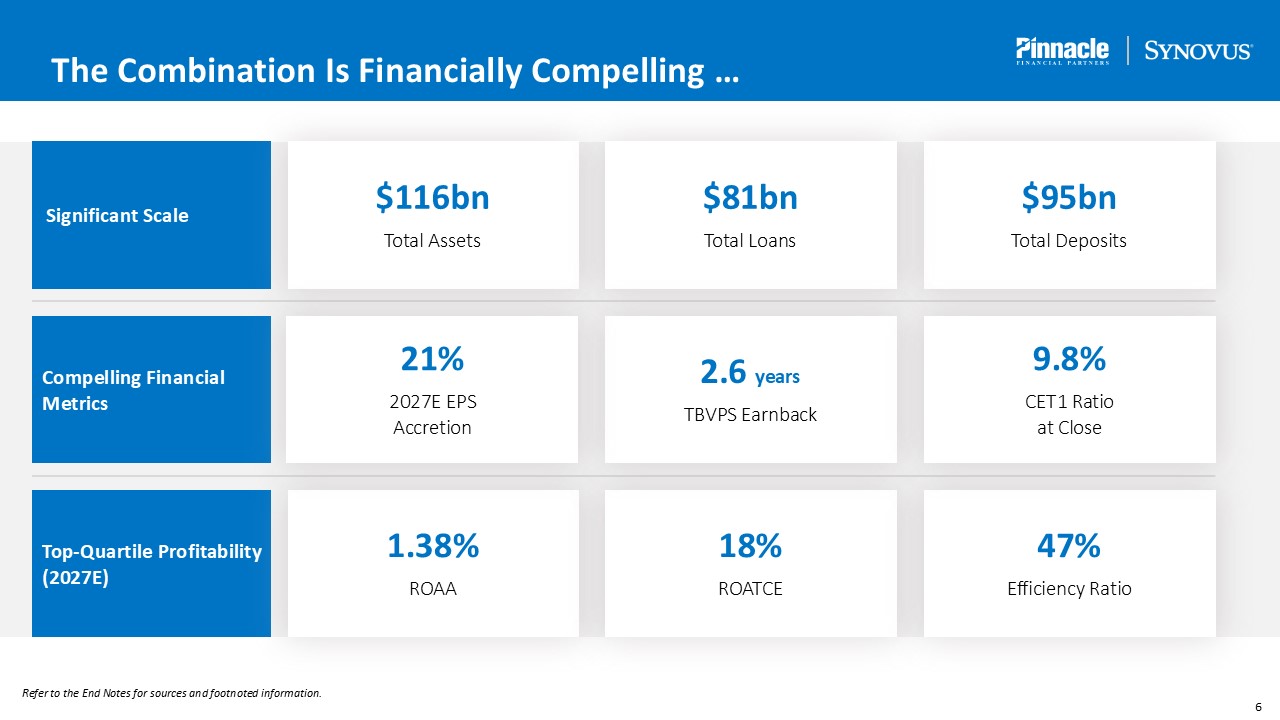
The Combination Is Financially Compelling … Refer to the End Notes for sources
and footnoted information. Significant Scale Top-Quartile Profitability (2027E) Compelling Financial Metrics 1.38% ROAA 18% ROATCE $116bn Total Assets $95bn Total Deposits 2.6 years TBVPS Earnback $81bn Total
Loans 47% Efficiency Ratio 21% 2027E EPS Accretion 9.8% CET1 Ratio at Close

… And Positioned to Deliver for Clients and Investors … Refer to the End Notes
for sources and footnoted information. High-Growth Market Focus Winning Culture Exceptional Client Service Track Record of Profitable Growth Efficient Operating Model Driver Pro Forma 5.1% 4.3% 4.6% (#1 among peers) 4.0 /
#2 4.2 / #1 Employer of choice in our markets #3 #6 $212 million $195 million 13.1% 11.4% Top-quartile revenue and net income growth, with strong risk discipline Trusted partner to our clients $202 million (#1 among peers) 55%
52% 47% (#1 among peers) 12.8% 7.2% Metric Last 10 Years Adj. EPS Growth Last 10 Years Adj. Revenue Growth Household Growth Employee Satisfaction (Glassdoor) J.D. Power Top 50 Banks: Overall Satisfaction Avg. Deposits per
Branch Efficiency Ratio (2027E)
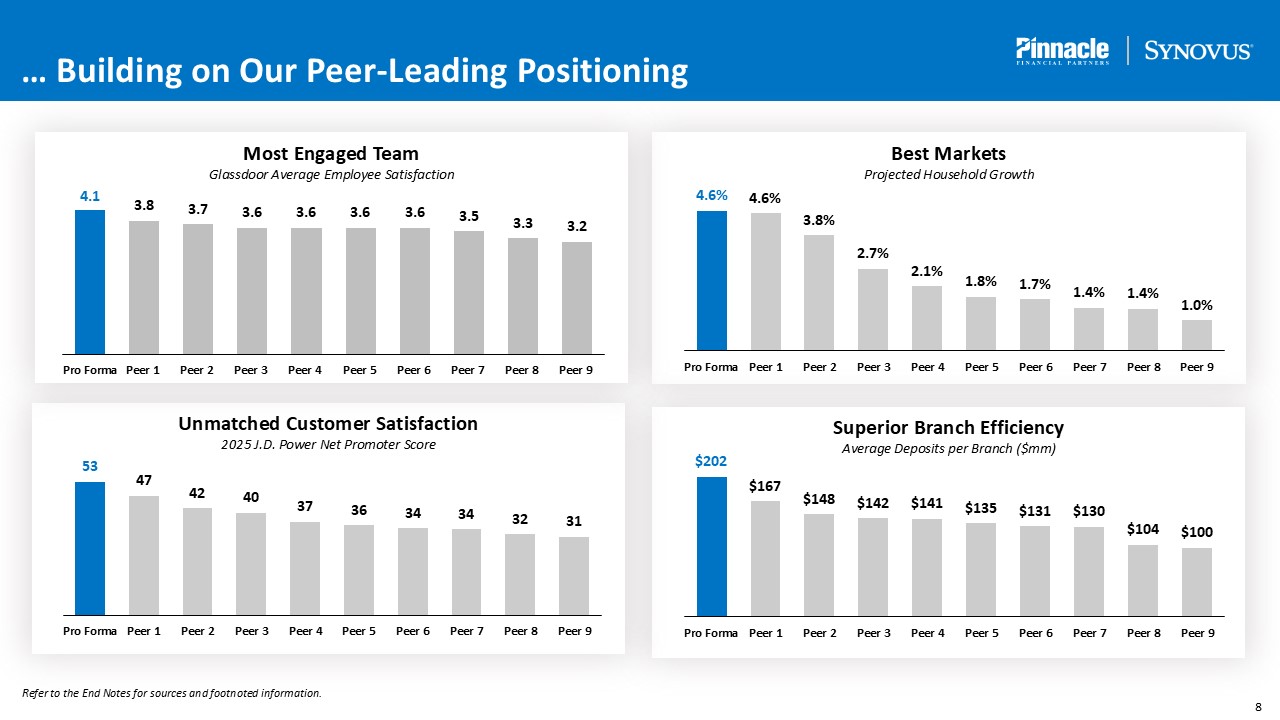
… Building on Our Peer-Leading Positioning Superior Branch Efficiency Average
Deposits per Branch ($mm) Best Markets Projected Household Growth Unmatched Customer Satisfaction 2025 J.D. Power Net Promoter Score Most Engaged Team Glassdoor Average Employee Satisfaction Refer to the End Notes for sources and
footnoted information.
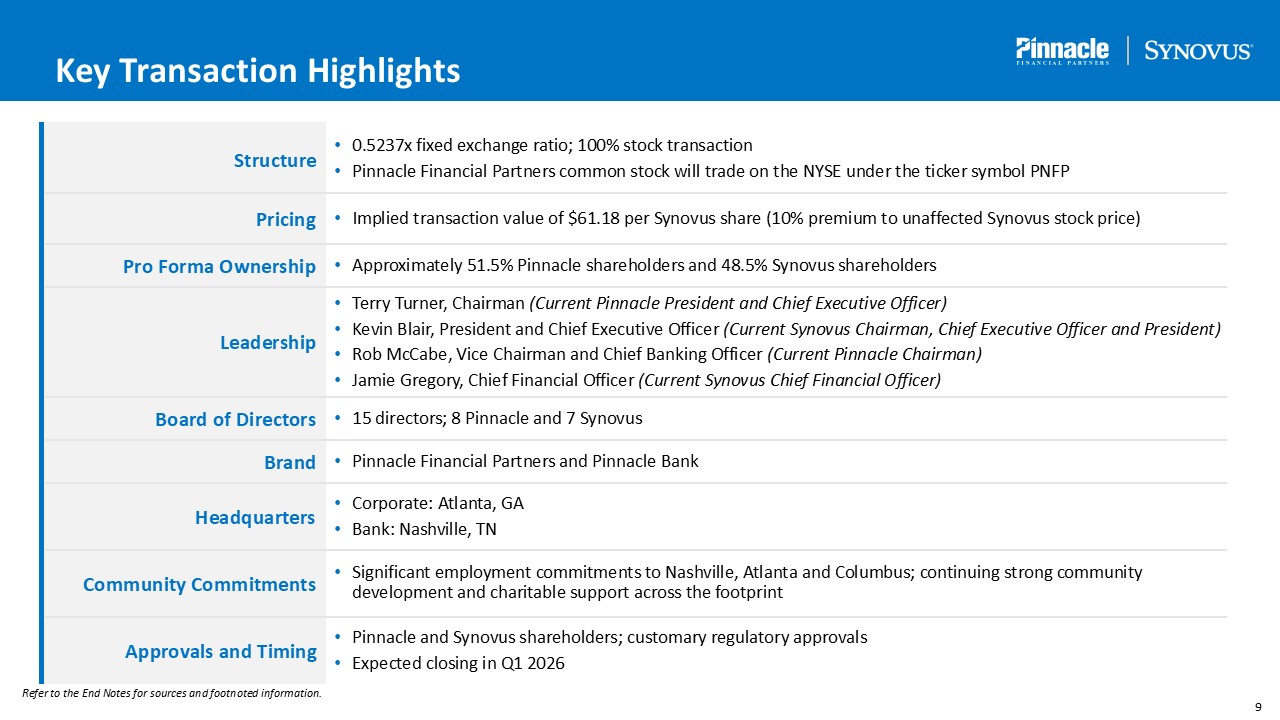
Key Transaction Highlights Structure 0.5237x fixed exchange ratio; 100% stock
transaction Pinnacle Financial Partners common stock will trade on the NYSE under the ticker symbol PNFP Pricing Leadership Board of Directors Pro Forma Ownership Brand Headquarters Community Commitments Approvals and Timing Implied
transaction value of $61.18 per Synovus share (10% premium to unaffected Synovus stock price) Terry Turner, Chairman (Current Pinnacle President and Chief Executive Officer) Kevin Blair, President and Chief Executive Officer (Current
Synovus Chairman, Chief Executive Officer and President) Rob McCabe, Vice Chairman and Chief Banking Officer (Current Pinnacle Chairman) Jamie Gregory, Chief Financial Officer (Current Synovus Chief Financial Officer) 15 directors; 8
Pinnacle and 7 Synovus Approximately 51.5% Pinnacle shareholders and 48.5% Synovus shareholders Pinnacle Financial Partners and Pinnacle Bank Corporate: Atlanta, GA Bank: Nashville, TN Significant employment commitments to Nashville,
Atlanta and Columbus; continuing strong community development and charitable support across the footprint Pinnacle and Synovus shareholders; customary regulatory approvals Expected closing in Q1 2026 Refer to the End Notes for sources and
footnoted information.
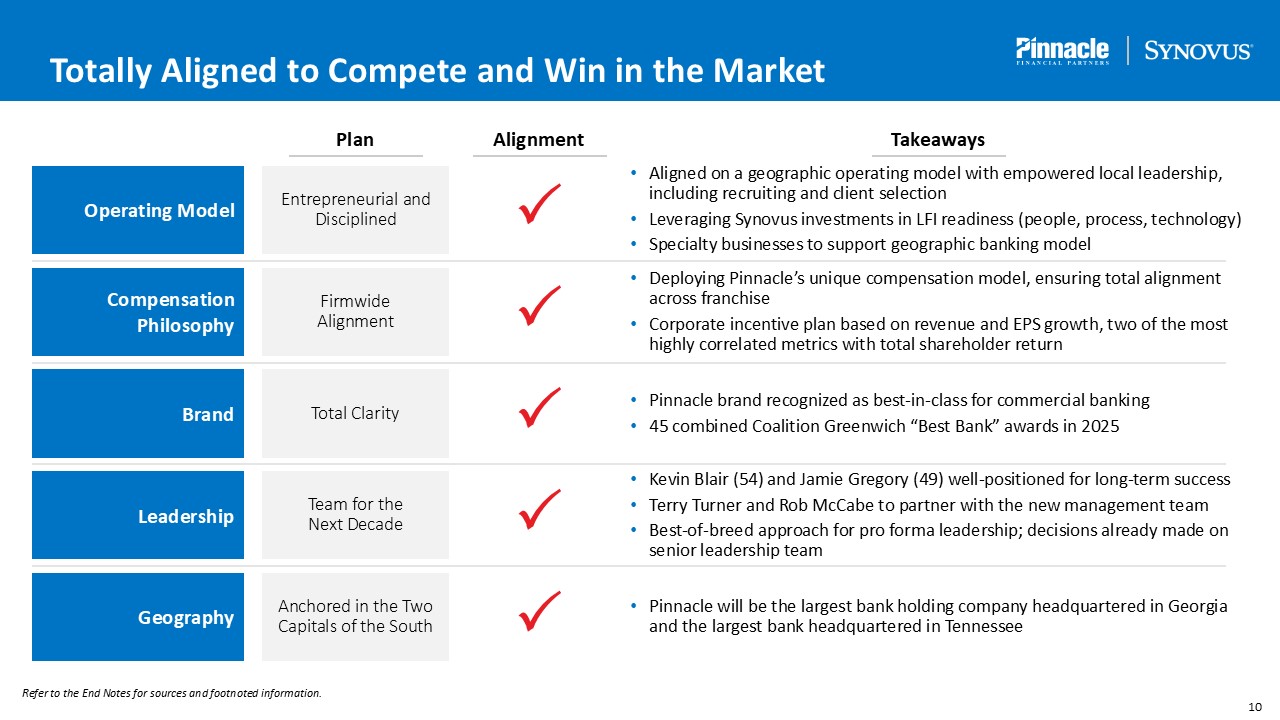
Totally Aligned to Compete and Win in the Market Operating Model Compensation
Philosophy Brand Leadership Geography Plan Alignment Takeaways Entrepreneurial and Disciplined Firmwide Alignment Total Clarity Team for the Next Decade Anchored in the Two Capitals of the South P P P P P Aligned on a
geographic operating model with empowered local leadership, including recruiting and client selection Leveraging Synovus investments in LFI readiness (people, process, technology) Specialty businesses to support geographic banking
model Deploying Pinnacle’s unique compensation model, ensuring total alignment across franchise Corporate incentive plan based on revenue and EPS growth, two of the most highly correlated metrics with total shareholder return Pinnacle
brand recognized as best-in-class for commercial banking 45 combined Coalition Greenwich “Best Bank” awards in 2025 Kevin Blair (54) and Jamie Gregory (49) well-positioned for long-term success Terry Turner and Rob McCabe to partner with
the new management team Best-of-breed approach for pro forma leadership; decisions already made on senior leadership team Pinnacle will be the largest bank holding company headquartered in Georgia and the largest bank headquartered in
Tennessee Refer to the End Notes for sources and footnoted information.
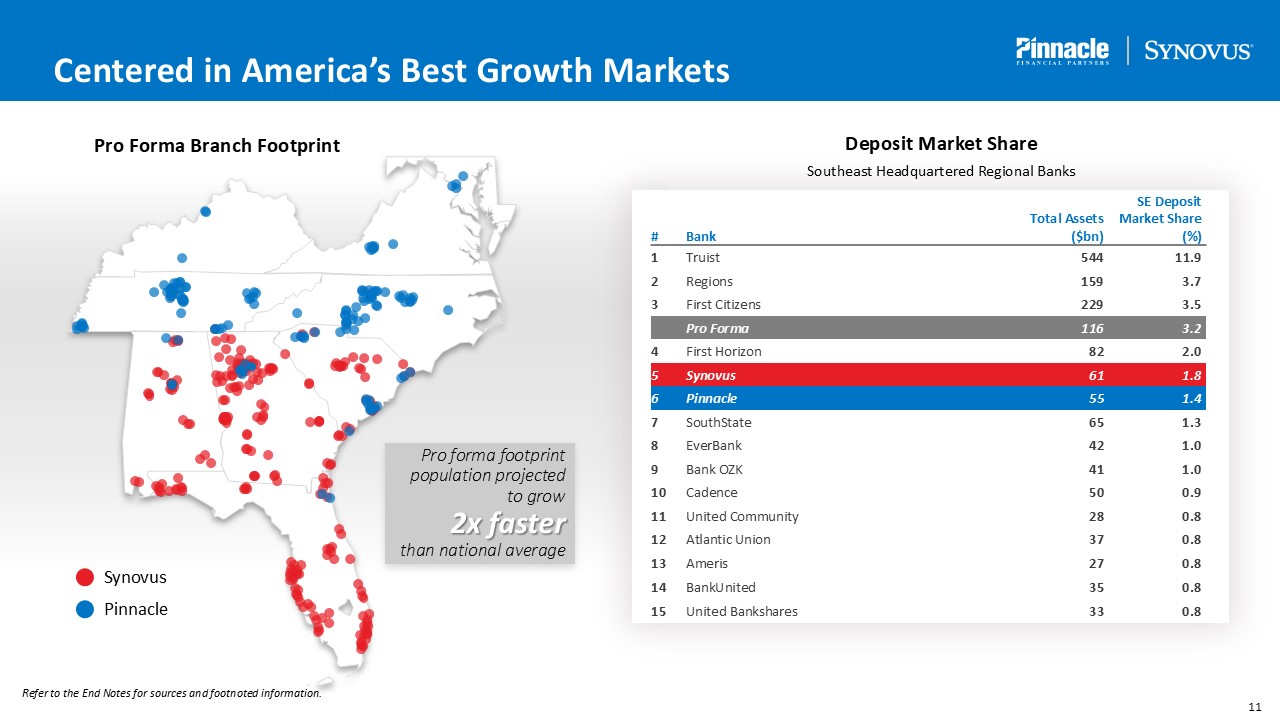
Pro Forma Branch Footprint Deposit Market Share Southeast Headquartered
Regional Banks Synovus Pinnacle Pro forma footprint population projected to grow 2x faster than national average Total Assets SE Deposit Market Share # Bank ($bn) (%) 1 Truist 544 11.9 2 Regions 159 3.7 3 First
Citizens 229 3.5 Pro Forma 116 3.2 4 First Horizon 82 2.0 5 Synovus 61 1.8 6 Pinnacle 55 1.4 7 SouthState 65 1.3 8 EverBank 42 1.0 9 Bank OZK 41 1.0 10 Cadence 50 0.9 11 United
Community 28 0.8 12 Atlantic Union 37 0.8 13 Ameris 27 0.8 14 BankUnited 35 0.8 15 United Bankshares 33 0.8 Refer to the End Notes for sources and footnoted information. Centered in America’s Best Growth Markets
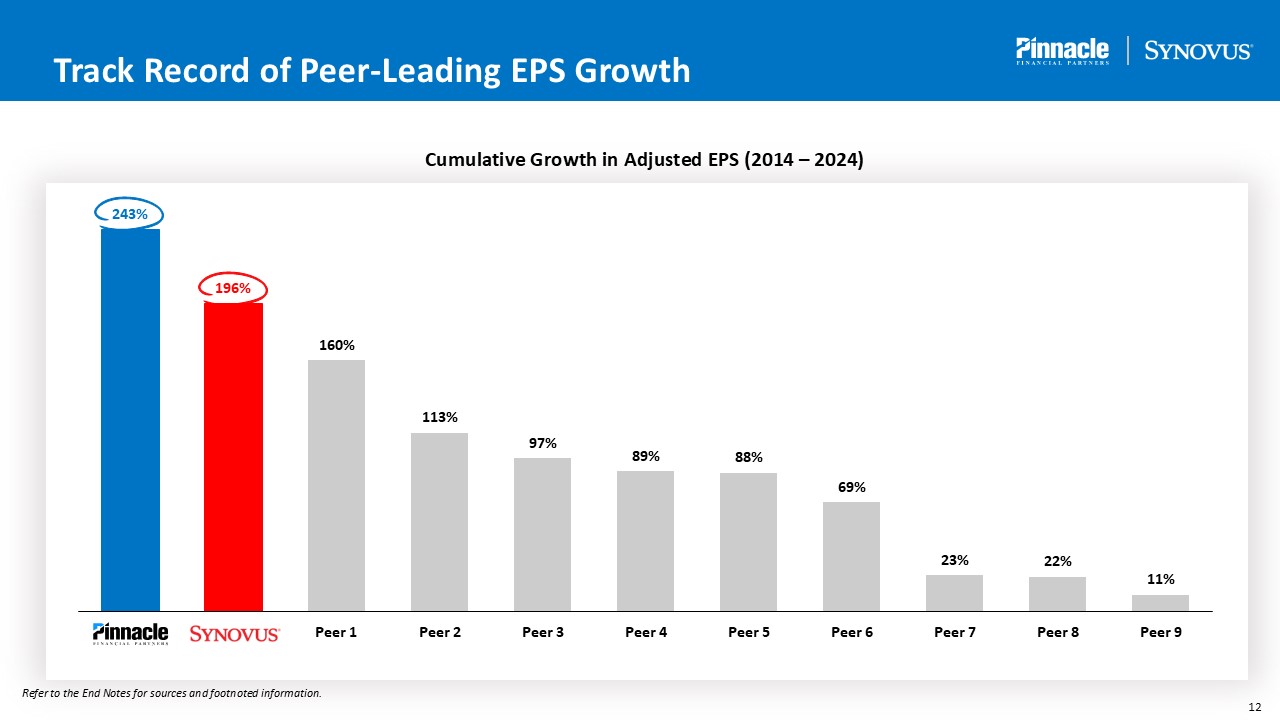
Cumulative Growth in Adjusted EPS (2014 – 2024) Refer to the End Notes for
sources and footnoted information. Track Record of Peer-Leading EPS Growth
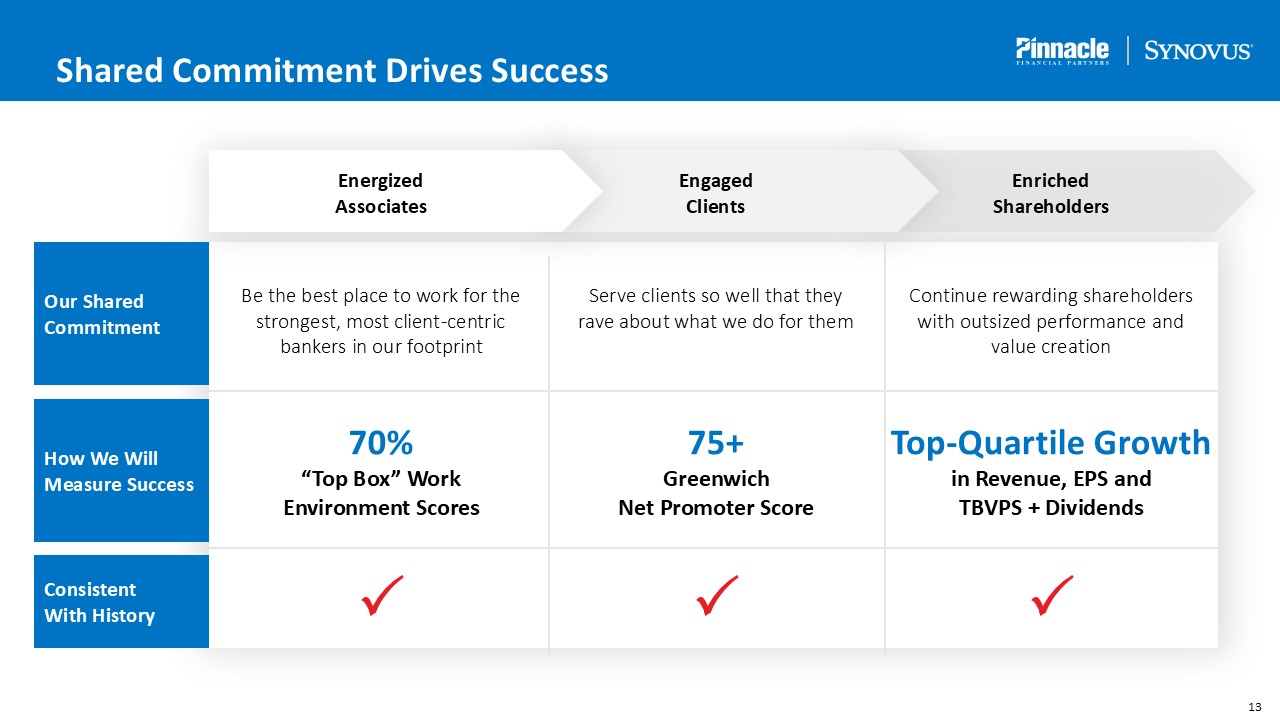
Shared Commitment Drives Success Be the best place to work for the strongest,
most client-centric bankers in our footprint 70% “Top Box” Work Environment Scores P Serve clients so well that they rave about what we do for them 75+ Greenwich Net Promoter Score P Continue rewarding shareholders with outsized
performance and value creation Top-Quartile Growth in Revenue, EPS and TBVPS + Dividends P EnergizedAssociates Engaged Clients EnrichedShareholders How We Will Measure Success Consistent With History Our Shared Commitment
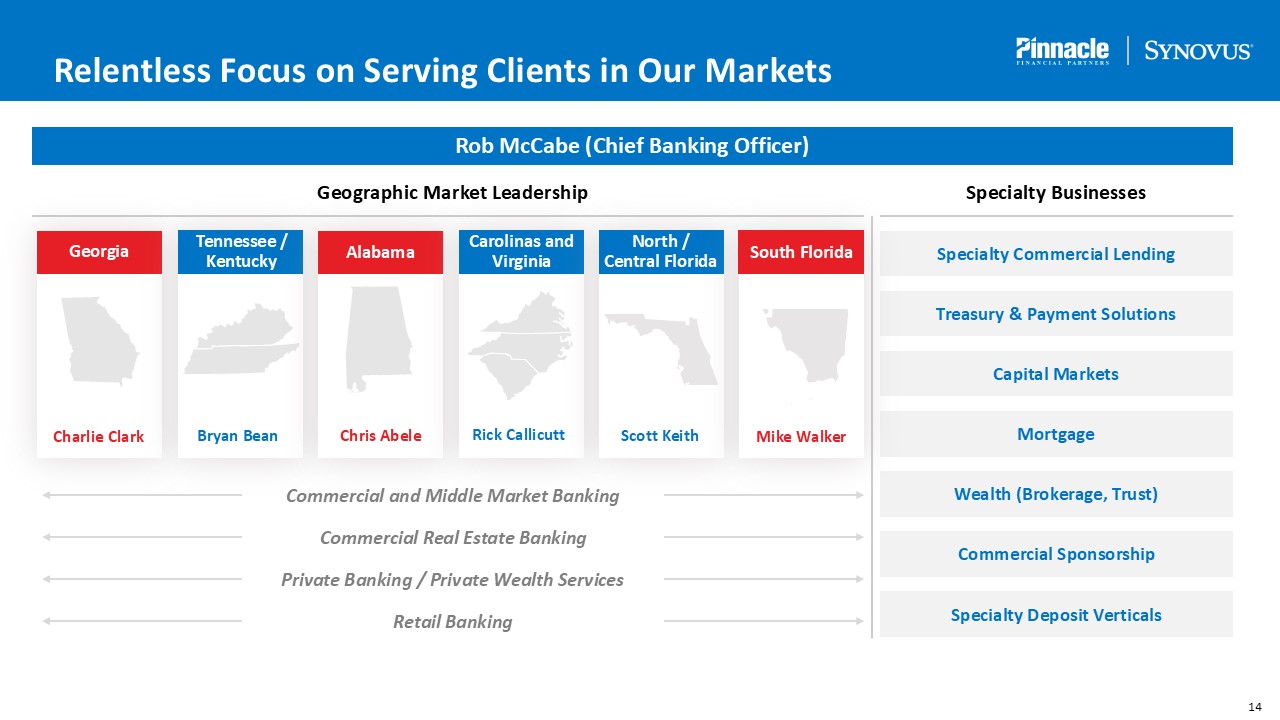
Relentless Focus on Serving Clients in Our Markets Commercial and Middle
Market Banking Commercial Real Estate Banking Private Banking / Private Wealth Services Retail Banking Geographic Market Leadership Specialty Businesses Specialty Commercial Lending Treasury & Payment Solutions Capital
Markets Mortgage Wealth (Brokerage, Trust) Commercial Sponsorship Specialty Deposit Verticals Rob McCabe (Chief Banking Officer) Charlie Clark Georgia Bryan Bean Tennessee / Kentucky Chris Abele Alabama Rick Callicutt Carolinas
and Virginia Scott Keith North / Central Florida Mike Walker South Florida
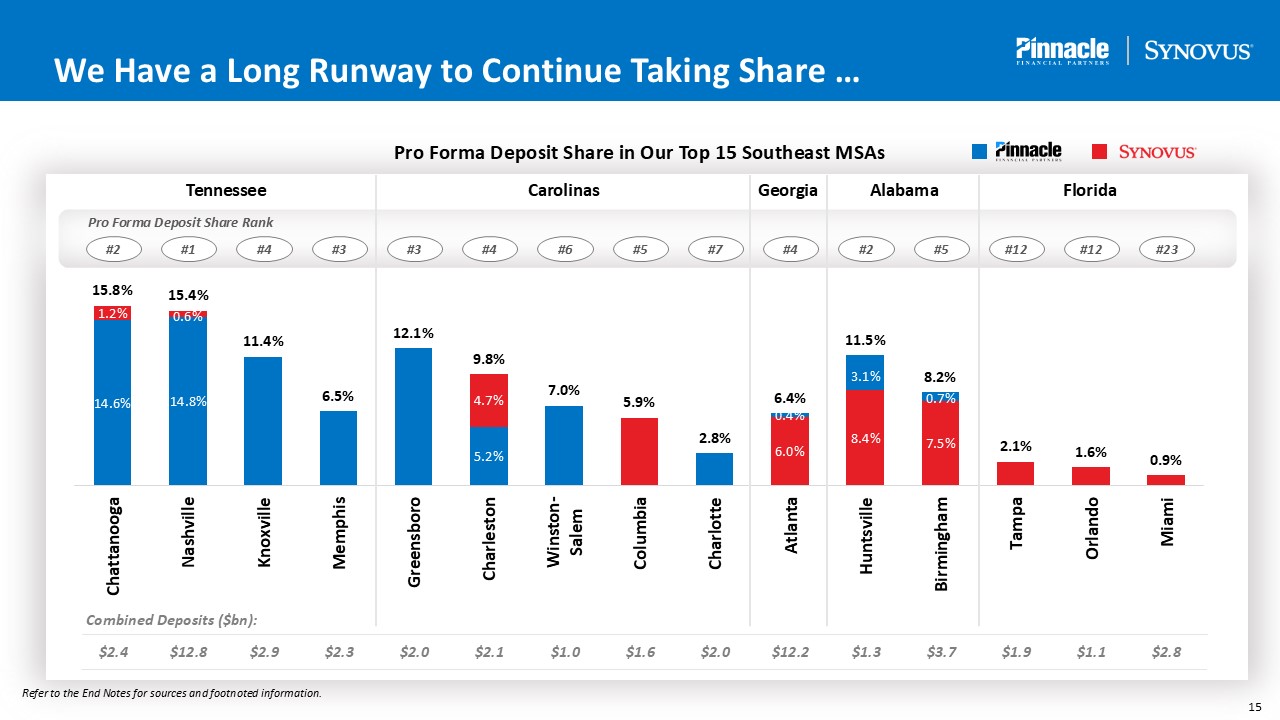
We Have a Long Runway to Continue Taking Share … Pro Forma Deposit Share in Our
Top 15 Southeast MSAs Pro Forma Deposit Share Rank Tennessee Carolinas Georgia Florida Alabama #2 #1 #4 #3 #3 #4 #6 #5 #7 #2 #5 #12 #12 #23 #4 Combined Deposits
($bn): $2.4 $12.8 $2.9 $2.3 $2.0 $2.1 $1.0 $1.6 $2.0 $12.2 $1.3 $3.7 $1.9 $1.1 $2.8 Refer to the End Notes for sources and footnoted information.
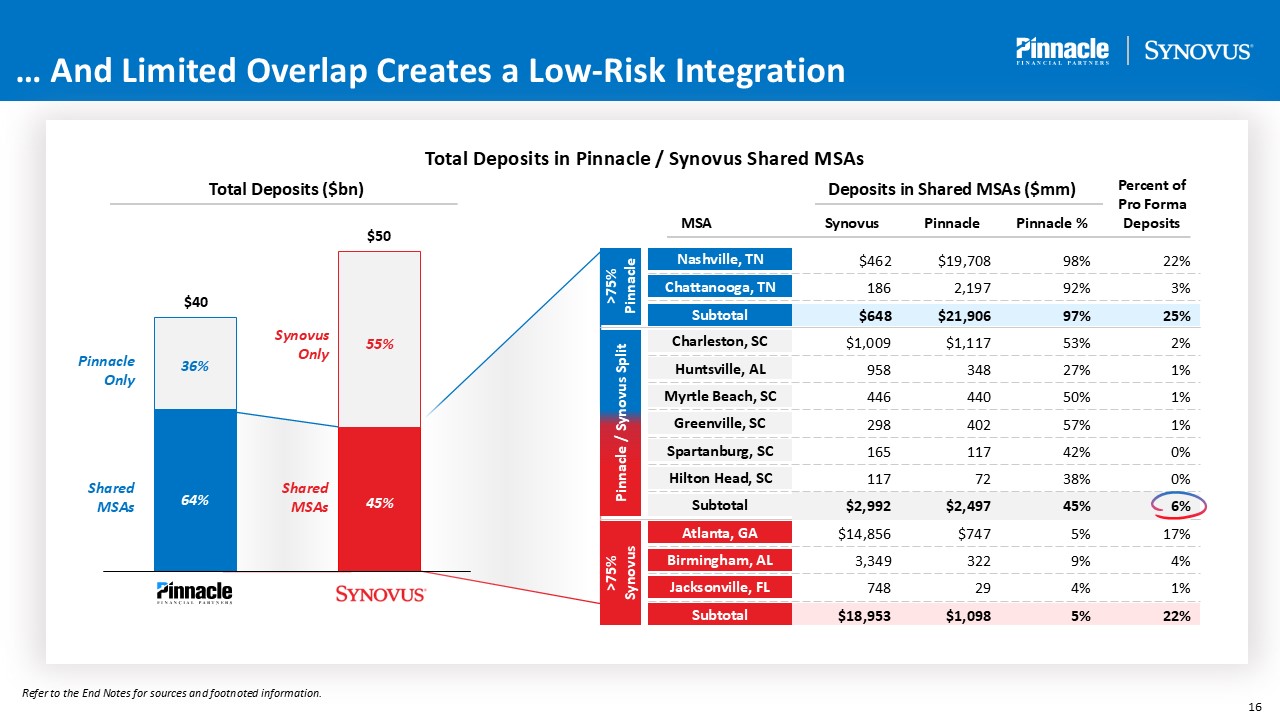
… And Limited Overlap Creates a Low-Risk Integration Total Deposits in Pinnacle
/ Synovus Shared MSAs >75% Pinnacle Pinnacle / Synovus Split >75% Synovus Nashville, TN Chattanooga, TN Charleston, SC Myrtle Beach, SC Greenville, SC Spartanburg, SC Hilton Head, SC Atlanta, GA Birmingham,
AL Huntsville, AL Jacksonville, FL Subtotal Subtotal Subtotal Percent of Pro Forma Deposits Pinnacle % Pinnacle Synovus Deposits in Shared MSAs ($mm) MSA Total Deposits ($bn) Shared MSAs Pinnacle Only Shared MSAs Synovus
Only 64% 45% 36% 55% $462 $19,708 98% 22% 186 2,197 92% 3% $648 $21,906 97% 25% $1,009 $1,117 53% 2% 958 348 27% 1% 446 440 50% 1% 298 402 57% 1% 165 117 42% 0% 117 72
38% 0% $2,992 $2,497 45% 6% $14,856 $747 5% 17% 3,349 322 9% 4% 748 29 4% 1% $18,953 $1,098 5% 22% Refer to the End Notes for sources and footnoted information.
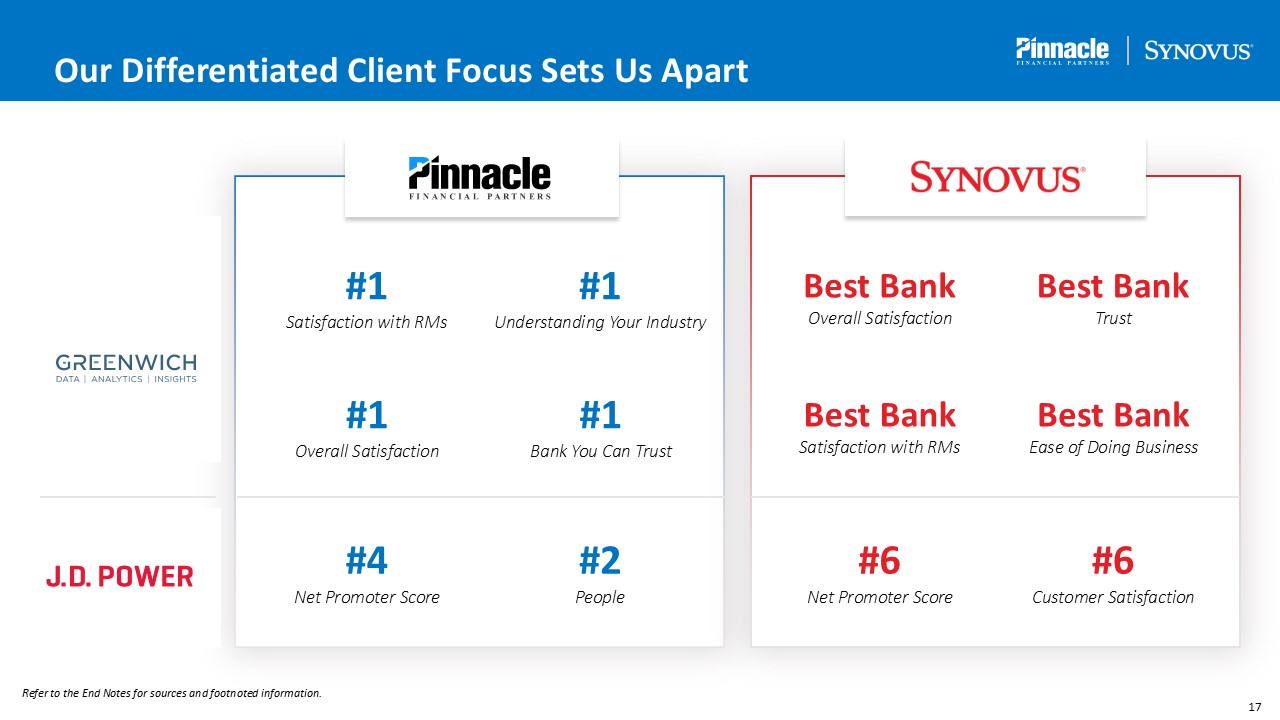
#6 Customer Satisfaction #6 Net Promoter Score #2 People #4 Net Promoter
Score Best Bank Ease of Doing Business Best Bank Satisfaction with RMs #1 Bank You Can Trust #1 Overall Satisfaction Best Bank Trust Best Bank Overall Satisfaction #1 Understanding Your Industry #1 Satisfaction with RMs Our
Differentiated Client Focus Sets Us Apart Refer to the End Notes for sources and footnoted information.
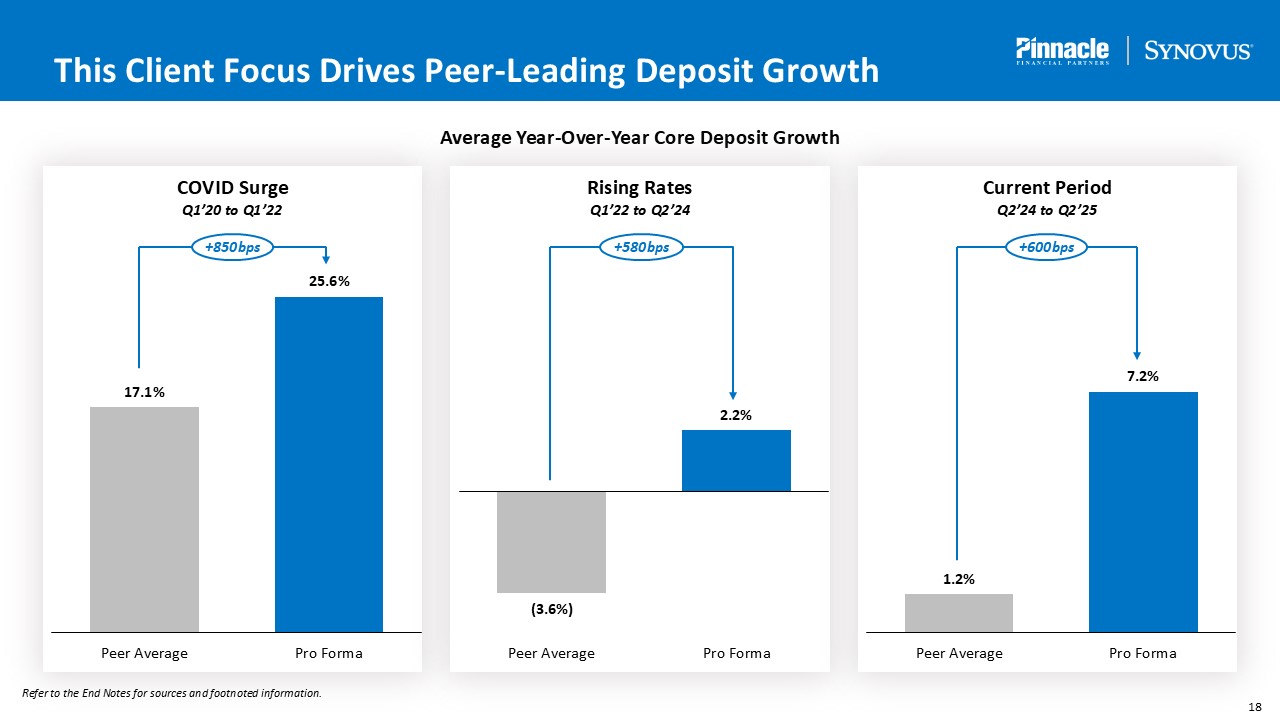
2 COVID Surge Q1’20 to Q1’22 This Client Focus Drives Peer-Leading Deposit
Growth Average Year-Over-Year Core Deposit Growth Rising Rates Q1’22 to Q2’24 Current Period Q2’24 to Q2’25 +850bps +580bps +600bps Refer to the End Notes for sources and footnoted information.
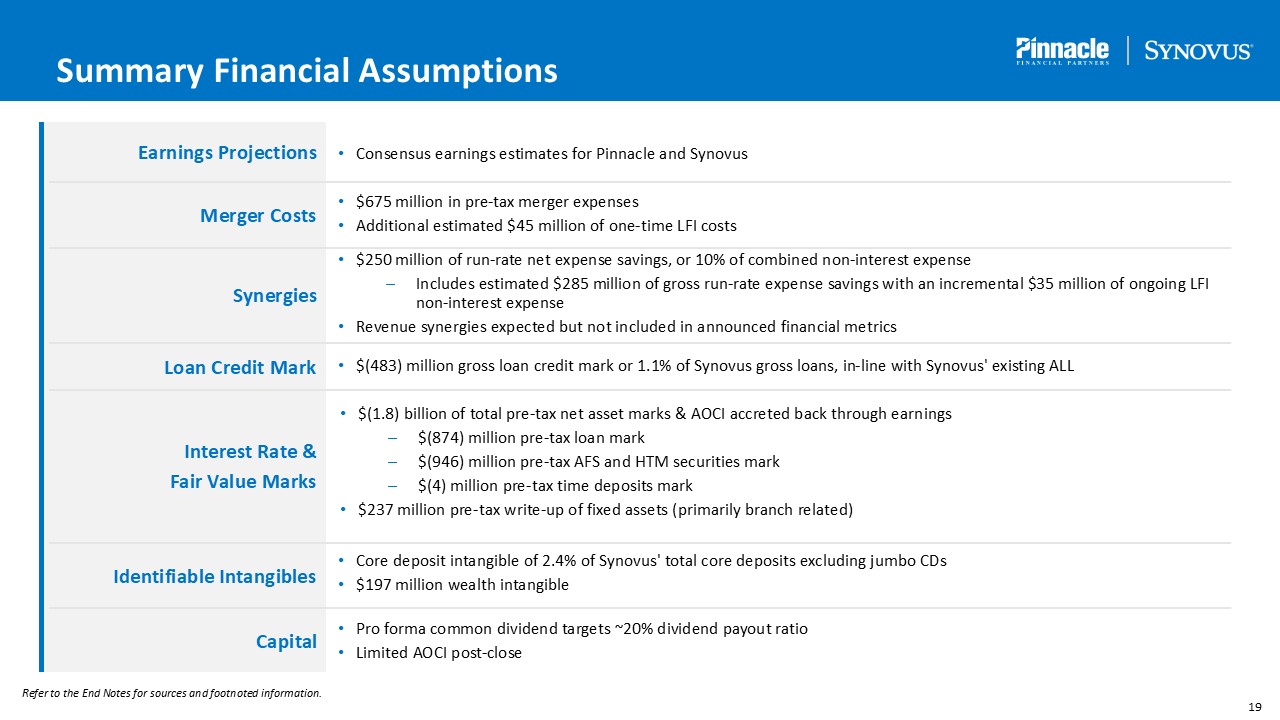
Summary Financial Assumptions Earnings Projections Consensus earnings
estimates for Pinnacle and Synovus Merger Costs Synergies Loan Credit Mark Interest Rate & Fair Value Marks Capital $675 million in pre-tax merger expenses Additional estimated $45 million of one-time LFI costs $250 million of
run-rate net expense savings, or 10% of combined non-interest expense Includes estimated $285 million of gross run-rate expense savings with an incremental $35 million of ongoing LFI non-interest expense Revenue synergies expected but not
included in announced financial metrics $(483) million gross loan credit mark or 1.1% of Synovus gross loans, in-line with Synovus' existing ALL Core deposit intangible of 2.4% of Synovus' total core deposits excluding jumbo CDs $197
million wealth intangible Identifiable Intangibles Pro forma common dividend targets ~20% dividend payout ratio Limited AOCI post-close $(1.8) billion of total pre-tax net asset marks & AOCI accreted back through earnings $(874)
million pre-tax loan mark $(946) million pre-tax AFS and HTM securities mark $(4) million pre-tax time deposits mark $237 million pre-tax write-up of fixed assets (primarily branch related) Refer to the End Notes for sources and footnoted
information.
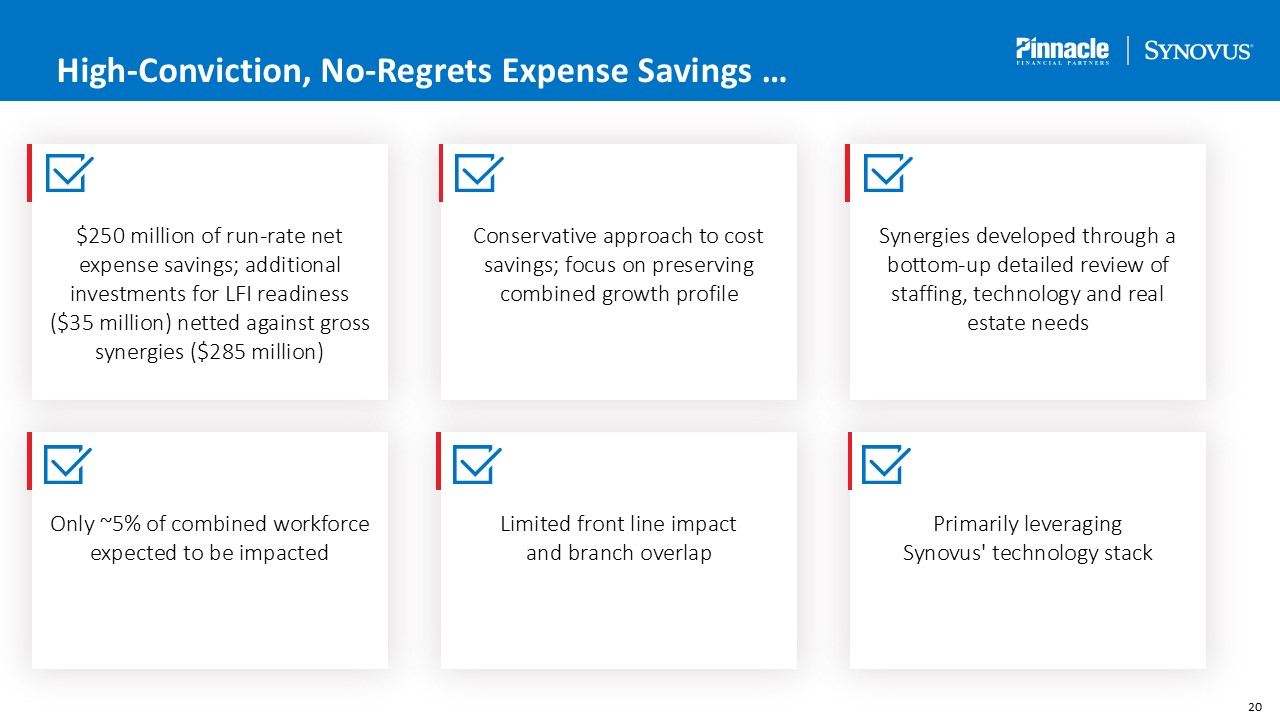
High-Conviction, No-Regrets Expense Savings … $250 million of run-rate net
expense savings; additional investments for LFI readiness ($35 million) netted against gross synergies ($285 million) Limited front line impact and branch overlap Only ~5% of combined workforce expected to be impacted Synergies developed
through a bottom-up detailed review of staffing, technology and real estate needs Conservative approach to cost savings; focus on preserving combined growth profile Primarily leveraging Synovus' technology stack
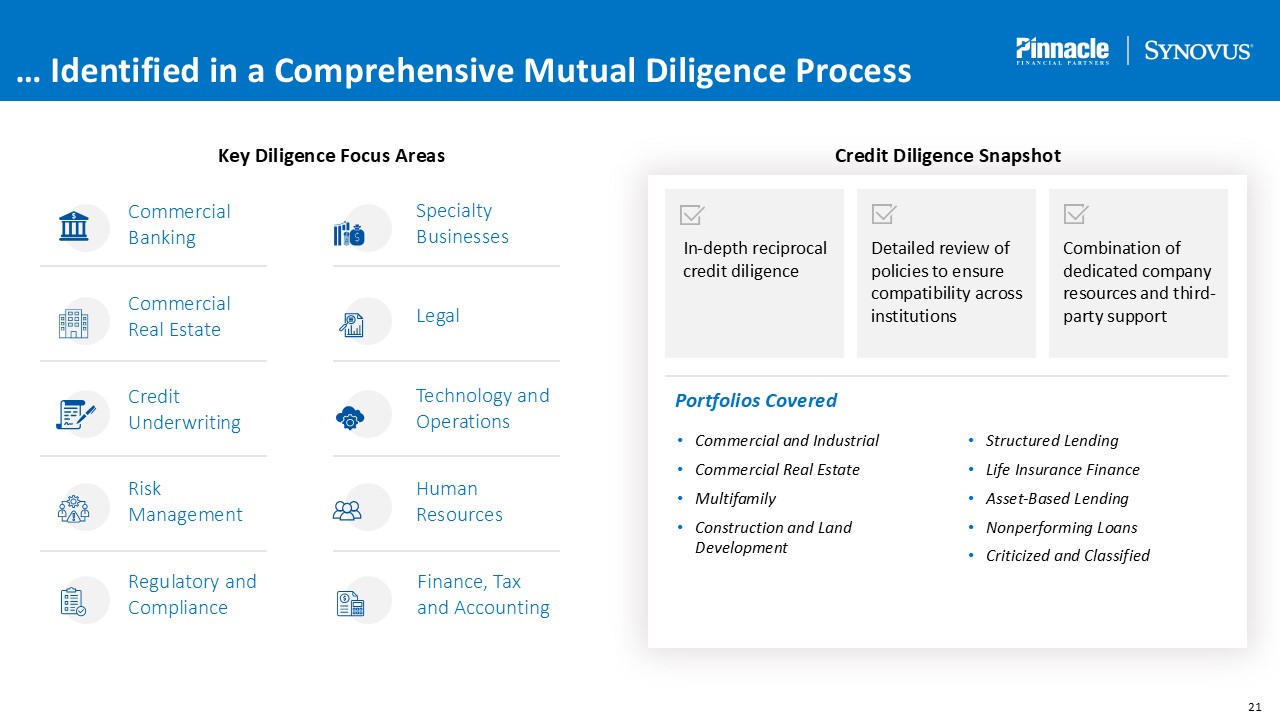
Commercial Banking … Identified in a Comprehensive Mutual Diligence
Process Key Diligence Focus Areas Specialty Businesses Commercial Real Estate Credit Underwriting Legal Risk Management Technology and Operations Regulatory and Compliance Finance, Tax and Accounting Human Resources Credit
Diligence Snapshot In-depth reciprocal credit diligence Detailed review of policies to ensure compatibility across institutions Combination of dedicated company resources and third-party support Portfolios Covered Commercial and
Industrial Commercial Real Estate Multifamily Construction and Land Development Structured Lending Life Insurance Finance Asset-Based Lending Nonperforming Loans Criticized and Classified
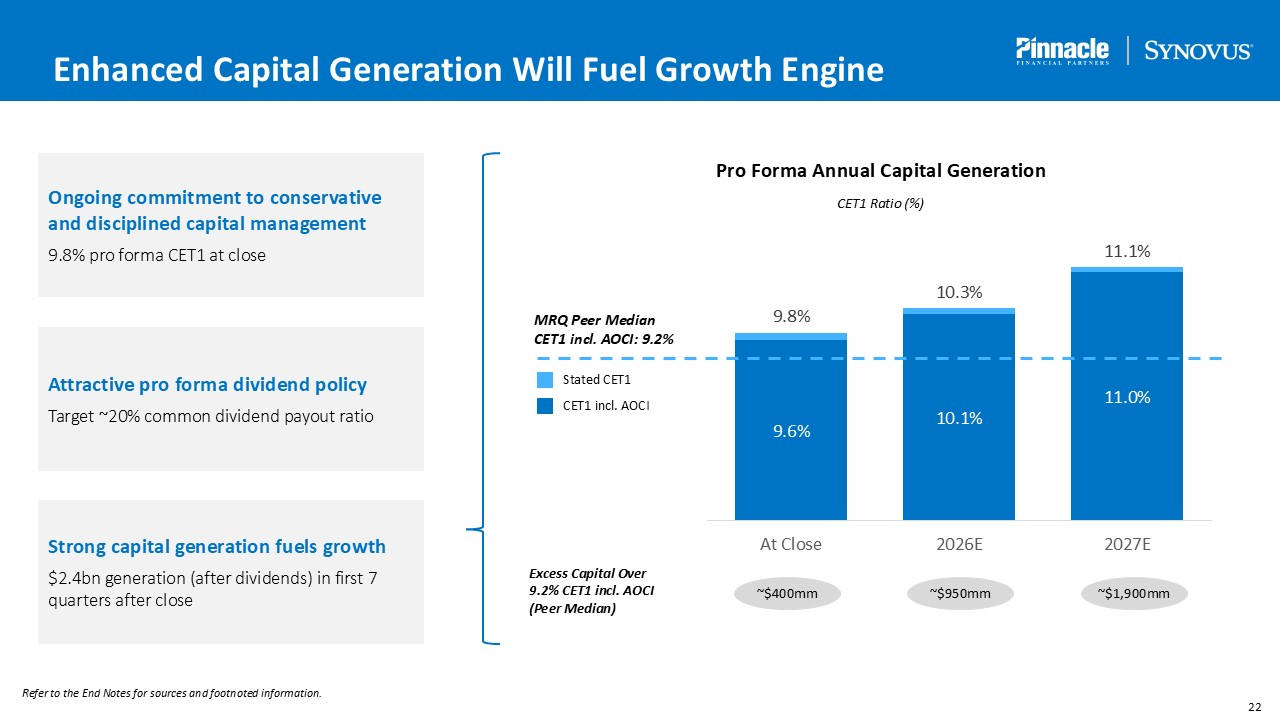
Enhanced Capital Generation Will Fuel Growth Engine Ongoing commitment to
conservative and disciplined capital management 9.8% pro forma CET1 at close Pro Forma Annual Capital Generation CET1 Ratio (%) Stated CET1 Excess Capital Over 9.2% CET1 incl. AOCI (Peer Median) ~$400mm ~$950mm ~$1,900mm Attractive
pro forma dividend policy Target ~20% common dividend payout ratio Strong capital generation fuels growth $2.4bn generation (after dividends) in first 7 quarters after close CET1 incl. AOCI MRQ Peer Median CET1 incl. AOCI: 9.2% Refer to
the End Notes for sources and footnoted information.
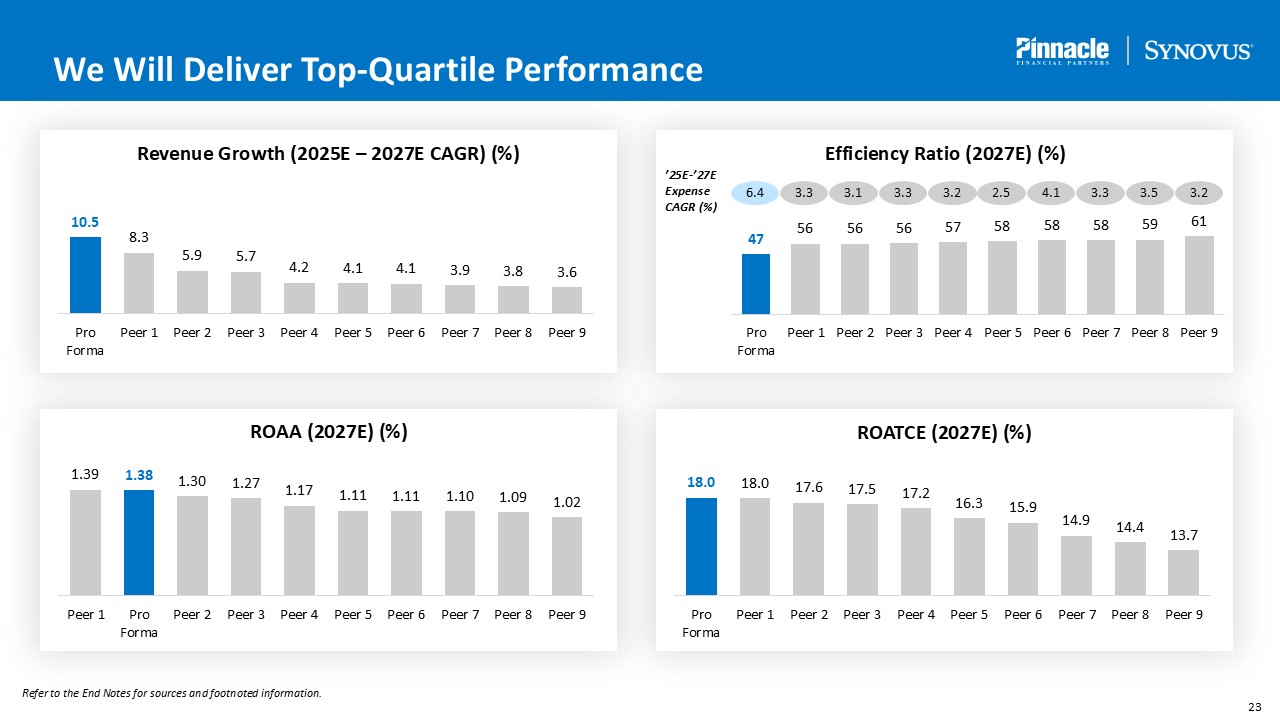
We Will Deliver Top-Quartile Performance Refer to the End Notes for sources and
footnoted information. Revenue Growth (2025E – 2027E CAGR) (%) ROAA (2027E) (%) ROATCE (2027E) (%) Efficiency Ratio (2027E) (%) ’25E-’27E Expense CAGR (%) 6.4 3.3 3.1 3.3 3.2 2.5 4.1 3.3 3.5 3.2
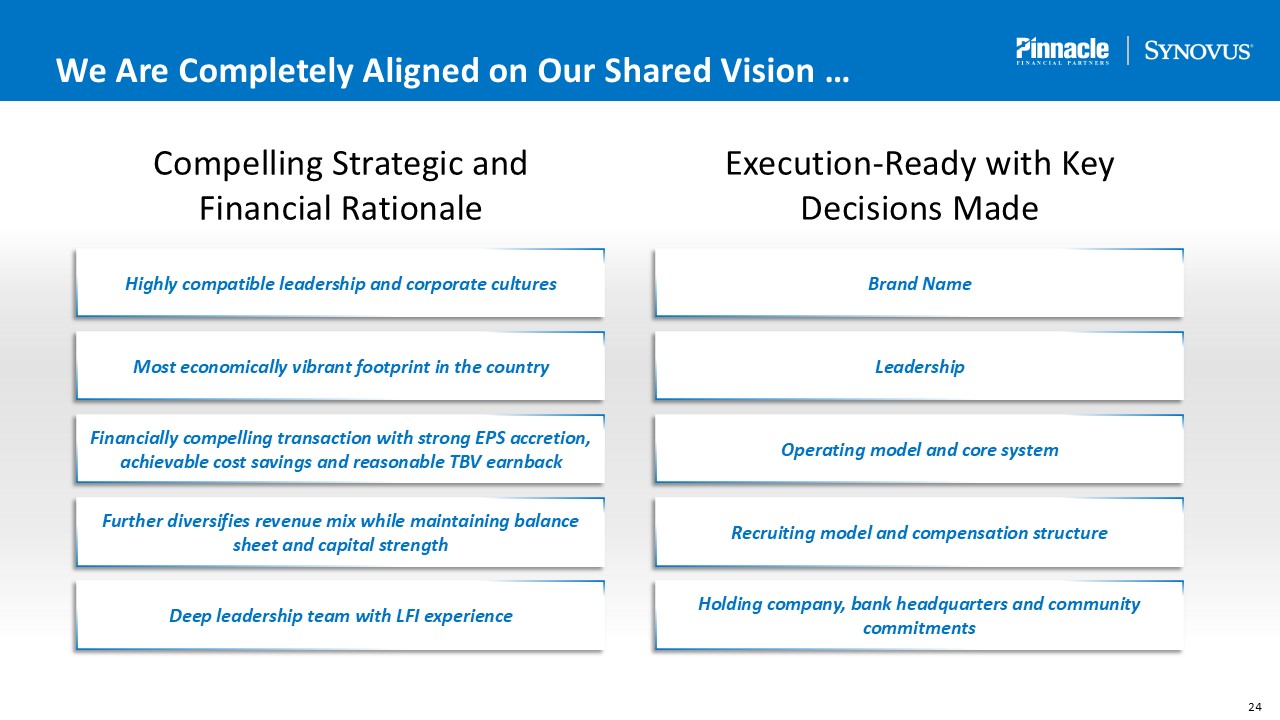
We Are Completely Aligned on Our Shared Vision … Compelling Strategic and
Financial Rationale Highly compatible leadership and corporate cultures Leadership Financially compelling transaction with strong EPS accretion, achievable cost savings and reasonable TBV earnback Recruiting model and compensation
structure Brand Name Operating model and core system Further diversifies revenue mix while maintaining balance sheet and capital strength Most economically vibrant footprint in the country Execution-Ready with Key Decisions Made Deep
leadership team with LFI experience Holding company, bank headquarters and community commitments
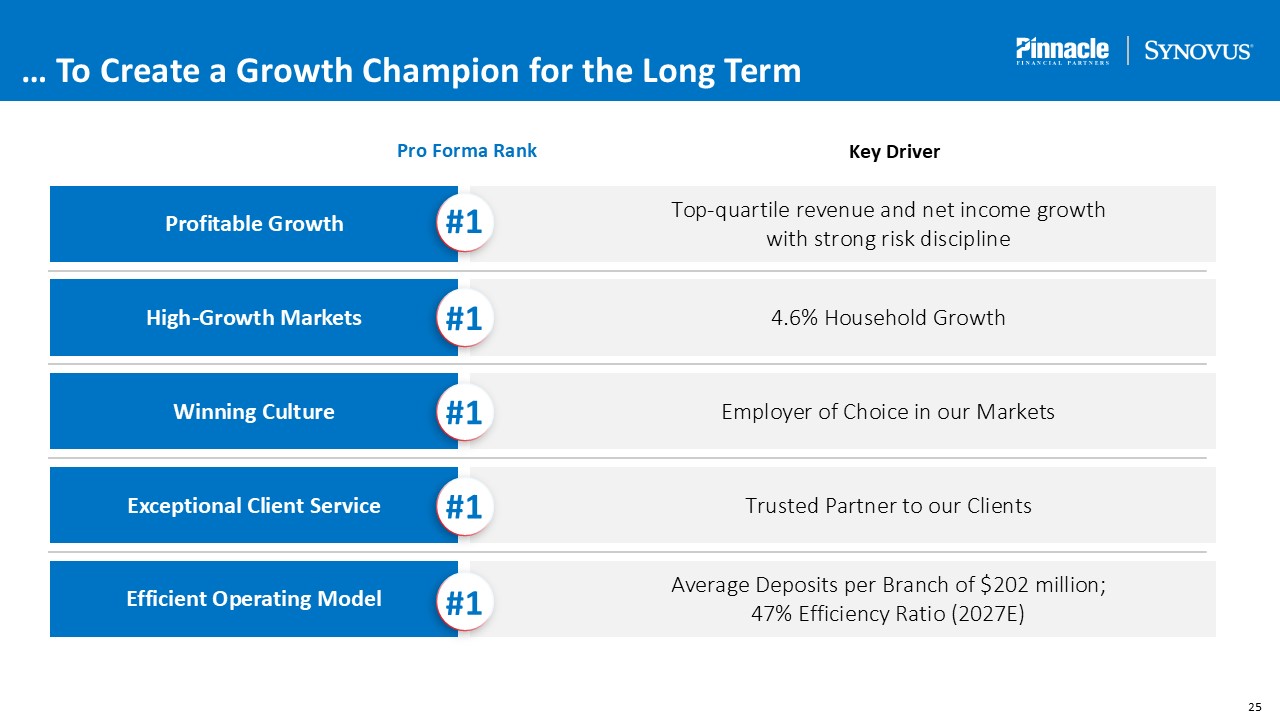
… To Create a Growth Champion for the Long Term High-Growth Markets Winning
Culture Exceptional Client Service Profitable Growth Efficient Operating Model 4.6% Household Growth Employer of Choice in our Markets Top-quartile revenue and net income growth with strong risk discipline Trusted Partner to our
Clients Average Deposits per Branch of $202 million; 47% Efficiency Ratio (2027E) Pro Forma Rank Key Driver #1 #1 #1 #1 #1
Appendix
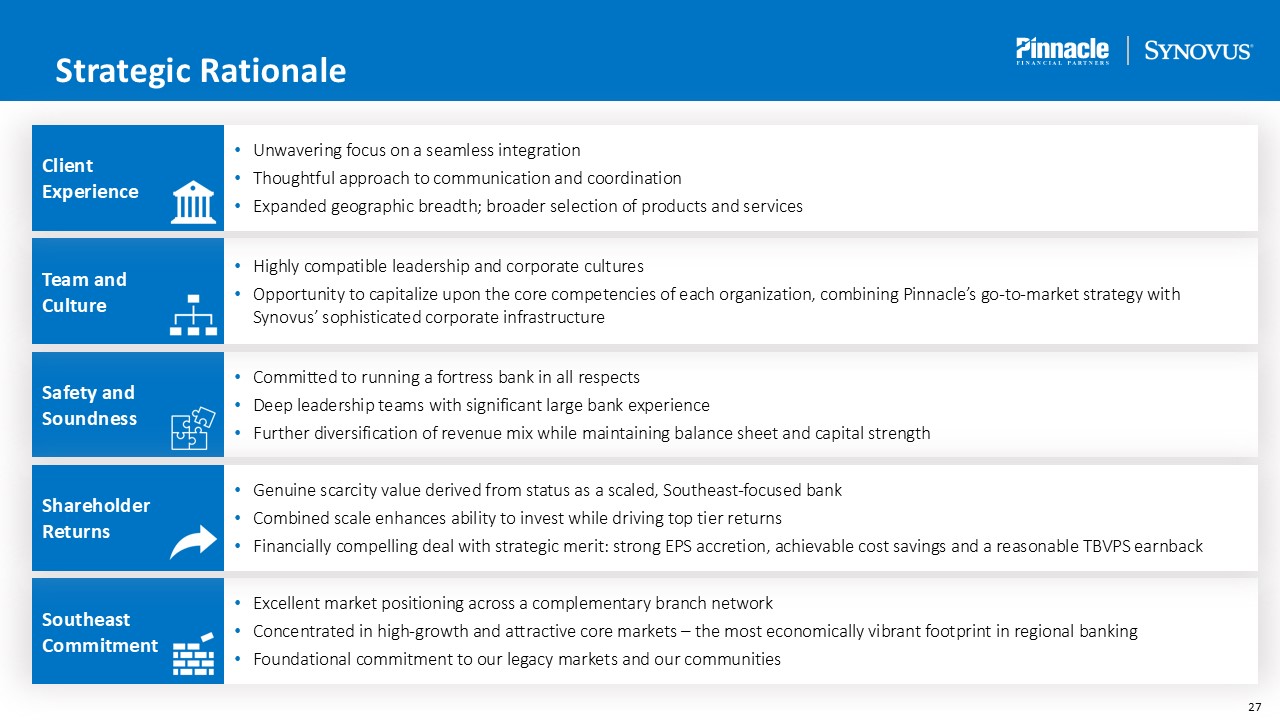
Strategic Rationale Excellent market positioning across a complementary branch
network Concentrated in high-growth and attractive core markets – the most economically vibrant footprint in regional banking Foundational commitment to our legacy markets and our communities Southeast Commitment Committed to running a
fortress bank in all respects Deep leadership teams with significant large bank experience Further diversification of revenue mix while maintaining balance sheet and capital strength Safety and Soundness Genuine scarcity value derived
from status as a scaled, Southeast-focused bank Combined scale enhances ability to invest while driving top tier returns Financially compelling deal with strategic merit: strong EPS accretion, achievable cost savings and a reasonable TBVPS
earnback Shareholder Returns Highly compatible leadership and corporate cultures Opportunity to capitalize upon the core competencies of each organization, combining Pinnacle’s go-to-market strategy with Synovus’ sophisticated corporate
infrastructure Team and Culture Unwavering focus on a seamless integration Thoughtful approach to communication and coordination Expanded geographic breadth; broader selection of products and services Client Experience
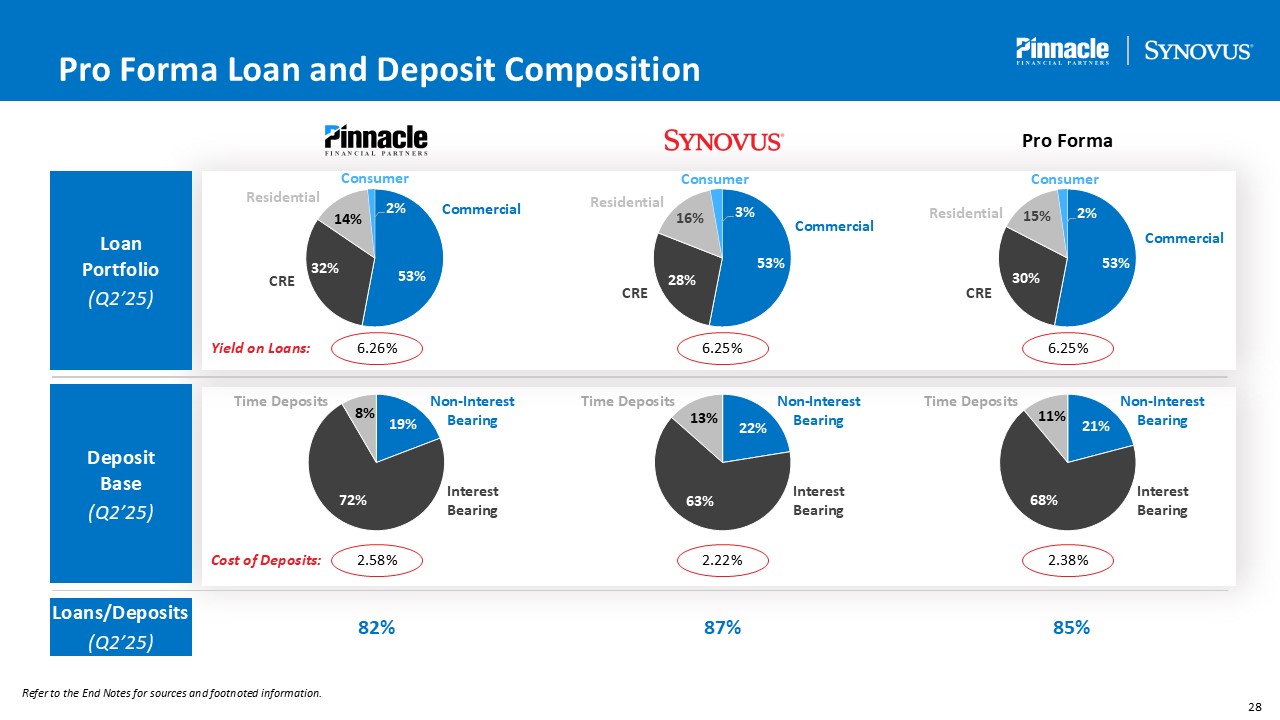
Pro Forma Loan and Deposit Composition Loan Portfolio (Q2’25) Deposit
Base (Q2’25) Loans/Deposits (Q2’25) CRE Commercial Non-Interest Bearing Interest Bearing Time Deposits 82% 87% 85% Consumer Yield on Loans: 6.26% 6.25% 6.25%
Residential CRE Residential CRE Residential Non-Interest Bearing Interest Bearing Time Deposits Non-Interest Bearing Interest Bearing Time Deposits Cost of Deposits: 2.58% 2.22% 2.38% Pro
Forma Commercial Commercial Consumer Consumer Refer to the End Notes for sources and footnoted information.
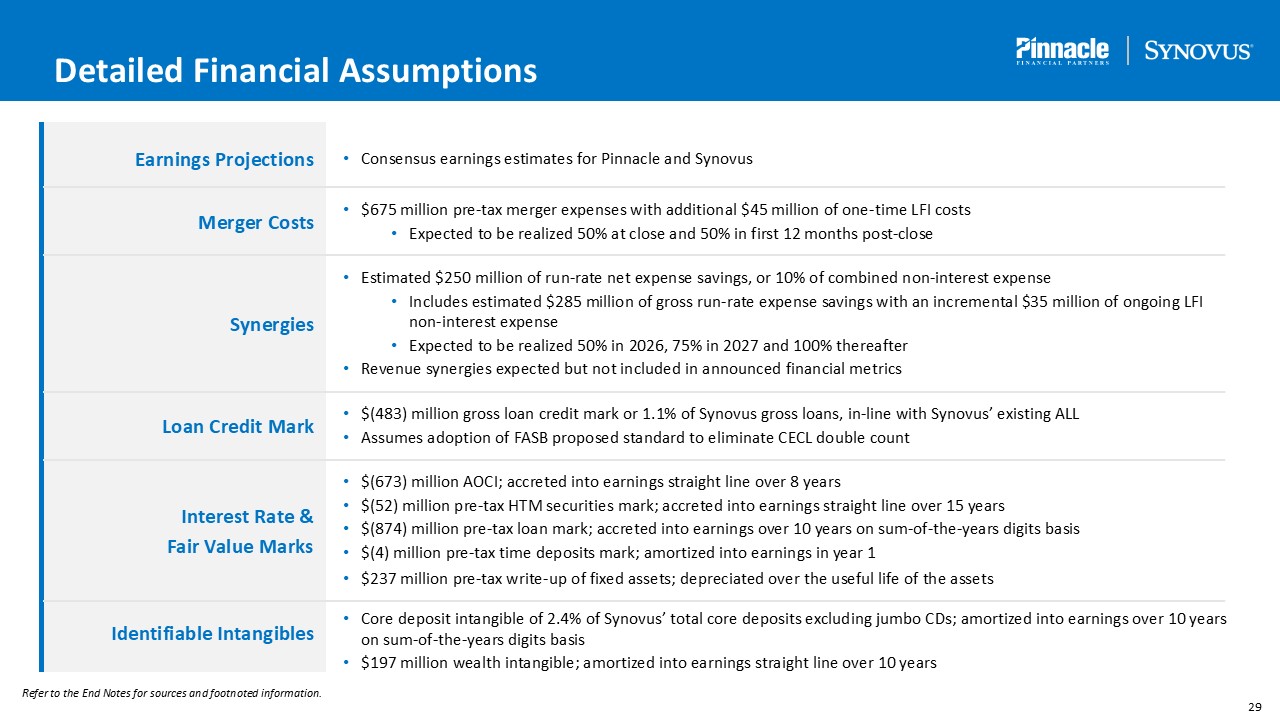
Refer to the End Notes for sources and footnoted information. Detailed
Financial Assumptions Earnings Projections Consensus earnings estimates for Pinnacle and Synovus Merger Costs Synergies Loan Credit Mark Interest Rate & Fair Value Marks Identifiable Intangibles $675 million pre-tax merger
expenses with additional $45 million of one-time LFI costs Expected to be realized 50% at close and 50% in first 12 months post-close Estimated $250 million of run-rate net expense savings, or 10% of combined non-interest expense Includes
estimated $285 million of gross run-rate expense savings with an incremental $35 million of ongoing LFI non-interest expense Expected to be realized 50% in 2026, 75% in 2027 and 100% thereafter Revenue synergies expected but not included in
announced financial metrics $(483) million gross loan credit mark or 1.1% of Synovus gross loans, in-line with Synovus’ existing ALL Assumes adoption of FASB proposed standard to eliminate CECL double count $(673) million AOCI; accreted
into earnings straight line over 8 years $(52) million pre-tax HTM securities mark; accreted into earnings straight line over 15 years $(874) million pre-tax loan mark; accreted into earnings over 10 years on sum-of-the-years digits
basis $(4) million pre-tax time deposits mark; amortized into earnings in year 1 $237 million pre-tax write-up of fixed assets; depreciated over the useful life of the assets Core deposit intangible of 2.4% of Synovus’ total core deposits
excluding jumbo CDs; amortized into earnings over 10 years on sum-of-the-years digits basis $197 million wealth intangible; amortized into earnings straight line over 10 years
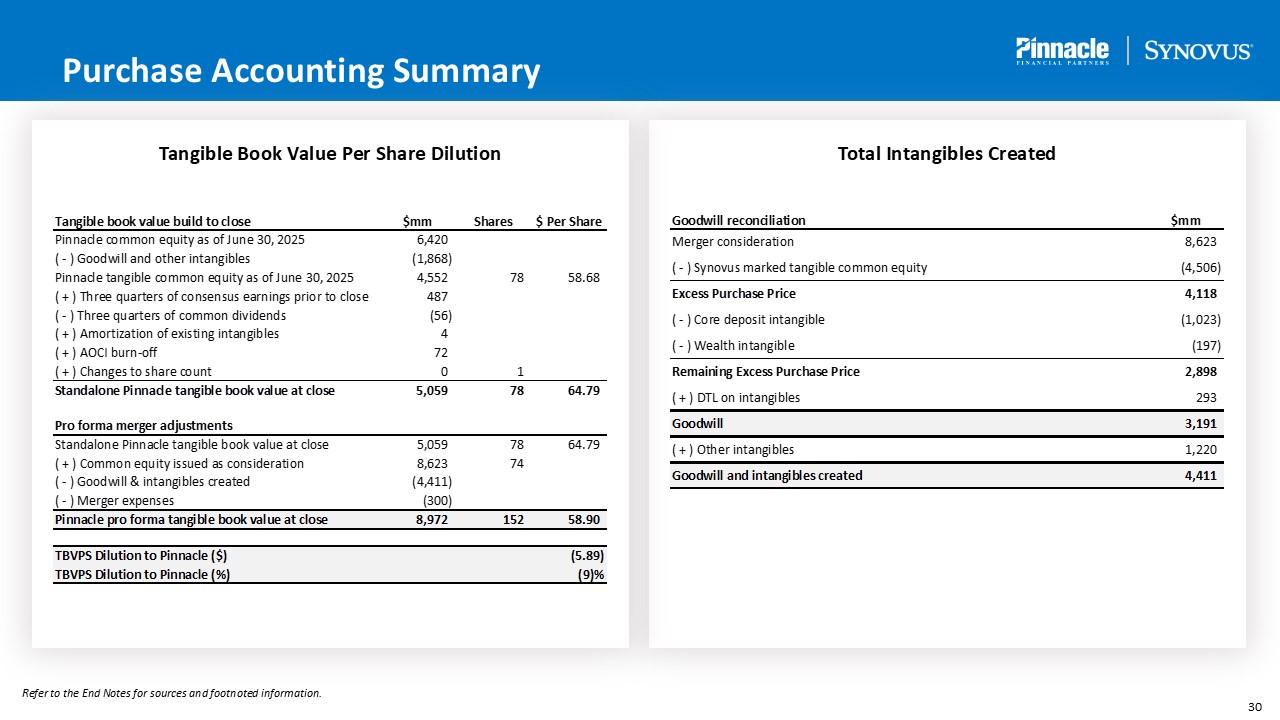
Purchase Accounting Summary Tangible Book Value Per Share Dilution Total
Intangibles Created Refer to the End Notes for sources and footnoted information.
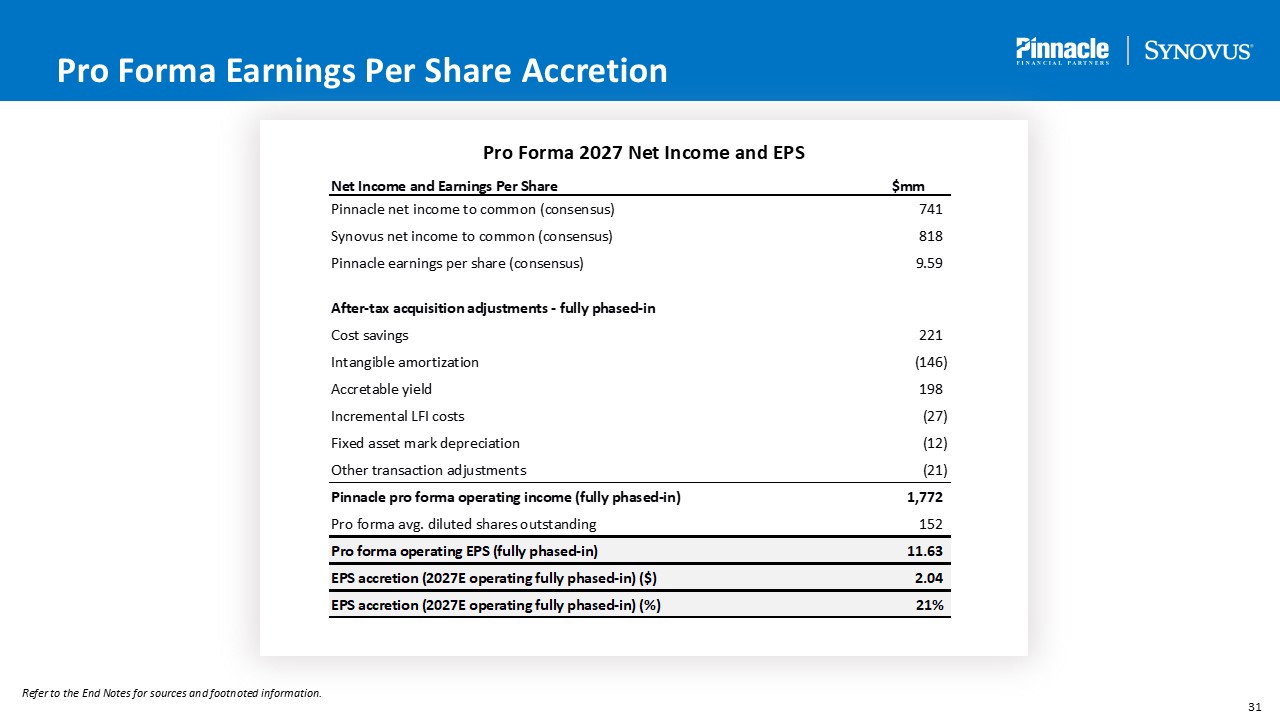
Pro Forma Earnings Per Share Accretion Pro Forma 2027 Net Income and EPS Refer
to the End Notes for sources and footnoted information.
End Notes Peers listed include CFG, FITB, HBAN, KEY, MTB, PNC, RF, TFC and
USB. Page 6 – The Combination is Financially Compelling … Scale figures represent a simple summation as of June 30, 2025 and exclude purchase accounting adjustments. EPS accretion and profitability metrics presented as of 2027E and include
fully phased-in cost savings. Reflects operating efficiency ratio including accretable yield. Page 7 – … And Positioned to Deliver for Clients and Investors … Source: S&P Capital IQ Pro, FDIC, J.D. Power and Coalition Greenwich. FDIC
deposit data as of June 30, 2024 and capped at $5 billion per branch. EPS Growth and Revenue Growth reflect 2014-2024 Adjusted EPS CAGR and 2014-2024 Adjusted Total Revenue per share CAGR, respectively. Household growth reflects estimated
2025-2030 (not annualized); growth rate reflects deposit-weighted average based on MSA-level deposits. Employee satisfaction reflects Glassdoor average employee satisfaction (out of 5 stars) as of June 27, 2025. J.D. Power rankings reflect
U.S. Retail Banking Satisfaction Study. Reflects operating efficiency ratio including accretable yield. Page 8 – … Building on Our Peer-Leading Positioning Source: FDIC, J.D. Power and S&P Capital IQ Pro. FDIC deposit data as of June
30, 2024 and capped at $5 billion per branch. Reflects Glassdoor average employee satisfaction rating (out of 5 stars). Reflects estimated 2025-2030 (not annualized) household growth; growth rate reflects deposit-weighted average based on
MSA-level deposits. Pro forma employee satisfaction and NPS figures blended based on 51.5% Pinnacle ownership and 48.5% Synovus ownership. Page 9 – Key Transaction Highlights Unaffected date as of July 21, 2025. Page 10 – Totally Aligned
to Compete and Win in the Market Source: Coalition Greenwich. Page 11 – Centered in America’s Best Growth Markets Source: S&P Capital IQ Pro and FDIC. FDIC deposit data as of June 30, 2024. Total assets as of Q2’25A. Market share
based on retail branches with pro forma ownership. Pro forma assets represent a simple summation as of June 30, 2025 and exclude purchase accounting adjustments. Page 12 – Track Record of Peer-Leading EPS Growth Reflect publicly reported
adjusted earnings per share figures. Page 15 – We Have a Long Runway to Continue Taking Share … Source: FDIC and S&P Capital IQ Pro. FDIC deposit data as of June 30, 2024. Top 15 MSAs by pro forma deposits where total market deposits
exceed $10 billion and deposits are capped at $5 billion per branch. MSAs shown by state in descending order of pro forma deposit share. Excludes credit union deposits. Pro forma deposit share may not sum due to rounding. Page 16 – … And
Limited Overlap Creates a Low-Risk Integration Source: FDIC and S&P Capital IQ Pro. FDIC deposit data as of June 30, 2024. Deposits per branch are not capped. Shared MSAs are sorted by percent of pro forma franchise deposits from high to
low within each category.
End Notes (Continued) Page 17 – Our Differentiated Client Focus Sets Us
Apart Source: J.D. Power and Coalition Greenwich. Greenwich: Pinnacle reflects 2025 rankings across Pinnacle’s eight state Southeastern footprint; Synovus reflects 2025 rankings in U.S. middle market banking. J.D. Power: Pinnacle and Synovus
reflect 2025 rankings for top 50 U.S. banks. Page 18 – This Client Focus Drives Peer-Leading Deposit Growth Source: S&P Capital IQ Pro. Reflects average YoY quarterly growth rates over each period. Peer figures are pro forma throughout
the period if an M&A transaction was completed. Core deposits defined as non-time deposits. Page 19 – Summary Financial Assumptions All figures are approximate. Pre-tax AFS and HTM mark includes $343mm mark on AFS portfolio included in
AOCI, $561mm mark on previously transferred HTM included in AOCI, $10mm write-up of cash flow hedges included in AOCI and an incremental $52mm mark on the HTM portfolio. Page 22 – Enhanced Capital Generation Will Fuel Growth Engine Source:
S&P Capital IQ Pro. Pro forma capital generation assumes no share repurchases through the projection period. Pro forma RWA growth in-line with standalone consensus estimates. Peer median CET1 Ratio as of most recent quarter. At Close
reflects pro forma capital as of March 31, 2026. Page 23 – We Will Deliver Top-Tier Performance Source: S&P Capital IQ Pro. Estimate information as of July 21, 2025. Pro forma revenue growth represents combined standalone consensus
revenue for both Pinnacle and Synovus. 2027E metrics include impacts of purchase accounting. Pro forma figures reflect fully-phased cost savings. Reflects operating efficiency ratio including accretable yield. Page 25 – … To Create a Growth
Champion for the Long Term Source: FDIC and S&P Capital IQ Pro. FDIC deposit data as of June 30, 2024 and capped at $5 billion per branch. Household growth reflects estimated 2025-2030 (not annualized); growth rate reflects
deposit-weighted average based on MSA-level deposits. Reflects operating efficiency ratio including accretable yield. Page 28 – Pro Forma Loan and Deposit Composition Represents a simple summation or calculation as of June 30, 2025 and
excludes purchase accounting adjustments. Yields on loans and cost of deposits reflect Q2’25 average. Commercial includes C&I and Owner Occupied CRE. CRE includes Non-Owner-Occupied CRE, Construction and Development and Multifamily. Time
deposits exclude public funds and brokered deposits. Page 30 – Purchase Accounting Summary Estimated financial impact is presented for illustrative purposes only. Pro forma date is subject to various assumptions and uncertainties. Page
31 – Pro Forma Earnings per Share Accretion Estimated financial impact is presented for illustrative purposes only. Other transaction adjustments includes earnings impact of future potential long-term debt issuance and other transaction
impacts. Pro forma date is subject to various assumptions and uncertainties.