Pay vs Performance Disclosure - USD ($)
Mar. 29, 2025
Mar. 30, 2024
Apr. 01, 2023
Apr. 02, 2022
Apr. 03, 2021
Pay Versus Performance | ||
The following Pay Versus Performance (PVP) table provides information about compensation for our NEOs for each of fiscal 2025, 2024, 2023, 2022 and 2021 (the “Covered Years”). The PVP table also provides information about the results for certain financial performance measures during the Covered Years. In reviewing this information, there are a few important things to consider:
• | The information in columns (b) and (d) comes directly from the Summary Compensation table (SCT) in this proxy statement, without adjustment. |
• | As required by the PVP regulations, we describe the information in columns (c) and (e) as “compensation actually paid” (CAP) to the applicable NEOs, but these CAP amounts do not necessarily reflect compensation that our NEOs actually earned for their service in the Covered Years. Instead, CAP is a calculation involving a combination of realized pay (for cash amounts and some equity award amounts) and realizable or accrued pay (primarily for pension benefits and other equity awards). |
• | The PVP regulations require that we choose a peer group or index for purposes of TSR comparisons, and we have chosen the S&P 400 Industrials Sector (the “PVP Peer Index”) for this purpose. |
• | As required by the PVP regulations, we provide information about our cumulative TSR, cumulative PVP Peer Index TSR and U.S. GAAP net income results (the “External Measures”) during the Covered Years in the PVP table. |
The Company is required to designate one financial metric as the “Company-Selected Measure,” or the most important financial measure that demonstrates how the Company sought to link 2025 executive pay to performance. For 2025, the Company has selected adjusted EBITDA. However, the Company believes that all of the metrics designated in the “Important Financial Performance Measures” section below are important drivers of Company performance.
Value of initial fixed $100 Investment based on: | ||||||||||||||||||||||||||
Fiscal Year (a) | Summary Compensation Table “SCT” Total for PEO (b) | Compensation Actually Paid to PEO (c)(2) | Average Summary Compensation Table Total for non-PEO NEOs (d) | Average Compensation Actually Paid to non-PEO NEOs (e)(2) | Total Shareholder Return (f)(3) | PVP Peer Index Total Shareholder Return (g)(3) | Net Income (h)(4) | Adjusted EBITDA (i)(5) | ||||||||||||||||||
2025 | $19,558,706 | $26,092,862 | $2,277,113 | $3,512,610 | $295.9 | $263.0 | $246.2 | $519.8 | ||||||||||||||||||
2024 | $8,977,576 | $12,753,252 | $1,609,114 | $2,003,000 | $245.8 | $283.9 | $209.9 | $482.1 | ||||||||||||||||||
2023 | $8,450,217 | $14,352,594 | $1,684,877 | $2,647,801 | $211.6 | $209.7 | $166.7 | $433.9 | ||||||||||||||||||
2022 | $19,404,363 | $18,435,256 | $3,068,308 | $2,923,082 | $177.8 | $201.6 | $54.7 | $266.5 | ||||||||||||||||||
2021 | $8,895,001 | $31,906,739 | $1,471,773 | $4,853,752 | $180.1 | $195.7 | $90.1 | $174.3 | ||||||||||||||||||
(1) | Dr. Michal J. Hartnett was out principal executive officer (PEO) for each of the Covered Years. In this disclosure, we refer to our NEOs other than Dr. Hartnett as our “other NEOs.” Daniel A. Bergeron, Richard J. Edwards, John J. Feeney and Robert M. Sullivan were our other NEOs for each of the Covered Years. |
(2) | For each Covered Year, in determining the CAP for our PEO and the average CAP for our other NEOs, we deducted or added back the following amounts from or to the total amounts of compensation reported in column (b) and column (d) for such Covered Year: |
Item and Value Added (or Deducted) | 2025 | 2024 | 2023 | 2022 | 2021 | ||||||||||||
For Dr. Hartnett: | |||||||||||||||||
- change in actuarial present value of pension benefits, as reported in SCT for Covered Year | - | - | - | - | - | ||||||||||||
+ service cost of pension benefits, as calculated for Covered Year | - | - | - | - | - | ||||||||||||
+ prior service cost of pension benefits, as calculated for Covered Year | - | - | - | - | - | ||||||||||||
- SCT “Stock Awards” column value | (15,619,573) | (6,317,484) | (5,984,946) | (10,364,286) | (3,725,036) | ||||||||||||
- SCT “Option Awards” column value | - | - | - | (5,820,840) | (2,900,431) | ||||||||||||
+/- adjusted amount for applicable stock/option awards, as calculated for Covered Year | 22,153,729 | 10,093,160 | 11,887,323 | 15,216,019 | 29,637,205 | ||||||||||||
+ the Covered Year-end fair value of equity awarded in (and still outstanding as of the end of) the Covered Year | 10,183,010 | 8,560,633 | 6,995,864 | 16,179,662 | 11,090,134 | ||||||||||||
+/- the change in fair value of equity awarded in prior Covered Years (and still outstanding as of the end of the Covered Year) | 3,414,310 | 3,925,511 | 4,844,811 | (827,571) | 15,484,735 | ||||||||||||
+ the vesting date fair value of equity awarded and vested in the Covered Year | 6,750,000 | - | - | - | - | ||||||||||||
+/- the change in fair value of equity awarded in prior Covered Years that vested in the Covered Year | 1,806,409 | (2,392,984) | 46,648 | (136,072) | 3,062,336 | ||||||||||||
- prior the Covered Year-end fair value of equity awarded in prior Covered Years that were forfeited in the Covered Year | - | - | - | - | - | ||||||||||||
+ dividends/earnings paid or accrued on equity awarded during or for the Covered Year (if not otherwise included in CAP) | - | - | - | - | - | ||||||||||||
Total Added (or Deducted): | 6,534,156 | 3,775,676 | 5,902,377 | (969,107) | 23,011,738 | ||||||||||||
For the Other NEOs (on Average): | |||||||||||||||||
- change in actuarial present value of pension benefits, as reported in SCT for Covered Year | - | - | - | - | - | ||||||||||||
+ service cost of pension benefits, as calculated for Covered Year | - | - | - | - | - | ||||||||||||
Item and Value Added (or Deducted) | 2025 | 2024 | 2023 | 2022 | 2021 | ||||||||||||
+ prior service cost of pension benefits, as calculated for Covered Year | - | - | - | - | - | ||||||||||||
- SCT “Stock Awards” column value | (1,345,767) | (750,557) | (834,923) | (1,419,015) | (548,610) | ||||||||||||
- SCT “Option Awards” column value | (218,586) | (181,380) | (216,122) | (899,933) | (383,306) | ||||||||||||
+/- adjusted amount for applicable stock/option awards, as calculated for Covered Year | 2,799,850 | 1,325,823 | 2,013,969 | 2,173,722 | 4,313,895 | ||||||||||||
+ the Covered Year-end fair value of equity awarded in (and still outstanding as of the end of) the Covered Year | 1,676,970 | 1,305,637 | 1,255,428 | 2,321,426 | 1,476,742 | ||||||||||||
+/- the change in fair value of equity awarded in prior Covered Years (and still outstanding as of the end of the Covered Year) | 591,967 | 381,552 | 750,249 | (131,882) | 2,408,207 | ||||||||||||
+ the vesting date fair value pf equity awarded and vested in the Covered Year | - | - | - | - | - | ||||||||||||
+/- the change in fair value of equity awarded in prior Covered Years that vested in the Covered Year | 530,913 | (361,366) | 8,292 | (15,822) | 428,946 | ||||||||||||
- prior the Covered Year-end fair value of equity awarded in prior Covered Years that was forfeited in the Covered Year | - | - | - | - | - | ||||||||||||
+ dividends/earnings paid or accrued on equity awarded during or for the Covered Year (if not otherwise included in CAP) | - | - | - | - | - | ||||||||||||
Total Added (or Deducted): | 1,235,497 | 393,886 | 962,924 | (145,226) | 3,381,979 | ||||||||||||
(3) | TSR assumes an initial investment of $100 on March 28, 2020 in RBC common stock for our cumulative TSR and in the PVP Peer Index for the PVP Peer Index cumulative TSR, based on market prices at the end of each fiscal year through and including March 29, 2025, and reinvestment of dividends. |
(4) | Dollars in millions. |
(5) | Adjusted EBITDA is calculated based on the Company’s net income as used for external reporting purposes adjusted to exclude various items that are reflected in externally reported net income. See Appendix B for a reconciliation of adjusted EBITDA to its most directly comparable GAAP financial measure. Dollar values are in millions. |
(1) | Dr. Michal J. Hartnett was out principal executive officer (PEO) for each of the Covered Years. In this disclosure, we refer to our NEOs other than Dr. Hartnett as our “other NEOs.” Daniel A. Bergeron, Richard J. Edwards, John J. Feeney and Robert M. Sullivan were our other NEOs for each of the Covered Years. |
(3) | TSR assumes an initial investment of $100 on March 28, 2020 in RBC common stock for our cumulative TSR and in the PVP Peer Index for the PVP Peer Index cumulative TSR, based on market prices at the end of each fiscal year through and including March 29, 2025, and reinvestment of dividends. |
(2) | For each Covered Year, in determining the CAP for our PEO and the average CAP for our other NEOs, we deducted or added back the following amounts from or to the total amounts of compensation reported in column (b) and column (d) for such Covered Year: |
Item and Value Added (or Deducted) | 2025 | 2024 | 2023 | 2022 | 2021 | ||||||||||||
For Dr. Hartnett: | |||||||||||||||||
- change in actuarial present value of pension benefits, as reported in SCT for Covered Year | - | - | - | - | - | ||||||||||||
+ service cost of pension benefits, as calculated for Covered Year | - | - | - | - | - | ||||||||||||
+ prior service cost of pension benefits, as calculated for Covered Year | - | - | - | - | - | ||||||||||||
- SCT “Stock Awards” column value | (15,619,573) | (6,317,484) | (5,984,946) | (10,364,286) | (3,725,036) | ||||||||||||
- SCT “Option Awards” column value | - | - | - | (5,820,840) | (2,900,431) | ||||||||||||
+/- adjusted amount for applicable stock/option awards, as calculated for Covered Year | 22,153,729 | 10,093,160 | 11,887,323 | 15,216,019 | 29,637,205 | ||||||||||||
+ the Covered Year-end fair value of equity awarded in (and still outstanding as of the end of) the Covered Year | 10,183,010 | 8,560,633 | 6,995,864 | 16,179,662 | 11,090,134 | ||||||||||||
+/- the change in fair value of equity awarded in prior Covered Years (and still outstanding as of the end of the Covered Year) | 3,414,310 | 3,925,511 | 4,844,811 | (827,571) | 15,484,735 | ||||||||||||
+ the vesting date fair value of equity awarded and vested in the Covered Year | 6,750,000 | - | - | - | - | ||||||||||||
+/- the change in fair value of equity awarded in prior Covered Years that vested in the Covered Year | 1,806,409 | (2,392,984) | 46,648 | (136,072) | 3,062,336 | ||||||||||||
- prior the Covered Year-end fair value of equity awarded in prior Covered Years that were forfeited in the Covered Year | - | - | - | - | - | ||||||||||||
+ dividends/earnings paid or accrued on equity awarded during or for the Covered Year (if not otherwise included in CAP) | - | - | - | - | - | ||||||||||||
Total Added (or Deducted): | 6,534,156 | 3,775,676 | 5,902,377 | (969,107) | 23,011,738 | ||||||||||||
For the Other NEOs (on Average): | |||||||||||||||||
- change in actuarial present value of pension benefits, as reported in SCT for Covered Year | - | - | - | - | - | ||||||||||||
+ service cost of pension benefits, as calculated for Covered Year | - | - | - | - | - | ||||||||||||
Item and Value Added (or Deducted) | 2025 | 2024 | 2023 | 2022 | 2021 | ||||||||||||
+ prior service cost of pension benefits, as calculated for Covered Year | - | - | - | - | - | ||||||||||||
- SCT “Stock Awards” column value | (1,345,767) | (750,557) | (834,923) | (1,419,015) | (548,610) | ||||||||||||
- SCT “Option Awards” column value | (218,586) | (181,380) | (216,122) | (899,933) | (383,306) | ||||||||||||
+/- adjusted amount for applicable stock/option awards, as calculated for Covered Year | 2,799,850 | 1,325,823 | 2,013,969 | 2,173,722 | 4,313,895 | ||||||||||||
+ the Covered Year-end fair value of equity awarded in (and still outstanding as of the end of) the Covered Year | 1,676,970 | 1,305,637 | 1,255,428 | 2,321,426 | 1,476,742 | ||||||||||||
+/- the change in fair value of equity awarded in prior Covered Years (and still outstanding as of the end of the Covered Year) | 591,967 | 381,552 | 750,249 | (131,882) | 2,408,207 | ||||||||||||
+ the vesting date fair value pf equity awarded and vested in the Covered Year | - | - | - | - | - | ||||||||||||
+/- the change in fair value of equity awarded in prior Covered Years that vested in the Covered Year | 530,913 | (361,366) | 8,292 | (15,822) | 428,946 | ||||||||||||
- prior the Covered Year-end fair value of equity awarded in prior Covered Years that was forfeited in the Covered Year | - | - | - | - | - | ||||||||||||
+ dividends/earnings paid or accrued on equity awarded during or for the Covered Year (if not otherwise included in CAP) | - | - | - | - | - | ||||||||||||
Total Added (or Deducted): | 1,235,497 | 393,886 | 962,924 | (145,226) | 3,381,979 | ||||||||||||
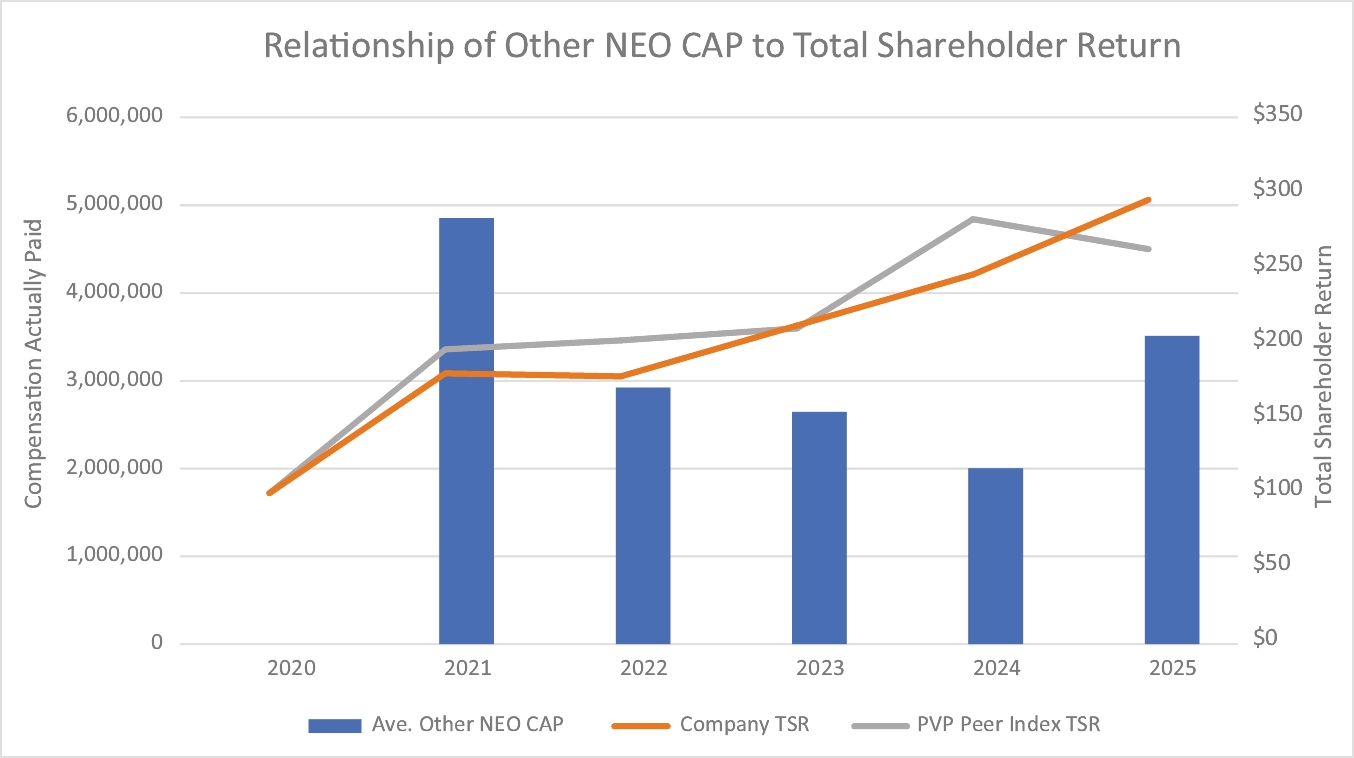
The following charts show the relationships between the Company’s cumulative TSR, the cumulative TSR for the PVP Peer Index, our PEO’s CAP, and our other NEOs’ CAP.
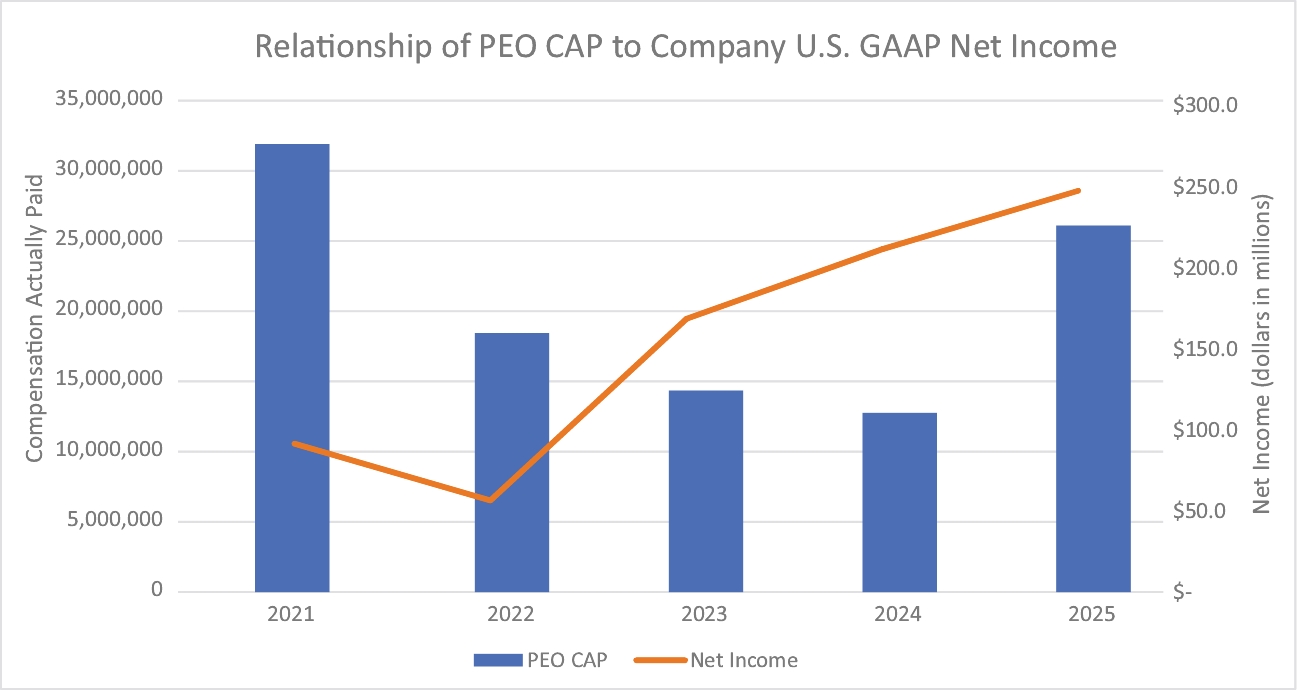
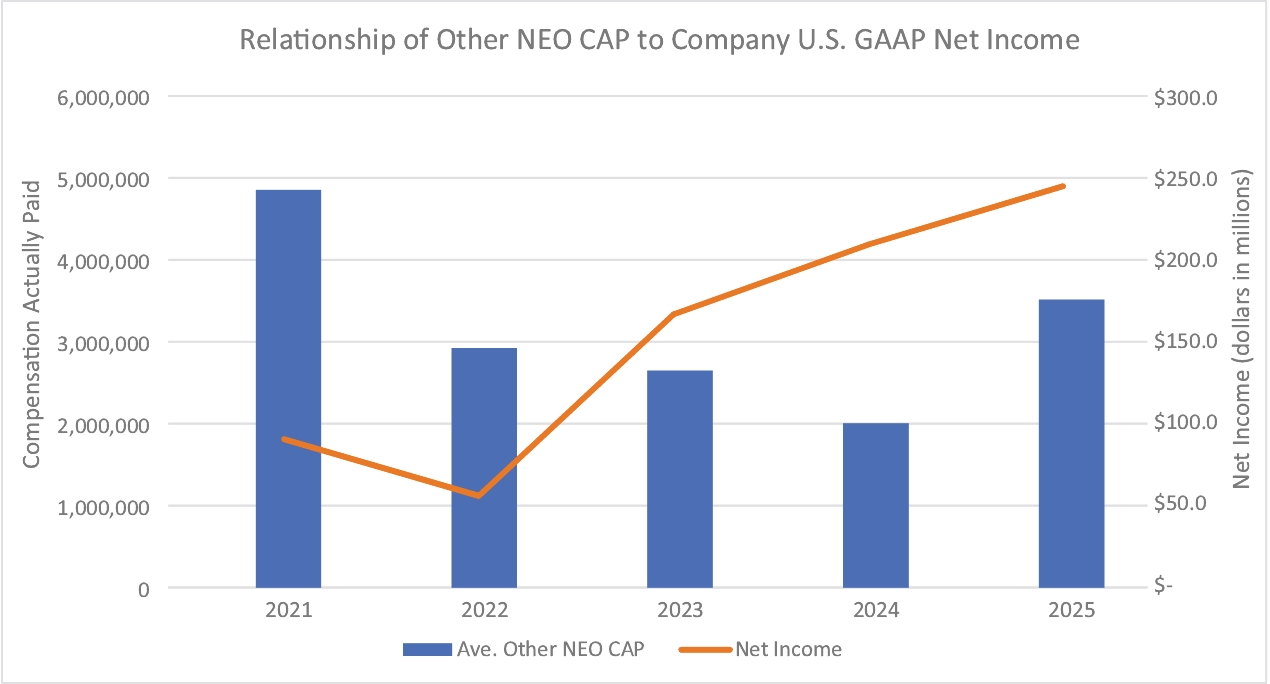
The following charts show the relationships between the Company’s net income, our PEO’s CAP, and our other NEOs’ CAP.
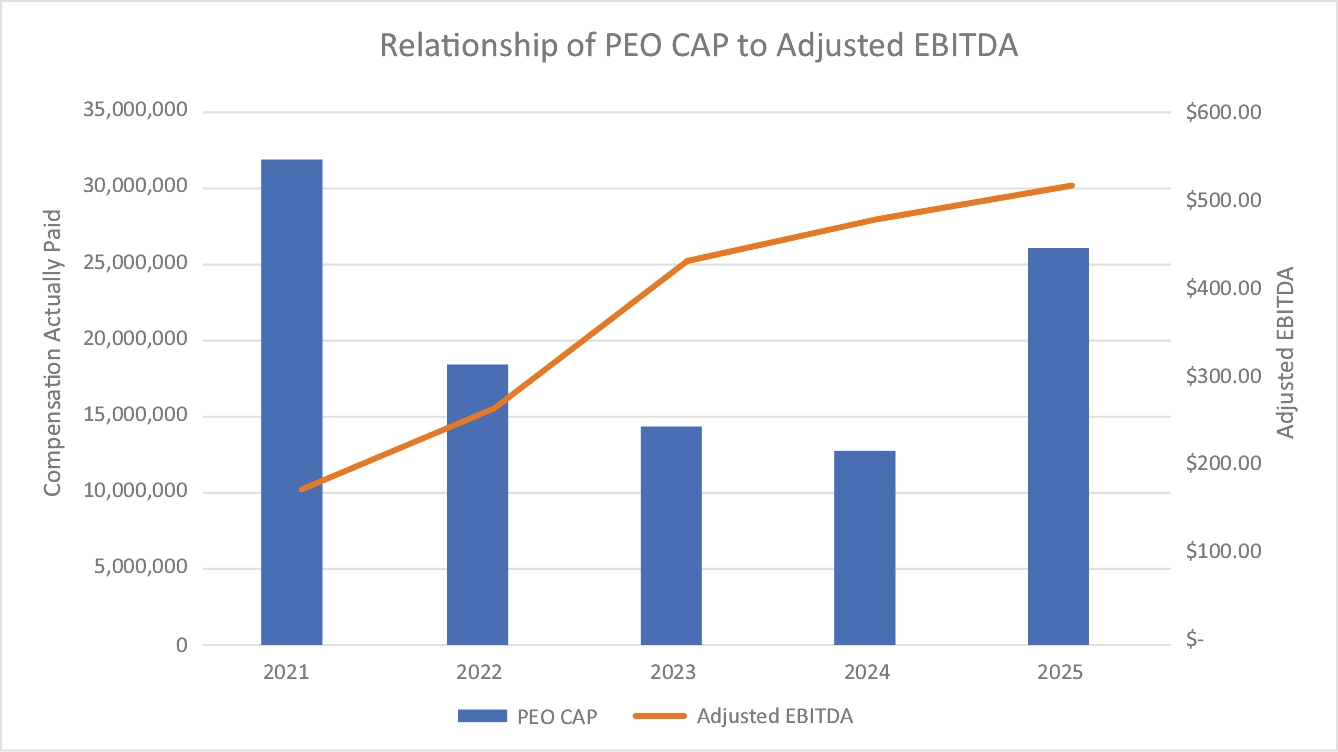
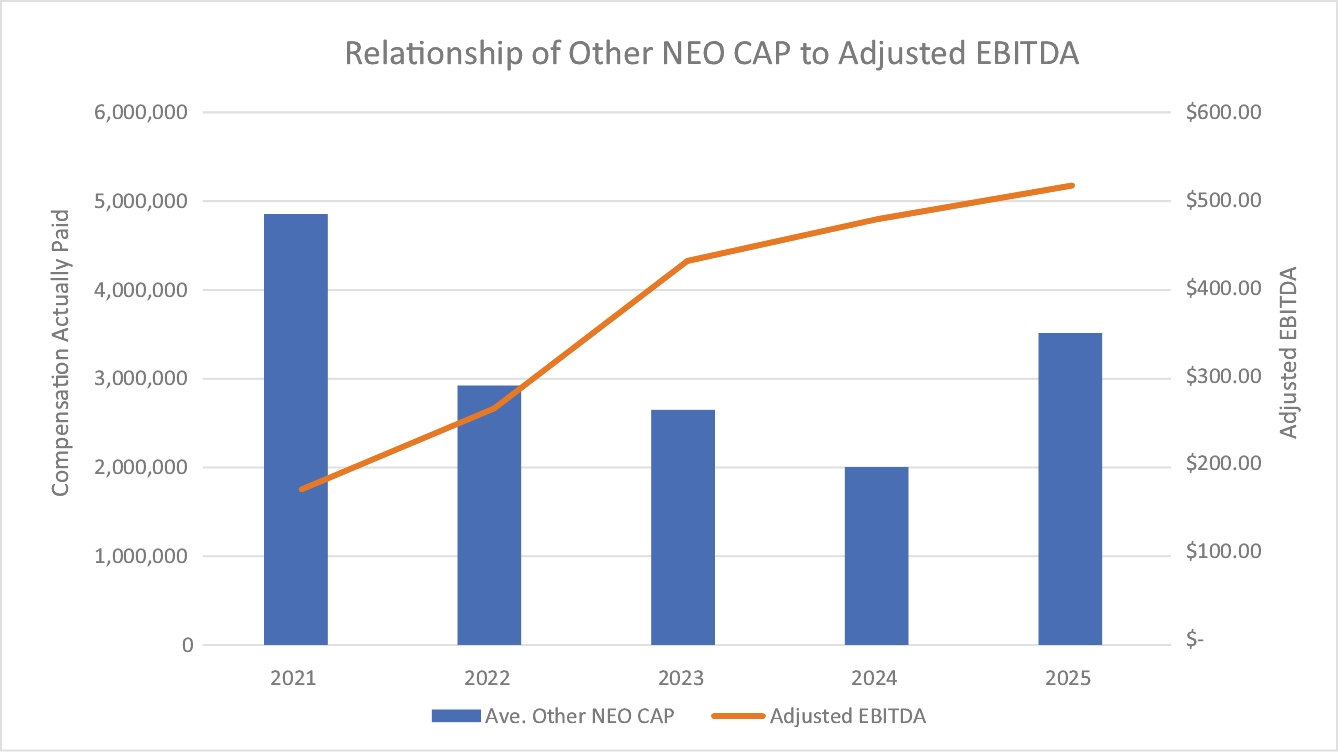
The following charts show the relationships between the Company’s adjusted EBITDA, our PEO’s CAP, and our other NEOs’ CAP.
The following charts show the relationships between the Company’s cumulative TSR, the cumulative TSR for the PVP Peer Index, our PEO’s CAP, and our other NEOs’ CAP.
Important Financial Performance Measures
The following table provides what we believe are the most important financial performance measures we used to link executive pay for our PEO and Other NEOs for 2025 to our performance:
Performance Measure | Type of Performance Measure | ||||
Adjusted EBITDA | Financial | ||||
Adjusted Return on Invested Capital | Financial | ||||
Free Cash Flow | Liquidity | ||||
(5) | Adjusted EBITDA is calculated based on the Company’s net income as used for external reporting purposes adjusted to exclude various items that are reflected in externally reported net income. See Appendix B for a reconciliation of adjusted EBITDA to its most directly comparable GAAP financial measure. Dollar values are in millions. |