Exhibit 99.1
Blackstone Reports Second Quarter 2025 Results |
New York, July 24, 2025: Blackstone (NYSE:BX) today reported its second quarter 2025 results.
Stephen A. Schwarzman, Chairman and Chief Executive Officer, said, Blackstone delivered outstanding second-
quarter results, reflective of the broader underlying expansion of the firms business and earnings power,
particularly in private wealth, credit and insurance, and infrastructure. Despite the volatile market backdrop, we
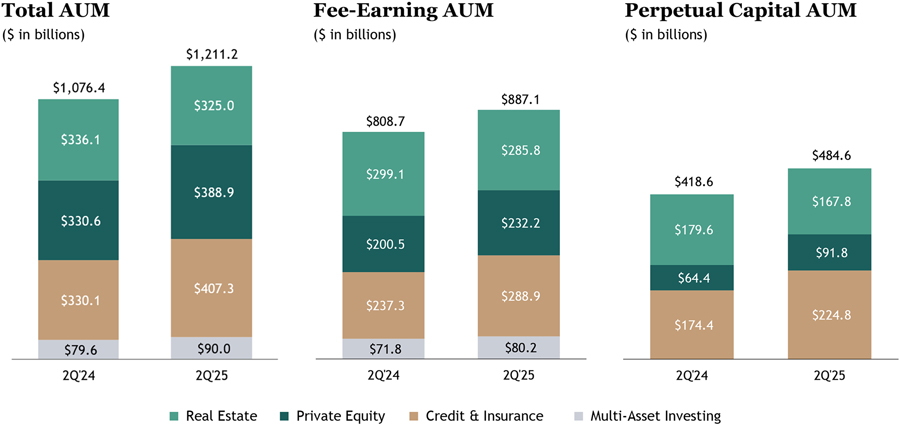
grew earnings significantly and total assets under management increased 13% year-over-year to more than
$1.2 trilliona new industry record. Most importantly, we continued to deliver strong investment performance for
our LPs, with the highest overall amount of fund appreciation in nearly four years.
Blackstone issued a full detailed presentation of its second quarter 2025 results, which can be viewed at
www.blackstone.com.
Dividend
Blackstone has declared a quarterly dividend of $1.03 per share to record holders of common stock at the close of
business on August 4, 2025. This dividend will be paid on August 11, 2025.
Quarterly Investor Call Details
Blackstone will host its second quarter 2025 investor conference via public webcast on July 24, 2025 at
9:00 a.m. ET. To register, please use the following link:
https://event.webcasts.com/starthere.jsp?ei=1725493&tp_key=ccdd76990b. For those unable to listen to the live
Blackstone
345 Park Avenue, New York, NY 10154
T 212 583 5000
www.blackstone.com
broadcast, there will be a webcast replay on the Shareholders section of Blackstones website at
https://ir.blackstone.com/.
About Blackstone
Blackstone is the worlds largest alternative asset manager. Blackstone seeks to deliver compelling returns for
institutional and individual investors by strengthening the companies in which the firm invests. Blackstones
$1.2 trillion in assets under management include global investment strategies focused on real estate, private
equity, credit, infrastructure, life sciences, growth equity, secondaries and hedge funds. Further information is
available at www.blackstone.com. Follow @blackstone on LinkedIn, X (Twitter), and Instagram.
Forward-Looking Statements
This presentation may contain forward-looking statements within the meaning of Section 27A of the Securities Act
of 1933, as amended, and Section 21E of the Securities Exchange Act of 1934, as amended, which reflect our
current views with respect to, among other things, our operations, taxes, earnings and financial performance, share
repurchases and dividends. You can identify these forward-looking statements by the use of words such as
outlook, indicator, believes, expects, potential, continues, may, will, should, seeks,
approximately, predicts, intends, plans, scheduled, estimates, anticipates, opportunity, leads,
forecast, possible or the negative version of these words or other comparable words. Such forward-looking
statements are subject to various risks and uncertainties. Accordingly, there are or will be important factors that
could cause actual outcomes or results to differ materially from those indicated in these statements. We believe
these factors include but are not limited to those described under the section entitled Risk Factors in our Annual
Report on Form 10-K for the year ended December 31, 2024, as such factors may be updated from time to time in
our periodic filings with the United States Securities and Exchange Commission (SEC), which are accessible on the
SECs website at www.sec.gov. These factors should not be construed as exhaustive and should be read in
conjunction with the other cautionary statements that are included in this report and in our other periodic filings.
The forward-looking statements speak only as of the date of this report, and we undertake no obligation to publicly
update or review any forward-looking statement, whether as a result of new information, future developments or
otherwise.
This presentation does not constitute an offer of any Blackstone Fund.
Investor and Media Relations Contacts
Weston Tucker Blackstone Tel: +1 (212) 583-5231 tucker@blackstone.com |
Christine Anderson Blackstone Tel: +1 (212) 583-5182 christine.anderson@blackstone.com |
|
Blackstones Second
Quarter 2025 Earnings
JULY 24, 2025
BLACKSTONES SECOND QUARTER 2025 GAAP RESULTS
§ |
GAAP Net Income was $1.6 billion for the quarter and $2.8 billion year-to-date (YTD). GAAP Net Income Attributable to Blackstone Inc. was $764 million for the quarter and $1.4 billion YTD. |
($ in thousands, except per share data) (unaudited) | 2Q24 | 2Q25 | 2Q24 YTD | 2Q25 YTD | 2Q24 LTM | 2Q25 LTM | ||||||||||||||||||||||
Revenues |
||||||||||||||||||||||||||||
Management and Advisory Fees, Net |
$ |
1,787,313 |
|
$ |
2,035,495 |
|
$ |
3,514,461 |
|
$ |
3,939,812 |
|
$ |
6,818,036 |
|
$ |
7,614,287 |
| ||||||||||
Incentive Fees |
|
188,299 |
|
|
195,414 |
|
|
367,640 |
|
|
387,239 |
|
|
766,858 |
|
|
983,777 |
| ||||||||||
Performance Allocations |
|
653,870 |
|
|
1,143,103 |
|
|
1,752,330 |
|
|
1,968,354 |
|
|
1,780,342 |
|
|
4,045,177 |
| ||||||||||
Principal Investments |
|
42,269 |
|
|
462,562 |
|
|
582,489 |
|
|
806,817 |
|
|
447,593 |
|
|
937,177 |
| ||||||||||
Interest and Dividend Revenue |
|
104,999 |
|
|
100,389 |
|
|
202,838 |
|
|
197,809 |
|
|
480,345 |
|
|
406,130 |
| ||||||||||
Other |
|
19,631 |
|
|
(225,063 |
) |
|
64,451 |
|
|
(298,673 |
) |
|
17,340 |
|
|
(239,431 |
) | ||||||||||
Total Revenues |
$ |
2,796,381 |
|
$ |
3,711,900 |
|
$ |
6,484,209 |
|
$ |
7,001,358 |
|
$ |
10,310,514 |
|
$ |
13,747,117 |
| ||||||||||
Expenses |
||||||||||||||||||||||||||||
Compensation and Benefits |
|
1,206,202 |
|
|
1,421,530 |
|
|
2,514,506 |
|
|
2,853,370 |
|
|
4,003,770 |
|
|
5,332,917 |
| ||||||||||
General, Administrative and Other |
|
311,928 |
|
|
360,817 |
|
|
681,878 |
|
|
693,190 |
|
|
1,250,755 |
|
|
1,373,221 |
| ||||||||||
Interest Expense |
|
108,616 |
|
|
135,822 |
|
|
216,819 |
|
|
253,937 |
|
|
436,150 |
|
|
480,806 |
| ||||||||||
Fund Expenses |
|
5,960 |
|
|
14,434 |
|
|
9,910 |
|
|
26,538 |
|
|
48,913 |
|
|
36,304 |
| ||||||||||
Total Expenses |
$ |
1,632,706 |
|
$ |
1,932,603 |
|
$ |
3,423,113 |
|
$ |
3,827,035 |
|
$ |
5,739,588 |
|
$ |
7,223,248 |
| ||||||||||
Other Income (Loss) |
$ |
44,934 |
|
$ |
136,330 |
|
$ |
27,167 |
|
$ |
193,905 |
|
$ |
(210,281 |
) |
$ |
215,576 |
| ||||||||||
Income Before Provision for Taxes |
$ |
1,208,609 |
|
$ |
1,915,627 |
|
$ |
3,088,263 |
|
$ |
3,368,228 |
|
$ |
4,360,645 |
|
$ |
6,739,445 |
| ||||||||||
Provision for Taxes |
|
260,246 |
|
|
289,494 |
|
|
543,917 |
|
|
533,321 |
|
|
786,434 |
|
|
1,011,075 |
| ||||||||||
Net Income |
$ |
948,363 |
|
$ |
1,626,133 |
|
$ |
2,544,346 |
|
$ |
2,834,907 |
|
$ |
3,574,211 |
|
$ |
5,728,370 |
| ||||||||||
Redeemable NCI in Consolidated Entities |
|
258 |
|
|
18,209 |
|
|
(39,411 |
) |
|
26,109 |
|
|
(295,917 |
) |
|
4,231 |
| ||||||||||
Non-Redeemable NCI in Consolidated Entities |
|
503,691 |
|
|
843,680 |
|
|
1,291,957 |
|
|
1,429,702 |
|
|
1,874,534 |
|
|
2,860,335 |
| ||||||||||
Net Income Attributable to Blackstone Inc. |
$ |
444,414 |
|
$ |
764,244 |
|
$ |
1,291,800 |
|
$ |
1,379,096 |
|
$ |
1,995,594 |
|
$ |
2,863,804 |
| ||||||||||
Net Income Per Share of Common Stock, Basic |
$ |
0.58 |
|
$ |
0.98 |
|
$ |
1.69 |
|
$ |
1.77 |
|
$ |
2.62 |
|
$ |
3.71 |
| ||||||||||
Net Income Per Share of Common Stock, Diluted |
$ |
0.58 |
|
$ |
0.98 |
|
$ |
1.69 |
|
$ |
1.77 |
|
$ |
2.62 |
|
$ |
3.71 |
|
Throughout this presentation, all current period amounts are preliminary and unaudited. Totals may not add due to rounding. See pages 36-38, Definitions and Dividend Policy, for definitions of terms used throughout this presentation. NCI means non-controlling interests. |
Blackstone | 1 |
BLACKSTONES SECOND QUARTER 2025 HIGHLIGHTS
Financial Measures |
§ Fee Related Earnings (FRE) of $1.5 billion ($1.19/share) in the quarter
FRE was $5.7 billion over the last twelve months (LTM) ($4.68/share)
§ Distributable Earnings (DE) of $1.6 billion ($1.21/share) in the quarter
DE was $6.4 billion over the LTM ($5.00/share)
§ Net Accrued Performance Revenues of $6.6 billion ($5.37/share)
| |
|
||
Capital Metrics |
§ Total Assets Under Management (AUM) of $1,211.2 billion
Fee-Earning AUM of $887.1 billion
Perpetual Capital AUM of $484.6 billion
§ Inflows of $52.1 billion in the quarter and $211.8 billion over the LTM
§ Deployment of $33.1 billion in the quarter and $145.1 billion over the LTM
§ Realizations of $23.4 billion in the quarter and $97.5 billion over the LTM
| |
|
||
Capital Returned to Shareholders |
§ Dividend of $1.03 per common share payable on August 11, 2025
Dividends of $4.26 per common share over the LTM
§ Repurchased 0.2 million common shares in the quarter and 1.7 million common shares
§ $1.4 billion to be distributed to shareholders with respect to the second quarter and
|
Blackstone | 2 |
BLACKSTONES SECOND QUARTER 2025 SEGMENT EARNINGS
% Change | % Change | |||||||||||||||||||||
($ in thousands, except per share data) | 2Q24 | 2Q25 | vs. 2Q24 | 2Q24 YTD | 2Q25 YTD | vs. 2Q24 YTD | ||||||||||||||||
Management and Advisory Fees, Net |
$ |
1,779,938 |
|
$ |
2,020,012 |
|
|
13% |
|
$ |
3,487,509 |
|
$ |
3,912,010 |
|
12% | ||||||
Fee Related Performance Revenues |
|
177,067 |
|
|
472,050 |
|
|
167% |
|
|
472,568 |
|
|
765,965 |
|
62% | ||||||
Fee Related Compensation |
|
(552,913 |
) |
|
(700,316 |
) |
|
27% |
|
|
(1,106,990 |
) |
|
(1,317,298 |
) |
19% | ||||||
Other Operating Expenses |
|
(293,122 |
) |
|
(332,243 |
) |
|
13% |
|
|
(582,100 |
) |
|
(639,118 |
) |
10% | ||||||
Fee Related Earnings |
$ |
1,110,970 |
|
$ |
1,459,503 |
|
|
31% |
|
$ |
2,270,987 |
|
$ |
2,721,559 |
|
20% | ||||||
|
|
|
|
|||||||||||||||||||
Realized Performance Revenues |
|
542,889 |
|
|
553,121 |
|
|
2% |
|
|
1,079,282 |
|
|
1,013,144 |
|
(6)% | ||||||
Realized Performance Compensation |
|
(251,057 |
) |
|
(256,624 |
) |
|
2% |
|
|
(504,081 |
) |
|
(477,548 |
) |
(5)% | ||||||
Realized Principal Investment Income |
|
16,572 |
|
|
29,421 |
|
|
78% |
|
|
26,510 |
|
|
147,331 |
|
456% | ||||||
Net Realizations |
|
308,404 |
|
|
325,918 |
|
|
6% |
|
|
601,711 |
|
|
682,927 |
|
13% | ||||||
Total Segment Distributable Earnings |
$ |
1,419,374 |
|
$ |
1,785,421 |
|
|
26% |
|
$ |
2,872,698 |
|
$ |
3,404,486 |
|
19% | ||||||
|
|
|
|
|||||||||||||||||||
Distributable Earnings |
$ |
1,252,221 |
|
$ |
1,565,763 |
|
|
25% |
|
$ |
2,518,599 |
|
$ |
2,976,568 |
|
18% | ||||||
|
|
|
|
|||||||||||||||||||
Additional Metrics: |
|
|
|
|||||||||||||||||||
Net Income Per Share of Common Stock, Basic |
$ |
0.58 |
|
$ |
0.98 |
|
|
69% |
|
$ |
1.69 |
|
$ |
1.77 |
|
5% | ||||||
FRE per Share |
$ |
0.91 |
|
$ |
1.19 |
|
|
31% |
|
$ |
1.86 |
|
$ |
2.22 |
|
19% | ||||||
DE per Common Share |
$ |
0.96 |
|
$ |
1.21 |
|
|
26% |
|
$ |
1.94 |
|
$ |
2.30 |
|
19% | ||||||
Total Segment Revenues |
$ |
2,516,466 |
|
$ |
3,074,604 |
|
|
22% |
|
$ |
5,065,869 |
|
$ |
5,838,450 |
|
15% | ||||||
Total Assets Under Management |
$ |
1,076,371,811 |
|
$ |
1,211,207,341 |
|
|
13% |
|
$ |
1,076,371,811 |
|
$ |
1,211,207,341 |
|
13% | ||||||
Fee-Earning Assets Under Management |
$ |
808,656,801 |
|
$ |
887,114,205 |
|
|
10% |
|
$ |
808,656,801 |
|
$ |
887,114,205 |
|
10% |
Fee Related Earnings per Share is based on end of period DE Shares Outstanding (see page 24, Share Summary). DE per Common Share is based on DE Attributable to Common Shareholders (see page 23, Shareholder Dividends) and end of period Participating Common Shares outstanding. YTD FRE per Share and DE per Common Share amounts represent the sum of the last two quarters. See pages 32-33 for the Reconciliation of GAAP to Total Segment Measures. |
Blackstone | 3 |
INVESTMENT PERFORMANCE AND NET ACCRUED PERFORMANCE REVENUES
§ |
Appreciation across nearly all strategies led to higher Net Accrued Performance Revenues quarter-over-quarter of $6.6 billion ($5.37/share). |
Investment Performance
(appreciation / gross returns)
2Q25 | 2Q25 LTM | |||||||||||
Real Estate |
||||||||||||
Opportunistic |
|
0.1% |
|
|
(3.6)% |
|
||||||
Core+ |
|
(0.4)% |
|
|
(0.5)% |
|
||||||
Private Equity |
||||||||||||
Corporate Private Equity |
|
5.1% |
|
|
17.2% |
|
||||||
Tactical Opportunities |
|
4.1% |
|
|
14.3% |
|
||||||
Secondaries |
|
6.6% |
|
|
10.9% |
|
||||||
Infrastructure |
|
2.9% |
|
|
19.1% |
|
||||||
Credit & Insurance |
||||||||||||
Private Credit |
|
3.0% |
|
|
13.3% |
|
||||||
Liquid Credit |
|
2.4% |
|
|
7.9% |
|
||||||
Multi-Asset Investing |
||||||||||||
Absolute Return Composite |
2.8% | 11.8% |
Net Accrued Performance Revenues
($ in millions)
Investment Performance represents fund appreciation for Real Estate and Private Equity and gross returns for Credit & Insurance and Multi-Asset Investing. Secondaries appreciation excludes GP Stakes. Private Credit net returns were 2.2% and 9.5% for 2Q25 and 2Q25 LTM, respectively. Liquid Credit net returns were 2.3% and 7.4% for 2Q25 and 2Q25 LTM, respectively. Absolute Return Composite net returns were 2.5% and 10.6% for 2Q25 and 2Q25 LTM, respectively. See notes on page 34 for additional details on these strategies and our investment performance. |
Blackstone | 4 |
CAPITAL METRICS ADDITIONAL DETAIL
§ |
Inflows were $52.1 billion in the quarter, bringing LTM inflows to $211.8 billion. |
§ |
Deployed $33.1 billion in the quarter and $145.1 billion over the LTM. |
| Committed an additional $19.5 billion that was not yet deployed in the quarter. |
§ |
Realizations were $23.4 billion in the quarter and $97.5 billion over the LTM. |
Inflows | Capital Deployed | Realizations | ||||||||||||||||||||||||||
($ in millions) | 2Q25 | 2Q25 LTM | 2Q25 | 2Q25 LTM | 2Q25 | 2Q25 LTM | ||||||||||||||||||||||
Real Estate |
$ |
7,222 |
|
$ |
27,327 |
|
$ |
6,168 |
|
$ |
22,071 |
|
$ |
5,249 |
|
$ |
22,418 |
| ||||||||||
Opportunistic |
|
383 |
|
|
4,137 |
|
|
1,230 |
|
|
10,186 |
|
|
636 |
|
|
4,249 |
| ||||||||||
Core+ |
|
4,479 |
|
|
14,502 |
|
|
1,857 |
|
|
4,896 |
|
|
2,141 |
|
|
8,977 |
| ||||||||||
Debt Strategies |
|
2,360 |
|
|
8,688 |
|
|
3,081 |
|
|
6,989 |
|
|
2,472 |
|
|
9,192 |
| ||||||||||
Private Equity |
|
15,323 |
|
|
58,826 |
|
|
11,759 |
|
|
51,655 |
|
|
7,316 |
|
|
29,604 |
| ||||||||||
Corporate Private Equity |
|
7,714 |
|
|
31,178 |
|
|
5,088 |
|
|
23,450 |
|
|
3,875 |
|
|
15,471 |
| ||||||||||
Tactical Opportunities |
|
550 |
|
|
3,491 |
|
|
231 |
|
|
4,794 |
|
|
1,042 |
|
|
4,452 |
| ||||||||||
Secondaries |
|
3,289 |
|
|
12,983 |
|
|
2,453 |
|
|
14,856 |
|
|
1,687 |
|
|
7,265 |
| ||||||||||
Infrastructure |
|
3,770 |
|
|
11,174 |
|
|
3,986 |
|
|
8,554 |
|
|
712 |
|
|
2,417 |
| ||||||||||
Credit & Insurance |
|
26,818 |
|
|
112,738 |
|
|
14,098 |
|
|
68,146 |
|
|
9,962 |
|
|
42,179 |
| ||||||||||
Multi-Asset Investing |
|
2,714 |
|
|
12,861 |
|
|
1,055 |
|
|
3,231 |
|
|
825 |
|
|
3,274 |
| ||||||||||
Total Blackstone |
$ |
52,077 |
|
$ |
211,752 |
|
$ |
33,080 |
|
$ |
145,104 |
|
$ |
23,352 |
|
$ |
97,475 |
|
Corporate Private Equity also includes Life Sciences, Growth, BTAS, and BXPE. AUM and related capital metrics are reported in the segment where the assets are managed. |
Blackstone | 5 |
ASSETS UNDER MANAGEMENT
§ |
Total AUM increased to $1,211.2 billion, up 13% year-over-year, with $52.1 billion of inflows in the quarter and $211.8 billion over the LTM. |
§ |
Fee-Earning AUM of $887.1 billion was up 10% year-over-year, with $41.9 billion of inflows in the quarter and $159.4 billion over the LTM. |
§ |
Perpetual Capital AUM reached $484.6 billion, up 16% year-over-year. |
| Fee-Earning Perpetual Capital AUM increased to $415.9 billion, representing 47% of Fee-Earning AUM. |
Multi-Asset Investing had $200 million and $186 million of Perpetual Capital AUM as of 2Q24 and 2Q25, respectively. |
Blackstone | 6 |
ADDITIONAL CAPITAL DETAIL
§ |
Invested Performance Eligible AUM reached $604.4 billion at quarter end, up 14% year-over-year. |
§ |
Total Dry Powder of $181.2 billion available for future investments. |
Invested Performance Eligible AUM represents the fair value of invested assets that are eligible to earn performance revenues. |
Blackstone | 7 |
Segment Highlights
Blackstone | 8 |
SEGMENT DISTRIBUTABLE EARNINGS COMPOSITION
§ |
2Q25 Total Segment Distributable Earnings were $1.8 billion. |
§ |
LTM Total Segment Distributable Earnings were $7.2 billion. |
Segment Distributable Earnings
($ in millions)
| ||
|
|
Blackstone | 9 |
REAL ESTATE
§ |
Total AUM: $325.0 billion with inflows of $7.2 billion in the quarter and $27.3 billion over the LTM. |
| Inflows in the quarter included $2.4 billion in BREDS, of which $1.2 billion was from Insurance SMAs, $1.1 billion of capital raised in BREIT, and $1.0 billion in Blackstone Americas Logistics within Core+. |
§ |
Capital Deployed: $6.2 billion in the quarter, including acquisitions of a portfolio of performing commercial real estate loans in BREDS and a Texas Industrial portfolio in Core+, and $22.1 billion over the LTM. |
§ |
Realizations: $5.2 billion in the quarter and $22.4 billion over the LTM. |
§ |
Appreciation: Opportunistic funds appreciated 0.1% in the quarter and declined (3.6)% over the LTM; Core+ funds declined (0.4)% in the quarter and (0.5)% over the LTM. |
% Change | % Change | |||||||||||||||||||
($ in thousands) | 2Q24 | 2Q25 | vs. 2Q24 | 2Q24 YTD | 2Q25 YTD | vs. 2Q24 YTD | ||||||||||||||
Management Fees, Net |
$ |
757,457 |
|
$ |
711,292 |
|
(6)% |
$ |
1,477,896 |
|
$ |
1,412,140 |
|
(4)% | ||||||
Fee Related Performance Revenues |
|
606 |
|
|
89,590 |
|
n/m |
|
130,564 |
|
|
127,393 |
|
(2)% | ||||||
Fee Related Compensation |
|
(184,404 |
) |
|
(170,209 |
) |
(8)% |
|
(358,973 |
) |
|
(340,734 |
) |
(5)% | ||||||
Other Operating Expenses |
|
(92,378 |
) |
|
(87,048 |
) |
(6)% |
|
(182,140 |
) |
|
(170,329 |
) |
(6)% | ||||||
Fee Related Earnings |
$ |
481,281 |
|
$ |
543,625 |
|
13% |
$ |
1,067,347 |
|
$ |
1,028,470 |
|
(4)% | ||||||
|
||||||||||||||||||||
Realized Performance Revenues |
|
53,472 |
|
|
43,587 |
|
(18)% |
|
103,439 |
|
|
62,597 |
|
(39)% | ||||||
Realized Performance Compensation |
|
(25,295 |
) |
|
(24,139 |
) |
(5)% |
|
(47,158 |
) |
|
(32,909 |
) |
(30)% | ||||||
Realized Principal Investment Income |
|
7,053 |
|
|
2,797 |
|
(60)% |
|
9,246 |
|
|
3,146 |
|
(66)% | ||||||
Net Realizations |
|
35,230 |
|
|
22,245 |
|
(37)% |
|
65,527 |
|
|
32,834 |
|
(50)% | ||||||
Segment Distributable Earnings |
$ |
516,511 |
|
$ |
565,870 |
|
10% |
$ |
1,132,874 |
|
$ |
1,061,304 |
|
(6)% | ||||||
|
||||||||||||||||||||
Segment Revenues |
$ |
818,588 |
|
$ |
847,266 |
|
4% |
$ |
1,721,145 |
|
$ |
1,605,276 |
|
(7)% | ||||||
Total AUM |
$ |
336,100,271 |
|
$ |
324,994,725 |
|
(3)% |
$ |
336,100,271 |
|
$ |
324,994,725 |
|
(3)% | ||||||
Fee-Earning AUM |
$ |
299,066,252 |
|
$ |
285,826,676 |
|
(4)% |
$ |
299,066,252 |
|
$ |
285,826,676 |
|
(4)% |
Blackstone | 10 |
PRIVATE EQUITY
§ |
Total AUM: Increased 18% to $388.9 billion with inflows of $15.3 billion in the quarter and $58.8 billion over the LTM. |
|
Inflows in the quarter included $3.8 billion in Infrastructure, $3.5 billion for the third Corporate Private Equity Asia fund, and $3.3 billion in Secondaries. |
|
$1.7 billion of capital raised for BXPE and $577 million of capital raised for BXINFRA. |
§ |
Capital Deployed: $11.8 billion in the quarter, including Safe Harbor Marinas, Citrin Cooperman, and AGS Airports, and $51.7 billion over the LTM; committed an additional $9.5 billion in the quarter, including to TXNM Energy. |
§ |
Realizations: $7.3 billion in the quarter, including HealthEdge, Vine Energy, and Liftoff, and $29.6 billion over the LTM. |
§ |
Appreciation: Corporate Private Equity appreciated 5.1% in the quarter and 17.2% over the LTM. |
|
Tactical Opportunities appreciated 4.1% in the quarter and 14.3% over the LTM; Secondaries appreciated 6.6% in the quarter and 10.9% over the LTM; Infrastructure appreciated 2.9% in the quarter and 19.1% over the LTM. |
% Change | % Change | |||||||||||||||||||
($ in thousands) | 2Q24 | 2Q25 | vs. 2Q24 | 2Q24 YTD | 2Q25 YTD | vs. 2Q24 YTD | ||||||||||||||
Management and Advisory Fees, Net |
$ |
514,851 |
|
$ |
706,298 |
|
37% |
$ |
1,016,058 |
|
$ |
1,328,090 |
|
31% | ||||||
Fee Related Performance Revenues |
|
8,703 |
|
|
192,331 |
|
n/m |
|
8,703 |
|
|
253,235 |
|
n/m | ||||||
Fee Related Compensation |
|
(158,068 |
) |
|
(266,925 |
) |
69% |
|
(320,627 |
) |
|
(470,244 |
) |
47% | ||||||
Other Operating Expenses |
|
(87,436 |
) |
|
(112,300 |
) |
28% |
|
(177,471 |
) |
|
(215,194 |
) |
21% | ||||||
Fee Related Earnings |
$ |
278,050 |
|
$ |
519,404 |
|
87% |
$ |
526,663 |
|
$ |
895,887 |
|
70% | ||||||
|
||||||||||||||||||||
Realized Performance Revenues |
|
381,797 |
|
|
408,980 |
|
7% |
|
831,671 |
|
|
759,053 |
|
(9)% | ||||||
Realized Performance Compensation |
|
(179,761 |
) |
|
(196,824 |
) |
9% |
|
(400,242 |
) |
|
(367,965 |
) |
(8)% | ||||||
Realized Principal Investment Income |
|
5,725 |
|
|
19,859 |
|
247% |
|
28,154 |
|
|
29,035 |
|
3% | ||||||
Net Realizations |
|
207,761 |
|
|
232,015 |
|
12% |
|
459,583 |
|
|
420,123 |
|
(9)% | ||||||
Segment Distributable Earnings |
$ |
485,811 |
|
$ |
751,419 |
|
55% |
$ |
986,246 |
|
$ |
1,316,010 |
|
33% | ||||||
|
||||||||||||||||||||
Segment Revenues |
$ |
911,076 |
|
$ |
1,327,468 |
|
46% |
$ |
1,884,586 |
|
$ |
2,369,413 |
|
26% | ||||||
Total AUM |
$ |
330,589,586 |
|
$ |
388,907,242 |
|
18% |
$ |
330,589,586 |
|
$ |
388,907,242 |
|
18% | ||||||
Fee-Earning AUM |
$ |
200,486,740 |
|
$ |
232,160,209 |
|
16% |
$ |
200,486,740 |
|
$ |
232,160,209 |
|
16% |
BXPE represents the aggregate BXPE fund platform, which comprises both U.S. and non-U.S. vehicles. BXPE and BXINFRA capital raised includes amounts allocated to other strategies. |
Blackstone | 11 |
CREDIT & INSURANCE
§ |
Total AUM: Increased 23% to $407.3 billion with inflows of $26.8 billion in the quarter and $112.7 billion over the LTM. |
|
Inflows in the quarter included $8.9 billion for the global direct lending strategy, inclusive of $3.7 billion of equity raised for BCRED, and $7.1 billion for infrastructure and asset based credit strategies. |
|
Closed 8 new CLOs (6 U.S. and 2 European) for $4.3 billion. |
|
Subsequent to quarter end, announced a partnership with Legal and General (L&G) to provide access to investment-grade assets to support L&Gs business growth, and to develop public/private credit solutions. |
§ |
Capital Deployed: $14.1 billion in the quarter and $68.1 billion over the LTM driven by U.S. direct lending as well as infrastructure and asset based credit strategies;
committed an additional $8.5 billion that was not yet deployed in the quarter. |
§ |
Realizations: $10.0 billion in the quarter and $42.2 billion over the LTM. |
§ |
Returns: Private Credit gross return of 3.0% (2.2% net) and Liquid Credit gross return of 2.4% (2.3% net) in the quarter. |
|
Private Credit gross return of 13.3% (9.5% net) and Liquid Credit gross return of 7.9% (7.4% net) over the LTM. |
% Change | % Change | |||||||||||||||||||
($ in thousands) | 2Q24 | 2Q25 | vs. 2Q24 | 2Q24 YTD | 2Q25 YTD | vs. 2Q24 YTD | ||||||||||||||
Management Fees, Net |
$ |
390,200 |
|
$ |
470,627 |
|
21% |
$ |
760,015 |
|
$ |
917,671 |
|
21% | ||||||
Fee Related Performance Revenues |
|
167,758 |
|
|
190,129 |
|
13% |
|
333,301 |
|
|
385,337 |
|
16% | ||||||
Fee Related Compensation |
|
(172,551 |
) |
|
(220,305 |
) |
28% |
|
(351,072 |
) |
|
(421,923 |
) |
20% | ||||||
Other Operating Expenses |
|
(88,348 |
) |
|
(107,426 |
) |
22% |
|
(172,924 |
) |
|
(203,704 |
) |
18% | ||||||
Fee Related Earnings |
$ |
297,059 |
|
$ |
333,025 |
|
12% |
$ |
569,320 |
|
$ |
677,381 |
|
19% | ||||||
Realized Performance Revenues |
|
91,247 |
|
|
87,393 |
|
(4)% |
|
106,367 |
|
|
178,990 |
|
68% | ||||||
Realized Performance Compensation |
|
(37,738 |
) |
|
(30,433 |
) |
(19)% |
|
(43,059 |
) |
|
(70,928 |
) |
65% | ||||||
Realized Principal Investment Income |
|
3,511 |
|
|
5,800 |
|
65% |
|
7,072 |
|
|
113,703 |
|
n/m | ||||||
Net Realizations |
|
57,020 |
|
|
62,760 |
|
10% |
|
70,380 |
|
|
221,765 |
|
215% | ||||||
Segment Distributable Earnings |
$ |
354,079 |
|
$ |
395,785 |
|
12% |
$ |
639,700 |
|
$ |
899,146 |
|
41% | ||||||
Segment Revenues |
$ |
652,716 |
|
$ |
753,949 |
|
16% |
$ |
1,206,755 |
|
$ |
1,595,701 |
|
32% | ||||||
Total AUM |
$ |
330,117,204 |
|
$ |
407,296,172 |
|
23% |
$ |
330,117,204 |
|
$ |
407,296,172 |
|
23% | ||||||
Fee-Earning AUM |
$ |
237,285,546 |
|
$ |
288,931,236 |
|
22% |
$ |
237,285,546 |
|
$ |
288,931,236 |
|
22% |
Blackstone | 12 |
MULTI-ASSET INVESTING
§ |
Total AUM: Increased 13% to $90.0 billion with inflows of $2.7 billion in the quarter and $12.9 billion over the LTM. |
§ |
Returns: Absolute Return Composite gross return of 2.8% in the quarter (2.5% net), outperforming the HFRX Global Hedge Fund Index, which was 1.8%. |
| Absolute Return benefited from performance across strategies, including quantitative, equities, macro, and credit during the quarter. |
| Gross return of 11.8% over the LTM (10.6% net), compared to 4.7% return for the HFRX Global Hedge Fund Index, with significantly less volatility than the broader markets. |
% Change | % Change | |||||||||||||||||||
($ in thousands) | 2Q24 | 2Q25 | vs. 2Q24 | 2Q24 YTD | 2Q25 YTD | vs. 2Q24 YTD | ||||||||||||||
Management Fees, Net |
$ |
117,430 |
|
$ |
131,795 |
|
12% |
$ |
233,540 |
|
$ |
254,109 |
|
9% | ||||||
Fee Related Compensation |
|
(37,890 |
) |
|
(42,877 |
) |
13% |
|
(76,318 |
) |
|
(84,397 |
) |
11% | ||||||
Other Operating Expenses |
|
(24,960 |
) |
|
(25,469 |
) |
2% |
|
(49,565 |
) |
|
(49,891 |
) |
1% | ||||||
Fee Related Earnings |
$ |
54,580 |
|
$ |
63,449 |
|
16% |
$ |
107,657 |
|
$ |
119,821 |
|
11% | ||||||
|
||||||||||||||||||||
Realized Performance Revenues |
|
16,373 |
|
|
13,161 |
|
(20)% |
|
37,805 |
|
|
12,504 |
|
(67)% | ||||||
Realized Performance Compensation |
|
(8,263 |
) |
|
(5,228 |
) |
(37)% |
|
(13,622 |
) |
|
(5,746 |
) |
(58)% | ||||||
Realized Principal Investment Income (Loss) |
|
283 |
|
|
965 |
|
241% |
|
(17,962 |
) |
|
1,447 |
|
n/m | ||||||
Net Realizations |
|
8,393 |
|
|
8,898 |
|
6% |
|
6,221 |
|
|
8,205 |
|
32% | ||||||
Segment Distributable Earnings |
$ |
62,973 |
|
$ |
72,347 |
|
15% |
$ |
113,878 |
|
$ |
128,026 |
|
12% | ||||||
|
||||||||||||||||||||
Segment Revenues |
$ |
134,086 |
|
$ |
145,921 |
|
9% |
$ |
253,383 |
|
$ |
268,060 |
|
6% | ||||||
Total AUM |
$ |
79,564,750 |
|
$ |
90,009,202 |
|
13% |
$ |
79,564,750 |
|
$ |
90,009,202 |
|
13% | ||||||
Fee-Earning AUM |
$ |
71,818,263 |
|
$ |
80,196,084 |
|
12% |
$ |
71,818,263 |
|
$ |
80,196,084 |
|
12% |
Blackstone | 13 |
Supplemental Details
Blackstone | 14 |
TOTAL SEGMENTS
($ in thousands) | 2Q24 | 3Q24 | 4Q24 | 1Q25 | 2Q25 | 2Q24 YTD | 2Q25 YTD | ||||||||||||||||||||||||||||
Base Management Fees |
$ | 1,651,566 | $ | 1,710,941 | $ | 1,773,645 | $ | 1,807,119 | $ | 1,876,672 | $ | 3,296,296 | $ | 3,683,791 | |||||||||||||||||||||
Transaction, Advisory and Other Fees, Net |
132,536 | 82,506 | 117,708 | 111,309 | 165,690 | 199,474 | 276,999 | ||||||||||||||||||||||||||||
Management Fee Offsets |
(4,164 | ) | (6,713 | ) | (32,062 | ) | (26,430 | ) | (22,350 | ) | (8,261 | ) | (48,780 | ) | |||||||||||||||||||||
Total Management and Advisory Fees, Net |
1,779,938 | 1,786,734 | 1,859,291 | 1,891,998 | 2,020,012 | 3,487,509 | 3,912,010 | ||||||||||||||||||||||||||||
Fee Related Performance Revenues |
177,067 | 264,101 | 1,399,276 | 293,915 | 472,050 | 472,568 | 765,965 | ||||||||||||||||||||||||||||
Fee Related Compensation |
(552,913 | ) | (554,855 | ) | (1,077,477 | ) | (616,982 | ) | (700,316 | ) | (1,106,990 | ) | (1,317,298 | ) | |||||||||||||||||||||
Other Operating Expenses |
(293,122 | ) | (320,823 | ) | (345,169 | ) | (306,875 | ) | (332,243 | ) | (582,100 | ) | (639,118 | ) | |||||||||||||||||||||
Fee Related Earnings |
$ | 1,110,970 | $ | 1,175,157 | $ | 1,835,921 | $ | 1,262,056 | $ | 1,459,503 | $ | 2,270,987 | $ | 2,721,559 | |||||||||||||||||||||
|
|||||||||||||||||||||||||||||||||||
Realized Performance Revenues |
542,889 | 342,669 | 865,080 | 460,023 | 553,121 | 1,079,282 | 1,013,144 | ||||||||||||||||||||||||||||
Realized Performance Compensation |
(251,057 | ) | (157,570 | ) | (289,595 | ) | (220,924 | ) | (256,624 | ) | (504,081 | ) | (477,548 | ) | |||||||||||||||||||||
Realized Principal Investment Income |
16,572 | 40,403 | 25,613 | 117,910 | 29,421 | 26,510 | 147,331 | ||||||||||||||||||||||||||||
Total Net Realizations |
$ | 308,404 | $ | 225,502 | $ | 601,098 | $ | 357,009 | $ | 325,918 | $ | 601,711 | $ | 682,927 | |||||||||||||||||||||
Total Segment Distributable Earnings |
$ | 1,419,374 | $ | 1,400,659 | $ | 2,437,019 | $ | 1,619,065 | $ | 1,785,421 | $ | 2,872,698 | $ | 3,404,486 | |||||||||||||||||||||
|
|||||||||||||||||||||||||||||||||||
Distributable Earnings |
$ | 1,252,221 | $ | 1,278,650 | $ | 2,169,493 | $ | 1,410,805 | $ | 1,565,763 | $ | 2,518,599 | $ | 2,976,568 | |||||||||||||||||||||
|
|||||||||||||||||||||||||||||||||||
Additional Metrics: |
|||||||||||||||||||||||||||||||||||
Total Segment Revenues |
$ | 2,516,466 | $ | 2,433,907 | $ | 4,149,260 | $ | 2,763,846 | $ | 3,074,604 | $ | 5,065,869 | $ | 5,838,450 | |||||||||||||||||||||
Total Assets Under Management |
$ | 1,076,371,811 | $ | 1,107,628,362 | $ | 1,127,179,996 | $ | 1,167,461,910 | $ | 1,211,207,341 | $ | 1,076,371,811 | $ | 1,211,207,341 | |||||||||||||||||||||
Fee-Earning Assets Under Management |
$ | 808,656,801 | $ | 820,457,203 | $ | 830,708,603 | $ | 860,069,950 | $ | 887,114,205 | $ | 808,656,801 | $ | 887,114,205 |
Blackstone | 15 |
ASSETS UNDER MANAGEMENT - ROLLFORWARD
Total AUM Rollforward
($ in millions)
Three Months Ended June 30, 2025 | Twelve Months Ended June 30, 2025 | |||||||||||||||||||||||||||||||||||||||||||
Real
Estate |
Private
Equity |
Credit &
Insurance |
Multi-Asset
Investing |
Total | Real
Estate |
Private
Equity |
Credit &
Insurance |
Multi-Asset
Investing |
Total | |||||||||||||||||||||||||||||||||||
Beginning Balance |
$ |
319,989 |
|
$ |
370,990 |
|
$ |
388,720 |
|
$ |
87,763 |
|
$ |
1,167,462 |
|
$ |
336,100 |
|
$ |
330,590 |
|
$ |
330,117 |
|
$ |
79,565 |
|
$ |
1,076,372 |
| ||||||||||||||
Inflows |
|
7,222 |
|
|
15,323 |
|
|
26,818 |
|
|
2,714 |
|
|
52,077 |
|
|
27,327 |
|
|
58,826 |
|
|
112,738 |
|
|
12,861 |
|
|
211,752 |
| ||||||||||||||
Outflows |
|
(1,883 |
) |
|
(1,805 |
) |
|
(5,287 |
) |
|
(1,796 |
) |
|
(10,772 |
) |
|
(22,233 |
) |
|
(9,774 |
) |
|
(9,333 |
) |
|
(8,161 |
) |
|
(49,500 |
) | ||||||||||||||
Net Flows |
|
5,339 |
|
|
13,518 |
|
|
21,531 |
|
|
917 |
|
|
41,306 |
|
|
5,095 |
|
|
49,053 |
|
|
103,405 |
|
|
4,700 |
|
|
162,252 |
| ||||||||||||||
Realizations |
|
(5,249 |
) |
|
(7,316 |
) |
|
(9,962 |
) |
|
(825 |
) |
|
(23,352 |
) |
|
(22,418 |
) |
|
(29,604 |
) |
|
(42,179 |
) |
|
(3,274 |
) |
|
(97,475 |
) | ||||||||||||||
Market Activity |
|
4,916 |
|
|
11,715 |
|
|
7,007 |
|
|
2,154 |
|
|
25,792 |
|
|
6,218 |
|
|
38,869 |
|
|
15,953 |
|
|
9,018 |
|
|
70,059 |
| ||||||||||||||
Ending Balance |
$ |
324,995 |
|
$ |
388,907 |
|
$ |
407,296 |
|
$ |
90,009 |
|
$ |
1,211,207 |
|
$ |
324,995 |
|
$ |
388,907 |
|
$ |
407,296 |
|
$ |
90,009 |
|
$ |
1,211,207 |
| ||||||||||||||
% Change |
|
2% |
|
|
5% |
|
|
5% |
|
|
3% |
|
|
4% |
|
|
(3)% |
|
|
18% |
|
|
23% |
|
|
13% |
|
|
13% |
|
Fee-Earning AUM Rollforward
($ in millions)
Three Months Ended June 30, 2025 | Twelve Months Ended June 30, 2025 | |||||||||||||||||||||||||||||||||||||||||||
Real
Estate |
Private
Equity |
Credit &
Insurance |
Multi-Asset
Investing |
Total | Real
Estate |
Private
Equity |
Credit &
Insurance |
Multi-Asset
Investing |
Total | |||||||||||||||||||||||||||||||||||
Beginning Balance |
$ |
282,060 |
|
$ |
226,219 |
|
$ |
274,120 |
|
$ |
77,670 |
|
$ |
860,070 |
|
$ |
299,066 |
|
$ |
200,487 |
|
$ |
237,286 |
|
$ |
71,818 |
|
$ |
808,657 |
| ||||||||||||||
Inflows |
|
7,587 |
|
|
7,550 |
|
|
23,817 |
|
|
2,945 |
|
|
41,900 |
|
|
26,464 |
|
|
39,825 |
|
|
82,637 |
|
|
10,475 |
|
|
159,401 |
| ||||||||||||||
Outflows |
|
(1,713 |
) |
|
(805 |
) |
|
(5,873 |
) |
|
(1,689 |
) |
|
(10,080 |
) |
|
(20,706 |
) |
|
(6,142 |
) |
|
(12,773 |
) |
|
(7,576 |
) |
|
(47,197 |
) | ||||||||||||||
Net Flows |
|
5,874 |
|
|
6,746 |
|
|
17,944 |
|
|
1,255 |
|
|
31,820 |
|
|
5,759 |
|
|
33,683 |
|
|
69,864 |
|
|
2,899 |
|
|
112,205 |
| ||||||||||||||
Realizations |
|
(5,406 |
) |
|
(3,289 |
) |
|
(7,006 |
) |
|
(782 |
) |
|
(16,483 |
) |
|
(23,027 |
) |
|
(11,376 |
) |
|
(26,990 |
) |
|
(2,971 |
) |
|
(64,364 |
) | ||||||||||||||
Market Activity |
|
3,297 |
|
|
2,484 |
|
|
3,873 |
|
|
2,053 |
|
|
11,707 |
|
|
4,029 |
|
|
9,367 |
|
|
8,772 |
|
|
8,450 |
|
|
30,617 |
| ||||||||||||||
Ending Balance |
$ |
285,827 |
|
$ |
232,160 |
|
$ |
288,931 |
|
$ |
80,196 |
|
$ |
887,114 |
|
$ |
285,827 |
|
$ |
232,160 |
|
$ |
288,931 |
|
$ |
80,196 |
|
$ |
887,114 |
| ||||||||||||||
% Change |
|
1% |
|
|
3% |
|
|
5% |
|
|
3% |
|
|
3% |
|
|
(4)% |
|
|
16% |
|
|
22% |
|
|
12% |
|
|
10% |
|
Inflows include contributions, capital raised, other increases in available capital (recallable capital and increased side-by-side commitments), purchases, inter-segment allocations and acquisitions. Outflows represent redemptions, client withdrawals and decreases in available capital (expired capital, expense drawdowns and decreased side-by-side commitments). Realizations represent realization proceeds from the disposition or other monetization of assets, current income or capital returned to investors from CLOs. Market Activity includes realized and unrealized gains (losses) on portfolio investments and the impact of foreign exchange rate fluctuations. AUM is reported in the segment where the assets are managed. |
Blackstone | 16 |
DECONSOLIDATED BALANCE SHEET HIGHLIGHTS
§ |
At June 30, 2025, Blackstone had $10.6 billion in total cash, cash equivalents, corporate treasury, and other investments and $20.5 billion of cash and net investments, or $16.64 per share. |
§ |
Blackstone has a $4.3 billion credit revolver ($3.6 billion undrawn) and maintains A+/A+ ratings. |
($ in millions) |
2Q25 | |||
Cash and Cash Equivalents |
$ | 2,235 | ||
Corporate Treasury and |
8,336 | |||
GP/Fund Investments |
3,289 | |||
Net Accrued Performance Revenues |
6,608 | |||
Cash and Net Investments |
$ | 20,468 | ||
Outstanding Debt (at par) |
12,004 |
Cash and Net Investments
(per share)
A+ / A+
rated by S&P and Fitch
$4.3B
credit revolver with
December 2028 maturity
$10.6B
total cash, corporate
treasury and other
Balance Sheet Highlights exclude the consolidated Blackstone Funds. Other Investments was $6.8 billion as of June 30, 2025, which was comprised of $6.3 billion of liquid investments and $514 million of illiquid investments. See notes on pages 31 and 34 for additional details on non-GAAP balance sheet measures. |
Blackstone | 17 |
NET ACCRUED PERFORMANCE REVENUES ADDITIONAL DETAIL
($ in millions, except per share data)
2Q24 | 1Q25 | 2Q25 | 2Q25 | |||||||||||||
Per Share | ||||||||||||||||
Real Estate |
||||||||||||||||
BREP Global |
$ |
1,294 |
|
$ |
904 |
|
$ |
721 |
|
$ |
0.59 |
| ||||
BREP Europe |
|
117 |
|
|
69 |
|
|
27 |
|
|
0.02 |
| ||||
BREP Asia |
|
97 |
|
|
98 |
|
|
98 |
|
|
0.08 |
| ||||
BPP |
|
73 |
|
|
37 |
|
|
45 |
|
|
0.04 |
| ||||
BREDS |
|
16 |
|
|
32 |
|
|
32 |
|
|
0.03 |
| ||||
Real Estate |
$ |
1,595 |
|
$ |
1,140 |
|
$ |
923 |
|
$ |
0.75 |
| ||||
Private Equity |
||||||||||||||||
BCP Global |
|
1,508 |
|
|
1,739 |
|
|
1,869 |
|
|
1.52 |
| ||||
BCP Asia |
|
190 |
|
|
253 |
|
|
344 |
|
|
0.28 |
| ||||
Energy/Energy Transition |
|
417 |
|
|
545 |
|
|
515 |
|
|
0.42 |
| ||||
Core Private Equity |
|
243 |
|
|
257 |
|
|
266 |
|
|
0.22 |
| ||||
Tactical Opportunities |
|
159 |
|
|
200 |
|
|
227 |
|
|
0.18 |
| ||||
Secondaries |
|
813 |
|
|
1,144 |
|
|
1,270 |
|
|
1.03 |
| ||||
Infrastructure |
|
478 |
|
|
248 |
|
|
247 |
|
|
0.20 |
| ||||
Life Sciences |
|
125 |
|
|
214 |
|
|
239 |
|
|
0.19 |
| ||||
BTAS/BXPE |
|
217 |
|
|
238 |
|
|
236 |
|
|
0.19 |
| ||||
Private Equity |
$ |
4,150 |
|
$ |
4,838 |
|
$ |
5,212 |
|
$ |
4.24 |
| ||||
Credit & Insurance |
$ |
391 |
|
$ |
374 |
|
$ |
369 |
|
$ |
0.30 |
| ||||
Multi-Asset Investing |
$ | 78 | $ | 46 | $ | 103 | $ | 0.08 | ||||||||
Net Accrued Performance Revenues |
$ |
6,214 |
|
$ |
6,399 |
|
$ |
6,608 |
|
$ |
5.37 |
|
2Q25 QoQ Rollforward
($ in millions)
Net | Net | |||||||||||||||
Performance | Realized | |||||||||||||||
1Q25 | Revenues | Distributions | 2Q25 | |||||||||||||
Real Estate |
$ | 1,140 | $ | (111 | ) | $ | (106 | ) | $ | 923 | ||||||
Private Equity |
4,838 | 707 | (332 | ) | 5,212 | |||||||||||
Credit & |
374 | 179 | (184 | ) | 369 | |||||||||||
Multi-Asset |
46 | 65 | (8 | ) | 103 | |||||||||||
Total |
$ | 6,399 | $ | 840 | $ | (631 | ) | $ | 6,608 | |||||||
QoQ Change |
3% |
2Q25 LTM Rollforward
($ in millions)
Net | Net | |||||||||||||||
Performance | Realized | |||||||||||||||
2Q24 | Revenues | Distributions | 2Q25 | |||||||||||||
Real Estate |
$ | 1,595 | $ | (405) | $ | (267 | ) | $ | 923 | |||||||
Private Equity |
4,150 | 2,636 | (1,573 | ) | 5,212 | |||||||||||
Credit & |
391 | 719 | (741 | ) | 369 | |||||||||||
Multi-Asset |
78 | 301 | (276 | ) | 103 | |||||||||||
Total |
$ | 6,214 | $ | 3,251 | $ | (2,857 | ) | $ | 6,608 | |||||||
YoY Change |
6% |
Net Accrued Performance Revenues (NAPR) are presented net of performance compensation and excludes Performance Revenues realized but not yet distributed as of the reporting date and clawback amounts, if any, which are disclosed in the 10-K/Q. Real Estate and Private Equity include co-investments, as applicable. Per Share calculations are based on end of period DE Shares Outstanding (see page 24, Share Summary). |
Blackstone | 18 |
INVESTMENT RECORDS AS OF JUNE 30, 2025(a)
($/ in thousands, except where noted)
Fund (Investment Period Beginning Date / Ending Date)
|
Committed
Capital
|
Available
Capital (b)
|
Unrealized Investments | Realized Investments | Total Investments | Net IRRs (d) | ||||||||||||||||||||||||
Value |
MOIC (c) |
Value |
MOIC (c) |
Value |
MOIC (c) |
Realized |
Total | |||||||||||||||||||||||
Real Estate |
||||||||||||||||||||||||||||||
Pre-BREP - BREP IV (Jan 1992 / Dec 2005) |
$ |
5,441,163 |
|
$ |
- |
|
$ |
- |
|
n/a |
$ |
12,219,526 |
|
2.0x |
$ |
12,219,526 |
|
2.0x |
24% |
24% | ||||||||||
BREP V (Dec 2005 / Feb 2007) |
|
5,539,418 |
|
|
- |
|
|
2,336 |
|
n/a |
|
13,468,476 |
|
2.3x |
|
13,470,812 |
|
2.3x |
11% |
11% | ||||||||||
BREP VI (Feb 2007 / Aug 2011) |
|
11,060,122 |
|
|
- |
|
|
1,752 |
|
n/a |
|
27,764,962 |
|
2.5x |
|
27,766,714 |
|
2.5x |
13% |
13% | ||||||||||
BREP VII (Aug 2011 / Apr 2015) |
|
13,506,798 |
|
|
898,732 |
|
|
1,584,660 |
|
0.5x |
|
28,788,970 |
|
2.2x |
|
30,373,630 |
|
1.9x |
18% |
14% | ||||||||||
BREP VIII (Apr 2015 / Jun 2019) |
|
16,638,999 |
|
|
1,415,060 |
|
|
10,524,212 |
|
1.3x |
|
23,084,365 |
|
2.3x |
|
33,608,577 |
|
1.8x |
23% |
12% | ||||||||||
BREP IX (Jun 2019 / Aug 2022) |
|
21,356,236 |
|
|
3,197,042 |
|
|
21,704,362 |
|
1.2x |
|
9,310,853 |
|
2.1x |
|
31,015,215 |
|
1.4x |
52% |
8% | ||||||||||
*BREP X (Aug 2022 / Feb 2028) |
|
30,662,078 |
|
|
19,129,490 |
|
|
14,101,112 |
|
1.2x |
|
1,071,053 |
|
1.2x |
|
15,172,165 |
|
1.2x |
7% |
10% | ||||||||||
Total Global BREP |
$ |
104,204,814 |
|
$ |
24,640,324 |
|
$ |
47,918,434 |
|
1.2x |
$ |
115,708,205 |
|
2.3x |
$ |
163,626,639 |
|
1.8x |
17% |
14% | ||||||||||
BREP Intl I-II (Jan 2001 / Jun 2008) (e) |
|
2,453,920 |
|
|
- |
|
|
- |
|
n/a |
|
3,956,202 |
|
1.9x |
|
3,956,202 |
|
1.9x |
12% |
12% | ||||||||||
BREP Europe III (Jun 2008 / Sep 2013) |
|
3,205,420 |
|
|
385,566 |
|
|
56,204 |
|
0.3x |
|
5,926,938 |
|
2.1x |
|
5,983,142 |
|
2.0x |
14% |
13% | ||||||||||
BREP Europe IV (Sep 2013 / Dec 2016) |
|
6,676,604 |
|
|
1,047,011 |
|
|
940,560 |
|
0.7x |
|
10,217,388 |
|
1.9x |
|
11,157,948 |
|
1.7x |
17% |
11% | ||||||||||
BREP Europe V (Dec 2016 / Oct 2019) |
|
7,997,397 |
|
|
757,584 |
|
|
4,192,061 |
|
0.8x |
|
6,762,819 |
|
3.8x |
|
10,954,880 |
|
1.5x |
41% |
6% | ||||||||||
BREP Europe VI (Oct 2019 / Sep 2023) |
|
9,935,641 |
|
|
2,869,990 |
|
|
7,798,015 |
|
1.1x |
|
3,512,882 |
|
2.6x |
|
11,310,897 |
|
1.4x |
72% |
8% | ||||||||||
*BREP Europe VII (Sep 2023 / Mar 2029) |
|
9,783,376 |
|
|
7,332,218 |
|
|
2,917,076 |
|
1.2x |
|
47,242 |
|
1.1x |
|
2,964,318 |
|
1.2x |
n/m |
15% | ||||||||||
Total BREP Europe |
|
40,052,358 |
|
|
12,392,369 |
|
|
15,903,916 |
|
1.0x |
|
30,423,471 |
|
2.3x |
|
46,327,387 |
|
1.5x |
16% |
10% | ||||||||||
BREP Asia I (Jun 2013 / Dec 2017) |
$ |
4,262,075 |
|
$ |
898,761 |
|
$ |
1,509,465 |
|
1.8x |
$ |
7,369,699 |
|
2.0x |
$ |
8,879,164 |
|
1.9x |
15% |
12% | ||||||||||
BREP Asia II (Dec 2017 / Mar 2022) |
|
7,358,270 |
|
|
1,236,069 |
|
|
6,202,463 |
|
1.2x |
|
2,387,241 |
|
1.8x |
|
8,589,704 |
|
1.3x |
23% |
4% | ||||||||||
*BREP Asia III (Mar 2022 / Sep 2027) |
|
8,225,740 |
|
|
4,628,445 |
|
|
3,884,536 |
|
1.1x |
|
70,976 |
|
2.3x |
|
3,955,512 |
|
1.1x |
42% |
(2)% | ||||||||||
Total BREP Asia |
$ |
19,846,085 |
|
$ |
6,763,275 |
|
$ |
11,596,464 |
|
1.2x |
$ |
9,827,916 |
|
1.9x |
$ |
21,424,380 |
|
1.5x |
16% |
8% | ||||||||||
BREP Co-Investment (f) |
|
7,782,389 |
|
|
136,284 |
|
|
1,142,965 |
|
1.4x |
|
15,277,156 |
|
2.2x |
|
16,420,121 |
|
2.1x |
16% |
16% | ||||||||||
Total BREP |
$ |
178,512,387 |
|
$ |
45,899,019 |
|
$ |
78,518,657 |
|
1.1x |
$ |
177,993,322 |
|
2.2x |
$ |
256,511,979 |
|
1.7x |
17% |
13% | ||||||||||
*BREDS High-Yield (Various) (g) |
|
27,607,180 |
|
|
9,640,706 |
|
|
5,402,248 |
|
1.1x |
|
22,923,144 |
|
1.3x |
|
28,325,392 |
|
1.3x |
10% |
9% | ||||||||||
Private Equity |
||||||||||||||||||||||||||||||
Corporate Private Equity |
||||||||||||||||||||||||||||||
BCP I-III (Oct 1987 / Nov 2002) |
$ |
6,187,603 |
|
$ |
- |
|
$ |
- |
|
n/a |
$ |
14,239,072 |
|
2.4x |
$ |
14,239,072 |
|
2.4x |
19% |
19% | ||||||||||
BCOM (Jun 2000 / Jun 2006) |
|
2,137,330 |
|
|
24,575 |
|
|
187 |
|
n/a |
|
2,995,106 |
|
1.4x |
|
2,995,293 |
|
1.4x |
6% |
6% | ||||||||||
BCP IV (Nov 2002 / Dec 2005) |
|
6,773,182 |
|
|
195,824 |
|
|
329 |
|
n/a |
|
21,720,334 |
|
2.9x |
|
21,720,663 |
|
2.9x |
36% |
36% | ||||||||||
BCP V (Dec 2005 / Jan 2011) |
|
21,009,112 |
|
|
982,018 |
|
|
7,751 |
|
n/a |
|
38,862,488 |
|
1.9x |
|
38,870,239 |
|
1.9x |
8% |
8% | ||||||||||
BCP VI (Jan 2011 / May 2016) |
|
15,195,794 |
|
|
1,341,577 |
|
|
3,749,193 |
|
2.1x |
|
29,465,219 |
|
2.3x |
|
33,214,412 |
|
2.2x |
15% |
12% | ||||||||||
BCP VII (May 2016 / Feb 2020) |
|
18,872,738 |
|
|
1,464,882 |
|
|
17,109,476 |
|
1.7x |
|
21,685,432 |
|
2.7x |
|
38,794,908 |
|
2.1x |
25% |
13% | ||||||||||
BCP VIII (Feb 2020 / Apr 2024) |
|
25,753,034 |
|
|
7,205,084 |
|
|
27,089,459 |
|
1.4x |
|
5,102,888 |
|
2.3x |
|
32,192,347 |
|
1.5x |
35% |
10% | ||||||||||
*BCP IX (Apr 2024 / Apr 2030) |
|
21,699,785 |
|
|
20,652,930 |
|
|
1,454,909 |
|
1.6x |
|
- |
|
n/a |
|
1,454,909 |
|
1.6x |
n/a |
n/m | ||||||||||
Energy I (Aug 2011 / Feb 2015) |
|
2,441,558 |
|
|
174,492 |
|
|
390,794 |
|
2.0x |
|
4,456,022 |
|
2.0x |
|
4,846,816 |
|
2.0x |
13% |
12% | ||||||||||
Energy II (Feb 2015 / Feb 2020) |
|
4,931,260 |
|
|
783,727 |
|
|
3,917,459 |
|
1.9x |
|
4,954,266 |
|
1.9x |
|
8,871,725 |
|
1.9x |
12% |
8% | ||||||||||
Energy III (Feb 2020 / Jun 2024) |
|
4,355,417 |
|
|
1,675,267 |
|
|
5,203,019 |
|
2.1x |
|
2,301,128 |
|
2.4x |
|
7,504,147 |
|
2.2x |
38% |
25% | ||||||||||
*Energy Transition IV (Jun 2024 / Jun 2030) |
|
5,852,687 |
|
|
4,738,767 |
|
|
1,458,397 |
|
1.5x |
|
- |
|
n/a |
|
1,458,397 |
|
1.5x |
n/a |
n/m | ||||||||||
BCP Asia I (Dec 2017 / Sep 2021) |
|
2,437,080 |
|
|
417,510 |
|
|
2,715,503 |
|
2.2x |
|
2,886,025 |
|
3.0x |
|
5,601,528 |
|
2.6x |
43% |
24% | ||||||||||
*BCP Asia II (Sep 2021 / Sep 2027) |
|
6,794,242 |
|
|
4,558,655 |
|
|
4,495,291 |
|
2.3x |
|
858,688 |
|
3.4x |
|
5,353,979 |
|
2.4x |
106% |
41% | ||||||||||
BCP Asia III (TBD) |
|
7,906,614 |
|
|
7,906,614 |
|
|
- |
|
n/a |
|
- |
|
n/a |
|
- |
|
n/a |
n/a |
n/a | ||||||||||
Core Private Equity I (Jan 2017 / Mar 2021) (h) |
|
4,760,130 |
|
|
1,184,250 |
|
|
7,607,485 |
|
2.0x |
|
3,086,102 |
|
5.5x |
|
10,693,587 |
|
2.5x |
59% |
16% | ||||||||||
*Core Private Equity II (Mar 2021 / Mar 2026) (h) |
|
8,231,069 |
|
|
5,028,913 |
|
|
5,067,196 |
|
1.5x |
|
502,247 |
|
n/a |
|
5,569,443 |
|
1.6x |
n/a |
14% | ||||||||||
Total Corporate Private Equity |
$ |
165,338,635 |
|
$ |
58,335,085 |
|
$ |
80,266,448 |
|
1.7x |
$ |
153,115,017 |
|
2.3x |
$ |
233,381,465 |
|
2.0x |
16% |
15% | ||||||||||
Tactical Opportunities |
||||||||||||||||||||||||||||||
*Tactical Opportunities (Various) |
|
31,299,857 |
|
|
12,676,036 |
|
|
14,449,563 |
|
1.3x |
|
27,911,570 |
|
1.8x |
|
42,361,133 |
|
1.6x |
14% |
11% | ||||||||||
*Tactical Opportunities Co-Investment and Other (Various) |
|
10,719,054 |
|
|
1,232,593 |
|
|
4,710,265 |
|
1.4x |
|
11,033,570 |
|
1.8x |
|
15,743,835 |
|
1.6x |
18% |
15% | ||||||||||
Total Tactical Opportunities |
$ |
42,018,911 |
|
$ |
13,908,629 |
|
$ |
19,159,828 |
|
1.3x |
$ |
38,945,140 |
|
1.8x |
$ |
58,104,968 |
|
1.6x |
16% |
12% |
The returns presented herein represent those of the applicable Blackstone Funds and not those of Blackstone Inc. n/m represents not meaningful generally due to the limited time since initial investment. n/a represents not applicable. Notes on pages 21-22. BREP Blackstone Real Estate Partners, BREDS Blackstone Real Estate Debt Strategies, BCP Blackstone Capital Partners, BCOM Blackstone Communications. * Represents funds that are currently in their investment period. |
Blackstone | 19 |
INVESTMENT RECORDS AS OF JUNE 30, 2025(a) (CONTD)
($/ in thousands, except where noted)
Fund (Investment Period Beginning Date / Ending Date)
|
Committed
Capital
|
Available
Capital (b)
|
Unrealized Investments | Realized Investments | Total Investments | Net IRRs (d) | ||||||||||||||||||||||||
Value |
MOIC (c) |
Value |
MOIC (c) |
Value |
MOIC (c) |
Realized |
Total | |||||||||||||||||||||||
Private Equity (continued) |
||||||||||||||||||||||||||||||
Growth |
||||||||||||||||||||||||||||||
BXG I (Jul 2020 / Feb 2025) |
$ |
4,968,719 |
|
$ |
724,615 |
|
$ |
4,111,011 |
|
1.0x |
$ |
561,134 |
|
2.7x |
$ |
4,672,145 |
|
1.1x |
n/m |
(1)% | ||||||||||
*BXG II (Feb 2025 / Feb 2030) |
|
4,389,899 |
|
|
4,342,078 |
|
|
- |
|
n/a |
|
- |
|
n/a |
|
- |
|
n/a |
n/a |
n/a | ||||||||||
Total Growth |
$ |
9,358,618 |
|
$ |
5,066,693 |
|
$ |
4,111,011 |
|
1.0x |
$ |
561,134 |
|
2.7x |
$ |
4,672,145 |
|
1.1x |
n/m |
(1)% | ||||||||||
Strategic Partners (Secondaries) |
||||||||||||||||||||||||||||||
Strategic Partners I-V (Various) (i) |
|
11,035,527 |
|
|
9,572 |
|
|
1,962 |
|
n/a |
|
16,796,758 |
|
n/a |
|
16,798,720 |
|
1.7x |
n/a |
13% | ||||||||||
Strategic Partners VI (Apr 2014 / Apr 2016) (i) |
|
4,362,772 |
|
|
590,701 |
|
|
529,398 |
|
n/a |
|
4,543,440 |
|
n/a |
|
5,072,838 |
|
1.7x |
n/a |
13% | ||||||||||
Strategic Partners VII (May 2016 / Mar 2019) (i) |
|
7,489,970 |
|
|
1,633,510 |
|
|
2,657,693 |
|
n/a |
|
8,036,195 |
|
n/a |
|
10,693,888 |
|
1.9x |
n/a |
15% | ||||||||||
Strategic Partners Real Assets II (May 2017 / Jun 2020) (i) |
|
1,749,807 |
|
|
517,352 |
|
|
1,395,364 |
|
n/a |
|
1,240,984 |
|
n/a |
|
2,636,348 |
|
1.8x |
n/a |
16% | ||||||||||
Strategic Partners VIII (Mar 2019 / Oct 2021) (i) |
|
10,763,600 |
|
|
3,587,242 |
|
|
7,459,822 |
|
n/a |
|
7,549,779 |
|
n/a |
|
15,009,601 |
|
1.8x |
n/a |
21% | ||||||||||
*Strategic Partners Real Estate, SMA and Other (Various) (i) |
|
7,055,591 |
|
|
1,708,630 |
|
|
2,543,735 |
|
n/a |
|
2,650,956 |
|
n/a |
|
5,194,691 |
|
1.4x |
n/a |
11% | ||||||||||
Strategic Partners Infrastructure III (Jun 2020 / Jun 2024) (i) |
|
3,250,100 |
|
|
789,234 |
|
|
2,569,431 |
|
n/a |
|
640,888 |
|
n/a |
|
3,210,319 |
|
1.5x |
n/a |
18% | ||||||||||
*Strategic Partners IX (Oct 2021 / Jan 2027) (i) |
|
19,692,625 |
|
|
3,697,398 |
|
|
13,603,694 |
|
n/a |
|
1,107,668 |
|
n/a |
|
14,711,362 |
|
1.5x |
n/a |
21% | ||||||||||
*Strategic Partners GP Solutions (Jun 2021 / Dec 2026) (i) |
|
2,095,211 |
|
|
578,490 |
|
|
1,038,195 |
|
n/a |
|
11,152 |
|
n/a |
|
1,049,347 |
|
1.0x |
n/a |
(2)% | ||||||||||
*Strategic Partners Infrastructure IV (Jul 2024 / Jun 2029) (i) |
|
4,637,949 |
|
|
4,190,514 |
|
|
69,750 |
|
n/a |
|
- |
|
n/a |
|
69,750 |
|
n/m |
n/a |
n/m | ||||||||||
Total Strategic Partners (Secondaries) |
$ |
72,133,152 |
|
$ |
17,302,643 |
|
$ |
31,869,044 |
|
n/a |
$ |
42,577,820 |
|
n/a |
$ |
74,446,864 |
|
1.6x |
n/a |
14% | ||||||||||
Life Sciences |
||||||||||||||||||||||||||||||
Clarus IV (Jan 2018 / Jan 2020) |
|
910,000 |
|
|
55,270 |
|
|
699,827 |
|
2.1x |
|
586,139 |
|
1.4x |
|
1,285,966 |
|
1.7x |
6% |
9% | ||||||||||
BXLS V (Jan 2020 / Mar 2025) |
|
4,993,165 |
|
|
2,566,835 |
|
|
4,705,006 |
|
2.1x |
|
1,088,641 |
|
1.6x |
|
5,793,647 |
|
2.0x |
9% |
20% | ||||||||||
Credit |
||||||||||||||||||||||||||||||
Mezzanine / Opportunistic I (Jul 2007 / Oct 2011) |
$ |
2,000,000 |
|
$ |
97,114 |
|
$ |
- |
|
n/a |
$ |
4,809,113 |
|
1.6x |
$ |
4,809,113 |
|
1.6x |
n/a |
17% | ||||||||||
Mezzanine / Opportunistic II (Nov 2011 / Nov 2016) |
|
4,120,000 |
|
|
993,260 |
|
|
72,977 |
|
0.6x |
|
6,678,087 |
|
1.4x |
|
6,751,064 |
|
1.4x |
n/a |
9% | ||||||||||
Mezzanine / Opportunistic III (Sep 2016 / Jan 2021) |
|
6,639,133 |
|
|
1,076,877 |
|
|
1,525,686 |
|
1.0x |
|
9,260,802 |
|
1.6x |
|
10,786,488 |
|
1.5x |
n/a |
12% | ||||||||||
*Mezzanine / Opportunistic IV (Jan 2021 / Jan 2026) |
|
5,016,771 |
|
|
1,369,196 |
|
|
4,206,195 |
|
1.2x |
|
2,526,842 |
|
1.6x |
|
6,733,037 |
|
1.3x |
n/a |
13% | ||||||||||
Mezzanine / Opportunistic V (TBD) |
|
3,916,540 |
|
|
3,916,540 |
|
|
- |
|
n/a |
|
- |
|
n/a |
|
- |
|
n/a |
n/a |
n/a | ||||||||||
Total Mezzanine / Opportunistic |
$ |
21,692,444 |
|
$ |
7,452,987 |
|
$ |
5,804,858 |
|
1.1x |
$ |
23,274,844 |
|
1.5x |
$ |
29,079,702 |
|
1.4x |
n/a |
13% | ||||||||||
Stressed / Distressed I (Sep 2009 / May 2013) |
|
3,253,143 |
|
|
- |
|
|
- |
|
n/a |
|
5,777,098 |
|
1.3x |
|
5,777,098 |
|
1.3x |
n/a |
9% | ||||||||||
Stressed / Distressed II (Jun 2013 / Jun 2018) |
|
5,125,000 |
|
|
547,430 |
|
|
66,642 |
|
0.1x |
|
5,504,072 |
|
1.2x |
|
5,570,714 |
|
1.1x |
n/a |
1% | ||||||||||
Stressed / Distressed III (Dec 2017 / Dec 2022) |
|
7,356,380 |
|
|
1,068,577 |
|
|
1,454,800 |
|
0.8x |
|
5,516,944 |
|
1.5x |
|
6,971,744 |
|
1.3x |
n/a |
10% | ||||||||||
Total Stressed / Distressed |
$ |
15,734,523 |
|
$ |
1,616,007 |
|
$ |
1,521,442 |
|
0.7x |
$ |
16,798,114 |
|
1.3x |
$ |
18,319,556 |
|
1.2x |
n/a |
7% | ||||||||||
European Senior Debt I (Feb 2015 / Feb 2019) |
|
1,964,689 |
|
|
65,796 |
|
|
172,113 |
|
0.3x |
|
2,981,872 |
|
1.3x |
|
3,153,985 |
|
1.1x |
n/a |
1% | ||||||||||
European Senior Debt II (Jun 2019 / Jun 2023) (j) |
|
4,088,344 |
|
|
916,352 |
|
|
2,799,584 |
|
0.9x |
|
4,166,690 |
|
1.7x |
|
6,966,274 |
|
1.3x |
n/a |
9% | ||||||||||
Total European Senior Debt |
|
6,053,033 |
|
|
982,148 |
|
|
2,971,697 |
|
0.8x |
|
7,148,562 |
|
1.5x |
|
10,120,259 |
|
1.2x |
n/a |
6% | ||||||||||
Energy I (Nov 2015 / Nov 2018) |
$ |
2,856,867 |
|
$ |
1,154,819 |
|
$ |
173,338 |
|
0.8x |
$ |
3,422,576 |
|
1.6x |
$ |
3,595,914 |
|
1.5x |
n/a |
10% | ||||||||||
Energy II (Feb 2019 / Jun 2023) |
|
3,616,081 |
|
|
1,464,279 |
|
|
619,526 |
|
1.0x |
|
3,216,072 |
|
1.4x |
|
3,835,598 |
|
1.3x |
n/a |
15% | ||||||||||
*Energy III (May 2023 / May 2028) |
|
6,477,000 |
|
|
3,043,157 |
|
|
3,936,437 |
|
1.1x |
|
328,904 |
|
1.2x |
|
4,265,341 |
|
1.1x |
n/a |
13% | ||||||||||
Total Energy |
$ |
12,949,948 |
|
$ |
5,662,255 |
|
$ |
4,729,301 |
|
1.1x |
$ |
6,967,552 |
|
1.5x |
$ |
11,696,853 |
|
1.3x |
n/a |
12% | ||||||||||
*Senior Direct Lending I (Dec 2023 / Dec 2025) (k) |
|
2,057,661 |
|
|
736,905 |
|
|
2,162,525 |
|
1.1x |
|
64,476 |
|
1.1x |
|
2,227,001 |
|
1.1x |
n/a |
11% | ||||||||||
Total Credit Drawdown Funds (l) |
$ |
59,340,235 |
|
$ |
16,621,050 |
|
$ |
19,149,462 |
|
1.0x |
$ |
55,671,872 |
|
1.5x |
$ |
74,821,334 |
|
1.3x |
n/a |
10% |
The returns presented herein represent those of the applicable Blackstone Funds and not those of Blackstone Inc. n/m represents not meaningful generally due to the limited time since initial investment. n/a represents not applicable. Notes on pages 21-22. BXG Blackstone Growth, BXLS Blackstone Life Sciences. * Represents funds that are currently in their investment period. |
Blackstone | 20 |
INVESTMENT RECORDS AS OF JUNE 30, 2025(a) (CONTD)
Selected Perpetual Capital Strategies(m)
($/ in thousands, except where noted) | Investment | Total | Total Net | |||||||||||||||||
Strategy (Inception Year) | Strategy | AUM | Return (n) | |||||||||||||||||
Real Estate |
||||||||||||||||||||
BPP - Blackstone Property Partners Platform (2013) (o) |
Core+ Real Estate | $ | 64,298,098 | 4% | ||||||||||||||||
BREIT - Blackstone Real Estate Income Trust (2017) (p) |
Core+ Real Estate | 53,050,569 | 9% | |||||||||||||||||
BREIT - Class I (q) |
Core+ Real Estate | 9% | ||||||||||||||||||
BXMT - Blackstone Mortgage Trust (2013) (r) |
Real Estate Debt | 6,129,160 | 7% | |||||||||||||||||
Private Equity |
||||||||||||||||||||
BXGP - Blackstone GP Stakes (2014) (s) |
Minority GP Interests | 11,656,689 | 14% | |||||||||||||||||
BIP - Blackstone Infrastructure Partners (2019) (t) |
Infrastructure | 51,540,327 | 17% | |||||||||||||||||
BXPE - Blackstone Private Equity Strategies Fund Program (2024) (u) |
Private Equity | 12,515,293 | 16% | |||||||||||||||||
BXPE - Class I (v) |
Private Equity | 17% | ||||||||||||||||||
Credit |
||||||||||||||||||||
BXSL - Blackstone Secured Lending Fund (2018) (w) |
U.S. Direct Lending | 16,311,870 | 11% | |||||||||||||||||
BCRED - Blackstone Private Credit Fund (2021) (x) |
U.S. Direct Lending | 83,511,801 | 10% | |||||||||||||||||
BCRED - Class I (y) |
U.S. Direct Lending | 10% | ||||||||||||||||||
ECRED - Blackstone European Credit Fund (2022) (z) |
European Direct Lending | | 2,613,129 | 10% | ||||||||||||||||
ECRED - Class I (aa) |
European Direct Lending | 11% |
Investment Records as of June 30, 2025 - Notes
(a) | Excludes investment vehicles where Blackstone does not earn fees. |
(b) | Available Capital represents total investable capital commitments, including side-by-side, adjusted for certain expenses and expired or recallable capital and may include leverage, less invested capital. This amount is not reduced by outstanding commitments to investments. |
(c) | Multiple of Invested Capital (MOIC) represents carrying value, before management fees, expenses and Performance Revenues, divided by invested capital. |
(d) | Unless otherwise indicated, Net Internal Rate of Return (IRR) represents the annualized inception to June 30, 2025 IRR on total invested capital based on realized proceeds and unrealized value, as applicable, after management fees, expenses and Performance Revenues. IRRs are calculated using actual timing of limited partner cash flows. Initial inception date of cash flows may differ from the Investment Period Beginning Date. |
(e) | The 12% Realized Net IRR and 12% Total Net IRR exclude investors that opted out of the Hilton investment opportunity. Overall BREP International I-II performance reflects a 10% Realized Net IRR and a 10% Total Net IRR. |
(f) | BREP Co-Investment represents co-investment capital raised for various BREP investments. The Net IRR reflected is calculated by aggregating each co-investments realized proceeds and unrealized value, as applicable, after management fees, expenses and Performance Revenues. |
(g) | BREDS High-Yield represents the flagship real estate debt drawdown funds only. |
(h) | Blackstone Core Equity Partners is a core private equity strategy which invests with a more modest risk profile and longer hold period than traditional private equity. |
(i) | Strategic Partners Unrealized Investment Value, Realized Investment Value, Total Investment Value, Total MOIC and Total Net IRRs are reported on a three-month lag and therefore do not include the impact of economic and market activities in the current quarter. Realizations are treated as returns of capital until fully recovered and therefore Unrealized and Realized MOICs and Realized Net IRRs are not applicable. Committed Capital and Available Capital are presented as of the current quarter. |
(j) | European Senior Debt II IRR represents the blended return across the commingled levered and unlevered funds within the strategy. The total net returns were 14% and 8%, respectively, for the levered and unlevered funds of the strategy. |
(k) | Senior Direct Lending I IRR represents the blended return across the commingled levered and unlevered funds within the strategy. The total net returns were 14% and 8%, respectively, for the levered and unlevered funds of the strategy. |
The returns presented herein represent those of the applicable Blackstone Funds and not those of Blackstone Inc. n/m represents not meaningful generally due to the
limited time since initial investment. n/a represents not applicable. Notes continue on page 22. |
Blackstone | 21 |
INVESTMENT RECORDS AS OF JUNE 30, 2025(a) (CONTD)
(l) | Funds presented represent the flagship credit drawdown funds only. The Total Credit Net IRR is the combined IRR of the credit drawdown funds presented. |
(m) | Represents the performance for select Perpetual Capital Strategies; strategies excluded consist primarily of (1) investment strategies that have been investing for less than one year, (2) perpetual capital assets managed for certain insurance clients, and (3) investment vehicles where Blackstone does not earn fees. |
(n) | Unless otherwise indicated, Total Net Return represents the annualized inception to June 30, 2025 IRR on total invested capital based on realized proceeds and unrealized value, as applicable, after management fees, expenses and Performance Revenues. IRRs are calculated using actual timing of investor cash flows. Initial inception date of cash flows occurred during the Inception Year. |
(o) | BPP represents the aggregate Total AUM and Total Net Return of the BPP Platform, which comprises over 30 funds, co-investment and separately managed account vehicles. It includes certain vehicles managed as part of the BPP Platform but not classified as Perpetual Capital. As of June 30, 2025, these vehicles represented $4.4 billion of Total AUM. |
(p) | The BREIT Total Net Return reflects a per share blended return, assuming BREIT had a single share class, reinvestment of all dividends received during the period, and no upfront selling commission, net of all fees and expenses incurred by BREIT. This return is not representative of the return experienced by any particular investor or share class. Total Net Return is presented on an annualized basis and is from January 1, 2017. |
(q) | Represents the Total Net Return for BREITs Class I shares, its largest share class. Performance varies by share class. Class I Total Net Return assumes reinvestment of all dividends received during the period, and no upfront selling commission, net of all fees and expenses incurred by BREIT. Class I Total Net Return is presented on an annualized basis and is from January 1, 2017. |
(r) | The BXMT Total Net Return reflects annualized market return of a shareholder invested in BXMT since inception, May 22, 2013, assuming reinvestment of all dividends received during the period. |
(s) | Blackstone GP Stakes (BXGP) represents the aggregate Total AUM and Total Net Return of BSCH I and II funds that invest as part of the Secondaries GP Stakes strategy, which targets minority investments in the general partners of private equity and other private-market alternative asset management firms globally. As of June 30, 2025, including co-investment vehicles that do not pay fees, BXGP Total AUM is $13.1 billion. |
(t) | BIP represents the aggregate Total AUM and Total Net Return of infrastructure-focused funds and co-investment vehicles for institutional investors with a primary focus on the U.S. and Europe. As of June 30, 2025, including co-investment vehicles that do not pay fees, BIP Total AUM is $62.4 billion. |
(u) | The BXPE Total Net Return reflects a per share blended return, assuming the BXPE Fund Program had a single vehicle and a single share class, reinvestment of any dividends received during the period, and no upfront selling commission, net of all fees and expenses incurred by BXPE. This return is not representative of the return experienced by any particular vehicle, investor or share class. For purposes of calculating the blended return, vehicles or share classes that report in a foreign currency have been converted to U.S. dollars at the spot rate as of June 30, 2025. Total net return is from January 2, 2024 and any share class or vehicle that has an inception date of less than one year from such latest reporting date is excluded from the calculation. BXPE Total AUM reflects net asset value as of June 30, 2025. BXPE AUM, to the extent managed by a different business, is reported in such business for the purposes of segment AUM reporting. |
(v) | Represents the blended Total Net Return for BXPE Fund Program Class I shares, the Programs largest share class across vehicles. Performance varies by vehicle and share class. Class I Total Net Return assumes reinvestment of any dividends received during the period, and no upfront selling commission, net of all fees and expenses incurred by the Class I shares. For purposes of calculating the blended Class I return, vehicles or share classes that report in a foreign currency have been converted to U.S. dollars at the spot rate as of June 30, 2025. Class I Total Net Return is from January 2, 2024 and any share class or vehicle that has an inception date of less than one year from such latest reporting date is excluded from the calculation. |
(w) | The BXSL Total AUM and Total Net Return are presented as of March 31, 2025. BXSL Total Net Return reflects the change in NAV per share, plus distributions per share (assuming dividends and distributions are reinvested in accordance with BXSLs dividend reinvestment plan) divided by the beginning NAV per share. Total Net Returns are presented on an annualized basis and are from November 20, 2018. |
(x) | The BCRED Total Net Return reflects a per share blended return, assuming BCRED had a single share class, reinvestment of all dividends received during the period, and no upfront selling commission, net of all fees and expenses incurred by BCRED. This return is not representative of the return experienced by any particular investor or share class. Total Net Return is presented on an annualized basis and is from January 7, 2021. Total AUM reflects gross asset value plus amounts borrowed or available to be borrowed under certain credit facilities. BCRED net asset value as of June 30, 2025 was $44.3 billion. |
(y) | Represents the Total Net Return for BCREDs Class I shares, its largest share class. Performance varies by share class. Class I Total Net Return assumes reinvestment of all dividends received during the period, and no upfront selling commission, net of all fees and expenses incurred by BCRED. Class I Total Net Return is presented on an annualized basis and is from January 7, 2021. |
(z) | The ECRED Total Net Return reflects a per share blended return, assuming ECRED had a single share class, reinvestment of all dividends received during the period, and no upfront selling commission, net of all fees and expenses incurred by ECRED. This return is not representative of the return experienced by any particular investor or share class. Total Net Return is presented on an annualized basis and is from October 3, 2022. Total AUM reflects gross asset value plus amounts borrowed or available to be borrowed under certain credit facilities. ECRED net asset value as of June 30, 2025 was 1.3 billion. |
(aa) | Represents the Total Net Return for ECREDs Class I shares, its largest share class. Performance varies by share class. Total Net Return assumes reinvestment of all dividends received during the period, and no upfront selling commission, net of all fees and expenses incurred by ECRED. Class I Total Net Return is presented on an annualized basis and is from October 3, 2022. |
Blackstone | 22 |
SHAREHOLDER DIVIDENDS
§ |
Generated $1.21 of Distributable Earnings per common share during the quarter, bringing the YTD amount to $2.30 per common share. |
§ |
Blackstone declared a quarterly dividend of $1.03 per common share to record holders as of August 4, 2025; payable on August 11, 2025. |
% Change | % Change | |||||||||||||||||||||||||||||||||||
($ in thousands, except per share data) | 2Q24 | 3Q24 | 4Q24 | 1Q25 | 2Q25 | vs. 2Q24 | 2Q24 YTD | 2Q25 YTD | vs. 2Q24 YTD | |||||||||||||||||||||||||||
Distributable Earnings |
$ | 1,252,221 | $ | 1,278,650 | $ | 2,169,493 | $ | 1,410,805 | $ | 1,565,763 | 25% | $ | 2,518,599 | $ | 2,976,568 | 18 | % | |||||||||||||||||||
Add: Other Payables Attributable to |
124,280 | 73,491 | 185,782 | 138,425 | 142,664 | 15% | 255,200 | 281,089 | 10 | % | ||||||||||||||||||||||||||
DE Before Certain Payables |
1,376,501 | 1,352,141 | 2,355,275 | 1,549,230 | 1,708,427 | 24% | 2,773,799 | 3,257,657 | 17 | % | ||||||||||||||||||||||||||
Percent to Common Shareholders |
63% | 63% | 63% | 63% | 64% | 63% | 63% | |||||||||||||||||||||||||||||
DE Before Certain Payables Attributable to Common Shareholders |
864,033 | 849,966 | 1,482,636 | 980,440 | 1,086,833 | 26% | 1,735,920 | 2,067,273 | 19 | % | ||||||||||||||||||||||||||
Less: Other Payables Attributable to Common Shareholders |
(124,280 | ) | (73,491 | ) | (185,782 | ) | (138,425 | ) | (142,664 | ) | 15% | (255,200 | ) | (281,089 | ) | 10 | % | |||||||||||||||||||
DE Attributable to Common Shareholders |
739,753 | 776,475 | 1,296,854 | 842,015 | 944,169 | 28% | 1,480,720 | 1,786,184 | 21 | % | ||||||||||||||||||||||||||
DE per Common Share |
$ | 0.96 | $ | 1.01 | $ | 1.69 | $ | 1.09 | $ | 1.21 | 26% | $ | 1.94 | $ | 2.30 | 19 | % | |||||||||||||||||||
Less: Retained Capital per Common Share |
$ | (0.14 | ) | $ | (0.15 | ) | $ | (0.25 | ) | $ | (0.16 | ) | $ | (0.18 | ) | 29% | $ | (0.29 | ) | $ | (0.34 | ) | 17 | % | ||||||||||||
Actual Dividend per Common Share |
$ | 0.82 | $ | 0.86 | $ | 1.44 | $ | 0.93 | $ | 1.03 | 26% | $ | 1.65 | $ | 1.96 | 19 | % | |||||||||||||||||||
Record Date |
Aug 4, 2025 | |||||||||||||||||||||||||||||||||||
Payable Date |
Aug 11, 2025 |
A detailed description of Blackstones dividend policy and the definition of Distributable Earnings can be found on pages 36-38, Definitions and Dividend Policy. See additional notes on page 35. | Blackstone | 23 |
SHARE SUMMARY
§ |
Distributable Earnings Shares Outstanding as of quarter end of 1,230 million shares. |
| Repurchased 0.2 million common shares in the quarter and 1.7 million common shares over the LTM. |
| Available authorization remaining was $1.8 billion at June 30, 2025. |
2Q24 | 3Q24 | 4Q24 | 1Q25 | 2Q25 | ||||||||||||||||
Participating Common Shares |
768,224,405 | 767,895,244 | 768,722,241 | 773,038,934 | 782,567,390 | |||||||||||||||
Participating Partnership Units |
455,642,926 | 453,685,697 | 452,448,896 | 448,468,715 | 447,574,842 | |||||||||||||||
Distributable Earnings Shares Outstanding |
1,223,867,331 | 1,221,580,941 | 1,221,171,137 | 1,221,507,649 | 1,230,142,232 |
Participating Common Shares and Participating Partnership Units include both issued and outstanding shares and unvested shares that participate in dividends. | Blackstone | 24 |
Reconciliations and Disclosures
Blackstone | 25 |
BLACKSTONES SECOND QUARTER 2025 GAAP CONSOLIDATED STATEMENTS OF OPERATIONS
($ in thousands, except per share data) (unaudited) |
2Q24 |
2Q25 |
2Q24 YTD |
2Q25 YTD |
2Q24 LTM |
2Q25 LTM |
||||||||||||||||||||||
Revenues |
||||||||||||||||||||||||||||
Management and Advisory Fees, Net |
$ |
1,787,313 |
|
$ |
2,035,495 |
|
$ |
3,514,461 |
|
$ |
3,939,812 |
|
$ |
6,818,036 |
|
$ |
7,614,287 |
| ||||||||||
Incentive Fees |
|
188,299 |
|
|
195,414 |
|
|
367,640 |
|
|
387,239 |
|
|
766,858 |
|
|
983,777 |
| ||||||||||
Investment Income |
||||||||||||||||||||||||||||
Performance Allocations |
||||||||||||||||||||||||||||
Realized |
|
531,641 |
|
|
829,820 |
|
|
1,184,158 |
|
|
1,391,870 |
|
|
2,259,021 |
|
|
3,665,458 |
| ||||||||||
Unrealized |
|
122,229 |
|
|
313,283 |
|
|
568,172 |
|
|
576,484 |
|
|
(478,679 |
) |
|
379,719 |
| ||||||||||
Principal Investments |
||||||||||||||||||||||||||||
Realized |
|
74,045 |
|
|
97,171 |
|
|
152,642 |
|
|
282,713 |
|
|
293,572 |
|
|
462,329 |
| ||||||||||
Unrealized |
|
(31,776 |
) |
|
365,391 |
|
|
429,847 |
|
|
524,104 |
|
|
154,021 |
|
|
474,848 |
| ||||||||||
Total Investment Income |
|
696,139 |
|
|
1,605,665 |
|
|
2,334,819 |
|
|
2,775,171 |
|
|
2,227,935 |
|
|
4,982,354 |
| ||||||||||
Interest and Dividend Revenue |
|
104,999 |
|
|
100,389 |
|
|
202,838 |
|
|
197,809 |
|
|
480,345 |
|
|
406,130 |
| ||||||||||
Other |
|
19,631 |
|
|
(225,063 |
) |
|
64,451 |
|
|
(298,673 |
) |
|
17,340 |
|
|
(239,431 |
) | ||||||||||
Total Revenues |
$ |
2,796,381 |
|
$ |
3,711,900 |
|
$ |
6,484,209 |
|
$ |
7,001,358 |
|
$ |
10,310,514 |
|
$ |
13,747,117 |
| ||||||||||
Expenses |
||||||||||||||||||||||||||||
Compensation and Benefits |
||||||||||||||||||||||||||||
Compensation |
|
766,647 |
|
|
870,358 |
|
|
1,561,450 |
|
|
1,899,720 |
|
|
2,893,595 |
|
|
3,386,499 |
| ||||||||||
Incentive Fee Compensation |
|
77,139 |
|
|
67,363 |
|
|
150,846 |
|
|
124,392 |
|
|
304,405 |
|
|
347,132 |
| ||||||||||
Performance Allocations Compensation |
||||||||||||||||||||||||||||
Realized |
|
260,736 |
|
|
331,191 |
|
|
519,630 |
|
|
573,081 |
|
|
918,499 |
|
|
1,485,668 |
| ||||||||||
Unrealized |
|
101,680 |
|
|
152,618 |
|
|
282,580 |
|
|
256,177 |
|
|
(112,729 |
) |
|
113,618 |
| ||||||||||
Total Compensation and Benefits |
|
1,206,202 |
|
|
1,421,530 |
|
|
2,514,506 |
|
|
2,853,370 |
|
|
4,003,770 |
|
|
5,332,917 |
| ||||||||||
General, Administrative and Other |
|
311,928 |
|
|
360,817 |
|
|
681,878 |
|
|
693,190 |
|
|
1,250,755 |
|
|
1,373,221 |
| ||||||||||
Interest Expense |
|
108,616 |
|
|
135,822 |
|
|
216,819 |
|
|
253,937 |
|
|
436,150 |
|
|
480,806 |
| ||||||||||
Fund Expenses |
|
5,960 |
|
|
14,434 |
|
|
9,910 |
|
|
26,538 |
|
|
48,913 |
|
|
36,304 |
| ||||||||||
Total Expenses |
$ |
1,632,706 |
|
$ |
1,932,603 |
|
$ |
3,423,113 |
|
$ |
3,827,035 |
|
$ |
5,739,588 |
|
$ |
7,223,248 |
| ||||||||||
Other Income (Loss) |
||||||||||||||||||||||||||||
Change in Tax Receivable Agreement Liability |
|
- |
|
|
- |
|
|
- |
|
|
- |
|
|
(29,083 |
) |
|
(41,246 |
) | ||||||||||
Net Gains (Losses) from Fund Investment Activities |
|
44,934 |
|
|
136,330 |
|
|
27,167 |
|
|
193,905 |
|
|
(181,198 |
) |
|
256,822 |
| ||||||||||
Total Other Income (Loss) |
$ |
44,934 |
|
$ |
136,330 |
|
$ |
27,167 |
|
$ |
193,905 |
|
$ |
(210,281) |
|
$ |
215,576 |
| ||||||||||
Income Before Provision for Taxes |
$ |
1,208,609 |
|
$ |
1,915,627 |
|
$ |
3,088,263 |
|
$ |
3,368,228 |
|
$ |
4,360,645 |
|
$ |
6,739,445 |
| ||||||||||
Provision for Taxes |
|
260,246 |
|
|
289,494 |
|
|
543,917 |
|
|
533,321 |
|
|
786,434 |
|
|
1,011,075 |
| ||||||||||
Net Income |
$ |
948,363 |
|
$ |
1,626,133 |
|
$ |
2,544,346 |
|
$ |
2,834,907 |
|
$ |
3,574,211 |
|
$ |
5,728,370 |
| ||||||||||
Net Income (Loss)
Attributable to Redeemable Non-Controlling |
|
258 |
|
|
18,209 |
|
|
(39,411 |
) |
|
26,109 |
|
|
(295,917 |
) |
|
4,231 |
| ||||||||||
Net Income Attributable to
Non-Controlling |
100,583 | 240,836 | 203,410 | 341,383 | 263,260 | 611,799 | ||||||||||||||||||||||
Net Income Attributable to
Non-Controlling |
|
403,108 |
|
|
602,844 |
|
|
1,088,547 |
|
|
1,088,319 |
|
|
1,611,274 |
|
|
2,248,536 |
| ||||||||||
Net Income Attributable to Blackstone Inc. |
$ |
444,414 |
|
$ |
764,244 |
|
$ |
1,291,800 |
|
$ |
1,379,096 |
|
$ |
1,995,594 |
|
$ |
2,863,804 |
| ||||||||||
Net Income Per Share of Common Stock, Basic |
$ |
0.58 |
|
$ |
0.98 |
|
$ |
1.69 |
|
$ |
1.77 |
|
$ |
2.62 |
|
$ |
3.71 |
| ||||||||||
Net Income Per Share of Common Stock, Diluted |
$ |
0.58 |
|
$ |
0.98 |
|
$ |
1.69 |
|
$ |
1.77 |
|
$ |
2.62 |
|
$ |
3.71 |
|
Blackstone | 26 |
RECONCILIATION OF GAAP TO NON-GAAP MEASURES
QTD | YTD | LTM | ||||||||||||||||||||||||||||||||||||||||||
($ in thousands) | 2Q24 | 3Q24 | 4Q24 | 1Q25 | 2Q25 | 2Q24 | 2Q25 | 2Q24 | 2Q25 | |||||||||||||||||||||||||||||||||||
Net Income Attributable to Blackstone Inc. |
$ | 444,414 | $ | 780,835 | $ | 703,873 | $ | 614,852 | $ | 764,244 | $ | 1,291,800 | $ | 1,379,096 | $ | 1,995,594 | $ | 2,863,804 | ||||||||||||||||||||||||||
Net Income Attributable to Non-Controlling Interests in Blackstone Holdings |
403,108 | 603,057 | 557,160 | 485,475 | 602,844 | 1,088,547 | 1,088,319 | 1,611,274 | 2,248,536 | |||||||||||||||||||||||||||||||||||
Net Income Attributable to Non-Controlling Interests in Consolidated Entities |
100,583 | 202,929 | 67,487 | 100,547 | 240,836 | 203,410 | 341,383 | 263,260 | 611,799 | |||||||||||||||||||||||||||||||||||
Net Income (Loss) Attributable to Redeemable Non-Controlling Interests in Consolidated Entities |
258 | (22,184 | ) | 306 | 7,900 | 18,209 | (39,411 | ) | 26,109 | (295,917 | ) | 4,231 | ||||||||||||||||||||||||||||||||
Net Income |
$ | 948,363 | $ | 1,564,637 | $ | 1,328,826 | $ | 1,208,774 | $ | 1,626,133 | $ | 2,544,346 | $ | 2,834,907 | $ | 3,574,211 | $ | 5,728,370 | ||||||||||||||||||||||||||
Provision for Taxes |
260,246 | 245,303 | 232,451 | 243,827 | 289,494 | 543,917 | 533,321 | 786,434 | 1,011,075 | |||||||||||||||||||||||||||||||||||
Income Before Provision for Taxes |
$ | 1,208,609 | $ | 1,809,940 | $ | 1,561,277 | $ | 1,452,601 | $ | 1,915,627 | $ | 3,088,263 | $ | 3,368,228 | $ | 4,360,645 | $ | 6,739,445 | ||||||||||||||||||||||||||
Transaction-Related and Non-Recurring Items (a) |
4,962 | (394 | ) | (393 | ) | 18,824 | 10,381 | 57,159 | 29,205 | 72,291 | 28,418 | |||||||||||||||||||||||||||||||||
Amortization of Intangibles (b) |
7,333 | 7,333 | 7,333 | 7,333 | 7,333 | 14,666 | 14,666 | 29,370 | 29,332 | |||||||||||||||||||||||||||||||||||
Impact of Consolidation (c) |
(100,841 | ) | (180,745 | ) | (67,793 | ) | (108,447 | ) | (259,045 | ) | (163,999 | ) | (367,492 | ) | 32,657 | (616,030 | ) | |||||||||||||||||||||||||||
Unrealized Performance Revenues (d) |
(122,239 | ) | (1,154,905 | ) | 1,351,673 | (263,201 | ) | (313,256 | ) | (568,175 | ) | (576,457 | ) | 478,676 | (379,689 | ) | ||||||||||||||||||||||||||||
Unrealized Performance Allocations Compensation (e) |
101,680 | 465,099 | (607,658 | ) | 103,559 | 152,618 | 282,580 | 256,177 | (112,729 | ) | 113,618 | |||||||||||||||||||||||||||||||||
Unrealized Principal Investment (Income) Loss (f) |
38,125 | 90,254 | 42,729 | (161,257 | ) | (294,093 | ) | (404,851 | ) | (455,350 | ) | (129,968 | ) | (322,367 | ) | |||||||||||||||||||||||||||||
Other Revenues (g) |
(19,541 | ) | 96,329 | (155,207 | ) | 73,635 | 225,083 | (64,288 | ) | 298,718 | (17,103 | ) | 239,840 | |||||||||||||||||||||||||||||||
Equity-Based Compensation (h) |
295,396 | 262,798 | 283,149 | 471,302 | 312,018 | 613,175 | 783,320 | 1,054,760 | 1,329,267 | |||||||||||||||||||||||||||||||||||
Administrative Fee Adjustment (i) |
2,465 | 3,219 | 3,429 | 4,186 | 4,112 | 4,942 | 8,298 | 9,789 | 14,946 | |||||||||||||||||||||||||||||||||||
Taxes and Related Payables (j) |
(163,728 | ) | (120,278 | ) | (249,046 | ) | (187,730 | ) | (195,015 | ) | (340,873 | ) | (382,745 | ) | (659,998 | ) | (752,069 | ) | ||||||||||||||||||||||||||
Distributable Earnings |
$ | 1,252,221 | $ | 1,278,650 | $ | 2,169,493 | $ | 1,410,805 | $ | 1,565,763 | $ | 2,518,599 | $ | 2,976,568 | $ | 5,118,390 | $ | 6,424,711 | ||||||||||||||||||||||||||
Taxes and Related Payables (j) |
163,728 | 120,278 | 249,046 | 187,730 | 195,015 | 340,873 | 382,745 | 659,998 | 752,069 | |||||||||||||||||||||||||||||||||||
Net Interest and Dividend (Income) Loss (k) |
3,425 | 1,731 | 18,480 | 20,530 | 24,643 | 13,226 | 45,173 | (55,892 | ) | 65,384 | ||||||||||||||||||||||||||||||||||
Total Segment Distributable Earnings |
$ | 1,419,374 | $ | 1,400,659 | $ | 2,437,019 | $ | 1,619,065 | $ | 1,785,421 | $ | 2,872,698 | $ | 3,404,486 | $ | 5,722,496 | $ | 7,242,164 | ||||||||||||||||||||||||||
Realized Performance Revenues (l) |
(542,889 | ) | (342,669 | ) | (865,080 | ) | (460,023 | ) | (553,121 | ) | (1,079,282 | ) | (1,013,144 | ) | (2,110,435 | ) | (2,220,893 | ) | ||||||||||||||||||||||||||
Realized Performance Compensation (m) |
251,057 | 157,570 | 289,595 | 220,924 | 256,624 | 504,081 | 477,548 | 925,704 | 924,713 | |||||||||||||||||||||||||||||||||||
Realized Principal Investment (Income) Loss (n) |
(16,572 | ) | (40,403 | ) | (25,613 | ) | (117,910 | ) | (29,421 | ) | (26,510 | ) | (147,331 | ) | (101,212 | ) | (213,347 | ) | ||||||||||||||||||||||||||
Fee Related Earnings |
$ | 1,110,970 | $ | 1,175,157 | $ | 1,835,921 | $ | 1,262,056 | $ | 1,459,503 | $ | 2,270,987 | $ | 2,721,559 | $ | 4,436,553 | $ | 5,732,637 | ||||||||||||||||||||||||||
Adjusted EBITDA Reconciliation |
||||||||||||||||||||||||||||||||||||||||||||
Distributable Earnings |
$ | 1,252,221 | $ | 1,278,650 | $ | 2,169,493 | $ | 1,410,805 | $ | 1,565,763 | $ | 2,518,599 | $ | 2,976,568 | $ | 5,118,390 | $ | 6,424,711 | ||||||||||||||||||||||||||
Interest Expense (o) |
108,424 | 111,326 | 117,027 | 117,950 | 125,033 | 216,064 | 242,983 | 434,246 | 471,336 | |||||||||||||||||||||||||||||||||||
Taxes and Related Payables (j) |
163,728 | 120,278 | 249,046 | 187,730 | 195,015 | 340,873 | 382,745 | 659,998 | 752,069 | |||||||||||||||||||||||||||||||||||
Depreciation and Amortization (p) |
25,336 | 24,685 | 22,682 | 22,226 | 26,642 | 51,389 | 48,868 | 98,238 | 96,235 | |||||||||||||||||||||||||||||||||||
Adjusted EBITDA |
$ | 1,549,709 | $ | 1,534,939 | $ | 2,558,248 | $ | 1,738,711 | $ | 1,912,453 | $ | 3,126,925 | $ | 3,651,164 | $ | 6,310,872 | $ | 7,744,351 | ||||||||||||||||||||||||||
Notes on pages 28-29. |
Blackstone | 27 |
RECONCILIATION OF GAAP TO NON-GAAP MEASURES NOTES
Note: See pages 36-38, Definitions and Dividend Policy.
(a) |
This adjustment removes Transaction-Related and Non-Recurring Items, which are excluded from Blackstones segment presentation. Transaction-Related and Non-Recurring Items arise from corporate actions including acquisitions, divestitures, Blackstones initial public offering, and non-recurring gains, losses, or other charges, if any. They consist primarily of equity-based compensation charges, gains and losses on contingent consideration arrangements, changes in the balance of the Tax Receivable Agreement resulting from a change in tax law or similar event, transaction costs, gains or losses associated with these corporate actions, and non-recurring gains, losses or other charges that affect period-to-period comparability and are not reflective of Blackstones operational performance. |
(b) |
This adjustment removes the amortization of transaction-related intangibles, which are excluded from Blackstones segment presentation. |
(c) |
This adjustment reverses the effect of consolidating Blackstone Funds, which are excluded from Blackstones segment presentation. This adjustment includes the elimination of Blackstones interest in these funds and the removal of amounts associated with the ownership of Blackstone consolidated operating partnerships held by non-controlling interests. |
(d) |
This adjustment removes Unrealized Performance Revenues on a segment basis. The Segment Adjustment represents the add back of performance revenues earned from consolidated Blackstone Funds which have been eliminated in consolidation. |
QTD | YTD | LTM | ||||||||||||||||||||||||||||||||||||||||||||
($ in thousands) | 2Q24 | 3Q24 | 4Q24 | 1Q25 | 2Q25 | 2Q24 | 2Q25 | 2Q24 | 2Q25 | |||||||||||||||||||||||||||||||||||||
GAAP Unrealized Performance Allocations |
$ | 122,229 | $ | 1,154,918 | $ | (1,351,683 | ) | $ | 263,201 | $ | 313,283 | $ | 568,172 | $ | 576,484 | $ | (478,679 | ) | $ | 379,719 | ||||||||||||||||||||||||||
Segment Adjustment |
10 | (13 | ) | 10 | - | (27 | ) | 3 | (27 | ) | 3 | (30 | ) | |||||||||||||||||||||||||||||||||
Unrealized Performance Revenues |
$ | 122,239 | $ | 1,154,905 | $ | (1,351,673 | ) | $ | 263,201 | $ | 313,256 | $ | 568,175 | $ | 576,457 | $ | (478,676 | ) | $ | 379,689 | ||||||||||||||||||||||||||
(e) This adjustment removes Unrealized Performance Allocations Compensation. (f) This adjustment removes Unrealized Principal Investment Income on a segment basis. The Segment Adjustment represents (1) the add back of Principal Investment Income, including general partner income, earned from consolidated Blackstone Funds which have been eliminated in consolidation, and (2) the removal of amounts associated with the ownership of Blackstone consolidated operating partnerships held by non-controlling interests.
|
| |||||||||||||||||||||||||||||||||||||||||||||
QTD | YTD | LTM | ||||||||||||||||||||||||||||||||||||||||||||
($ in thousands) | 2Q24 | 3Q24 | 4Q24 | 1Q25 | 2Q25 | 2Q24 | 2Q25 | 2Q24 | 2Q25 | |||||||||||||||||||||||||||||||||||||
GAAP Unrealized Principal Investment Income (Loss) |
$ | (31,776 | ) | $ | (1,864 | ) | $ | (47,392 | ) | $ | 158,713 | $ | 365,391 | $ | 429,847 | $ | 524,104 | $ | 154,021 | $ | 474,848 | |||||||||||||||||||||||||
Segment Adjustment |
(6,349 | ) | (88,390 | ) | 4,663 | 2,544 | (71,298 | ) | (24,996 | ) | (68,754 | ) | (24,053 | ) | (152,481 | ) | ||||||||||||||||||||||||||||||
Unrealized Principal Investment Income (Loss) |
$ | (38,125 | ) | $ | (90,254 | ) | $ | (42,729 | ) | $ | 161,257 | $ | 294,093 | $ | 404,851 | $ | 455,350 | $ | 129,968 | $ | 322,367 | |||||||||||||||||||||||||
(g) This adjustment removes Other Revenues on a segment basis. The Segment Adjustment represents the removal of certain Transaction-Related and Non-Recurring Items.
|
| |||||||||||||||||||||||||||||||||||||||||||||
QTD | YTD | LTM | ||||||||||||||||||||||||||||||||||||||||||||
($ in thousands) | 2Q24 | 3Q24 | 4Q24 | 1Q25 | 2Q25 | 2Q24 | 2Q25 | 2Q24 | 2Q25 | |||||||||||||||||||||||||||||||||||||
GAAP Other Revenue |
$ | 19,631 | $ | (96,312 | ) | $ | 155,554 | $ | (73,610 | ) | $ | (225,063 | ) | $ | 64,451 | $ | (298,673 | ) | $ | 17,340 | $ | (239,431 | ) | |||||||||||||||||||||||
Segment Adjustment |
(90 | ) | (17 | ) | (347 | ) | (25 | ) | (20 | ) | (163 | ) | (45 | ) | (237 | ) | (409 | ) | ||||||||||||||||||||||||||||
Other Revenues |
$ | 19,541 | $ | (96,329 | ) | $ | 155,207 | $ | (73,635 | ) | $ | (225,083 | ) | $ | 64,288 | $ | (298,718 | ) | $ | 17,103 | $ | (239,840 | ) |
(h) | This adjustment removes Equity-Based Compensation on a segment basis. |
(i) | This adjustment adds an amount equal to an administrative fee collected on a quarterly basis from certain holders of Blackstone Holdings Partnership Units. The administrative fee is accounted for as a capital contribution under GAAP, but is reflected as a reduction of Other Operating Expenses in Blackstones segment presentation. |
Blackstone | 28 |
RECONCILIATION OF GAAP TO NON-GAAP MEASURES NOTES (CONTD)
(j) |
Taxes represent the total GAAP tax provision adjusted to include only the current tax provision (benefit) calculated on Income (Loss) Before Provision (Benefit) for Taxes and adjusted to exclude the tax impact of any divestitures. For interim periods, taxes are calculated using the preferred annualized effective tax rate approach. Related Payables represent tax-related payables including the amount payable to holders of the Tax Receivable Agreements based on expected tax savings generated in the current period. Please refer to page 36 for the full definition of Taxes and Related Payables. |
QTD | YTD | LTM | ||||||||||||||||||||||||||||||||||||||||||||
($ in thousands) | 2Q24 | 3Q24 | 4Q24 | 1Q25 | 2Q25 | 2Q24 | 2Q25 | 2Q24 | 2Q25 | |||||||||||||||||||||||||||||||||||||
Taxes |
$ | 141,656 | $ | 95,483 | $ | 211,496 | $ | 162,535 | $ | 167,162 | $ | 297,529 | $ | 329,697 | $ | 570,496 | $ | 636,676 | ||||||||||||||||||||||||||||
Related Payables |
22,072 | 24,795 | 37,550 | 25,195 | 27,853 | 43,344 | 53,048 | 89,502 | 115,393 | |||||||||||||||||||||||||||||||||||||
Taxes and Related Payables |
$ | 163,728 | $ | 120,278 | $ | 249,046 | $ | 187,730 | $ | 195,015 | $ | 340,873 | $ | 382,745 | $ | 659,998 | $ | 752,069 | ||||||||||||||||||||||||||||
(k) This adjustment removes Interest and Dividend Revenue less Interest Expense on a segment basis. The Segment Adjustment represents (1) the add back of Interest and Dividend Revenue earned from consolidated Blackstone Funds which have been eliminated in consolidation, and (2) the removal of interest expense associated with the Tax Receivable Agreement.
|
| |||||||||||||||||||||||||||||||||||||||||||||
QTD | YTD | LTM | ||||||||||||||||||||||||||||||||||||||||||||
($ in thousands) | 2Q24 | 3Q24 | 4Q24 | 1Q25 | 2Q25 | 2Q24 | 2Q25 | 2Q24 | 2Q25 | |||||||||||||||||||||||||||||||||||||
GAAP Interest and Dividend Revenue |
$ | 104,999 | $ | 109,774 | $ | 98,547 | $ | 97,420 | $ | 100,389 | $ | 202,838 | $ | 197,809 | $ | 480,345 | $ | 406,130 | ||||||||||||||||||||||||||||
Segment Adjustment |
- | (179 | ) | - | - | 1 | - | 1 | 9,793 | (178 | ) | |||||||||||||||||||||||||||||||||||
Interest and Dividend Revenue |
$ | 104,999 | $ | 109,595 | $ | 98,547 | $ | 97,420 | $ | 100,390 | $ | 202,838 | $ | 197,810 | $ | 490,138 | $ | 405,952 | ||||||||||||||||||||||||||||
GAAP Interest Expense |
$ | 108,616 | $ | 111,337 | $ | 115,532 | $ | 118,115 | $ | 135,822 | $ | 216,819 | $ | 253,937 | $ | 436,150 | $ | 480,806 | ||||||||||||||||||||||||||||
Segment Adjustment |
(192 | ) | (11 | ) | 1,495 | (165 | ) | (10,789 | ) | (755 | ) | (10,954 | ) | (1,904 | ) | (9,470 | ) | |||||||||||||||||||||||||||||
Interest Expense |
$ | 108,424 | $ | 111,326 | $ | 117,027 | $ | 117,950 | $ | 125,033 | $ | 216,064 | $ | 242,983 | $ | 434,246 | $ | 471,336 | ||||||||||||||||||||||||||||
Net Interest and Dividend Income (Loss) |
$ | (3,425 | ) | $ | (1,731 | ) | $ | (18,480 | ) | $ | (20,530 | ) | $ | (24,643 | ) | $ | (13,226 | ) | $ | (45,173 | ) | $ | 55,892 | $ | (65,384 | ) |
(l) This adjustment removes the total segment amount of Realized Performance Revenues. (m) This adjustment removes the total segment amount of Realized Performance Compensation. (n) This adjustment removes the total segment amount of Realized Principal Investment Income. (o) This adjustment adds back Interest Expense on a segment basis, excluding interest expense related to the Tax Receivable Agreement. (p) This adjustment adds back Depreciation and Amortization on a segment basis.
Reconciliation of GAAP Shares of Common Stock Outstanding to Distributable Earnings Shares Outstanding |
QTD | ||||||||||||||||||||||||||||||||||||||||||||||
2Q24 | 3Q24 | 4Q24 | 1Q25 | 2Q25 | ||||||||||||||||||||||||||||||||||||||||||
GAAP Shares of Common Stock Outstanding |
722,540,712 | 730,699,964 | 731,925,965 | 737,929,437 | 739,055,944 | |||||||||||||||||||||||||||||||||||||||||
Unvested Participating Common Shares |
45,683,693 | 37,195,280 | 36,796,276 | 35,109,497 | 43,511,446 | |||||||||||||||||||||||||||||||||||||||||
Total Participating Common Shares |
768,224,405 | 767,895,244 | 768,722,241 | 773,038,934 | 782,567,390 | |||||||||||||||||||||||||||||||||||||||||
Participating Partnership Units |
455,642,926 | 453,685,697 | 452,448,896 | 448,468,715 | 447,574,842 | |||||||||||||||||||||||||||||||||||||||||
Distributable Earnings Shares Outstanding |
1,223,867,331 | 1,221,580,941 | 1,221,171,137 | 1,221,507,649 | 1,230,142,232 | |||||||||||||||||||||||||||||||||||||||||
Disclosure of Weighted-Average Shares Common Stock Outstanding |
| |||||||||||||||||||||||||||||||||||||||||||||
QTD | YTD | LTM | ||||||||||||||||||||||||||||||||||||||||||||
2Q24 | 3Q24 | 4Q24 | 1Q25 | 2Q25 | 2Q24 | 2Q25 | 2Q24 | 2Q25 | ||||||||||||||||||||||||||||||||||||||
Total GAAP Weighted-Average Shares of Common Stock Outstanding - Basic |
769,187,351 | 768,230,595 | 768,689,957 | 771,796,385 | 782,386,121 | 764,492,944 | 777,120,501 | 761,256,453 | 772,754,797 | |||||||||||||||||||||||||||||||||||||
Weighted-Average Shares of Unvested Deferred Restricted Common Stock |
47,326 | 49,771 | 80,028 | 638,217 | 15,116 | 253,218 | 326,667 | 188,840 | 195,783 | |||||||||||||||||||||||||||||||||||||
Total GAAP Weighted-Average Shares of Common Stock Outstanding - Diluted |
769,234,677 | 768,280,366 | 768,769,985 | 772,434,602 | 782,401,237 | 764,746,162 | 777,447,168 | 761,445,293 | 772,950,580 |
Blackstone | 29 |
BLACKSTONES SECOND QUARTER 2025 GAAP CONDENSED CONSOLIDATED STATEMENTS OF FINANCIAL CONDITION
($ in thousands) (unaudited) | 2Q24 | 3Q24 | 4Q24 | 1Q25 | 2Q25 | |||||||||||||||
Assets |
||||||||||||||||||||
Cash and Cash Equivalents |
$ |
2,381,436 |
|
$ |
2,353,332 |
|
$ |
1,972,140 |
|
$ |
2,386,979 |
|
$ |
2,235,499 |
| |||||
Cash Held by Blackstone Funds and Other |
|
219,393 |
|
|
180,545 |
|
|
204,052 |
|
|
1,012,958 |
|
|
313,950 |
| |||||
Investments |
|
26,426,289 |
|
|
28,322,715 |
|
|
29,800,566 |
|
|
30,259,429 |
|
|
31,135,504 |
| |||||
Accounts Receivable |
|
247,538 |
|
|
300,004 |
|
|
237,930 |
|
|
221,200 |
|
|
357,858 |
| |||||
Due from Affiliates |
|
4,868,069 |
|
|
5,163,883 |
|
|
5,409,315 |
|
|
5,434,078 |
|
|
5,516,820 |
| |||||
Intangible Assets, Net |
|
183,246 |
|
|
174,265 |
|
|
165,243 |
|
|
156,269 |
|
|
147,294 |
| |||||
Goodwill |
|
1,890,202 |
|
|
1,890,202 |
|
|
1,890,202 |
|
|
1,890,202 |
|
|
1,890,202 |
| |||||
Other Assets |
|
1,083,400 |
|
|
933,990 |
|
|
947,859 |
|
|
929,107 |
|
|
877,000 |
| |||||
Right-of-Use Assets |
|
995,524 |
|
|
978,699 |
|
|
838,620 |
|
|
807,487 |
|
|
793,690 |
| |||||
Deferred Tax Assets |
|
2,289,932 |
|
|
2,277,807 |
|
|
2,003,948 |
|
|
2,157,920 |
|
|
2,105,277 |
| |||||
Total Assets |
$ |
40,585,029 |
|
$ |
42,575,442 |
|
$ |
43,469,875 |
|
$ |
45,255,629 |
|
$ |
45,373,094 |
| |||||
Liabilities and Equity |
||||||||||||||||||||
Loans Payable |
$ |
10,688,193 |
|
$ |
10,752,246 |
|
$ |
11,320,956 |
|
$ |
12,454,559 |
|
$ |
12,008,870 |
| |||||
Due to Affiliates |
|
2,364,099 |
|
|
2,620,530 |
|
|
2,808,148 |
|
|
3,361,900 |
|
|
2,802,514 |
| |||||
Accrued Compensation and Benefits |
|
5,703,156 |
|
|
6,398,365 |
|
|
6,087,700 |
|
|
6,164,503 |
|
|
6,065,974 |
| |||||
Operating Lease Liabilities |
|
1,142,317 |
|
|
1,136,671 |
|
|
965,742 |
|
|
937,369 |
|
|
918,887 |
| |||||
Accounts Payable, Accrued Expenses and Other Liabilities |
|
2,012,969 |
|
|
2,202,689 |
|
|
2,792,314 |
|
|
2,472,395 |
|
|
2,497,969 |
| |||||
Total Liabilities |
|
21,910,734 |
|
|
23,110,501 |
|
|
23,974,860 |
|
|
25,390,726 |
|
|
24,294,214 |
| |||||
Redeemable Non-Controlling Interests in Consolidated Entities |
|
888,868 |
|
|
892,846 |
|
|
801,399 |
|
|
1,382,374 |
|
|
1,487,129 |
| |||||
Equity |
||||||||||||||||||||
Common Stock, $0.00001 par value
(739,055,944 shares issued |
|
7 |
|
|
7 |
|
|
7 |
|
|
7 |
|
|
7 |
| |||||
Series I Preferred Stock, $0.00001 par value (1
share issued |
|
- |
|
|
- |
|
|
- |
|
|
- |
|
|
- |
| |||||
Series II Preferred Stock, $0.00001
par value (1 share issued |
|
- |
|
|
- |
|
|
- |
|
|
- |
|
|
- |
| |||||
Additional Paid-in-Capital |
|
6,260,619 |
|
|
6,257,788 |
|
|
7,444,561 |
|
|
7,686,980 |
|
|
7,988,663 |
| |||||
Retained Earnings |
|
607,564 |
|
|
760,471 |
|
|
808,079 |
|
|
320,160 |
|
|
362,614 |
| |||||
Accumulated Other Comprehensive Loss |
|
(34,617 |
) |
|
(10,609 |
) |
|
(40,326 |
) |
|
(29,027 |
) |
|
1,055 |
| |||||
Non-Controlling Interests in Consolidated Entities |
|
5,682,606 |
|
|
6,015,967 |
|
|
6,154,943 |
|
|
6,400,585 |
|
|
6,847,785 |
| |||||
Non-Controlling Interests in Blackstone Holdings |
|
5,269,248 |
|
|
5,548,471 |
|
|
4,326,352 |
|
|
4,103,824 |
|
|
4,391,627 |
| |||||
Total Equity |
|
17,785,427 |
|
|
18,572,095 |
|
|
18,693,616 |
|
|
18,482,529 |
|
|
19,591,751 |
| |||||
Total Liabilities and Equity |
$ |
40,585,029 |
|
$ |
42,575,442 |
|
$ |
43,469,875 |
|
$ |
45,255,629 |
|
$ |
45,373,094 |
| |||||
See page 31, Reconciliation of GAAP to Non-GAAP Balance Sheet Measures. |
Blackstone | 30 |
RECONCILIATION OF GAAP TO NON-GAAP BALANCE SHEET MEASURES
($ in thousands) | 2Q24 | 3Q24 | 4Q24 | 1Q25 | 2Q25 | |||||||||||||||
Investments of Consolidated Blackstone Funds |
$ | 3,621,676 | $ | 3,873,027 | $ | 3,890,732 | $ | 4,589,194 | $ | 5,101,278 | ||||||||||
Equity Method Investments |
||||||||||||||||||||
Partnership Investments |
6,107,429 | 6,295,704 | 6,546,728 | 6,740,598 | 6,942,526 | |||||||||||||||
Accrued Performance Allocations |
11,132,801 | 12,411,485 | 12,397,366 | 12,522,848 | 12,054,879 | |||||||||||||||
Corporate Treasury Investments |
176,330 | 147,642 | 1,147,328 | 106,684 | 229,497 | |||||||||||||||
Other Investments |
5,388,053 | 5,594,857 | 5,818,412 | 6,300,105 | 6,807,324 | |||||||||||||||
Total GAAP Investments |
26,426,289 | 28,322,715 | 29,800,566 | 30,259,429 | 31,135,504 | |||||||||||||||
|
||||||||||||||||||||
Accrued Performance Allocations - GAAP |
$ | 11,132,801 | $ | 12,411,485 | $ | 12,397,366 | $ | 12,522,848 | $ | 12,054,879 | ||||||||||
Impact of Consolidation (a) |
- | - | - | - | - | |||||||||||||||
Due from Affiliates - GAAP (b) |
235,767 | 253,490 | 489,086 | 249,376 | 229,359 | |||||||||||||||
Less: Net Realized Performance Revenues (c) |
(146,832 | ) | (141,896 | ) | (1,050,026 | ) | (927,240 | ) | (456,507 | ) | ||||||||||
Less: Accrued Performance Compensation - GAAP (d) |
(5,007,547 | ) | (5,531,520 | ) | (5,555,870 | ) | (5,446,352 | ) | (5,220,188 | ) | ||||||||||
Net Accrued Performance Revenues |
$ | 6,214,189 | $ | 6,991,559 | $ | 6,280,556 | $ | 6,398,632 | $ | 6,607,543 | ||||||||||
Corporate Treasury and Other Investments - GAAP |
$ | 5,564,383 | $ | 5,742,499 | $ | 6,965,740 | $ | 6,406,789 | $ | 7,036,821 | ||||||||||
Impact of Consolidation (a) |
590,551 | 580,076 | 622,411 | 857,457 | 965,045 | |||||||||||||||
Other Assets (e) |
218,728 | 250,996 | 159,011 | 180,761 | 337,228 | |||||||||||||||
Other Liabilities (f) |
(6,874 | ) | (6,584 | ) | (4,024 | ) | (3,653 | ) | (3,190 | ) | ||||||||||
Corporate Treasury and Other Investments - Deconsolidated (g) |
$ | 6,366,788 | $ | 6,566,987 | $ | 7,743,138 | $ | 7,441,354 | $ | 8,335,904 | ||||||||||
Partnership Investments - GAAP |
$ | 6,107,429 | $ | 6,295,704 | $ | 6,546,728 | $ | 6,740,598 | $ | 6,942,526 | ||||||||||
Impact of Consolidation (h) |
(3,401,589 | ) | (3,482,920 | ) | (3,482,497 | ) | (3,559,722 | ) | (3,653,037 | ) | ||||||||||
GP/Fund Investments - Deconsolidated |
$ | 2,705,840 | $ | 2,812,784 | $ | 3,064,231 | $ | 3,180,876 | $ | 3,289,489 | ||||||||||
Loans Payable - GAAP |
$ | 10,688,193 | $ | 10,752,246 | $ | 11,320,956 | $ | 12,454,559 | $ | 12,008,870 | ||||||||||
Impact of Consolidation (i) |
(130,321 | ) | (107,715 | ) | (87,488 | ) | (266,568 | ) | (128,335 | ) | ||||||||||
Outstanding Debt - Carrying Value |
10,557,872 | 10,644,531 | 11,233,468 | 12,187,991 | 11,880,535 | |||||||||||||||
Unamortized Discount |
124,677 | 122,418 | 127,281 | 125,209 | 123,255 | |||||||||||||||
Outstanding Debt (at par) - Deconsolidated |
$ | 10,682,549 | $ | 10,766,949 | $ | 11,360,749 | $ | 12,313,200 | $ | 12,003,790 | ||||||||||
(a) |
This adjustment adds back investments in consolidated Blackstone Funds which have been eliminated in consolidation. |
(b) |
Represents GAAP accrued performance revenue recorded within Due from Affiliates. |
(c) |
Represents Performance Revenues realized but not yet distributed as of the reporting date and are included in Distributable Earnings in the period they are realized. |
(d) |
Represents GAAP accrued performance compensation associated with Accrued Performance Allocations and is recorded within Accrued Compensation and Benefits and Due to Affiliates. |
(e) |
This adjustment adds other assets related to Treasury Operations that are recorded within Accounts Receivable, reverse repurchase agreements and Due from Affiliates. |
(f) |
This adjustment adds other liabilities related to Treasury Operations that are recorded within Accounts Payable, Accrued Expenses and Other Liabilities, Repurchase Agreements and securities sold short, not yet purchased. |
(g) |
Deconsolidated Other Investments was $6.8 billion as of June 30, 2025, which was comprised of $6.3 billion of liquid investments and $514 million of illiquid investments. The liquid portion of Other Investments relates to public equity securities and other investments held by Blackstone that can be easily converted to cash and may include securities and investments subject to lock-up periods. |
(h) |
This adjustment removes amounts associated with the ownership of Blackstone consolidated operating partnerships held by non-controlling interests and adds back investments in consolidated Blackstone Funds which have been eliminated in consolidation. |
(i) |
This adjustment removes amounts related to consolidated Blackstone Funds. |
Blackstone | 31 |
RECONCILIATION OF GAAP TO TOTAL SEGMENTS
QTD | YTD | LTM | ||||||||||||||||||||||||||||||||||||||||||
($ in thousands) | 2Q24 | 3Q24 | 4Q24 | 1Q25 | 2Q25 | 2Q24 | 2Q25 | 2Q24 | 2Q25 | |||||||||||||||||||||||||||||||||||
Management and Advisory Fees, Net |
||||||||||||||||||||||||||||||||||||||||||||
GAAP |
$ | 1,787,313 | $ | 1,794,894 | $ | 1,879,581 | $ | 1,904,317 | $ | 2,035,495 | $ | 3,514,461 | $ | 3,939,812 | $ | 6,818,036 | $ | 7,614,287 | ||||||||||||||||||||||||||
Segment Adjustment (a) |
(7,375 | ) | (8,160 | ) | (20,290 | ) | (12,319 | ) | (15,483 | ) | (26,952 | ) | (27,802 | ) | (22,856 | ) | (56,252 | ) | ||||||||||||||||||||||||||
Total Segment |
$ | 1,779,938 | $ | 1,786,734 | $ | 1,859,291 | $ | 1,891,998 | $ | 2,020,012 | $ | 3,487,509 | $ | 3,912,010 | $ | 6,795,180 | $ | 7,558,035 | ||||||||||||||||||||||||||
GAAP Realized Performance Revenues to Total Segment Fee Related Performance Revenues |
|
|||||||||||||||||||||||||||||||||||||||||||
GAAP |
||||||||||||||||||||||||||||||||||||||||||||
Incentive Fees |
188,299 | 191,794 | 404,744 | 191,825 | 195,414 | 367,640 | 387,239 | 766,858 | 983,777 | |||||||||||||||||||||||||||||||||||
Investment Income - Realized Performance Allocations |
531,641 | 414,755 | 1,858,833 | 562,050 | 829,820 | 1,184,158 | 1,391,870 | 2,259,021 | 3,665,458 | |||||||||||||||||||||||||||||||||||
GAAP |
$ | 719,940 | $ | 606,549 | $ | 2,263,577 | $ | 753,875 | $ | 1,025,234 | $ | 1,551,798 | $ | 1,779,109 | $ | 3,025,879 | $ | 4,649,235 | ||||||||||||||||||||||||||
Total Segment |
||||||||||||||||||||||||||||||||||||||||||||
Less: Realized Performance Revenues |
(542,889 | ) | (342,669 | ) | (865,080 | ) | (460,023 | ) | (553,121 | ) | (1,079,282 | ) | (1,013,144 | ) | (2,110,435 | ) | (2,220,893 | ) | ||||||||||||||||||||||||||
Segment Adjustment (b) |
16 | 221 | 779 | 63 | (63 | ) | 52 | | 669 | 1,000 | ||||||||||||||||||||||||||||||||||
Total Segment |
$ | 177,067 | $ | 264,101 | $ | 1,399,276 | $ | 293,915 | $ | 472,050 | $ | 472,568 | $ | 765,965 | $ | 916,113 | $ | 2,429,342 | ||||||||||||||||||||||||||
GAAP Compensation to Total Segment Fee Related Compensation |
|
|||||||||||||||||||||||||||||||||||||||||||
GAAP |
||||||||||||||||||||||||||||||||||||||||||||
Compensation |
766,647 | 732,041 | 754,738 | 1,029,362 | 870,358 | 1,561,450 | 1,899,720 | 2,893,595 | 3,386,499 | |||||||||||||||||||||||||||||||||||
Incentive Fees Compensation |
77,139 | 73,464 | 149,276 | 57,029 | 67,363 | 150,846 | 124,392 | 304,405 | 347,132 | |||||||||||||||||||||||||||||||||||
Realized Performance Allocations Compensation |
260,736 | 169,740 | 742,847 | 241,890 | 331,191 | 519,630 | 573,081 | 918,499 | 1,485,668 | |||||||||||||||||||||||||||||||||||
GAAP |
$ | 1,104,522 | $ | 975,245 | $ | 1,646,861 | $ | 1,328,281 | $ | 1,268,912 | $ | 2,231,926 | $ | 2,597,193 | $ | 4,116,499 | $ | 5,219,299 | ||||||||||||||||||||||||||
Total Segment |
||||||||||||||||||||||||||||||||||||||||||||
Less: Realized Performance Compensation |
(251,057 | ) | (157,570 | ) | (289,595 | ) | (220,924 | ) | (256,624 | ) | (504,081 | ) | (477,548 | ) | (925,704 | ) | (924,713 | ) | ||||||||||||||||||||||||||
Less: Equity-Based Compensation - Fee Related Compensation |
(291,540 | ) | (259,265 | ) | (278,849 | ) | (464,053 | ) | (306,495 | ) | (604,940 | ) | (770,548 | ) | (1,039,916 | ) | (1,308,662 | ) | ||||||||||||||||||||||||||
Less: Equity-Based Compensation - Performance Compensation |
(3,856 | ) | (3,533 | ) | (4,300 | ) | (7,249 | ) | (5,523 | ) | (8,235 | ) | (12,772 | ) | (14,844 | ) | (20,605 | ) | ||||||||||||||||||||||||||
Segment Adjustment (c) |
(5,156 | ) | (22 | ) | 3,360 | (19,073 | ) | 46 | (7,680 | ) | (19,027 | ) | (18,714 | ) | (15,689 | ) | ||||||||||||||||||||||||||||
Total Segment |
$ | 552,913 | $ | 554,855 | $ | 1,077,477 | $ | 616,982 | $ | 700,316 | $ | 1,106,990 | $ | 1,317,298 | $ | 2,117,321 | $ | 2,949,630 | ||||||||||||||||||||||||||
GAAP General, Administrative and Other to Total Segment Other Operating Expenses |
|
|||||||||||||||||||||||||||||||||||||||||||
GAAP |
$ | 311,928 | $ | 340,945 | $ | 339,086 | $ | 332,373 | $ | 360,817 | $ | 681,878 | $ | 693,190 | $ | 1,250,755 | $ | 1,373,221 | ||||||||||||||||||||||||||
Segment Adjustment (d) |
(18,806 | ) | (20,122 | ) | 6,083 | (25,498 | ) | (28,574 | ) | (99,778 | ) | (54,072 | ) | (93,336 | ) | (68,111 | ) | |||||||||||||||||||||||||||
Total Segment |
$ | 293,122 | $ | 320,823 | $ | 345,169 | $ | 306,875 | $ | 332,243 | $ | 582,100 | $ | 639,118 | $ | 1,157,419 | $ | 1,305,110 | ||||||||||||||||||||||||||
Realized Performance Revenues |
|
|||||||||||||||||||||||||||||||||||||||||||
GAAP |
||||||||||||||||||||||||||||||||||||||||||||
Incentive Fees |
188,299 | 191,794 | 404,744 | 191,825 | 195,414 | 367,640 | 387,239 | 766,858 | 983,777 | |||||||||||||||||||||||||||||||||||
Investment Income - Realized Performance Allocations |
531,641 | 414,755 | 1,858,833 | 562,050 | 829,820 | 1,184,158 | 1,391,870 | 2,259,021 | 3,665,458 | |||||||||||||||||||||||||||||||||||
GAAP |
$ | 719,940 | $ | 606,549 | $ | 2,263,577 | $ | 753,875 | $ | 1,025,234 | $ | 1,551,798 | $ | 1,779,109 | $ | 3,025,879 | $ | 4,649,235 | ||||||||||||||||||||||||||
Total Segment |
||||||||||||||||||||||||||||||||||||||||||||
Less: Fee Related Performance Revenues |
(177,067 | ) | (264,101 | ) | (1,399,276 | ) | (293,915 | ) | (472,050 | ) | (472,568 | ) | (765,965 | ) | (916,113 | ) | (2,429,342 | ) | ||||||||||||||||||||||||||
Segment Adjustment (b) |
16 | 221 | 779 | 63 | (63 | ) | 52 | | 669 | 1,000 | ||||||||||||||||||||||||||||||||||
Total Segment |
$ | 542,889 | $ | 342,669 | $ | 865,080 | $ | 460,023 | $ | 553,121 | $ | 1,079,282 | $ | 1,013,144 | $ | 2,110,435 | $ | 2,220,893 | ||||||||||||||||||||||||||
Blackstone | 32 |
RECONCILIATION OF GAAP TO TOTAL SEGMENTS (CONTD)
QTD | YTD | LTM | ||||||||||||||||||||||||||||||||||||||||||
($ in thousands) | 2Q24 | 3Q24 | 4Q24 | 1Q25 | 2Q25 | 2Q24 | 2Q25 | 2Q24 | 2Q25 | |||||||||||||||||||||||||||||||||||
Realized Performance Compensation |
||||||||||||||||||||||||||||||||||||||||||||
GAAP |
||||||||||||||||||||||||||||||||||||||||||||
Incentive Fee Compensation |
$ | 77,139 | $ | 73,464 | $ | 149,276 | $ | 57,029 | $ | 67,363 | $ | 150,846 | $ | 124,392 | $ | 304,405 | $ | 347,132 | ||||||||||||||||||||||||||
Realized Performance Allocations Compensation |
260,736 | 169,740 | 742,847 | 241,890 | 331,191 | 519,630 | 573,081 | 918,499 | 1,485,668 | |||||||||||||||||||||||||||||||||||
GAAP |
$ | 337,875 | $ | 243,204 | $ | 892,123 | $ | 298,919 | $ | 398,554 | $ | 670,476 | $ | 697,473 | $ | 1,222,904 | $ | 1,832,800 | ||||||||||||||||||||||||||
Total Segment |
||||||||||||||||||||||||||||||||||||||||||||
Less: Fee Related Performance Compensation (e) |
(82,962 | ) | (82,101 | ) | (598,228 | ) | (70,746 | ) | (136,407 | ) | (158,160 | ) | (207,153 | ) | (282,356 | ) | (887,482 | ) | ||||||||||||||||||||||||||
Less: Equity-Based Compensation - Performance Compensation |
(3,856 | ) | (3,533 | ) | (4,300 | ) | (7,249 | ) | (5,523 | ) | (8,235 | ) | (12,772 | ) | (14,844 | ) | (20,605 | ) | ||||||||||||||||||||||||||
Total Segment |
$ | 251,057 | $ | 157,570 | $ | 289,595 | $ | 220,924 | $ | 256,624 | $ | 504,081 | $ | 477,548 | $ | 925,704 | $ | 924,713 | ||||||||||||||||||||||||||
Realized Principal Investment Income (Loss) |
|
|||||||||||||||||||||||||||||||||||||||||||
GAAP |
$ | 74,045 | $ | 95,235 | $ | 84,381 | $ | 185,542 | $ | 97,171 | $ | 152,642 | $ | 282,713 | $ | 293,572 | $ | 462,329 | ||||||||||||||||||||||||||
Segment Adjustment (f) |
(57,473 | ) | (54,832 | ) | (58,768 | ) | (67,632 | ) | (67,750 | ) | (126,132 | ) | (135,382 | ) | (192,360 | ) | (248,982 | ) | ||||||||||||||||||||||||||
Total Segment |
$ | 16,572 | $ | 40,403 | $ | 25,613 | $ | 117,910 | $ | 29,421 | $ | 26,510 | $ | 147,331 | $ | 101,212 | $ | 213,347 | ||||||||||||||||||||||||||
GAAP Interest and Dividend Revenue net of Interest Expense to Total Segment Net Interest and Dividend Income (Loss) |
|
|||||||||||||||||||||||||||||||||||||||||||
GAAP |
||||||||||||||||||||||||||||||||||||||||||||
Interest and Dividend Revenue |
104,999 | 109,774 | 98,547 | 97,420 | 100,389 | 202,838 | 197,809 | 480,345 | 406,130 | |||||||||||||||||||||||||||||||||||
Interest Expense |
(108,616 | ) | (111,337 | ) | (115,532 | ) | (118,115 | ) | (135,822 | ) | (216,819 | ) | (253,937 | ) | (436,150 | ) | (480,806 | ) | ||||||||||||||||||||||||||
GAAP |
$ | (3,617 | ) | $ | (1,563 | ) | $ | (16,985 | ) | $ | (20,695 | ) | $ | (35,433 | ) | $ | (13,981 | ) | $ | (56,128 | ) | $ | 44,195 | $ | (74,676 | ) | ||||||||||||||||||
Segment Adjustment (g) |
192 | (168 | ) | (1,495 | ) | 165 | 10,790 | 755 | 10,955 | 11,697 | 9,292 | |||||||||||||||||||||||||||||||||
Total Segment |
$ | (3,425 | ) | $ | (1,731 | ) | $ | (18,480 | ) | $ | (20,530 | ) | $ | (24,643 | ) | $ | (13,226 | ) | $ | (45,173 | ) | $ | 55,892 | $ | (65,384 | ) | ||||||||||||||||||
This analysis reconciles the components of Total Segment Distributable Earnings (page 3) to their equivalent GAAP measures, reported on the Consolidated Statement of Operations (page 26). Segment basis presents revenues and expenses on a basis that deconsolidates the investment funds Blackstone manages and excludes the amortization of intangibles, the expense of equity-based awards and Transaction-Related and Non-Recurring Items.
(a) |
Represents (1) the add back of net management fees earned from consolidated Blackstone Funds which have been eliminated in consolidation, and (2) the removal of amounts attributable to the reimbursement of certain expenses by the Blackstone Funds and certain NAV-based fee arrangements, which are presented on a gross basis under GAAP but as a reduction of Management and Advisory Fees, Net in the Total Segment measures. |
(b) |
Represents the add back of Performance Revenues earned from consolidated Blackstone Funds which have been eliminated in consolidation. |
(c) |
Represents the removal of Transaction-Related and Non-Recurring Items that are not recorded in the Total Segment measures. |
(d) |
Represents the (1) removal of Transaction-Related and Non-Recurring Items that are not recorded in the Total Segment Measures, (2) removal of amounts attributable to certain expenses that are reimbursed by the Blackstone Funds and certain NAV-based fee arrangements, which are presented on a gross basis under GAAP but as a reduction of Management and Advisory Fees, Net in the Total Segment measures, and (3) a reduction equal to an administrative fee collected on a quarterly basis from certain holders of Blackstone Holdings Partnership Units which is accounted for as a capital contribution under GAAP, but is reflected as a reduction of Other Operating Expenses in Blackstones segment presentation. |
(e) |
Fee related performance compensation may include equity based compensation based on fee related performance revenues. |
(f) |
Represents (1) the add back of Principal Investment Income, including general partner income, earned from consolidated Blackstone Funds which have been eliminated in consolidation, and (2) the removal of amounts associated with the ownership of Blackstone consolidated operating partnerships held by non-controlling interests. |
(g) |
Represents (1) the add back of Interest and Dividend Revenue earned from consolidated Blackstone Funds which have been eliminated in consolidation, and (2) the removal of interest expense associated with the Tax Receivable Agreement. |
Blackstone | 33 |
NOTES
Notes to page 4 - Investment Performance and Net Accrued Performance Revenues
§ | The changes in carrying value, fund returns and composite returns presented throughout this presentation represent those of the applicable Blackstone Funds and not those of Blackstone. |
§ | Core+ appreciation represents a weighted average of BREITs per share appreciation, BEPIFs per share appreciation, and BPPs appreciation for the period. The returns are weighted based on the average of BREITs monthly net asset values, BEPIFs monthly net asset values, and the average of BPPs net asset value. |
§ | Throughout this presentation, Secondaries reflects Strategic Partners and GP Stakes unless otherwise indicated. Results for the Secondaries business refer to the appreciation of the Strategic Partners funds and do not include results for GP Stakes. Strategic Partners results are reported on a three-month lag from fund financial statements, which generally report underlying investments on a same-quarter basis, if available. As a result, the appreciation presented herein does not include the impact of economic and market activity in the current quarter. Current market activity is expected to affect reported results in upcoming quarters. |
§ | Throughout this presentation, Infrastructure refers to our infrastructure-focused funds, including Blackstone Infrastructure Partners funds (BIP) and Blackstone Infrastructure Strategies (BXINFRA). AUM, inflows, and related metrics for Infrastructure refer to BIP and the portion of BXINFRA assets that are managed in Infrastructure. Infrastructure appreciation represents a weighted average of BIPs appreciation and BXINFRAs per share appreciation for the period. The returns are weighted based on the average of BIPs quarterly net asset value and the average of BXINFRAs monthly net asset values. |
§ | Private Credit returns include the Flagship commingled funds across the opportunistic lending, global middle market direct lending funds (including BXSL, BCRED, and ECRED strategies), stressed/distressed strategies, and non-investment grade infrastructure and asset-based credit strategies. Separately managed accounts, funds with a limited number of limited partners that are not broadly marketed, inactive investment strategies, unlevered funds within a strategy that has designated levered and unlevered sleeves, and Multi-Asset Credit strategies are excluded. Liquid Credit returns include CLOs, closed-ended funds, open-ended funds and separately managed accounts. Only fee-earning funds exceeding $100 million of fair value at the beginning of each respective quarter-end are included. Funds in liquidation, funds investing primarily in investment grade corporate credit and asset-based finance are excluded. Blackstone Funds that were contributed to Blackstone Credit as part of Blackstones acquisition of Blackstone Credit, formerly known as GSO, in March 2008 and the pre-acquisition date performance for funds and vehicles acquired by Blackstone Credit subsequent to March 2008, are also excluded. |
§ | The Absolute Return Composite gross and net returns are based on the Multi-Asset Investing (BXMA) Absolute Return Composite, which includes only BXMA-managed commingled and customized multi-manager funds and accounts and does not include BXMAs liquid solutions group, seeding, multi-strategy, and advisory (non-discretionary) platforms, except for investments by Absolute Return funds directly into those platforms. BXMA-managed funds in liquidation and, in the case of net returns, non fee-paying assets are also excluded. The funds/accounts that comprise the Absolute Return Composite are not managed within a single fund or account and are managed with different mandates. There is no guarantee that BXMA would have made the same mix of investments in a stand-alone fund/account. The Absolute Return Composite is not an investible product and, as such, the performance of the Absolute Return Composite does not represent the performance of an actual fund or account. |
Notes to page 17 Deconsolidated Balance Sheet Highlights
§ | GP/Fund Investments include Blackstone investments in Real Estate, Private Equity, Credit & Insurance, and Multi-Asset Investing, which were $623 million, $1.5 billion, $1.1 billion, and $119 million, respectively, as of June 30, 2025. Cash and Net Investments per share amounts are calculated using period end DE Shares Outstanding (see page 24, Share Summary). |
Blackstone | 34 |
NOTES (CONTD)
Notes to page 23 Shareholder Dividends
§ | DE before Certain Payables represents Distributable Earnings before the deduction for the Payable Under Tax Receivable Agreement and tax expense (benefit) of wholly owned subsidiaries. Common shareholders receive tax benefits from deductions taken by Blackstones corporate tax paying subsidiaries and bear responsibility for the deduction from Distributable Earnings of the Payable Under Tax Receivable Agreement and certain other tax-related payables. |
§ | Per Share calculations are based on end of period Participating Common Shares (page 24, Share Summary); actual dividends are paid to shareholders as of the applicable record date. |
§ | Retained capital is withheld pro rata from common shareholders and Blackstone Holdings Partnership unitholders. Common shareholders share was $141 million for 2Q25 and $265 million for 2Q25 YTD. |
Blackstone | 35 |
DEFINITIONS AND DIVIDEND POLICY
Blackstone discloses the following operating metrics and financial measures that are calculated and presented on the basis of methodologies other than in accordance with generally accepted accounting principles in the United States of America (non-GAAP) in this presentation:
§ | Segment Distributable Earnings, or Segment DE, is Blackstones segment profitability measure used to make operating decisions and assess performance across Blackstones four segments. Segment DE represents the net realized earnings of Blackstones segments and is the sum of Fee Related Earnings and Net Realizations for each segment. Blackstones segments are presented on a basis that deconsolidates Blackstone Funds, eliminates non-controlling ownership interests in Blackstones consolidated operating partnerships, removes the amortization of intangible assets and removes Transaction-Related and Non-Recurring Items. Segment DE excludes unrealized activity and is derived from and reconciled to, but not equivalent to, its most directly comparable GAAP measure of Income (Loss) Before Provision (Benefit) for Taxes. |
| Net Realizations is presented on a segment basis and is the sum of Realized Principal Investment Income and Realized Performance Revenues (which refers to Realized Performance Revenues excluding Fee Related Performance Revenues), less Realized Performance Compensation (which refers to Realized Performance Compensation excluding Fee Related Performance Compensation and Equity-Based Performance Compensation). |
| Segment Revenues represent Net Management and Advisory Fees, Fee Related Performance Revenues, Realized Performance Revenues and Realized Principal Investment Income. |
§ | Distributable Earnings, or DE, is derived from Blackstones segment reported results. DE is used to assess performance and amounts available for dividends to Blackstone shareholders, including Blackstone personnel and others who are limited partners of the Blackstone Holdings Partnerships. DE is the sum of Segment DE plus Net Interest and Dividend Income (Loss) less Taxes and Related Payables. DE excludes unrealized activity and is derived from and reconciled to, but not equivalent to, its most directly comparable GAAP measure of Income (Loss) Before Provision (Benefit) for Taxes. |
| Net Interest and Dividend Income (Loss) is presented on a segment basis and is equal to Interest and Dividend Revenue less Interest Expense, adjusted for the impact of consolidation of Blackstone Funds, and interest expense associated with the Tax Receivable Agreement. |
| Taxes and Related Payables represent the total GAAP tax provision adjusted to include only the current tax provision (benefit) calculated on Income (Loss) Before Provision (Benefit) for Taxes and including the Payable under the Tax Receivable Agreement. Further, the current tax provision utilized when calculating Taxes and Related Payables and DE reflects the benefit of deductions available to the company on certain expense items that are excluded from the underlying calculation of Segment DE and Total Segment Distributable Earnings, such as equity-based compensation charges and certain Transaction-Related and Non-Recurring Items where there is a current tax provision or benefit. The economic assumptions and methodologies that impact the implied income tax provision are the same as those methodologies and assumptions used in calculating the current income tax provision for Blackstones consolidated statements of operations under U.S. GAAP, excluding the impact of divestitures and accrued tax contingencies and refunds which are reflected when paid or received. The Payable under the Tax Receivable Agreement reflects the expected amount of tax savings generated in the period that holders of the Tax Receivable Agreements are entitled to receive in future periods. Management believes that including the amount payable under the tax receivable agreement and utilizing the current income tax provision adjusted as described above when calculating DE is meaningful as it increases comparability between periods and more accurately reflects earnings that are available for distribution to shareholders. |
§ | Fee Related Earnings, or FRE, is a performance measure used to assess Blackstones ability to generate profits from revenues that are measured and received on a recurring basis and not subject to future realization events. FRE equals management and advisory fees (net of management fee reductions and offsets) plus Fee Related Performance Revenues, less (a) Fee Related Compensation on a segment basis, and (b) Other Operating Expenses. FRE is derived from and reconciled to, but not equivalent to, its most directly comparable GAAP measure of Income (Loss) Before Provision (Benefit) for Taxes. |
Blackstone | 36 |
DEFINITIONS AND DIVIDEND POLICY (CONTD)
| Fee Related Compensation is presented on a segment basis and refers to the compensation expense, excluding Equity-Based Compensation, directly related to (a) Management and Advisory Fees, Net and (b) Fee Related Performance Revenues, referred to as Fee Related Performance Compensation. |
| Fee Related Performance Revenues refers to the realized portion of Performance Revenues from Perpetual Capital that are (a) measured and received on a recurring basis, and (b) not dependent on realization events from the underlying investments. |
| Other Operating Expenses is presented on a segment basis and is equal to General, Administrative and Other Expenses, adjusted to (a) remove the Transaction-Related and Non-Recurring Items that are not recorded in the Total Segment Measures, (b) remove certain expenses reimbursed by the Blackstone Funds which are netted against Management and Advisory Fees, Net in Blackstones segment presentation, and (c) give effect to an administrative fee collected on a quarterly basis from certain holders of Blackstone Holdings Partnership Units. The administrative fee is accounted for as a capital contribution under GAAP, but is reflected as a reduction of Other Operating Expenses in Blackstones segment presentation. |
| Perpetual Capital refers to the component of assets under management with an indefinite term, that is not in liquidation, and for which there is no requirement to return capital to investors through redemption requests in the ordinary course of business, except where funded by new capital inflows or where required redemption requests are limited in quantum. Includes co-investment capital with an investor right to convert into Perpetual Capital. |
| FRE Margin is calculated by dividing Fee Related Earnings by Fee Related Revenues (defined as the sum of Total Segment Management and Advisory Fees, Net and Fee Related Performance Revenues). |
§ | Adjusted Earnings Before Interest, Taxes and Depreciation and Amortization, or Adjusted EBITDA, is a supplemental measure used to assess performance derived from Blackstones segment results and may be used to assess its ability to service its borrowings. Adjusted EBITDA represents Distributable Earnings plus the addition of (a) Interest Expense on a segment basis, (b) Taxes and Related Payables, and (c) Depreciation and Amortization. Adjusted EBITDA is derived from and reconciled to, but not equivalent to, its most directly comparable GAAP measure of Income (Loss) Before Provision (Benefit) for Taxes. |
§ | Performance Revenues collectively refers to: (a) Incentive Fees, and (b) Performance Allocations. |
§ | Performance Compensation collectively refers to: (a) Incentive Fee Compensation, and (b) Performance Allocations Compensation. |
| Performance Compensation reflects an increase in the aggregate Realized Performance Compensation paid to certain of our professionals above the amounts allocable to them based upon the percentage participation in the relevant performance plans previously awarded to them as a result of a compensation program that commenced in 2Q21. The expectation is that for the full year 2025, Fee Related Compensation will be decreased by the total amount of additional Performance Compensation awarded for the year. For 2Q25 QTD, 2Q25 YTD, 2Q24 QTD and 2Q24 YTD, the increase to Realized Performance Compensation was greater than the decrease to Fee Related Compensation, which negatively impacted Distributable Earnings for both the current year and prior year quarter and YTD periods. These changes typically have an impact on individual quarters but do not impact Income Before Provision (Benefit) for Taxes and Distributable Earnings for the full year. |
§ | Transaction-Related and Non-Recurring Items arise from corporate actions including acquisitions, divestitures, Blackstones initial public offering, and non-recurring gains, losses, or other charges, if any. They consist primarily of equity-based compensation charges, gains and losses on contingent consideration arrangements, changes in the balance of the Tax Receivable Agreement resulting from a change in tax law or similar event, transaction costs, gains or losses associated with these corporate actions, and non-recurring gains, losses or other charges that affect period-to-period comparability and are not reflective of Blackstones operational performance. |
Blackstone | 37 |
DEFINITIONS AND DIVIDEND POLICY (CONTD)
Dividend Policy. Blackstones intention is to pay to holders of common stock a quarterly dividend representing approximately 85% of Blackstone Inc.s share of Distributable Earnings, subject to adjustment by amounts determined by Blackstones board of directors to be necessary or appropriate to provide for the conduct of its business, to make appropriate investments in its business and funds, to comply with applicable law, any of its debt instruments or other agreements, or to provide for future cash requirements such as tax-related payments, clawback obligations and dividends to shareholders for any ensuing quarter. The dividend amount could also be adjusted upward in any one quarter. All of the foregoing is subject to the qualification that the declaration and payment of any dividends are at the sole discretion of Blackstones board of directors and our board of directors may change our dividend policy at any time, including, without limitation, to reduce such quarterly dividends or even to eliminate such dividends entirely.
Blackstone | 38 |
FORWARD-LOOKING STATEMENTS
This presentation may contain forward-looking statements within the meaning of Section 27A of the Securities Act of 1933, as amended, and Section 21E of the Securities Exchange Act of 1934, as amended, which reflect our current views with respect to, among other things, our operations, taxes, earnings and financial performance, share repurchases and dividends. You can identify these forward-looking statements by the use of words such as outlook, indicator, believes, expects, potential, continues, may, will, should, seeks, approximately, predicts, intends, plans, scheduled, estimates, anticipates, opportunity, leads, forecast, possible or the negative version of these words or other comparable words. Such forward-looking statements are subject to various risks and uncertainties. Accordingly, there are or will be important factors that could cause actual outcomes or results to differ materially from those indicated in these statements. We believe these factors include but are not limited to those described under the section entitled Risk Factors in our Annual Report on Form 10-K for the year ended December 31, 2024, as such factors may be updated from time to time in our periodic filings with the United States Securities and Exchange Commission (SEC), which are accessible on the SECs website at www.sec.gov. These factors should not be construed as exhaustive and should be read in conjunction with the other cautionary statements that are included in this report and in our other periodic filings. The forward-looking statements speak only as of the date of this report, and we undertake no obligation to publicly update or review any forward-looking statement, whether as a result of new information, future developments or otherwise.
This presentation does not constitute an offer of any Blackstone Fund.
Blackstone | 39 |