(FMCB) 10 ©2025 Farmers & Merchants Bank of Central California. All Rights
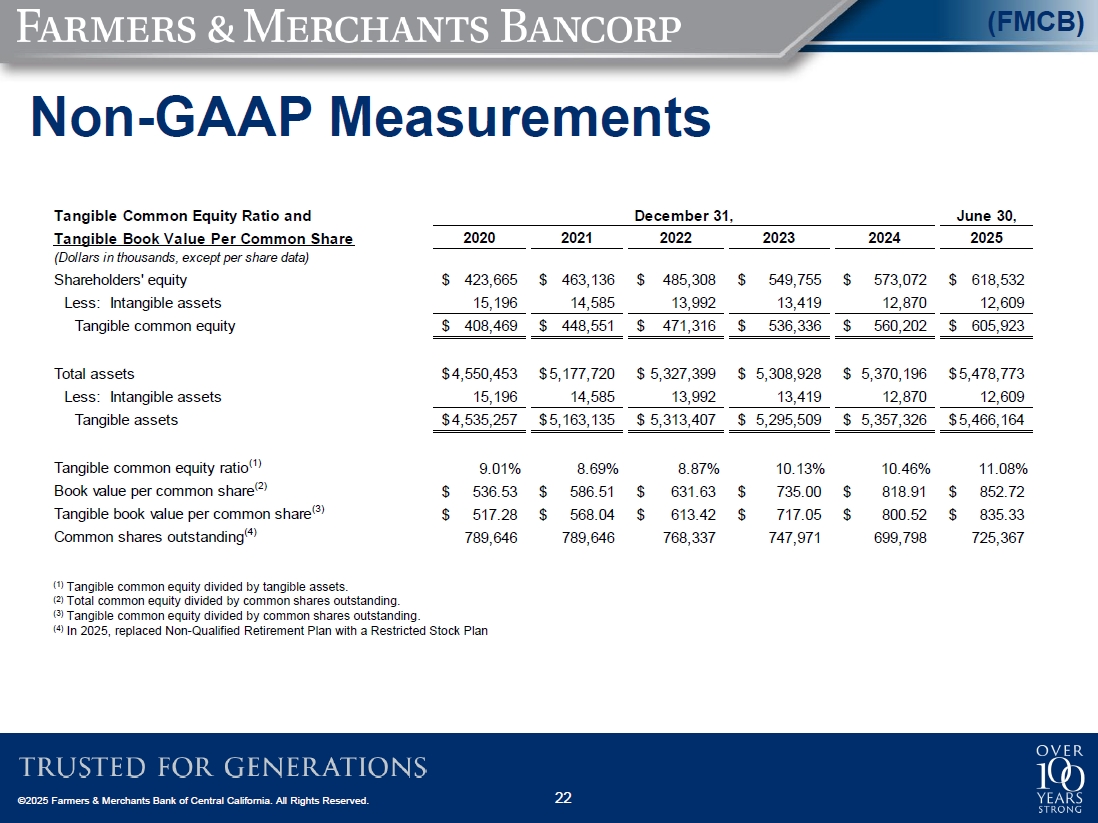
Reserved. Non-GAAP Measurements (1) Tangible common equity divided by tangible assets. (2) Total common equity divided by common shares outstanding. (3) Tangible common equity divided by common shares outstanding. (4) In 2025, replaced
Non-Qualified Retirement Plan with a Restricted Stock Plan Tangible Common Equity Ratio and December 31, June 30, Tangible Book Value Per Common Share 2020 2021 2022 2023 2024 2025 (Dollars in thousands, except per share
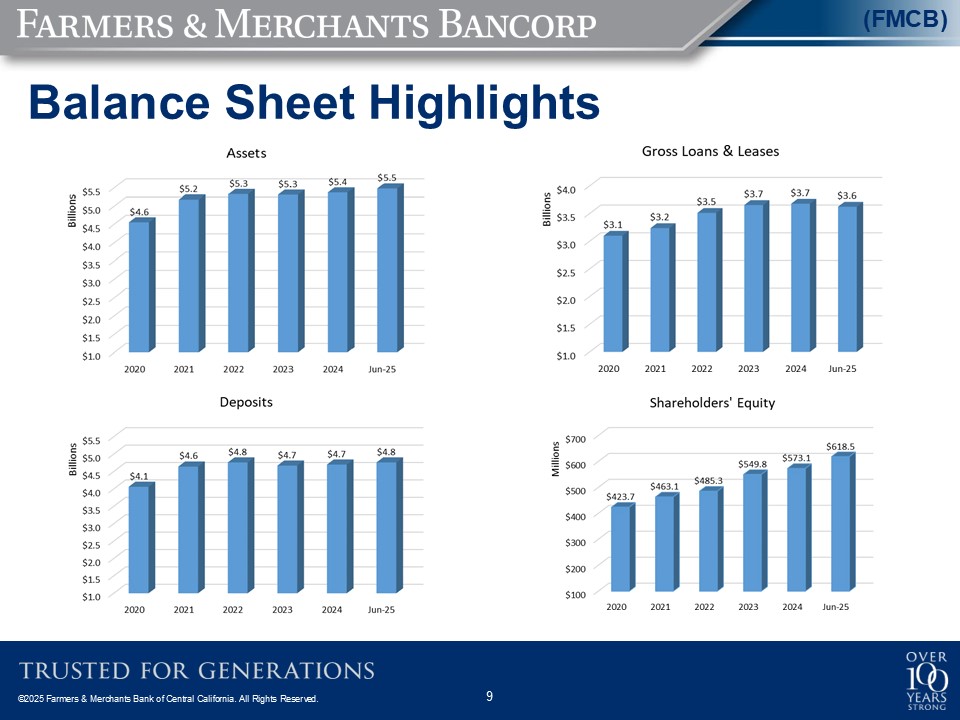
data) Shareholders' equity $ 423,665 $ 463,136 $ 485,308 $ 549,755 $ 573,072 $ 618,532 Less: Intangible assets 15,196 14,585 13,992 13,419 12,870 12,609 Tangible common equity $ 408,469 $ 448,551 $ 471,316 $ 536,336 $
560,202 $ 605,923 Total assets $ 4,550,453 $ 5,177,720 $ 5,327,399 $ 5,308,928 $ 5,370,196 $ 5,478,773 Less: Intangible assets 15,196 14,585 13,992 13,419 12,870 12,609 Tangible assets $ 4,535,257 $ 5,163,135 $ 5,313,407 $
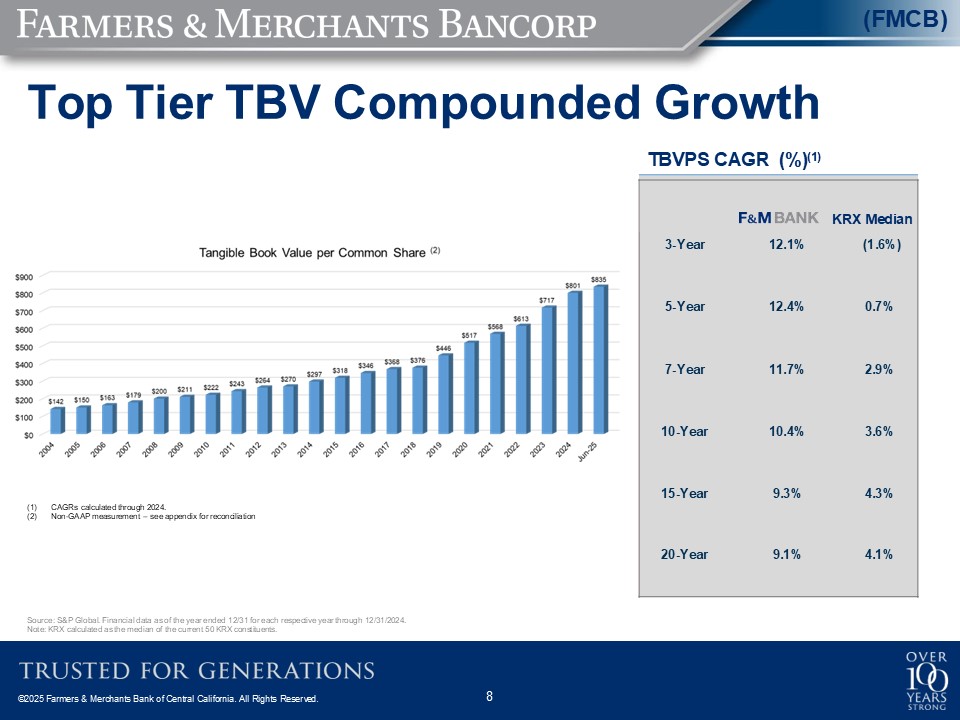
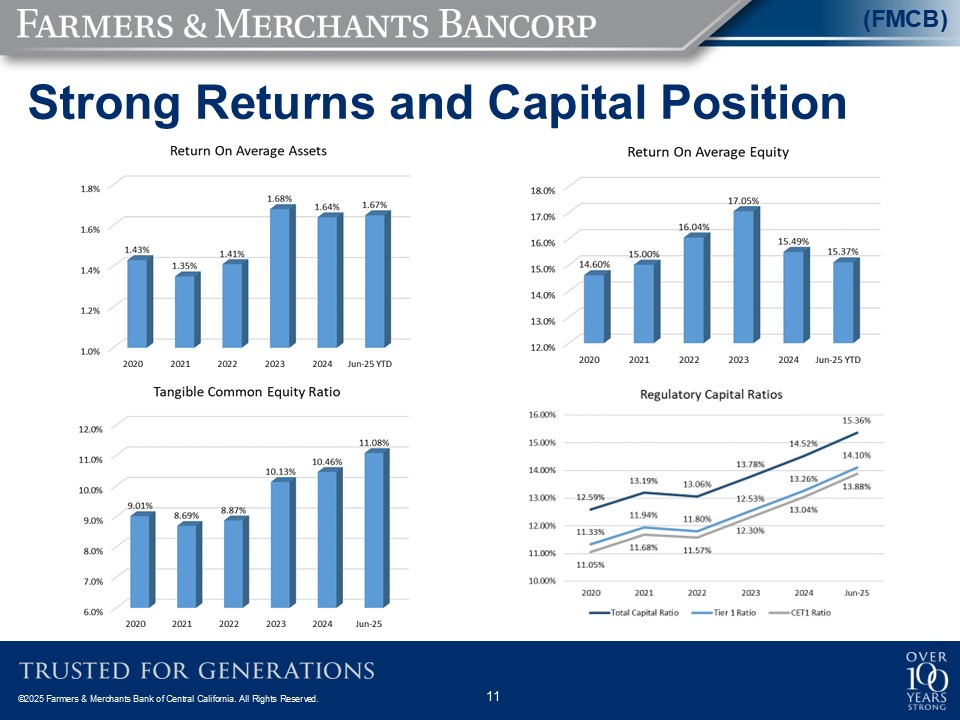
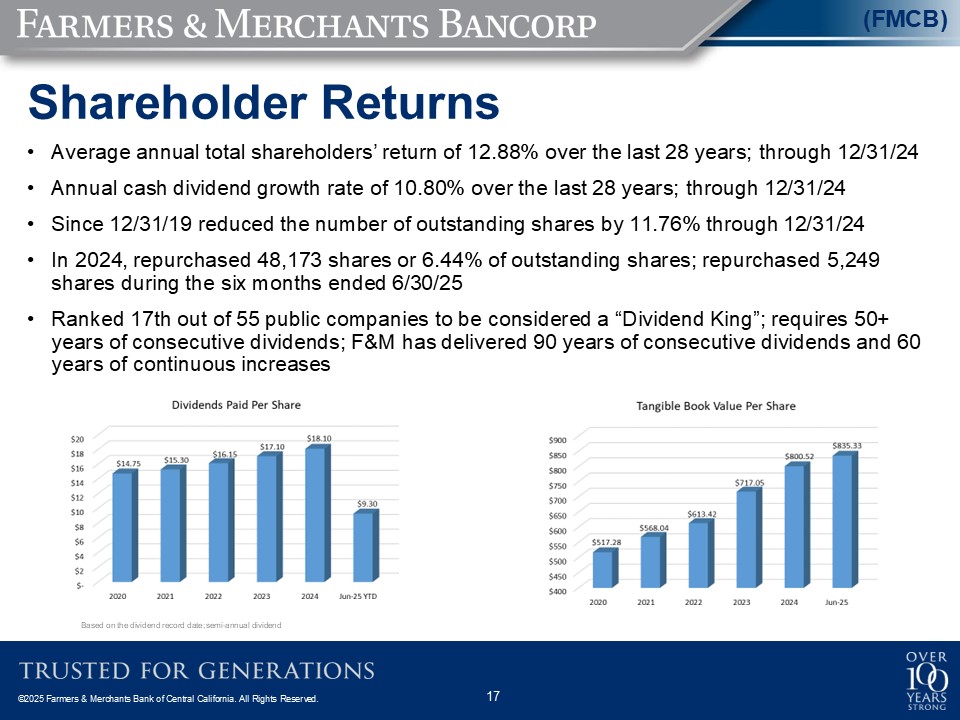
5,295,509 $ 5,357,326 $ 5,466,164 Tangible common equity ratio(1) 9.01% 8.69% 8.87% 10.13% 10.46% 11.08% Book value per common share(2) $ 536.53 $ 586.51 $ 631.63 $ 735.00 $ 818.91 $ 852.72 Tangible book value per common
share(3) $ 517.28 $ 568.04 $ 613.42 $ 717.05 $ 800.52 $ 835.33 Common shares outstanding(4) 789,646 789,646 768,337 747,971 699,798 725,367