Shareholder Report
May 31, 2025
USD ($)
Holding
Shareholder Report |
6 Months Ended |
|---|---|
|
May 31, 2025
USD ($)
Holding
| |
| Shareholder Report [Line Items] | |
| Document Type | N-CSRS |
| Amendment Flag | false |
| Registrant Name | Federated Hermes Investment Series Funds, Inc. |
| Entity Central Index Key | 0000889388 |
| Entity Investment Company Type | N-1A |
| Document Period End Date | May 31, 2025 |
| C000024768 | |
| Shareholder Report [Line Items] | |
| Fund Name | Federated Hermes Corporate Bond Fund |
| Class Name | Class A Shares |
| Trading Symbol | FDBAX |
| Annual or Semi-Annual Statement [Text Block] | This semi-annual shareholder report contains important information about the Federated Hermes Corporate Bond Fund (the "Fund") for the period of December 1, 2024 to May 31, 2025. |
| Shareholder Report Annual or Semi-Annual | Semi-Annual Shareholder Report |
| Additional Information [Text Block] | You can find additional information at FederatedHermes.com/us/FundInformation. You can also request this information by contacting us at 1-800-341-7400, Option 4, or your financial advisor. |
| Additional Information Phone Number | 1-800-341-7400 |
| Additional Information Website | FederatedHermes.com/us/FundInformation |
| Expenses [Text Block] | |
| Expenses Paid, Amount | $ 43 |
| Expense Ratio, Percent | 0.85% |
| AssetsNet | $ 1,086,918,120 |
| Holdings Count | Holding | 398 |
| InvestmentCompanyPortfolioTurnover | 6.00% |
| Additional Fund Statistics [Text Block] | |
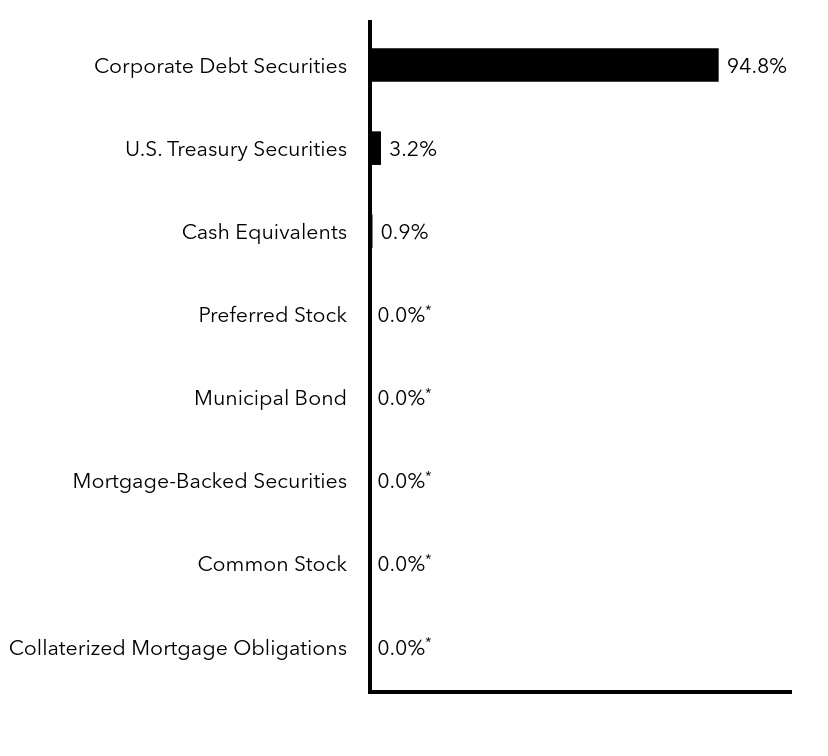
| Holdings [Text Block] | |
| Material Fund Change [Text Block] | |
| C000024770 | |
| Shareholder Report [Line Items] | |
| Fund Name | Federated Hermes Corporate Bond Fund |
| Class Name | Class C Shares |
| Trading Symbol | FDBCX |
| Annual or Semi-Annual Statement [Text Block] | This semi-annual shareholder report contains important information about the Federated Hermes Corporate Bond Fund (the "Fund") for the period of December 1, 2024 to May 31, 2025. |
| Shareholder Report Annual or Semi-Annual | Semi-Annual Shareholder Report |
| Additional Information [Text Block] | You can find additional information at FederatedHermes.com/us/FundInformation. You can also request this information by contacting us at 1-800-341-7400, Option 4, or your financial advisor. |
| Additional Information Phone Number | 1-800-341-7400 |
| Additional Information Website | FederatedHermes.com/us/FundInformation |
| Expenses [Text Block] | |
| Expenses Paid, Amount | $ 83 |
| Expense Ratio, Percent | 1.67% |
| AssetsNet | $ 1,086,918,120 |
| Holdings Count | Holding | 398 |
| InvestmentCompanyPortfolioTurnover | 6.00% |
| Additional Fund Statistics [Text Block] | |
| Holdings [Text Block] | |
| Material Fund Change [Text Block] | |
| C000024771 | |
| Shareholder Report [Line Items] | |
| Fund Name | Federated Hermes Corporate Bond Fund |
| Class Name | Class F Shares |
| Trading Symbol | ISHIX |
| Annual or Semi-Annual Statement [Text Block] | This semi-annual shareholder report contains important information about the Federated Hermes Corporate Bond Fund (the "Fund") for the period of December 1, 2024 to May 31, 2025. |
| Shareholder Report Annual or Semi-Annual | Semi-Annual Shareholder Report |
| Additional Information [Text Block] | You can find additional information at FederatedHermes.com/us/FundInformation. You can also request this information by contacting us at 1-800-341-7400, Option 4, or your financial advisor. |
| Additional Information Phone Number | 1-800-341-7400 |
| Additional Information Website | FederatedHermes.com/us/FundInformation |
| Expenses [Text Block] | |
| Expenses Paid, Amount | $ 43 |
| Expense Ratio, Percent | 0.85% |
| AssetsNet | $ 1,086,918,120 |
| Holdings Count | Holding | 398 |
| InvestmentCompanyPortfolioTurnover | 6.00% |
| Additional Fund Statistics [Text Block] | |
| Holdings [Text Block] | |
| Material Fund Change [Text Block] | |
| C000062220 | |
| Shareholder Report [Line Items] | |
| Fund Name | Federated Hermes Corporate Bond Fund |
| Class Name | Institutional Shares |
| Trading Symbol | FDBIX |
| Annual or Semi-Annual Statement [Text Block] | This semi-annual shareholder report contains important information about the Federated Hermes Corporate Bond Fund (the "Fund") for the period of December 1, 2024 to May 31, 2025. |
| Shareholder Report Annual or Semi-Annual | Semi-Annual Shareholder Report |
| Additional Information [Text Block] | You can find additional information at FederatedHermes.com/us/FundInformation. You can also request this information by contacting us at 1-800-341-7400, Option 4, or your financial advisor. |
| Additional Information Phone Number | 1-800-341-7400 |
| Additional Information Website | FederatedHermes.com/us/FundInformation |
| Expenses [Text Block] | |
| Expenses Paid, Amount | $ 30 |
| Expense Ratio, Percent | 0.60% |
| AssetsNet | $ 1,086,918,120 |
| Holdings Count | Holding | 398 |
| InvestmentCompanyPortfolioTurnover | 6.00% |
| Additional Fund Statistics [Text Block] | |
| Holdings [Text Block] | |
| Material Fund Change [Text Block] | |
| C000173769 | |
| Shareholder Report [Line Items] | |
| Fund Name | Federated Hermes Corporate Bond Fund |
| Class Name | Class R6 Shares |
| Trading Symbol | FDBLX |
| Annual or Semi-Annual Statement [Text Block] | This semi-annual shareholder report contains important information about the Federated Hermes Corporate Bond Fund (the "Fund") for the period of December 1, 2024 to May 31, 2025. |
| Shareholder Report Annual or Semi-Annual | Semi-Annual Shareholder Report |
| Additional Information [Text Block] | You can find additional information at FederatedHermes.com/us/FundInformation. You can also request this information by contacting us at 1-800-341-7400, Option 4, or your financial advisor. |
| Additional Information Phone Number | 1-800-341-7400 |
| Additional Information Website | FederatedHermes.com/us/FundInformation |
| Expenses [Text Block] | |
| Expenses Paid, Amount | $ 29 |
| Expense Ratio, Percent | 0.58% |
| AssetsNet | $ 1,086,918,120 |
| Holdings Count | Holding | 398 |
| InvestmentCompanyPortfolioTurnover | 6.00% |
| Additional Fund Statistics [Text Block] | |
| Holdings [Text Block] | |
| Material Fund Change [Text Block] |