Shareholder Report
|
12 Months Ended |
|
May 31, 2025
USD ($)
Holding
|
|---|
| Shareholder Report [Line Items] |
|
| Document Type |
N-CSR
|
| Amendment Flag |
false
|
| Registrant Name |
T. ROWE PRICE SPECTRUM FUNDS II, INC.
|
| Entity Central Index Key |
0000923084
|
| Entity Investment Company Type |
N-1A
|
| Document Period End Date |
May 31, 2025
|
| C000005534 |
|
| Shareholder Report [Line Items] |
|
| Fund Name |
Spectrum Conservative Allocation Fund
|
| Class Name |
Investor Class
|
| Trading Symbol |
PRSIX
|
| Annual or Semi-Annual Statement [Text Block] |
This annual shareholder report contains important information about Spectrum Conservative Allocation Fund (the "fund") for the period of June 1, 2024 to May 31, 2025. You can find the fund’s prospectus, financial information on Form N‑CSR (which includes required tax information for dividends), holdings, proxy voting information, and other information atwww.troweprice.com/prospectus. You can also request this information without charge by contacting T. Rowe Price at 1‑800‑638‑5660 or info@troweprice.com or contacting your intermediary.
|
| Shareholder Report Annual or Semi-Annual |
Annual Shareholder Report
|
| Additional Information [Text Block] |
You can find the fund’s prospectus, financial information on Form N‑CSR (which includes required tax information for dividends), holdings, proxy voting information, and other information atwww.troweprice.com/prospectus. You can also request this information without charge by contacting T. Rowe Price at 1‑800‑638‑5660 or info@troweprice.com or contacting your intermediary.
|
| Material Fund Change Notice [Text Block] |
|
| Additional Information Phone Number |
1‑800‑638‑5660
|
| Additional Information Email |
<span style="box-sizing: border-box; color: rgb(0, 0, 0); display: inline; flex-wrap: nowrap; font-size: 13.3333px; font-weight: 400; grid-area: auto; line-height: 17.3333px; margin: 0px; overflow: visible; text-align: justify; text-align-last: left; white-space-collapse: preserve-breaks;">info@troweprice.com</span>
|
| Additional Information Website |
www.troweprice.com/prospectus
|
| Expenses [Text Block] |
What were the fund costs for the last year? (based on a hypothetical $10,000 investment)
|
Costs of a $10,000 investment |
Costs paid as a percentage of a $10,000 investment |
Spectrum Conservative Allocation Fund - Investor Class |
$39 |
0.38% | |
| Expenses Paid, Amount |
$ 39
|
| Expense Ratio, Percent |
0.38%
|
| Factors Affecting Performance [Text Block] |
What drove fund performance during the past 12 months?Global stock indexes and fixed income markets were broadly positive for the 12 months ended May 31, 2025. Many major central banks began easing interest rates early in the period as inflation slowed. Early optimism over the U.S. election of President Donald Trump brought, first, a boost to U.S. equities, followed by heightened volatility in global equity markets amid concerns over Trump’s fluctuating tariff policies. Versus the style-specific Morningstar Moderately Conservative Target Risk Index, the fund had some contributing factors that had a positive impact on relative returns. Security selection in the underlying alternatives strategy contributed for the trailing one-year period, as did selection in the underlying U.S. small-cap core equity strategy. The fund’s allocations to these strategies outpaced their respective style-specific benchmarks, which added value on a relative basis. On the negative side, security selection dragged on relative returns overall. Selection among U.S. large-cap core equities was a leading detractor during the period as this allocation trailed its style benchmark. Additionally, diversifying exposure to real assets equities detracted. The fund seeks the highest total return over time consistent with a primary emphasis on income and a secondary emphasis on capital growth. It is designed to provide investors with a core multi-asset portfolio that is globally diversified across traditional and alternative asset classes, with an emphasis on the roles of broad diversification, fundamental research, tactical allocation, and risk management.
|
| Performance Past Does Not Indicate Future [Text] |
The fund’s past performance is not a good predictor of the fund’s future performance.
|
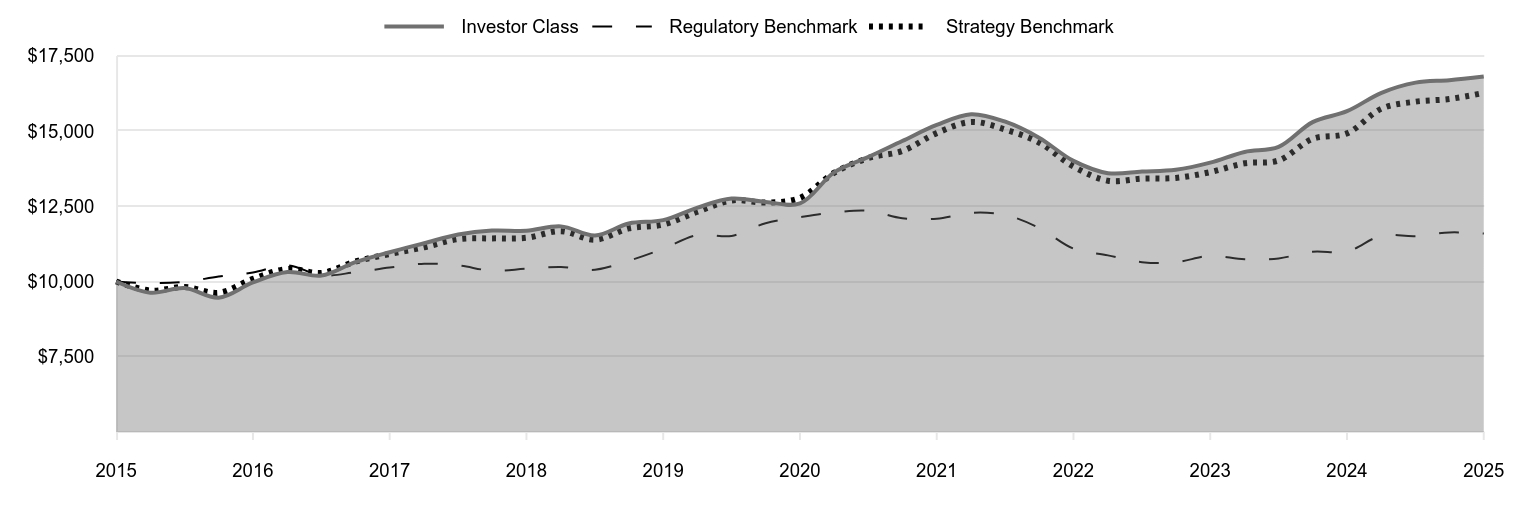
| Line Graph [Table Text Block] |
|
Investor Class |
Regulatory Benchmark |
Strategy Benchmark |
2015 |
10,000 |
10,000 |
10,000 |
2015 |
9,628 |
9,945 |
9,696 |
2015 |
9,781 |
9,988 |
9,818 |
2016 |
9,461 |
10,164 |
9,624 |
2016 |
9,970 |
10,299 |
10,085 |
2016 |
10,315 |
10,539 |
10,417 |
2016 |
10,196 |
10,205 |
10,284 |
2017 |
10,641 |
10,308 |
10,661 |
2017 |
10,973 |
10,462 |
10,913 |
2017 |
11,272 |
10,591 |
11,137 |
2017 |
11,561 |
10,533 |
11,409 |
2018 |
11,692 |
10,360 |
11,432 |
2018 |
11,686 |
10,423 |
11,452 |
2018 |
11,831 |
10,480 |
11,673 |
2018 |
11,529 |
10,391 |
11,388 |
2019 |
11,927 |
10,689 |
11,763 |
2019 |
12,039 |
11,090 |
11,893 |
2019 |
12,455 |
11,546 |
12,317 |
2019 |
12,754 |
11,513 |
12,693 |
2020 |
12,642 |
11,937 |
12,622 |
2020 |
12,594 |
12,134 |
12,777 |
2020 |
13,632 |
12,293 |
13,617 |
2020 |
14,138 |
12,351 |
14,101 |
2021 |
14,666 |
12,102 |
14,336 |
2021 |
15,200 |
12,085 |
14,929 |
2021 |
15,559 |
12,283 |
15,299 |
2021 |
15,308 |
12,209 |
15,046 |
2022 |
14,779 |
11,782 |
14,618 |
2022 |
14,006 |
11,091 |
13,819 |
2022 |
13,599 |
10,868 |
13,349 |
2022 |
13,652 |
10,641 |
13,418 |
2023 |
13,711 |
10,637 |
13,441 |
2023 |
13,947 |
10,854 |
13,634 |
2023 |
14,304 |
10,738 |
13,926 |
2023 |
14,471 |
10,767 |
14,021 |
2024 |
15,294 |
10,991 |
14,739 |
2024 |
15,657 |
10,995 |
14,921 |
2024 |
16,268 |
11,522 |
15,741 |
2024 |
16,607 |
11,507 |
15,975 |
2025 |
16,689 |
11,629 |
16,062 |
2025 |
16,808 |
11,596 |
16,265 |
|
| Average Annual Return [Table Text Block] |
|
1 Year |
5 Years |
10 Years |
Spectrum Conservative Allocation Fund (Investor Class) |
7.35% |
5.94% |
5.33% |
Bloomberg U.S. Aggregate Bond Index (Regulatory Benchmark) |
5.46 |
-0.90 |
1.49 |
Morningstar Moderately Conservative Target Risk Index (Strategy Benchmark) |
9.01 |
4.95 |
4.98 | |
| No Deduction of Taxes [Text Block] |
Neither the fund’s returns nor the index returns reflect the deduction of taxes that a shareholder would pay on fund distributions or redemptions of fund shares.
|
| Updated Performance Information Location [Text Block] |
Updated performance information can be found at www.troweprice.com.
|
| Distribution of Capital [Text Block] |
The fund's total return figures reflect the reinvestment of dividends and capital gains, if any.
|
| AssetsNet |
$ 1,923,989,000
|
| Holdings Count | Holding |
1,799
|
| Advisory Fees Paid, Amount |
$ 4,000,000
|
| InvestmentCompanyPortfolioTurnover |
45.30%
|
| Additional Fund Statistics Significance or Limits [Text Block] |
What are some fund statistics? - Total Net Assets (000s)$1,923,989
- Number of Portfolio Holdings1,799
|
| Holdings [Text Block] |
Common Stocks |
33.8% |
Bond Funds |
24.5 |
Equity Funds |
11.7 |
U.S. Government Agency Obligations (Excluding Mortgage-Backed) |
7.6 |
Private Investment Companies |
6.5 |
Corporate Bonds |
4.8 |
U.S. Government & Agency Mortgage-Backed Securities |
3.9 |
Asset-Backed Securities |
1.4 |
Short-Term and Other |
5.8 | |
| Largest Holdings [Text Block] |
Blackstone Partners Offshore Fund |
6.5% |
T. Rowe Price Multi-Strategy Total Return Fund - I Class |
6.0 |
T. Rowe Price International Bond Fund (USD Hedged) - I Class |
6.0 |
T. Rowe Price Dynamic Global Bond Fund - I Class |
5.7 |
U.S. Treasury Notes |
4.7 |
T. Rowe Price Emerging Markets Bond Fund - I Class |
4.7 |
T. Rowe Price Institutional High Yield Fund - Institutional Class |
4.2 |
T. Rowe Price Institutional Emerging Markets Equity Fund |
3.0 |
U.S. Treasury Bonds |
2.9 |
T. Rowe Price Real Assets Fund - I Class |
2.7 | |
| Material Fund Change [Text Block] |
|
| Updated Prospectus Web Address |
www.troweprice.com/paperless
|
| C000169940 |
|
| Shareholder Report [Line Items] |
|
| Fund Name |
Spectrum Conservative Allocation Fund
|
| Class Name |
I Class
|
| Trading Symbol |
PPIPX
|
| Annual or Semi-Annual Statement [Text Block] |
This annual shareholder report contains important information about Spectrum Conservative Allocation Fund (the "fund") for the period of June 1, 2024 to May 31, 2025. You can find the fund’s prospectus, financial information on Form N‑CSR (which includes required tax information for dividends), holdings, proxy voting information, and other information atwww.troweprice.com/prospectus. You can also request this information without charge by contacting T. Rowe Price at 1‑800‑638‑5660 or info@troweprice.com or contacting your intermediary.
|
| Shareholder Report Annual or Semi-Annual |
Annual Shareholder Report
|
| Additional Information [Text Block] |
You can find the fund’s prospectus, financial information on Form N‑CSR (which includes required tax information for dividends), holdings, proxy voting information, and other information atwww.troweprice.com/prospectus. You can also request this information without charge by contacting T. Rowe Price at 1‑800‑638‑5660 or info@troweprice.com or contacting your intermediary.
|
| Material Fund Change Notice [Text Block] |
|
| Additional Information Phone Number |
1‑800‑638‑5660
|
| Additional Information Email |
<span style="box-sizing: border-box; color: rgb(0, 0, 0); display: inline; flex-wrap: nowrap; font-size: 13.3333px; font-weight: 400; grid-area: auto; line-height: 17.3333px; margin: 0px; overflow: visible; text-align: justify; text-align-last: left; white-space-collapse: preserve-breaks;">info@troweprice.com</span>
|
| Additional Information Website |
www.troweprice.com/prospectus
|
| Expenses [Text Block] |
What were the fund costs for the last year? (based on a hypothetical $10,000 investment)
|
Costs of a $10,000 investment |
Costs paid as a percentage of a $10,000 investment |
Spectrum Conservative Allocation Fund - I Class |
$27 |
0.26% | |
| Expenses Paid, Amount |
$ 27
|
| Expense Ratio, Percent |
0.26%
|
| Factors Affecting Performance [Text Block] |
What drove fund performance during the past 12 months?Global stock indexes and fixed income markets were broadly positive for the 12 months ended May 31, 2025. Many major central banks began easing interest rates early in the period as inflation slowed. Early optimism over the U.S. election of President Donald Trump brought, first, a boost to U.S. equities, followed by heightened volatility in global equity markets amid concerns over Trump’s fluctuating tariff policies. Versus the style-specific Morningstar Moderately Conservative Target Risk Index, the fund had some contributing factors that had a positive impact on relative returns. Security selection in the underlying alternatives strategy contributed for the trailing one-year period, as did selection in the underlying U.S. small-cap core equity strategy. The fund’s allocations to these strategies outpaced their respective style-specific benchmarks, which added value on a relative basis. On the negative side, security selection dragged on relative returns overall. Selection among U.S. large-cap core equities was a leading detractor during the period as this allocation trailed its style benchmark. Additionally, diversifying exposure to real assets equities detracted. The fund seeks the highest total return over time consistent with a primary emphasis on income and a secondary emphasis on capital growth. It is designed to provide investors with a core multi-asset portfolio that is globally diversified across traditional and alternative asset classes, with an emphasis on the roles of broad diversification, fundamental research, tactical allocation, and risk management.
|
| Performance Past Does Not Indicate Future [Text] |
The fund’s past performance is not a good predictor of the fund’s future performance.
|
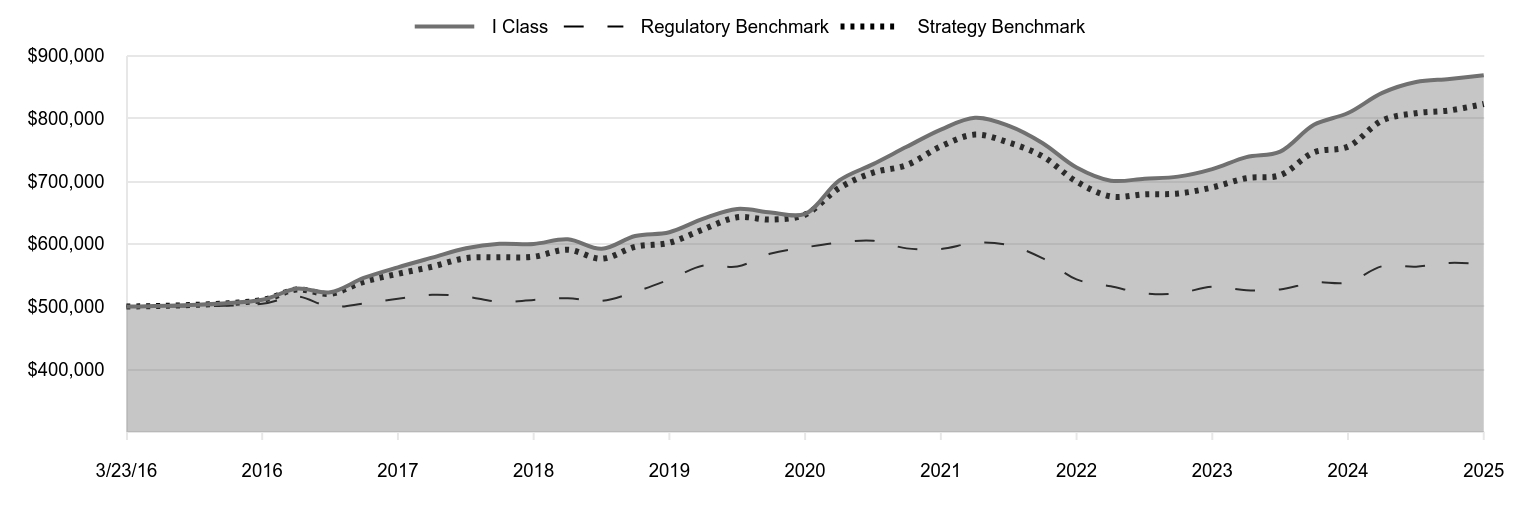
| Line Graph [Table Text Block] |
|
I Class |
Regulatory Benchmark |
Strategy Benchmark |
3/23/16 |
500,000 |
500,000 |
500,000 |
5/31/16 |
510,917 |
504,500 |
510,386 |
8/31/16 |
528,605 |
516,220 |
527,162 |
11/30/16 |
522,770 |
499,861 |
520,428 |
2/28/17 |
545,583 |
504,920 |
539,547 |
5/31/17 |
562,631 |
512,464 |
552,260 |
8/31/17 |
577,985 |
518,763 |
563,632 |
11/30/17 |
593,132 |
515,928 |
577,382 |
2/28/18 |
600,125 |
507,470 |
578,556 |
5/31/18 |
599,838 |
510,544 |
579,534 |
8/31/18 |
607,253 |
513,319 |
590,757 |
11/30/18 |
592,070 |
509,004 |
576,311 |
2/28/19 |
612,510 |
523,556 |
595,312 |
5/31/19 |
618,620 |
543,220 |
601,851 |
8/31/19 |
640,312 |
565,536 |
623,328 |
11/30/19 |
655,667 |
563,931 |
642,364 |
2/29/20 |
649,924 |
584,721 |
638,778 |
5/31/20 |
647,760 |
594,368 |
646,626 |
8/31/20 |
701,195 |
602,146 |
689,127 |
11/30/20 |
727,214 |
605,007 |
713,637 |
2/28/21 |
754,773 |
592,811 |
725,509 |
5/31/21 |
782,255 |
591,961 |
755,502 |
8/31/21 |
801,099 |
601,638 |
774,222 |
11/30/21 |
788,170 |
598,029 |
761,451 |
2/28/22 |
760,897 |
577,136 |
739,786 |
5/31/22 |
721,783 |
543,290 |
699,347 |
8/31/22 |
700,774 |
532,354 |
675,557 |
11/30/22 |
703,958 |
521,244 |
679,034 |
2/28/23 |
707,211 |
521,028 |
680,220 |
5/31/23 |
719,228 |
531,648 |
689,989 |
8/31/23 |
738,302 |
526,001 |
704,760 |
11/30/23 |
747,164 |
527,394 |
709,545 |
2/29/24 |
789,918 |
538,363 |
745,884 |
5/31/24 |
808,610 |
538,589 |
755,115 |
8/31/24 |
840,726 |
564,382 |
796,616 |
11/30/24 |
858,072 |
563,653 |
808,433 |
2/28/25 |
862,990 |
569,633 |
812,838 |
5/31/25 |
869,042 |
567,990 |
823,117 |
|
| Average Annual Return [Table Text Block] |
|
1 Year |
5 Years |
Since Inception 3/23/16 |
Spectrum Conservative Allocation Fund (I Class) |
7.47% |
6.05% |
6.20% |
Bloomberg U.S. Aggregate Bond Index (Regulatory Benchmark) |
5.46 |
-0.90 |
1.40 |
Morningstar Moderately Conservative Target Risk Index (Strategy Benchmark) |
9.01 |
4.95 |
5.58 | |
| Performance Inception Date |
Mar. 23, 2016
|
| No Deduction of Taxes [Text Block] |
Neither the fund’s returns nor the index returns reflect the deduction of taxes that a shareholder would pay on fund distributions or redemptions of fund shares.
|
| Updated Performance Information Location [Text Block] |
Updated performance information can be found at www.troweprice.com.
|
| Distribution of Capital [Text Block] |
The fund's total return figures reflect the reinvestment of dividends and capital gains, if any.
|
| AssetsNet |
$ 1,923,989,000
|
| Holdings Count | Holding |
1,799
|
| Advisory Fees Paid, Amount |
$ 4,000,000
|
| InvestmentCompanyPortfolioTurnover |
45.30%
|
| Additional Fund Statistics Significance or Limits [Text Block] |
What are some fund statistics? - Total Net Assets (000s)$1,923,989
- Number of Portfolio Holdings1,799
|
| Holdings [Text Block] |
Common Stocks |
33.8% |
Bond Funds |
24.5 |
Equity Funds |
11.7 |
U.S. Government Agency Obligations (Excluding Mortgage-Backed) |
7.6 |
Private Investment Companies |
6.5 |
Corporate Bonds |
4.8 |
U.S. Government & Agency Mortgage-Backed Securities |
3.9 |
Asset-Backed Securities |
1.4 |
Short-Term and Other |
5.8 | |
| Largest Holdings [Text Block] |
Blackstone Partners Offshore Fund |
6.5% |
T. Rowe Price Multi-Strategy Total Return Fund - I Class |
6.0 |
T. Rowe Price International Bond Fund (USD Hedged) - I Class |
6.0 |
T. Rowe Price Dynamic Global Bond Fund - I Class |
5.7 |
U.S. Treasury Notes |
4.7 |
T. Rowe Price Emerging Markets Bond Fund - I Class |
4.7 |
T. Rowe Price Institutional High Yield Fund - Institutional Class |
4.2 |
T. Rowe Price Institutional Emerging Markets Equity Fund |
3.0 |
U.S. Treasury Bonds |
2.9 |
T. Rowe Price Real Assets Fund - I Class |
2.7 | |
| Material Fund Change [Text Block] |
|
| Updated Prospectus Web Address |
www.troweprice.com/paperless
|