| Global. Connected. Sustainable. 2Q25 FINANCIAL RESULTS July 24, 2025 The meeting place for companies, technologies and data |

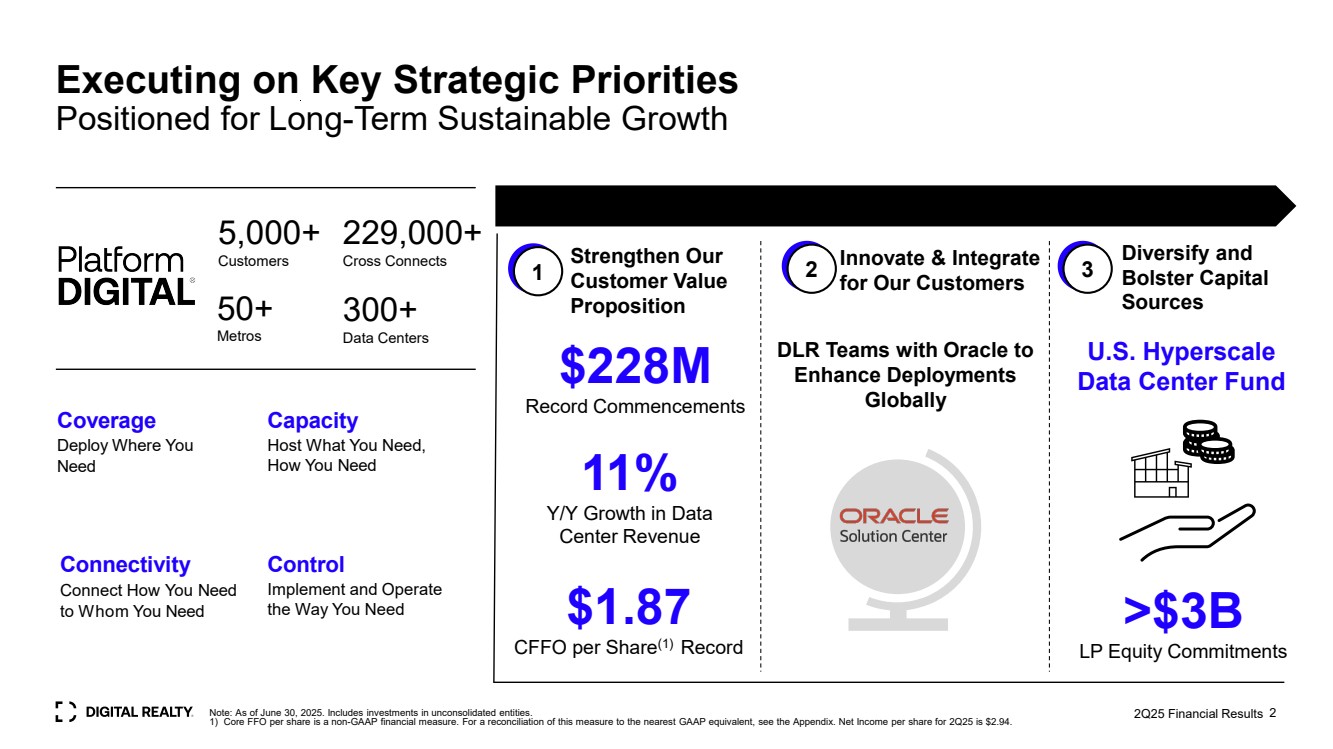
| 5,000+ Customers 229,000+ Cross Connects 50+ Metros 300+ Data Centers Capacity Host What You Need, How You Need Coverage Deploy Where You Need Connectivity Connect How You Need to Whom You Need Control Implement and Operate the Way You Need 2Q25 Financial Results 2 Executing on Key Strategic Priorities Positioned for Long-Term Sustainable Growth Note: As of June 30, 2025. Includes investments in unconsolidated entities. 1) Core FFO per share is a non-GAAP financial measure. For a reconciliation of this measure to the nearest GAAP equivalent, see the Appendix. Net Income per share for 2Q25 is $2.94. Strengthen Our Customer Value Proposition 1 2 3 Innovate & Integrate for Our Customers Diversify and Bolster Capital Sources 11% Y/Y Growth in Data Center Revenue U.S. Hyperscale Data Center Fund $1.87 CFFO per Share(1) Record $228M Record Commencements DLR Teams with Oracle to Enhance Deployments Globally >$3B LP Equity Commitments |
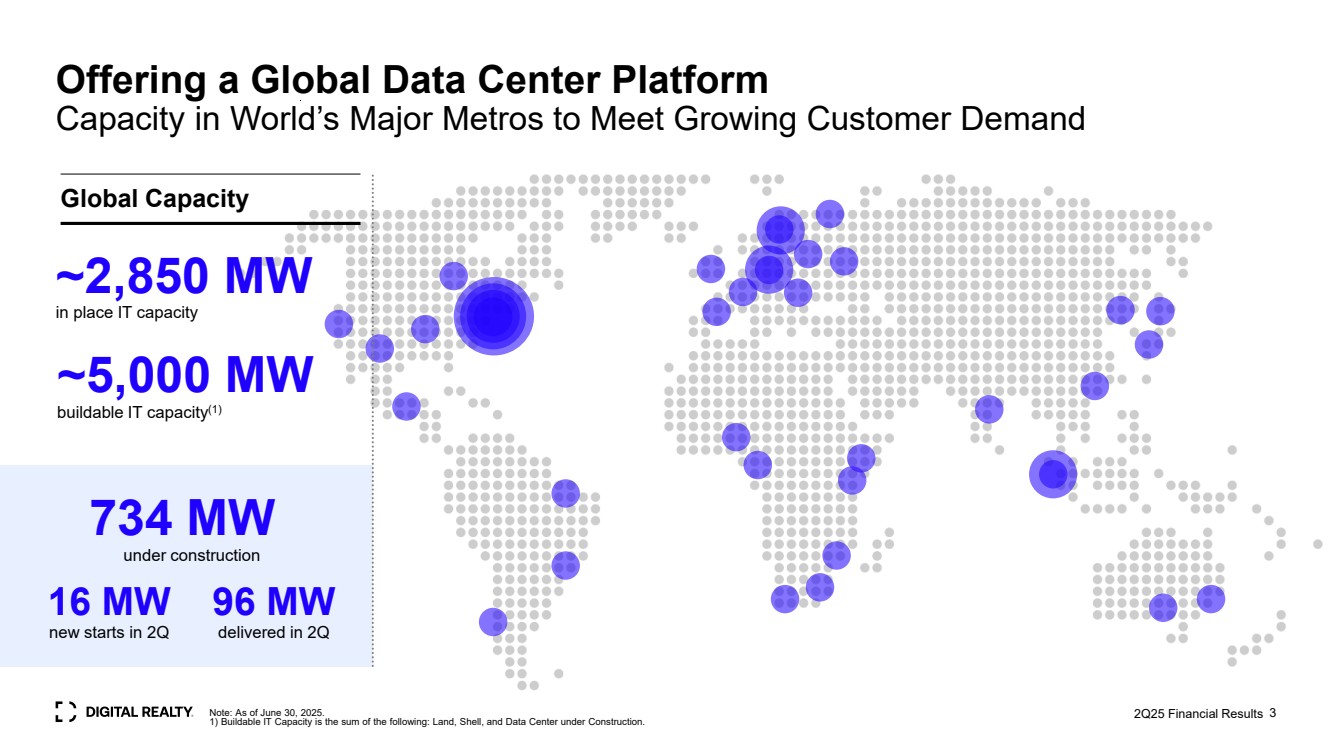
| 3 Offering a Global Data Center Platform Capacity in World’s Major Metros to Meet Growing Customer Demand Global Capacity ~5,000 MW buildable IT capacity(1) 734 MW under construction 2Q25 Financial Results 96 MW delivered in 2Q 16 MW new starts in 2Q ~2,850 MW in place IT capacity Note: As of June 30, 2025. 1) Buildable IT Capacity is the sum of the following: Land, Shell, and Data Center under Construction. |
| 2Q25 Financial Results 4 Enabling the Meeting Place 0-1MW + Interconnection Driven by Record Exports 139 New Logos Added $90M Record 2Q Bookings from 0-1MW + IX 2Q25 Results 66% of total 2Q bookings from 0-1 MW + IX |

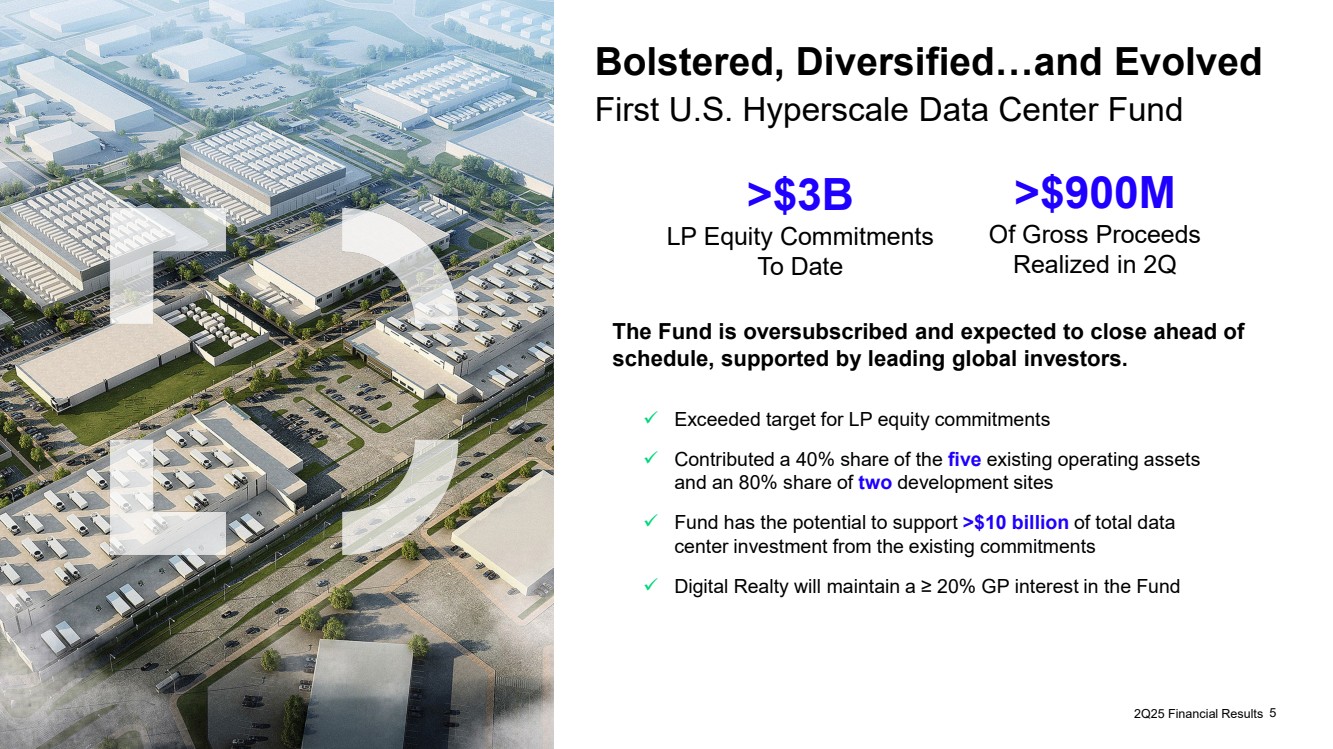
| Bolstered, Diversified…and Evolved First U.S. Hyperscale Data Center Fund 5 Exceeded target for LP equity commitments Contributed a 40% share of the five existing operating assets and an 80% share of two development sites Fund has the potential to support >$10 billion of total data center investment from the existing commitments Digital Realty will maintain a ≥ 20% GP interest in the Fund The Fund is oversubscribed and expected to close ahead of schedule, supported by leading global investors. >$3B LP Equity Commitments To Date >$900M Of Gross Proceeds Realized in 2Q 2Q25 Financial Results |
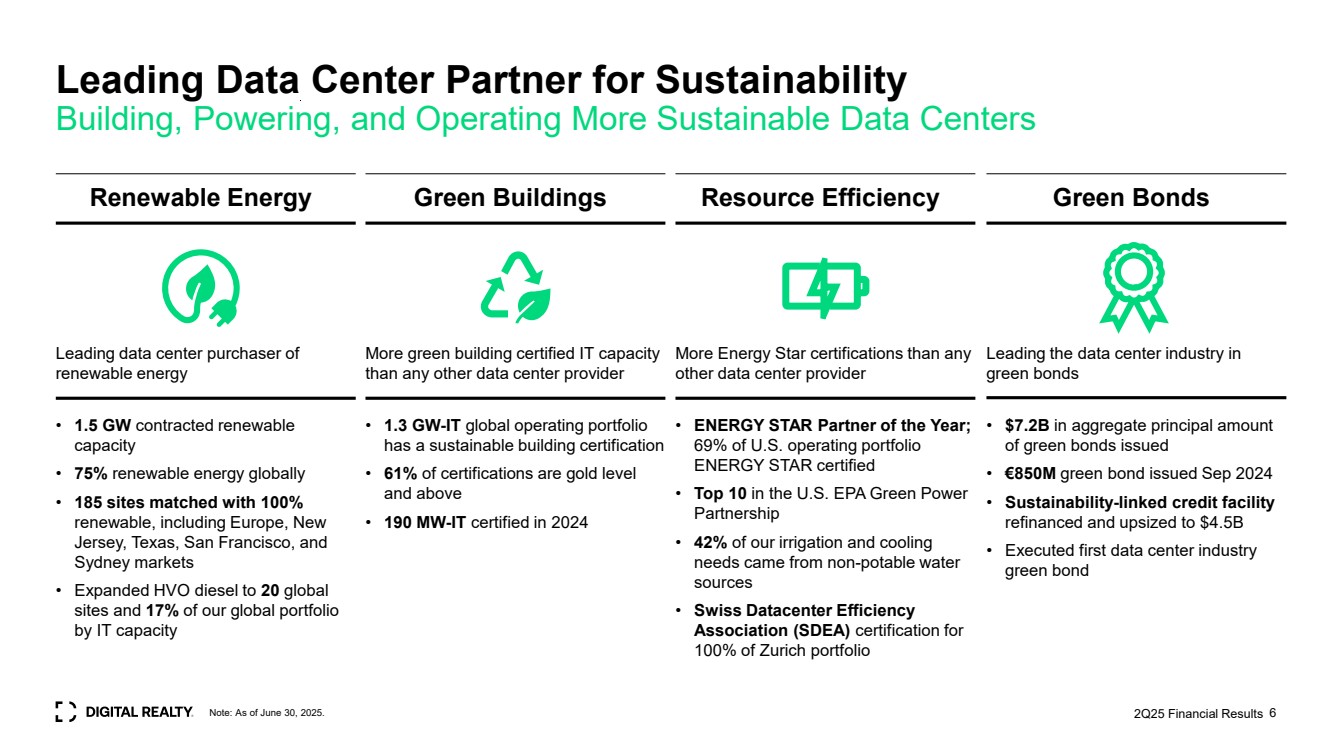
| Note: As of June 30, 2025. 2Q25 Financial Results • 1.5 GW contracted renewable capacity • 75% renewable energy globally • 185 sites matched with 100% renewable, including Europe, New Jersey, Texas, San Francisco, and Sydney markets • Expanded HVO diesel to 20 global sites and 17% of our global portfolio by IT capacity More green building certified IT capacity than any other data center provider • ENERGY STAR Partner of the Year; 69% of U.S. operating portfolio ENERGY STAR certified • Top 10 in the U.S. EPA Green Power Partnership • 42% of our irrigation and cooling needs came from non-potable water sources • Swiss Datacenter Efficiency Association (SDEA) certification for 100% of Zurich portfolio Leading the data center industry in green bonds Renewable Energy Leading data center purchaser of renewable energy • 1.3 GW-IT global operating portfolio has a sustainable building certification • 61% of certifications are gold level and above • 190 MW-IT certified in 2024 Green Buildings Resource Efficiency Green Bonds More Energy Star certifications than any other data center provider • $7.2B in aggregate principal amount of green bonds issued • €850M green bond issued Sep 2024 • Sustainability-linked credit facility refinanced and upsized to $4.5B • Executed first data center industry green bond Leading Data Center Partner for Sustainability Building, Powering, and Operating More Sustainable Data Centers 6 |
| 2Q25 Financial Results 2Q25 Financial Results 7 |

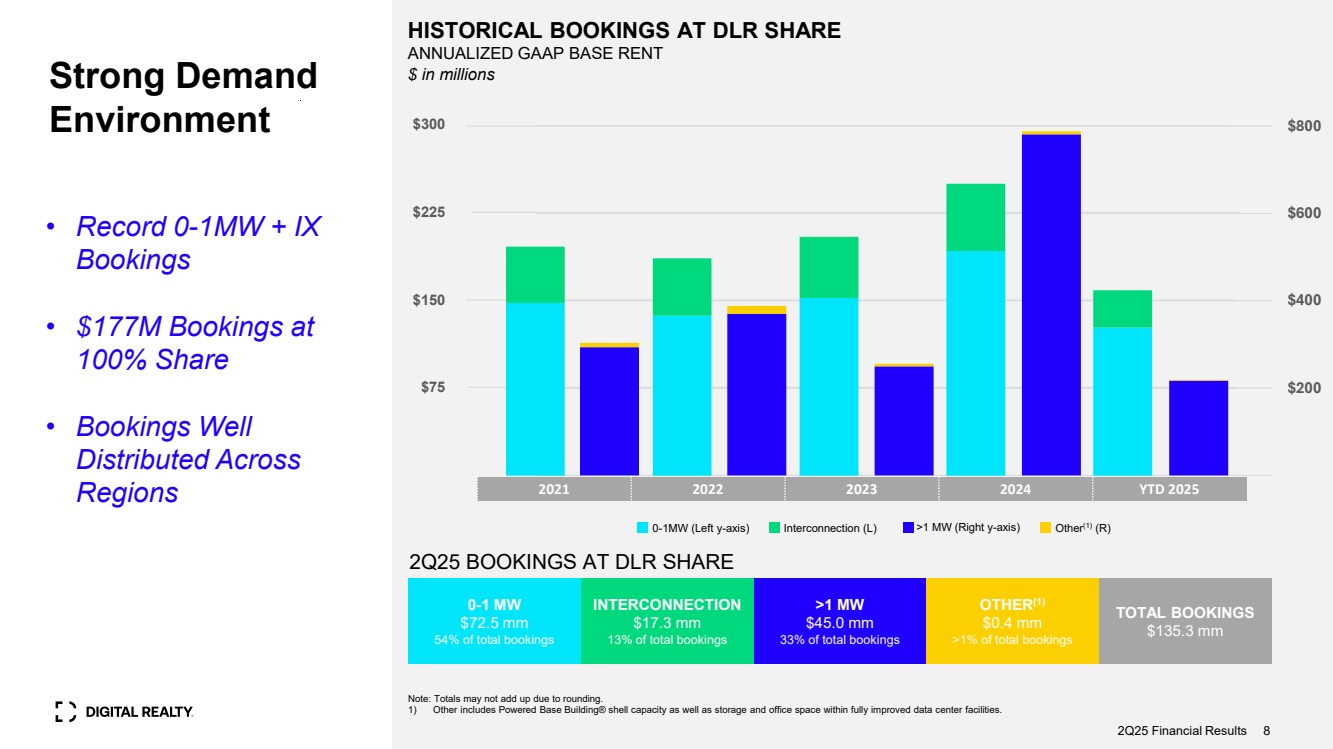
| Note: Totals may not add up due to rounding. 1) Other includes Powered Base Building® shell capacity as well as storage and office space within fully improved data center facilities. 2Q25 BOOKINGS AT DLR SHARE HISTORICAL BOOKINGS AT DLR SHARE ANNUALIZED GAAP BASE RENT Strong Demand $ in millions Environment 0-1 MW $72.5 mm 54% of total bookings INTERCONNECTION $17.3 mm 13% of total bookings >1 MW $45.0 mm 33% of total bookings OTHER(1) $0.4 mm >1% of total bookings TOTAL BOOKINGS $135.3 mm 2Q25 Financial Results 8 2021 2022 2023 2024 YTD 2025 $200 $400 $600 $800 0-1MW (Left y-axis) Interconnection (L) >1 MW (Right y-axis) Other(1) (R) • Record 0-1MW + IX Bookings • $177M Bookings at 100% Share • Bookings Well Distributed Across Regions $75 $150 $225 $300 |
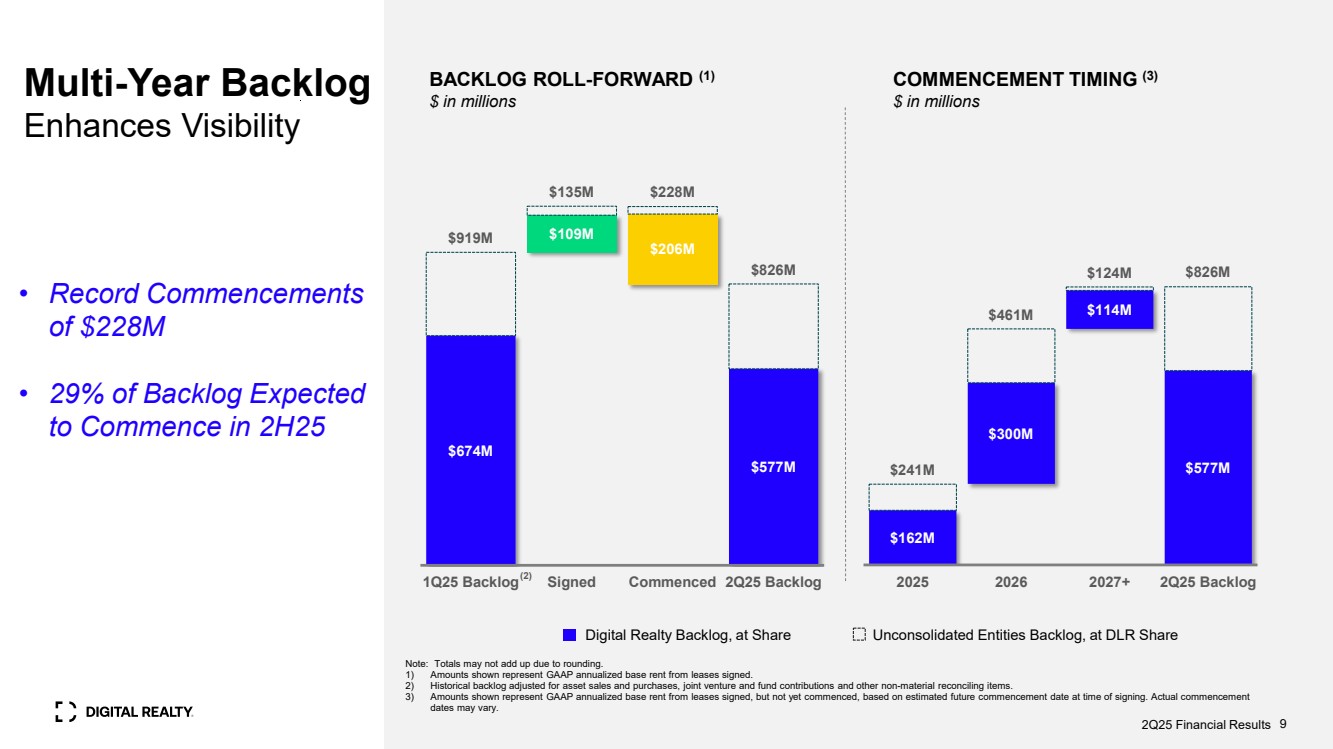
| Note: Totals may not add up due to rounding. 1) Amounts shown represent GAAP annualized base rent from leases signed. 2) Historical backlog adjusted for asset sales and purchases, joint venture and fund contributions and other non-material reconciling items. 3) Amounts shown represent GAAP annualized base rent from leases signed, but not yet commenced, based on estimated future commencement date at time of signing. Actual commencement dates may vary. BACKLOG ROLL-FORWARD (1) $ in millions Digital Realty Backlog, at Share Unconsolidated Entities Backlog, at DLR Share COMMENCEMENT TIMING (3) $ in millions 2Q25 Financial Results 9 $674M $109M $206M $577M $919M $135M $228M $826M 1Q25 Backlog Signed Commenced 2Q25 Backlog (2) • Record Commencements of $228M • 29% of Backlog Expected to Commence in 2H25 Multi-Year Backlog Enhances Visibility $162M $300M $114M $241M $577M $461M $124M $826M 2025 2026 2027+ 2Q25 Backlog |
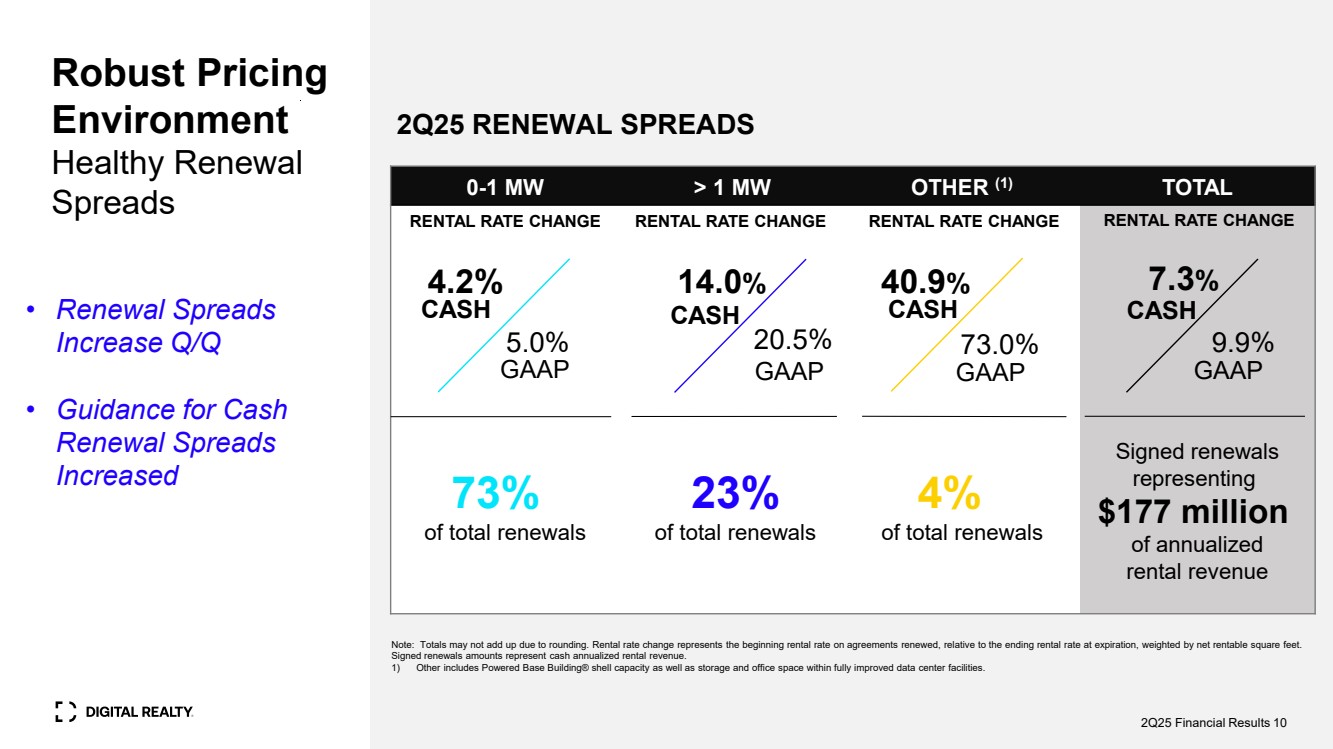
| Robust Pricing Environment Healthy Renewal Spreads 2Q25 RENEWAL SPREADS 0-1 MW > 1 MW OTHER (1) TOTAL 73% of total renewals 23% of total renewals 4% of total renewals Signed renewals representing $177 million of annualized rental revenue RENTAL RATE CHANGE RENTAL RATE CHANGE RENTAL RATE CHANGE RENTAL RATE CHANGE 5.0% 14.0% GAAP Note: Totals may not add up due to rounding. Rental rate change represents the beginning rental rate on agreements renewed, relative to the ending rental rate at expiration, weighted by net rentable square feet. Signed renewals amounts represent cash annualized rental revenue. 1) Other includes Powered Base Building® shell capacity as well as storage and office space within fully improved data center facilities. 4.2% CASH GAAP CASH 20.5% 40.9% CASH 73.0% GAAP 7.3% CASH 9.9% GAAP 2Q25 Financial Results 10 • Renewal Spreads Increase Q/Q • Guidance for Cash Renewal Spreads Increased |
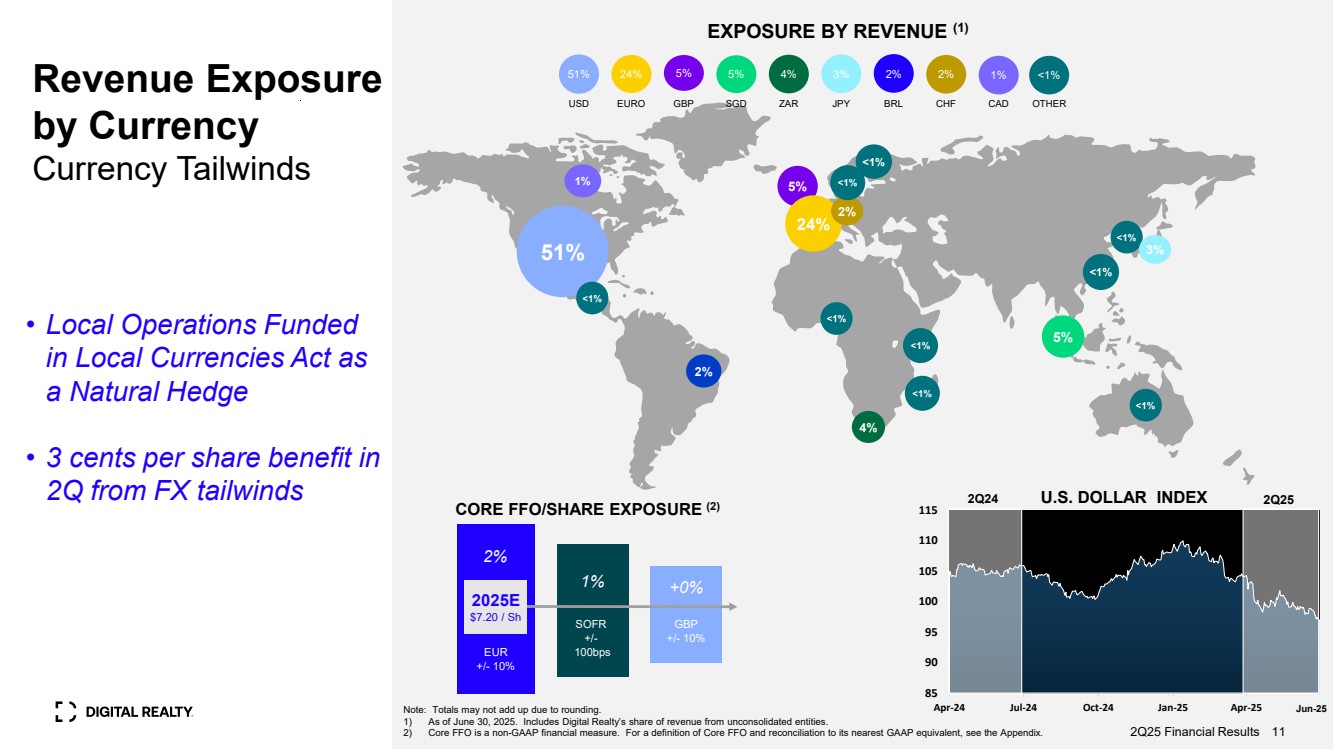
| 85 90 95 100 105 110 115 Apr-24 Jul-24 Oct-24 Jan-25 Apr-25 Revenue Exposure by Currency Currency Tailwinds 1% 5% 24% 5% 51% <1% 2% 4% 2025E $7.20 / Sh 1% SOFR +/- 100bps +0% GBP +/- 10% 2% EUR +/- 10% CORE FFO/SHARE EXPOSURE (2) EXPOSURE BY REVENUE (1) Note: Totals may not add up due to rounding. 1) As of June 30, 2025. Includes Digital Realty’s share of revenue from unconsolidated entities. 2) Core FFO is a non-GAAP financial measure. For a definition of Core FFO and reconciliation to its nearest GAAP equivalent, see the Appendix. 2Q25 Financial Results 11 2% <1% • Local Operations Funded in Local Currencies Act as a Natural Hedge • 3 cents per share benefit in 2Q from FX tailwinds <1% <1% 2Q24 U.S. DOLLAR INDEX 2Q25 ZAR 4% USD EURO GBP SGD 24% 5% 5% OTHER <1% CHF 51% 2% 1% BRL CAD 2% JPY 3% <1% <1% <1% 3% Jun-25 <1% <1% |
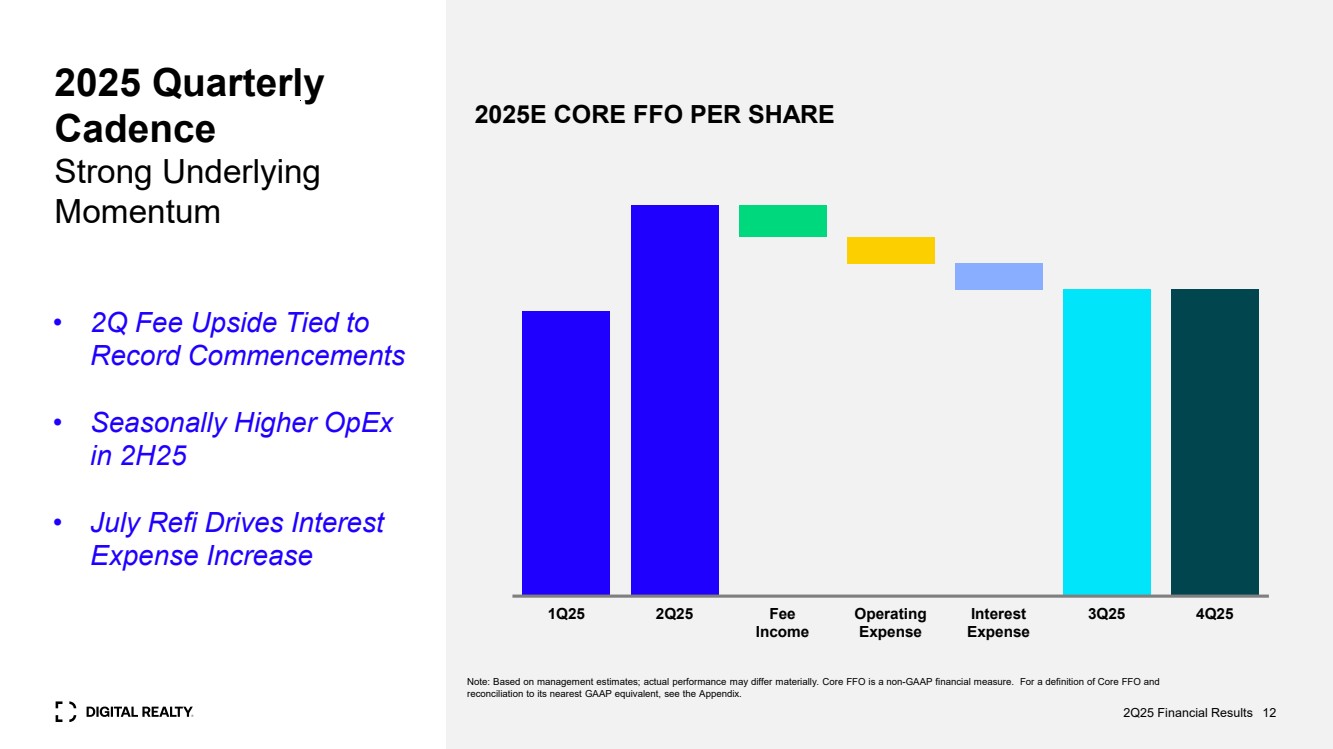
| 2025 Quarterly Cadence Strong Underlying Momentum 2025E CORE FFO PER SHARE Note: Based on management estimates; actual performance may differ materially. Core FFO is a non-GAAP financial measure. For a definition of Core FFO and reconciliation to its nearest GAAP equivalent, see the Appendix. 1Q25 2Q25 Fee Income Operating Expense Interest Expense 3Q25 4Q25 • 2Q Fee Upside Tied to Record Commencements • Seasonally Higher OpEx in 2H25 • July Refi Drives Interest Expense Increase 2Q25 Financial Results 12 |
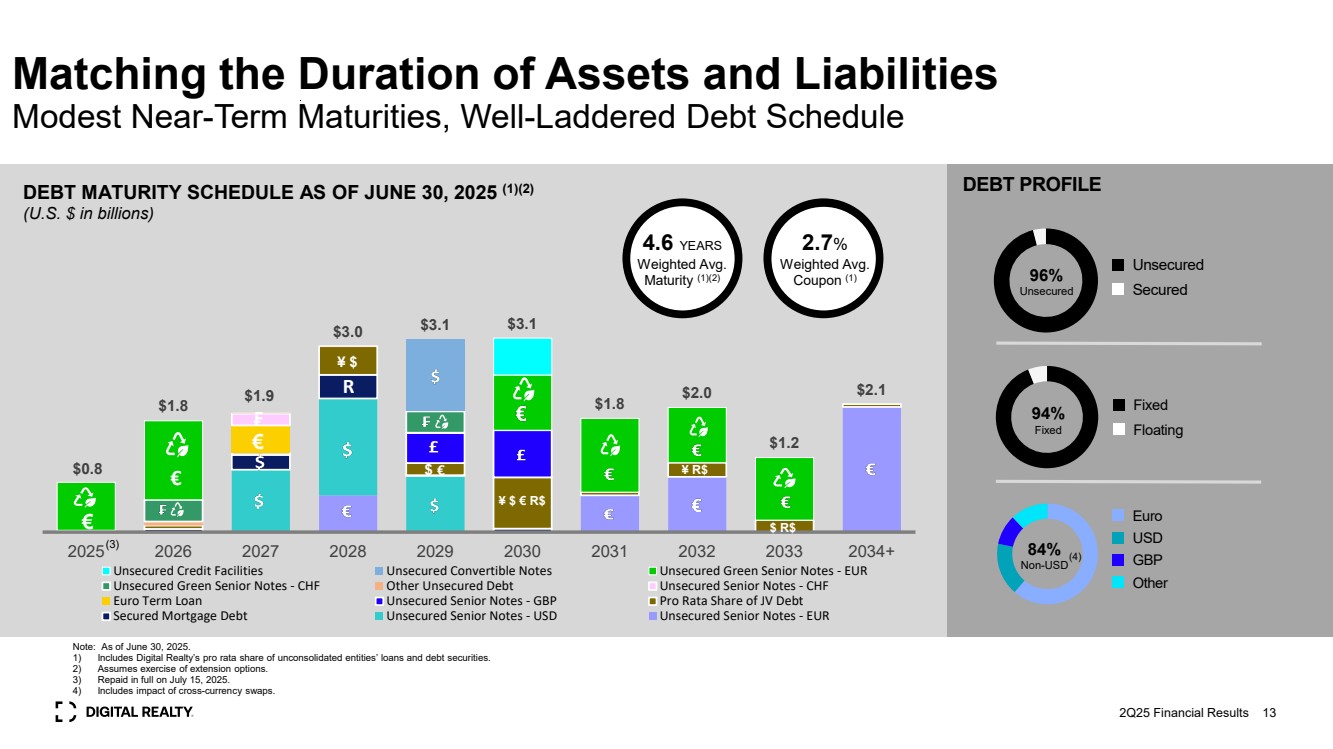
| Matching the Duration of Assets and Liabilities Modest Near-Term Maturities, Well-Laddered Debt Schedule DEBT MATURITY SCHEDULE AS OF JUNE 30, 2025 (1)(2) (U.S. $ in billions) Note: As of June 30, 2025. 1) Includes Digital Realty’s pro rata share of unconsolidated entities’ loans and debt securities. 2) Assumes exercise of extension options. 3) Repaid in full on July 15, 2025. 4) Includes impact of cross-currency swaps. DEBT PROFILE 96% Unsecured Unsecured Secured 84% Non-USD Euro USD GBP Other 94% Fixed Fixed Floating 2Q25 Financial Results (4) 4.6 YEARS Weighted Avg. Maturity (1)(2) 2.7% Weighted Avg. Coupon (1) 13 $0.8 $1.8 $1.9 $3.0 $3.1 $3.1 $1.8 $2.0 $1.2 $2.1 2025 2026 2027 2028 2029 2030 2031 2032 2033 2034+ Unsecured Credit Facilities Unsecured Convertible Notes Unsecured Green Senior Notes - EUR Unsecured Green Senior Notes - CHF Other Unsecured Debt Unsecured Senior Notes - CHF Euro Term Loan Unsecured Senior Notes - GBP Pro Rata Share of JV Debt Secured Mortgage Debt Unsecured Senior Notes - USD Unsecured Senior Notes - EUR € € R € ₣ ¥ $ $ € ¥ $ € R$ ¥ R$ $ R$ (3) |
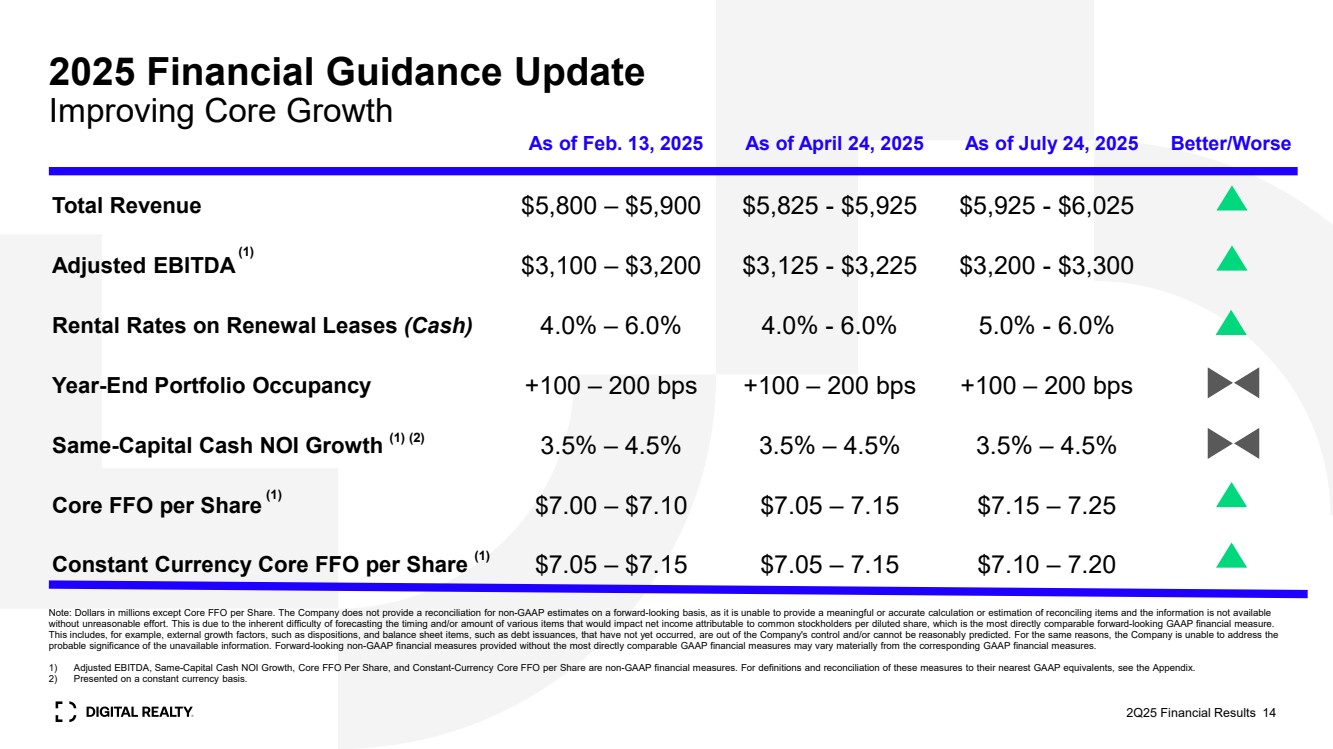
| 2025 Financial Guidance Update Improving Core Growth (1) (1) (2) (1) 2Q25 Financial Results 14 As of Feb. 13, 2025 As of April 24, 2025 As of July 24, 2025 Better/Worse Total Revenue $5,800 – $5,900 $5,825 - $5,925 $5,925 - $6,025 Adjusted EBITDA $3,100 – $3,200 $3,125 - $3,225 $3,200 - $3,300 Rental Rates on Renewal Leases (Cash) 4.0% – 6.0% 4.0% - 6.0% 5.0% - 6.0% Year-End Portfolio Occupancy +100 – 200 bps +100 – 200 bps +100 – 200 bps Same-Capital Cash NOI Growth 3.5% – 4.5% 3.5% – 4.5% 3.5% – 4.5% Core FFO per Share $7.00 – $7.10 $7.05 – 7.15 $7.15 – 7.25 Constant Currency Core FFO per Share $7.05 – $7.15 $7.05 – 7.15 $7.10 – 7.20 Note: Dollars in millions except Core FFO per Share. The Company does not provide a reconciliation for non-GAAP estimates on a forward-looking basis, as it is unable to provide a meaningful or accurate calculation or estimation of reconciling items and the information is not available without unreasonable effort. This is due to the inherent difficulty of forecasting the timing and/or amount of various items that would impact net income attributable to common stockholders per diluted share, which is the most directly comparable forward-looking GAAP financial measure. This includes, for example, external growth factors, such as dispositions, and balance sheet items, such as debt issuances, that have not yet occurred, are out of the Company's control and/or cannot be reasonably predicted. For the same reasons, the Company is unable to address the probable significance of the unavailable information. Forward-looking non-GAAP financial measures provided without the most directly comparable GAAP financial measures may vary materially from the corresponding GAAP financial measures. 1) Adjusted EBITDA, Same-Capital Cash NOI Growth, Core FFO Per Share, and Constant-Currency Core FFO per Share are non-GAAP financial measures. For definitions and reconciliation of these measures to their nearest GAAP equivalents, see the Appendix. 2) Presented on a constant currency basis. (1) |
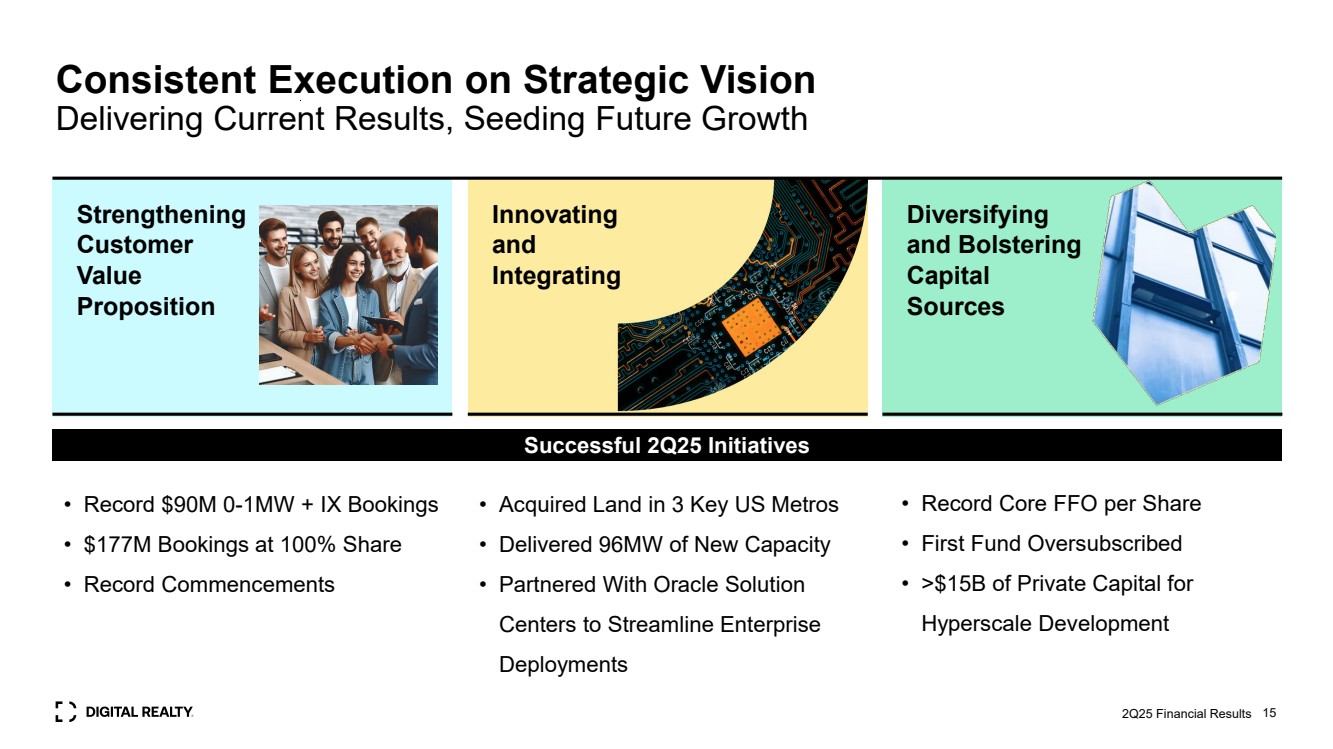
| 15 Diversifying and Bolstering Capital Sources Strengthening Customer Value Proposition Innovating and Integrating Consistent Execution on Strategic Vision Delivering Current Results, Seeding Future Growth • Record $90M 0-1MW + IX Bookings • $177M Bookings at 100% Share • Record Commencements • Acquired Land in 3 Key US Metros • Delivered 96MW of New Capacity • Partnered With Oracle Solution Centers to Streamline Enterprise Deployments • Record Core FFO per Share • First Fund Oversubscribed • >$15B of Private Capital for Hyperscale Development 2Q25 Financial Results Successful 2Q25 Initiatives |
| Appendix 2Q25 Financial Results 16 |

| Appendix Management Statements on Non-GAAP Measures The information included in this presentation contains certain non-GAAP financial measures that management believes are helpful in understanding our business, as further described below. Our definition and calculation of non-GAAP financial measures may differ from those of other REITs, and, therefore, may not be comparable. The non-GAAP financial measures should not be considered alternatives to net income or any other GAAP measurement of performance and should not be considered an alternative to cash flows from operating, investing or financing activities as a measure of liquidity. Funds From Operations (FFO): We calculate funds from operations, or FFO, in accordance with the standards established by the National Association of Real Estate Investment Trusts, or Nareit, in the Nareit Funds From Operations White Paper - 2018 Restatement. FFO represents net income (loss) (computed in accordance with GAAP), excluding gains (or losses) from real estate transactions, provision for impairment, real estate related depreciation and amortization (excluding amortization of deferred financing costs), our share of unconsolidated JV real estate related depreciation & amortization, net income (loss) attributable to non-controlling interests in operating partnership, and reconciling items related to non-controlling interests. Management uses FFO as a supplemental performance measure because, in excluding real estate related depreciation and amortization and gains and losses from property dispositions and after adjustments for unconsolidated partnerships and joint ventures, it provides a performance measure that, when compared year over year, captures trends in occupancy rates, rental rates and operating costs. We also believe that, as a widely recognized measure of the performance of REITs, FFO will be used by investors as a basis to compare our operating performance with that of other REITs. However, because FFO excludes depreciation and amortization and captures neither the changes in the value of our data centers that result from use or market conditions, nor the level of capital expenditures and capitalized leasing commissions necessary to maintain the operating performance of our data centers, all of which have real economic effect and could materially impact our financial condition and results from operations, the utility of FFO as a measure of our performance is limited. Other REITs may not calculate FFO in accordance with the Nareit definition and, accordingly, our FFO may not be comparable to other REITs’ FFO. FFO should be considered only as a supplement to net income computed in accordance with GAAP as a measure of our performance. Core Funds from Operations (Core FFO): We present core funds from operations, or Core FFO, as a supplemental operating measure because, in excluding certain items that do not reflect core revenue or expense streams, it provides a performance measure that, when compared year over year, captures trends in our core business operating performance. We calculate Core FFO by adding to or subtracting from FFO (i) other non-core revenues adjustments, (ii) transaction and integration expenses, (iii) loss on extinguishment and modifications, (iv) gain on / issuance costs associated with redeemed preferred stock, (v) severance, equity acceleration, and legal expenses, (vi) gain/loss on FX and derivatives revaluation, and (vii) other non-core expense adjustments. Because certain of these adjustments have a real economic impact on our financial condition and results from operations, the utility of Core FFO as a measure of our performance is limited. Other REITs may calculate Core FFO differently than we do and accordingly, our Core FFO may not be comparable to other REITs’ Core FFO. Core FFO should be considered only as a supplement to net income computed in accordance with GAAP as a measure of our performance. EBITDA and Adjusted EBITDA: We believe that earnings before interest, loss on debt extinguishment and modifications, income taxes, and depreciation and amortization, or EBITDA, and Adjusted EBITDA (as defined below), are useful supplemental performance measures because they allow investors to view our performance without the impact of non-cash depreciation and amortization or the cost of debt and, with respect to Adjusted EBITDA, unconsolidated joint venture real estate related depreciation & amortization, unconsolidated joint venture interest expense and tax expense, severance, equity acceleration, and legal expenses, transaction and integration expenses, gain (loss) on sale / deconsolidation, provision for impairment, other non-core adjustments, net, non-controlling interests, preferred stock dividends, and issuance costs associated with redeemed preferred stock. Adjusted EBITDA is EBITDA excluding unconsolidated joint venture real estate related depreciation & amortization, unconsolidated joint venture interest expense and tax, severance, equity acceleration, and legal expenses, transaction and integration expenses, gain (loss) on sale / deconsolidation, provision for impairment, other non-core adjustments, net, non-controlling interests, preferred stock dividends, and gain on / issuance costs associated with redeemed preferred stock. In addition, we believe EBITDA and Adjusted EBITDA are frequently used by securities analysts, investors and other interested parties in the evaluation of REITs. Because EBITDA and Adjusted EBITDA are calculated before recurring cash charges including interest expense and income taxes, exclude capitalized costs, such as leasing commissions, and are not adjusted for capital expenditures or other recurring cash requirements of our business, their utility as a measure of our performance is limited. Other REITs may calculate EBITDA and Adjusted EBITDA differently than we do and, accordingly, our EBITDA and Adjusted EBITDA may not be comparable to other REITs’ EBITDA and Adjusted EBITDA. Accordingly, EBITDA and Adjusted EBITDA should be considered only as supplements to net income computed in accordance with GAAP as a measure of our financial performance. Net Operating Income (NOI) and Cash NOI: Net operating income, or NOI, represents rental revenue, tenant reimbursement revenue and interconnection revenue less utilities expense, rental property operating expenses, property taxes and insurance expenses (as reflected in the statement of operations). NOI is commonly used by stockholders, company management and industry analysts as a measurement of operating performance of the company’s rental portfolio. Cash NOI is NOI less straight-line rents and above- and below-market rent amortization. Cash NOI is commonly used by stockholders, company management and industry analysts as a measure of property operating performance on a cash basis. However, because NOI and cash NOI exclude depreciation and amortization and capture neither the changes in the value of our data centers that result from use or market conditions, nor the level of capital expenditures and capitalized leasing commissions necessary to maintain the operating performance of our data centers, all of which have real economic effect and could materially impact our results from operations, the utility of NOI and cash NOI as measures of our performance is limited. Other REITs may calculate NOI and cash NOI differently than we do and, accordingly, our NOI and cash NOI may not be comparable to other REITs’ NOI and cash NOI. NOI and cash NOI should be considered only as supplements to net income computed in accordance with GAAP as measures of our performance. Same–Capital Cash NOI: Same-Capital Cash NOI represents buildings owned as of December 31, 2023 with less than 5% of total rentable square feet under development and excludes buildings that were undergoing, or were expected to undergo, development activities in 2024-2025, buildings classified as held for sale, and buildings sold or contributed to joint ventures for all periods presented (prior period numbers are adjusted to reflect the current same-capital pool). 2Q25 Financial Results 17 |
| Appendix Forward-Looking Statements This information in this presentation contains forward-looking statements within the meaning of the federal securities laws, which are based on current expectations, forecasts and assumptions that involve risks and uncertainties that could cause actual outcomes and results to differ materially. Such forward-looking statements include statements relating to: our economic outlook; our expected investment and expansion activity; our joint ventures; the expected benefits and timing of PlatformDIGITAL®; the Data Gravity Index ; Data Gravity Index DGx ; public cloud services spending; the potential impact of artificial intelligence and data regulations; our sustainability initiatives; the expected effect of foreign currency translation adjustments on our financials; anticipated continued demand for our products and services; our liquidity; demand drivers and economic growth outlook; business drivers; our expected development plans and completions, including timing, total square footage, IT capacity and raised floor space upon completion; expected availability for leasing efforts and colocation initiatives; organizational initiatives; our product offerings; our connected data communities; joint venture opportunities; occupancy and total investment; our expected investment in our properties; our estimated time to stabilization and targeted returns at stabilization of our properties; our expected future acquisitions; acquisitions strategy; available inventory and development strategy; the signing and commencement of leases, and related rental revenue; lag between signing and commencement of leases; our 2025 backlog; future rents; our expected same store portfolio growth; our expected growth and stabilization of development completions and acquisitions; lease rollovers and expected rental rate changes; our re-leasing spreads; our expected yields on investments; our expectations with respect to capital investments at lease expiration on existing data center or colocation space; debt maturities; lease maturities; our other expected future financial and other results including guidance, and the assumptions underlying such results; our customers’ capital investments; our plans and intentions; future data center utilization, utilization rates, growth rates, trends, supply and demand; data center expansion plans; estimated kW/MW requirements; capital expenditures; the effect new leases and increases in rental rates will have on our rental revenues and results of operations; estimates of the value of our development portfolio; our ability to meet our liquidity needs, including the ability to raise additional capital; access to power; market forecasts; projected financial information and covenant metrics; Core FFO run rate and NOI growth; other forward looking financial data; leasing expectations; our exposure to tenants in certain industries; our expectations and underlying assumptions regarding our sensitivity to fluctuations in foreign exchange rates; and the sufficiency of our capital to fund future requirements. You can identify forward-looking statements by the use of forward-looking terminology such as “believes,” “expects,” “may,” “will,” “should,” “seeks,” “approximately,” “intends,” “plans,” “pro forma,” “estimates” or “anticipates” or the negative of these words and phrases or similar words or phrases which are predictions of or indicate future events or trends and discussions which do not relate solely to historical matters. Such statements are based on management’s beliefs and assumptions made based on information currently available to management. Such statements are subject to risks, uncertainties and assumptions and are not guarantees of future performance and may be affected by known and unknown risks, trends, uncertainties and factors that are beyond our control. Should one or more of these risks or uncertainties materialize, or should underlying assumptions prove incorrect, actual results may vary materially from those anticipated, estimated or projected. Some of the risks and uncertainties that may cause our actual results, performance or achievements to differ materially from those by forward-looking statements include, among others, the following: reduced demand for data centers or decreases in information technology spending; decreased rental rates, increased operating costs or increased vacancy rates; increased competition or available supply of data center space; the suitability of our data centers and data center infrastructure, delays or disruptions in connectivity or availability of power, or failures or breaches of our physical and information security infrastructure or services; breaches of our obligations or restrictions under our contracts with our customers; our inability to successfully develop and lease new properties and development space, and delays or unexpected costs in development of properties; the impact of current global and local economic, credit and market conditions; increased tariffs, global supply chain or procurement disruptions, or increased supply chain costs; the impact from periods of heightened inflation on our costs, such as operating and general and administrative expenses, interest expense and real estate acquisition and construction costs; the impact on our customers’ and our suppliers’ operations during an epidemic, pandemic, or other global events; our dependence upon significant customers, bankruptcy or insolvency of a major customer or a significant number of smaller customers, or defaults on or non-renewal of leases by customers; changes in political conditions, geopolitical turmoil, political instability, civil disturbances, restrictive governmental actions or nationalization in the countries in which we operate; our inability to retain data center space that we lease or sublease from third parties; information security and data privacy breaches; difficulties managing an international business and acquiring or operating properties in foreign jurisdictions and unfamiliar metropolitan areas; our failure to realize the intended benefits from, or disruptions to our plans and operations or unknown or contingent liabilities related to, our recent and future acquisitions; our failure to successfully integrate and operate acquired or developed properties or businesses; difficulties in identifying properties to acquire and completing acquisitions; risks related to joint venture investments, including as a result of our lack of control of such investments; risks associated with using debt to fund our business activities, including re-financing and interest rate risks, our failure to repay debt when due, adverse changes in our credit ratings or our breach of covenants or other terms contained in our loan facilities and agreements; our failure to obtain necessary debt and equity financing, and our dependence on external sources of capital; financial market fluctuations and changes in foreign currency exchange rates; adverse economic or real estate developments in our industry or the industry sectors that we sell to, including risks relating to decreasing real estate valuations and impairment charges and goodwill and other intangible asset impairment charges; our inability to manage our growth effectively; losses in excess of our insurance coverage; our inability to attract and retain talent; environmental liabilities, risks related to natural disasters and our inability to achieve our sustainability goals; the expected operating performance of anticipated near-term acquisitions and descriptions relating to these expectations; our inability to comply with rules and regulations applicable to our company; Digital Realty Trust, Inc.’s failure to maintain its status as a REIT for U.S. federal income tax purposes; Digital Realty Trust, L.P.’s failure to qualify as a partnership for U.S. federal income tax purposes; restrictions on our ability to engage in certain business activities; and changes in local, state, federal and international laws and regulations, including related to taxation, real estate and zoning laws and increases in real property tax rates; the impact of any financial, accounting, legal or regulatory issues or litigation that may affect us. The risks included here are not exhaustive, and additional factors could adversely affect our business and financial performance. We discussed a number of additional material risks in our annual report on Form 10-K for the year ended December 31, 2024, and other filings with the Securities and Exchange Commission. Those risks continue to be relevant to our performance and financial condition. Moreover, we operate in a very competitive and rapidly changing environment. New risk factors emerge from time to time and it is not possible for management to predict all such risk factors, nor can it assess the impact of all such risk factors on the business or the extent to which any factor, or combination of factors, may cause actual results to differ materially from those contained in any forward-looking statements. We expressly disclaim any responsibility to update forward-looking statements, whether as a result of new information, future events or otherwise. Digital Realty, Digital Realty Trust, the Digital Realty logo, Interxion, Turn-Key Flex, Powered Base Building, PlatformDIGITAL, Data Gravity Index, Data Gravity Index DGx, ServiceFabric, AnyScale Colo, and Pervasive Data Center Architecture (PDx),among others, are registered trademarks and service marks of Digital Realty Trust, Inc. in the United States and/or other countries. All other names, trademarks and service marks are the property of their respective owners. 2Q25 Financial Results 18 |
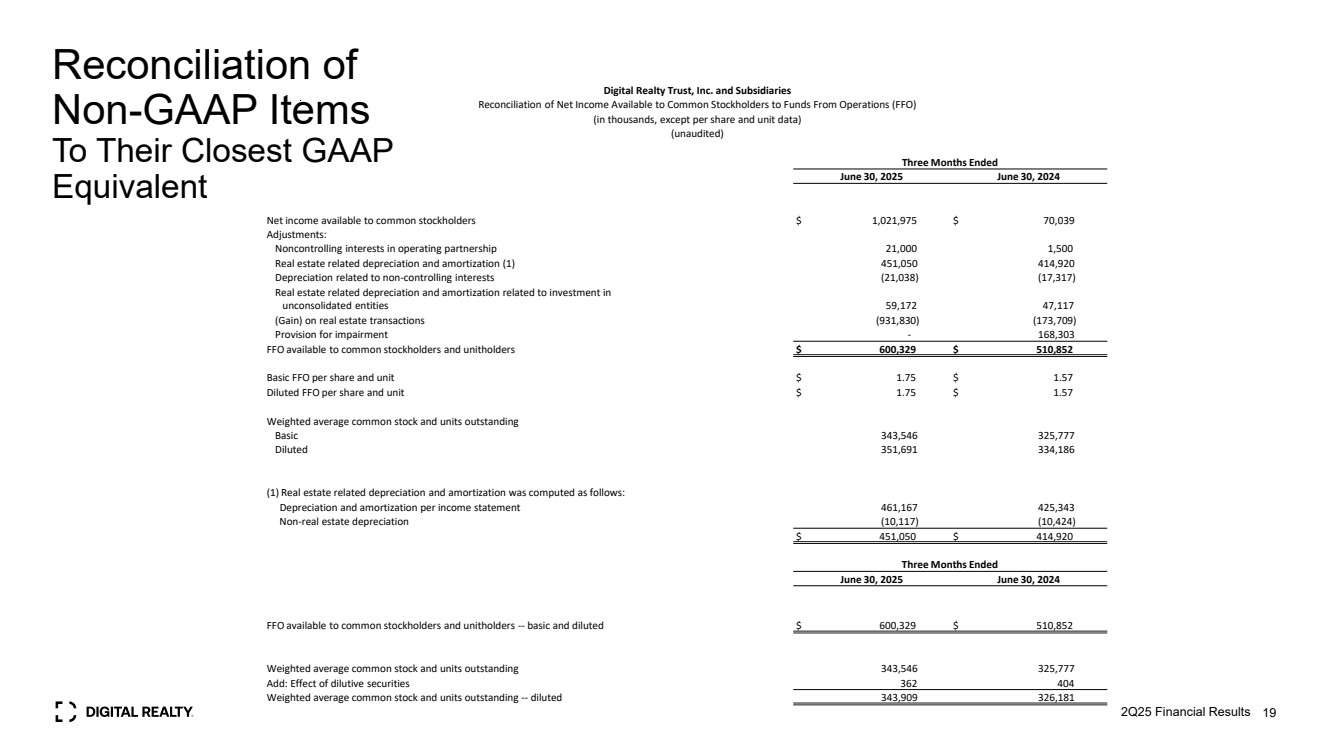
| Reconciliation of Non-GAAP Items To Their Closest GAAP Equivalent 2Q25 Financial Results 19 Digital Realty Trust, Inc. and Subsidiaries Reconciliation of Net Income Available to Common Stockholders to Funds From Operations (FFO) (in thousands, except per share and unit data) (unaudited) Three Months Ended June 30, 2025 June 30, 2024 Net income available to common stockholders $ 1,021,975 $ 70,039 Adjustments: Noncontrolling interests in operating partnership 21,000 1,500 Real estate related depreciation and amortization (1) 451,050 414,920 Depreciation related to non-controlling interests (21,038) (17,317) Real estate related depreciation and amortization related to investment in unconsolidated entities 59,172 47,117 (Gain) on real estate transactions (931,830) (173,709) Provision for impairment - 168,303 FFO available to common stockholders and unitholders $ 600,329 $ 510,852 Basic FFO per share and unit $ 1.75 $ 1.57 Diluted FFO per share and unit $ 1.75 $ 1.57 Weighted average common stock and units outstanding Basic 343,546 325,777 Diluted 351,691 334,186 (1) Real estate related depreciation and amortization was computed as follows: Depreciation and amortization per income statement 461,167 425,343 Non-real estate depreciation (10,117) (10,424) $ 451,050 $ 414,920 Three Months Ended June 30, 2025 June 30, 2024 FFO available to common stockholders and unitholders -- basic and diluted $ 600,329 $ 510,852 Weighted average common stock and units outstanding 343,546 325,777 Add: Effect of dilutive securities 362 404 Weighted average common stock and units outstanding -- diluted 343,909 326,181 |
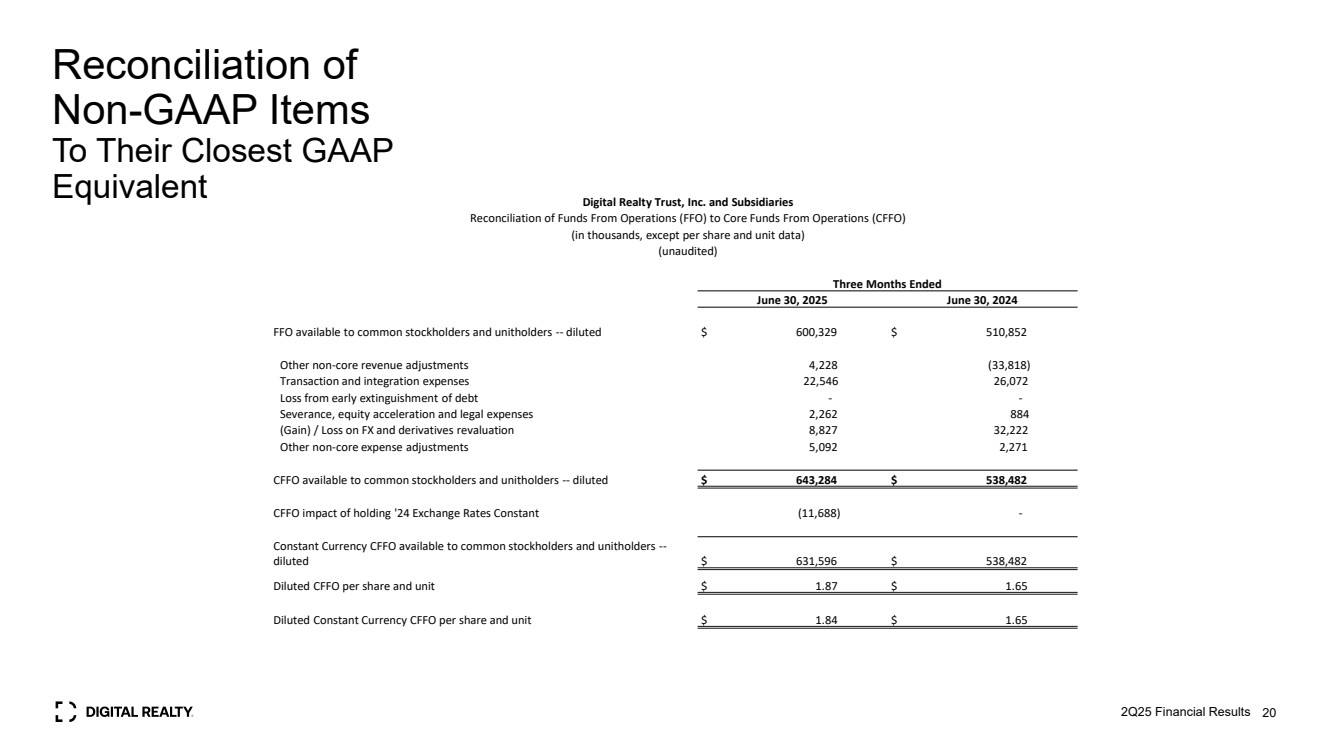
| Reconciliation of Non-GAAP Items To Their Closest GAAP Equivalent 2Q25 Financial Results 20 Digital Realty Trust, Inc. and Subsidiaries Reconciliation of Funds From Operations (FFO) to Core Funds From Operations (CFFO) (in thousands, except per share and unit data) (unaudited) Three Months Ended June 30, 2025 June 30, 2024 FFO available to common stockholders and unitholders -- diluted $ 600,329 $ 510,852 Other non-core revenue adjustments 4,228 (33,818) Transaction and integration expenses 22,546 26,072 Loss from early extinguishment of debt - - Severance, equity acceleration and legal expenses 2,262 884 (Gain) / Loss on FX and derivatives revaluation 8,827 32,222 Other non-core expense adjustments 5,092 2,271 CFFO available to common stockholders and unitholders -- diluted $ 643,284 $ 538,482 CFFO impact of holding '24 Exchange Rates Constant (11,688) - Constant Currency CFFO available to common stockholders and unitholders -- diluted $ 631,596 $ 538,482 Diluted CFFO per share and unit $ 1.87 $ 1.65 Diluted Constant Currency CFFO per share and unit $ 1.84 $ 1.65 |
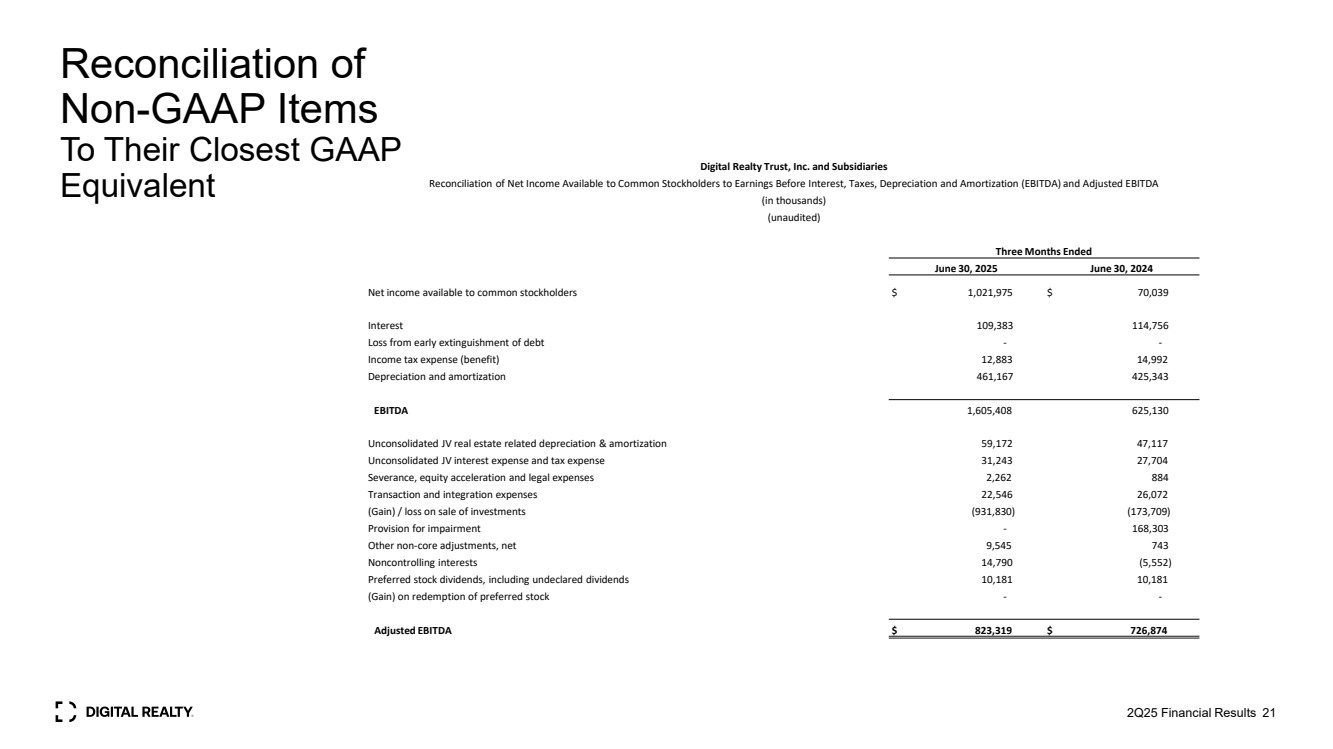
| Reconciliation of Non-GAAP Items To Their Closest GAAP Equivalent 2Q25 Financial Results 21 Digital Realty Trust, Inc. and Subsidiaries Reconciliation of Net Income Available to Common Stockholders to Earnings Before Interest, Taxes, Depreciation and Amortization (EBITDA) and Adjusted EBITDA (in thousands) (unaudited) Three Months Ended June 30, 2025 June 30, 2024 Net income available to common stockholders $ 1,021,975 $ 70,039 Interest 109,383 114,756 Loss from early extinguishment of debt - - Income tax expense (benefit) 12,883 14,992 Depreciation and amortization 461,167 425,343 EBITDA 1,605,408 625,130 Unconsolidated JV real estate related depreciation & amortization 59,172 47,117 Unconsolidated JV interest expense and tax expense 31,243 27,704 Severance, equity acceleration and legal expenses 2,262 884 Transaction and integration expenses 22,546 26,072 (Gain) / loss on sale of investments (931,830) (173,709) Provision for impairment - 168,303 Other non-core adjustments, net 9,545 743 Noncontrolling interests 14,790 (5,552) Preferred stock dividends, including undeclared dividends 10,181 10,181 (Gain) on redemption of preferred stock - - Adjusted EBITDA $ 823,319 $ 726,874 |
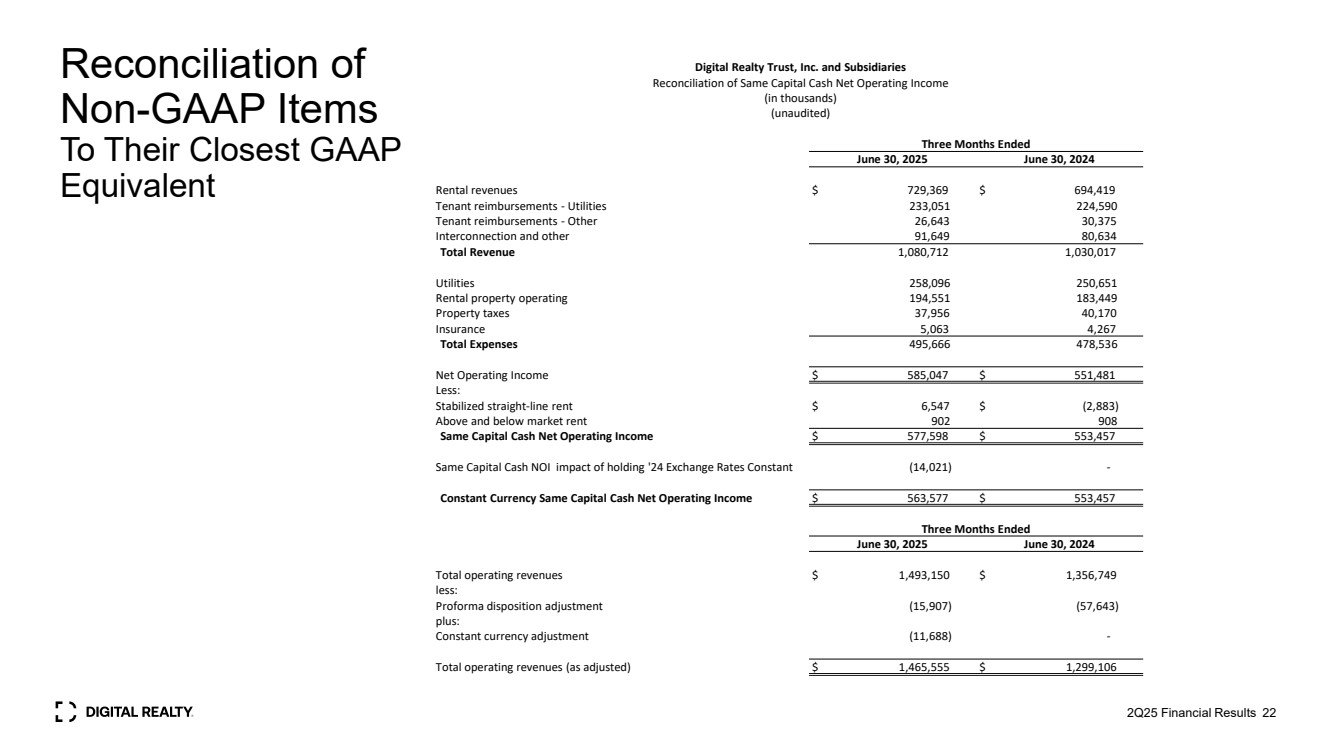
| Reconciliation of Non-GAAP Items To Their Closest GAAP Equivalent 2Q25 Financial Results 22 Digital Realty Trust, Inc. and Subsidiaries Reconciliation of Same Capital Cash Net Operating Income (in thousands) (unaudited) Three Months Ended June 30, 2025 June 30, 2024 Rental revenues $ 729,369 $ 694,419 Tenant reimbursements - Utilities 233,051 224,590 Tenant reimbursements - Other 26,643 30,375 Interconnection and other 91,649 80,634 Total Revenue 1,080,712 1,030,017 Utilities 258,096 250,651 Rental property operating 194,551 183,449 Property taxes 37,956 40,170 Insurance 5,063 4,267 Total Expenses 495,666 478,536 Net Operating Income $ 585,047 $ 551,481 Less: Stabilized straight-line rent $ 6,547 $ (2,883) Above and below market rent 902 908 Same Capital Cash Net Operating Income $ 577,598 $ 553,457 Same Capital Cash NOI impact of holding '24 Exchange Rates Constant (14,021) - Constant Currency Same Capital Cash Net Operating Income $ 563,577 $ 553,457 Three Months Ended June 30, 2025 June 30, 2024 Total operating revenues $ 1,493,150 $ 1,356,749 less: Proforma disposition adjustment (15,907) (57,643) plus: Constant currency adjustment (11,688) - Total operating revenues (as adjusted) $ 1,465,555 $ 1,299,106 |
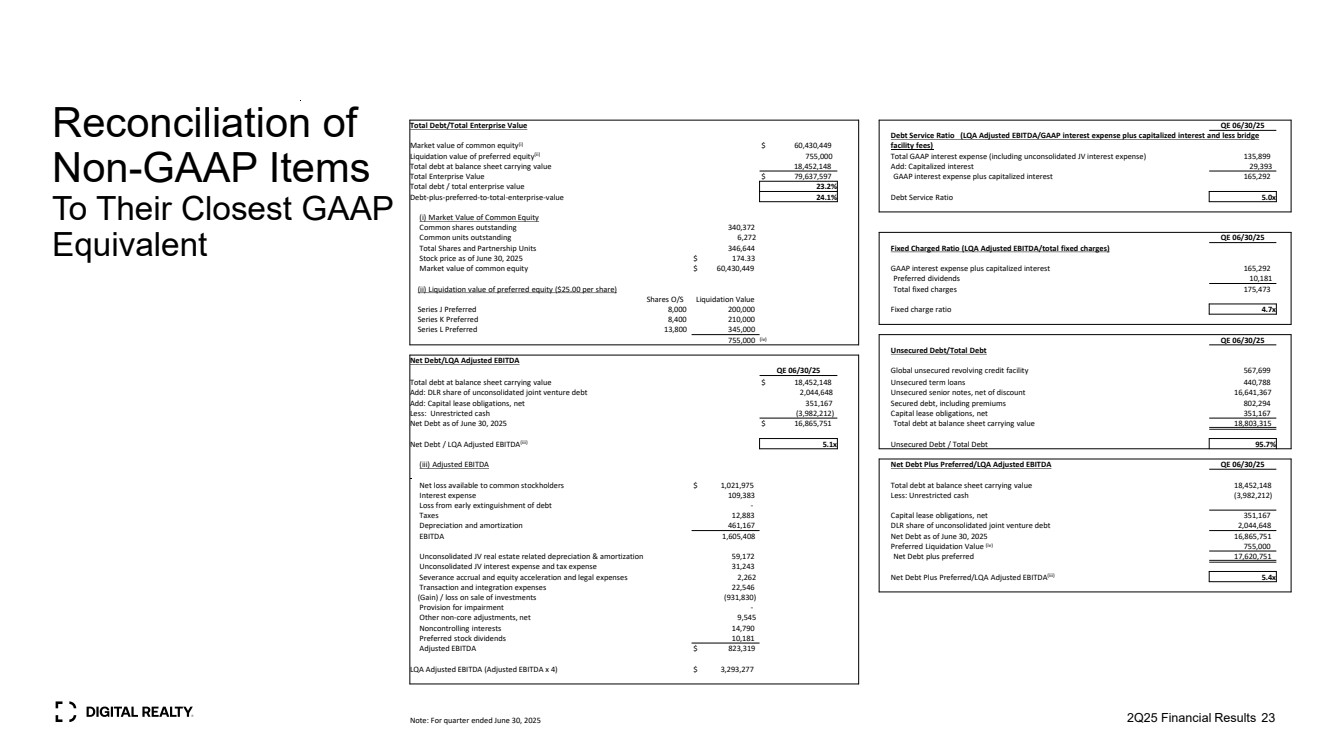
| Reconciliation of Non-GAAP Items To Their Closest GAAP Equivalent 2Q25 Financial Results 23 Total Debt/Total Enterprise Value QE 06/30/25 Market value of common equity(i) $ 60,430,449 Debt Service Ratio (LQA Adjusted EBITDA/GAAP interest expense plus capitalized interest and less bridge facility fees) Liquidation value of preferred equity(ii) 755,000 Total GAAP interest expense (including unconsolidated JV interest expense) 135,899 Total debt at balance sheet carrying value 18,452,148 Add: Capitalized interest 29,393 Total Enterprise Value $ 79,637,597 GAAP interest expense plus capitalized interest 165,292 Total debt / total enterprise value 23.2% Debt-plus-preferred-to-total-enterprise-value 24.1% Debt Service Ratio 5.0x (i) Market Value of Common Equity Common shares outstanding 340,372 Common units outstanding 6,272 QE 06/30/25 Total Shares and Partnership Units 346,644 Fixed Charged Ratio (LQA Adjusted EBITDA/total fixed charges) Stock price as of June 30, 2025 $ 174.33 Market value of common equity $ 60,430,449 GAAP interest expense plus capitalized interest 165,292 Preferred dividends 10,181 (ii) Liquidation value of preferred equity ($25.00 per share) Total fixed charges 175,473 Shares O/S Liquidation Value Series J Preferred 8,000 200,000 Fixed charge ratio 4.7x Series K Preferred 8,400 210,000 Series L Preferred 13,800 345,000 755,000 (iv) QE 06/30/25 Unsecured Debt/Total Debt Net Debt/LQA Adjusted EBITDA QE 06/30/25 Global unsecured revolving credit facility 567,699 Total debt at balance sheet carrying value $ 18,452,148 Unsecured term loans 440,788 Add: DLR share of unconsolidated joint venture debt 2,044,648 Unsecured senior notes, net of discount 16,641,367 Add: Capital lease obligations, net 351,167 Secured debt, including premiums 802,294 Less: Unrestricted cash (3,982,212) Capital lease obligations, net 351,167 Net Debt as of June 30, 2025 $ 16,865,751 Total debt at balance sheet carrying value 18,803,315 Net Debt / LQA Adjusted EBITDA(iii) 5.1x Unsecured Debt / Total Debt 95.7% (iii) Adjusted EBITDA Net Debt Plus Preferred/LQA Adjusted EBITDA QE 06/30/25 Net loss available to common stockholders $ 1,021,975 Total debt at balance sheet carrying value 18,452,148 Interest expense 109,383 Less: Unrestricted cash (3,982,212) Loss from early extinguishment of debt - Taxes 12,883 Capital lease obligations, net 351,167 Depreciation and amortization 461,167 DLR share of unconsolidated joint venture debt 2,044,648 EBITDA 1,605,408 Net Debt as of June 30, 2025 16,865,751 Preferred Liquidation Value (iv) 755,000 Unconsolidated JV real estate related depreciation & amortization 59,172 Net Debt plus preferred 17,620,751 Unconsolidated JV interest expense and tax expense 31,243 Severance accrual and equity acceleration and legal expenses 2,262 Net Debt Plus Preferred/LQA Adjusted EBITDA(iii) 5.4x Transaction and integration expenses 22,546 (Gain) / loss on sale of investments (931,830) Provision for impairment - Other non-core adjustments, net 9,545 Noncontrolling interests 14,790 Preferred stock dividends 10,181 Adjusted EBITDA $ 823,319 LQA Adjusted EBITDA (Adjusted EBITDA x 4) $ 3,293,277 Note: For quarter ended June 30, 2025 |
| Thank you |