| 1 Loan Portfolio Disclosures AS OF JUNE 30, 2025 Exhibit 99.2 |
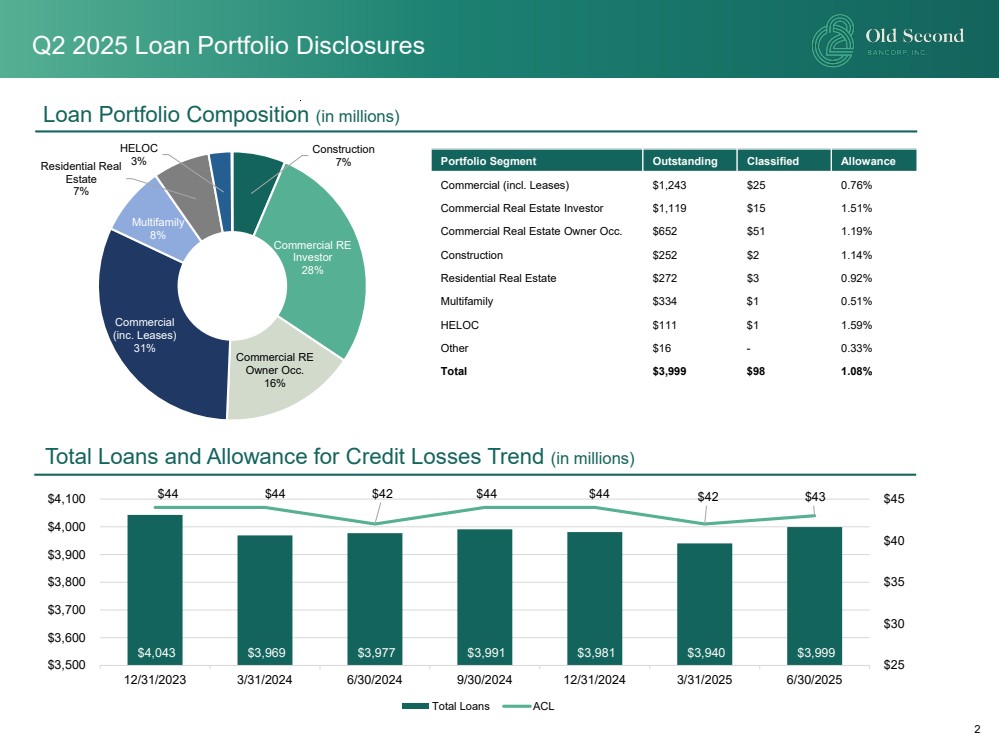
| 2 Portfolio Segment Outstanding Classified Allowance Commercial (incl. Leases) $1,243 $25 0.76% Commercial Real Estate Investor $1,119 $15 1.51% Commercial Real Estate Owner Occ. $652 $51 1.19% Construction $252 $2 1.14% Residential Real Estate $272 $3 0.92% Multifamily $334 $1 0.51% HELOC $111 $1 1.59% Other $16 - 0.33% Total $3,999 $98 1.08% Construction 7% Commercial RE Investor 28% Commercial RE Owner Occ. 16% Commercial (inc. Leases) 31% Multifamily 8% Residential Real Estate 7% HELOC 3% Loan Portfolio Composition (in millions) Q2 2025 Loan Portfolio Disclosures Total Loans and Allowance for Credit Losses Trend (in millions) $4,043 $3,969 $3,977 $3,991 $3,981 $3,940 $3,999 $44 $44 $42 $44 $44 $42 $43 $25 $30 $35 $40 $45 $3,500 $3,600 $3,700 $3,800 $3,900 $4,000 $4,100 12/31/2023 3/31/2024 6/30/2024 9/30/2024 12/31/2024 3/31/2025 6/30/2025 Total Loans ACL |
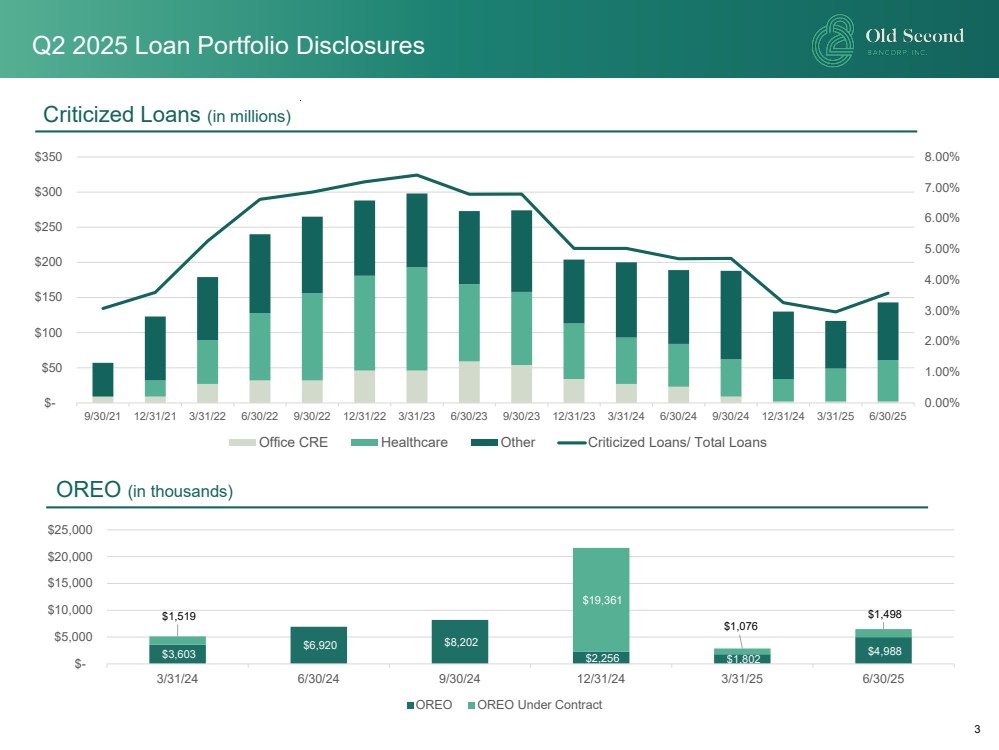
| 3 Criticized Loans (in millions) 0.00% 1.00% 2.00% 3.00% 4.00% 5.00% 6.00% 7.00% 8.00% $- $50 $100 $150 $200 $250 $300 $350 9/30/21 12/31/21 3/31/22 6/30/22 9/30/22 12/31/22 3/31/23 6/30/23 9/30/23 12/31/23 3/31/24 6/30/24 9/30/24 12/31/24 3/31/25 6/30/25 Office CRE Healthcare Other Criticized Loans/ Total Loans Q2 2025 Loan Portfolio Disclosures $3,603 $6,920 $8,202 $2,256 $1,802 $4,988 $1,519 $19,361 $1,076 $1,498 $- $5,000 $10,000 $15,000 $20,000 $25,000 3/31/24 6/30/24 9/30/24 12/31/24 3/31/25 6/30/25 OREO OREO Under Contract OREO (in thousands) |
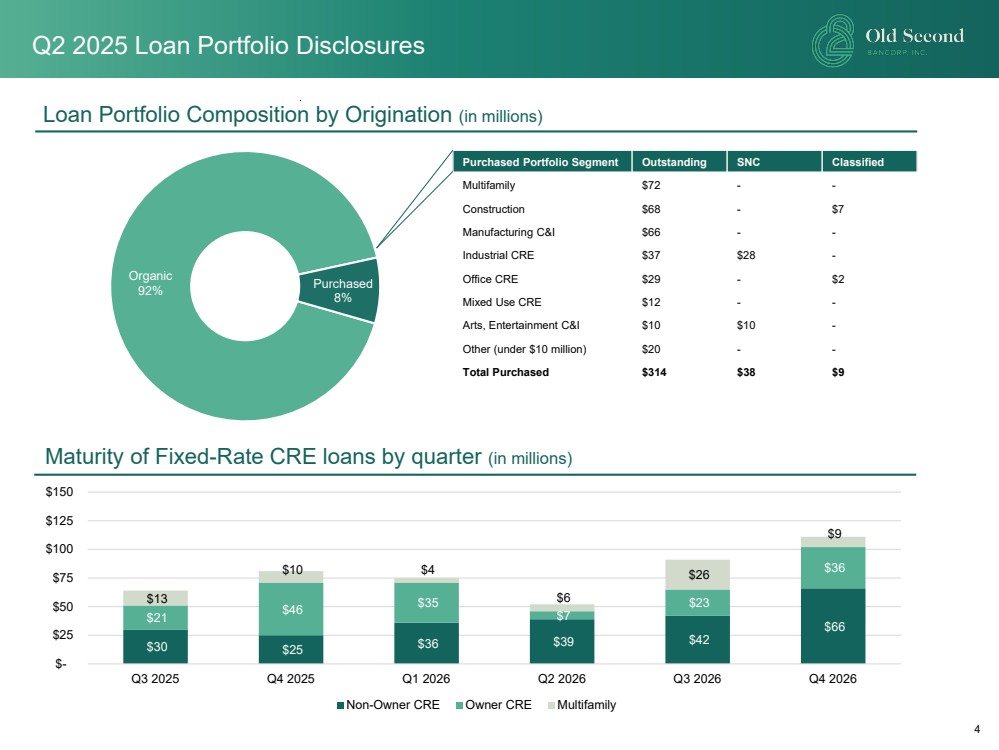
| 4 Loan Portfolio Composition by Origination (in millions) Maturity of Fixed-Rate CRE loans by quarter (in millions) Purchased Portfolio Segment Outstanding SNC Classified Multifamily $72 - - Construction $68 - $7 Manufacturing C&I $66 - - Industrial CRE $37 $28 - Office CRE $29 - $2 Mixed Use CRE $12 - - Arts, Entertainment C&I $10 $10 - Other (under $10 million) $20 - - Total Purchased $314 $38 $9 Organic 92% Purchased 8% $30 $25 $36 $39 $42 $66 $21 $46 $35 $7 $23 $36 $13 $10 $4 $6 $26 $9 $- $25 $50 $75 $100 $125 $150 Q3 2025 Q4 2025 Q1 2026 Q2 2026 Q3 2026 Q4 2026 Non-Owner CRE Owner CRE Multifamily Q2 2025 Loan Portfolio Disclosures |
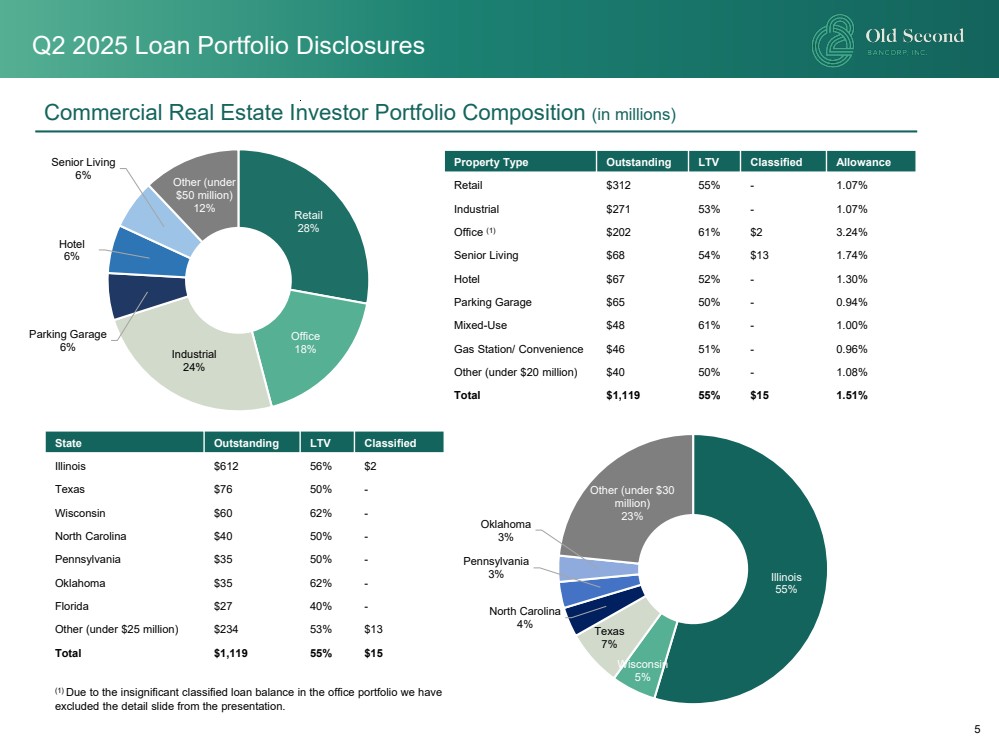
| 5 Property Type Outstanding LTV Classified Allowance Retail $312 55% - 1.07% Industrial $271 53% - 1.07% Office (1) $202 61% $2 3.24% Senior Living $68 54% $13 1.74% Hotel $67 52% - 1.30% Parking Garage $65 50% - 0.94% Mixed-Use $48 61% - 1.00% Gas Station/ Convenience $46 51% - 0.96% Other (under $20 million) $40 50% - 1.08% Total $1,119 55% $15 1.51% Commercial Real Estate Investor Portfolio Composition (in millions) Retail 28% Office 18% Industrial 24% Parking Garage 6% Hotel 6% Senior Living 6% Other (under $50 million) 12% Illinois 55% Wisconsin 5% Texas 7% North Carolina 4% Pennsylvania 3% Oklahoma 3% Other (under $30 million) 23% State Outstanding LTV Classified Illinois $612 56% $2 Texas $76 50% - Wisconsin $60 62% - North Carolina $40 50% - Pennsylvania $35 50% - Oklahoma $35 62% - Florida $27 40% - Other (under $25 million) $234 53% $13 Total $1,119 55% $15 Q2 2025 Loan Portfolio Disclosures (1) Due to the insignificant classified loan balance in the office portfolio we have excluded the detail slide from the presentation. |
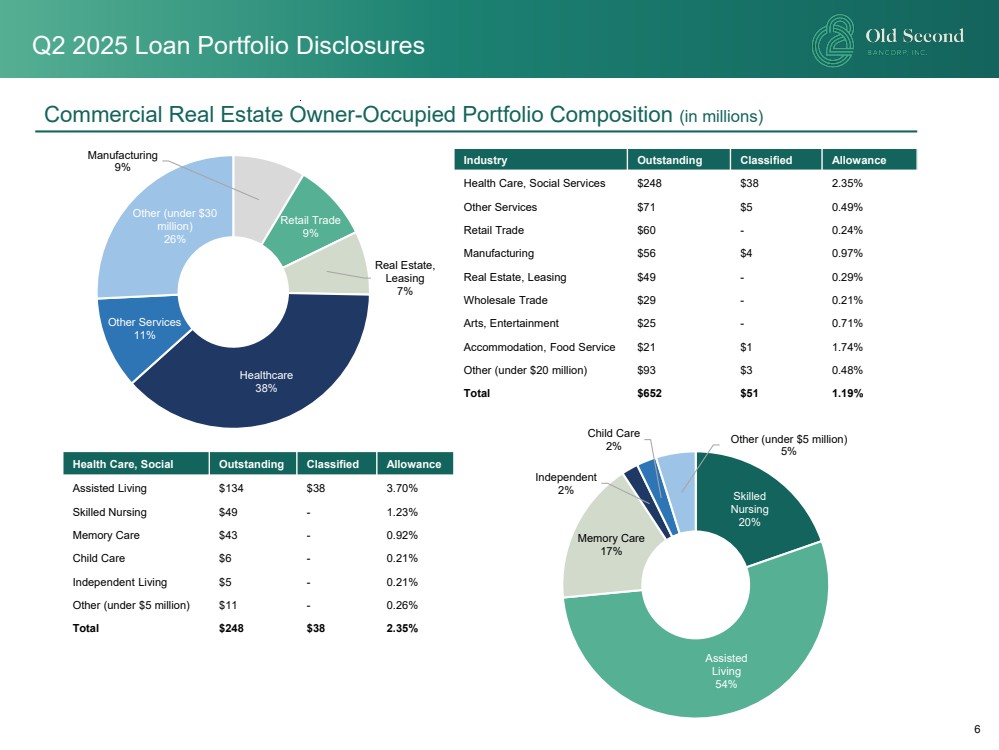
| 6 Industry Outstanding Classified Allowance Health Care, Social Services $248 $38 2.35% Other Services $71 $5 0.49% Retail Trade $60 - 0.24% Manufacturing $56 $4 0.97% Real Estate, Leasing $49 - 0.29% Wholesale Trade $29 - 0.21% Arts, Entertainment $25 - 0.71% Accommodation, Food Service $21 $1 1.74% Other (under $20 million) $93 $3 0.48% Total $652 $51 1.19% Manufacturing 9% Retail Trade 9% Real Estate, Leasing 7% Healthcare 38% Other Services 11% Other (under $30 million) 26% Commercial Real Estate Owner-Occupied Portfolio Composition (in millions) Health Care, Social Outstanding Classified Allowance Assisted Living $134 $38 3.70% Skilled Nursing $49 - 1.23% Memory Care $43 - 0.92% Child Care $6 - 0.21% Independent Living $5 - 0.21% Other (under $5 million) $11 - 0.26% Total $248 $38 2.35% Skilled Nursing 20% Assisted Living 54% Memory Care 17% Independent 2% Child Care 2% Other (under $5 million) 5% Q2 2025 Loan Portfolio Disclosures |
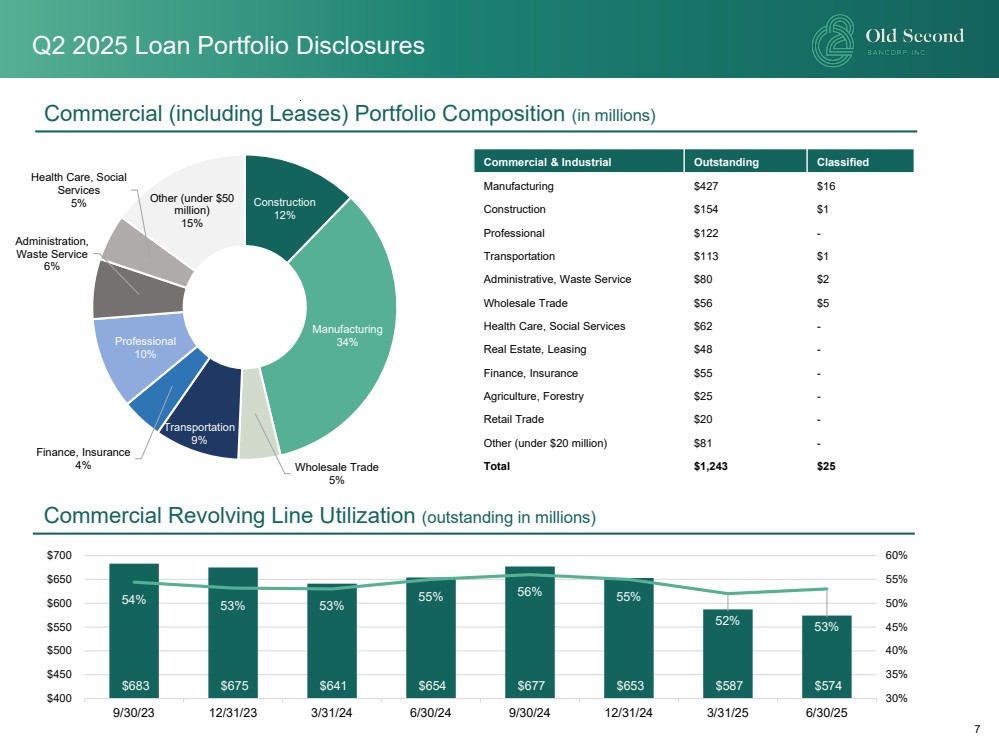
| 7 Commercial & Industrial Outstanding Classified Manufacturing $427 $16 Construction $154 $1 Professional $122 - Transportation $113 $1 Administrative, Waste Service $80 $2 Wholesale Trade $56 $5 Health Care, Social Services $62 - Real Estate, Leasing $48 - Finance, Insurance $55 - Agriculture, Forestry $25 - Retail Trade $20 - Other (under $20 million) $81 - Total $1,243 $25 Commercial (including Leases) Portfolio Composition (in millions) Construction 12% Manufacturing 34% Wholesale Trade 5% Transportation 9% Finance, Insurance 4% Professional 10% Administration, Waste Service 6% Health Care, Social Services 5% Other (under $50 million) 15% Commercial Revolving Line Utilization (outstanding in millions) $683 $675 $641 $654 $677 $653 $587 $574 54% 53% 53% 55% 56% 55% 52% 53% 30% 35% 40% 45% 50% 55% 60% $400 $450 $500 $550 $600 $650 $700 9/30/23 12/31/23 3/31/24 6/30/24 9/30/24 12/31/24 3/31/25 6/30/25 Q2 2025 Loan Portfolio Disclosures |
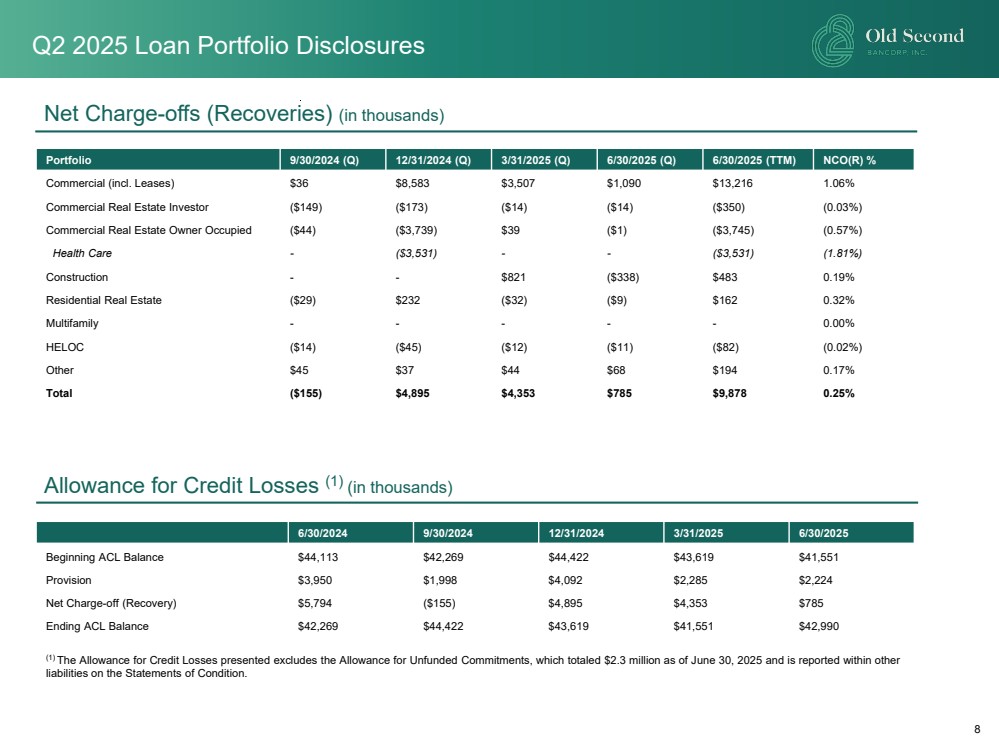
| 8 Net Charge-offs (Recoveries) (in thousands) Portfolio 9/30/2024 (Q) 12/31/2024 (Q) 3/31/2025 (Q) 6/30/2025 (Q) 6/30/2025 (TTM) NCO(R) % Commercial (incl. Leases) $36 $8,583 $3,507 $1,090 $13,216 1.06% Commercial Real Estate Investor ($149) ($173) ($14) ($14) ($350) (0.03%) Commercial Real Estate Owner Occupied ($44) ($3,739) $39 ($1) ($3,745) (0.57%) Health Care - ($3,531) - - ($3,531) (1.81%) Construction - - $821 ($338) $483 0.19% Residential Real Estate ($29) $232 ($32) ($9) $162 0.32% Multifamily - - - - - 0.00% HELOC ($14) ($45) ($12) ($11) ($82) (0.02%) Other $45 $37 $44 $68 $194 0.17% Total ($155) $4,895 $4,353 $785 $9,878 0.25% 6/30/2024 9/30/2024 12/31/2024 3/31/2025 6/30/2025 Beginning ACL Balance $44,113 $42,269 $44,422 $43,619 $41,551 Provision $3,950 $1,998 $4,092 $2,285 $2,224 Net Charge-off (Recovery) $5,794 ($155) $4,895 $4,353 $785 Ending ACL Balance $42,269 $44,422 $43,619 $41,551 $42,990 Allowance for Credit Losses (1) (in thousands) Q2 2025 Loan Portfolio Disclosures (1) The Allowance for Credit Losses presented excludes the Allowance for Unfunded Commitments, which totaled $2.3 million as of June 30, 2025 and is reported within other liabilities on the Statements of Condition. |