EXHIBIT 99.2
July 24, 2025 1 2Q 2025 Financial Results
Forward Looking Statements 2 Certain statements contained in this presentation that are not historical facts may constitute forward - looking statements within the meaning of Section 27 A of the Securities Act of 1933 , as amended, and Section 21 E of the Securities Exchange Act of 1934 , as amended, and are intended to be covered by the safe harbor provisions of the Private Securities Litigation Reform Act of 1995 . We may also make forward - looking statements in other documents we file with the Securities and Exchange Commission ("SEC"), in our annual reports to shareholders, in press releases and other written materials, and in oral statements made by our officers, directors or employees . You can identify forward looking statements by the use of the words “believe,” “expect,” “anticipate,” “intend,” “estimate,” “assume,” “outlook,” “will,” “should,” and other expressions that predict or indicate future events and trends and which do not relate to historical matters, including statements regarding the Company’s business, credit quality, financial condition, liquidity and results of operations . Forward - looking statements may differ, possibly materially, from what is included in this press release due to factors and future developments that are uncertain and beyond the scope of the Company’s control . These include, but are not limited to, changes in interest rates ; general economic conditions (including inflation and concerns about liquidity) on a national basis or in the local markets in which the Company operates ; turbulence in the capital and debt markets ; competitive pressures from other financial institutions ; changes in consumer behavior due to changing political, business and economic conditions, or legislative or regulatory initiatives ; changes in the value of securities and other assets in the Company’s investment portfolio ; increases in loan and lease default and charge - off rates ; the adequacy of allowances for loan and lease losses ; failure to complete the proposed merger with Berkshire Hills Bancorp, Inc . (“Berkshire”) or unexpected delays related to the merger or either party’s inability to satisfy closing conditions required to complete the merger ; failure to obtain necessary regulatory approvals (and the risk that such approvals may result in the imposition of conditions that could adversely affect the combined company or the expected benefits of the proposed merger) ; certain restrictions during the pendency of the proposed merger with Berkshire that may impact the Company’s ability to pursue certain business opportunities or strategic transactions ; the diversion of management’s attention from ongoing business operations and opportunities ; decreases in deposit levels that necessitate increases in borrowing to fund loans and investments ; operational risks including, but not limited to, cybersecurity incidents, fraud, natural disasters, and future pandemics ; changes in regulation ; the possibility that future credit losses may be higher than currently expected due to changes in economic assumptions and adverse economic developments ; the risk that goodwill and intangibles recorded in the Company’s financial statements will become impaired ; and changes in assumptions used in making such forward - looking statements . Forward - looking statements involve risks and uncertainties which are difficult to predict . The Company’s actual results could differ materially from those projected in the forward - looking statements as a result of, among others, the risks outlined in the Company’s Annual Report on Form 10 - K, as updated by its Quarterly Reports on Form 10 - Q and other filings submitted to the SEC . The Company does not undertake any obligation to update any forward - looking statement to reflect circumstances or events that occur after the date the forward - looking statements are made . Non - GAAP In addition to financial measures presented in accordance with U . S . generally accepted accounting principles (“GAAP”), this presentation contains certain non - GAAP financial measures, including, without limitation, operating earnings, and the ratios of tangible common equity to tangible assets . The presentation of non - GAAP financial information is not intended to be considered in isolation or as a substitute for any measure prepared in accordance with GAAP . Please see the Earnings Release for certain Non - GAAP reconciliations .
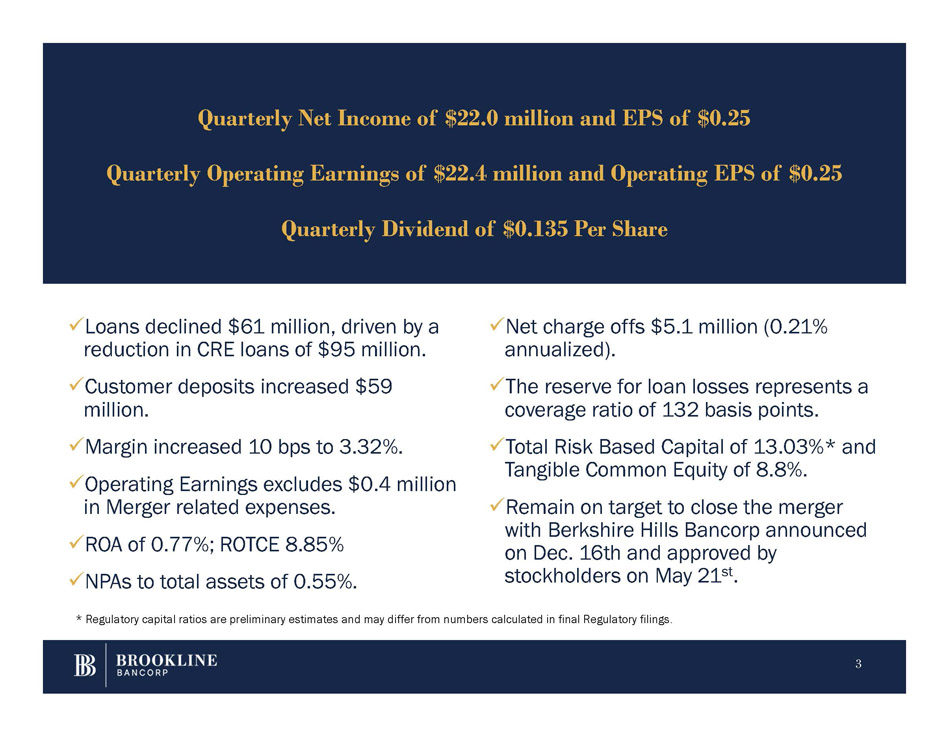
x Loans declined $61 million, driven by a reduction in CRE loans of $95 million. x Customer deposits increased $59 million. x Margin increased 10 bps to 3.32%. x Operating Earnings excludes $0.4 million in Merger related expenses. x ROA of 0.77%; ROTCE 8.85% x NPAs to total assets of 0.55%. 3 x Net charge offs $5.1 million (0.21% annualized). x The reserve for loan losses represents a coverage ratio of 132 basis points. x Total Risk Based Capital of 13.03%* and Tangible Common Equity of 8.8%. x Remain on target to close the merger with Berkshire Hills Bancorp announced on Dec. 16th and approved by stockholders on May 21 st . Quarterly Net Income of $22.0 million and EPS of $0.25 Quarterly Operating Earnings of $22.4 million and Operating EPS of $0.25 Quarterly Dividend of $0.135 Per Share * Regulatory capital ratios are preliminary estimates and may differ from numbers calculated in final Regulatory filings.
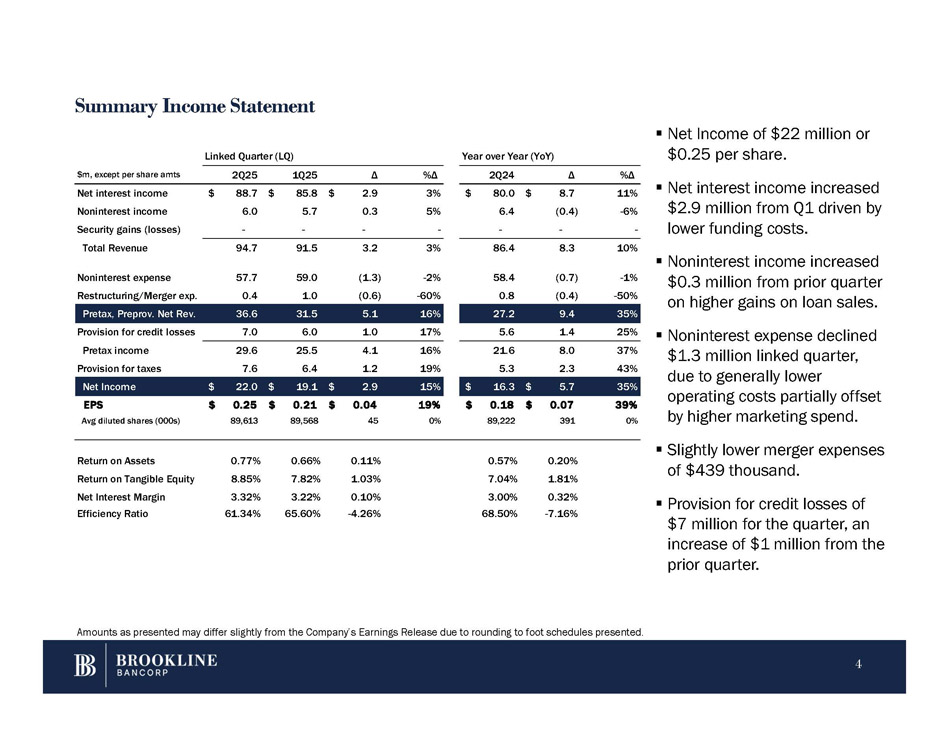
Summary Income Statement ▪ Net Income of $22 million or $0.25 per share. ▪ Net interest income increased $2.9 million from Q1 driven by lower funding costs. ▪ Noninterest income increased $0.3 million from prior quarter on higher gains on loan sales. ▪ Noninterest expense declined $1.3 million linked quarter, due to generally lower operating costs partially offset by higher marketing spend. ▪ Slightly lower merger expenses of $439 thousand. ▪ Provision for credit losses of $7 million for the quarter, an increase of $1 million from the prior quarter. %Δ Δ 2Q24 %Δ Δ 1Q25 2Q25 $m, except per share amts 11% $ 8.7 $ 80.0 3% $ 2.9 $ 85.8 $ 88.7 Net interest income - 6% (0.4) 6.4 5% 0.3 5.7 6.0 Noninterest income - - - - - - Security gains (losses) - 10% 8.3 86.4 3% 3.2 91.5 Total Revenue 94.7 - 1% (0.7) 58.4 - 2% (1.3) 59.0 Noninterest expense 57.7 - 50% (0.4) 0.8 - 60% (0.6) 1.0 0.4 Restructuring/Merger exp. 35% 9.4 27.2 16% 5.1 31.5 36.6 Pretax, Preprov. Net Rev. 25% 1.4 5.6 17% 1.0 6.0 7.0 Provision for credit losses 37% 8.0 21.6 16% 4.1 25.5 29.6 Pretax income 43% 2.3 5.3 19% 1.2 6.4 7.6 Provision for taxes 35% $ 5.7 $ 16.3 15% $ 2.9 $ 19.1 $ 22.0 Net Income 39% $ 0.07 $ 0.18 19% $ 0.04 $ 0.21 $ 0.25 EPS 0% 391 89,222 0% 45 89,568 89,613 Avg diluted shares (000s) 0.20% 0.57% 0.11% 0.66% 0.77% Return on Assets 1.81% 7.04% 1.03% 7.82% 8.85% Return on Tangible Equity 0.32% 3.00% 0.10% 3.22% 3.32% Net Interest Margin - 7.16% 68.50% - 4.26% 65.60% 61.34% Efficiency Ratio Linked Quarter (LQ) Year over Year (YoY) Amounts as presented may differ slightly from the Company’s Earnings Release due to rounding to foot schedules presented. 4
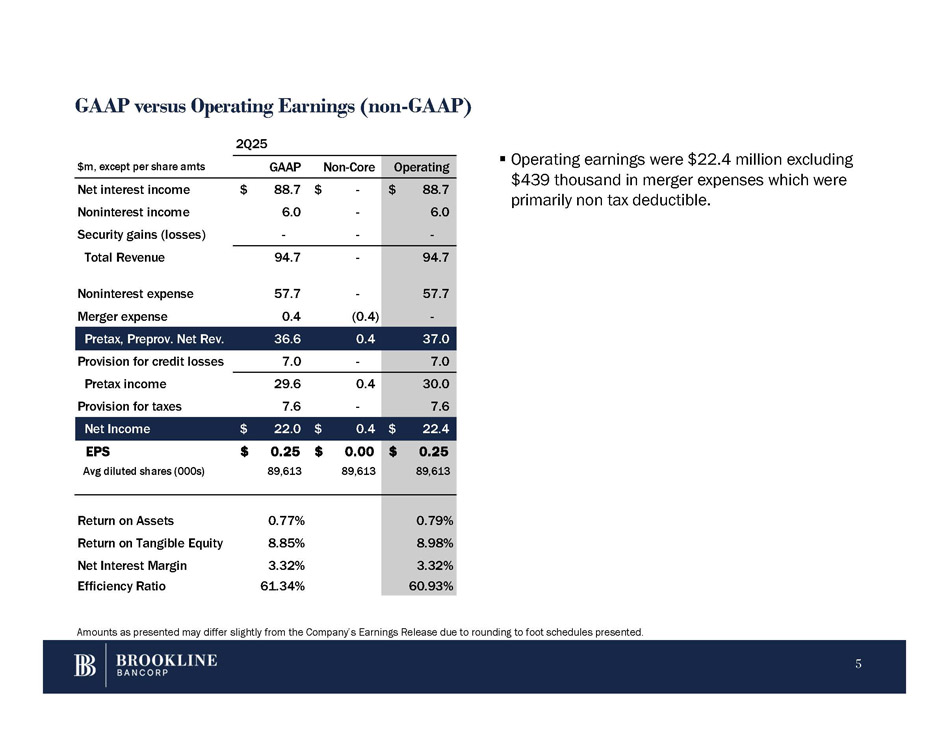
GAAP versus Operating Earnings (non - GAAP) Amounts as presented may differ slightly from the Company’s Earnings Release due to rounding to foot schedules presented. 5 ▪ Operating earnings were $22.4 million excluding $439 thousand in merger expenses which were primarily non tax deductible. Operating Non - Core GAAP $m, except per share amts $ 88.7 $ - $ 88.7 Net interest income 6.0 6.0 - Noninterest income - - - Security gains (losses) 94.7 94.7 - Total Revenue 57.7 57.7 - Noninterest expense - (0.4) 0.4 Merger expense 37.0 0.4 36.6 Pretax, Preprov. Net Rev. 7.0 7.0 - Provision for credit losses 30.0 0.4 29.6 Pretax income 7.6 7.6 - Provision for taxes $ 22.4 $ 0.4 $ 22.0 Net Income $ 0.25 $ 0.00 $ 0.25 EPS 89,613 89,613 89,613 Avg diluted shares (000s) 0.79% 0.77% Return on Assets 8.98% 8.85% Return on Tangible Equity 3.32% 3.32% Net Interest Margin 60.93% 61.34% Efficiency Ratio 2Q25
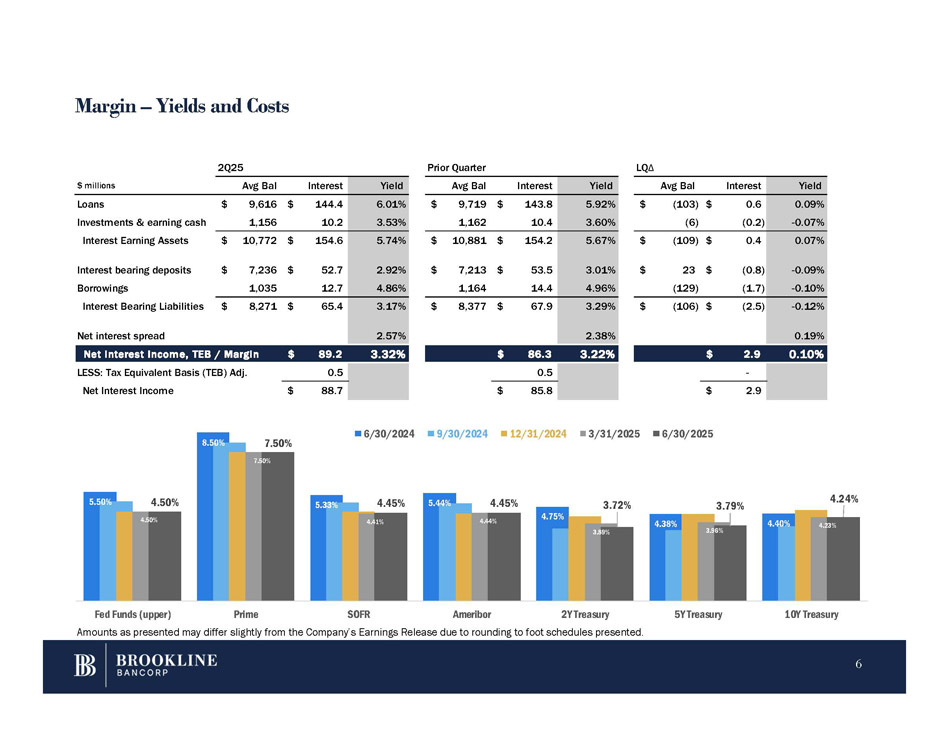
Margin – Yields and Costs LQ Δ Prior Quarter 2Q25 Yield Interest Avg Bal Yield Interest Avg Bal Yield Interest Avg Bal $ millions 0.09% $ 0.6 $ (103) 5.92% $ 143.8 $ 9,719 6.01% $ 144.4 $ 9,616 Loans - 0.07% (0.2) (6) 3.60% 10.4 1,162 3.53% 10.2 1,156 Investments & earning cash 0.07% $ 0.4 $ (109) 5.67% $ 154.2 $ 10,881 5.74% $ 154.6 $ 10,772 Interest Earning Assets - 0.09% $ (0.8) $ 23 3.01% $ 53.5 $ 7,213 2.92% $ 52.7 $ 7,236 Interest bearing deposits - 0.10% (1.7) (129) 4.96% 14.4 1,164 4.86% 12.7 1,035 Borrowings - 0.12% $ (2.5) $ (106) 3.29% $ 67.9 $ 8,377 3.17% $ 65.4 $ 8,271 Interest Bearing Liabilities 0.19% 2.38% 2.57% Net interest spread 0.10% $ 2.9 3.22% $ 86.3 3.32% $ 89.2 Net interest income, TEB / Margin - 0.5 0.5 LESS: Tax Equivalent Basis (TEB) Adj. 2.9 $ 85.8 $ 88.7 $ Net Interest Income 5.50% 8.50% 5.33% 5.44% 4.75% 4.38% 4.40% 4.50% 7.50% 4.41% 4.44% 3.89 % 3.96% 4.23% 4.50% 7.50% 4.45% 4.45% 3.72% 3.79% 4.24% Fed Funds (upper) Prime SOFR Ameribor 2Y Treasury 5Y Treasury 10Y Treasury 6/30/2024 9/30/2024 12/31/2024 3/31/2025 6/30/2025 Amounts as presented may differ slightly from the Company’s Earnings Release due to rounding to foot schedules presented. 6
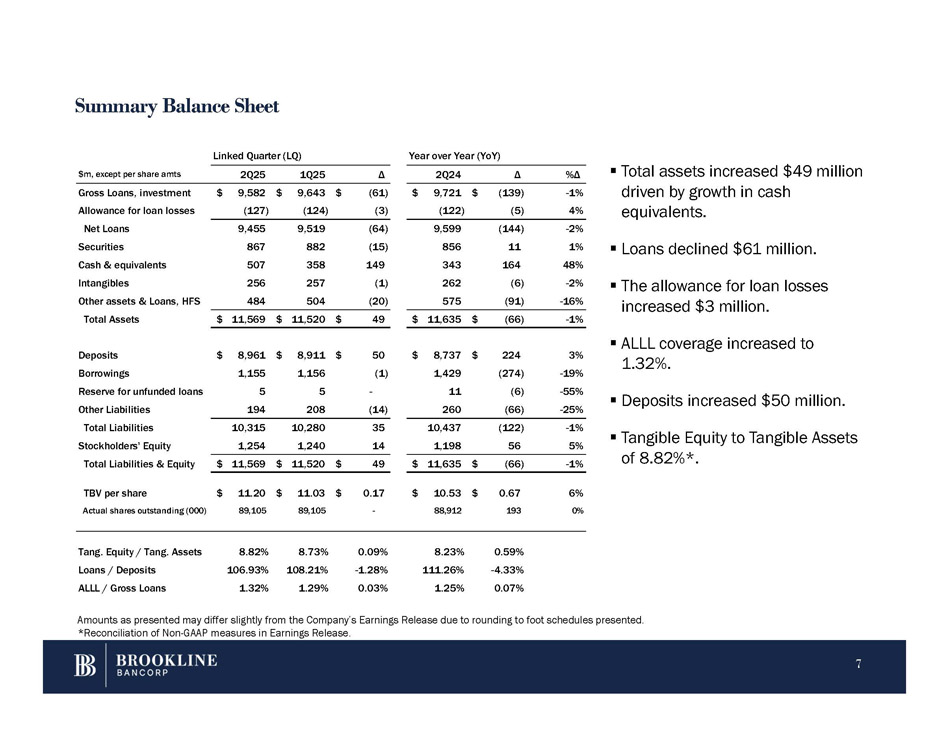
Summary Balance Sheet ▪ Total assets increased $4 %Δ Δ 2Q24 Δ 1Q25 2Q25 $m, except per share amts driven by growth in cash - 1% $ (139) $ 9,721 $ (61) $ 9,643 $ 9,582 Gross Loans, investment equivalents. 4% (5) (122) (3) (124) (127) Allowance for loan losses - 2% (144) 9,599 (64) 9,519 9,455 Net Loans 9 million ▪ Loans declined $61 million. ▪ The allowance for loan losses increased $3 million. ▪ ALLL coverage increased to 1.32%. ▪ Deposits increased $50 million. ▪ Tangible Equity to Tangible Assets of 8.82%*. 1% 11 856 (15) 882 867 Securities 48% 164 343 149 358 507 Cash & equivalents - 2% (6) 262 (1) 257 256 Intangibles - 16% (91) 575 (20) 504 484 Other assets & Loans, HFS Total Assets $ 11,569 $ 11,520 $ 49 $ 11,635 $ (66) - 1% 3% $ 224 $ 8,737 $ 50 $ 8,911 $ 8,961 Deposits - 19% (274) 1,429 (1) 1,156 1,155 Borrowings - 55% (6) Reserve for unfunded loans 5 5 - 11 - 25% (66) 260 (14) 208 194 Other Liabilities - 1% (122) 10,437 35 10,280 10,315 Total Liabilities 5% 56 1,198 14 1,240 1,254 Stockholders' Equity - 1% $ (66) $ 11,635 $ 49 $ 11,520 $ 11,569 Total Liabilities & Equity 6% $ 0.67 $ 10.53 $ 0.17 $ 11.03 $ 11.20 TBV per share 0% 193 88,912 - 89,105 89,105 Actual shares outstanding (000) 0.59% 8.23% 0.09% 8.73% 8.82% Tang. Equity / Tang. Assets - 4.33% 111.26% - 1.28% 108.21% 106.93% Loans / Deposits 0.07% 1.25% 0.03% 1.29% 1.32% ALLL / Gross Loans Linked Quarter (LQ) Year over Year (YoY) Amounts as presented may differ slightly from the Company’s Earnings Release due to rounding to foot schedules presented. *Reconciliation of Non - GAAP measures in Earnings Release. 7
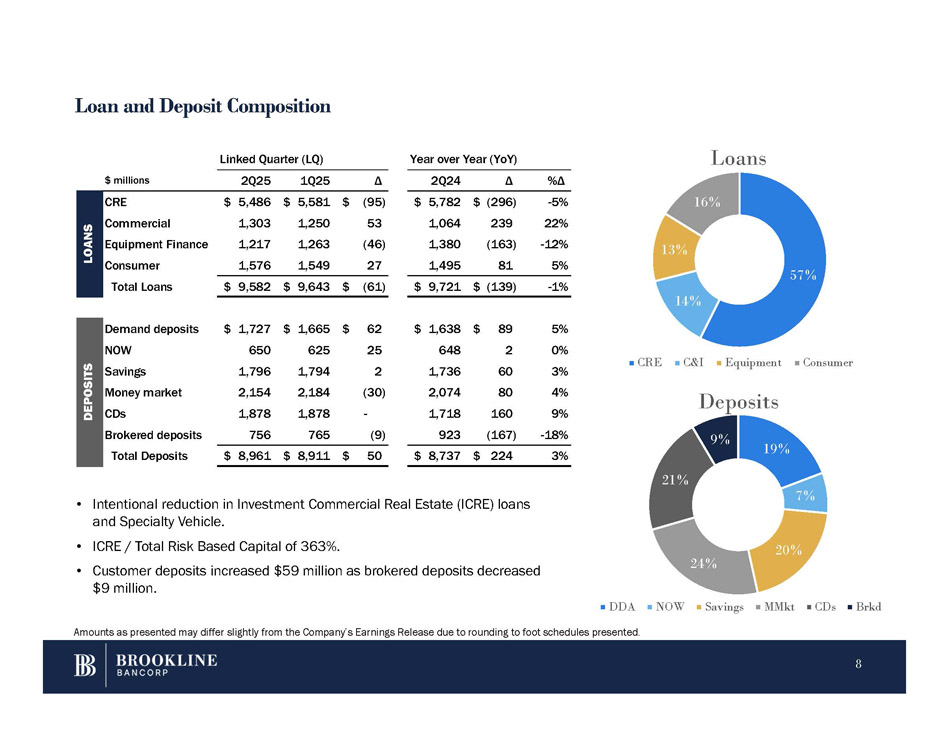
Loan and Deposit Composition 16% 13% 57% 14% Loans 19% 7% 20% 24% 9% CRE C&I Equipment Consumer Deposits DDA Amounts as presented may differ slightly from the Company’s Earnings Release due to rounding to foot schedules presented. NOW Savings MMkt CDs Brkd %Δ Δ 2Q24 Δ 1Q25 2Q25 $ millions - 5% $ (296) $ 5,782 $ (95) $ 5,581 $ 5,486 CRE 22% 239 1,064 53 1,250 1,303 Commercial S - 12% (163) 1,380 (46) 1,263 1,217 Equipment Finance OA N 5% 81 1,495 27 1,549 1,576 Consumer L - 1% (139) $ 9,721 $ (61) $ 9,643 $ 9,582 $ Total Loans 5% $ 89 $ 1,638 $ 62 $ 1,665 $ 1,727 Demand deposits 0% 2 648 25 625 650 NOW 3% 60 1,736 2 1,794 1,796 Savings 4% 80 2,074 (30) 2,184 2,154 Money market 9% 160 1,718 - 1,878 1,878 CDs 8 - 18% (167) 923 (9) 765 756 Brokered deposits 3% $ 224 $ 8,737 $ 50 $ 8,911 $ 8,961 Total Deposits 21% Linked Quarter (LQ) Year over Year (YoY) DEPOSITS • Intentional reduction in Investment Commercial Real Estate (ICRE) loans and Specialty Vehicle. • ICRE / Total Risk Based Capital of 363%. • Customer deposits increased $59 million as brokered deposits decreased $9 million.
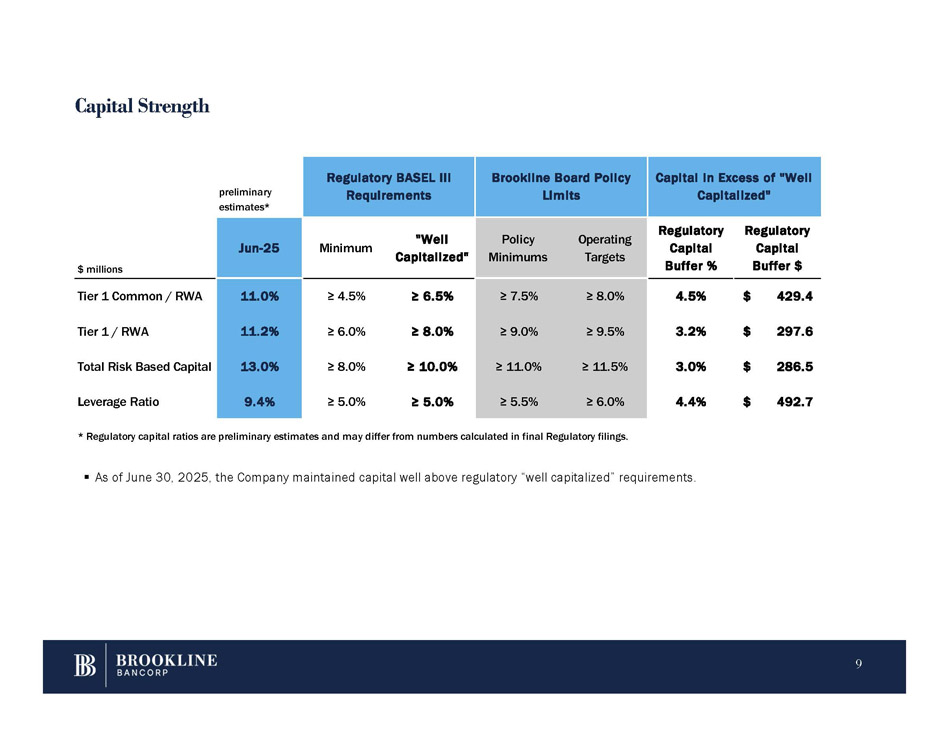
Capital Strength 9 * Regulatory capital ratios are preliminary estimates and may differ from numbers calculated in final Regulatory filings. ▪ As of June 30, 2025, the Company maintained capital well above regulatory “well capitalized” requirements. Capital in Excess of "Well Capitalized" Brookline Board Policy Limits Regulatory BASEL III Requirements preliminary estimates* Regulatory Capital Buffer $ Regulatory Capital Buffer % Operating Targets Policy Minimums "Well Capitalized" Minimum Jun - 25 $ millions $ 429.4 4.5% ≥ 8.0% ≥ 7.5% ≥ 6.5% ≥ 4.5% 11.0% Tier 1 Common / RWA $ 297.6 3.2% ≥ 9.5% ≥ 9.0% ≥ 8.0% ≥ 6.0% 11.2% Tier 1 / RWA $ 286.5 3.0% ≥ 11.5% ≥ 11.0% ≥ 10.0% ≥ 8.0% 13.0% Total Risk Based Capital $ 492.7 4.4% ≥ 6.0% ≥ 5.5% ≥ 5.0% ≥ 5.0% 9.4% Leverage Ratio
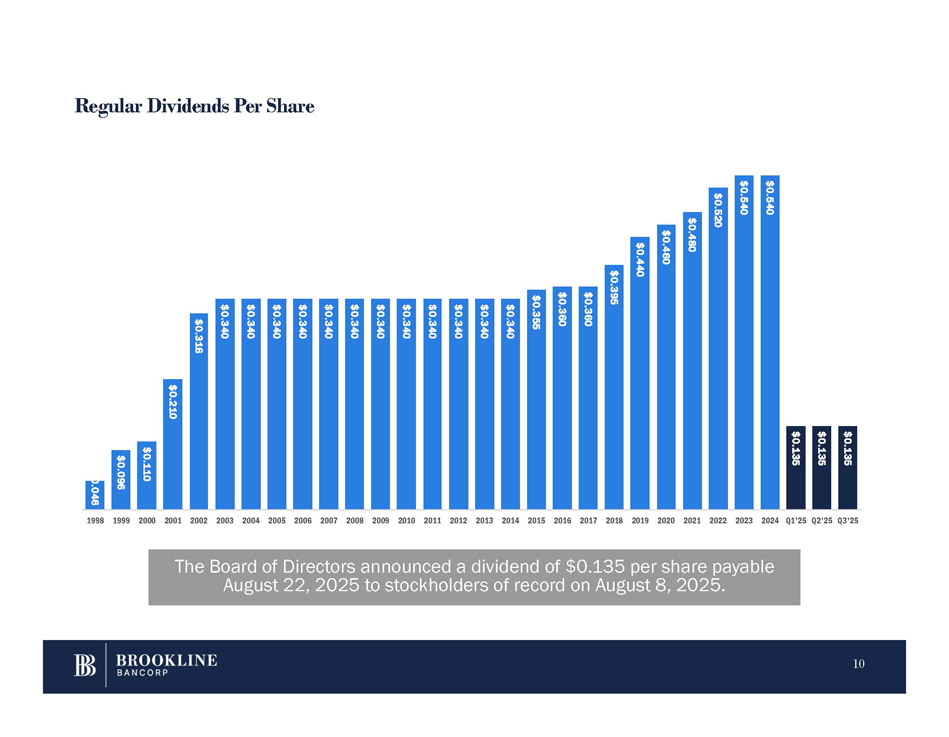
Regular Dividends Per Share The Board of Directors announced a dividend of $0.135 per share payable August 22, 2025 to stockholders of record on August 8, 2025. $0.046 10 $0.096 $0.110 $0.210 $0.316 $0.340 $0.340 $0.340 $0.340 $0.340 $0.340 $0.340 $0.340 $0.340 $0.340 $0.340 $0.340 $0.355 $0.360 $0.360 $0.395 $0.440 $0.460 $0.480 $0.520 $0.540 $0.540 $0.135 $0.135 $0.135 1998 1999 2000 2001 2002 2003 2004 2005 2006 2007 2008 2009 2010 2011 2012 2013 2014 2015 2016 2017 2018 2019 2020 2021 2022 2023 2024 Q1'25 Q2'25 Q3'25
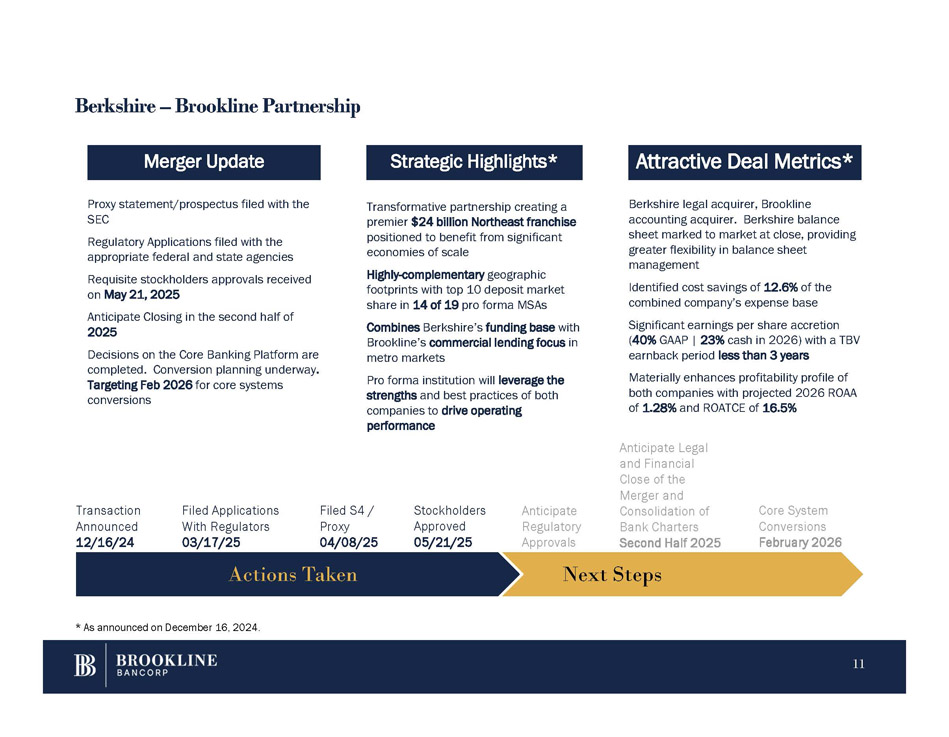
Strategic Highlights* Merger Update Attractive Deal Metrics* Transformative partnership creating a premier $24 billion Northeast franchise positioned to benefit from significant economies of scale Highly - complementary geographic footprints with top 10 deposit market share in 14 of 19 pro forma MSAs Combines Berkshire’s funding base with Brookline’s commercial lending focus in metro markets Pro forma institution will leverage the strengths and best practices of both companies to drive operating performance Proxy statement/prospectus filed with the SEC Regulatory Applications filed with the appropriate federal and state agencies Requisite stockholders approvals received on May 21, 2025 Anticipate Closing in the second half of 2025 Decisions on the Core Banking Platform are completed. Conversion planning underway. Targeting Feb 2026 for core systems conversions Berkshire legal acquirer, Brookline accounting acquirer. Berkshire balance sheet marked to market at close, providing greater flexibility in balance sheet management Identified cost savings of 12.6% of the combined company’s expense base Significant earnings per share accretion (40% GAAP | 23% cash in 2026) with a TBV earnback period less than 3 years Materially enhances profitability profile of both companies with projected 2026 ROAA of 1.28% and ROATCE of 16.5% Berkshire – Brookline Partnership Next Steps Actions Taken 11 Anticipate Legal and Financial Close of the Core System Merger and Consolidation of Anticipate Stockholders Filed S4 / Filed Applications Transaction Conversions Bank Charters Regulatory Approved Proxy With Regulators Announced February 2026 Second Half 2025 Approvals 05/21/25 04/08/25 03/17/25 12/16/24 * As announced on December 16, 2024.
QUESTIONS Paul A. Perrault, Chairman and Chief Executive Officer Carl M. Carlson, Co - President, Chief Financial and Strategy Officer Thank You. 12
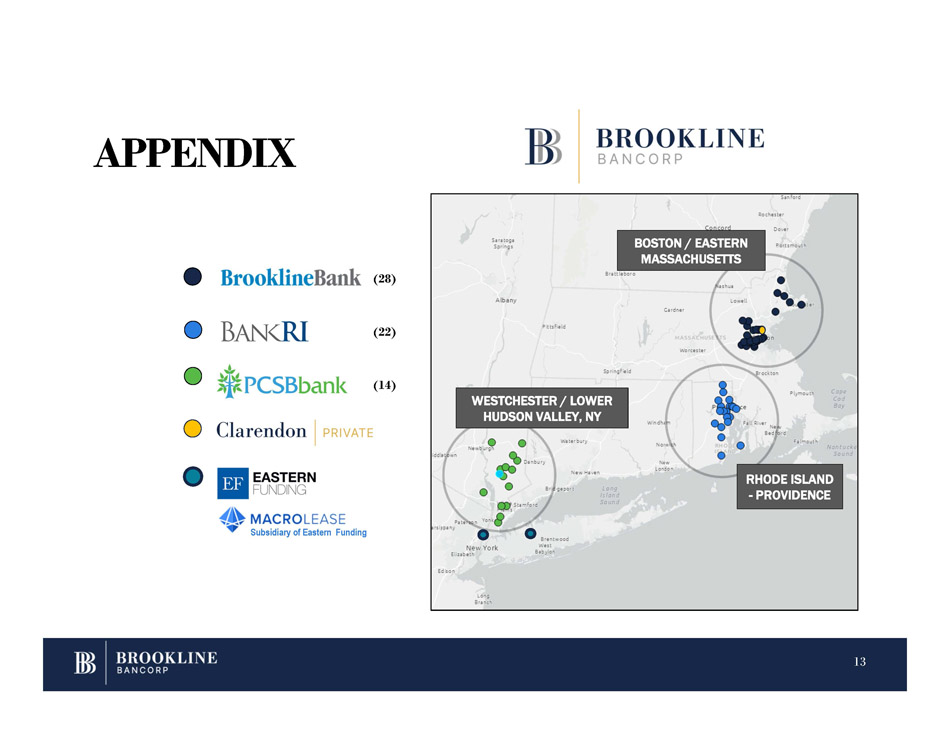
APPENDIX RHODE ISLAND - PROVIDENCE BOSTON / EASTERN MASSACHUSETTS (14) WESTCHESTER / LOWER HUDSON VALLEY, NY (28) (22) Subsidiary of Eastern Funding 13
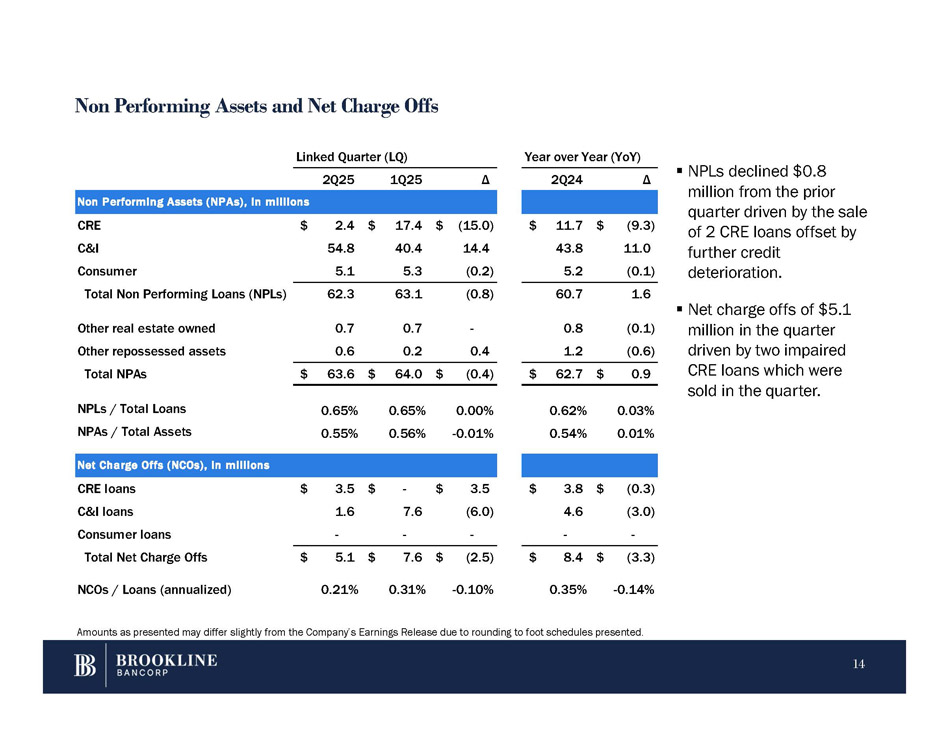
Non Performing Assets and Net Charge Offs Δ 2Q24 Δ 1Q25 2Q25 ons Non Performing Assets (NPAs), in milli $ (9.3) $ 11.7 $ (15.0) $ 17.4 $ 2.4 CRE 11.0 43.8 14.4 40.4 54.8 C&I (0.1) 5.2 (0.2) 5.3 5.1 Consumer 1.6 60.7 (0.8) 63.1 62.3 Total Non Performing Loans (NPLs) million in the quarter (0.1) 0.8 - 0.7 0.7 Other real estate owned driven by two impaired (0.6) 1.2 0.4 0.2 0.6 Other repossessed assets CRE loans which were sold in the quarter. $ 0.9 $ 62.7 $ (0.4) $ 64.0 Total NPAs $ 63.6 0.03% 0.62% 0.00% 0.65% 0.65% NPLs / Total Loans 0.01% 0.54% - 0.01% 0.56% 0.55% NPAs / Total Assets Net Charge Offs (NCOs), in millions $ (0.3) $ 3.8 $ 3.5 $ - $ 3.5 CRE loans (3.0) 4.6 (6.0) 7.6 1.6 C&I loans - - - - - Consumer loans $ (3.3) $ 8.4 $ (2.5) $ 7.6 $ 5.1 Total Net Charge Offs - 0.14% 0.35% - 0.10% 0.31% 0.21% NCOs / Loans (annualized) Linked Quarter (LQ) Year over Year (YoY) Amounts as presented may differ slightly from the Company’s Earnings Release due to rounding to foot schedules presented. 14 ▪ NPLs declined $0.8 million from the prior quarter driven by the sale of 2 CRE loans offset by further credit deterioration. ▪ Net charge offs of $5.1
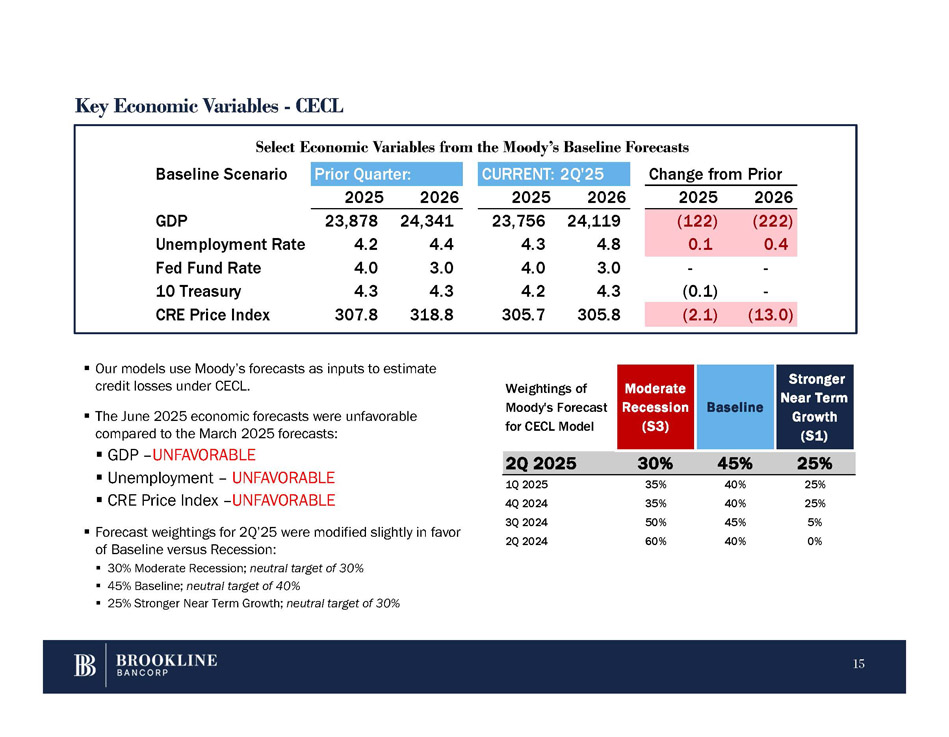
Key Economic Variables - CECL Select Economic Variables from the Moody’s Baseline Forecasts ▪ Our models use Moody’s forecasts as inputs to estimate credit losses under CECL. 15 ▪ The June 2025 economic forecasts were unfavorable compared to the March 2025 forecasts: ▪ GDP – UNFAVORABLE ▪ Unemployment – UNFAVORABLE ▪ CRE Price Index – UNFAVORABLE ▪ Forecast weightings for 2Q’25 were modified slightly in favor of Baseline versus Recession: ▪ 30% Moderate Recession; neutral target of 30% ▪ 45% Baseline; neutral target of 40% ▪ 25% Stronger Near Term Growth; neutral target of 30% Stronger Near Term Growth (S1) Baseline Moderate Recession (S3) Weightings of Moody's Forecast for CECL Model 2Q 2025 30% 45% 25% 25% 40% 35% 1Q 2025 25% 40% 35% 4Q 2024 5% 45% 50% 3Q 2024 0% 40% 60% 2Q 2024 Change from Prior CURRENT: 2Q'25 Prior Quarter: Baseline Scenario 2026 2025 2026 2025 2026 2025 (222) (122) 24,119 23,756 24,341 23,878 GDP 0.4 0.1 4.8 4.3 4.4 4.2 Unemployment Rate - - 3.0 4.0 3.0 4.0 Fed Fund Rate - (0.1) 4.3 4.2 4.3 4.3 10 Treasury (13.0) (2.1) 305.8 305.7 318.8 307.8 CRE Price Index
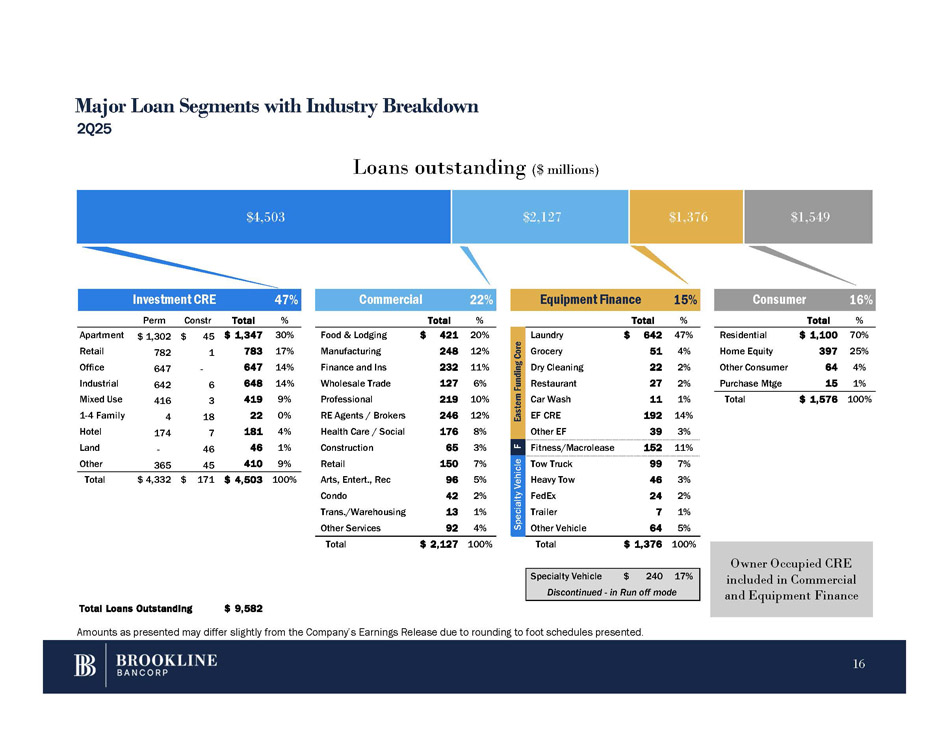
Total $ 2,127 100% Total $ 1,376 100% 16% Consumer 15% Equipment Finance 22% Commercial 47% Investment CRE % Total % Total % Total % Perm Constr Total 70% $ 1,100 Residential 20% Food & Lodging $ 421 30% 45 $ 1,347 $ $ 1,302 Apartment 25% 397 Home Equity 12% Manufacturing 248 17% 1 783 782 Retail 4% 64 Other Consumer 11% Finance and Ins 232 14% 647 - 647 Office 1% 15 Purchase Mtge 6% Wholesale Trade 127 14% 6 648 642 Industrial 100% $ 1,576 Total 10% Professional 219 9% 3 419 416 Mixed Use 12% RE Agents / Brokers 246 0% 18 22 4 1 - 4 Family 8% Health Care / Social 176 4% 7 181 174 Hotel 3% Construction 65 1% 46 46 - Land 7% Retail 150 9% 45 410 365 Other 5% Arts, Entert., Rec 96 100% $ 171 $ 4,503 $ 4,332 Total 2% Condo 42 1% Trans./Warehousing 13 4% Other Services 92 47% $ 642 Laundry Eastern Funding Core 4% 51 Grocery 2% 22 Dry Cleaning 2% 27 Restaurant 1% 11 Car Wash 14% 192 EF CRE 3% 39 Other EF 11% 152 Fitness/Macrolease F 7% 99 Tow Truck Specialty Vehicle 3% 46 Heavy Tow 2% 24 FedEx 1% 7 Trailer 5% 64 Other Vehicle Specialty Vehicle $ 240 17% Discontinued - in Run off mode Total Loans Outstanding $ 9,582 Amounts as presented may differ slightly from the Company’s Earnings Release due to rounding to foot schedules presented. Major Loan Segments with Industry Breakdown 2Q25 $4,503 $2,127 $1,376 $1,549 Loans outstanding ($ millions) Owner Occupied CRE included in Commercial and Equipment Finance 16
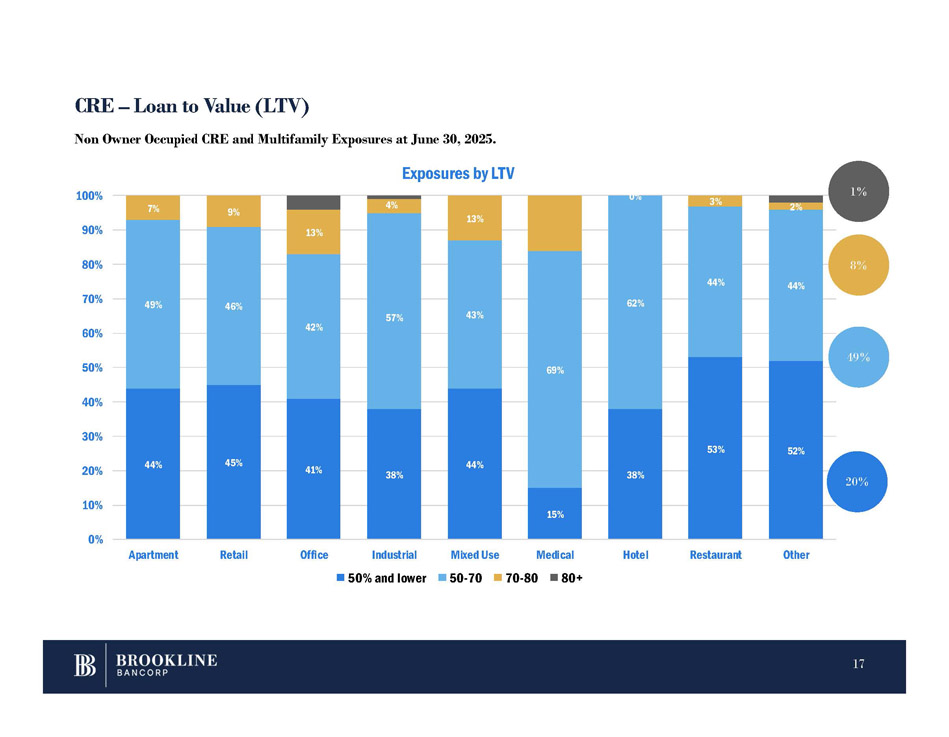
CRE – Loan to Value (LTV) 44% 45% 41% 38% 44% 15% 38% 53% 52% 49% 46% 42% 57% 43% 69% 62% 44% 44% 7% 9% 13% 4% 13% 0% 3% 2% 0% 10% 20% 30% 40% 50% 60% 70% 80% 90% 100% Apartment Retail Office Industrial 50% and lower Mixed Use 50 - 70 Medical Hotel Restaurant Other Non Owner Occupied CRE and Multifamily Exposures at June 30, 2025. Exposures by LTV 70 - 80 80+ 20% 49% 1% 8% 17
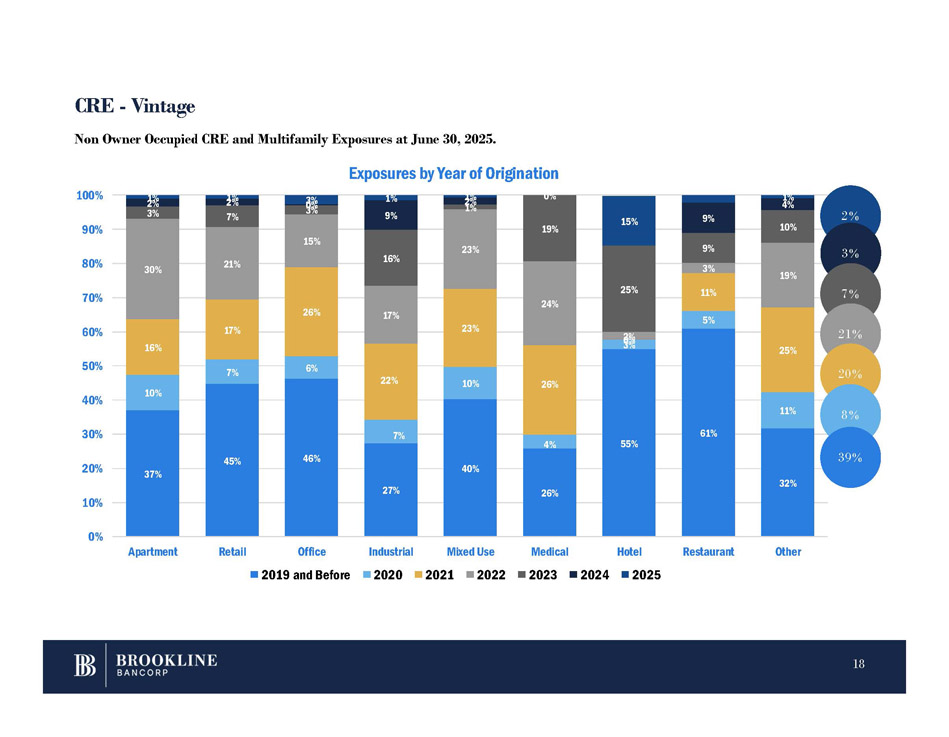
37% 45% 46% 27% 40% 26% 55% 61% 32% 10% 7% 6% 7% 10% 4% 3% 5% 11% 16% 17% 26% 22% 23% 26% 11% 25% 30% 21% 15% 17% 23% 24% 2 0 % 3% 19% 3% 7% 16% 1% 25% 9% 10% 0 3 % 9% 0% 19% 9% 4% 1 2 % 1 2 % 3% 1% 1 2 % 15% 1% 0% 10% 20% 30% 40% 50% 60% 70% 80% 90% 100% Apartment Retail Office 2019 and Before Restaurant Other Non Owner Occupied CRE and Multifamily Exposures at June 30, 2025. Exposures by Year of Origination Industrial Mixed Use Medical Hotel 2020 2021 2022 2023 2024 2025 2 % CRE - Vintage 3 % 7 % 21 % 20 % 8 % 39 % 18
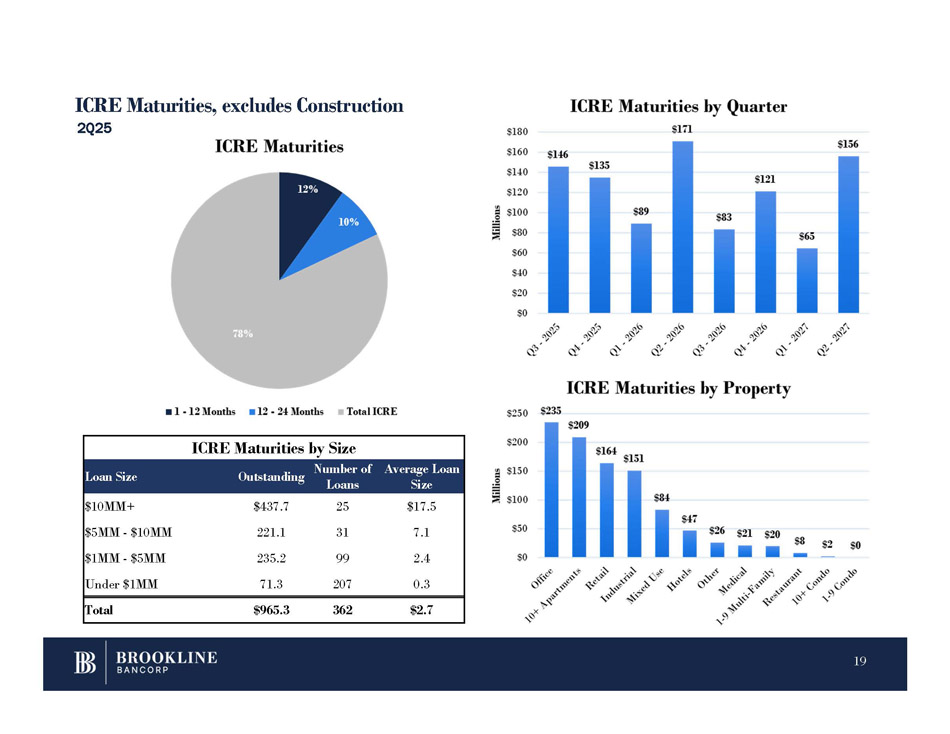
ICRE Maturities, excludes Construction 2Q25 ICRE Maturities by Size Average Loan Size Number of Loans Outstanding Loan Size $17.5 25 $437.7 $10MM+ 7.1 31 221.1 $5MM - $10MM 2.4 99 235.2 $1MM - $5MM 0.3 207 71.3 Under $1MM $2.7 362 $965.3 Total 19
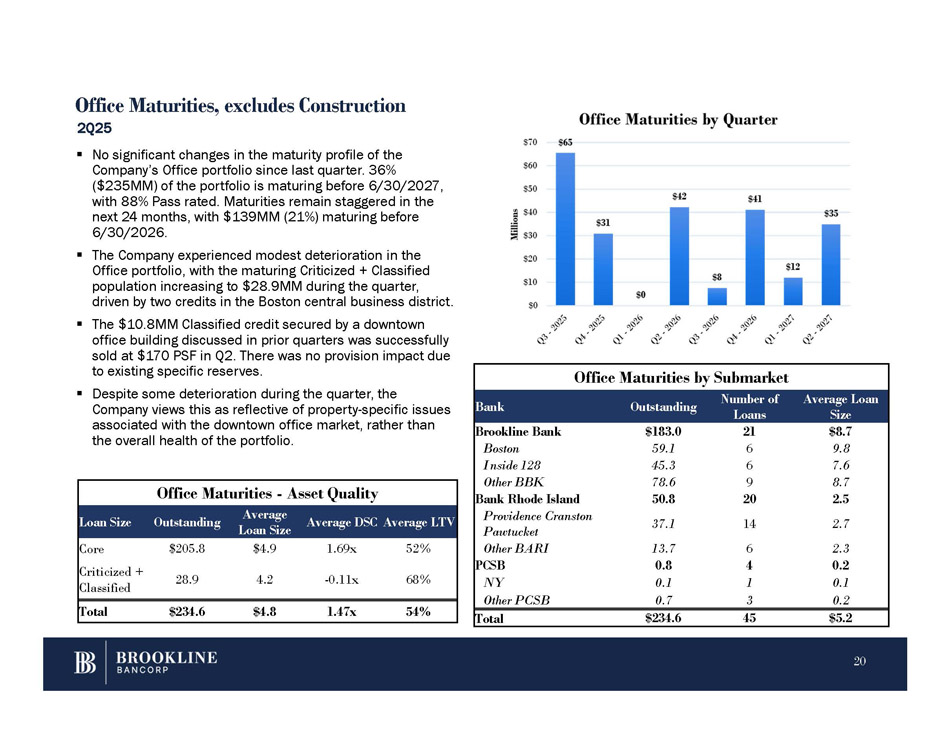
Office Maturities, excludes Construction Office Maturities by Submarket Average Loan Size Number of Loans Outstanding Bank $8.7 21 $183.0 Brookline Bank 9.8 6 59.1 Boston 7.6 6 45.3 Inside 128 8.7 9 78.6 Other BBK 2.5 20 50.8 Bank Rhode Island 2.7 14 37.1 Providence Cranston Pawtucket 2.3 6 13.7 Other BARI 0.2 4 0.8 PCSB 0.1 1 0.1 NY 0.2 3 0.7 Other PCSB $5.2 45 $234.6 Total Office Maturities - Asset Quality Average LTV Average DSC Average Loan Size Outstanding Loan Size 52% 1.69x $4.9 $205.8 Core 68% - 0.11x 4.2 28.9 Criticized + Classified 54% 1.47x $4.8 $234.6 Total 2Q25 ▪ No significant changes in the maturity profile of the Company’s Office portfolio since last quarter. 36% ($235MM) of the portfolio is maturing before 6/30/2027, with 88% Pass rated. Maturities remain staggered in the next 24 months, with $139MM (21%) maturing before 6/30/2026. ▪ The Company experienced modest deterioration in the Office portfolio, with the maturing Criticized + Classified population increasing to $28.9MM during the quarter, driven by two credits in the Boston central business district. ▪ The $10.8MM Classified credit secured by a downtown office building discussed in prior quarters was successfully sold at $170 PSF in Q2. There was no provision impact due to existing specific reserves. ▪ Despite some deterioration during the quarter, the Company views this as reflective of property - specific issues associated with the downtown office market, rather than the overall health of the portfolio. 20
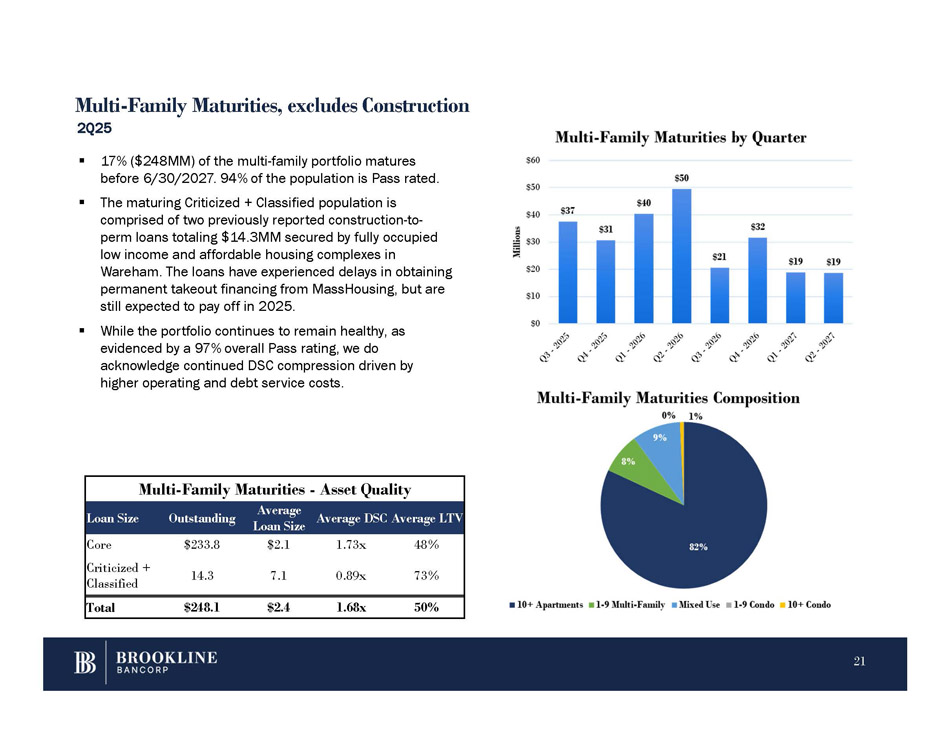
Multi - Family Maturities, excludes Construction Multi - Family Maturities - Asset Quality Average DSC Average LTV Average Loan Size Outstanding Loan Size 48% 1.73x $2.1 $233.8 Core 73% 0.89x 7.1 14.3 Criticized + Classified 50% 1.68x $2.4 $248.1 Total 2Q25 ▪ 17% ($248MM) of the multi - family portfolio matures before 6/30/2027. 94% of the population is Pass rated. ▪ The maturing Criticized + Classified population is comprised of two previously reported construction - to - perm loans totaling $14.3MM secured by fully occupied low income and affordable housing complexes in Wareham. The loans have experienced delays in obtaining permanent takeout financing from MassHousing, but are still expected to pay off in 2025. ▪ While the portfolio continues to remain healthy, as evidenced by a 97% overall Pass rating, we do acknowledge continued DSC compression driven by higher operating and debt service costs. 21
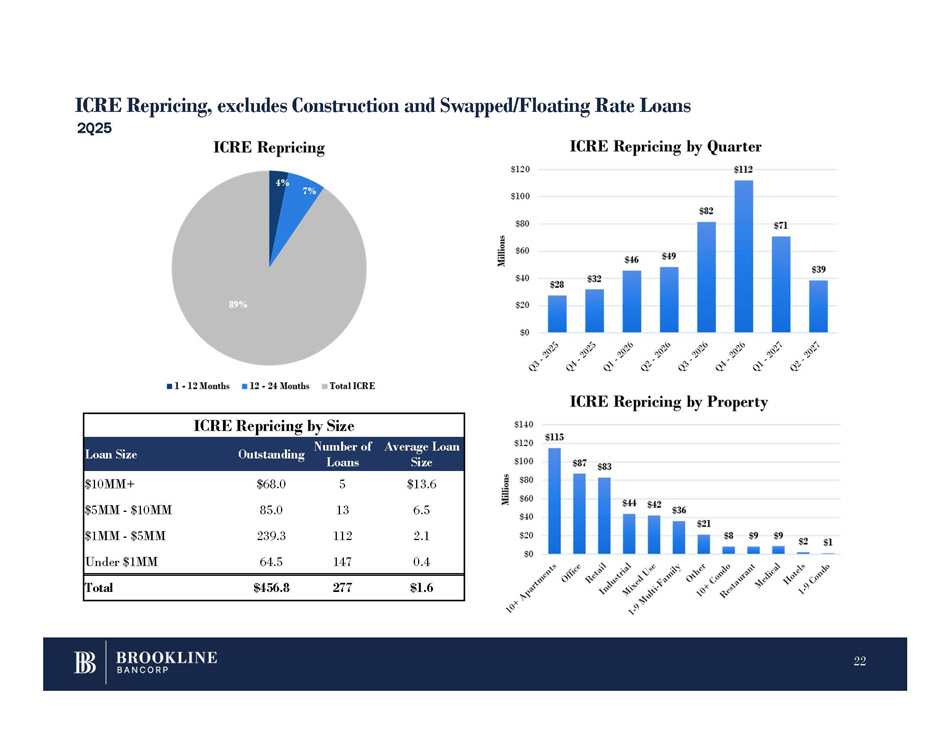
ICRE Repricing, excludes Construction and Swapped/Floating Rate Loans 2Q25 ICRE Repricing by Size Average Loan Size Number of Loans Outstanding Loan Size $13.6 5 $68.0 $10MM+ 6.5 13 85.0 $5MM - $10MM 2.1 112 239.3 $1MM - $5MM 0.4 147 64.5 Under $1MM $1.6 277 $456.8 Total 22
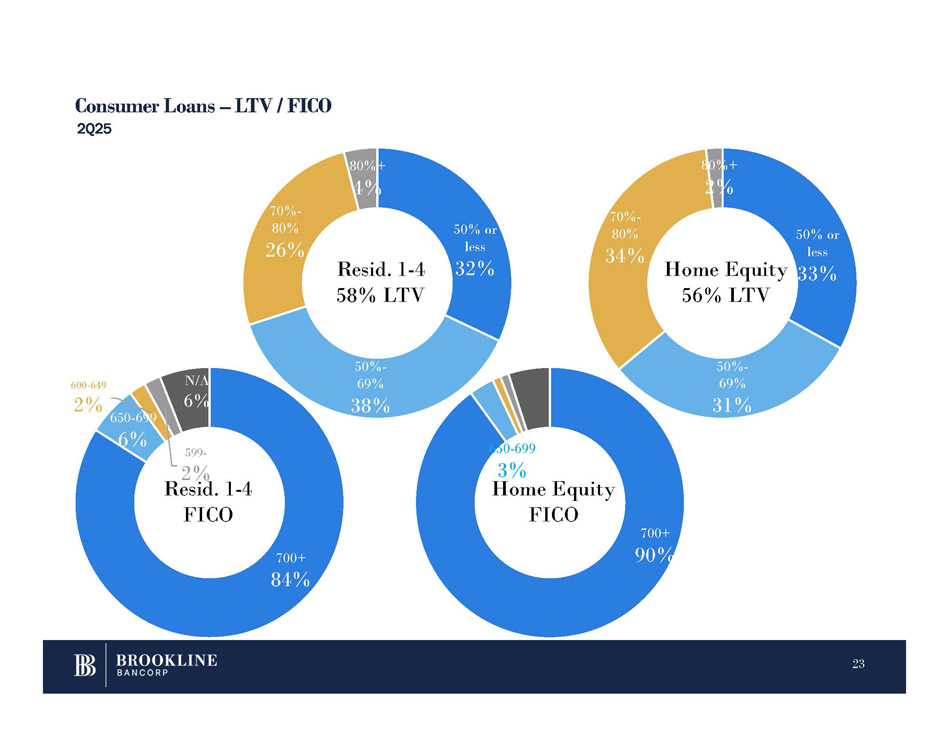
Consumer Loans – LTV / FICO 2Q25 23 700+ 84% 650 - 699 6% 600 - 649 2% 599 - 2% N/A 6% 50% or less 32% 50% - 69% 38% 70% - 80% 26% 80%+ 4% 700+ 90% 50% - 69% 31% 70% - 80% 34% 80%+ 2% Resid. 1 - 4 58% LTV Resid. 1 - 4 FICO 650 - 699 3% Home Equity FICO 50% or less Home Equity 33% 56% LTV
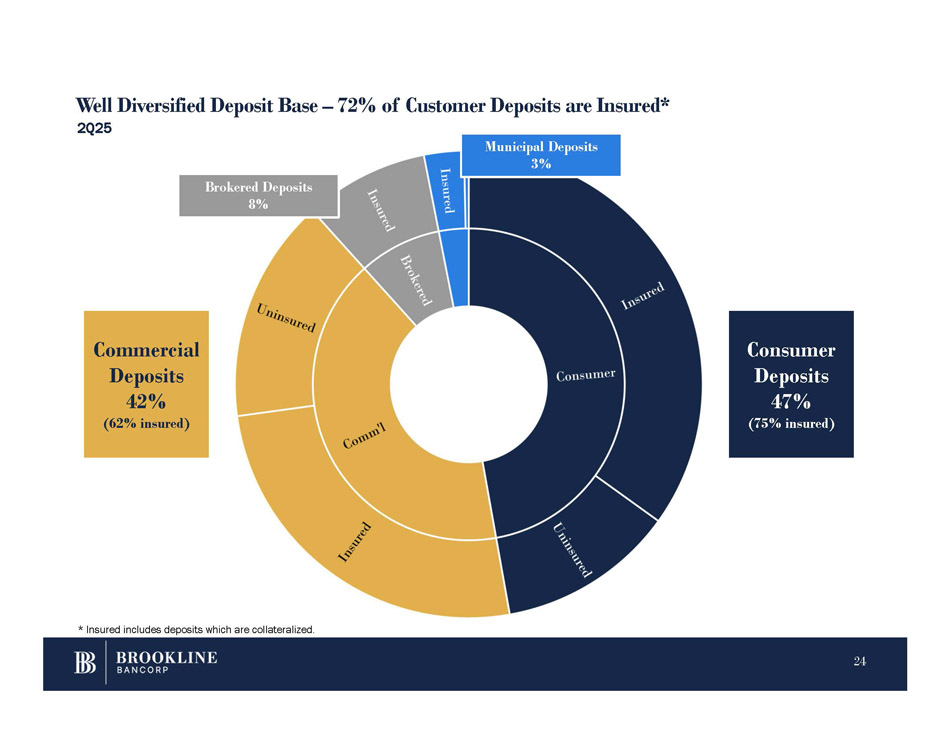
Well Diversified Deposit Base – 72% of Customer Deposits are Insured* Consumer Deposits 47% (75% insured) Commercial Deposits 42% (62% insured) * Insured includes deposits which are collateralized. 2Q25 Municipal Deposits 3% Brokered Deposits 8% 24
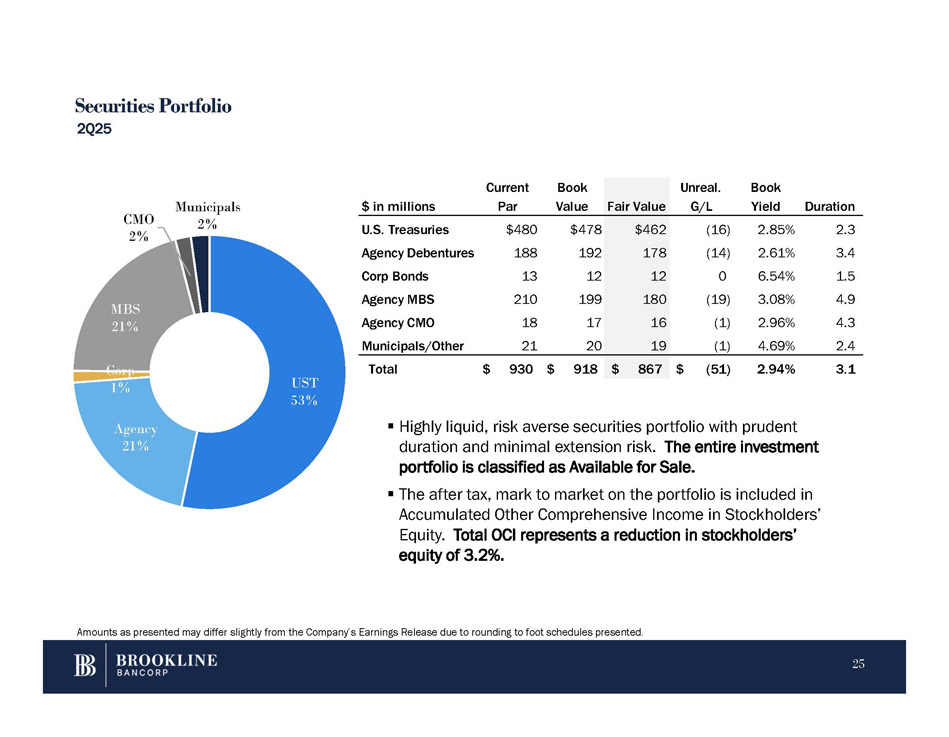
Securities Portfolio 2Q25 ▪ Highly liquid, risk averse securities portfolio with prudent duration and minimal extension risk. The entire investment portfolio is classified as Available for Sale. ▪ The after tax, mark to market on the portfolio is included in Accumulated Other Comprehensive Income in Stockholders’ Equity. Total OCI represents a reduction in stockholders’ equity of 3.2%. UST 53% 25 Agency 21% Corp 1% MBS 21% CMO 2% Municipals 2% Amounts as presented may differ slightly from the Company’s Earnings Release due to rounding to foot schedules presented. Duration Book Yield Unreal. G/L Fair Value Book Value Current Par $ in millions 2.3 2.85% (16) $462 $478 $480 U.S. Treasuries 3.4 2.61% (14) 178 192 188 Agency Debentures 1.5 6.54% 0 12 12 13 Corp Bonds 4.9 3.08% (19) 180 199 210 Agency MBS 4.3 2.96% (1) 16 17 18 Agency CMO 2.4 4.69% (1) 19 20 21 Municipals/Other 3.1 2.94% $ (51) $ 867 $ 918 $ 930 Total
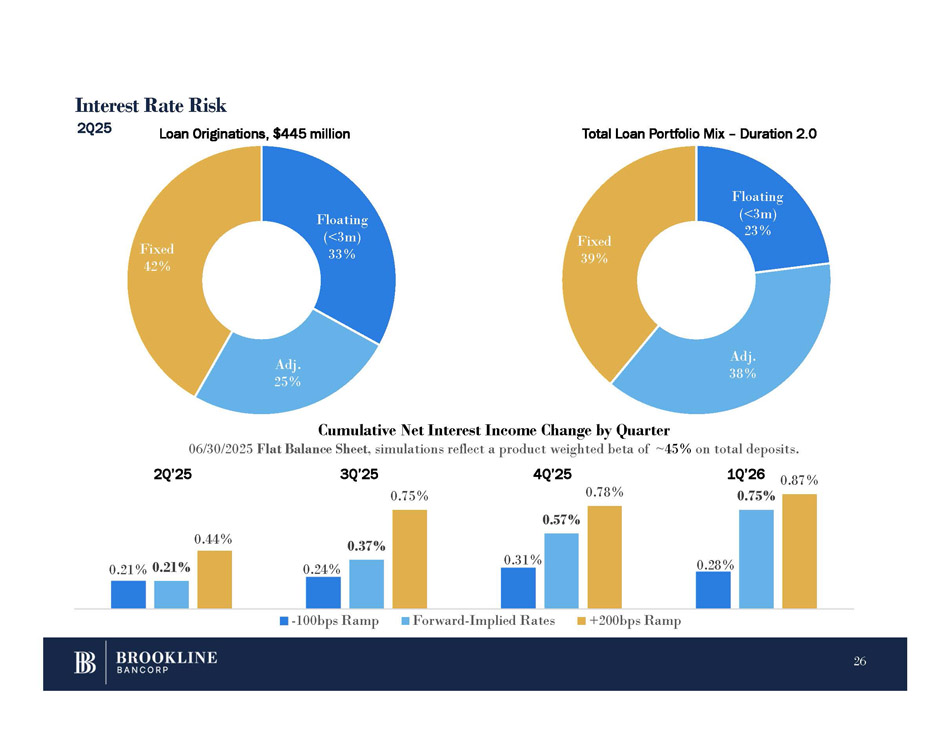
Interest Rate Risk Floating (<3m) 33% Adj. 25% Fixed 42% Loan Originations, $445 million Total Loan Portfolio Mix – Duration 2.0 0.24% 0.31% 0.28% 0.21% 0.21% 0.37% 0.57% 0.44% 0.75% 0.78% 0.87% Cumulative Net Interest Income Change by Quarter 06/30/2025 Flat Balance Sheet , simulations reflect a product weighted beta of ~ 45% on total deposits. - 100bps Ramp Forward - Implied Rates +200bps Ramp 1Q’26 0.75% Floating (<3m) 23% 26 Adj. 38% Fixed 39% 2Q25 2Q’25 3Q’25 4Q’25
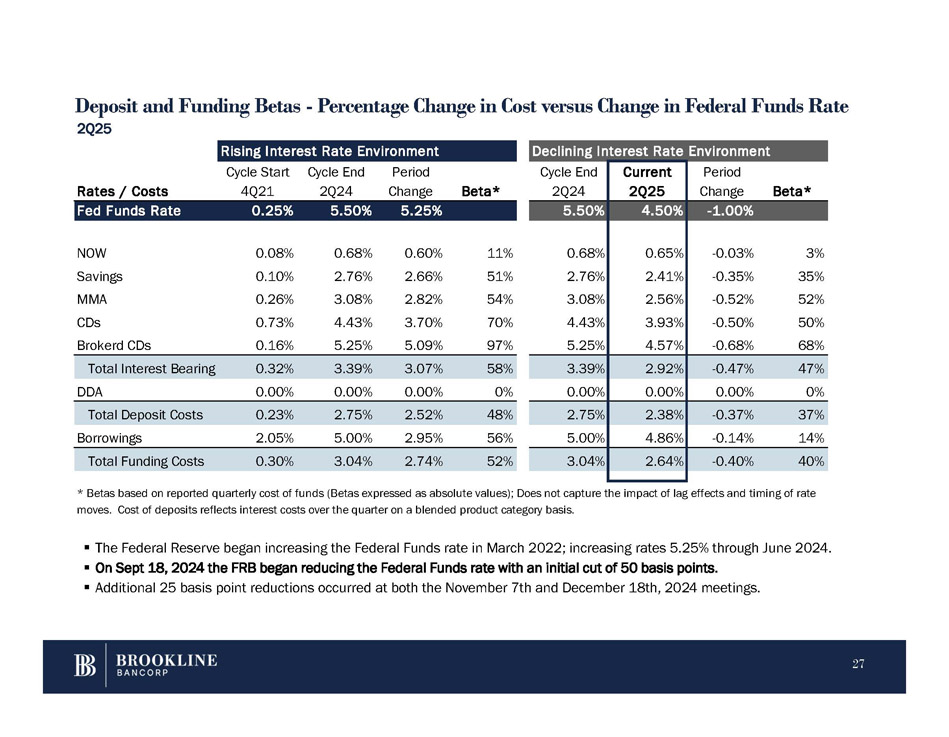
Deposit and Funding Betas - Percentage Change in Cost versus Change in Federal Funds Rate 2Q25 27 Rising Interest Rate Environment Beta* Period Change Cycle End 2Q24 Cycle Start 4Q21 Rates / Costs 5.25% 5.50% 0.25% Fed Funds Rate 11% 0.60% 0.68% 0.08% NOW 51% 2.66% 2.76% 0.10% Savings 54% 2.82% 3.08% 0.26% MMA 70% 3.70% 4.43% 0.73% CDs 97% 5.09% 5.25% 0.16% Brokerd CDs 58% 3.07% 3.39% 0.32% Total Interest Bearing 0% 0.00% 0.00% 0.00% DDA 48% 2.52% 2.75% 0.23% Total Deposit Costs 56% 2.95% 5.00% 2.05% Borrowings 52% 2.74% 3.04% 0.30% Total Funding Costs Declining Interest Rate Environment Beta* Period Change Current 2Q25 Cycle End 2Q24 - 1.00% 4.50% 5.50% 3% - 0.03% 0.65% 0.68% 35% - 0.35% 2.41% 2.76% 52% - 0.52% 2.56% 3.08% 50% - 0.50% 3.93% 4.43% 68% - 0.68% 4.57% 5.25% 47% - 0.47% 2.92% 3.39% 0% 0.00% 0.00% 0.00% 37% - 0.37% 2.38% 2.75% 14% - 0.14% 4.86% 5.00% 40% - 0.40% 2.64% 3.04% * Betas based on reported quarterly cost of funds (Betas expressed as absolute values); Does not capture the impact of lag effects and timing of rate moves. Cost of deposits reflects interest costs over the quarter on a blended product category basis. ▪ The Federal Reserve began increasing the Federal Funds rate in March 2022; increasing rates 5.25% through June 2024. ▪ On Sept 18, 2024 the FRB began reducing the Federal Funds rate with an initial cut of 50 basis points. ▪ Additional 25 basis point reductions occurred at both the November 7th and December 18th, 2024 meetings.