Pay vs Performance Disclosure
Mar. 31, 2025
USD ($)
$ / shares
Mar. 31, 2024
USD ($)
$ / shares
Mar. 31, 2023
USD ($)
$ / shares
Mar. 31, 2022
USD ($)
$ / shares
Mar. 31, 2021
USD ($)
$ / shares
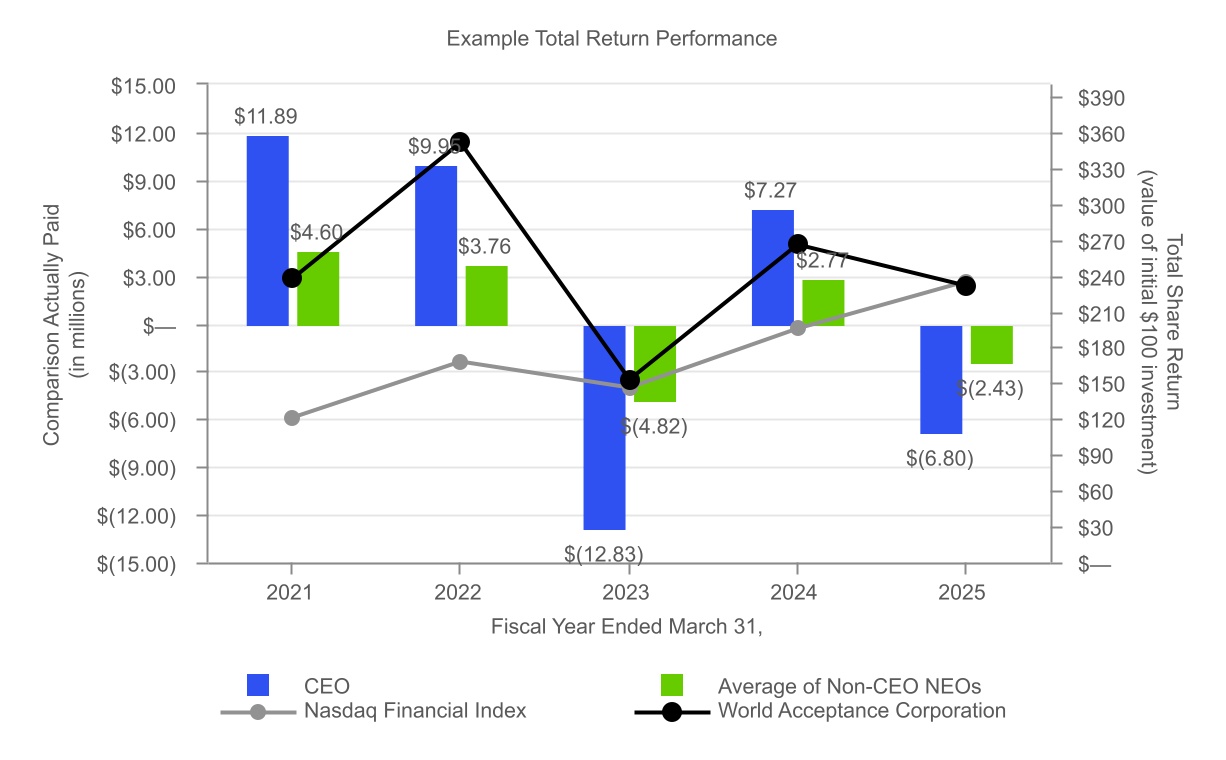
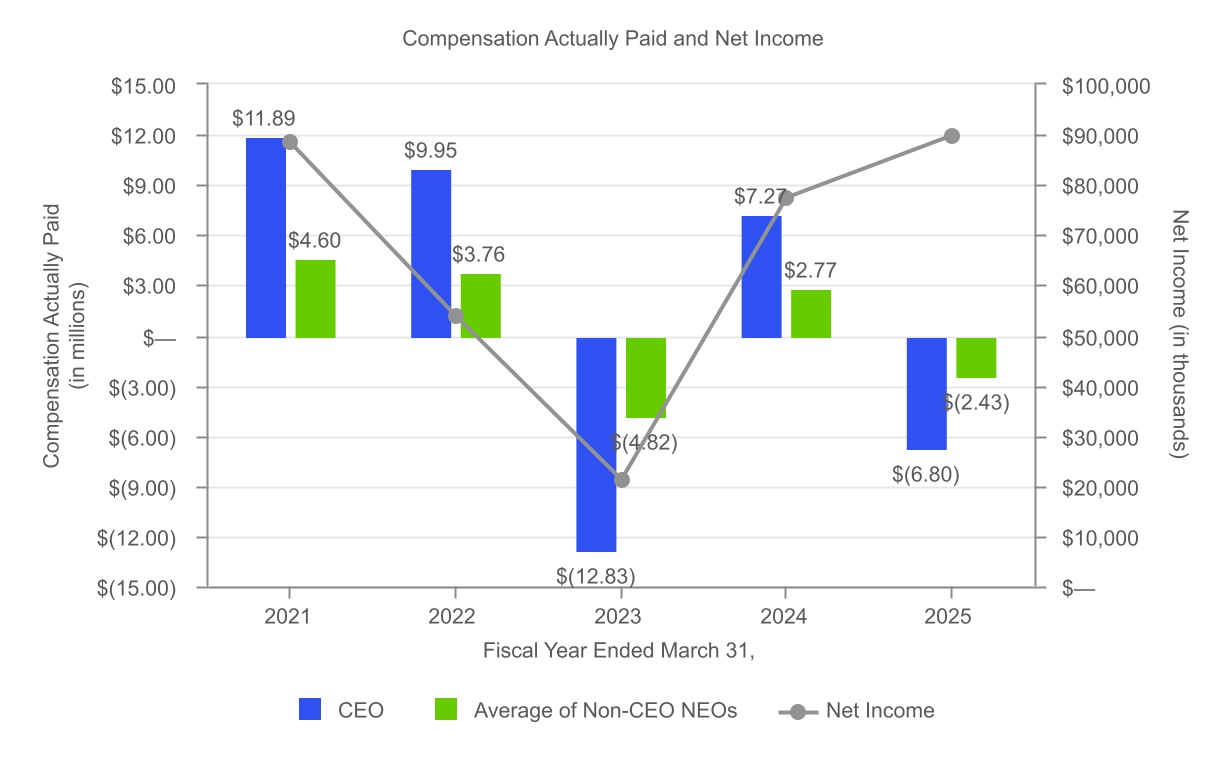
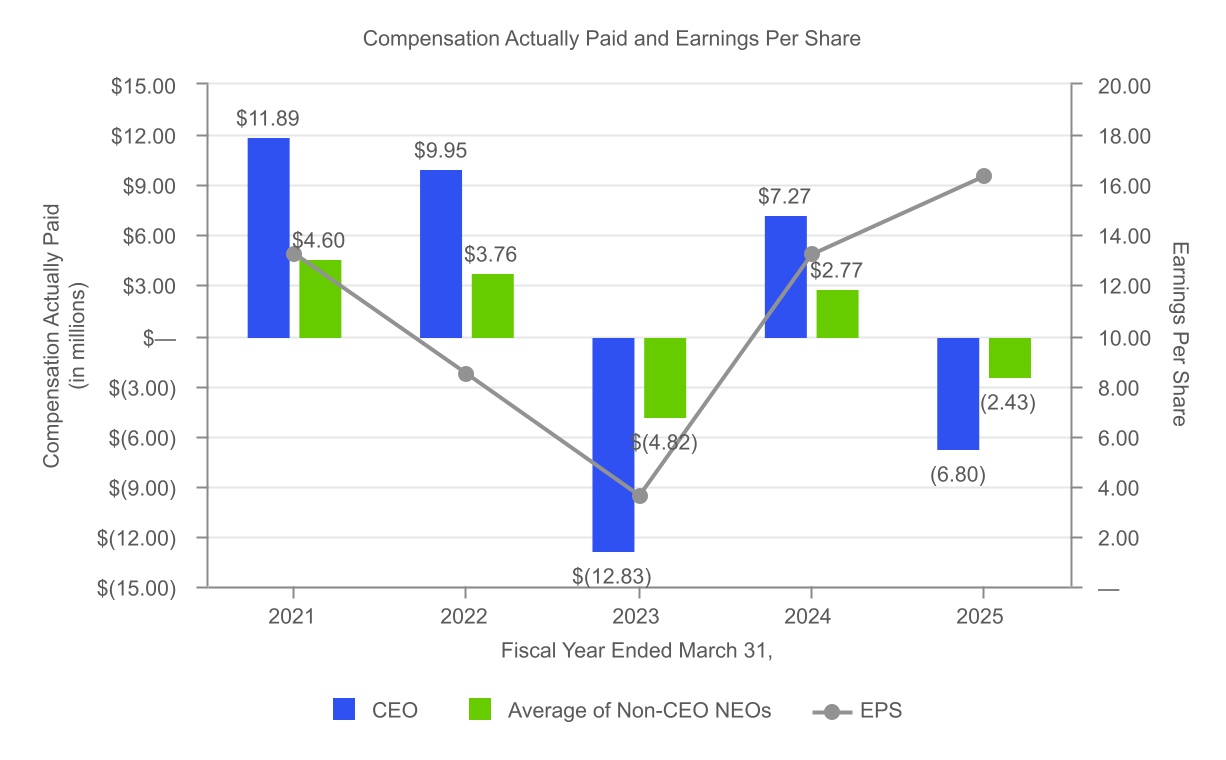
Year | Summary Compensation Table Total for PEO(1) | Compensation Actually Paid for PEO(1)(3) | Average Summary Compensation Table Total for Non-PEO Named Executive Officers(2) | Average Compensation Actually Paid for Non-PEO Named Executive Officers(2)(3) | Value of Initial Fixed $100 Investment Based on: | Net Income | EPS | |||||||||||||||||||
Company TSR | Peer Group TSR(4) | |||||||||||||||||||||||||
| 2025 | $ | 2,276,080 | $ | (6,797,172) | $ | 938,728 | $ | (2,434,661) | 231.73 | 235.08 | 89,741,398 | 16.30 | ||||||||||||||
| 2024 | $ | 965,737 | $ | 7,274,546 | $ | 427,762 | $ | 2,773,345 | 265.48 | 195.62 | 77,345,227 | 13.19 | ||||||||||||||
| 2023 | $ | 956,588 | $ | (12,833,581) | $ | 422,206 | $ | (4,820,535) | 152.52 | 145.88 | 21,231,990 | 3.60 | ||||||||||||||
| 2022 | $ | 933,966 | $ | 9,945,093 | $ | 415,437 | $ | 3,760,244 | 351.29 | 167.55 | 53,919,837 | 8.47 | ||||||||||||||
| 2021 | $ | 938,071 | $ | 11,889,842 | $ | 476,344 | $ | 4,602,519 | 237.61 | 120.99 | 88,282,828 | 13.23 | ||||||||||||||
PEO NEO CAP | |||||||||||||||||||||||
Year | Summary Compensation Table Total for PEO(1) | Less: RSA Grant in SCT | Add: Year-End Value of Unvested Equity Awards Granted in Year | Add: Change in Value of Unvested Equity Awards Granted in Prior Years that Vested During Year | Add: Change in Year-End Value of Unvested Equity Awards Granted in Prior Years | Add: Vesting Date Value of Equity Awards Granted and Vested During Year | Total Compensation Actually Paid(1)(3) | ||||||||||||||||
| 2025 | $ | 2,276,080 | $ | 1,299,936 | $ | 1,473,548 | $ | (626,525) | $ | (8,620,339) | $ | — | $ | (6,797,172) | |||||||||
| 2024 | $ | 965,737 | $ | — | $ | — | $ | 557,700 | $ | 5,751,109 | $ | — | $ | 7,274,546 | |||||||||
| 2023 | $ | 956,588 | $ | — | $ | — | $ | (1,134,510) | $ | (12,655,659) | $ | — | $ | (12,833,581) | |||||||||
| 2022 | $ | 933,966 | $ | — | $ | — | $ | 973,765 | $ | 8,037,362 | $ | — | $ | 9,945,093 | |||||||||
| 2021 | $ | 938,071 | $ | — | $ | — | $ | 750,858 | $ | 10,200,913 | $ | — | $ | 11,889,842 | |||||||||
| Non-PEO NEO CAP | |||||||||||||||||||||||
Year | Average Summary Compensation Table Total for Non-PEO Named Executive Officers(2) | Less: RSA Grant in SCT | Add: Year-End Value of Unvested Equity Awards Granted in Year | Add: Change in Value of Unvested Equity Awards Granted in Prior Years that Vested During Year | Add: Change in Year-End Value of Unvested Equity Awards Granted in Prior Years | Add: Vesting Date Value of Equity Awards Granted and Vested During Year | Average Total Compensation Actually Paid(2)(3) | ||||||||||||||||
| 2025 | $ | 938,728 | $ | 483,308 | $ | 547,856 | $ | (232,939) | $ | (3,204,998) | $ | — | $ | (2,434,661) | |||||||||
| 2024 | $ | 427,762 | $ | — | $ | — | $ | 207,350 | $ | 2,138,233 | $ | — | $ | 2,773,345 | |||||||||
| 2023 | $ | 422,206 | $ | — | $ | — | $ | (421,805) | $ | (4,820,936) | $ | — | $ | (4,820,535) | |||||||||
| 2022 | $ | 415,437 | $ | — | $ | — | $ | 326,690 | $ | 3,018,117 | $ | — | $ | 3,760,244 | |||||||||
| 2021 | $ | 476,344 | $ | 72,279 | $ | — | $ | 278,203 | $ | 3,847,972 | $ | 72,279 | $ | 4,602,519 | |||||||||