Exhibit 99.2
July 21, 2025
Fellow Calix stockholders:
During the second quarter of 2025, the Calix team delivered strong sequential revenue growth of 10%, as our broadband experience provider customers (BXPs) continued to win new subscribers, drive down churn and grow revenue via the unique capabilities of our appliance-based platform, cloud and managed services model.
As a result, our remaining performance obligations (RPOs) rose 30% year-over-year and 2% quarter-over-quarter to $347 million, and gross margin hit another record, increasing sequentially by 60 basis points. The market disruption continued as 18 customers began their journey with our appliance-based platform, cloud and managed services model, and for the first time, a large customer adopted our cloud.
Our relentless focus on operational excellence delivered our ninth consecutive quarter of eight-figure free cash flow, our 20th consecutive quarter of positive free cash flow, rising to a record $36 million in the quarter, while days sales outstanding (DSO) dropped to a record low of 24 days. Our strong balance sheet and cash position enabled us to repurchase one million shares of our common stock in the second quarter, all while we finished the quarter with record cash and investments of $299 million.
Continuing to Cross the Chasm now with our Third-Generation Agentic Platform
The clarity of our vision and our financial strength enables us to focus on our strategy and continue our product and platform investments to capitalize on the disruption and commoditization that is happening across the broadband market. This opportunity has driven 15 years of investment in the unique Calix broadband platform and fueled our mission to enable broadband providers of all sizes to simplify operations and go to market, innovate by delivering exceptional experiences to residential, small business, multi-dwelling units (MDUs), education, first responders and the communities they serve and to grow revenue, margin, customer satisfaction and their brand.
The next stage of our journey began in the second quarter with our third-generation platform going into preproduction prior to full launch in the second half of 2025. This next iteration builds on our second-generation platform, launched in 2019, with three goals:
•Expand our platform, cloud and managed services to new geographies using sovereign local data centers
•Deliver private cloud for large customers
•Accelerate the expansion of Calix solutions through platform-based, agentic AI
This next stage of the Calix platform will maximize our ability to simplify and innovate, enabling service providers to grow through a platform that is purpose built for AI and building out a fast-growing legion of agents trained to automate every use case and workflow that our more than 1,100 BXP customers face every day.
As we have articulated, our primary challenge in the broadband market is not competition from legacy box vendors; rather, it is our ability to help our BXP customers successfully transform their business models to fully leverage our platform. To address this need, we have made substantial investments in our
customer success organization to support BXP transformation through best practices, community enablement, workshops and bespoke service engagements. However, our team's ability to scale is constrained by our customers’ real-world limitations such as local hiring capacity and the capital required to implement new operating models. These constraints slow our ability to help the market move across the adoption curve from innovators and early adopters to the early and late majority, and ultimately, to legacy operators.
The implementation of agentic AI across the Calix platform will significantly strengthen our ability to scale our customer success team and in turn, our BXP customers’ success. Agentic AI will provide both our customer success team and BXP customers with advanced automated tools to augment their operations, accelerate transformation initiatives and expand their impact independent of traditional resource constraints. In addition, our third-generation platform will further enhance our development capabilities, enabling us to expedite the expansion of our platform solutions and the transformation processes that our customers need.
The Calix Difference
While delivering record results and bringing our third-generation platform to market, the Calix team continued to receive numerous industry awards for our culture, technology innovation, sustainability and dedication to customers and partners in the quarter including:
•TMC recognized SmartBiz and Service Cloud as “Customer Product of the Year”
•Fortune names Calix #18 on its list of the “Best Workplaces in the Bay Area”
•Comparably recognized Calix in the large company category for “Best Career Growth”, “Best Leadership Teams”, “Best Engineering Teams”, “Best HR Teams”, “Best Marketing Teams” and “Best Sales Teams”
As we enter the second half of 2025, our leadership team continues to align our strategy and investments to support our BXP customers’ success as they transform to dominate the markets they serve, which fuels our long-term financial performance across four measurable objectives:
•Deliberate revenue growth
•Gross margin expansion
•Disciplined operating expense investment
•Ongoing predictability
The disruption and the commoditization of the broadband industry continue; and with the rapid rise of AI, we will accelerate the adoption of our platform, cloud and managed services with our ability to support BXPs’ subscriber growth, footprint expansion and business transformation. We plan to do this while maintaining our own strong operating discipline, allowing us to expand our highly differentiated business model into new markets such as MDUs, new sovereign geographies and new customer segments for years to come.
Second Quarter 2025 Financial Results
| | | | | | | | | | | |
| GAAP | Non-GAAP | Guidance Non-GAAP 1 |
| Revenue | $241.9m | $241.9m | $221.0m – $227.0m |
| Gross margin | 56.3% | 56.8%2 | 55.25% – 57.25% |
| Operating expenses | $135.9m | $111.1m2 | $109.0m – $111.0m |
| Net income (loss) per diluted common share | ($0.00) | $0.332 | $0.18 – $0.24 |
| | | | | | | |
1 | Non-GAAP guidance provided on April 21, 2025. | | |
2 | Non-GAAP excludes stock-based compensation and intangible asset amortization as well as the income tax impact of these items. See GAAP to non-GAAP reconciliations beginning on page 15. | | |
| | | |
| | | |
| | | |
| | | |
| | | |
| | | |
| | | |
| | | |
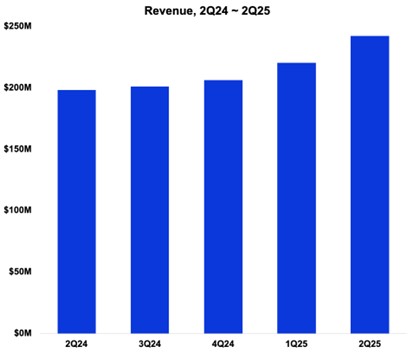
For the second quarter of 2025, revenue was $241.9 million, representing an increase of 10% from the prior quarter and an increase of 22% compared with the same quarter a year ago. During the second quarter of 2025, we saw broad-based demand from our BXP customers as well as the urgent need for appliances as we continue to take footprint from legacy box vendors. Unlimited Subscriber revenue increased by 16% and 59% from the prior quarter and year ago quarter, respectively, primarily due to our BXP customers’ focus on the subscriber experience and adding subscribers. Intelligent Access revenue increased by 11% and 5% from the prior quarter and year ago quarter, respectively, driven by healthy demand this quarter for network technology investment and upgrades.
U.S. revenue was 91% of revenue for the second quarter of 2025, down from 96% in the first quarter of 2025 and 92% for the year ago quarter. U.S. revenue increased 4% in absolute dollars sequentially and increased 20% compared with the year ago quarter. International revenue was 9% of revenue in the second quarter of 2025, up 152% from the prior quarter and up 48% compared with the year ago period. The increase was primarily due to increased shipments to a European customer.
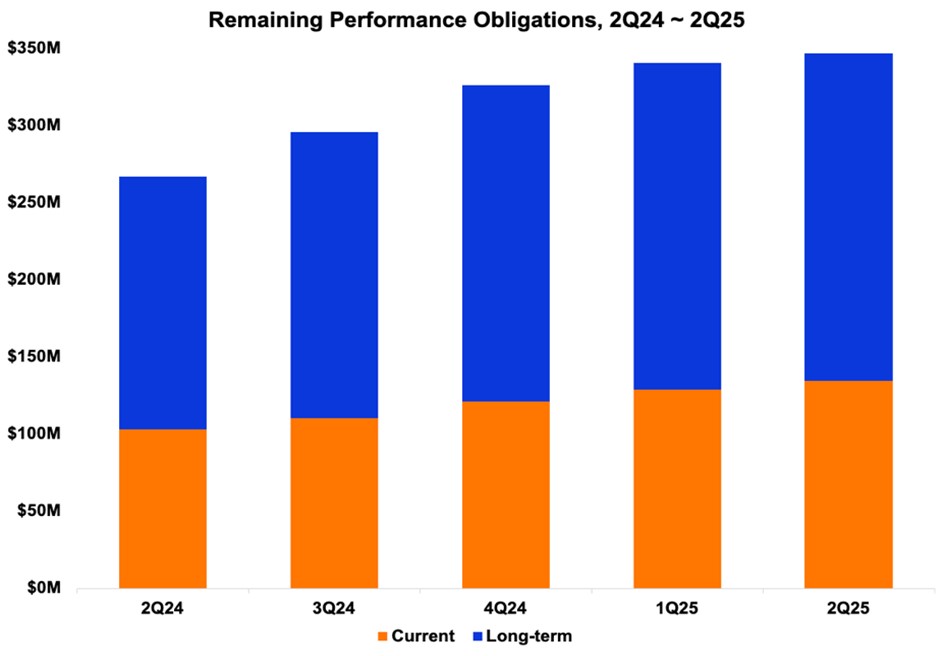
RPOs result from long-term commitments made by our customers and consist mainly of Calix Cloud, managed services, extended warranties and support/maintenance agreements and exclude platform licenses, month-to-month usage-based models and true-ups. These commitments generally have a three-year term at signing.
At the end of the second quarter of 2025, our RPOs were $346.6 million, which is an increase of $6.2 million, or 2%, from the prior quarter and an increase of $79.8 million, or 30%, from the same quarter a year ago. Current RPO was $134.3 million, up 5% from $128.4 million as compared with the prior quarter and up 30% from $103.0 million with a year ago. The increases reflected continued strength as our BXP customers adopt our platform, cloud and managed services, add incremental cloud and managed service offerings and win new subscribers. We expect RPOs will continue to grow each quarter while the size of the increases may fluctuate quarter over quarter.
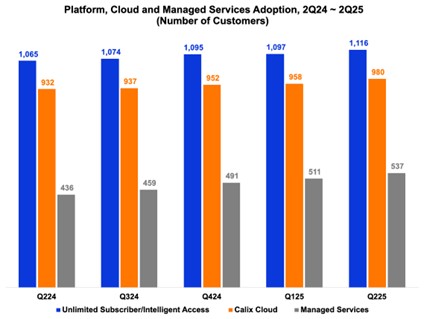
Expanded customer adoption of our platform, cloud and managed services was again evidenced by an increase in all three metrics compared with the prior quarter. As we have noted previously, the growth in subscribers and on-going adoption of our platform, cloud and managed services form the “expand” in our “land and expand” strategy. Over time, we expect the recurring revenue from continued platform, cloud and managed services adoption will drive higher gross margin.
In the second quarter of 2025, we added 19 new Unlimited Subscriber and/or Intelligent Access platform deployments. By deploying the Unlimited Subscriber, BXPs can quickly implement and sell managed services, thereby enabling them to improve their average revenue per user at higher margins with the greatest levels of subscriber satisfaction.
We also added 22 new Calix Cloud deployments, which include Engagement Cloud, Operations Cloud and/or Service Cloud. Calix Cloud allows our BXPs to benefit from the power of data-driven insights to drive best-in-class Net Promoter Scores℠.
Our managed services showed continued growth as 26 additional customers began deploying a managed service. We currently offer the following SmartLife™ managed services: SmartHome™ (which includes Wi-FiIQ, CommandIQ®, ProtectIQ® and ExperienceIQ®), Arlo Secure, Bark, SmartBiz™, SmartMDU™ and SmartTown®.
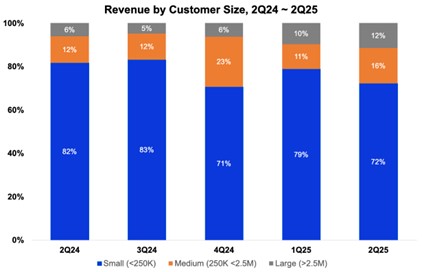
As we have discussed previously, technology disruptions start with small customers and eventually work their way up to large customers. In the second quarter of 2025, revenue from large customers increased sequentially by $6.2 million to a total of 12% of total revenue, up 2% of total revenue from last quarter, and increased $15.8 million, or up 6% of total revenue from the same quarter a year ago. The sequential increase was mostly related to a shift in classification of a customer from the small category to the large as this small customer was acquired by a large customer. Revenue from medium customers increased $14.4 million to 16% of total revenue, up 5% of total revenue from last quarter, mainly due to shipments to a European customer. Revenue from small customers accounted for 72% of revenue for the second quarter of 2025, down 7% of total revenue from the prior quarter and down 10% of total revenue from the year ago quarter. The decrease is primarily a result of a reclassification of a customer to the large customer segment as we discussed above. In absolute dollars, revenue from small customers increased by $1.1 million.
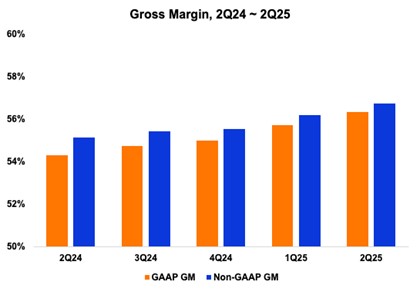
Our GAAP gross margin for the second quarter of 2025 was a record 56.3%, an increase of 60 basis points sequentially and 200 basis points year-over-year. U.S. tariff and tariff-related costs were not material in the second quarter of 2025. Included in GAAP gross margin was stock-based compensation and intangible asset amortization. Excluding these items, our non-GAAP gross margin for the second quarter of 2025 was a record 56.8%, representing an increase of 60 basis points sequentially and 170 basis points from the year ago period. The sequential and year-over-year increases relate primarily to our BXP customers winning new subscribers and the continued adoption of our platform by new broadband service providers and to a lesser extent customer mix. We expect that gross margin will continue to increase each quarter; however, the amount of increase may vary from quarter to quarter depending on customer and product mix.
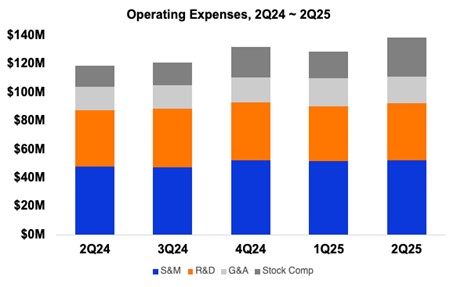
Our GAAP and non-GAAP operating expenses for the second quarter of 2025 were $135.9 million and $111.1 million, representing 56% and 46% of revenue, respectively. Sequentially, GAAP operating expenses increased by $7.0 million primarily due to stock-based compensation, and non-GAAP operating expenses increased by $1.2 million due to incentive compensation. Compared with the year ago quarter, GAAP operating expenses increased by $16.9 million mainly due to stock-based compensation, and non-GAAP operating expenses increased by $6.8 million primarily related to personnel costs, including higher sales commissions and incentive compensation. Non-GAAP sales and marketing investments were 22% of revenue, which is above our Target Financial Model range of 18% to 20%. Non-GAAP research and development investments were 29% of gross profit, which is in-line with our Target Financial Model of 29%. Non-GAAP general and administrative investments were 8% of revenue, which is above our Target Financial Model of 7%. We expect our 2025 non-GAAP operating expense investments to be modestly up over the prior year and decline as a percentage of revenue as our revenue continues to grow sequentially.
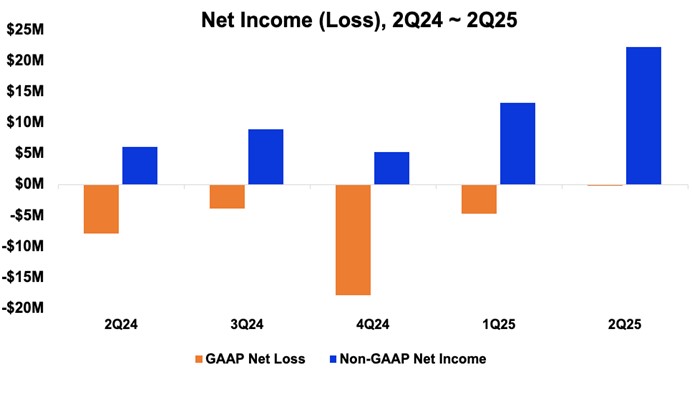
Our GAAP net loss was $0.2 million for the second quarter of 2025, an improvement of $4.6 million sequentially and $7.8 million from the year ago period. The improvement was primarily the result of higher revenue and gross margin partially offset by higher operating expenses. GAAP net loss for the second quarter of 2025 included stock-based compensation of $25.6 million and intangible asset amortization of $0.2 million. Excluding these items, our non-GAAP net income was $22.2 million, an increase of $9.1 million compared with the prior quarter due primarily to higher revenue and gross margin. Non-GAAP net income increased $16.1 million when compared with $6.1 million from the same quarter last year due to higher revenue and gross margin.
Balance Sheet and Cash Flow
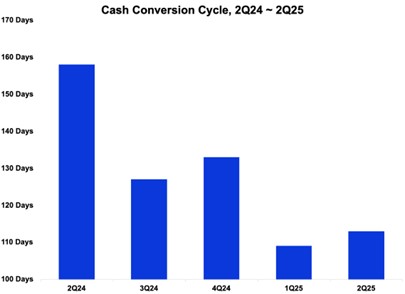
Our balance sheet remains strong. Our DSO at the end of the second quarter of 2025 was a record 24 days, down 6 days from the prior quarter and 14 days from the year ago period, reflecting improved linearity during the quarter and early payment by certain customers. Our Target Financial Model for DSO remains between 35 and 45 days. Inventory turns were 3.4, down from 3.6 in the prior quarter and up from 2.8 a year ago. The decrease in turns from the first quarter reflected the acceleration of inventory purchases while reciprocal tariffs were paused for 90 days. Inventory turns for the second quarter of 2025 were within our Target Financial Model of 3 to 4 turns. In the second quarter of 2025, our inventory deposits decreased by $15.0 million, bringing our total inventory deposits to $43.5 million, which is within our expected range of $40 million to $50 million. Days payable outstanding (DPO) at the end of the second quarter was 17 days, down 6 days from the prior quarter and up 7 days from the year ago quarter. Our Target Financial Model for DPO is between 25 and 35 days. Our cash conversion cycle was 113 days compared with 109 days in the prior quarter and 158 days in the same quarter last year. Our Target Financial Model for our cash conversion cycle remains between 100 and 130 days.
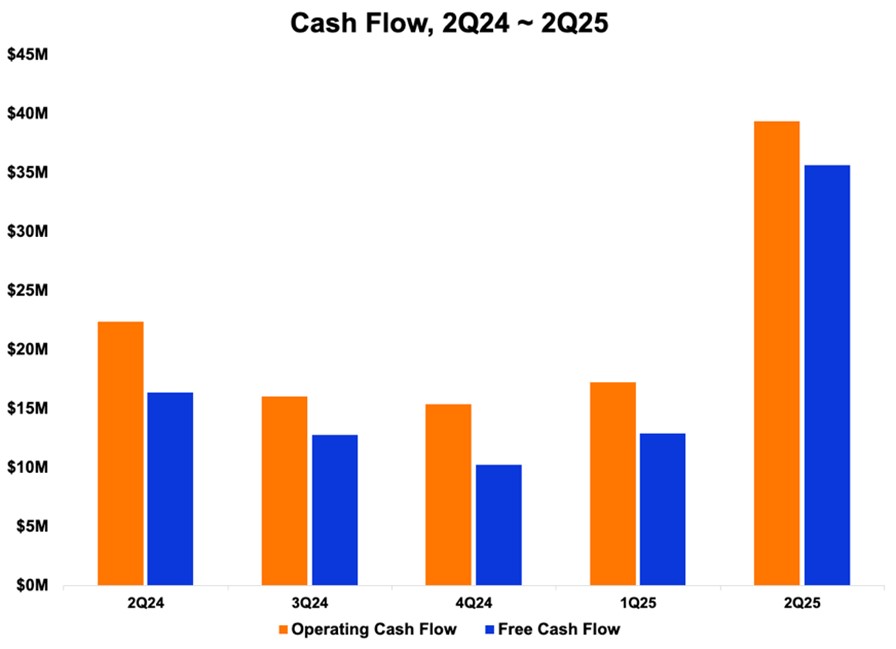
After repurchasing 1.0 million shares of common stock during the second quarter of 2025, we ended the quarter with record cash and investments of $299.0 million, which was a sequential quarterly increase of $16.7 million. The increase was primarily due to record quarterly operating cash flow of $39.4 million and proceeds from equity-based employee benefit plans of $13.4 million partially offset by purchases of our common stock of $33.6 million and capital expenditures of $3.7 million. Compared with the year ago period, our cash and investments increased by $37.7 million. The increase was due primarily to the
generation of operating cash flow of $88.0 million and proceeds from equity-based employee benefit plans of $40.9 million partially offset by share repurchases of $80.5 million and capital expenditures of $16.4 million. We continue to expect both GAAP operating and non-GAAP free cash flow to remain strong due to expected continued non-GAAP profitability and a robust cash conversion cycle.
We had $129.4 million available under the Board-authorized share repurchase program at the end of the second quarter of 2025.
Third Quarter 2025 Guidance
| | | | | | | | |
| Guidance Non-GAAP | Guidance Reconciled to GAAP |
| Revenue | $243m – $249m | $243m – $249m |
| Gross margin | 56.0% – 58.0%1 | 55.3% – 57.3% |
| Operating expenses | $112m – $114m1 | $132m – $134m |
Net income per diluted common share2 | $0.31 – $0.371 | $0.05 – $0.11 |
| | | | | | | |
1 | Non-GAAP excludes stock-based compensation and intangible asset amortization as well as the income tax impact of these items. See GAAP to non-GAAP reconciliation on page 17. | | |
2 | Based on 68.6 million weighted-average diluted common shares outstanding. | | |
| | | |
| | | |
| | | |
| | | |
| | | |
| | | |
| | | |
| | | |
Our guidance for the third quarter of 2025, ending September 27, 2025, reflects our expectations as of the date of this letter.
Our revenue guidance for the third quarter of 2025 is for revenue to be between $243 million and $249 million, up 2% (at the midpoint) from the prior quarter taking into consideration the strength of customer deployments in the first half of 2025 and current visibility.
Our non-GAAP gross margin guidance for the third quarter of 2025 of 57.0% (at the midpoint) would be a slight increase from the prior quarter reflecting expected customer and product mix in the third quarter 2025. We expect our annual gross margin improvement in 2025 will be at the higher end of our Target Financial Model range of 100 to 200 basis points resulting from the growth of our platform, cloud and managed services.
Our non-GAAP operating expense guidance for the third quarter of 2025 of $113 million (at the midpoint) represents a slight increase sequentially. We continue to expect that our non-GAAP operating expenses will increase modestly until we are back into our Target Financial Model. Consequently, operating expenses as a percentage of revenue will continue to decline sequentially given our current revenue outlook.
In light of the improved financial performance for the first half of 2025 and expectations for second half of 2025, we expect our non-GAAP effective tax rate for 2025 will be in a range of 23% to 25%. This guidance does not reflect any recent legislative changes to U.S. federal income taxes as we are evaluating their impact.
Summary
Our team has invested the last decade living the innovator’s dilemma, transforming Calix from a systems to a platform company with the capability to transform the industry via our vision of simplify and innovate to enable our BXP customers to grow for their members, investors and the communities they serve. Our product investment over the last two years has once again allowed us to take advantage of the biggest disruption in human history, artificial intelligence. These investments and the resulting innovations position Calix and, more importantly, our BXP customers to lead.
As we step into the second half of 2025, not only will we enable the next level of transformation within our BXP customers through agentic AI, but we will begin our internal transformation to evolve the way that we work to serve our customers while embracing new markets such as MDU, new sovereign geographies and new customer segments for years to come.
Our continued strong results demonstrate that our BXP customers are thriving in this disruptive market as the Calix model enables a simple path to a comprehensive business model that differentiates to win consumer, business, MDU and municipal subscribers at an increasing pace. We expect further footprint gains as we continue to convert legacy network operators, who are struggling with commoditization, margin declines and slowing growth, and new market segments such as MDU, large new customers and new geographies, as they see the power of Calix partnership to simplify, innovate and grow.
The foundation for our growth continues to be based on three vectors:
•New subscribers: BXP customers leverage our platform, cloud and managed services to differentiate themselves in their markets thereby adding subscribers.
•Existing subscribers: BXP customers adopt additional platform extensions, cloud and managed services, enabling them to reduce their operational costs and grow revenue per subscriber.
•New BXPs: We continue to help legacy operators and operators in new customer segments and geographies become strategically aligned experience providers who recognize that our unique platform, cloud and managed services model enables their teams to transform their business as they simplify their operations, subscriber engagement and services, innovate for their consumer, business and municipal subscribers and grow their value for members, investors and the communities they serve.
With strong demand for our appliances, platform, cloud and managed services, we are confident in our sequential revenue growth, and we are excited by the multi-year outlook for our business. We remain focused on growing our footprint by adding to our BXP customer base and expanding the reach of our platform, cloud and managed services across their subscribers in the geographies they serve.
We thank our customers, employees, partners, vendors and stockholders for their continued support.
Sincerely,
| | | | | | | | |
Michael Weening President and CEO | | Cory Sindelar CFO |
Conference Call
In conjunction with this announcement, Calix will host a conference call tomorrow, july 22, 2025 at 5:30 a.m. Pacific Time / 8:30 a.m. Eastern Time to answer questions regarding our second quarter 2025 financial results. A live audio webcast and replay of the call will be available in the Investor Relations section of the Calix website at http://investor-relations.calix.com.
Live call access information: Dial-in number: (877) 407-4019 (U.S.) or (201) 689-8337 (outside the U.S.) ID# 13754440.
The conference call and webcast will include forward-looking information.
Investor Inquiries
Nancy Fazioli
VP, Investor Relations
InvestorRelations@calix.com
(669) 308-3901
About Calix
Calix, Inc. (NYSE: CALX) — Calix is an appliance-based platform, cloud and managed services company. Broadband experience providers leverage Calix’s broadband platform, cloud and managed services to simplify their operations, subscriber engagement and services; innovate for their consumer, business and municipal subscribers; and grow their value for members, investors and the communities they serve.
Our end-to-end platform and managed services democratize the use of data—enabling our customers of any size to operate efficiently, acquire subscribers and deliver exceptional experiences. Calix is dedicated to driving continuous improvement in partnership with our growing ecosystem to support the transformation of our customers and their communities.
Forward-Looking Statements
Statements made in this stockholder letter and the earnings call referencing the stockholder letter that are not statements of historical fact are forward-looking statements. Forward-looking statements are subject to the “safe harbor” provisions of the Private Securities Litigation Reform Act of 1995. Forward-looking statements relate to, but are not limited to, impact from U.S. tariffs and trade policies, potential customer or market opportunities, growth and future opportunities, customer demand or the sustainability of continued demand, anticipated customer purchase trends, anticipated government funding, programs and proposals, expected customer and product mix or anticipated adoption or deployment of our appliances, platform, cloud or managed services, implementation of agentic AI, industry, market and customer trends, opportunities with existing and prospective customers, the timing of BEAD shipments, free cash flow and liquidity, continuation of our stock repurchase program and future financial performance (including the outlook for the third quarter of 2025, full year and future periods and performance against our Target Financial Model). Forward-looking statements are subject to risks and uncertainties that could cause actual results to differ materially from expectations, including but not limited to fluctuations in our financial and operating results, the capital spending decisions of our customers, U.S. tariffs, changes and disruptions in the market and industry, availability of capital in the market, potential for growth in our business driven by government funds, changes in and impacts of regulations and/or government sponsored programs, competition, our ability to achieve market acceptance of our appliances, platform, cloud or managed services, our ability to grow our customer base, our ability to implement agentic AI across our platform to scale our customer success team and our BXP customers’ success, fluctuations in costs associated with our appliances and services including higher costs, dependence on third-parties for production and resource management associated with our global supply chain that may cause delays in production, inventory write-offs or component liabilities, cost
overruns, disruptions in global trade and relations, social unrest and political uncertainties and other unanticipated factors, as well as the risks and uncertainties described in our annual report on Form 10-K and our quarterly reports on Form 10-Q, each as filed with the SEC and available at www.sec.gov, particularly in the sections titled “Risk Factors.” Forward-looking statements speak only as of the date the statements are made and are based on information available to us at the time those statements are made and/or management’s good faith belief as of that time with respect to future events. Calix assumes no obligation to update forward-looking statements to reflect actual performance or results, changes in assumptions or changes in other factors affecting forward-looking information, except to the extent required by applicable securities laws. Accordingly, investors should not place undue reliance on any forward-looking statements.
Use of Non-GAAP Financial Information
The Company uses certain non-GAAP financial measures in this stockholder letter to supplement its consolidated financial statements, which are presented in accordance with U.S. GAAP. These non-GAAP measures include non-GAAP gross margin, non-GAAP operating expenses, non-GAAP sales and marketing investments, non-GAAP research and development investments, non-GAAP general and administrative investments, non-GAAP effective income tax rate, non-GAAP net income or profitability, non-GAAP net income per diluted common share and non-GAAP free cash flow. These non-GAAP measures are provided to enhance the reader’s understanding of the Company’s operating performance as they primarily exclude non-cash stock-based compensation, U.S. tariff and tariff-related costs, intangible asset amortization and the impact from changes in income taxes, which the Company believes are not indicative of its core operating results. Management believes that the non-GAAP measures used in this stockholder letter provide investors with important perspectives into the Company’s ongoing business performance and management uses these non-GAAP measures to evaluate financial results and to establish operational goals. The presentation of these non-GAAP measures is not meant to be a substitute for results presented in accordance with GAAP, but rather should be evaluated in conjunction with those GAAP results. A reconciliation of the non-GAAP results to the most directly comparable GAAP results is provided in this stockholder letter. The non-GAAP financial measures used by the Company may be calculated differently from, and therefore may not be comparable to, similarly titled measures used by other companies.
| | | | | | | | | | | | | | | | | | | | | | | | | | | | | | | | |
| Calix, Inc. |
| Condensed Consolidated Statements of Operations |
| (Unaudited, in thousands, except per share data) |
| | | | | | | | | | |
| | | | Three Months Ended | | Six Months Ended |
| | | | June 28, | | June 29, | | June 28, | | June 29, |
| | | | 2025 | | 2024 | | 2025 | | 2024 |
| | | | | | |
| Revenue | | $ | 241,882 | | | $ | 198,139 | | | $ | 462,124 | | | $ | 424,449 | |
| Cost of revenue | | 105,587 | | | 90,536 | | | 203,121 | | | 194,269 | |
| Gross profit | | 136,295 | | | 107,603 | | | 259,003 | | | 230,180 | |
| Operating expenses: | | | | | | | | |
| Sales and marketing | | 63,653 | | | 52,238 | | | 121,712 | | | 106,135 | |
| Research and development | | 45,787 | | | 44,123 | | | 89,767 | | | 88,545 | |
| General and administrative | | 26,464 | | | 22,598 | | | 53,214 | | | 48,888 | |
| | Total operating expenses | | 135,904 | | | 118,959 | | | 264,693 | | | 243,568 | |
| Operating income (loss) | | 391 | | | (11,356) | | | (5,690) | | | (13,388) | |
| Interest income and other income (expense), net: | | | | | | | | |
| Interest income, net | | 2,959 | | | 2,960 | | | 6,246 | | | 5,595 | |
| Other income (expense), net | | 77 | | | (286) | | | (119) | | | (421) | |
| | Total interest income and other income (expense), net | | 3,036 | | | 2,674 | | | 6,127 | | | 5,174 | |
| Income (loss) before income taxes | | 3,427 | | | (8,682) | | | 437 | | | (8,214) | |
| Income taxes (benefit) | | 3,626 | | | (724) | | | 5,423 | | | (359) | |
| Net loss | | $ | (199) | | | $ | (7,958) | | | $ | (4,986) | | | $ | (7,855) | |
| Net loss per common share: | | | | | | | | |
| | Basic | | $ | (0.00) | | | $ | (0.12) | | | $ | (0.08) | | | $ | (0.12) | |
| | Diluted | | $ | (0.00) | | | $ | (0.12) | | | $ | (0.08) | | | $ | (0.12) | |
| Weighted average number of shares used to compute net loss per common share: | | | | | | | |
| | Basic | | 64,525 | | | 65,678 | | | 65,321 | | | 65,509 | |
| | Diluted | | 64,525 | | | 65,678 | | | 65,321 | | | 65,509 | |
| | | | | | | | | | |
| | | | | | | | | | | | | | |
| Calix, Inc. |
| Condensed Consolidated Balance Sheets |
| (Unaudited, in thousands) |
| | | | |
| | June 28, | | December 31, |
| | 2025 | | 2024 |
| ASSETS |
| Current assets: | | | | |
| Cash and cash equivalents | | $ | 76,538 | | | $ | 43,162 | |
| Marketable securities | | 222,430 | | | 253,929 | |
| Accounts receivable, net | | 63,076 | | | 79,321 | |
| Inventory | | 110,522 | | | 102,727 | |
| Prepaid expenses and other current assets | | 89,748 | | | 105,596 | |
| Total current assets | | 562,314 | | | 584,735 | |
| Property and equipment, net | | 32,415 | | | 31,153 | |
| Right-of-use operating leases | | 4,736 | | | 6,216 | |
| Deferred tax assets | | 178,817 | | | 177,601 | |
| Goodwill | | 116,175 | | | 116,175 | |
| Other assets | | 26,949 | | | 23,387 | |
| | $ | 921,406 | | | $ | 939,267 | |
LIABILITIES AND STOCKHOLDERS’ EQUITY |
| Current liabilities: | | | | |
| Accounts payable | | $ | 23,746 | | | $ | 20,226 | |
| Accrued liabilities | | 74,122 | | | 84,167 | |
| Deferred revenue | | 25,774 | | | 26,750 | |
| Total current liabilities | | 123,642 | | | 131,143 | |
| Long-term portion of deferred revenue | | 20,111 | | | 20,883 | |
| Operating leases | | 2,953 | | | 3,720 | |
| Other long-term liabilities | | 2,028 | | | 2,581 | |
| Total liabilities | | 148,734 | | | 158,327 | |
| Stockholders’ equity: | | | | |
| Common stock | | 1,633 | | | 1,661 | |
| Additional paid-in capital | | 1,166,266 | | | 1,170,017 | |
| Accumulated other comprehensive loss | | (115) | | | (612) | |
| Accumulated deficit | | (395,112) | | | (390,126) | |
| Total stockholders’ equity | | 772,672 | | | 780,940 | |
| | $ | 921,406 | | | $ | 939,267 | |
| | | | | | | | | | | | | | |
| Calix, Inc. |
| Condensed Consolidated Statements of Cash Flows |
| (Unaudited, in thousands) |
| | | | |
| | Six Months Ended |
| | June 28, | | June 29, |
| | 2025 | | 2024 |
| Operating activities: | | | | |
| Net loss | | $ | (4,986) | | | $ | (7,855) | |
| Adjustments to reconcile net loss to net cash provided by operating activities: | | | | |
| Stock-based compensation | | 45,357 | | | 32,315 | |
| Depreciation and amortization | | 8,613 | | | 9,988 | |
| Deferred income taxes | | (1,285) | | | (5,284) | |
| Net accretion of available-for-sale securities | | (2,137) | | | (2,716) | |
| Changes in operating assets and liabilities: | | | | |
| Accounts receivable, net | | 16,245 | | | 43,962 | |
| Inventory | | (7,795) | | | 19,500 | |
| Prepaid expenses and other assets | | 13,752 | | | 6,420 | |
| Accounts payable | | 2,284 | | | (23,424) | |
| Accrued liabilities | | (10,387) | | | (26,787) | |
| Deferred revenue | | (1,748) | | | (7,300) | |
| Other long-term liabilities | | (1,320) | | | (1,781) | |
| Net cash provided by operating activities | | 56,593 | | | 37,038 | |
Investing activities: | | | | |
| Purchases of property and equipment | | (8,045) | | | (9,661) | |
| Purchases of marketable securities | | (95,116) | | | (148,897) | |
| Sales of marketable securities | | 11,362 | | | 48,734 | |
| Maturities of marketable securities | | 117,679 | | | 82,805 | |
| Net cash provided by (used in) investing activities | | 25,880 | | | (27,019) | |
| Financing activities: | | | | |
| Proceeds from common stock issuances related to employee benefit plans | | 24,197 | | | 14,834 | |
| Repurchases of common stock | | (73,531) | | | (3,738) | |
| | | | |
| Net cash provided by (used in) financing activities | | (49,334) | | | 11,096 | |
| Effect of exchange rate changes on cash and cash equivalents | | 237 | | | (38) | |
| Net increase in cash and cash equivalents | | 33,376 | | | 21,077 | |
| Cash and cash equivalents at beginning of period | | 43,162 | | | 63,409 | |
| Cash and cash equivalents at end of period | | $ | 76,538 | | | $ | 84,486 | |
| | | | | | | | | | | | | | | | | | | | | | | | | | | | | | | | |
| Calix, Inc. |
| Reconciliation of GAAP to Non-GAAP Gross Margin |
| (Unaudited) |
| | Three Months Ended |
| | June 28,
2025 | | March 29,
2025 | | December 31,
2024 | | September 28,
2024 | | June 29,
2024 |
| GAAP gross margin | | 56.3 | % | | 55.7 | % | | 55.0 | % | | 54.8 | % | | 54.3 | % |
| Adjustments to GAAP amount: | | | | | | | | | | |
| Stock-based compensation | | 0.4 | | | 0.4 | | | 0.4 | | | 0.3 | | | 0.3 | |
| Intangible asset amortization | | 0.1 | | | 0.1 | | | 0.1 | | | 0.3 | | | 0.5 | |
| Non-GAAP gross margin | | 56.8 | % | | 56.2 | % | | 55.5 | % | | 55.4 | % | | 55.1 | % |
| | | | | | | | | | | | | | | | | | | | | | | | | | | | | | | | |
| Calix, Inc. |
| Reconciliation of GAAP to Non-GAAP Operating Expenses |
| (Unaudited, in thousands) |
| | Three Months Ended |
| | June 28, | | March 29, | | December 31, | | Sept. 28, | | June 29, |
| | 2025 | | 2025 | | 2024 | | 2024 | | 2024 |
| GAAP operating expenses: | | | | | | | | | | |
| Sales and marketing | | $ | 63,653 | | | $ | 58,059 | | | $ | 59,443 | | | $ | 52,301 | | | $ | 52,238 | |
| Research and development | | 45,787 | | | 43,980 | | | 45,858 | | | 45,467 | | | 44,123 | |
| General and administrative | | 26,464 | | | 26,750 | | | 26,816 | | | 23,175 | | | 22,598 | |
| | 135,904 | | | 128,789 | | | 132,117 | | | 120,943 | | | 118,959 | |
| Stock-based compensation: | | | | | | | | | | |
| Sales and marketing | | (11,047) | | | (6,469) | | | (7,138) | | | (4,630) | | | (4,191) | |
| Research and development | | (5,890) | | | (5,081) | | | (5,388) | | | (4,783) | | | (4,398) | |
| General and administrative | | (7,912) | | | (7,415) | | | (8,729) | | | (6,188) | | | (6,162) | |
| | (24,849) | | | (18,965) | | | (21,255) | | | (15,601) | | | (14,751) | |
| | | | | | | | | | |
| Non-GAAP operating expenses: | | | | | | | | | | |
| Sales and marketing | | 52,606 | | | 51,590 | | | 52,305 | | | 47,671 | | | 48,047 | |
| Research and development | | 39,897 | | | 38,899 | | | 40,470 | | | 40,684 | | | 39,725 | |
| General and administrative | | 18,552 | | | 19,335 | | | 18,087 | | | 16,987 | | | 16,436 | |
| | $ | 111,055 | | | $ | 109,824 | | | $ | 110,862 | | | $ | 105,342 | | | $ | 104,208 | |
| | | | | | | | | | | | | | | | | | | | | | | | | | | | | | | | | | | |
| Calix, Inc. |
| Reconciliation of GAAP Net Loss to Non-GAAP Net Income |
| (Unaudited, in thousands) |
| | Three Months Ended | |
| | June 28, | | March 29, | | December 31, | | Sept. 28, | | June 29, | |
| | 2025 | | 2025 | | 2024 | | 2024 | | 2024 | |
| GAAP net loss | | $ | (199) | | | $ | (4,787) | | | $ | (17,924) | | | $ | (3,968) | | | $ | (7,958) | | |
| Adjustments to GAAP amount: | | | | | | | | | | | |
| Stock-based compensation | | 25,613 | | | 19,745 | | | 22,075 | | | 16,371 | | | 15,458 | | |
| Intangible asset amortization | | 228 | | | 298 | | | 298 | | | 604 | | | 956 | | |
Income tax effect of non-GAAP adjustments | | (3,398) | | | (2,125) | | | 781 | | | (4,100) | | | (2,348) | | |
| Non-GAAP net income | | $ | 22,244 | | | $ | 13,131 | | | $ | 5,230 | | | $ | 8,907 | | | $ | 6,108 | | |
| | | | | | | | | | | |
| | | | | | | | | | | | | | | | | | | | | | | | | | | | | | | | |
| Calix, Inc. |
| Non-GAAP Free Cash Flow Reconciliation |
| (Unaudited, in thousands) |
| | Three Months Ended |
| | June 28, | | March 29, | | December 31, | | Sept. 28, | | June 29, |
| | 2025 | | 2025 | | 2024 | | 2024 | | 2024 |
| Net cash provided by operating activities | | $ | 39,381 | | | $ | 17,212 | | | $ | 15,363 | | | $ | 15,999 | | | $ | 22,347 | |
| Purchases of property and equipment | | (3,735) | | | (4,310) | | | (5,149) | | | (3,244) | | | (5,952) | |
| Non-GAAP free cash flow | | $ | 35,646 | | | $ | 12,902 | | | $ | 10,214 | | | $ | 12,755 | | | $ | 16,395 | |
| | | | | | | | |
| Calix, Inc. |
Reconciliation of GAAP Net Loss to Non-GAAP Net Income Per Diluted Common Share1 |
| (Unaudited) |
| | Three Months Ended
June 28, 2025 |
| GAAP net loss per diluted common share | | $ | (0.00) | |
| Adjustments to GAAP amount: | | |
| Stock-based compensation | | 0.38 | |
| Intangible asset amortization | | 0.00 | |
Income tax effect of non-GAAP adjustments | | (0.05) | |
| Non-GAAP net income per diluted common share | | $ | 0.33 | |
| | | | | | | |
1 | Based on 67.6 million weighted-average diluted common shares outstanding. | | |
| | | |
| | | |
| | | |
| | | |
| | | |
| | | |
| | | |
| | | |
| | | | | | | | | | | | | | | | | | | | | | | | | | | | | | | | |
| Calix, Inc. |
| Reconciliation of GAAP to Non-GAAP Guidance |
| (Unaudited, dollars in thousands, except per share data) |
| Three Months Ending September 27, 2025 |
| | GAAP | | Stock-Based Compensation | | U.S. Tariff and Tariff-related Costs | | Intangible
Asset Amortization | | Non-GAAP |
| Gross margin | | 55.3% - 57.3% | | 0.4% | | 0.2% | | 0.1% | | 56.0% - 58.0% |
| Operating expenses | | $132,000 - $134,000 | | $(20,000) | | $ — | | $ — | | $112,000 - $114,000 |
Net income per diluted common share1 | | $0.05 - $0.11 | | $0.25 2 | | $0.01 2 | | $0.00 2 | | $0.31 - $0.37 |
| | | | | | | |
1 | Based on 69.1 million weighted-average diluted common shares outstanding. | | |
2 | Net of income taxes. | | |
| | | |
| | | |
| | | |
| | | |
| | | |
| | | |
| | | |
| | | |