Pay vs Performance Disclosure - USD ($)
Dec. 31, 2024
Dec. 31, 2023
Dec. 31, 2022
Dec. 31, 2021
Pay Versus Performance Table
The table below summarizes compensation values both previously reported in our Summary Compensation Table, as well as the adjusted values required in this section for fiscal years 2021, 2022, 2023, and 2024. Note that for our NEOs other than our principal executive officer (the “PEO”), compensation is reported as an average.
Year |
Summary Compensation Table Total for PEO ($) (1)(2) |
Compensation Actually Paid to PEO ($) (1)(3) |
Average Summary Compensation Table Total for Non-PEO Named Executive Officers ($) (1)(2) |
Average Compensation Actually Paid to Non-PEO Named Executive Officers ($) (1)(3) |
Value of Initial Fixed $100 Investment Based on Total Shareholder Return ($) (4) |
Net Loss ($) (5)(6) (in thousands) |
||||||||||||||||||
2024 |
$ | 875,320 | $ | 814,693 | $ | 578,612 | $ | 552,364 | $ | 0.01 | $ | (39.25 | ) | |||||||||||
2023 |
$ | 815,854 | $ | 611,189 | $ | 560,486 | $ | 472,646 | $ | 0.08 | $ | (41.90 | ) | |||||||||||
2022 |
$ | 1,087,406 | $ | 491,160 | $ | 592,096 | $ | 442,188 | $ | 3.55 | $ | (48.40 | ) | |||||||||||
2021 |
$ | 3,059,658 | $ | 1,356,572 | $ | 929,294 | $ | 598,918 | $ | 42.54 | $ | (52.60 | ) | |||||||||||
| (1) | During fiscal years 2024, 2023, 2022 and 2021, the PEO was Lisa Conte. During fiscal years 2024 and 2023, the non-PEO NEOs were Dr. Chaturvedi, Dr. King, and Mr. Wolin. During fiscal year 2022, the non-PEO NEOs were Dr. Chaturvedi, Dr. King, Mr. Wolin, and Mr. Wendt. During fiscal year 2021, the non-PEO NEOs were Dr. King, Mr. Wolin, and Mr. Wendt. |
| (2) | The dollar amounts reported are the amounts of total compensation reported for Ms. Conte and the average total compensation reported for non-PEO NEOs for the applicable fiscal year in the “Total” column of the Summary Compensation Table (SCT). |
| (3) | The following table sets forth the adjustments made to the SCT total for 2024, 2023, 2022, and 2021 in the pay versus performance table to arrive at “compensation actually paid” to our PEO and non-PEO NEOs, as computed in accordance with Item 402(v) of Regulation S-K: |
Fiscal Year 2024 |
PEO |
Non-PEO NEOs |
||||||
SCT Total |
$ |
875,320 |
$ |
578,612 |
||||
Less: Amount reported under the “Stock Awards” & “Option Awards” columns in the SCT |
$ | 181,455 | $ | 54,120 | ||||
Add: Fair value as of fiscal year-end of awards granted during the fiscal year that are outstanding and unvested as of the end of the fiscal year |
$ | 157,476 | $ | 46,969 | ||||
Add: Change in fair value as of fiscal year-end, compared to prior fiscal year-end, of awards granted in any prior fiscal year that are outstanding and unvested as of the end of the fiscal year |
$ | (26,173 | ) | $ | (12,665 | ) | ||
Add: Fair value as of vest date of awards granted and vested in the fiscal year |
$ | 6,838 | $ | 2,039 | ||||
Add: Change in fair value as of vesting date, compared to prior fiscal year-end, of awards granted in any prior fiscal year for which all vesting conditions were satisfied at fiscal year-end or during the fiscal year |
$ | (17,314 | ) | $ | (8,471 | ) | ||
Less: Forfeitures during fiscal year equal to prior fiscal year-end value |
$ | 0 | $ | 0 | ||||
Total Adjustments |
$ |
(60,627 |
) |
$ |
(26,248 |
) | ||
Compensation Actually Paid * |
$ |
814,693 |
$ |
552,364 |
||||
Fiscal Year 2023 |
PEO |
Non-PEO NEOs |
||||||
SCT Total |
$ |
815,854 |
$ |
560,486 |
||||
Less: Amount reported under the “Stock Awards” & “Option Awards” columns in the SCT |
$ | 205,190 | $ | 99,846 | ||||
Add: Fair value as of fiscal year-end of awards granted during the fiscal year that are outstanding and unvested as of the end of the fiscal year |
$ | 58,078 | $ | 28,261 | ||||
Add: Change in fair value as of fiscal year-end, compared to prior fiscal year-end, of awards granted in any prior fiscal year that are outstanding and unvested as of the end of the fiscal year |
$ | (38,102 | ) | $ | (10,841 | ) | ||
Add: Fair value as of vest date of awards granted and vested in the fiscal year |
$ | 0 | $ | 0 | ||||
Add: Change in fair value as of vesting date, compared to prior fiscal year-end, of awards granted in any prior fiscal year for which all vesting conditions were satisfied at fiscal year-end or during the fiscal year |
$ | (19,451 | ) | $ | (5,414 | ) | ||
Less: Forfeitures during fiscal year equal to prior fiscal year-end value |
$ | 0 | $ | 0 | ||||
Total Adjustments |
$ |
(204,665 |
) |
$ |
(87,840 |
) | ||
Compensation Actually Paid * |
$ |
611,189 |
$ |
472,646 |
||||
Fiscal Year 2022 |
PEO |
Non-PEO NEOs |
||||||
SCT Total |
$ |
1,087,406 |
$ |
592,096 |
||||
Less: Amount reported under the “Stock Awards” & “Option Awards” columns in the SCT |
$ | 327,403 | $ | 97,811 | ||||
Add: Fair value as of fiscal year-end of awards granted during the fiscal year that are outstanding and unvested as of the end of the fiscal year |
$ | 52,685 | $ | 16,390 | ||||
Add: Change in fair value as of fiscal year-end, compared to prior fiscal year-end, of awards granted in any prior fiscal year that are outstanding and unvested as of the end of the fiscal year |
$ | (91,523 | ) | $ | (18,798 | ) | ||
Add: Fair value as of vest date of awards granted and vested in the fiscal year |
$ | 0 | $ | 0 | ||||
Add: Change in fair value as of vesting date, compared to prior fiscal year-end, of awards granted in any prior fiscal year for which all vesting conditions were satisfied at fiscal year-end or during the fiscal year |
$ | (101,440 | ) | $ | (23,499 | ) | ||
Less: Forfeitures during fiscal year equal to prior fiscal year-end value |
$ | (128,565 | ) | $ | (26,190 | ) | ||
Total Adjustments |
$ |
(596,246 |
) |
$ |
(149,908 |
) | ||
Compensation Actually Paid * |
$ |
491,160 |
$ |
442,188 |
||||
Fiscal Year 2021 |
PEO |
Non-PEO NEOs |
||||||
SCT Total |
$ |
3,059,658 |
$ |
929,294 |
||||
Less: Amount reported under the “Stock Awards” & “Option Awards” columns in the SCT |
$ | 2,314,061 | $ | 456,327 | ||||
Add: Fair value as of fiscal year-end of awards granted during the fiscal year that are outstanding and unvested as of the end of the fiscal year |
$ | 327,531 | $ | 64,655 | ||||
Add: Change in fair value as of fiscal year-end, compared to prior fiscal year-end, of awards granted in any prior fiscal year that are outstanding and unvested as of the end of the fiscal year |
$ | (140,704 | ) | $ | (37,996 | ) | ||
Add: Fair value as of vest date of awards granted and vested in the fiscal year |
$ | 182,253 | $ | 35,997 | ||||
Add: Change in fair value as of vesting date, compared to prior fiscal year-end, of awards granted in any prior fiscal year for which all vesting conditions were satisfied at fiscal year-end or during the fiscal year |
$ | 241,894 | $ | 63,295 | ||||
Less: Forfeitures during fiscal year equal to prior fiscal year-end value |
$ | 0 | $ | 0 | ||||
Total Adjustments |
$ |
(1,703,086 |
) |
$ |
(330,376 |
) | ||
Compensation Actually Paid * |
$ |
1,356,572 |
$ |
598,918 |
||||
| (4) | The amounts reported represent the measurement period value of an investment of $100 in our stock on December 31, 2020 (the last trading day before the 2021 fiscal year), and then valued again on each of December 31, 2021 (the last trading day of the 2021 fiscal year), December 30, 2022 (the last trading day of the 2022 fiscal year), December 29, 2023 (the last trading day of the 2023 fiscal year), and December 31, 2024 (the last trading day of the 2024 fiscal year), based on the closing price per share of the Company’s common stock as of such dates and assuming the reinvestment of dividends. |
| (5) | The amounts reported represent net income (loss) for the applicable fiscal year calculated in accordance with generally accepted accounting principles in the United States. |
| (6) | Net Loss: The dollar amounts reported represent the amount of net loss reflected in the Company’s audited financial statements for the applicable year. |
| * | The valuation assumptions for stock option awards included in Compensation Actually Paid are: (i) the expected life of each stock option, which is determined using the “simplified method” and which takes into account the average of the remaining vesting period and remaining term as of the vest or fiscal year end date; (ii) the exercise price and the asset price, which are based on the closing price of our Common Stock traded on the Nasdaq on the vest and fiscal year end date, respectively; (iii) the risk-free rate, which is based on the Treasury Constant Maturity rate closest to the remaining expected life as of the vest or fiscal year end date; (iv) historical volatility, which is based on the daily price history for our Common stock for each expected life period prior to each vest or fiscal year end date; and (v) the annual dividend yield, which for Jaguar Health was zero as we do not pay dividends. |
| (1) | During fiscal years 2024, 2023, 2022 and 2021, the PEO was Lisa Conte. During fiscal years 2024 and 2023, the non-PEO NEOs were Dr. Chaturvedi, Dr. King, and Mr. Wolin. During fiscal year 2022, the non-PEO NEOs were Dr. Chaturvedi, Dr. King, Mr. Wolin, and Mr. Wendt. During fiscal year 2021, the non-PEO NEOs were Dr. King, Mr. Wolin, and Mr. Wendt. |
| (3) | The following table sets forth the adjustments made to the SCT total for 2024, 2023, 2022, and 2021 in the pay versus performance table to arrive at “compensation actually paid” to our PEO and non-PEO NEOs, as computed in accordance with Item 402(v) of Regulation S-K: |
Fiscal Year 2024 |
PEO |
Non-PEO NEOs |
||||||
SCT Total |
$ |
875,320 |
$ |
578,612 |
||||
Less: Amount reported under the “Stock Awards” & “Option Awards” columns in the SCT |
$ | 181,455 | $ | 54,120 | ||||
Add: Fair value as of fiscal year-end of awards granted during the fiscal year that are outstanding and unvested as of the end of the fiscal year |
$ | 157,476 | $ | 46,969 | ||||
Add: Change in fair value as of fiscal year-end, compared to prior fiscal year-end, of awards granted in any prior fiscal year that are outstanding and unvested as of the end of the fiscal year |
$ | (26,173 | ) | $ | (12,665 | ) | ||
Add: Fair value as of vest date of awards granted and vested in the fiscal year |
$ | 6,838 | $ | 2,039 | ||||
Add: Change in fair value as of vesting date, compared to prior fiscal year-end, of awards granted in any prior fiscal year for which all vesting conditions were satisfied at fiscal year-end or during the fiscal year |
$ | (17,314 | ) | $ | (8,471 | ) | ||
Less: Forfeitures during fiscal year equal to prior fiscal year-end value |
$ | 0 | $ | 0 | ||||
Total Adjustments |
$ |
(60,627 |
) |
$ |
(26,248 |
) | ||
Compensation Actually Paid * |
$ |
814,693 |
$ |
552,364 |
||||
Fiscal Year 2023 |
PEO |
Non-PEO NEOs |
||||||
SCT Total |
$ |
815,854 |
$ |
560,486 |
||||
Less: Amount reported under the “Stock Awards” & “Option Awards” columns in the SCT |
$ | 205,190 | $ | 99,846 | ||||
Add: Fair value as of fiscal year-end of awards granted during the fiscal year that are outstanding and unvested as of the end of the fiscal year |
$ | 58,078 | $ | 28,261 | ||||
Add: Change in fair value as of fiscal year-end, compared to prior fiscal year-end, of awards granted in any prior fiscal year that are outstanding and unvested as of the end of the fiscal year |
$ | (38,102 | ) | $ | (10,841 | ) | ||
Add: Fair value as of vest date of awards granted and vested in the fiscal year |
$ | 0 | $ | 0 | ||||
Add: Change in fair value as of vesting date, compared to prior fiscal year-end, of awards granted in any prior fiscal year for which all vesting conditions were satisfied at fiscal year-end or during the fiscal year |
$ | (19,451 | ) | $ | (5,414 | ) | ||
Less: Forfeitures during fiscal year equal to prior fiscal year-end value |
$ | 0 | $ | 0 | ||||
Total Adjustments |
$ |
(204,665 |
) |
$ |
(87,840 |
) | ||
Compensation Actually Paid * |
$ |
611,189 |
$ |
472,646 |
||||
Fiscal Year 2022 |
PEO |
Non-PEO NEOs |
||||||
SCT Total |
$ |
1,087,406 |
$ |
592,096 |
||||
Less: Amount reported under the “Stock Awards” & “Option Awards” columns in the SCT |
$ | 327,403 | $ | 97,811 | ||||
Add: Fair value as of fiscal year-end of awards granted during the fiscal year that are outstanding and unvested as of the end of the fiscal year |
$ | 52,685 | $ | 16,390 | ||||
Add: Change in fair value as of fiscal year-end, compared to prior fiscal year-end, of awards granted in any prior fiscal year that are outstanding and unvested as of the end of the fiscal year |
$ | (91,523 | ) | $ | (18,798 | ) | ||
Add: Fair value as of vest date of awards granted and vested in the fiscal year |
$ | 0 | $ | 0 | ||||
Add: Change in fair value as of vesting date, compared to prior fiscal year-end, of awards granted in any prior fiscal year for which all vesting conditions were satisfied at fiscal year-end or during the fiscal year |
$ | (101,440 | ) | $ | (23,499 | ) | ||
Less: Forfeitures during fiscal year equal to prior fiscal year-end value |
$ | (128,565 | ) | $ | (26,190 | ) | ||
Total Adjustments |
$ |
(596,246 |
) |
$ |
(149,908 |
) | ||
Compensation Actually Paid * |
$ |
491,160 |
$ |
442,188 |
||||
Fiscal Year 2021 |
PEO |
Non-PEO NEOs |
||||||
SCT Total |
$ |
3,059,658 |
$ |
929,294 |
||||
Less: Amount reported under the “Stock Awards” & “Option Awards” columns in the SCT |
$ | 2,314,061 | $ | 456,327 | ||||
Add: Fair value as of fiscal year-end of awards granted during the fiscal year that are outstanding and unvested as of the end of the fiscal year |
$ | 327,531 | $ | 64,655 | ||||
Add: Change in fair value as of fiscal year-end, compared to prior fiscal year-end, of awards granted in any prior fiscal year that are outstanding and unvested as of the end of the fiscal year |
$ | (140,704 | ) | $ | (37,996 | ) | ||
Add: Fair value as of vest date of awards granted and vested in the fiscal year |
$ | 182,253 | $ | 35,997 | ||||
Add: Change in fair value as of vesting date, compared to prior fiscal year-end, of awards granted in any prior fiscal year for which all vesting conditions were satisfied at fiscal year-end or during the fiscal year |
$ | 241,894 | $ | 63,295 | ||||
Less: Forfeitures during fiscal year equal to prior fiscal year-end value |
$ | 0 | $ | 0 | ||||
Total Adjustments |
$ |
(1,703,086 |
) |
$ |
(330,376 |
) | ||
Compensation Actually Paid * |
$ |
1,356,572 |
$ |
598,918 |
||||
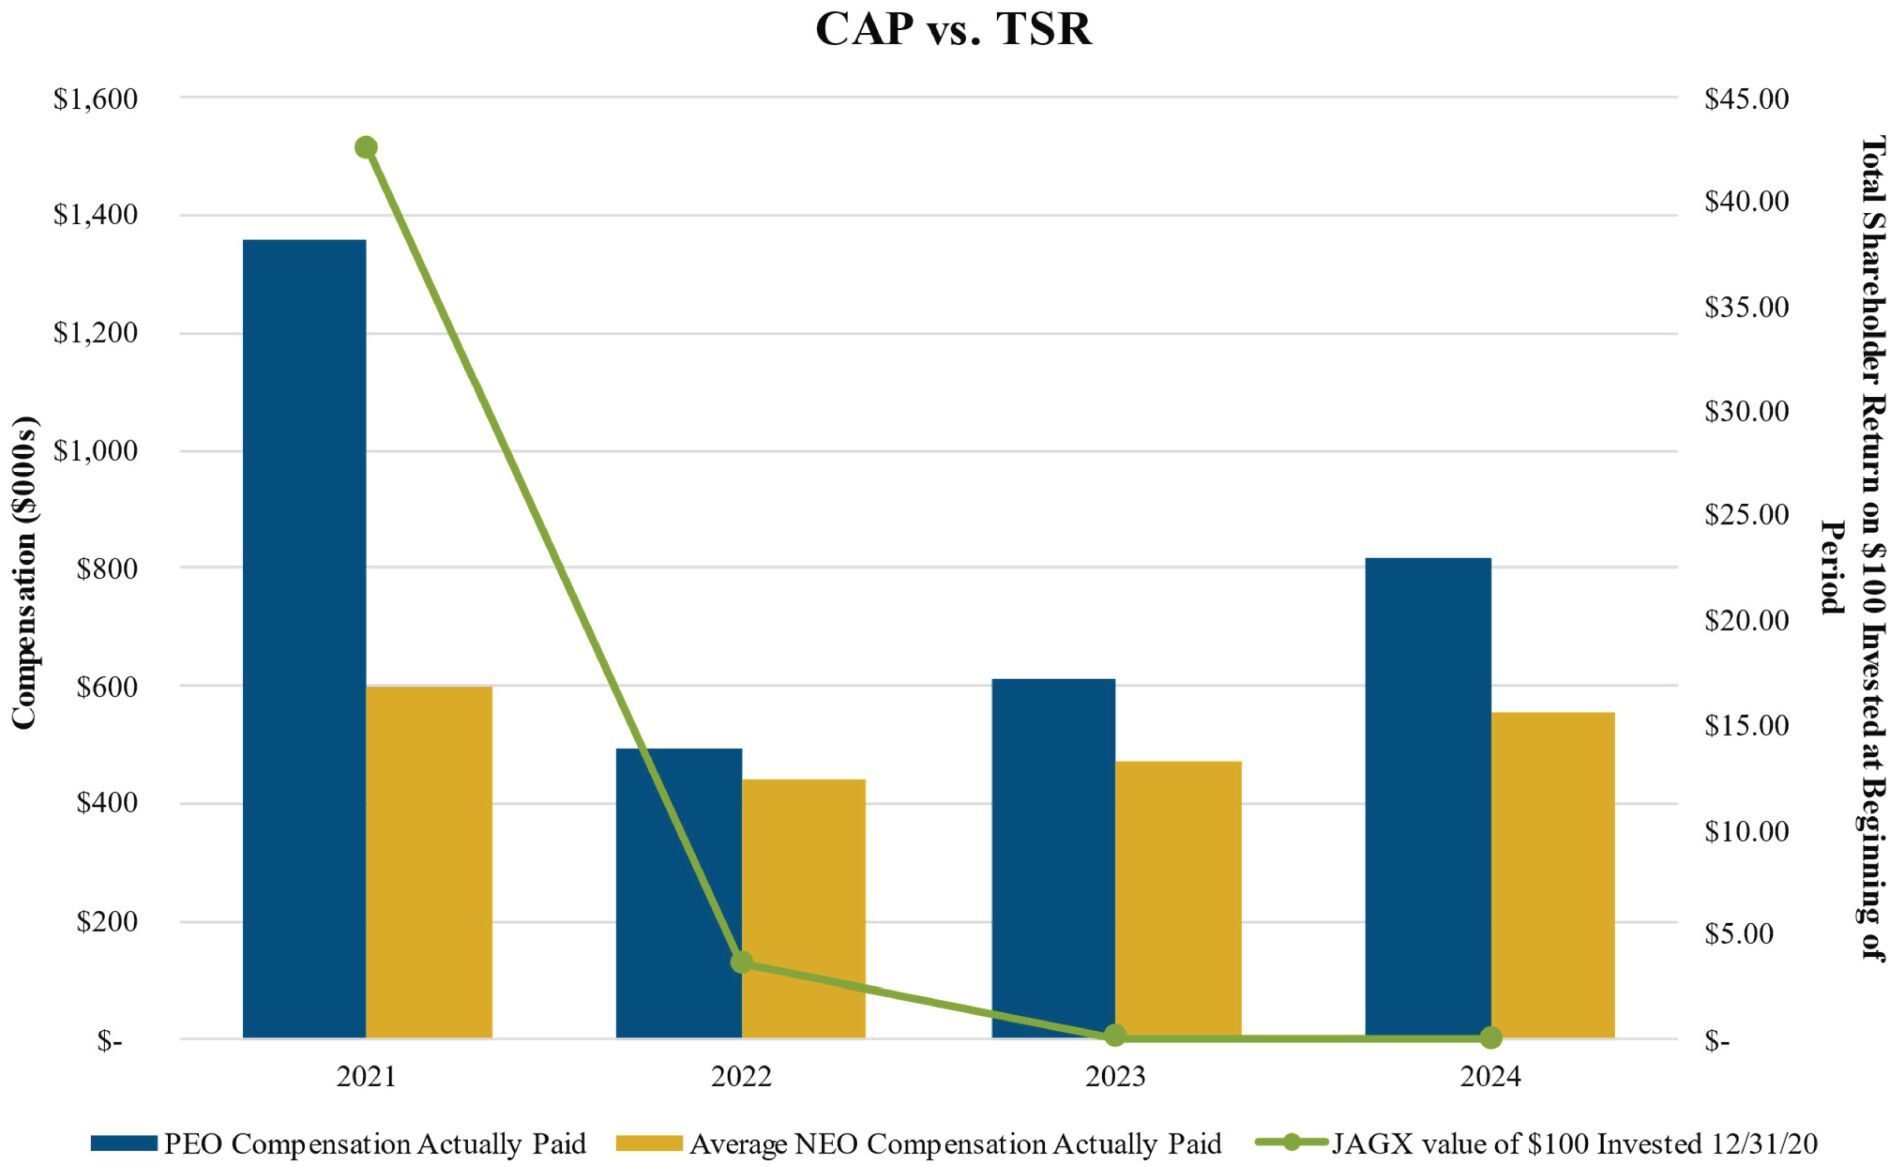
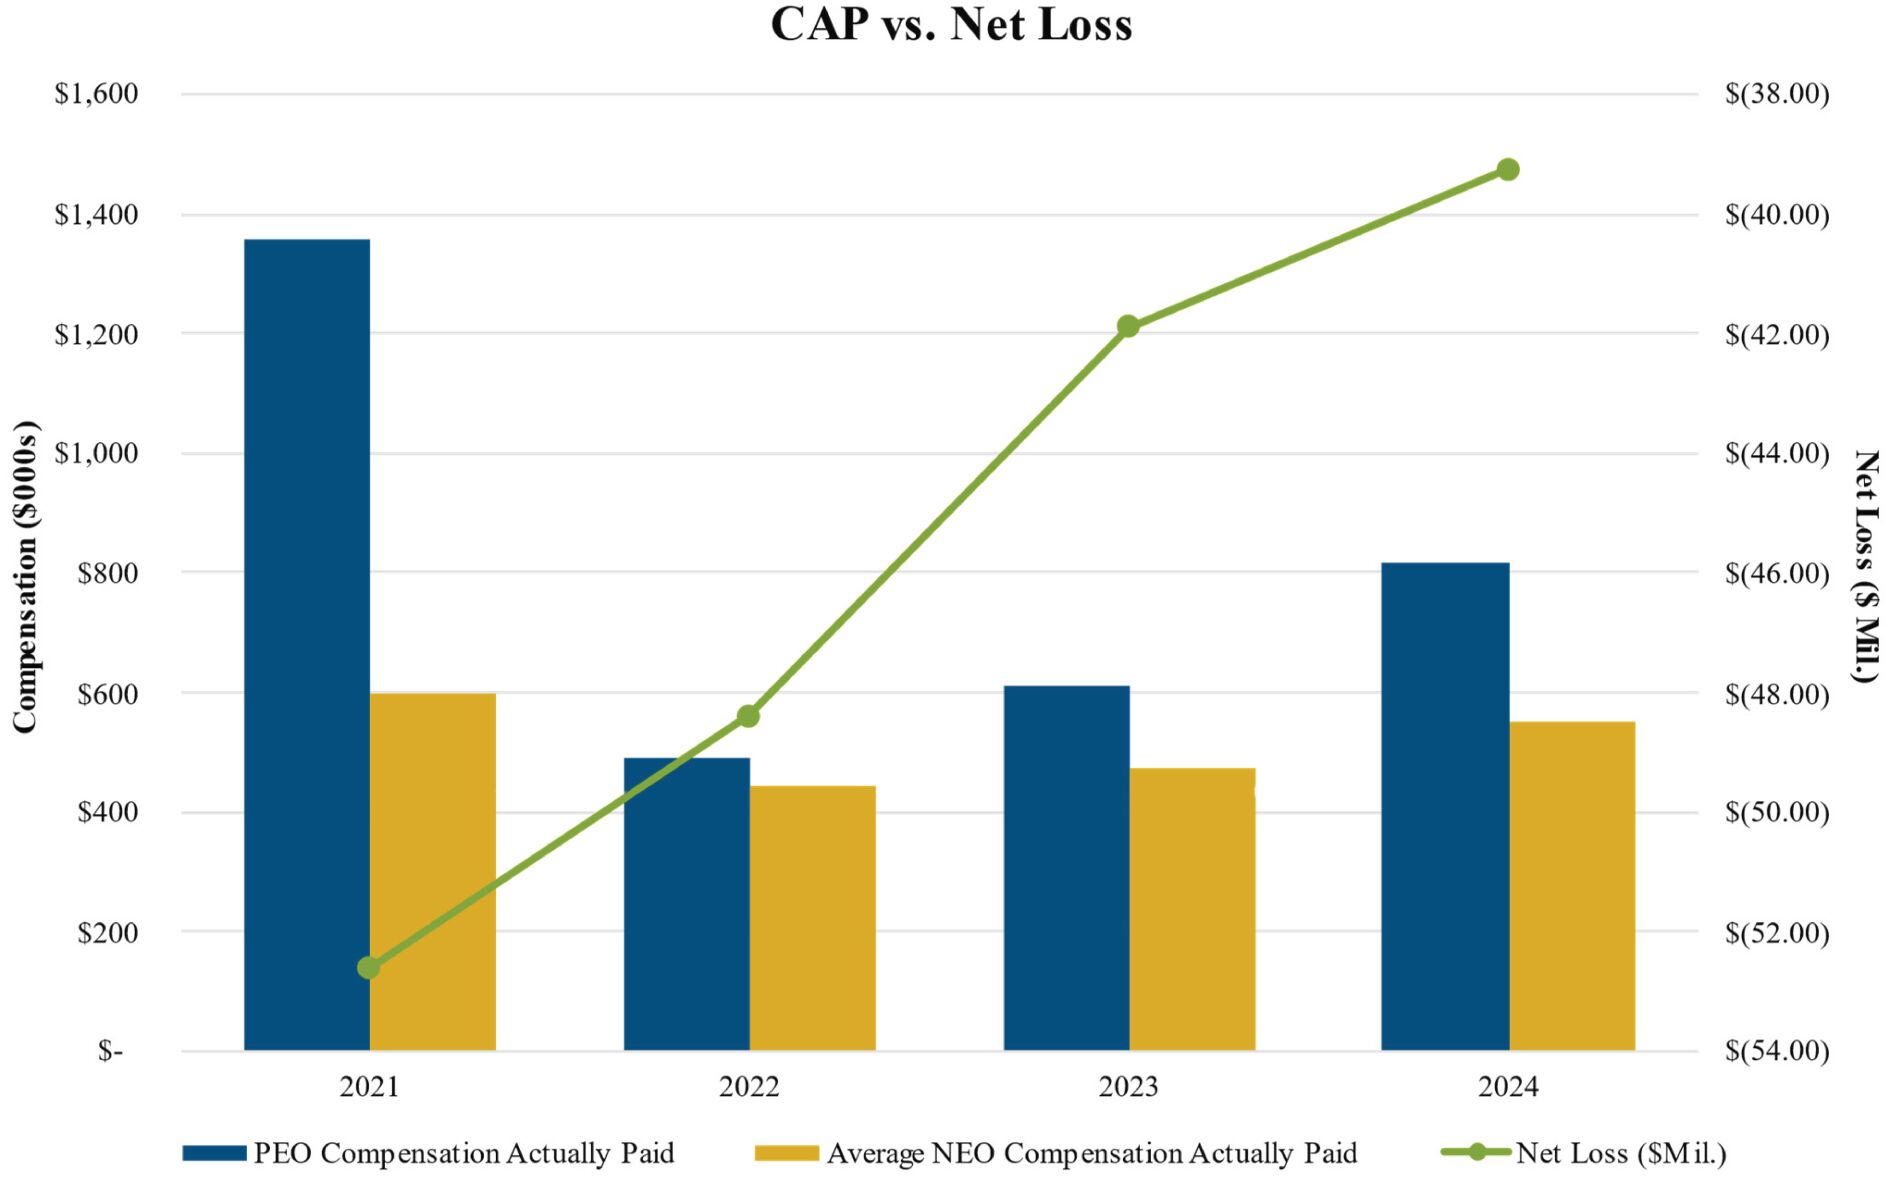
Relationship Between CAP Amounts and Performance Measures
The following charts show graphically the relationships over the past three years of the CAP Amounts for the PEO and
non-PEO
NEOs as compared to our (i) cumulative total shareholder return and (ii) net income (loss).