|
|
|
|
|
|
|
|
| Value of |
| ||||||||||
Initial Fixed | ||||||||||||||||||||
Average | $100 | |||||||||||||||||||
Summary | Summary | Summary | Summary | Average | Investment | |||||||||||||||
Compensation | Compensation | Compensation | Compensation | Compensation | Compensation | Compensation | Compensation | Based on | ||||||||||||
Table | Actually | Table | Actually | Table | Actually | Table | Actually | Total | ||||||||||||
Total for | Paid to | Total for | Paid to | Total for | Paid to | Total for | Paid to | Shareholder | ||||||||||||
PEO #1 | PEO #1 | PEO #2 | PEO #2 | PEO #3 | PEO #3 | Non-PEO | Non-PEO | Return | ||||||||||||
Year | ($)(1) | ($)(2) | ($)(1) | ($)(2) | ($)(1) | ($)(1) | NEOs ($)(1) | NEOs ($)(2) | ($)(3) | Net Income ($) | ||||||||||
2025 |
| 1,481,716 |
| 1,609,280 |
| 458,684 |
| 483,033 |
| — |
| — |
| 442,332 |
| 459,921 |
| (17.3) |
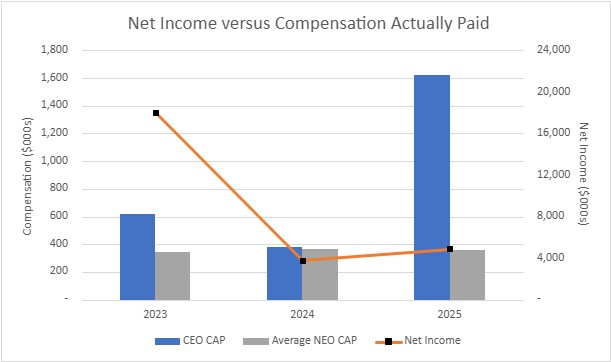
| 4,903,000 |
2024 |
| — |
| — |
| 403,949 |
| 382,111 |
| 264,775 |
| 264,775 |
| 380,390 |
| 362,957 |
| (22.0) |
| 3,799,000 |
2023 |
| — |
| — |
| — |
| — |
| 922,466 |
| 620,953 |
| 406,203 |
| 340,870 |
| (17.7) |
| 18,069,000 |
(1) | During the year ended March 31, 2025, B. Nicole Sherman (PEO #1) and Daniel D. Cox (PEO #2) each served as our principal executive officer (“PEO”). During the year ended March 31, 2024, Daniel D. Cox (PEO #2) and Kevin J. Lycklama (PEO #3) each served as our PEO. For 2023, Kevin J. Lycklama (PEO #3) served as our PEO. The non-PEO named executive officers (non-PEO NEOs) for 2025 are Daniel D. Cox and C. Evan Sowers, for 2024 are C. Evan Sowers and David Lam, and for 2023 are Daniel D. Cox and David Lam. |
(2) | The amounts shown for Compensation Actually Paid have been calculated in accordance with Item 402(v) of Regulation S-K and do not reflect compensation actually earned, realized, or received by Riverview’s NEOs. These amounts reflect the Summary Compensation Table totals with certain adjustments. Adjustments for 2025 are as follows: |
|
|
| Average of | |||
Non-PEO | ||||||
PEO #1 ($) | PEO #2 ($) | NEOs ($) | ||||
Summary Compensation Table total |
| 1,481,716 |
| 458,684 |
| 442,332 |
Deduction for amounts reported under the Stock Awards column in the Summary Compensation Table |
| 896,060 |
| 63,861 |
| 55,146 |
Year-end value of equity awards granted during year that remain unvested as of year‑end |
| 878,948 |
| 62,642 |
| 54,093 |
Year over year change in fair value of outstanding and unvested equity awards |
| 144,676 |
| 19,380 |
| 15,875 |
Year over year change in fair value of equity awards granted in prior years and vested in the year |
| — |
| 6,188 |
| 2,767 |
Compensation Actually Paid |
| 1,609,280 |
| 483,033 |
| 459,921 |
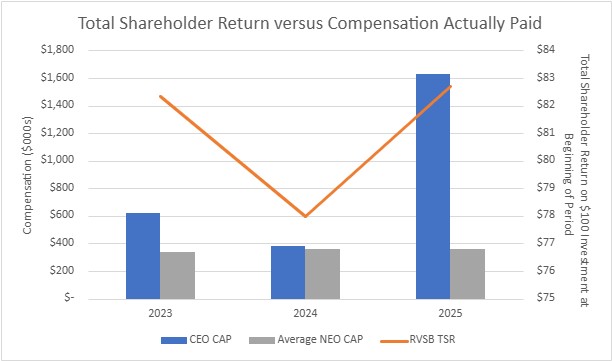
(3) | Total Shareholder Return assumes $100 invested on March 31, 2022, with all dividends reinvested. |
(1) | During the year ended March 31, 2025, B. Nicole Sherman (PEO #1) and Daniel D. Cox (PEO #2) each served as our principal executive officer (“PEO”). During the year ended March 31, 2024, Daniel D. Cox (PEO #2) and Kevin J. Lycklama (PEO #3) each served as our PEO. For 2023, Kevin J. Lycklama (PEO #3) served as our PEO. The non-PEO named executive officers (non-PEO NEOs) for 2025 are Daniel D. Cox and C. Evan Sowers, for 2024 are C. Evan Sowers and David Lam, and for 2023 are Daniel D. Cox and David Lam. |
(2) | The amounts shown for Compensation Actually Paid have been calculated in accordance with Item 402(v) of Regulation S-K and do not reflect compensation actually earned, realized, or received by Riverview’s NEOs. These amounts reflect the Summary Compensation Table totals with certain adjustments. Adjustments for 2025 are as follows: |
|
|
| Average of | |||
Non-PEO | ||||||
PEO #1 ($) | PEO #2 ($) | NEOs ($) | ||||
Summary Compensation Table total |
| 1,481,716 |
| 458,684 |
| 442,332 |
Deduction for amounts reported under the Stock Awards column in the Summary Compensation Table |
| 896,060 |
| 63,861 |
| 55,146 |
Year-end value of equity awards granted during year that remain unvested as of year‑end |
| 878,948 |
| 62,642 |
| 54,093 |
Year over year change in fair value of outstanding and unvested equity awards |
| 144,676 |
| 19,380 |
| 15,875 |
Year over year change in fair value of equity awards granted in prior years and vested in the year |
| — |
| 6,188 |
| 2,767 |
Compensation Actually Paid |
| 1,609,280 |
| 483,033 |
| 459,921 |