Financial Report April - June 2025
Stockholm, Sweden, July 18, 2025 |
|

Exhibit 99.1
Financial Report April - June 2025
Stockholm, Sweden, July 18, 2025 |
|
Financial Report April - June 2025 |
Q2 2025: Q2 records for sales, operating income and margin as well as EPS
Financial highlights Q2 2025 $2,714 million net sales 4.2% net sales increase 3.4% organic sales growth* 9.1% operating margin 9.3% adjusted operating margin* $2.16 diluted EPS, 27% increase $2.21 adjusted diluted EPS*, 18% increase |
|
Full year 2025 guidance Around 3% organic sales growth Around 0% FX effect on net sales Around 10-10.5% adjusted operating margin Around $1.2 billion operating cash flow
|
All change figures in this release compare to the same period of the previous year except when stated otherwise.
*For non-U.S. GAAP measures see enclosed reconciliation tables. |
Key Figures
(Dollars in millions, except per share data) |
Q2 2025 |
Q2 2024 |
Change |
6M 2025 |
6M 2024 |
Change |
Net sales |
$2,714 |
$2,605 |
4.2% |
$5,292 |
$5,220 |
1.4% |
Operating income |
247 |
206 |
20% |
502 |
400 |
25% |
Adjusted operating income1) |
251 |
221 |
14% |
506 |
420 |
21% |
Operating margin |
9.1% |
7.9% |
1.2pp |
9.5% |
7.7% |
1.8pp |
Adjusted operating margin1) |
9.3% |
8.5% |
0.8pp |
9.6% |
8.0% |
1.5pp |
Earnings per share - diluted |
2.16 |
1.71 |
27% |
4.31 |
3.23 |
34% |
Adjusted earnings per share - diluted1) |
2.21 |
1.87 |
18% |
4.36 |
3.45 |
27% |
Operating cash flow |
277 |
340 |
(18)% |
355 |
462 |
(23)% |
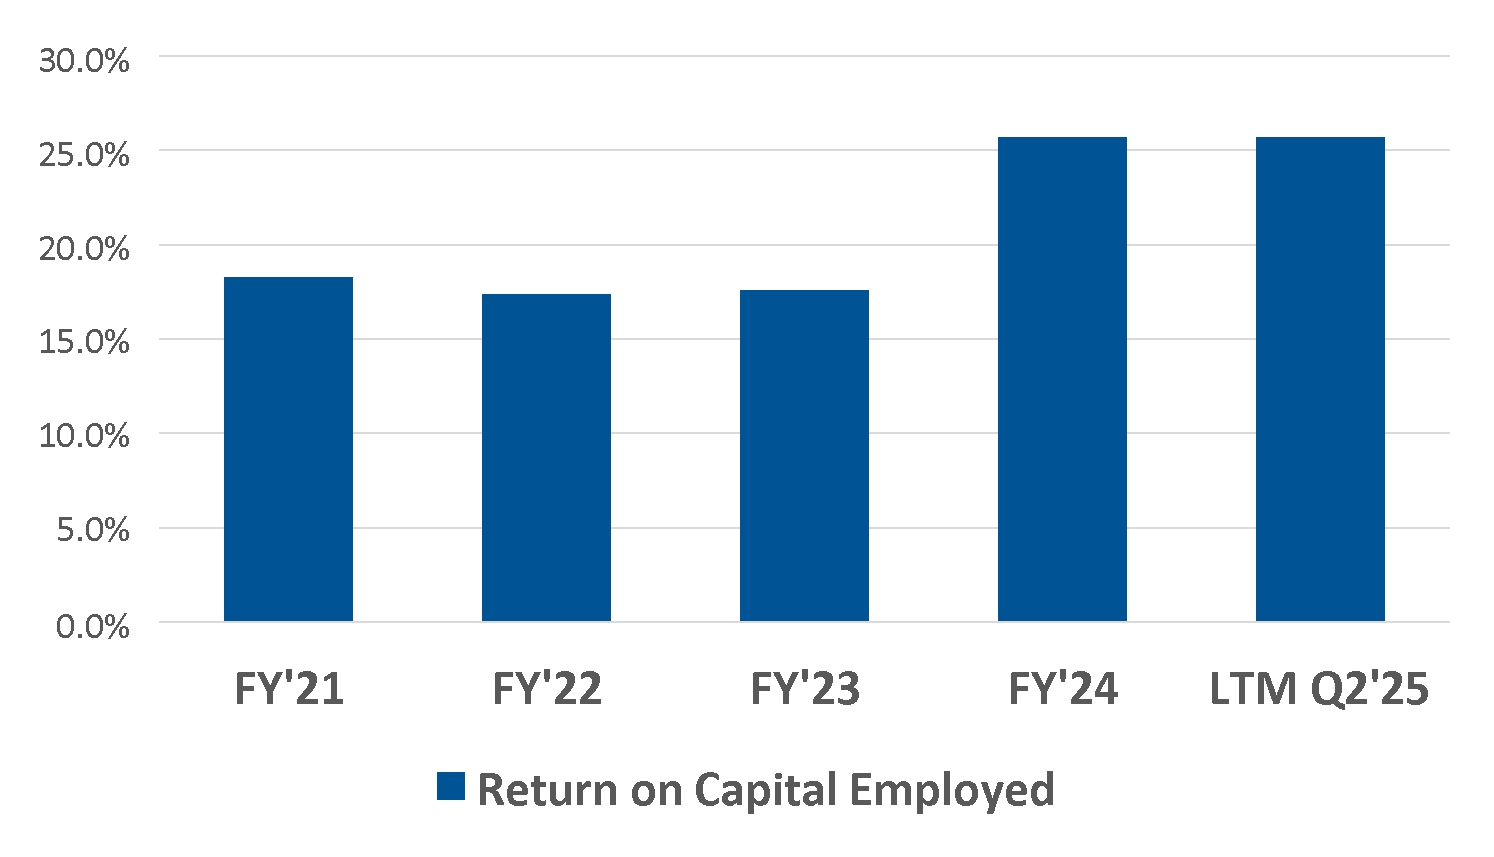
Return on capital employed2) |
23.8% |
21.0% |
2.7pp |
24.8% |
20.4% |
4.3pp |
Adjusted return on capital employed1,2) |
24.1% |
22.5% |
1.6pp |
25.0% |
21.4% |
3.6pp |
1) Excluding effects from capacity alignments and antitrust related matters. Non-U.S. GAAP measure, see reconciliation table. |
||||||
Comments from Mikael Bratt, President & CEO |
|
|
|
|
I am pleased to, in a turbulent market environment, report a record breaking second quarter for sales, operating income and margin as well as EPS. The performance was driven by good sales development coupled with successful actions to reduce costs and achieve tariff compensations. We outperformed in Americas, Europe and Asia |
together with continued repurchases of shares, contributed to a 27% increase in EPS. We remain confident that we can continue to successfully receive compensation from our customers for tariffs, although the industry outlook for tariffs is uncertain. We recovered around 80% of tariff costs in the second quarter, and we expect to recover most of what remains later in the year. We continue to closely monitor and evaluate the situation, focusing on being adaptive and agile. At our Capital Markets Day in June, we reiterated our financial targets and communicated a new share repurchase program of up to $2.5 billion until the end of 2029 as well as announced a 21% dividend increase for the third quarter to $0.85 per share. Our increased shareholder return ambitions are supported by our strong balance sheet and cash conversion. Our 2025 guidance for organic sales growth has increased to around 3% due to tariff compensations, and we reiterate our guidance of an adjusted operating margin of around 10-10.5%. |
|
excl. China and continued to outperform global LVP despite strong headwinds from LVP mix shifts, particularly in China. Based on a positive trend during the second quarter and a record number of new launches we continue to expect significantly improved sales vs. LVP in China in the second half year. We remain focused on operational efficiency, commercial excellence and our cost reduction programs. Direct headcount was reduced by 6% while sales grew 3% organically, which |
|||
1
Financial Report April - June 2025 |
Full year 2025 guidance
In addition to the assumptions and our business and market update noted below, our full year 2025 guidance is based on our customer call-offs, as well as the achievement of our targeted cost compensation adjustments with our customers, including for the new tariffs, no further material changes to tariffs or trade restrictions, as compared to what is in effect as of July 10, 2025, as well as no significant changes in the macro-economic environment, changes to customer call-off volatility or significant supply chain disruptions.
Full year 2025 Guidance |
|
Organic sales growth |
Around 3% |
Adjusted operating margin1) |
Around 10-10.5% |
Operating cash flow2) |
Around $1.2 billion |
Capex, net, % of sales |
Around 5% |
1) Excluding effects from capacity alignments, antitrust related matters and other discrete items. 2) Excluding unusual items. |
|
Full year 2025 Assumptions |
|
LVP growth |
Around 0.5% negative |
FX impact on net sales |
Around 0% |
Tax rate3) |
Around 28% |
3) Excluding unusual tax items. |
|
The forward-looking non-U.S. GAAP financial measures above are provided on a non-U.S. GAAP basis. Autoliv has not provided a U.S. GAAP reconciliation of these measures because items that impact these measures, such as costs and gains related to capacity alignments and antitrust matters, cannot be reasonably predicted or determined. As a result, such reconciliation is not available without unreasonable efforts and Autoliv is unable to determine the probable significance of the unavailable information.
Conference call and webcast
The earnings conference call will be held at 2:00 p.m. CET today, July 18, 2025. Information regarding how to participate is available on www.autoliv.com. The presentation slides for the conference call will be available on our website shortly after the publication of this financial report.
2
Financial Report April - June 2025 |
Business and market condition update
Supply Chain
In the second quarter of 2025, global LVP increased by 2.7% year-over-year (according to S&P Global July 2025). Call-off volatility improved slightly compared to a year earlier and was comparable to the first quarter of 2025, although it remains higher than pre-pandemic levels. Low customer demand visibility and changes to customer call-offs with short notice, although it improved, continued to have some negative impact on our production efficiency and profitability. We expect call-off volatility in 2025 on average to be slightly lower than it was in 2024 but still remain higher than pre-pandemic levels. However, the continued uncertainty regarding future changes in tariffs and trade restrictions may lead to a more negative call-off volatility environment.
Inflation
In the second quarter, cost pressure from labor and other items impacted our profitability negatively, although to a lesser degree than in the second quarter of 2024. Most of the inflationary cost pressure was offset by price increases and other customer compensations in the quarter. Raw material price changes had a slightly negative impact on our profitability during the quarter. We expect raw material costs in 2025 to be slightly higher than in 2024. We expect cost pressure from general inflation to moderate in 2025, but we still expect some pressure coming mainly from labor, especially in Europe and the Americas and potentially from tariffs. The continued uncertainty regarding effects of tariffs and trade restrictions may lead to a more adverse inflation environment. We continue to execute on productivity and cost reduction initiatives to offset these cost pressures.
Geopolitical risks and tariffs
The effects from the new tariffs imposed in the first quarter did not have a material impact on our profitability in the second quarter, as we achieved customer compensations for almost all tariff costs. It is our ambition and expectation that we will continue to pass on tariff costs to our customers, although there is significant uncertainty. We recovered around 80% of the tariffs in the second quarter, and we expect to recover most of what remains later in the year. The impact of the tariffs not yet recovered on our operating income was around $7 million negative in the quarter. Including the dilutive effect of tariffs recovered, operating margin was negatively impacted by around 35 bps. For the full year 2025, we expect the tariff dilution on our operating margin to be around 20 bps. Geopolitical uncertainties will continue to create a challenging operating environment. We also believe there will be new or increased or changed tariffs or other related trade restrictions imposed in 2025 that may impact our operations and which contributes to the uncertainty of industry expectations. We continue to closely monitor the situation and are prepared to remain agile in responding to any such developments.
This report includes content supplied by S&P Global; Copyright © Light Vehicle Production Forecast, January, March and July 2025. All rights reserved.
3
Financial Report April - June 2025 |
Key Performance Trends
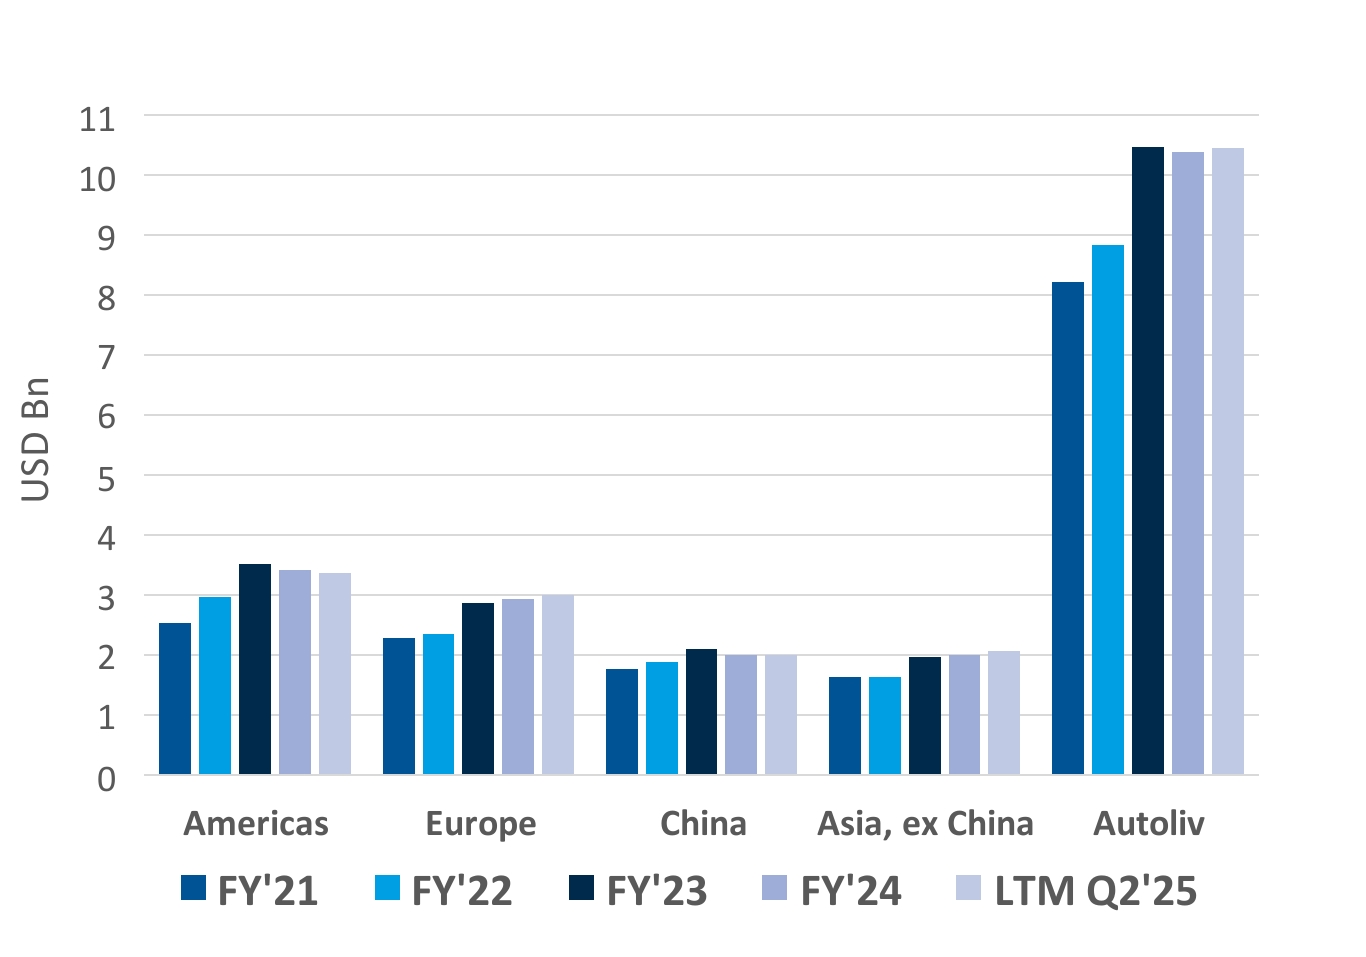
Net Sales Development by region |
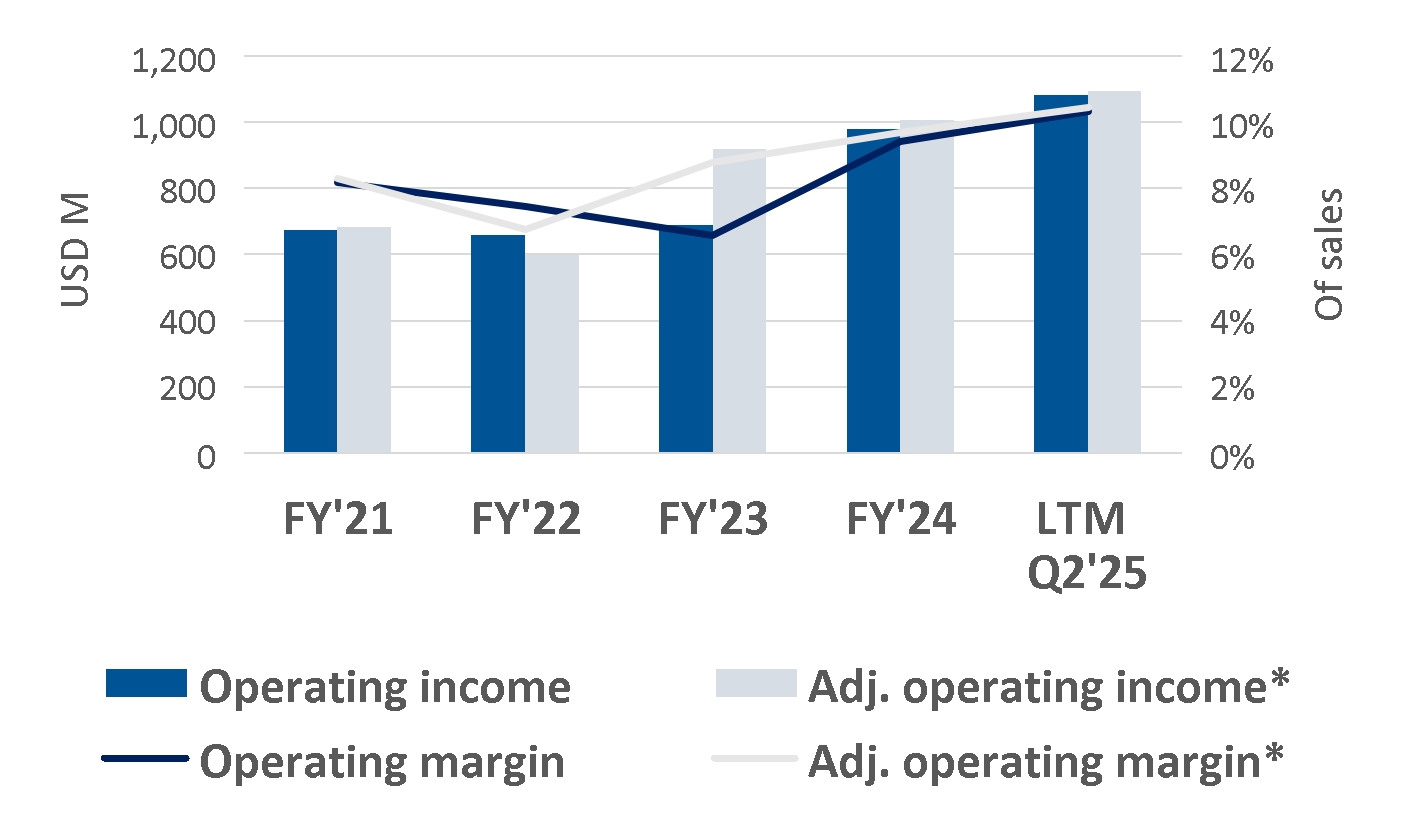
Operating and adjusted* operating income and margins |
|
|
|
|
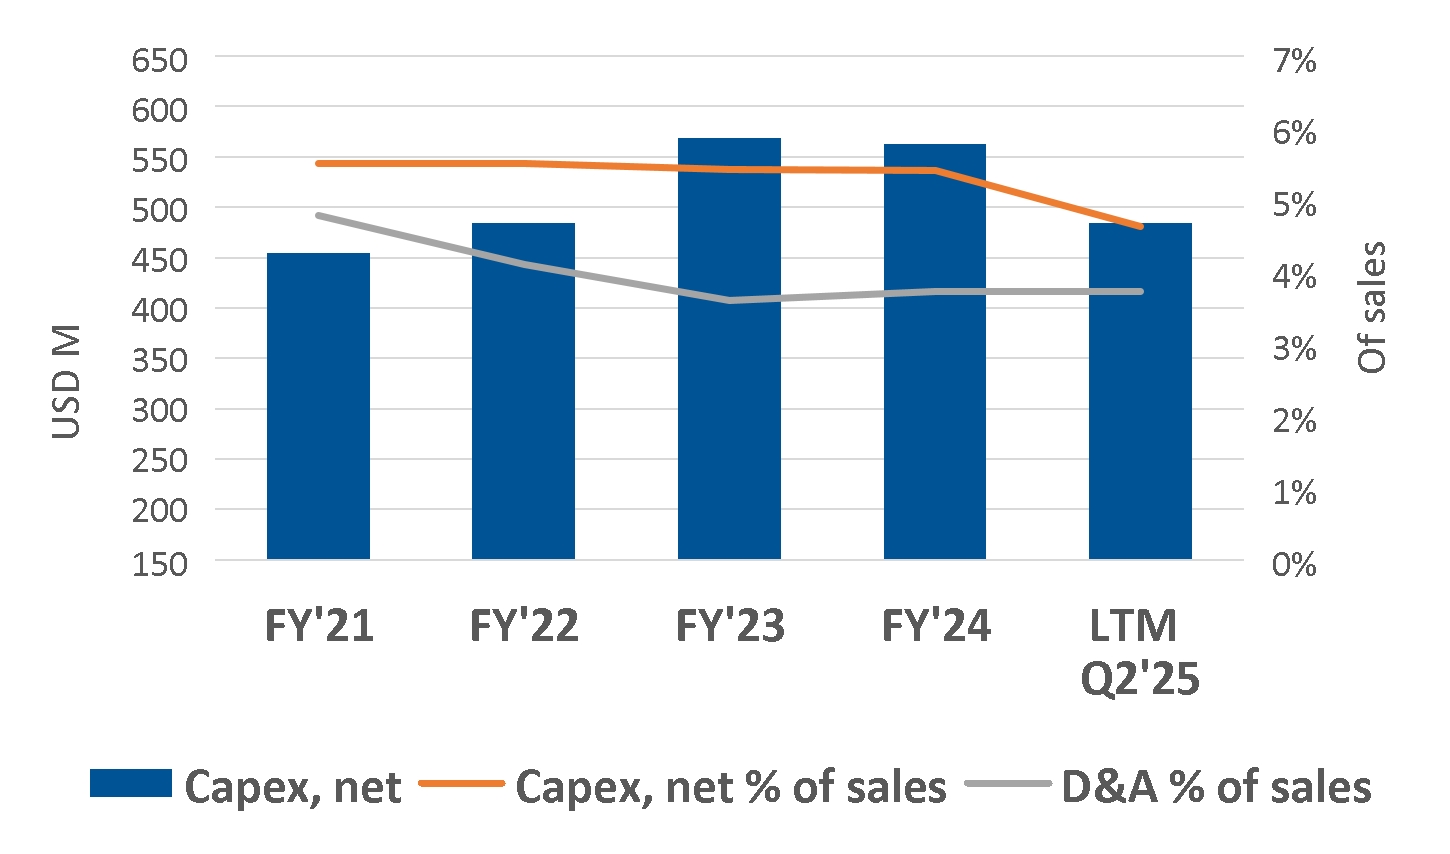
Capex, net and D&A |
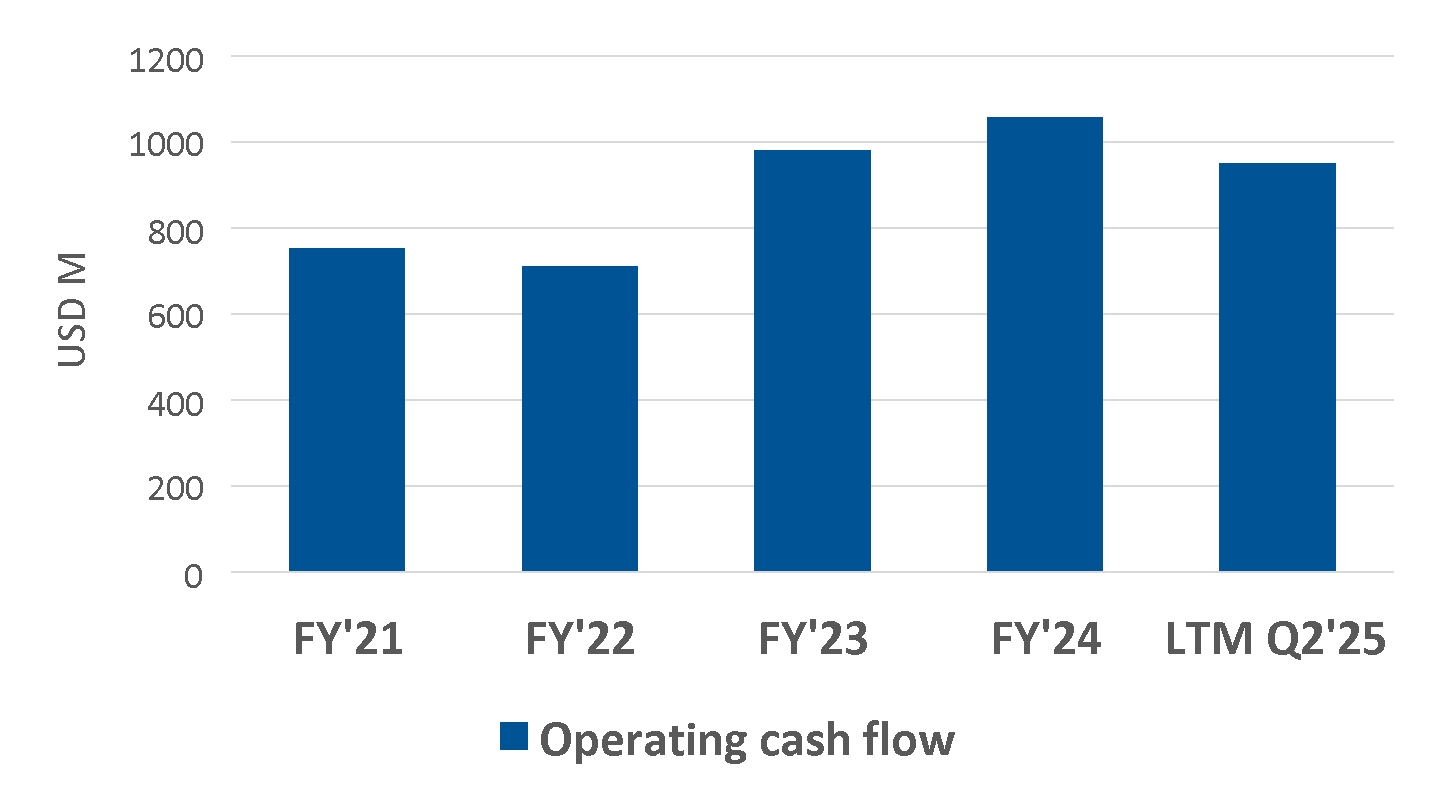
Operating cash flow |
|
|
|
|
Return on Capital Employed |
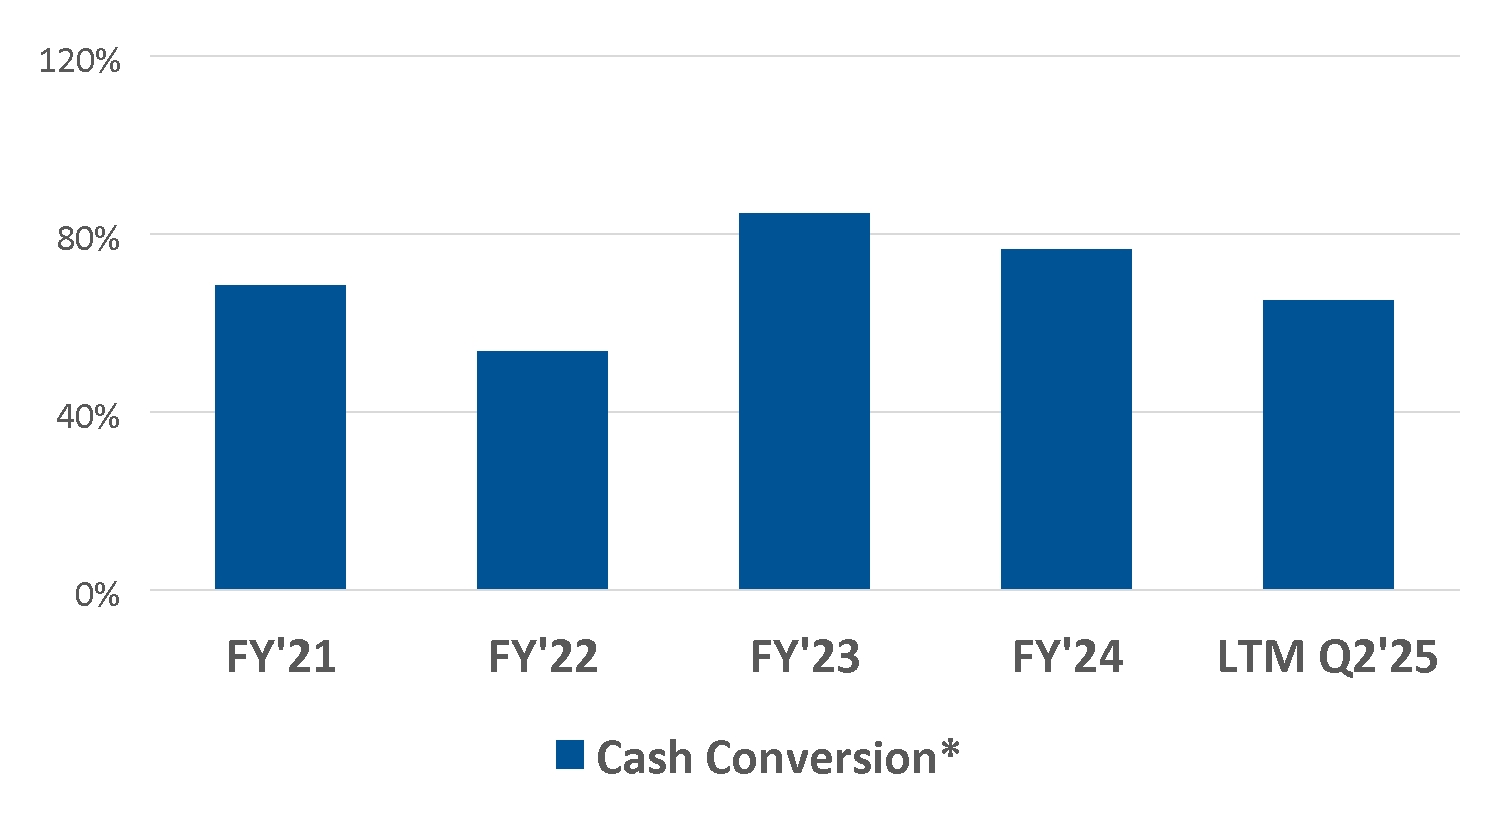
Cash Conversion* |
|
|
|
|
Adj. operating income and margin*: Operating income adjusted for capacity alignments, antitrust related matters and for FY 2023 the Andrews litigation settlement. Capacity alignments include non-recurring costs related to our structural efficiency and business cycle management programs.Capex, net: Capital Expenditure, net, defined as Expenditures for Property, Plant and Equipment less Proceeds from sale of Property, Plant and Equipment. |
|
D&A: Depreciation and Amortization.Cash conversion*: Free operating cash flow* in relation to net income. Free operating cash flow defined as operating cash flow less capital expenditure, net. |
4
Financial Report April - June 2025 |
Consolidated sales |
|
Second quarter |
Reported change |
Currency |
Organic |
|
(Dollars in millions) |
|
2025 |
2024 |
(U.S. GAAP) |
effects1) |
change* |
Airbags, Steering Wheels and Other2) |
|
$1,812 |
$1,747 |
3.8% |
0.7% |
3.1% |
Seatbelt Products and Other2) |
|
902 |
858 |
5.1% |
1.1% |
4.0% |
Total |
|
$2,714 |
$2,605 |
4.2% |
0.8% |
3.4% |
|
|
|
|
|
|
|
Americas |
|
$891 |
$893 |
(0.2)% |
(4.3)% |
4.1% |
Europe |
|
828 |
761 |
8.7% |
5.4% |
3.3% |
China |
|
477 |
468 |
1.9% |
0.2% |
1.7% |
Asia excl. China |
|
519 |
483 |
7.4% |
3.6% |
3.8% |
Total |
|
$2,714 |
$2,605 |
4.2% |
0.8% |
3.4% |
1) Effects from currency translations. 2) Including Corporate sales. |
||||||
Sales by product – Airbags, Steering Wheels and Other Sales grew organically* by 3.1% in the quarter. The largest contributor to the increase was inflatable curtains, side airbags and steering wheels, followed by center airbags. This was partly offset by a decline for knee airbags, while sales of driver airbags and passenger airbags were close to unchanged. |
|
Sales by product - Seatbelt Products and Other
Sales for Seatbelt Products and Other grew organically* by 4.0% in the quarter. Sales increased organically in all regions, led by strong growth in Americas followed by Asia excluding China, Europe and China. |
Sales by region Our global organic sales* increased by 3.4% compared to the global LVP increase of 2.7% (according to S&P Global, July 2025). The 0.7pp .outperformance was mainly driven by product launches and tariff compensations. We estimate that the regional and model LVP mix contributed to about 2.5pp underperformance. This was particularly accentuated in China. Our organic sales growth* outperformed LVP growth by 5.0pp in Americas, by 4.9pp in Europe and by 1.4pp in Asia excluding China, while we underperformed by 7.0pp in China. |
|
LVP growth in China was driven by domestic OEMs with typically lower safety content. LVP for global OEMs declined by 4% while it increased by 16% for domestic OEMs. Autoliv's sales growth with domestic OEMs also grew by 16%. Our sales performance relative to LVP in China in Q2 is a significant improvement over recent quarters, and in June, we outperformed LVP in China. We expect that our strong order intake with domestic OEMs and a record high number of new launches will improve our relative sales performance in China in 2025 in the second half of 2025. |
Q2 2025 organic growth* |
Americas |
Europe |
China |
Asia excl. China |
Global |
Autoliv |
4.1% |
3.3% |
1.7% |
3.8% |
3.4% |
Main growth drivers |
Toyota, Nissan, Honda |
Stellantis, BMW, Renault |
GM, Changan, Chery |
Suzuki, Toyota, Hyundai |
Toyota, Ford, Stellantis |
Main decline drivers |
EV OEM, Hyundai, GM |
Toyota, Volvo, Nissan |
Nissan, Mercedes, |
Mazda, Mitsubishi, GM |
EV OEM, Hyundai, Volvo |
Light vehicle production development
Change compared to the same period last year according to S&P Global
Q2 2025 |
Americas |
Europe |
China |
Asia excl. China |
Global |
LVP (Jul 2025) |
(0.9)% |
(1.6)% |
8.8 % |
2.5% |
2.7% |
LVP (Mar 2025) |
(3.0)% |
(3.4)% |
7.0% |
(0.5)% |
0.6% |
5
Financial Report April - June 2025 |
Consolidated sales |
|
First 6 months |
|
Reported change |
|
Currency |
|
Organic |
|
|||||||
(Dollars in millions) |
|
|
2025 |
|
|
2024 |
|
(U.S. GAAP) |
|
effects1) |
|
change* |
|
|||
Airbags, Steering Wheels and Other2) |
|
$ |
3,565 |
|
$ |
3,528 |
|
|
1.0 |
% |
|
(1.3 |
)% |
|
2.4 |
% |
Seatbelt Products and Other2) |
|
|
1,727 |
|
|
1,692 |
|
|
2.1 |
% |
|
(1.5 |
)% |
|
3.6 |
% |
Total |
|
$ |
5,292 |
|
$ |
5,220 |
|
|
1.4 |
% |
|
(1.4 |
)% |
|
2.8 |
% |
|
|
|
|
|
|
|
|
|
|
|
|
|||||
Americas |
|
$ |
1,742 |
|
$ |
1,786 |
|
|
(2.5 |
)% |
|
(5.2 |
)% |
|
2.7 |
% |
Europe |
|
|
1,592 |
|
|
1,531 |
|
|
4.0 |
% |
|
1.4 |
% |
|
2.6 |
% |
China |
|
|
924 |
|
|
928 |
|
|
(0.5 |
)% |
|
(0.5 |
)% |
|
0.1 |
% |
Asia excl. China |
|
|
1,034 |
|
|
975 |
|
|
6.1 |
% |
|
0.3 |
% |
|
5.8 |
% |
Total |
|
$ |
5,292 |
|
$ |
5,220 |
|
|
1.4 |
% |
|
(1.4 |
)% |
|
2.8 |
% |
1) Effects from currency translations. 2) Including Corporate sales. |
|
|||||||||||||||
Sales by product – Airbags, Steering Wheels and Other Sales grew organically* by 2.4% in the quarter. The largest contributor to the increase was side airbags and inflatable curtains, followed by steering wheels and center airbags. This was partly offset by declines for knee airbags and modest declines for driver airbags and passenger airbags. |
|
Sales by product - Seatbelt Products and Other
Sales for Seatbelt Products and Other grew organically* by 3.6% in the quarter. Sales growth was mainly driven by Americas and Asia excluding China while Europe and China was close to unchanged. |
Sales by region Our global organic sales* increased by 2.8% compared to the global LVP increase of 3.1% (according to S&P Global, July 2025). The relative performance was positively impacted by product launches and pricing. This was more than offset by negative effects from the regional and model LVP mix development, which we estimate contributed to about 3pp underperformance. This was particularly accentuated in China. Our organic sales growth outperformed LVP growth by 5.7pp in Europe, by 4.7pp in Americas and by 2.6pp in Asia excluding China, while we underperformed by 11pp in China. |
|
LVP growth in China in the first six months was driven by domestic OEMs with typically lower safety content. LVP for global OEMs declined by 4% while it increased by 21% for domestic OEMs. Autoliv's sales to domestic OEMs increased by 17% in the first half of 2025. We expect that our strong order intake with domestic OEMs and a record number of new launches will significantly improve Autoliv's sales performance in China in the second half of 2025. |
6M 2025 organic growth* |
Americas |
Europe |
China |
Asia excl. China |
Global |
Autoliv |
2.7% |
2.6% |
0.1% |
5.8% |
2.8% |
Main growth drivers |
Toyota, Honda, Ford |
Renault, BMW, Ford |
Changan, Chery, Nio |
Toyota, Suzuki, Subaru |
Toyota, Ford, Suzuki |
Main decline drivers |
EV OEM, Hyundai, BMW |
Volvo, EV OEM, Toyota |
EV OEM, Nissan, Volvo |
Mitsubishi, Honda, Mazda |
EV OEM, Volvo, Hyundai |
Light vehicle production development
First 6 months 2025 |
Americas |
Europe |
China |
Asia excl. China |
Global |
LVP (Jul 2025) |
(2.0)% |
(3.1)% |
11.4 % |
3.2% |
3.1% |
LVP (Jan 2025) |
(2.3)% |
(6.6)% |
6.2% |
0.7% |
0.0% |
6
Financial Report April - June 2025 |
Deepal S09 |
Honda Ye P7 |
Nio Firefly |
|||
Nissan Roox |
Changan Avatr 06 |
Chery Fengyun A9 |
|||
Nissan Leaf |
Renault 4 |
Suzuki eVitara |
|||
Daihatsu Move |
Lynk & Co 900 |
Mitsubishi XFORCE |
|||
Driver/Passenger Airbags |
Seatbelts |
Side Airbags |
||||
Head/Inflatable Curtain Airbags |
Steering Wheel |
Knee Airbag |
||||
Front Center Airbag |
Bag-in-Belt |
Pyrotechnical Safety Switch |
||||
Pedestrian Airbag |
Hood Lifter |
|
Available as EV/PHEV |
7
Financial Report April - June 2025 |
Financial development
Condensed Income Statement |
Second quarter |
|
First 6 months |
||||
(Dollars in millions, except per share data) |
2025 |
2024 |
Change |
|
2025 |
2024 |
Change |
Net sales |
$2,714 |
$2,605 |
4.2% |
|
$5,292 |
$5,220 |
1.4% |
Cost of sales |
(2,213) |
(2,130) |
3.9% |
|
(4,312) |
(4,303) |
0.2% |
Gross profit |
501 |
475 |
5.7% |
|
980 |
917 |
6.8% |
S,G&A |
(145) |
(138) |
5.3% |
|
(290) |
(270) |
7.4% |
R,D&E, net |
(107) |
(116) |
(7.8)% |
|
(202) |
(229) |
(12)% |
Other income (expense), net |
(1) |
(14) |
(90)% |
|
14 |
(18) |
n/a |
Operating income |
247 |
206 |
20% |
|
502 |
400 |
25% |
Adjusted operating income1) |
251 |
221 |
14% |
|
506 |
420 |
21% |
Financial and non-operating items, net |
(27) |
(23) |
15% |
|
(48) |
(43) |
12% |
Income before taxes |
221 |
183 |
21% |
|
453 |
356 |
27% |
Income taxes |
(53) |
(44) |
21% |
|
(118) |
(91) |
30% |
Net income |
$168 |
$139 |
21% |
|
$335 |
$266 |
26% |
|
|
|
|
|
|
|
|
Earnings per share - diluted2) |
$2.16 |
$1.71 |
27% |
|
$4.31 |
$3.23 |
34% |
Adjusted earnings per share - diluted1,2) |
$2.21 |
$1.87 |
18% |
|
$4.36 |
$3.45 |
27% |
|
|
|
|
|
|
|
|
Gross margin |
18.5% |
18.2% |
0.3pp |
|
18.5% |
17.6% |
0.9pp |
S,G&A, in relation to sales |
(5.4)% |
(5.3)% |
(0.1)pp |
|
(5.5)% |
(5.2)% |
(0.3)pp |
R,D&E, net in relation to sales |
(3.9)% |
(4.5)% |
0.5pp |
|
(3.8)% |
(4.4)% |
0.6pp |
Operating margin |
9.1% |
7.9% |
1.2pp |
|
9.5% |
7.7% |
1.8pp |
Adjusted operating margin1) |
9.3% |
8.5% |
0.8pp |
|
9.6% |
8.0% |
1.5pp |
Tax Rate |
24.1% |
24.1% |
(0.0)pp |
|
26.1% |
25.5% |
0.6pp |
|
|
|
|
|
|
|
|
Other data |
|
|
|
|
|
|
|
No. of shares at period-end in millions2) |
76.8 |
80.1 |
(4.1)% |
|
76.8 |
80.1 |
(4.1)% |
Weighted average no. of shares in millions, basic2) |
77.1 |
80.9 |
(4.7)% |
|
77.3 |
81.6 |
(5.3)% |
Weighted average no. of shares in millions, diluted2) |
77.3 |
81.1 |
(4.8)% |
|
77.5 |
82.1 |
(5.6)% |
1) Non-U.S. GAAP measure, excluding effects from capacity alignments and antitrust related matters. See reconciliation table. 2) Net of treasury shares. |
|||||||
Second quarter 2025 development Gross profit increased by $27 million, and the gross margin increased by 0.3pp compared to the prior year. The drivers behind the gross profit improvement were mainly improved operational efficiency with lower costs for labor, premium freight, waste and scrap and logistics. We also had positive effects from the organic sales growth partly offset by negative effects from un-recovered tariff costs. S,G&A costs increased by $7 million compared to the prior year, mainly due to higher costs for personnel and increased credit loss reserves following generally increased default risk rate for the automotive industry. S,G&A costs in relation to sales increased from 5.3% to 5.4%. R,D&E, net costs decreased by $9 million compared to the prior year, mainly due to higher engineering income and positive FX translation effects. R,D&E, net, in relation to sales decreased from 4.5% to 3.9%. Other income (expense), net was negative $1 million, compared to negative $14 million in the same period last year. The difference compared to last year is almost entirely due to lower restructuring costs.
|
|
Operating income increased by $41 million compared to the prior year, due to the higher gross profit, lower costs for R,D&E, net, and the improvement in Other income (expense), partly offset by higher costs for S,G&A, as outlined above. Adjusted operating income* increased by $30 million compared to the prior year, due to the higher gross profit, lower costs for R,D&E, net, and the improvement in Other income (expense), partly offset by higher costs for S,G&A, as outlined above. Financial and non-operating items, net, was negative $27 million compared to negative $23 million a year earlier. The increase comes mainly from other non-operating items, net, which was negative $3 million for Q2 2025 compared to positive $1 million in Q2 2024. Income before taxes increased by $38 million compared to the prior year, mainly due to the higher operating income. Tax rate was unchanged at 24.1%. Discrete tax items, net, had a favorable impact of 4.3pp in the second quarter of 2025, while discrete tax items, net had a favorable impact of 4.9pp in the corresponding quarter last year. Earnings per share, diluted increased by $0.46 compared to the prior year. The main drivers were $0.39 from higher operating income and $0.10 from lower number of outstanding shares, diluted, partly offset by $0.03 from financial items and $0.01 from taxes. |
8
Financial Report April - June 2025 |
First six months 2025 development Gross profit increased by $63 million, and the gross margin increased by 0.9pp compared to the prior year. The drivers behind the gross profit improvement were mainly improved operational efficiency with lower costs for labor, premium freight, logistics and waste and scrap. We also had positive effects from the organic sales growth partly offset by negative effects from material costs and un-recovered tariffs. S,G&A costs increased by $20 million compared to the prior year, mainly due to increased credit loss reserves following generally higher default risk rate for the automotive industry and higher IT costs, as well as minor cost increases for other items, including personnel costs, partly offset by positive FX translation effects. S,G&A costs in relation to sales increased from 5.2% to 5.5%. R,D&E, net costs decreased by $27 million compared to the prior year, with $10 million of the improvement coming from higher engineering income. The decrease was also driven by $7 million from positive FX translation effects and $4 million in lower personnel costs and $4 million in lower costs for professional services. R,D&E, net, in relation to sales decreased from 4.4% to 3.8%. Other income (expense), net was positive $14 million, compared to negative $18 million in the same period last year. The improvement compared to last year is due to lower restructuring costs and the recycled accumulated currency translation differences related to the divestment of our idled operations in Russia in Q1 2025. |
|
Operating income increased by $102 million compared to the prior year, due to the higher gross profit, lower costs for R,D&E, net, and the improvement in Other income (expense), partly offset by higher costs for S,G&A, as outlined above. Adjusted operating income* increased by $86 million compared to the prior year, due to the higher gross profit, lower costs for R,D&E, net, and the improvement in Other income (expense), partly offset by higher costs for S,G&A, as outlined above. Financial and non-operating items, net, was negative $48 million compared to negative $43 million a year earlier. The increase was mainly due to higher interest income in 2024 due to higher cash holdings, and lower other non-operating items, net, in 2025. Income before taxes increased by $97 million compared to the prior year, mainly due to the higher operating income. Tax rate was 26.1% compared to 25.5% in the prior year. Discrete tax items, net, had a favorable impact of 2.1pp in the first six months of 2025 compared to 3.7pp favorable impact in the same period last year. Earnings per share, diluted increased by $1.09 compared to the prior year. The main drivers were $0.92 from higher operating income and $0.24 from lower number of outstanding shares, diluted, partly offset by $0.04 from financial items and $0.03 from taxes. |
9
Financial Report April - June 2025 |
Selected Cash Flow and Balance Sheet Items
Selected Cash Flow items |
Second quarter |
First 6 months |
||||
(Dollars in millions) |
2025 |
2024 |
Change |
2025 |
2024 |
Change |
Net income |
$168 |
$139 |
21% |
$335 |
$266 |
26% |
Depreciation and amortization |
100 |
96 |
4.1% |
195 |
192 |
1.7% |
Other non-cash adjustments, net |
(5) |
(23) |
(76)% |
(12) |
(9) |
26% |
Changes in operating working capital |
15 |
128 |
(88)% |
(164) |
14 |
n/a |
Operating cash flow |
277 |
340 |
(18)% |
355 |
462 |
(23)% |
Capital expenditure, net1) |
(114) |
(146) |
(22)% |
(208) |
(286) |
(27)% |
Free operating cash flow2) |
$163 |
$194 |
(16)% |
$147 |
$176 |
(16)% |
Cash conversion3) |
97% |
140% |
(43)pp |
44% |
66% |
(22)pp |
Shareholder returns |
|
|
|
|
|
|
- Dividends paid |
(54) |
(55) |
(2.0)% |
(108) |
(111) |
(2.1)% |
- Share repurchases |
(51) |
(160) |
(68)% |
(101) |
(320) |
(68)% |
Cash dividend paid per share |
$(0.70) |
$(0.68) |
3.7% |
$(1.40) |
$(1.36) |
2.6% |
Capital expenditures, net in relation to sales |
4.2% |
5.6% |
(1.4)pp |
3.9% |
5.5% |
(1.6)pp |
1) Defined as Expenditures for property, plant and equipment less Proceeds from sale of property, plant and equipment. 2) Operating cash flow less Capital expenditure, net. Non-U.S. GAAP measure. See enclosed reconciliation table. 3) Free operating cash flow relative to Net income. Non-U.S. GAAP measure. See reconciliation table. |
||||||
Selected Balance Sheet items |
Second quarter |
||
(Dollars in millions) |
2025 |
2024 |
Change |
Trade working capital1) |
$1,354 |
$1,169 |
16% |
Trade working capital in relation to sales2) |
12.5% |
11.2% |
1.3pp |
- Receivables outstanding in relation to sales3) |
21.6% |
20.1% |
1.5pp |
- Inventory outstanding in relation to sales4) |
8.8% |
9.0% |
(0.2)pp |
- Payables outstanding in relation to sales5) |
17.9% |
17.8% |
0.1pp |
Cash & cash equivalents |
237 |
408 |
(42)% |
Gross Debt6) |
2,051 |
1,996 |
2.8% |
Net Debt7) |
1,752 |
1,579 |
11% |
Capital employed8) |
4,231 |
3,890 |
9% |
Return on capital employed9) |
23.8% |
21.0% |
2.7pp |
Total equity |
2,480 |
2,311 |
7.3% |
Return on total equity10) |
27.7% |
23.4% |
4.3pp |
Leverage ratio11) |
1.3 |
1.2 |
0.0 |
1) Outstanding receivables and outstanding inventory less outstanding payables. Non-U.S. GAAP measure, see reconciliation table. 2) Outstanding receivables and outstanding inventory less outstanding payables relative to annualized quarterly sales. Non-U.S. GAAP measure, see reconciliation table. Annualized quarterly sales is calculated as the quarterly sales amount multiplied by four. 3) Outstanding receivables relative to annualized quarterly sales. 4) Outstanding inventory relative to annualized quarterly sales. 5) Outstanding payables relative to annualized quarterly sales. 6) Short- and long-term interest-bearing debt. 7) Short- and long-term debt less cash and cash equivalents and debt-related derivatives. Non-U.S. GAAP measure. See reconciliation table. 8) Total equity and net debt. 9) Annualized operating income and income from equity method investments, relative to average capital employed. See definitions of "Annualized operating income" in footnote to the reconciliation tables below. 10) Annualized net income relative to average total equity. See definitions of "Annualized net income" in footnote to the reconciliation tables below. 11) Net debt adjusted for pension liabilities in relation to EBITDA. Non-U.S. GAAP measure. See reconciliation table. |
|||
Second quarter 2025 development Changes in operating working capital impacted operating cash flow by $15 million positive compared to an impact of $128 million positive in the prior year. The relatively large positive effects from working capital in Q2 last year was related to timing effects while the impact from working capital in Q2 2025 can be considered to be more within normal variations and impacted by higher sales towards the end of the quarter. The working capital decrease in the quarter of $15 million was mainly a result of $113 million in positive effects from accounts payables and accrued expenses, $9 million from deferred income taxes and $4 million from lower inventories. This was partly offset by $110 million in increased receivables partly due to tariff recoveries not yet paid. Operating cash flow decreased by $63 million to $277 million compared to the prior year, mainly because of less favorable effects from changes in operating working capital, as outlined above. |
|
Capital expenditure, net decreased by $32 million compared to the prior year. The level of capital expenditure, net, in relation to sales declined to 4.2% versus 5.6% a year earlier. The lower level of capital expenditure, net is mainly related to the lower activity level of footprint optimization in Europe and Americas and less capacity expansion, especially in Asia. Free operating cash flow* was positive $163 million compared to positive $194 million in the prior year. The decrease was due to the lower operating cash flow partly offset by the lower capital expenditure, net, as outlined above. Cash conversion* defined as free operating cash flow* in relation to net income, was 97% in the quarter compared to 140% a year earlier. The decline was a result of the lower free operating cash flow and higher net income.
|
10
Financial Report April - June 2025 |
Trade working capital* increased by $185 million compared to the prior year, where the main drivers were $251 million in higher accounts receivables, $87 million in higher accounts payable and $21 million in higher inventories. In relation to sales, trade working capital increased from 11.2% to 12.5%. The increase in trade working capital is mainly due to tariffs and increased sales and timing effects last year. Net debt* was $1,752 million as of June 30, 2025, which was $172 million higher than a year earlier, mainly due to that in the last twelve months, dividends paid and share repurchases were higher than free operating cash flow as well as due to FX effects. |
|
Total equity as of June 30, 2025, increased by $169 million compared to June 30, 2024. This was mainly due to net income of $717 million and $69 million in positive currency translation effects, partly offset by $337 million in share repurchases, including taxes and $282 million in dividend payments. Leverage ratio*: On June 30, 2025, the Company had a leverage ratio of 1.3x compared to 1.2x on June 30, 2024, following that the 12 months trailing adjusted EBITDA* increased by around $103 million while net debt* per the policy increased by around $324 million. |
First six months 2025 development Operating cash flow decreased by $107 million to $355 million compared to the prior year, mainly because the increase in operating working capital was larger than the increase in net income. Capital expenditure, net decreased by $78 million compared to the prior year. The level of capital expenditure, net, in relation to sales declined to 3.9% versus 5.5% a year earlier. The lower level of capital expenditure, net is mainly related to the lower activity level of footprint optimization in Europe and Americas and less capacity expansion, especially in Asia. |
|
Free operating cash flow* was positive $147 million compared to positive $176 million in the prior year. The decrease was due to the lower operating cash flow partly offset by the lower capital expenditure, net, as outlined above. Cash conversion* defined as free operating cash flow* in relation to net income, was 44% for the period, compared to 66% in the prior year. The decline was a result of the lower free operating cash flow and higher net income.
|
Headcount
|
Jun 30 |
Mar 31 |
Jun 30 |
|
2025 |
2025 |
2024 |
Headcount |
65,100 |
65,900 |
68,700 |
Whereof: Direct headcount in manufacturing |
48,000 |
48,800 |
51,100 |
Indirect headcount |
17,100 |
17,100 |
17,500 |
Temporary personnel |
9% |
10% |
9% |
As of June 30, 2025, total headcount (Full Time Equivalent) decreased by around 3,600, or 5.2%, compared to a year earlier, despite that organic sales* increased by 3.4%. The indirect workforce decreased by around 400, or 2.3%, mainly reflecting our structural reduction initiatives. The direct workforce decreased by approximately 3,200, or 6.2%. The decrease was supported by an improvement in customer call-off accuracy which enabled us to accelerate operating efficiency improvements. |
|
Compared to March 31, 2025, total headcount (Full Time Equivalent) decreased by around 800, or 1.3%. Indirect headcount was unchanged while direct headcount decreased by approximately 900, or 1.8%.
|
11
Financial Report April - June 2025 |
Other Items
• On April 16, 2025, Autoliv announced it was named a 2025 Automotive News PACE Pilot Innovation to Watch. The recognition acknowledges post-pilot, pre-commercial innovations in the automotive and future mobility space. Autoliv was recognized for The Bernoulli™ Airbag Module. The Bernoulli Airbag Module addresses the challenge of inflating large airbags quickly and safely, and reducing heat generation and development costs by over 30%. • On April 24, 2025, Autoliv announced it is entering a partnership with the ABB FIA Formula E World Championship, as the new Official Mobility Safety Partner. The partnership provides Autoliv with a platform to showcase its expertise and improve awareness of automotive safety in an electric racing setting. • On April 25, 2025, Autoliv announced that it presented Omni Safety™, at the Shanghai International Automobile Industry Exhibition 2025. Omni Safety™ is a safety system designed to address critical risks to occupants in reclined seating positions in the event of a collision. This system integrates advanced seatbelt and airbag systems and related functionalities to redefine occupant safety. • On June 4, 2025, Autoliv hosted its Capital Markets Day, where it reiterated its 2025 guidance and financial targets, and announced a sustainable increase in shareholder returns, including launching a new share repurchase program and a 21% dividend increase for the third quarter to $0.85 per share. • On May 28, 2025, the Company repaid a SEK 3,000 million loan to Swedish Export Credit Corporation. On the same day, the Company took out a new 1-year SEK 2,000 million loan with Swedish Export Credit Corporation. |
|
• On June 30, 2025, Autoliv announced that Fredrik Westin decided to resign as the Chief Financial Officer and Executive Vice President, Finance of the Company for personal reasons and to pursue a position in continental Europe. He remains in his current position until December 31, 2025, unless otherwise agreed by the parties. Mikael Bratt, President and CEO of the Company, said, "We sincerely thank Fredrik for his valuable contributions to Autoliv and the executive management team over the past five years. We wish him and his family all the best as they relocate." The recruitment process for the successor Chief Financial Officer has been launched. • In Q2 2025, Autoliv repurchased and retired 0.5 million shares of common stock at an average price of $99.81 per share under the Autoliv 2022-2025 stock purchase program. These were the last purchases under this program. It is replaced by the 2029 stock repurchase program. Under this new program, repurchases may be made from July 1, 2025 through December 31, 2029. The maximum value of aggregate repurchases under this program is $2.5 billion. Repurchases of stock may be made directly on the NYSE or indirectly through the repurchase of SDRs traded on the Stockholm Nasdaq. |
12
Financial Report April - June 2025 |
Next Report Autoliv intends to publish the quarterly earnings report for the third quarter of 2025 on Friday, October 17, 2025. |
|
Footnotes *Non-U.S. GAAP measure, see enclosed reconciliation tables. |
Inquiries: Investors and Analysts Anders Trapp Vice President Investor Relations Tel +46 (0)8 5872 0671 Henrik Kaar Director Investor Relations Tel +46 (0)8 5872 0614
Inquiries: Media Gabriella Etemad Senior Vice President Communications Tel +46 (0)70 612 6424 Autoliv, Inc. is obliged to make this information public pursuant to the EU Market Abuse Regulation. The information was submitted for publication, through the agency of the VP of Investor Relations set out above, at 12.00 CET on July 18, 2025. |
Definitions and SEC Filings Please refer to www.autoliv.com or to our Annual Report for definitions of terms used in this report. Autoliv’s annual report to stockholders, annual report on Form 10-K, quarterly reports on Form 10-Q, proxy statements, management certifications, press releases, current reports on Form 8-K and other documents filed with the SEC can be obtained free of charge from Autoliv at the Company’s address. These documents are also available at the SEC’s website www.sec.gov and at Autoliv’s corporate website www.autoliv.com. This report includes content supplied by S&P Global; Copyright © Light Vehicle Production Forecast, January, March and July 2025. All rights reserved. S&P Global is a global supplier of independent industry information. The permission to use S&P Global copyrighted reports, data and information does not constitute an endorsement or approval by S&P Global of the manner, format, context, content, conclusion, opinion or viewpoint in which S&P Global reports, data and information or its derivations are used or referenced herein. |
13
Financial Report April - June 2025 |
“Safe Harbor Statement”
This report contains statements that are not historical facts but rather forward-looking statements within the meaning of the Private Securities Litigation Reform Act of 1995. Such forward-looking statements include those that address activities, events or developments that Autoliv, Inc. or its management believes or anticipates may occur in the future. All forward-looking statements are based upon our current expectations, various assumptions and/or data available from third parties. Our expectations and assumptions are expressed in good faith and we believe there is a reasonable basis for them. However, there can be no assurance that such forward-looking statements will materialize or prove to be correct as forward-looking statements are inherently subject to known and unknown risks, uncertainties and other factors which may cause actual future results, performance or achievements to differ materially from the future results, performance or achievements expressed in or implied by such forward-looking statements. In some cases, you can identify these statements by forward-looking words such as “estimates”, “expects”, “anticipates”, “projects”, “plans”, “intends”, “believes”, “may”, “likely”, “might”, “would”, “should”, “could”, or the negative of these terms and other comparable terminology, although not all forward-looking statements contain such words. Because these forward-looking statements involve risks and uncertainties, the outcome could differ materially from those set out in the forward-looking statements for a variety of reasons, including without limitation, general economic conditions, including inflation; changes in light vehicle production; fluctuation in vehicle production schedules for which the Company is a supplier; global supply chain disruptions, including port, transportation and distribution delays or interruptions; supply chain disruptions and component shortages specific to the automotive industry or the Company; geopolitical instability, including the ongoing war between Russia and Ukraine and the hostilities in the Middle East; changes in general industry and market conditions or regional growth or decline; changes in and the successful execution of our capacity alignment, restructuring, cost reduction and efficiency initiatives and the market reaction thereto; loss of business from increased competition; higher raw material, fuel and energy costs; changes in consumer and customer preferences for end products; |
|
customer losses; changes in regulatory conditions; customer bankruptcies, consolidations, or restructuring or divestiture of customer brands; unfavorable fluctuations in currencies or interest rates among the various jurisdictions in which we operate; market acceptance of our new products; costs or difficulties related to the integration of any new or acquired businesses and technologies; continued uncertainty in pricing and other negotiations with customers; successful integration of acquisitions and operations of joint ventures; successful implementation of strategic partnerships and collaborations; our ability to be awarded new business; product liability, warranty and recall claims and investigations and other litigation, civil judgments or financial penalties and customer reactions thereto; higher expenses for our pension and other postretirement benefits, including higher funding needs for our pension plans; work stoppages or other labor issues; possible adverse results of pending or future litigation or infringement claims and the availability of insurance with respect to such matters; our ability to protect our intellectual property rights; negative impacts of antitrust investigations or other governmental investigations and associated litigation relating to the conduct of our business; tax assessments by governmental authorities and changes in our effective tax rate; dependence on key personnel; legislative or regulatory changes impacting or limiting our business; including changes in trade policy and tariffs, our ability to meet our sustainability targets, goals and commitments; political conditions; dependence on and relationships with customers and suppliers; the conditions necessary to hit our financial targets; and other risks and uncertainties identified under the headings “Risk Factors” and “Management’s Discussion and Analysis of Financial Condition and Results of Operations” in our Annual Reports and Quarterly Reports on Forms 10-K and 10-Q and any amendments thereto. For any forward-looking statements contained in this or any other document, we claim the protection of the safe harbor for forward-looking statements contained in the Private Securities Litigation Reform Act of 1995, and we assume no obligation to update publicly or revise any forward-looking statements in light of new information or future events, except as required by law. |
14
Financial Report April - June 2025 |
Consolidated Statements of Income
|
Second quarter |
First 6 months |
Latest 12 |
Full Year |
||
(Dollars in millions, except per share data, unaudited) |
2025 |
2024 |
2025 |
2024 |
months |
2024 |
Airbags, Steering Wheels and Other1) |
$1,812 |
$1,747 |
$3,565 |
$3,528 |
$7,060 |
$7,023 |
Seatbelt products and Other1) |
902 |
858 |
1,727 |
1,692 |
3,402 |
3,367 |
Total net sales |
2,714 |
2,605 |
5,292 |
5,220 |
10,463 |
10,390 |
|
|
|
|
|
|
|
Cost of sales |
(2,213) |
(2,130) |
(4,312) |
(4,303) |
(8,473) |
(8,463) |
Gross profit |
501 |
475 |
980 |
917 |
1,990 |
1,927 |
|
|
|
|
|
|
|
Selling, general & administrative expenses |
(145) |
(138) |
(290) |
(270) |
(550) |
(530) |
Research, development & engineering expenses, net |
(107) |
(116) |
(202) |
(229) |
(371) |
(398) |
Other income (expense), net |
(1) |
(14) |
14 |
(18) |
13 |
(19) |
Operating income |
247 |
206 |
502 |
400 |
1,081 |
979 |
|
|
|
|
|
|
|
Income from equity method investments |
1 |
2 |
3 |
3 |
6 |
7 |
Interest income |
2 |
3 |
4 |
7 |
10 |
13 |
Interest expense |
(27) |
(28) |
(52) |
(54) |
(106) |
(107) |
Other non-operating items, net |
(3) |
1 |
(3) |
(0) |
(19) |
(16) |
Income before income taxes |
221 |
183 |
453 |
356 |
972 |
875 |
|
|
|
|
|
|
|
Income taxes |
(53) |
(44) |
(118) |
(91) |
(255) |
(227) |
Net income |
168 |
139 |
335 |
266 |
717 |
648 |
|
|
|
|
|
|
|
Less: Net income attributable to non-controlling interest |
0 |
0 |
1 |
1 |
1 |
1 |
Net income attributable to controlling interest |
$167 |
$138 |
$334 |
$265 |
$716 |
$646 |
|
|
|
|
|
|
|
Earnings per share - diluted |
$2.16 |
$1.71 |
$4.31 |
$3.23 |
$9.15 |
$8.04 |
1) Including Corporate sales. |
||||||
15
Financial Report April - June 2025 |
Consolidated Balance Sheets
|
|
Jun 30 |
Mar 31 |
Dec 31 |
Sep 30 |
Jun 30 |
(Dollars in millions, unaudited) |
|
2025 |
2025 |
2024 |
2024 |
2024 |
Assets |
|
|
|
|
|
|
Cash & cash equivalents |
|
$237 |
$322 |
$330 |
$415 |
$408 |
Receivables, net |
|
2,341 |
2,205 |
1,993 |
2,192 |
2,090 |
Inventories, net |
|
957 |
913 |
921 |
997 |
936 |
Prepaid expenses |
|
249 |
184 |
167 |
172 |
193 |
Other current assets |
|
146 |
75 |
72 |
90 |
76 |
Total current assets |
|
3,929 |
3,699 |
3,483 |
3,865 |
3,703 |
|
|
|
|
|
|
|
Property, plant & equipment, net |
|
2,399 |
2,286 |
2,239 |
2,317 |
2,197 |
Operating leases right-of-use assets |
|
171 |
168 |
158 |
173 |
167 |
Goodwill and intangible assets, net |
|
1,389 |
1,380 |
1,375 |
1,386 |
1,379 |
Investments and other non-current assets |
|
588 |
581 |
548 |
565 |
564 |
Total assets |
|
8,476 |
8,114 |
7,804 |
8,306 |
8,010 |
|
|
|
|
|
|
|
Liabilities and equity |
|
|
|
|
|
|
Short-term debt |
|
679 |
540 |
387 |
624 |
455 |
Accounts payable |
|
1,945 |
1,839 |
1,799 |
1,881 |
1,858 |
Accrued expenses |
|
1,138 |
1,053 |
1,056 |
1,189 |
1,120 |
Operating lease liabilities - current |
|
44 |
42 |
41 |
44 |
41 |
Other current liabilities |
|
430 |
327 |
351 |
297 |
312 |
Total current liabilities |
|
4,235 |
3,800 |
3,633 |
4,034 |
3,785 |
|
|
|
|
|
|
|
Long-term debt |
|
1,372 |
1,565 |
1,522 |
1,586 |
1,540 |
Pension liability |
|
167 |
163 |
153 |
147 |
140 |
Operating lease liabilities - non-current |
|
121 |
120 |
118 |
130 |
127 |
Other non-current liabilities |
|
102 |
103 |
92 |
110 |
106 |
Total non-current liabilities |
|
1,762 |
1,952 |
1,885 |
1,974 |
1,913 |
|
|
|
|
|
|
|
Total parent shareholders’ equity |
|
2,469 |
2,351 |
2,276 |
2,288 |
2,298 |
Non-controlling interest |
|
11 |
10 |
10 |
10 |
13 |
Total equity |
|
2,480 |
2,361 |
2,285 |
2,298 |
2,311 |
|
|
|
|
|
|
|
Total liabilities and equity |
|
$8,476 |
$8,114 |
$7,804 |
$8,306 |
$8,010 |
16
Financial Report April - June 2025 |
Consolidated Statements of Cash Flow
|
Second quarter |
First 6 months |
Latest 12 |
Full Year |
||
(Dollars in millions, unaudited) |
2025 |
2024 |
2025 |
2024 |
months |
2024 |
Net income |
$168 |
$139 |
$335 |
$266 |
$717 |
$648 |
Depreciation and amortization |
100 |
96 |
195 |
192 |
390 |
387 |
Gain on divestiture of property |
- |
- |
(6) |
- |
(10) |
(4) |
Other non-cash adjustments, net |
(5) |
(23) |
(6) |
(9) |
(21) |
(24) |
Net change in operating working capital: |
|
|
|
|
|
|
Receivables |
(0) |
74 |
(166) |
33 |
(153) |
47 |
Other current assets |
(110) |
(27) |
(134) |
(7) |
(59) |
67 |
Inventories |
4 |
39 |
26 |
31 |
22 |
28 |
Accounts payable |
42 |
39 |
67 |
(55) |
40 |
(83) |
Accrued expenses |
71 |
7 |
25 |
34 |
(22) |
(12) |
Income taxes |
9 |
(5) |
19 |
(22) |
47 |
6 |
Net cash provided by operating activities |
277 |
340 |
355 |
462 |
952 |
1,059 |
|
|
|
|
|
|
|
Expenditures for property, plant and equipment |
(115) |
(154) |
(217) |
(294) |
(502) |
(579) |
Proceeds from sale of property, plant and equipment |
1 |
8 |
9 |
8 |
18 |
17 |
Net cash used in investing activities |
(114) |
(146) |
(208) |
(286) |
(484) |
(563) |
|
|
|
|
|
|
|
Net increase (decrease) in short term debt |
151 |
160 |
273 |
(67) |
214 |
(126) |
Decrease in long-term debt |
(273) |
(306) |
(311) |
(306) |
(311) |
(306) |
Increase in long-term debt |
- |
- |
77 |
534 |
69 |
526 |
Dividends paid |
(54) |
(55) |
(108) |
(111) |
(216) |
(219) |
Share repurchases |
(51) |
(160) |
(101) |
(320) |
(333) |
(552) |
Common stock options exercised |
- |
0 |
0 |
0 |
1 |
1 |
Dividend paid to non-controlling interests |
- |
(1) |
- |
(1) |
(4) |
(5) |
Net cash used in financing activities |
(227) |
(362) |
(170) |
(269) |
(581) |
(680) |
|
|
|
|
|
|
|
Effect of exchange rate changes on cash |
(22) |
6 |
(71) |
3 |
(58) |
16 |
Decrease in cash and cash equivalents |
(86) |
(161) |
(94) |
(90) |
(171) |
(168) |
Cash and cash equivalents at period-start |
322 |
570 |
330 |
498 |
408 |
498 |
Cash and cash equivalents at period-end |
$237 |
$408 |
$237 |
$408 |
$237 |
$330 |
|
||||||
17
Financial Report April - June 2025 |
RECONCILIATION OF U.S. GAAP TO NON-U.S. GAAP MEASURES
In this report we sometimes refer to non-U.S. GAAP measures that we and securities analysts use in measuring Autoliv's performance. We believe that these measures assist investors and management in analyzing trends in the Company's business for the reasons given below. Investors should not consider these non-U.S. GAAP measures as substitutes, but rather as additions, to financial reporting measures prepared in accordance with U.S. GAAP. It should be noted that these measures, as defined, may not be comparable to similarly titled measures used by other companies.
Components in Sales Increase/Decrease
Since the Company historically generates approximately 75% of sales in currencies other than in the reporting currency (i.e., U.S. dollars) and currency rates have been volatile, we analyze the Company's sales trends and performance as changes in organic sales growth. This presents the increase or decrease in the overall U.S. dollar net sales on a comparable basis, allowing separate discussions of the impact of acquisitions/divestitures and exchange rates. The tables on pages 5 and 6 present changes in organic sales growth as reconciled to the change in the total U.S. GAAP net sales.
Reconciliation of GAAP measure "Working Capital" to Non-GAAP Measure "Trade Working Capital"
Due to the need to optimize cash generation to create value for shareholders, management focuses on operationally derived trade working capital as defined in the table below. Trade working capital is an indicator of operational efficiency, which impacts the Company’s ability to return value to shareholders either through dividends or share repurchases. We believe this is useful for readers to understand the efficiency of the Company’ operational capital management. The reconciling items used to derive this measure are, by contrast, managed as part of our overall management of cash and debt, but they are not part of the responsibilities of day-to-day operations management.
|
Jun 30 |
Mar 31 |
Dec 31 |
Sep 30 |
Jun 30 |
(Dollars in millions) |
2025 |
2025 |
2024 |
2024 |
2024 |
Total current assets |
$3,929 |
$3,699 |
$3,483 |
$3,865 |
$3,703 |
Total current liabilities |
(4,235) |
(3,800) |
(3,633) |
(4,034) |
(3,785) |
Working capital (U.S. GAAP) |
(305) |
(101) |
(150) |
(169) |
(83) |
Less: Cash and cash equivalents |
(237) |
(322) |
(330) |
(415) |
(408) |
Prepaid expenses |
(249) |
(184) |
(167) |
(172) |
(193) |
Other current assets |
(146) |
(75) |
(72) |
(90) |
(76) |
Less: Short-term debt |
679 |
540 |
387 |
624 |
455 |
Accrued expenses |
1,138 |
1,053 |
1,056 |
1,189 |
1,120 |
Operating lease liabilities - current |
44 |
42 |
41 |
44 |
41 |
Other current liabilities |
430 |
327 |
351 |
297 |
312 |
Trade working capital (non-U.S. GAAP) |
$1,354 |
$1,279 |
$1,115 |
$1,307 |
$1,169 |
|
|
|
|
|
|
|
Jun 30 |
Mar 31 |
Dec 31 |
Sep 30 |
Jun 30 |
(Dollars in millions) |
2025 |
2025 |
2024 |
2024 |
2024 |
Receivables, net |
$2,341 |
$2,205 |
$1,993 |
$2,192 |
$2,090 |
Inventories, net |
957 |
913 |
921 |
997 |
936 |
Accounts payable |
(1,945) |
(1,839) |
(1,799) |
(1,881) |
(1,858) |
Trade working capital (non-U.S. GAAP) |
$1,354 |
$1,279 |
$1,115 |
$1,307 |
$1,169 |
|
Dec 31 |
Dec 31 |
Dec 31 |
Dec 31 |
(Dollars in millions) |
2023 |
2022 |
2021 |
2020 |
Total current assets |
$3,974 |
$3,714 |
$3,675 |
$4,269 |
Total current liabilities |
(4,035) |
(3,642) |
(2,821) |
(3,147) |
Working capital (U.S. GAAP) |
(61) |
72 |
853 |
1,122 |
Less: Cash and cash equivalents |
(498) |
(594) |
(969) |
(1,178) |
Prepaid expenses |
(173) |
(160) |
(164) |
(164) |
Other current assets |
(93) |
(84) |
(65) |
(307) |
Less: Short-term debt |
538 |
711 |
346 |
302 |
Accrued expenses |
1,135 |
915 |
996 |
1,270 |
Operating lease liabilities - current |
39 |
39 |
38 |
37 |
Other current liabilities |
345 |
283 |
297 |
284 |
Trade working capital (non-U.S. GAAP) |
$1,232 |
$1,183 |
$1,332 |
$1,366 |
|
|
|
|
|
|
Dec 31 |
Dec 31 |
Dec 31 |
Dec 31 |
(Dollars in millions) |
2023 |
2022 |
2021 |
2020 |
Receivables, net |
$2,198 |
$1,907 |
$1,699 |
$1,822 |
Inventories, net |
1,012 |
969 |
777 |
798 |
Accounts payable |
(1,978) |
(1,693) |
(1,144) |
(1,254) |
Trade working capital (non-U.S. GAAP) |
$1,232 |
$1,183 |
$1,332 |
$1,366 |
18
Financial Report April - June 2025 |
Net Debt
Autoliv from time to time enters into “debt-related derivatives” (DRDs) as a part of its debt management and as part of efficiently managing the Company’s overall cost of funds. Creditors and credit rating agencies use net debt adjusted for DRDs in their analyses of the Company’s debt, therefore we provide this non-U.S. GAAP measure. DRDs are fair value adjustments to the carrying value of the underlying debt. Also included in the DRDs is the unamortized fair value adjustment related to a discontinued fair value hedge that will be amortized over the remaining life of the debt. By adjusting for DRDs, the total financial liability of net debt is disclosed without grossing debt up with currency or interest fair values.
|
Jun 30 |
Mar 31 |
Dec 31 |
Sep 30 |
Jun 30 |
(Dollars in millions) |
2025 |
2025 |
2024 |
2024 |
2024 |
Short-term debt |
$679 |
$540 |
$387 |
$624 |
$455 |
Long-term debt |
1,372 |
1,565 |
1,522 |
1,586 |
1,540 |
Total debt |
2,051 |
2,105 |
1,909 |
2,210 |
1,996 |
Cash & cash equivalents |
(237) |
(322) |
(330) |
(415) |
(408) |
Debt issuance cost/Debt-related derivatives, net |
(62) |
4 |
(24) |
(9) |
(8) |
Net debt |
$1,752 |
$1,787 |
$1,554 |
$1,787 |
$1,579 |
|
|||||
|
|
Dec 31 |
Dec 31 |
Dec 31 |
Dec 31 |
(Dollars in millions) |
|
2023 |
2022 |
2021 |
2020 |
Short-term debt |
|
$538 |
$711 |
$346 |
$302 |
Long-term debt |
|
1,324 |
1,054 |
1,662 |
2,110 |
Total debt |
|
1,862 |
1,766 |
2,008 |
2,411 |
Cash & cash equivalents |
|
(498) |
(594) |
(969) |
(1,178) |
Debt issuance cost/Debt-related derivatives, net |
|
3 |
12 |
13 |
(19) |
Net debt |
|
$1,367 |
$1,184 |
$1,052 |
$1,214 |
Leverage ratio
The non-U.S. GAAP measure “net debt” is also used in the non-U.S. GAAP measure “Leverage ratio”. Management uses this measure to analyze the amount of debt the Company can incur under its debt policy. Management believes that this policy also provides guidance to credit and equity investors regarding the extent to which the Company would be prepared to leverage its operations. Autoliv’s policy is to maintain a leverage ratio commensurate with a strong investment grade credit rating. The Company measures its leverage ratio as net debt* adjusted for pension liabilities in relation to adjusted EBITDA*. The long-term target is to maintain a leverage ratio equal to or below 1.5x.
|
Jun 30 |
Mar 31 |
Jun 30 |
(Dollars in millions) |
2025 |
2025 |
2024 |
Net debt1) |
$1,752 |
$1,787 |
$1,579 |
Pension liabilities |
167 |
163 |
140 |
Net debt per the Policy |
$1,919 |
$1,950 |
$1,720 |
|
|
|
|
Net income2) |
$717 |
$688 |
$627 |
Income taxes2) |
255 |
246 |
150 |
Interest expense, net2, 3) |
96 |
97 |
89 |
Other non-operating items, net2) |
19 |
16 |
8 |
Income from equity method investments2) |
(6) |
(6) |
(6) |
Depreciation and amortization of intangibles2) |
390 |
386 |
384 |
Adjustments2), 4) |
12 |
23 |
128 |
EBITDA per the Policy (Adjusted EBITDA) |
$1,483 |
$1,449 |
$1,380 |
|
|
|
|
Leverage ratio |
1.3 |
1.3 |
1.2 |
1) Short- and long-term debt less cash and cash equivalents and debt-related derivatives. 2) Latest 12 months. 3) Interest expense including cost for extinguishment of debt, if any, less interest income. 4) Capacity alignments and antitrust related matters. See Items Affecting Comparability below. |
|||
19
Financial Report April - June 2025 |
Reconciliation of GAAP measure "Operating cash flow" to "Free operating cash flow" and "Cash conversion"
Management uses the non-U.S. GAAP measure “free operating cash flow” to analyze the amount of cash flow being generated by the Company’s operations after capital expenditure, net. This measure indicates the Company’s cash flow generation level that enables strategic value creation options such as dividends or acquisitions. For details on free operating cash flow, see the reconciliation table below. Management uses the non-U.S. GAAP measure “cash conversion” to analyze the proportion of net income that is converted into free operating cash flow. The measure is a tool to evaluate how efficiently the Company utilizes its resources. For details on cash conversion, see the reconciliation table below.
|
Second quarter |
|
First 6 months |
Latest 12 |
Full Year |
||
(Dollars in millions) |
2025 |
2024 |
|
2025 |
2024 |
months |
2024 |
Net income |
$168 |
$139 |
|
$335 |
$266 |
$717 |
$648 |
Depreciation and amortization |
100 |
96 |
|
195 |
192 |
390 |
387 |
Gain on divestiture of property |
- |
- |
|
(6) |
- |
(10) |
(4) |
Other, net |
(5) |
(23) |
|
(6) |
(9) |
(21) |
(24) |
Changes in operating working capital, net |
15 |
128 |
|
(164) |
14 |
(124) |
53 |
Operating cash flow |
277 |
340 |
|
$355 |
$462 |
952 |
1,059 |
Expenditures for property, plant and equipment |
(115) |
(154) |
|
(217) |
(294) |
(502) |
(579) |
Proceeds from sale of property, plant and equipment |
1 |
8 |
|
9 |
8 |
18 |
17 |
Capital expenditure, net1) |
(114) |
(146) |
|
(208) |
(286) |
(484) |
(563) |
Free operating cash flow2) |
$163 |
$194 |
|
$147 |
$176 |
$468 |
$497 |
Cash conversion3) |
97% |
140% |
|
44% |
66% |
65% |
77% |
1) Defined as Expenditures for property, plant and equipment less Proceeds from sale of property, plant and equipment. 2) Operating cash flow less Capital expenditure, net. 3) Free operating cash flow relative to Net income. |
|||||||
|
Full year |
Full year |
Full year |
Full year |
(Dollars in millions) |
2023 |
2022 |
2021 |
2020 |
Net income |
$489 |
$425 |
$437 |
$188 |
Depreciation and amortization |
378 |
363 |
394 |
371 |
Gain on divestiture of property |
- |
(80) |
- |
- |
Other, net |
(119) |
(54) |
(15) |
13 |
Changes in operating working capital, net |
235 |
58 |
(63) |
277 |
Operating cash flow |
982 |
713 |
754 |
849 |
Expenditures for property, plant and equipment |
(572) |
(585) |
(458) |
(344) |
Proceeds from sale of property, plant and equipment |
4 |
101 |
4 |
4 |
Capital expenditure, net1) |
(569) |
(485) |
(454) |
(340) |
Free operating cash flow2) |
$414 |
$228 |
$300 |
$509 |
Cash conversion3) |
85% |
54% |
69% |
270% |
1) Defined as Expenditures for property, plant and equipment less Proceeds from sale of property, plant and equipment. 2) Operating cash flow less Capital expenditure, net. 3) Free operating cash flow relative to net income. |
||||
20
Financial Report April - June 2025 |
Items Affecting Comparability
We believe that comparability between periods is improved through the exclusion of certain items. To assist investors in understanding the operating performance of Autoliv's business, it is useful to consider certain U.S. GAAP measures exclusive of these items.
The following tables reconcile Income before income taxes, Net income attributable to controlling interest, Capital employed, which are inputs utilized to calculate Return On Capital Employed (“ROCE”), adjusted ROCE and Return On Total Equity (“ROE”). The Company believes this presentation may be useful to investors and industry analysts who utilize these adjusted non-U.S. GAAP measures in their ROCE and ROE calculations to exclude certain items for comparison purposes across periods. Autoliv’s management uses the ROCE, adjusted ROCE and ROE measures for purposes of comparing its financial performance with the financial performance of other companies in the industry and providing useful information regarding the factors and trends affecting the Company’s business.
As used by the Company, ROCE is annualized operating income and income from equity method investments, relative to average capital employed. Adjusted ROCE is annualized operating income and income from equity method investments, relative to average capital employed as adjusted to exclude certain non-recurring items. See definitions of "annualized operating income" and "average capital employed" in footnote to the tables below. The Company believes ROCE and adjusted ROCE are useful indicators of long-term performance both absolute and relative to the Company's peers as it allows for a comparison of the profitability of the Company’s capital employed in its business relative to that of its peers.
ROE is the ratio of annualized income (loss) relative to average total equity for the periods presented. See definitions of "annualized income" and "average total equity" in footnote to the tables below. The Company’s management believes that ROE is a useful indicator of how well management creates value for its shareholders through its operating activities and its capital management.
With respect to the Andrews litigation settlement, the Company has treated this specific settlement as a non-recurring charge because of the unique nature of the lawsuit, including the facts and legal issues involved.
Accordingly, the tables below reconcile from U.S. GAAP to the equivalent non-U.S. GAAP measure.
Reconciliation of GAAP measure "Operating income" to Non-GAAP measure "Adjusted Operating income"
|
Second quarter |
|
First 6 months |
||
(Dollars in millions) |
2025 |
2024 |
|
2025 |
2024 |
Operating income (GAAP) |
$247 |
$206 |
|
$502 |
$400 |
Non-GAAP adjustments: |
|
|
|
|
|
Less: Capacity alignments |
1 |
14 |
|
3 |
16 |
Less: Antitrust related items |
3 |
1 |
|
1 |
4 |
Total non-GAAP adjustments to operating income |
4 |
15 |
|
5 |
20 |
Adjusted Operating income (Non-GAAP) |
$251 |
$221 |
|
$506 |
$420 |
(Dollars in millions) |
2024 |
2023 |
2022 |
2021 |
2020 |
Operating income (GAAP) |
$979 |
$690 |
$659 |
$675 |
$382 |
Non-GAAP adjustments: |
|
|
|
|
|
Less: Capacity alignments1) |
19 |
218 |
(61) |
8 |
99 |
Less: The Andrews litigation settlement |
- |
8 |
- |
- |
- |
Less: Antitrust related items |
8 |
4 |
- |
- |
1 |
Total non-GAAP adjustments to operating income |
27 |
230 |
(61) |
8 |
99 |
Adjusted Operating income (Non-GAAP) |
$1,007 |
$920 |
$598 |
$683 |
$482 |
1) For 2022, including a gain on divestiture of property of $80 million. |
|||||
21
Financial Report April - June 2025 |
Reconciliation of GAAP measure "Operating margin" to Non-GAAP measure "Adjusted Operating margin"
|
Second quarter |
|
First 6 months |
||
|
2025 |
2024 |
|
2025 |
2024 |
Operating margin (GAAP) |
9.1% |
7.9% |
|
9.5% |
7.7% |
Non-GAAP adjustments: |
|
|
|
|
|
Less: Capacity alignments |
0.0% |
0.5% |
|
0.1% |
0.3% |
Less: Antitrust related items |
0.1% |
0.0% |
|
0.0% |
0.1% |
Total non-GAAP adjustments to operating margin |
0.1% |
0.6% |
|
0.1% |
0.4% |
Adjusted Operating margin (Non-GAAP) |
9.3% |
8.5% |
|
9.6% |
8.0% |
|
2024 |
2023 |
2022 |
2021 |
2020 |
Operating margin (GAAP) |
9.4% |
6.6% |
7.5% |
8.2% |
5.1% |
Non-GAAP adjustments: |
|
|
|
|
|
Less: Capacity alignments |
0.2% |
2.1% |
(0.7)% |
0.1% |
1.4% |
Less: The Andrews litigation settlement |
- |
0.1% |
- |
- |
- |
Less: Antitrust related items |
0.1% |
0.0% |
- |
- |
0.0% |
Total non-GAAP adjustments to operating margin |
0.3% |
2.2% |
(0.7)% |
0.1% |
1.4% |
Adjusted Operating margin (Non-GAAP) |
9.7% |
8.8% |
6.8% |
8.3% |
6.5% |
Reconciliation of GAAP measure "Income before income taxes" to Non-GAAP measure "Adjusted Income before income taxes"
|
Second quarter |
|
First 6 months |
||
(Dollars in millions) |
2025 |
2024 |
|
2025 |
2024 |
Income before income taxes (GAAP) |
$221 |
$183 |
|
$453 |
$356 |
Non-GAAP adjustments: |
|
|
|
|
|
Less: Capacity alignments |
1 |
14 |
|
3 |
16 |
Less: Antitrust related items |
3 |
1 |
|
1 |
4 |
Total non-GAAP adjustments to Income before income taxes |
4 |
15 |
|
5 |
20 |
Adjusted Income before income taxes (Non-GAAP) |
$225 |
$198 |
|
$458 |
$377 |
Reconciliation of GAAP measure "Net income" to Non-GAAP measure "Adjusted Net income"
|
Second quarter |
|
First 6 months |
||
(Dollars in millions) |
2025 |
2024 |
|
2025 |
2024 |
Net income (GAAP) |
$168 |
$139 |
|
$335 |
$266 |
Non-GAAP adjustments: |
|
|
|
|
|
Less: Capacity alignments |
1 |
14 |
|
3 |
16 |
Less: Antitrust related items |
3 |
1 |
|
1 |
4 |
Less: Tax on non-GAAP adjustments |
(1) |
(1) |
|
(1) |
(2) |
Total non-GAAP adjustments to Net income |
3 |
14 |
|
4 |
18 |
Adjusted Net income (Non-GAAP) |
$171 |
$152 |
|
$339 |
$284 |
22
Financial Report April - June 2025 |
Reconciliation of GAAP measure "Net income attributable to controlling interest" to Non-GAAP measure "Adjusted Net income attributable to controlling interest"
|
Second quarter |
|
First 6 months |
||
(Dollars in millions) |
2025 |
2024 |
|
2025 |
2024 |
Net income attributable to controlling interest (GAAP) |
$167 |
$138 |
|
$334 |
$265 |
Non-GAAP adjustments: |
|
|
|
|
|
Less: Capacity alignments |
1 |
14 |
|
3 |
16 |
Less: Antitrust related items |
3 |
1 |
|
1 |
4 |
Less: Tax on non-GAAP adjustments |
(1) |
(1) |
|
(1) |
(2) |
Total non-GAAP adjustments to Net income attributable to controlling interest |
3 |
14 |
|
4 |
18 |
Adjusted Net income attributable to controlling interest (Non-GAAP) |
$170 |
$152 |
|
$338 |
$283 |
Reconciliation of GAAP measure "Earnings per share - diluted" to Non-GAAP measure "Adjusted Earnings per share - diluted"
|
Second quarter |
|
First 6 months |
||
|
2025 |
2024 |
|
2025 |
2024 |
Earnings per share - diluted (GAAP) |
$2.16 |
$1.71 |
|
$4.31 |
$3.23 |
Non-GAAP adjustments: |
|
|
|
|
|
Less: Capacity alignments |
0.02 |
0.17 |
|
0.04 |
0.20 |
Less: Antitrust related items |
0.03 |
0.01 |
|
0.02 |
0.05 |
Less: Tax on non-GAAP adjustments |
(0.01) |
(0.02) |
|
(0.01) |
(0.02) |
Total non-GAAP adjustments to Earnings per share - diluted |
0.04 |
0.17 |
|
0.05 |
0.22 |
Adjusted Earnings per share - diluted (Non-GAAP) |
$2.21 |
$1.87 |
|
$4.36 |
$3.45 |
|
|
|
|
|
|
Weighted average number of shares outstanding - diluted |
77.3 |
81.1 |
|
77.5 |
82.1 |
Reconciliation of GAAP measure "Return on Capital Employed" to Non-GAAP measure "Adjusted Return on Capital Employed"
|
Second quarter |
|
First 6 months |
||
|
2025 |
2024 |
|
2025 |
2024 |
Return on capital employed1) (GAAP) |
23.8% |
21.0% |
|
24.8% |
20.4% |
Non-GAAP adjustments: |
|
|
|
|
|
Less: Capacity alignments |
0.1% |
1.3% |
|
0.2% |
0.8% |
Less: Antitrust related items |
0.2% |
0.1% |
|
0.1% |
0.2% |
Total non-GAAP adjustments to Return on capital employed1) |
0.4% |
1.5% |
|
0.2% |
1.0% |
Adjusted Return on capital employed1) (Non-GAAP) |
24.1% |
22.5% |
|
25.0% |
21.4% |
|
|
|
|
|
|
Annualized adjustment2) on Return on capital employed1) |
$16 |
$60 |
|
$9 |
$40 |
1) Annualized operating income and income from equity method investments, relative to average capital employed. The average capital employed amount is calculated as an average of the opening balance amount and the closing balance amounts for each quarter included in the period. |
|||||
2) The quarterly annualized adjustment to the operating income and income from equity method investments amount is calculated as the quarterly amount multiplied by four. The year-to-date annualized adjustment to the operating income and income from equity method investments amount is calculated as the year-to-date amount divided by the quarterly period number (two, three or four) multiplied by four. |
|||||
23
Financial Report April - June 2025 |
Reconciliation of GAAP measure "Return on Total Equity" to Non-GAAP measure "Adjusted Return on Total Equity"
|
Second quarter |
|
First 6 months |
||
|
2025 |
2024 |
|
2025 |
2024 |
Return on total equity1) (GAAP) |
27.7% |
23.4% |
|
28.2% |
21.8% |
Non-GAAP adjustments: |
|
|
|
|
|
Less: Capacity alignments |
0.2% |
2.2% |
|
0.3% |
1.3% |
Less: Antitrust related items |
0.4% |
0.2% |
|
0.1% |
0.3% |
Less: Tax on non-GAAP adjustments |
(0.1)% |
(0.2)% |
|
(0.1)% |
(0.2)% |
Total non-GAAP adjustments to Return on total equity1) |
0.5% |
2.2% |
|
0.3% |
1.4% |
Adjusted Return on total equity1) (Non-GAAP) |
28.2% |
25.6% |
|
28.5% |
23.2% |
|
|
|
|
|
|
Annualized adjustment2) on Return on total equity1) |
$13 |
$54 |
|
$8 |
$36 |
1) Annualized net income relative to average total equity. The average total equity amount is calculated as an average of the opening balance amount and the closing balance amounts for each quarter included in the period. |
|||||
2) The quarterly annualized adjustment to net income amount is calculated as the quarterly amount multiplied by four. The year-to-date annualized adjustment to the net income amount is calculated as the year-to-date amount divided by the quarterly period number (two, three or four) multiplied by four. |
|||||
24
Financial Report April - June 2025 |
(Dollars in millions, except per share data, unaudited) |
2024 |
2023 |
2022 |
2021 |
2020 |
Sales and Income |
|
|
|
|
|
Net sales |
$10,390 |
$10,475 |
$8,842 |
$8,230 |
$7,447 |
Airbags, Steering Wheels and Other1) |
7,023 |
7,055 |
5,807 |
5,380 |
4,824 |
Seatbelt Products and Other1) |
3,367 |
3,420 |
3,035 |
2,850 |
2,623 |
Operating income |
979 |
690 |
659 |
675 |
382 |
Net income attributable to controlling interest |
646 |
488 |
423 |
435 |
187 |
Earnings per share – basic2) |
8.06 |
5.74 |
4.86 |
4.97 |
2.14 |
Earnings per share – diluted2) |
8.04 |
5.72 |
4.85 |
4.96 |
2.14 |
Gross margin3) |
18.5% |
17.4% |
15.8% |
18.4% |
16.7% |
S,G&A in relation to sales |
(5.1)% |
(4.8)% |
(4.9)% |
(5.3)% |
(5.2)% |
R,D&E net in relation to sales |
(3.8)% |
(4.1)% |
(4.4)% |
(4.7)% |
(5.0)% |
Operating margin4) |
9.4% |
6.6% |
7.5% |
8.2% |
5.1% |
Adjusted operating margin5,6) |
9.7% |
8.8% |
6.8% |
8.3% |
6.5% |
Balance Sheet |
|||||
Trade working capital6,7) |
1,115 |
1,232 |
1,183 |
1,332 |
1,366 |
Trade working capital in relation to sales8) |
10.7% |
11.2% |
12.7% |
15.7% |
13.6% |
Receivables outstanding in relation to sales9) |
19.0% |
20.0% |
20.4% |
20.0% |
18.1% |
Inventory outstanding in relation to sales10) |
8.8% |
9.2% |
10.4% |
9.2% |
7.9% |
Payables outstanding in relation to sales11) |
17.2% |
18.0% |
18.1% |
13.5% |
12.5% |
Total equity |
2,285 |
2,570 |
2,626 |
2,648 |
2,423 |
Total parent shareholders’ equity per share |
29.26 |
30.93 |
30.30 |
30.10 |
27.56 |
Current assets excluding cash |
3,153 |
3,475 |
3,119 |
2,705 |
3,091 |
Property, plant and equipment, net |
2,239 |
2,192 |
1,960 |
1,855 |
1,869 |
Goodwill and Intangible assets |
1,375 |
1,385 |
1,382 |
1,395 |
1,412 |
Capital employed |
3,840 |
3,937 |
3,810 |
3,700 |
3,637 |
Net debt6) |
1,554 |
1,367 |
1,184 |
1,052 |
1,214 |
Total assets |
7,804 |
8,332 |
7,717 |
7,537 |
8,157 |
Long-term debt |
1,522 |
1,324 |
1,054 |
1,662 |
2,110 |
Return on capital employed12) |
25.0% |
17.7% |
17.5% |
18.3% |
10.0% |
Return on total equity13) |
27.2% |
19.0% |
16.3% |
17.1% |
9.0% |
Total equity ratio |
29% |
31% |
34% |
35% |
30% |
Cash flow and other data |
|||||
Operating cash flow |
1,059 |
982 |
713 |
754 |
849 |
Depreciation and amortization |
387 |
378 |
363 |
394 |
371 |
Capital expenditures, net |
563 |
569 |
485 |
454 |
340 |
Capital expenditures, net in relation to sales |
5.4% |
5.4% |
5.5% |
5.5% |
4.6% |
Free operating cash flow6,14) |
497 |
414 |
228 |
300 |
509 |
Cash conversion6,15) |
77% |
85% |
54% |
69% |
270% |
Direct shareholder return16) |
771 |
577 |
339 |
165 |
54 |
Cash dividends paid per share |
2.74 |
2.66 |
2.58 |
1.88 |
0.62 |
Number of shares outstanding (millions)17) |
77.7 |
82.6 |
86.2 |
87.5 |
87.4 |
Number of employees, December 31 |
59,500 |
62,900 |
61,700 |
55,900 |
61,000 |
1) Including Corporate sales 2) Net of treasury shares. 3) Gross profit relative to sales. 4) Operating income relative to sales. 5) Excluding effects from capacity alignments, antitrust related matters and for FY 2023 the Andrews litigation settlement. 6) Non-US GAAP measure, for reconciliation see tables above. 7) Outstanding receivables and outstanding inventory less outstanding payables. 8) Outstanding receivables and outstanding inventory less outstanding payables relative to annualized fourth quarter sales. 9) Outstanding receivables relative to annualized fourth quarter sales. 10) Outstanding inventory relative to annualized fourth quarter sales. 11) Outstanding payables relative to annualized fourth quarter sales. 12) Operating income and income from equity method investments, relative to average capital employed. 13) Income relative to average total equity. 14) Operating cash flow less Capital expenditures, net. 15) Free operating cash flow relative to Net income. 16) Dividends paid and Shares repurchased. 17) At year end, excluding dilution and net of treasury shares. |
|||||
25