Pay Versus Performance
As required by Item 402(v) of Regulation S-K, we are providing the following information about the relationship between “compensation actually paid” to our principal executive officer (“PEO”) and the average of our other Named Executive Officers (“NEOs”) and certain financial metrics of the Company. The following table also provides information regarding company performance over the same periods as well as the relationship of “compensation actually paid” to our PEO and non-PEO NEOs to company performance.
|
|
|
|
|
|
|
|
|
Value of Initial Fixed $100 Investment Based On: |
|
|
|
||||||
Year |
Summary Compensation Table Total for PEO ($) (1) |
|
Compensation Actually Paid to PEO ($) (2) (3) |
|
Average Summary Compensation Table Total for non PEO NEOs ($) (4) |
|
Average |
|
Total Shareholder Return ($) (6) |
|
Net Income ($ in thousands) (7) |
|
||||||
2024 |
|
1,133,016 |
|
|
1,286,838 |
|
|
508,816 |
|
|
564,750 |
|
|
210.71 |
|
|
(24,774 |
) |
2023 |
|
1,518,811 |
|
|
1,748,073 |
|
|
917,300 |
|
|
1,011,521 |
|
|
234.92 |
|
|
(38,371 |
) |
2022 |
|
1,372,710 |
|
|
1,453,333 |
|
|
767,356 |
|
|
732,197 |
|
|
33.50 |
|
|
(44,434 |
) |
(1) Reflects compensation (as reported in the Summary Compensation Table) for our PEO, Mr. Corey Fishman, in 2022, 2023 and 2024.
(2) Calculated in accordance with Item 402(v)(2) of Regulation S-K. The Compensation Actually Paid Schedule shown below sets forth the adjustments made during each year represented in the Pay Versus Performance Table to arrive at the “compensation actually paid” to our Chief Executive Officer.
Year |
Summary Compensation Table Total for PEO ($) (1) |
|
Deductions for |
|
Deductions for Reported Grant Date Fair Value of Option Awards (a) |
|
Additions for Pay Versus Performance Equity Adjustments (b) |
|
Compensation Actually Paid ($) |
|
|||||
2024 |
|
1,133,016 |
|
|
— |
|
|
— |
|
|
153,822 |
|
|
1,286,838 |
|
2023 |
|
1,518,811 |
|
|
— |
|
|
(220,000 |
) |
|
449,262 |
|
|
1,748,073 |
|
2022 |
|
1,372,710 |
|
|
— |
|
|
— |
|
|
80,623 |
|
|
1,453,333 |
|
Year |
Year-End Fair |
|
Year Over Year |
|
Year Over Year |
|
Total Pay Versus Performance Equity Adjustments ($) |
|
||||
2024 |
|
173,392 |
|
|
(8,158 |
) |
|
(11,412 |
) |
|
153,822 |
|
2023 |
|
435,502 |
|
|
— |
|
|
13,760 |
|
|
449,262 |
|
2022 |
|
— |
|
|
— |
|
|
80,623 |
|
|
80,623 |
|
(3) Measurement date equity fair values are calculated with assumptions derived on a basis consistent with those used for grant date fair value purposes. RSUs are valued based on the closing share price on the applicable vesting date(s). Share options are valued using a Black-Scholes model as at the relevant measurement dates.
(4) Reflects compensation our non-PEO NEOs, Dr. Sailaja Puttagunta and Ms. Judith M. Matthews, in 2022, 2023 and 2024, including compensation paid to Dr. Puttagunta as a consultant following her resignation in May 2024. The dollar amounts reported in column (d) represent the average of the compensation reported for the non-PEO NEOs for each corresponding year in the “Total” column of the Summary Compensation Table.
(5) Average “compensation actually paid” for the non-PEO NEOs has been calculated in accordance with Item 402(v)(2) of Regulation S-K. The Compensation Actually Paid Schedule shown below sets forth the adjustments made during each year represented in the Pay Versus Performance Table to arrive at the average “compensation actually paid” to our non-PEO NEOs.
Year |
Summary Compensation Table Total ($) |
|
Deductions for |
|
Deductions for Reported Grant Date Fair Value of Option Awards ($) (a) |
|
Additions for Pay |
|
Compensation Actually Paid ($) |
|
|||||
2024 |
|
508,816 |
|
|
— |
|
|
— |
|
|
55,934 |
|
|
564,750 |
|
2023 |
|
917,300 |
|
|
— |
|
|
(70,000 |
) |
|
164,221 |
|
|
1,011,521 |
|
2022 |
|
767,356 |
|
|
— |
|
|
— |
|
|
(35,159 |
) |
|
732,197 |
|
Year |
Year-End Fair |
|
Year Over Year |
|
Year Over Year |
|
Total Pay Versus Performance Equity Adjustments ($) |
|
||||
2024 |
|
63,051 |
|
|
(2,967 |
) |
|
(4,150 |
) |
|
55,934 |
|
2023 |
|
138,569 |
|
|
— |
|
|
25,652 |
|
|
164,221 |
|
2022 |
|
— |
|
|
— |
|
|
- 35,159 |
|
|
(35,159 |
) |
(6) The cumulative total shareholder return amounts reported are calculated by dividing the difference between the Company’s share price at the end of the applicable measurement period and the beginning of the measurement period by the Company’s share price at the beginning of the measurement period. The Company did not pay any dividends during the measurement periods.
(7) The dollar amounts are the Company’s net loss amounts reflected in the Company’s audited financial statements for the applicable year.
(1) Reflects compensation (as reported in the Summary Compensation Table) for our PEO, Mr. Corey Fishman, in 2022, 2023 and 2024.
(4) Reflects compensation our non-PEO NEOs, Dr. Sailaja Puttagunta and Ms. Judith M. Matthews, in 2022, 2023 and 2024, including compensation paid to Dr. Puttagunta as a consultant following her resignation in May 2024.(2) Calculated in accordance with Item 402(v)(2) of Regulation S-K. The Compensation Actually Paid Schedule shown below sets forth the adjustments made during each year represented in the Pay Versus Performance Table to arrive at the “compensation actually paid” to our Chief Executive Officer.
Year |
Summary Compensation Table Total for PEO ($) (1) |
|
Deductions for |
|
Deductions for Reported Grant Date Fair Value of Option Awards (a) |
|
Additions for Pay Versus Performance Equity Adjustments (b) |
|
Compensation Actually Paid ($) |
|
|||||
2024 |
|
1,133,016 |
|
|
— |
|
|
— |
|
|
153,822 |
|
|
1,286,838 |
|
2023 |
|
1,518,811 |
|
|
— |
|
|
(220,000 |
) |
|
449,262 |
|
|
1,748,073 |
|
2022 |
|
1,372,710 |
|
|
— |
|
|
— |
|
|
80,623 |
|
|
1,453,333 |
|
Year |
Year-End Fair |
|
Year Over Year |
|
Year Over Year |
|
Total Pay Versus Performance Equity Adjustments ($) |
|
||||
2024 |
|
173,392 |
|
|
(8,158 |
) |
|
(11,412 |
) |
|
153,822 |
|
2023 |
|
435,502 |
|
|
— |
|
|
13,760 |
|
|
449,262 |
|
2022 |
|
— |
|
|
— |
|
|
80,623 |
|
|
80,623 |
|
(5) Average “compensation actually paid” for the non-PEO NEOs has been calculated in accordance with Item 402(v)(2) of Regulation S-K. The Compensation Actually Paid Schedule shown below sets forth the adjustments made during each year represented in the Pay Versus Performance Table to arrive at the average “compensation actually paid” to our non-PEO NEOs.
Year |
Summary Compensation Table Total ($) |
|
Deductions for |
|
Deductions for Reported Grant Date Fair Value of Option Awards ($) (a) |
|
Additions for Pay |
|
Compensation Actually Paid ($) |
|
|||||
2024 |
|
508,816 |
|
|
— |
|
|
— |
|
|
55,934 |
|
|
564,750 |
|
2023 |
|
917,300 |
|
|
— |
|
|
(70,000 |
) |
|
164,221 |
|
|
1,011,521 |
|
2022 |
|
767,356 |
|
|
— |
|
|
— |
|
|
(35,159 |
) |
|
732,197 |
|
Year |
Year-End Fair |
|
Year Over Year |
|
Year Over Year |
|
Total Pay Versus Performance Equity Adjustments ($) |
|
||||
2024 |
|
63,051 |
|
|
(2,967 |
) |
|
(4,150 |
) |
|
55,934 |
|
2023 |
|
138,569 |
|
|
— |
|
|
25,652 |
|
|
164,221 |
|
2022 |
|
— |
|
|
— |
|
|
- 35,159 |
|
|
(35,159 |
) |
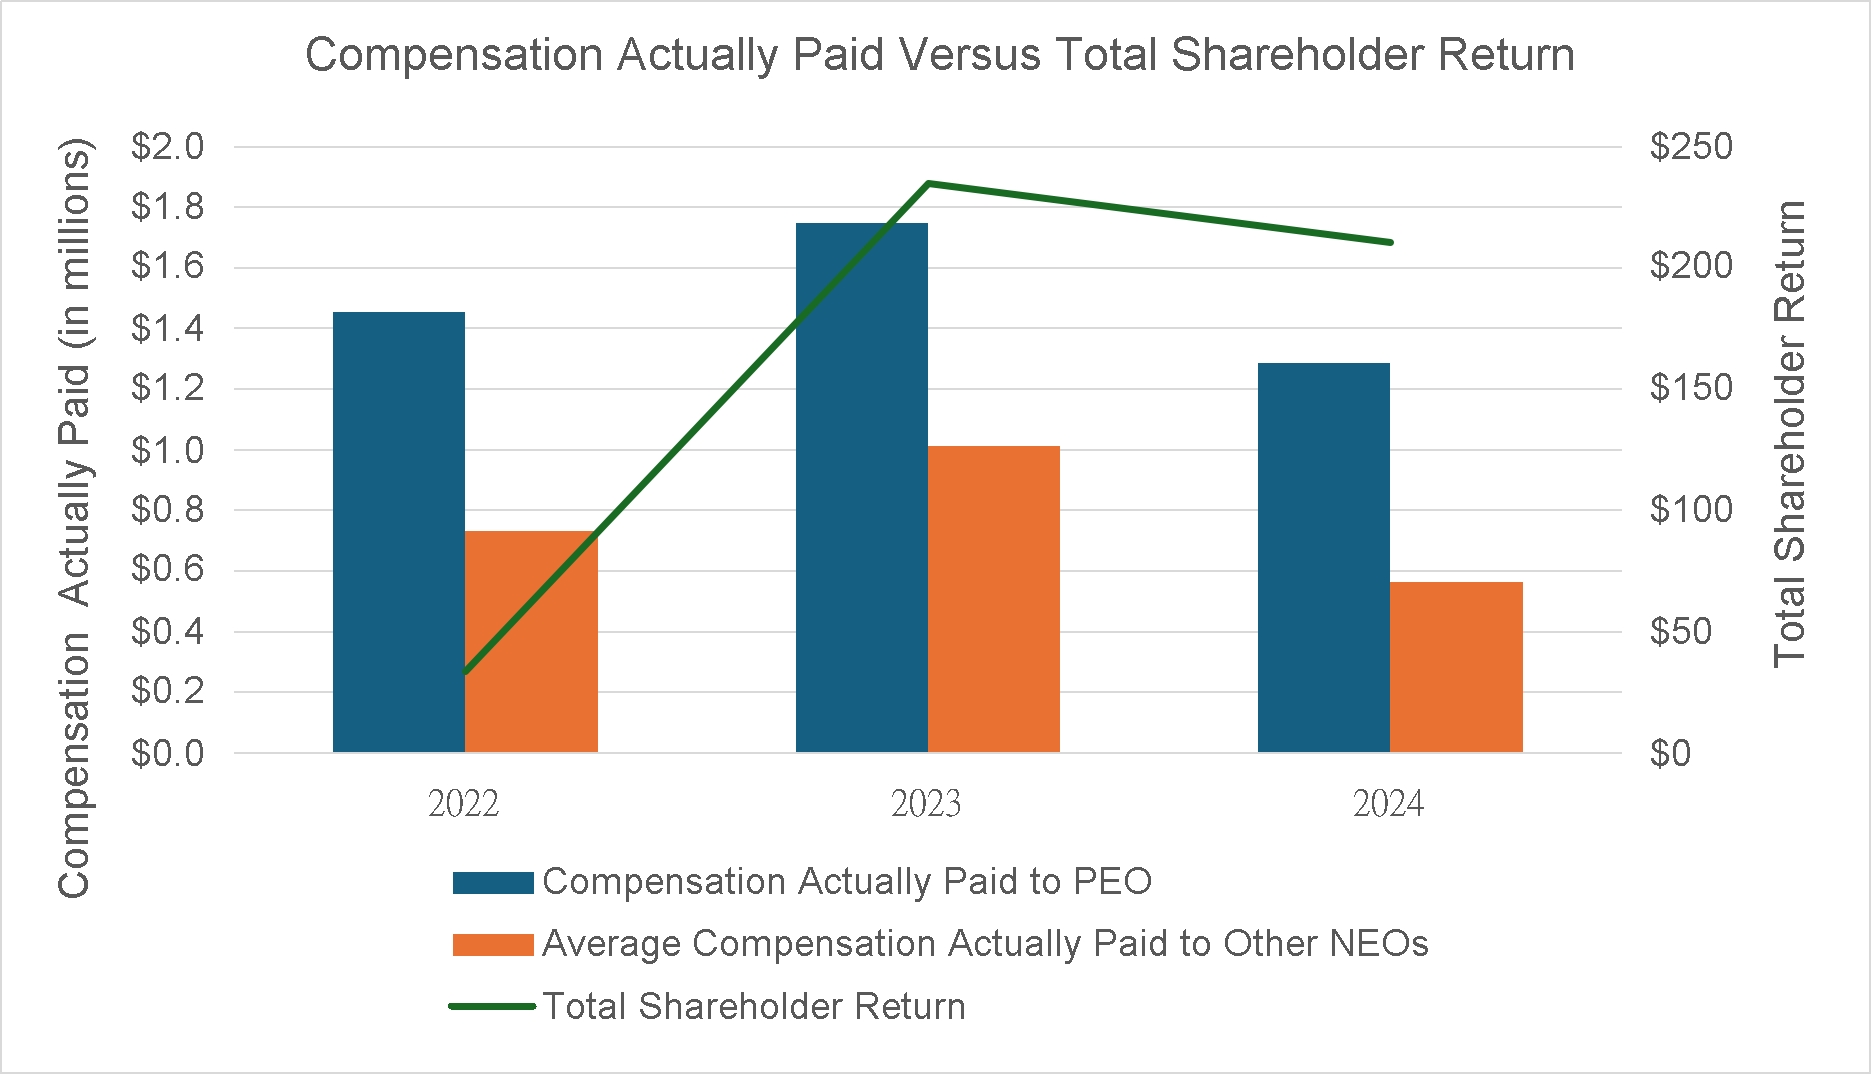
The following graph visually describes the relationship between “compensation actually paid” to our PEO and the average “compensation actually paid” to our other non-PEO NEOs, to the cumulative total shareholder return of the Company.
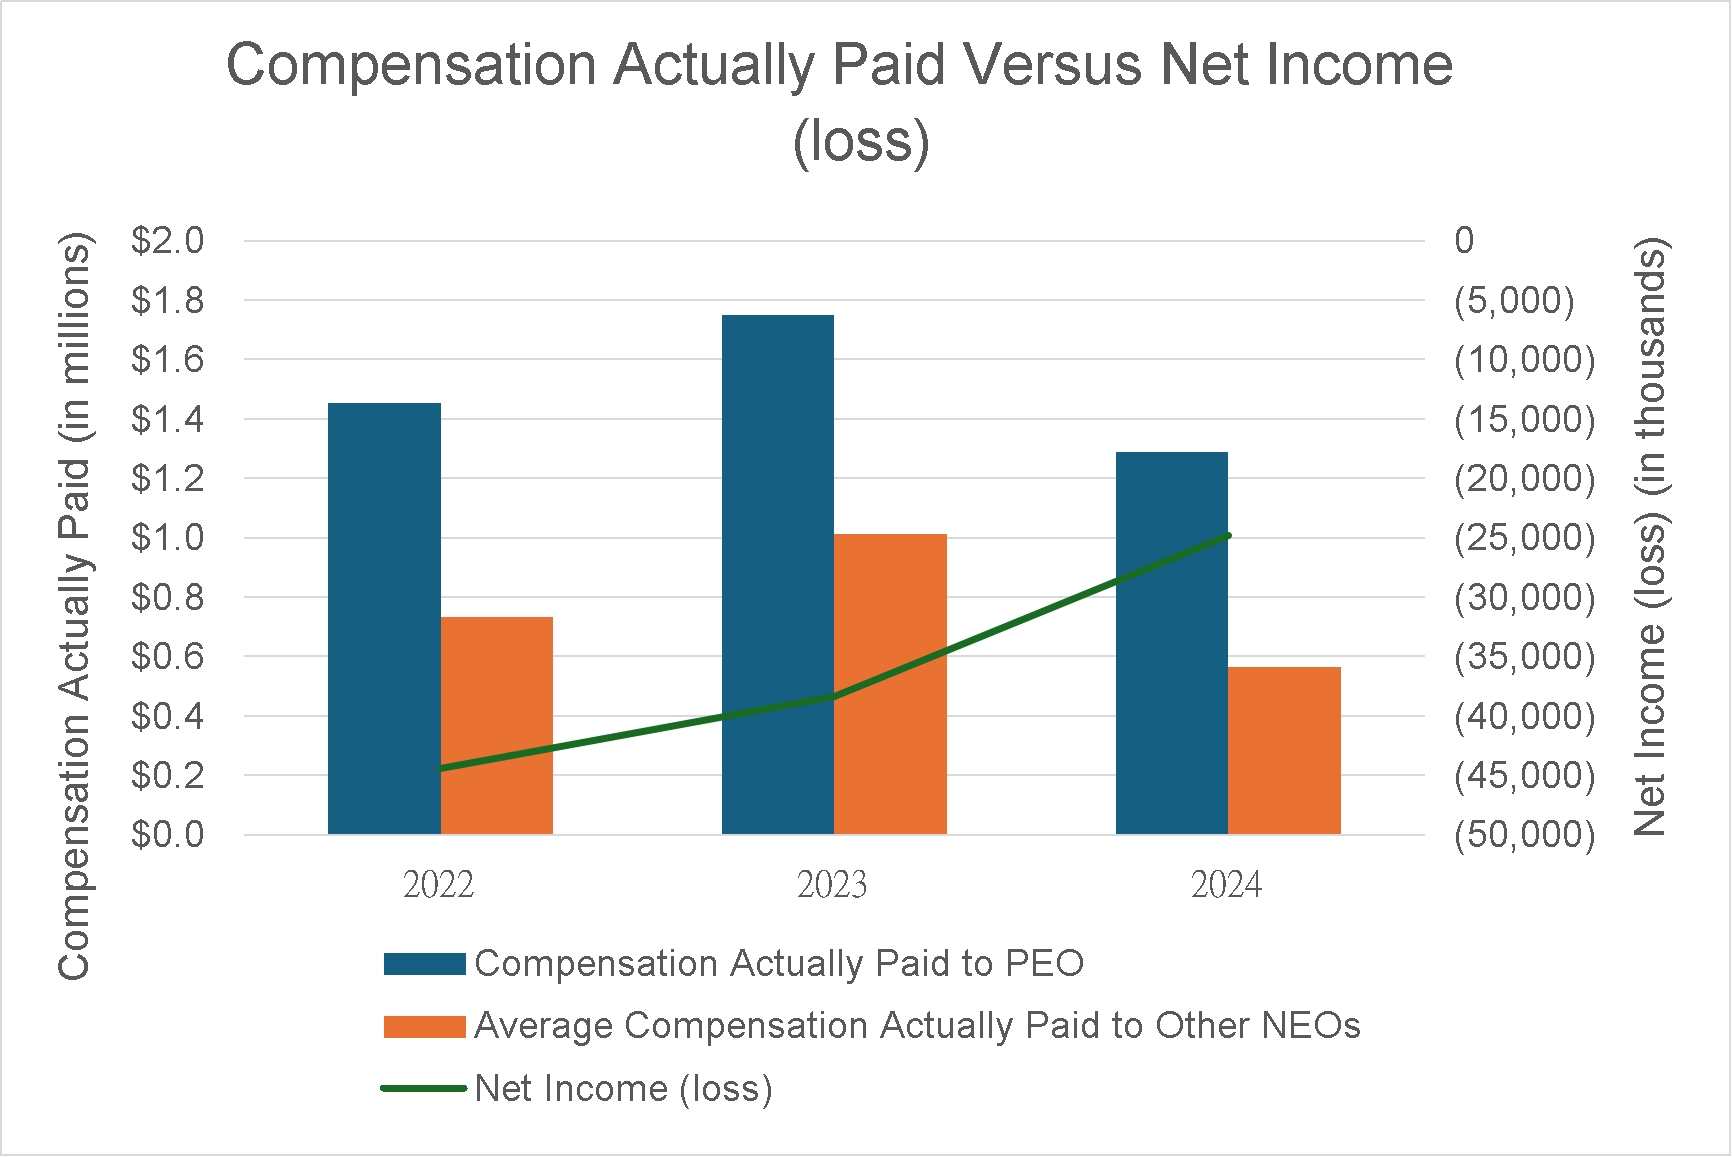
The following graph visually describes the relationship between “compensation actually paid” to our PEO and the average “compensation actually paid” to our other non-PEO NEOs, to net income (loss).