Shareholder Report
Apr. 30, 2025
USD ($)
$ / shares
WHAT WERE THE FUND COSTS FOR THE PAST YEAR? (based on a hypothetical $10,000 investment)
|
Fund Name
|
Costs of a $10,000 investment
|
Costs paid as a percentage of a $10,000 investment
|
|
The Acquirers Fund
|
$76
|
0.79%
|
HOW DID THE FUND PERFORM LAST YEAR AND WHAT AFFECTED ITS PERFORMANCE?
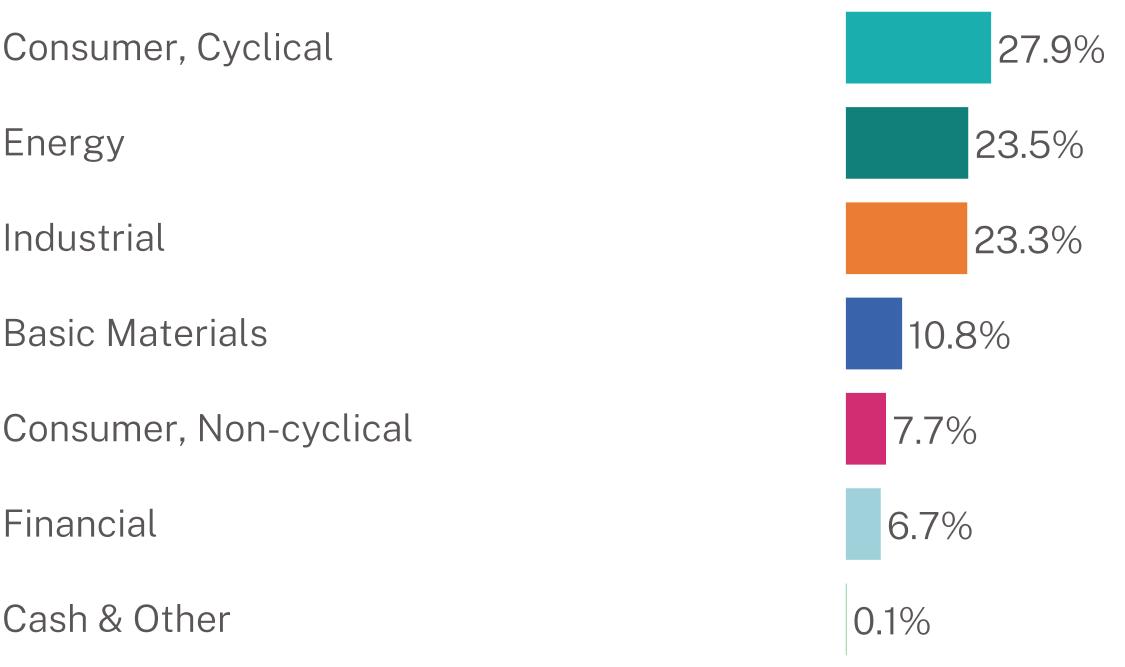
The Acquirers Fund (ZIG) is a U.S. domestic equity ETF with a concentrated deep-value strategy and mid-cap tilt. During the reporting period (May 2024 - April 2025), ZIG underperformed the broader market and the value factor. This was due to the ZIG’s distinctive sector composition, which featured substantial allocations to cyclical industries including materials, industrials, and select energy companies and underweighting in technology relative to broader market indices.
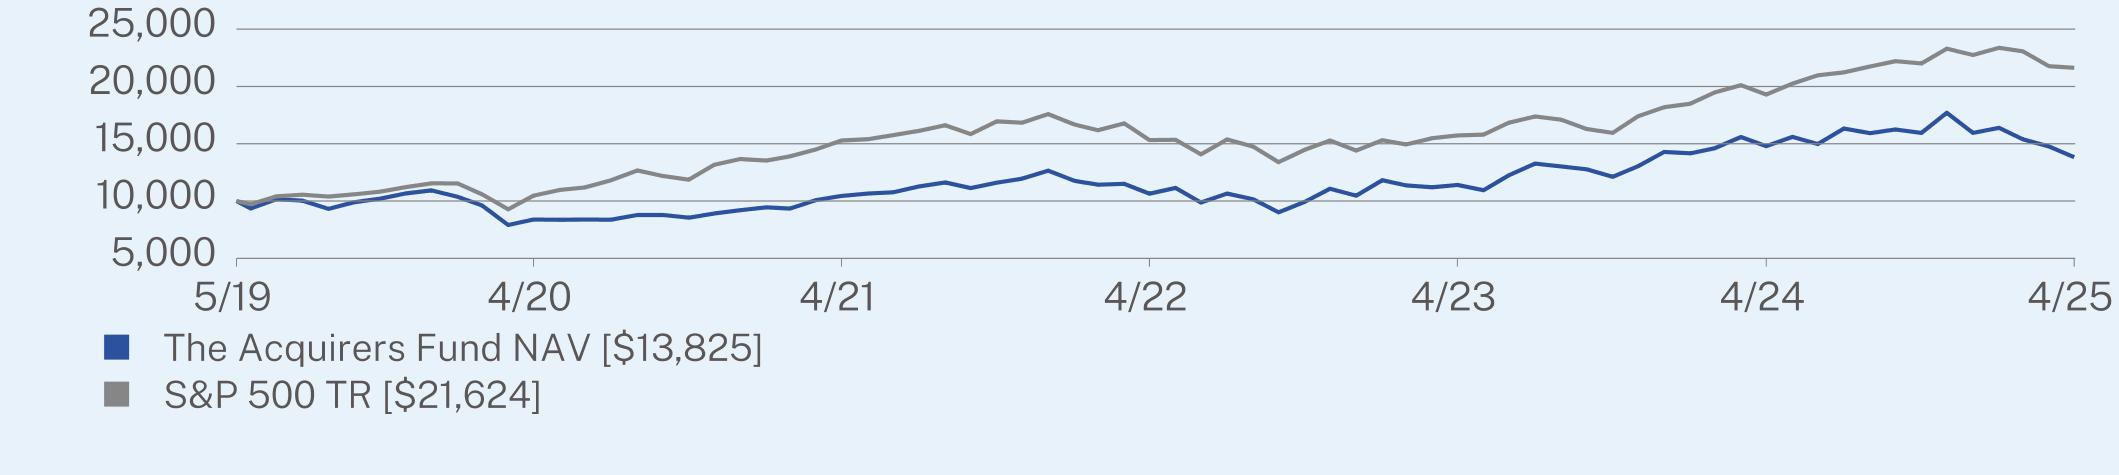
ANNUAL AVERAGE TOTAL RETURN (%)
|
|
1 Year
|
5 Year
|
Since Inception
(05/14/2019) |
|
The Acquirers Fund NAV
|
-6.53
|
10.51
|
5.58
|
|
S&P 500 TR
|
12.10
|
15.61
|
13.80
|
Visit https://acquirersfund.com/ for more recent performance information.
Visit https://acquirersfund.com/ for more recent performance information.
KEY FUND STATISTICS (as of April 30, 2025)
|
Net Assets
|
$33,821,441
|
|
Number of Holdings
|
32
|
|
Net Advisory Fee
|
$364,102
|
|
Portfolio Turnover
|
179%
|
|
Top 10 Issuers
|
(% of the net assets)
|
|
National Beverage Corporation
|
4.0%
|
|
Domino’s Pizza, Inc.
|
3.7%
|
|
Steel Dynamics, Inc.
|
3.7%
|
|
Altria Group, Inc.
|
3.7%
|
|
Green Brick Partners, Inc.
|
3.6%
|
|
CF Industries Holdings, Inc.
|
3.6%
|
|
Atkore, Inc.
|
3.6%
|
|
Bath & Body Works, Inc.
|
3.6%
|
|
PulteGroup, Inc.
|
3.5%
|
|
Nucor Corporation
|
3.5%
|