Shareholder Report
|
12 Months Ended |
|
Dec. 31, 2024
USD ($)
Holding
|
Dec. 31, 2023 |
| Shareholder Report [Line Items] |
|
|
| Document Type |
N-CSR/A
|
|
| Amendment Flag |
false
|
|
| Registrant Name |
Morgan
Stanley Institutional Fund, Inc.
|
|
| Entity Central Index Key |
0000836487
|
|
| Entity Investment Company Type |
N-1A
|
|
| Document Period End Date |
Dec. 31, 2024
|
|
| C000085093 |
|
|
| Shareholder Report [Line Items] |
|
|
| Fund Name |
Morgan Stanley Institutional Fund, Inc. - Advantage Portfolio
|
|
| Class Name |
Class A
|
|
| Trading Symbol |
MAPPX
|
|
| Annual or Semi-Annual Statement [Text Block] |
This annual shareholder report contains important information about Morgan Stanley Institutional Fund, Inc. - Advantage Portfolio for the period of January 1, 2024 to December 31, 2024.
|
|
| Shareholder Report Annual or Semi-Annual |
Annual Shareholder Report
|
|
| Additional Information [Text Block] |
You can find additional information about the Fund at www.morganstanley.com/im/shareholderreports. You can also request this information by contacting us at 1-800-869-6397.
|
|
| Additional Information Phone Number |
1-800-869-6397
|
|
| Additional Information Website |
<span style="box-sizing: border-box; color: rgb(0, 0, 0); display: inline; flex-wrap: nowrap; font-size: 10.6667px; font-weight: 400; grid-area: auto; line-height: 16px; margin: 0px; overflow: visible; text-align: left;">www.morganstanley.com/im/shareholderreports</span>
|
|
| Expenses [Text Block] |
What were the Fund costs for the last year?(based on a hypothetical $10,000 investment) Class Name | Costs of a $10,000 investment | Costs paid as a percentage of a $10,000 investment |
|---|
Class A | $138 | 1.17% |
|---|
|
|
| Expenses Paid, Amount |
$ 138
|
|
| Expense Ratio, Percent |
1.17%
|
|
| Factors Affecting Performance [Text Block] |
How did the Fund perform last year and what affected its performance?Key contributors to (↑) and detractors from (↓) performance, relative to the Russell 1000® Growth Index: ↑ Stock selection in information technology, led by a position in an enterprise analytics platform and Bitcoin developing company ↑ Average overweight and stock selection in consumer discretionary, led by a food delivery company ↑ No exposure to consumer staples, a sector that underperformed in the index ↓ Stock selection in health care, led lower by a biopharmaceutical royalties acquirer and a next-generation sequencing company (the sequencing company was sold during the period) ↓ Stock selection and average overweight in financials, ↓ Average underweight in information technology, which was one of the stronger performing sectors in the period |
|
| Line Graph [Table Text Block] |
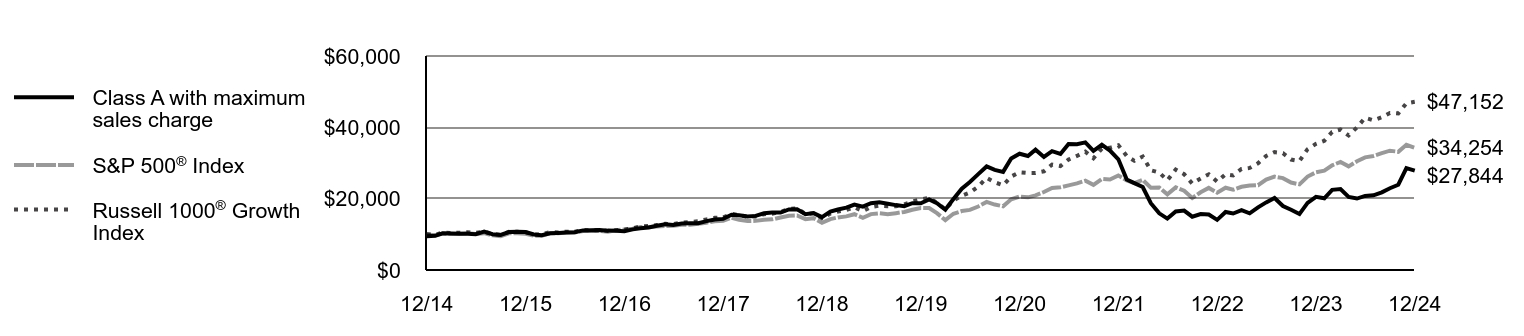 | Class A with maximum sales charge | S&P 500® Index | Russell 1000® Growth Index |
|---|
12/14 | $9,472 | $10,000 | $10,000 |
|---|
1/15 | $9,580 | $9,700 | $9,847 |
|---|
2/15 | $10,295 | $10,257 | $10,503 |
|---|
3/15 | $10,210 | $10,095 | $10,384 |
|---|
4/15 | $10,170 | $10,192 | $10,436 |
|---|
5/15 | $10,153 | $10,323 | $10,583 |
|---|
6/15 | $10,057 | $10,123 | $10,396 |
|---|
7/15 | $10,749 | $10,335 | $10,749 |
|---|
8/15 | $10,045 | $9,712 | $10,096 |
|---|
9/15 | $9,817 | $9,471 | $9,846 |
|---|
10/15 | $10,634 | $10,270 | $10,694 |
|---|
11/15 | $10,691 | $10,301 | $10,724 |
|---|
12/15 | $10,628 | $10,138 | $10,567 |
|---|
1/16 | $9,967 | $9,635 | $9,977 |
|---|
2/16 | $9,733 | $9,622 | $9,973 |
|---|
3/16 | $10,294 | $10,275 | $10,645 |
|---|
4/16 | $10,375 | $10,315 | $10,548 |
|---|
5/16 | $10,504 | $10,500 | $10,753 |
|---|
6/16 | $10,597 | $10,527 | $10,711 |
|---|
7/16 | $11,109 | $10,915 | $11,216 |
|---|
8/16 | $11,166 | $10,931 | $11,160 |
|---|
9/16 | $11,241 | $10,933 | $11,201 |
|---|
10/16 | $11,040 | $10,733 | $10,938 |
|---|
11/16 | $11,034 | $11,131 | $11,176 |
|---|
12/16 | $10,891 | $11,351 | $11,314 |
|---|
1/17 | $11,389 | $11,566 | $11,696 |
|---|
2/17 | $11,723 | $12,025 | $12,182 |
|---|
3/17 | $11,913 | $12,039 | $12,322 |
|---|
4/17 | $12,392 | $12,163 | $12,604 |
|---|
5/17 | $12,815 | $12,334 | $12,932 |
|---|
6/17 | $12,651 | $12,411 | $12,898 |
|---|
7/17 | $13,005 | $12,666 | $13,241 |
|---|
8/17 | $13,126 | $12,705 | $13,483 |
|---|
9/17 | $13,113 | $12,967 | $13,659 |
|---|
10/17 | $13,703 | $13,270 | $14,188 |
|---|
11/17 | $14,134 | $13,677 | $14,619 |
|---|
12/17 | $14,336 | $13,829 | $14,733 |
|---|
1/18 | $15,471 | $14,621 | $15,776 |
|---|
2/18 | $15,356 | $14,082 | $15,363 |
|---|
3/18 | $15,002 | $13,724 | $14,941 |
|---|
4/18 | $15,172 | $13,777 | $14,994 |
|---|
5/18 | $15,886 | $14,108 | $15,651 |
|---|
6/18 | $16,110 | $14,195 | $15,801 |
|---|
7/18 | $16,112 | $14,724 | $16,265 |
|---|
8/18 | $16,982 | $15,203 | $17,155 |
|---|
9/18 | $17,044 | $15,290 | $17,251 |
|---|
10/18 | $15,628 | $14,245 | $15,708 |
|---|
11/18 | $15,945 | $14,535 | $15,875 |
|---|
12/18 | $14,820 | $13,223 | $14,510 |
|---|
1/19 | $16,349 | $14,282 | $15,814 |
|---|
2/19 | $16,970 | $14,741 | $16,380 |
|---|
3/19 | $17,482 | $15,027 | $16,846 |
|---|
4/19 | $18,341 | $15,636 | $17,607 |
|---|
5/19 | $17,778 | $14,642 | $16,495 |
|---|
6/19 | $18,737 | $15,674 | $17,628 |
|---|
7/19 | $18,983 | $15,899 | $18,026 |
|---|
8/19 | $18,579 | $15,648 | $17,888 |
|---|
9/19 | $18,196 | $15,940 | $17,890 |
|---|
10/19 | $17,901 | $16,286 | $18,394 |
|---|
11/19 | $18,745 | $16,877 | $19,210 |
|---|
12/19 | $18,702 | $17,386 | $19,790 |
|---|
1/20 | $19,769 | $17,379 | $20,232 |
|---|
2/20 | $18,716 | $15,949 | $18,854 |
|---|
3/20 | $16,885 | $13,979 | $17,000 |
|---|
4/20 | $19,886 | $15,771 | $19,515 |
|---|
5/20 | $22,800 | $16,522 | $20,825 |
|---|
6/20 | $24,690 | $16,850 | $21,732 |
|---|
7/20 | $26,875 | $17,801 | $23,404 |
|---|
8/20 | $29,031 | $19,080 | $25,819 |
|---|
9/20 | $28,082 | $18,355 | $24,604 |
|---|
10/20 | $27,508 | $17,867 | $23,769 |
|---|
11/20 | $31,290 | $19,823 | $26,203 |
|---|
12/20 | $32,592 | $20,585 | $27,408 |
|---|
1/21 | $31,948 | $20,377 | $27,205 |
|---|
2/21 | $33,748 | $20,939 | $27,199 |
|---|
3/21 | $31,692 | $21,856 | $27,666 |
|---|
4/21 | $33,313 | $23,022 | $29,548 |
|---|
5/21 | $32,522 | $23,183 | $29,140 |
|---|
6/21 | $35,315 | $23,724 | $30,968 |
|---|
7/21 | $35,260 | $24,288 | $31,988 |
|---|
8/21 | $35,772 | $25,026 | $33,184 |
|---|
9/21 | $33,407 | $23,863 | $31,326 |
|---|
10/21 | $35,105 | $25,534 | $34,039 |
|---|
11/21 | $33,507 | $25,357 | $34,247 |
|---|
12/21 | $31,053 | $26,494 | $34,971 |
|---|
1/22 | $25,364 | $25,123 | $31,970 |
|---|
2/22 | $24,344 | $24,371 | $30,612 |
|---|
3/22 | $23,266 | $25,276 | $31,809 |
|---|
4/22 | $18,732 | $23,071 | $27,968 |
|---|
5/22 | $15,883 | $23,114 | $27,318 |
|---|
6/22 | $14,420 | $21,206 | $25,154 |
|---|
7/22 | $16,393 | $23,161 | $28,173 |
|---|
8/22 | $16,663 | $22,217 | $26,861 |
|---|
9/22 | $14,940 | $20,170 | $24,249 |
|---|
10/22 | $15,681 | $21,804 | $25,667 |
|---|
11/22 | $15,565 | $23,022 | $26,836 |
|---|
12/22 | $14,063 | $21,696 | $24,782 |
|---|
1/23 | $16,274 | $23,059 | $26,847 |
|---|
2/23 | $15,832 | $22,496 | $26,528 |
|---|
3/23 | $16,765 | $23,322 | $28,342 |
|---|
4/23 | $15,906 | $23,686 | $28,621 |
|---|
5/23 | $17,564 | $23,789 | $29,926 |
|---|
6/23 | $18,952 | $25,361 | $31,972 |
|---|
7/23 | $20,204 | $26,176 | $33,050 |
|---|
8/23 | $17,957 | $25,759 | $32,753 |
|---|
9/23 | $16,888 | $24,531 | $30,972 |
|---|
10/23 | $15,685 | $24,015 | $30,531 |
|---|
11/23 | $18,804 | $26,208 | $33,859 |
|---|
12/23 | $20,511 | $27,399 | $35,358 |
|---|
1/24 | $20,106 | $27,859 | $36,240 |
|---|
2/24 | $22,477 | $29,347 | $38,713 |
|---|
3/24 | $22,685 | $30,291 | $39,394 |
|---|
4/24 | $20,511 | $29,054 | $37,723 |
|---|
5/24 | $20,032 | $30,494 | $39,981 |
|---|
6/24 | $20,757 | $31,589 | $42,677 |
|---|
7/24 | $20,941 | $31,973 | $41,951 |
|---|
8/24 | $21,777 | $32,749 | $42,825 |
|---|
9/24 | $22,931 | $33,448 | $44,038 |
|---|
10/24 | $23,901 | $33,145 | $43,893 |
|---|
11/24 | $28,544 | $35,090 | $46,740 |
|---|
12/24 | $27,844 | $34,254 | $47,152 |
|---|
|
|
| Average Annual Return [Table Text Block] |
AATR | 1 Year | 5 Years | 10 Years |
|---|
Class A | 35.75% | 8.29% | 11.39% |
|---|
Class A, with 5.25% maximum front end sales charge | 28.59% | 7.12% | 10.78% |
|---|
S&P 500® Index | 25.02% | 14.53% | 13.10% |
|---|
Russell 1000® Growth Index | 33.36% | 18.96% | 16.78% |
|---|
|
|
| AssetsNet |
$ 194,996,435
|
|
| Holdings Count | Holding |
28
|
|
| Advisory Fees Paid, Amount |
$ 877,326
|
|
| InvestmentCompanyPortfolioTurnover |
57.00%
|
|
| Additional Fund Statistics [Text Block] |
Total Net Assets | $194,996,435 |
|---|
# of Portfolio Holdings | 28 |
|---|
Portfolio Turnover Rate | 57% |
|---|
Total Advisory Fees Paid | $877,326 |
|---|
|
|
| Holdings [Text Block] |
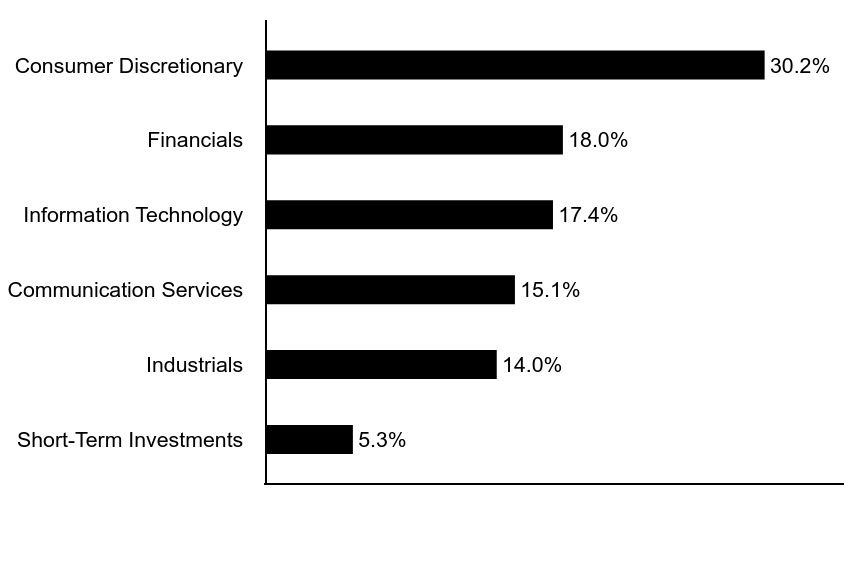
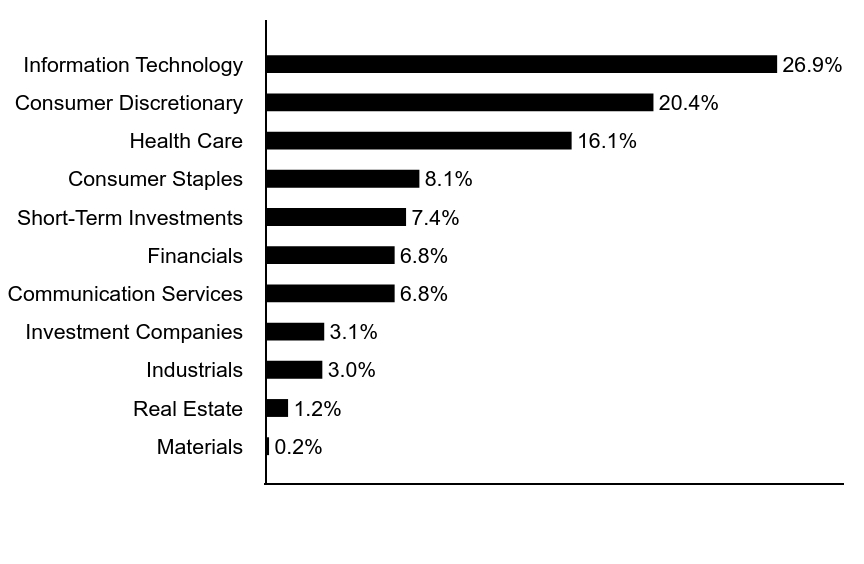
Sector Allocation (% of total investments)Value | Value |
|---|
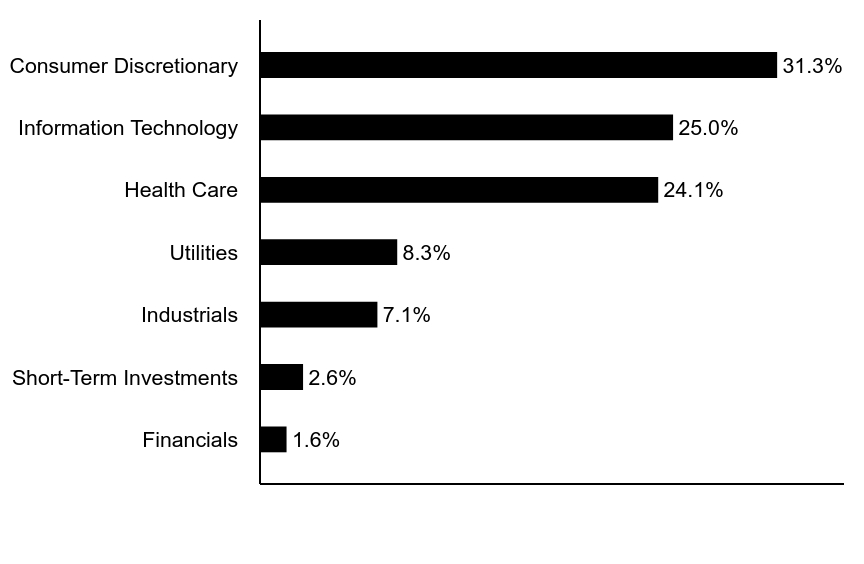
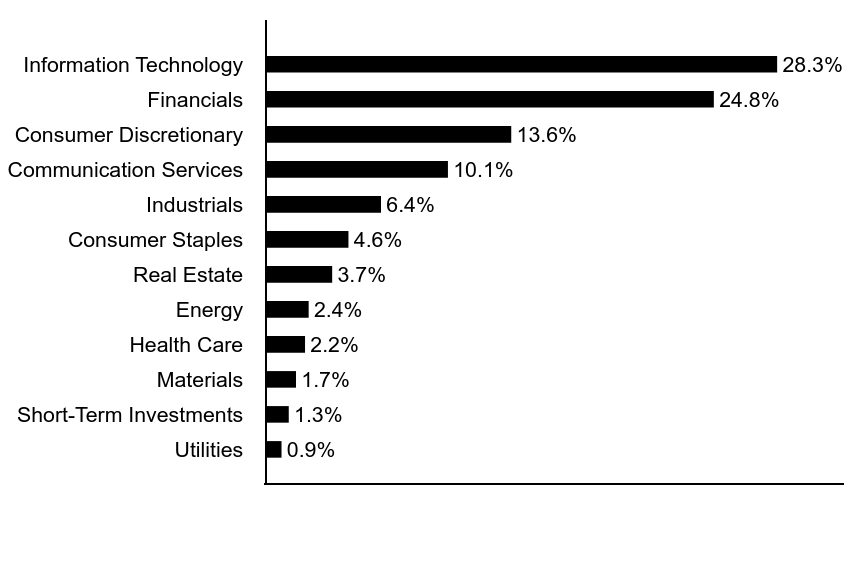
Real Estate | 1.6% | Short-Term Investments | 2.3% | Industrials | 2.6% | Investment Company | 3.0% | Health Care | 5.8% | Financals | 8.0% | Communication Services | 10.7% | Information Technology | 31.6% | Consumer Discretionary | 34.4% |
Top Ten Holdings (% of total investments)Footnote ReferenceaTesla, Inc. | 9.5% | Cloudflare, Inc. | 9.4% | DoorDash, Inc. | 6.4% | Shopify, Inc. | 6.3% | ROBLOX Corp. | 5.4% | Trade Desk, Inc. | 5.3% | MercadoLibre, Inc. | 4.9% | Amazon.com, Inc. | 4.9% | Snowflake, Inc. | 4.9% | Crowdstrike Holdings, Inc. | 3.7% | Total | 60.7% |
| Footnote | Description | Footnotea | Excluding cash equivalents. |
|
|
| Material Fund Change [Text Block] |
|
|
| Updated Prospectus Web Address |
<span style="box-sizing: border-box; color: rgb(0, 0, 0); display: inline; flex-wrap: nowrap; font-size: 10.6667px; font-weight: 400; grid-area: auto; line-height: 16px; margin: 0px; overflow: visible; text-align: left;">www.morganstanley.com/im/shareholderreports</span>
|
|
| C000155898 |
|
|
| Shareholder Report [Line Items] |
|
|
| Fund Name |
Morgan Stanley Institutional Fund, Inc. - Advantage Portfolio
|
|
| Class Name |
Class C
|
|
| Trading Symbol |
MSPRX
|
|
| Annual or Semi-Annual Statement [Text Block] |
This annual shareholder report contains important information about Morgan Stanley Institutional Fund, Inc. - Advantage Portfolio for the period of January 1, 2024 to December 31, 2024.
|
|
| Shareholder Report Annual or Semi-Annual |
Annual Shareholder Report
|
|
| Additional Information [Text Block] |
You can find additional information about the Fund at www.morganstanley.com/im/shareholderreports. You can also request this information by contacting us at 1-800-869-6397.
|
|
| Additional Information Phone Number |
1-800-869-6397
|
|
| Additional Information Website |
<span style="box-sizing: border-box; color: rgb(0, 0, 0); display: inline; flex-wrap: nowrap; font-size: 10.6667px; font-weight: 400; grid-area: auto; line-height: 16px; margin: 0px; overflow: visible; text-align: left;">www.morganstanley.com/im/shareholderreports</span>
|
|
| Expenses [Text Block] |
What were the Fund costs for the last year?(based on a hypothetical $10,000 investment) Class Name | Costs of a $10,000 investment | Costs paid as a percentage of a $10,000 investment |
|---|
Class C | $225 | 1.92% |
|---|
|
|
| Expenses Paid, Amount |
$ 225
|
|
| Expense Ratio, Percent |
1.92%
|
|
| Factors Affecting Performance [Text Block] |
How did the Fund perform last year and what affected its performance?Key contributors to (↑) and detractors from (↓) performance, relative to the Russell 1000® Growth Index: ↑ Stock selection in information technology, led by a position in an enterprise analytics platform and Bitcoin developing company ↑ Average overweight and stock selection in consumer discretionary, led by a food delivery company ↑ No exposure to consumer staples, a sector that underperformed in the index ↓ Stock selection in health care, led lower by a biopharmaceutical royalties acquirer and a next-generation sequencing company (the sequencing company was sold during the period) ↓ Stock selection and average overweight in financials, ↓ Average underweight in information technology, which was one of the stronger performing sectors in the period |
|
| Line Graph [Table Text Block] |
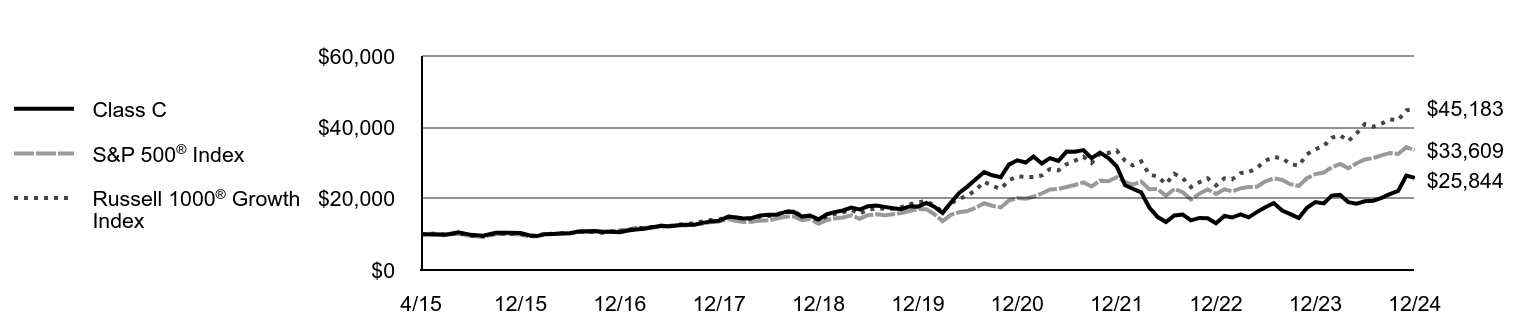 | Class C | S&P 500® Index | Russell 1000® Growth Index |
|---|
4/15 | $10,000 | $10,000 | $10,000 |
|---|
5/15 | $9,978 | $10,129 | $10,141 |
|---|
6/15 | $9,873 | $9,933 | $9,962 |
|---|
7/15 | $10,548 | $10,141 | $10,300 |
|---|
8/15 | $9,851 | $9,529 | $9,674 |
|---|
9/15 | $9,616 | $9,293 | $9,435 |
|---|
10/15 | $10,414 | $10,077 | $10,248 |
|---|
11/15 | $10,465 | $10,107 | $10,276 |
|---|
12/15 | $10,391 | $9,947 | $10,125 |
|---|
1/16 | $9,740 | $9,454 | $9,560 |
|---|
2/16 | $9,505 | $9,441 | $9,556 |
|---|
3/16 | $10,048 | $10,082 | $10,201 |
|---|
4/16 | $10,120 | $10,121 | $10,107 |
|---|
5/16 | $10,240 | $10,302 | $10,304 |
|---|
6/16 | $10,325 | $10,329 | $10,263 |
|---|
7/16 | $10,813 | $10,710 | $10,748 |
|---|
8/16 | $10,868 | $10,725 | $10,694 |
|---|
9/16 | $10,935 | $10,727 | $10,733 |
|---|
10/16 | $10,727 | $10,531 | $10,481 |
|---|
11/16 | $10,721 | $10,921 | $10,709 |
|---|
12/16 | $10,568 | $11,137 | $10,842 |
|---|
1/17 | $11,049 | $11,348 | $11,207 |
|---|
2/17 | $11,363 | $11,799 | $11,673 |
|---|
3/17 | $11,542 | $11,813 | $11,808 |
|---|
4/17 | $12,003 | $11,934 | $12,078 |
|---|
5/17 | $12,404 | $12,102 | $12,392 |
|---|
6/17 | $12,238 | $12,178 | $12,359 |
|---|
7/17 | $12,571 | $12,428 | $12,688 |
|---|
8/17 | $12,682 | $12,466 | $12,920 |
|---|
9/17 | $12,664 | $12,723 | $13,088 |
|---|
10/17 | $13,221 | $13,020 | $13,596 |
|---|
11/17 | $13,630 | $13,419 | $14,009 |
|---|
12/17 | $13,820 | $13,569 | $14,118 |
|---|
1/18 | $14,902 | $14,345 | $15,118 |
|---|
2/18 | $14,783 | $13,817 | $14,721 |
|---|
3/18 | $14,431 | $13,466 | $14,317 |
|---|
4/18 | $14,590 | $13,517 | $14,367 |
|---|
5/18 | $15,267 | $13,843 | $14,997 |
|---|
6/18 | $15,480 | $13,928 | $15,142 |
|---|
7/18 | $15,468 | $14,446 | $15,586 |
|---|
8/18 | $16,292 | $14,917 | $16,438 |
|---|
9/18 | $16,346 | $15,002 | $16,530 |
|---|
10/18 | $14,976 | $13,977 | $15,052 |
|---|
11/18 | $15,272 | $14,261 | $15,212 |
|---|
12/18 | $14,185 | $12,974 | $13,904 |
|---|
1/19 | $15,639 | $14,013 | $15,154 |
|---|
2/19 | $16,225 | $14,463 | $15,696 |
|---|
3/19 | $16,697 | $14,744 | $16,143 |
|---|
4/19 | $17,509 | $15,341 | $16,872 |
|---|
5/19 | $16,959 | $14,366 | $15,806 |
|---|
6/19 | $17,869 | $15,379 | $16,892 |
|---|
7/19 | $18,095 | $15,600 | $17,273 |
|---|
8/19 | $17,693 | $15,353 | $17,141 |
|---|
9/19 | $17,318 | $15,640 | $17,143 |
|---|
10/19 | $17,029 | $15,979 | $17,626 |
|---|
11/19 | $17,820 | $16,559 | $18,408 |
|---|
12/19 | $17,770 | $17,059 | $18,964 |
|---|
1/20 | $18,771 | $17,052 | $19,387 |
|---|
2/20 | $17,763 | $15,648 | $18,067 |
|---|
3/20 | $16,013 | $13,716 | $16,290 |
|---|
4/20 | $18,850 | $15,474 | $18,700 |
|---|
5/20 | $21,601 | $16,211 | $19,956 |
|---|
6/20 | $23,387 | $16,533 | $20,825 |
|---|
7/20 | $25,439 | $17,465 | $22,427 |
|---|
8/20 | $27,462 | $18,721 | $24,741 |
|---|
9/20 | $26,547 | $18,009 | $23,577 |
|---|
10/20 | $25,993 | $17,531 | $22,776 |
|---|
11/20 | $29,543 | $19,449 | $25,108 |
|---|
12/20 | $30,759 | $20,197 | $26,263 |
|---|
1/21 | $30,136 | $19,993 | $26,069 |
|---|
2/21 | $31,809 | $20,545 | $26,063 |
|---|
3/21 | $29,854 | $21,444 | $26,511 |
|---|
4/21 | $31,368 | $22,589 | $28,314 |
|---|
5/21 | $30,607 | $22,747 | $27,923 |
|---|
6/21 | $33,209 | $23,278 | $29,675 |
|---|
7/21 | $33,140 | $23,831 | $30,653 |
|---|
8/21 | $33,604 | $24,555 | $31,799 |
|---|
9/21 | $31,360 | $23,413 | $30,018 |
|---|
10/21 | $32,935 | $25,054 | $32,618 |
|---|
11/21 | $31,421 | $24,880 | $32,817 |
|---|
12/21 | $29,096 | $25,995 | $33,511 |
|---|
1/22 | $23,760 | $24,650 | $30,635 |
|---|
2/22 | $22,786 | $23,912 | $29,334 |
|---|
3/22 | $21,765 | $24,800 | $30,481 |
|---|
4/22 | $17,517 | $22,637 | $26,800 |
|---|
5/22 | $14,835 | $22,679 | $26,177 |
|---|
6/22 | $13,460 | $20,807 | $24,104 |
|---|
7/22 | $15,293 | $22,725 | $26,997 |
|---|
8/22 | $15,541 | $21,798 | $25,739 |
|---|
9/22 | $13,918 | $19,791 | $23,237 |
|---|
10/22 | $14,605 | $21,393 | $24,595 |
|---|
11/22 | $14,491 | $22,589 | $25,716 |
|---|
12/22 | $13,088 | $21,287 | $23,747 |
|---|
1/23 | $15,135 | $22,625 | $25,726 |
|---|
2/23 | $14,713 | $22,073 | $25,421 |
|---|
3/23 | $15,569 | $22,883 | $27,158 |
|---|
4/23 | $14,763 | $23,240 | $27,426 |
|---|
5/23 | $16,302 | $23,341 | $28,676 |
|---|
6/23 | $17,590 | $24,883 | $30,637 |
|---|
7/23 | $18,753 | $25,683 | $31,669 |
|---|
8/23 | $16,667 | $25,274 | $31,385 |
|---|
9/23 | $15,675 | $24,069 | $29,678 |
|---|
10/23 | $14,558 | $23,563 | $29,256 |
|---|
11/23 | $17,454 | $25,715 | $32,445 |
|---|
12/23 | $19,038 | $26,883 | $33,882 |
|---|
1/24 | $18,662 | $27,335 | $34,727 |
|---|
2/24 | $20,862 | $28,794 | $37,096 |
|---|
3/24 | $21,056 | $29,721 | $37,749 |
|---|
4/24 | $19,038 | $28,507 | $36,148 |
|---|
5/24 | $18,594 | $29,920 | $38,312 |
|---|
6/24 | $19,266 | $30,994 | $40,895 |
|---|
7/24 | $19,437 | $31,371 | $40,200 |
|---|
8/24 | $20,212 | $32,132 | $41,037 |
|---|
9/24 | $21,284 | $32,818 | $42,200 |
|---|
10/24 | $22,185 | $32,521 | $42,060 |
|---|
11/24 | $26,494 | $34,430 | $44,788 |
|---|
12/24 | $25,844 | $33,609 | $45,183 |
|---|
|
|
| Average Annual Return [Table Text Block] |
AATR | 1 Year | 5 Years | Since 4/30/15
(Inception) |
|---|
Class C, with conversion to Class A after 8 years | 34.81% | 7.51% | 10.32% |
|---|
Class C, with 1% maximum contingent deferred sales charge and conversion to Class A after 8 years | 33.81% | 7.51% | 10.32% |
|---|
S&P 500® Index | 25.02% | 14.53% | 13.35% |
|---|
Russell 1000® Growth Index | 33.36% | 18.96% | 16.88% |
|---|
|
|
| Performance Inception Date |
Apr. 30, 2015
|
|
| AssetsNet |
$ 194,996,435
|
|
| Holdings Count | Holding |
28
|
|
| Advisory Fees Paid, Amount |
$ 877,326
|
|
| InvestmentCompanyPortfolioTurnover |
57.00%
|
|
| Additional Fund Statistics [Text Block] |
Total Net Assets | $194,996,435 |
|---|
# of Portfolio Holdings | 28 |
|---|
Portfolio Turnover Rate | 57% |
|---|
Total Advisory Fees Paid | $877,326 |
|---|
|
|
| Holdings [Text Block] |
Sector Allocation (% of total investments)Value | Value |
|---|
Real Estate | 1.6% | Short-Term Investments | 2.3% | Industrials | 2.6% | Investment Company | 3.0% | Health Care | 5.8% | Financals | 8.0% | Communication Services | 10.7% | Information Technology | 31.6% | Consumer Discretionary | 34.4% |
Top Ten Holdings (% of total investments)Footnote ReferenceaTesla, Inc. | 9.5% | Cloudflare, Inc. | 9.4% | DoorDash, Inc. | 6.4% | Shopify, Inc. | 6.3% | ROBLOX Corp. | 5.4% | Trade Desk, Inc. | 5.3% | MercadoLibre, Inc. | 4.9% | Amazon.com, Inc. | 4.9% | Snowflake, Inc. | 4.9% | Crowdstrike Holdings, Inc. | 3.7% | Total | 60.7% |
| Footnote | Description | Footnotea | Excluding cash equivalents. |
|
|
| Material Fund Change [Text Block] |
|
|
| Updated Prospectus Web Address |
<span style="box-sizing: border-box; color: rgb(0, 0, 0); display: inline; flex-wrap: nowrap; font-size: 10.6667px; font-weight: 400; grid-area: auto; line-height: 16px; margin: 0px; overflow: visible; text-align: left;">www.morganstanley.com/im/shareholderreports</span>
|
|
| C000085091 |
|
|
| Shareholder Report [Line Items] |
|
|
| Fund Name |
Morgan Stanley Institutional Fund, Inc. - Advantage Portfolio
|
|
| Class Name |
Class I
|
|
| Trading Symbol |
MPAIX
|
|
| Annual or Semi-Annual Statement [Text Block] |
This annual shareholder report contains important information about Morgan Stanley Institutional Fund, Inc. - Advantage Portfolio for the period of January 1, 2024 to December 31, 2024.
|
|
| Shareholder Report Annual or Semi-Annual |
Annual Shareholder Report
|
|
| Additional Information [Text Block] |
You can find additional information about the Fund at www.morganstanley.com/im/shareholderreports. You can also request this information by contacting us at 1-800-869-6397.
|
|
| Additional Information Phone Number |
1-800-869-6397
|
|
| Additional Information Website |
<span style="box-sizing: border-box; color: rgb(0, 0, 0); display: inline; flex-wrap: nowrap; font-size: 10.6667px; font-weight: 400; grid-area: auto; line-height: 16px; margin: 0px; overflow: visible; text-align: left;">www.morganstanley.com/im/shareholderreports</span>
|
|
| Expenses [Text Block] |
What were the Fund costs for the last year?(based on a hypothetical $10,000 investment) Class Name | Costs of a $10,000 investment | Costs paid as a percentage of a $10,000 investment |
|---|
Class I | $100 | 0.85% |
|---|
|
|
| Expenses Paid, Amount |
$ 100
|
|
| Expense Ratio, Percent |
0.85%
|
|
| Factors Affecting Performance [Text Block] |
How did the Fund perform last year and what affected its performance?Key contributors to (↑) and detractors from (↓) performance, relative to the Russell 1000® Growth Index: ↑ Stock selection in information technology, led by a position in an enterprise analytics platform and Bitcoin developing company ↑ Average overweight and stock selection in consumer discretionary, led by a food delivery company ↑ No exposure to consumer staples, a sector that underperformed in the index ↓ Stock selection in health care, led lower by a biopharmaceutical royalties acquirer and a next-generation sequencing company (the sequencing company was sold during the period) ↓ Stock selection and average overweight in financials, ↓ Average underweight in information technology, which was one of the stronger performing sectors in the period |
|
| Line Graph [Table Text Block] |
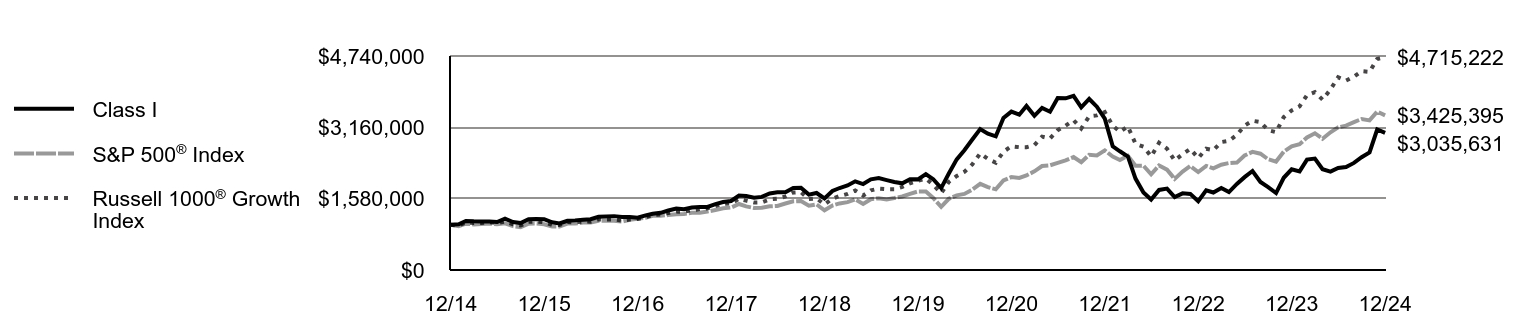 | Class I | S&P 500® Index | Russell 1000® Growth Index |
|---|
12/14 | $1,000,000 | $1,000,000 | $1,000,000 |
|---|
1/15 | $1,011,289 | $969,981 | $984,687 |
|---|
2/15 | $1,087,344 | $1,025,727 | $1,050,322 |
|---|
3/15 | $1,078,431 | $1,009,506 | $1,038,376 |
|---|
4/15 | $1,074,272 | $1,019,190 | $1,043,577 |
|---|
5/15 | $1,073,084 | $1,032,296 | $1,058,266 |
|---|
6/15 | $1,062,983 | $1,012,313 | $1,039,623 |
|---|
7/15 | $1,136,478 | $1,033,522 | $1,074,878 |
|---|
8/15 | $1,062,751 | $971,166 | $1,009,602 |
|---|
9/15 | $1,038,775 | $947,136 | $984,626 |
|---|
10/15 | $1,125,689 | $1,027,030 | $1,069,408 |
|---|
11/15 | $1,132,282 | $1,030,085 | $1,072,410 |
|---|
12/15 | $1,125,630 | $1,013,838 | $1,056,673 |
|---|
1/16 | $1,055,803 | $963,527 | $997,681 |
|---|
2/16 | $1,031,235 | $962,227 | $997,256 |
|---|
3/16 | $1,090,717 | $1,027,503 | $1,064,512 |
|---|
4/16 | $1,099,122 | $1,031,487 | $1,054,791 |
|---|
5/16 | $1,113,992 | $1,050,010 | $1,075,275 |
|---|
6/16 | $1,124,337 | $1,052,731 | $1,071,051 |
|---|
7/16 | $1,178,662 | $1,091,544 | $1,121,607 |
|---|
8/16 | $1,185,235 | $1,093,076 | $1,116,035 |
|---|
9/16 | $1,193,124 | $1,093,283 | $1,120,117 |
|---|
10/16 | $1,172,088 | $1,073,340 | $1,093,813 |
|---|
11/16 | $1,172,088 | $1,113,091 | $1,117,613 |
|---|
12/16 | $1,157,327 | $1,135,093 | $1,131,448 |
|---|
1/17 | $1,210,987 | $1,156,621 | $1,169,576 |
|---|
2/17 | $1,246,098 | $1,202,546 | $1,218,155 |
|---|
3/17 | $1,266,634 | $1,203,949 | $1,232,245 |
|---|
4/17 | $1,318,307 | $1,216,313 | $1,260,426 |
|---|
5/17 | $1,363,354 | $1,233,430 | $1,293,201 |
|---|
6/17 | $1,346,793 | $1,241,129 | $1,289,794 |
|---|
7/17 | $1,383,960 | $1,266,650 | $1,324,076 |
|---|
8/17 | $1,397,946 | $1,270,527 | $1,348,348 |
|---|
9/17 | $1,397,280 | $1,296,736 | $1,365,879 |
|---|
10/17 | $1,459,884 | $1,326,995 | $1,418,803 |
|---|
11/17 | $1,506,505 | $1,367,694 | $1,461,906 |
|---|
12/17 | $1,528,373 | $1,382,901 | $1,473,287 |
|---|
1/18 | $1,650,215 | $1,462,078 | $1,577,634 |
|---|
2/18 | $1,638,102 | $1,408,190 | $1,536,267 |
|---|
3/18 | $1,600,338 | $1,372,403 | $1,494,138 |
|---|
4/18 | $1,619,577 | $1,377,669 | $1,499,358 |
|---|
5/18 | $1,695,817 | $1,410,846 | $1,565,077 |
|---|
6/18 | $1,720,756 | $1,419,530 | $1,580,146 |
|---|
7/18 | $1,720,947 | $1,472,355 | $1,626,533 |
|---|
8/18 | $1,814,343 | $1,520,333 | $1,715,466 |
|---|
9/18 | $1,821,583 | $1,528,986 | $1,725,054 |
|---|
10/18 | $1,670,267 | $1,424,480 | $1,570,788 |
|---|
11/18 | $1,705,724 | $1,453,508 | $1,587,472 |
|---|
12/18 | $1,585,560 | $1,322,270 | $1,450,985 |
|---|
1/19 | $1,749,557 | $1,428,231 | $1,581,409 |
|---|
2/19 | $1,816,063 | $1,474,089 | $1,637,991 |
|---|
3/19 | $1,871,233 | $1,502,733 | $1,684,613 |
|---|
4/19 | $1,963,434 | $1,563,578 | $1,760,724 |
|---|
5/19 | $1,903,730 | $1,464,216 | $1,649,493 |
|---|
6/19 | $2,007,268 | $1,567,408 | $1,762,775 |
|---|
7/19 | $2,034,475 | $1,589,935 | $1,802,580 |
|---|
8/19 | $1,991,397 | $1,564,750 | $1,788,774 |
|---|
9/19 | $1,950,587 | $1,594,027 | $1,788,996 |
|---|
10/19 | $1,920,357 | $1,628,553 | $1,839,431 |
|---|
11/19 | $2,011,046 | $1,687,668 | $1,921,034 |
|---|
12/19 | $2,007,316 | $1,738,605 | $1,978,994 |
|---|
1/20 | $2,122,086 | $1,737,924 | $2,023,234 |
|---|
2/20 | $2,010,397 | $1,594,859 | $1,885,449 |
|---|
3/20 | $1,813,979 | $1,397,874 | $1,699,966 |
|---|
4/20 | $2,136,721 | $1,577,072 | $1,951,512 |
|---|
5/20 | $2,450,220 | $1,652,185 | $2,082,526 |
|---|
6/20 | $2,654,340 | $1,685,042 | $2,173,209 |
|---|
7/20 | $2,890,042 | $1,780,054 | $2,340,414 |
|---|
8/20 | $3,122,663 | $1,908,005 | $2,581,926 |
|---|
9/20 | $3,020,987 | $1,835,507 | $2,460,447 |
|---|
10/20 | $2,960,136 | $1,786,694 | $2,376,885 |
|---|
11/20 | $3,367,608 | $1,982,273 | $2,620,259 |
|---|
12/20 | $3,508,593 | $2,058,487 | $2,740,768 |
|---|
1/21 | $3,440,480 | $2,037,705 | $2,720,489 |
|---|
2/21 | $3,635,087 | $2,093,895 | $2,719,859 |
|---|
3/21 | $3,414,533 | $2,185,598 | $2,766,587 |
|---|
4/21 | $3,589,679 | $2,302,241 | $2,954,822 |
|---|
5/21 | $3,505,349 | $2,318,321 | $2,913,953 |
|---|
6/21 | $3,806,989 | $2,372,442 | $3,096,768 |
|---|
7/21 | $3,802,124 | $2,428,799 | $3,198,826 |
|---|
8/21 | $3,858,884 | $2,502,648 | $3,318,426 |
|---|
9/21 | $3,604,274 | $2,386,250 | $3,132,575 |
|---|
10/21 | $3,788,339 | $2,553,435 | $3,403,905 |
|---|
11/21 | $3,617,248 | $2,535,743 | $3,424,717 |
|---|
12/21 | $3,352,619 | $2,649,385 | $3,497,125 |
|---|
1/22 | $2,740,419 | $2,512,287 | $3,196,984 |
|---|
2/22 | $2,629,564 | $2,437,066 | $3,061,197 |
|---|
3/22 | $2,514,714 | $2,527,553 | $3,180,943 |
|---|
4/22 | $2,025,354 | $2,307,145 | $2,796,807 |
|---|
5/22 | $1,717,755 | $2,311,378 | $2,731,788 |
|---|
6/22 | $1,559,962 | $2,120,588 | $2,515,400 |
|---|
7/22 | $1,773,682 | $2,316,116 | $2,817,301 |
|---|
8/22 | $1,803,643 | $2,221,660 | $2,686,059 |
|---|
9/22 | $1,616,887 | $2,017,049 | $2,424,932 |
|---|
10/22 | $1,697,782 | $2,180,352 | $2,566,666 |
|---|
11/22 | $1,685,797 | $2,302,198 | $2,683,621 |
|---|
12/22 | $1,524,097 | $2,169,558 | $2,478,172 |
|---|
1/23 | $1,763,418 | $2,305,880 | $2,684,721 |
|---|
2/23 | $1,716,813 | $2,249,619 | $2,652,836 |
|---|
3/23 | $1,817,580 | $2,332,212 | $2,834,174 |
|---|
4/23 | $1,725,631 | $2,368,614 | $2,862,136 |
|---|
5/23 | $1,905,751 | $2,378,910 | $2,992,588 |
|---|
6/23 | $2,056,901 | $2,536,097 | $3,197,237 |
|---|
7/23 | $2,192,936 | $2,617,569 | $3,304,952 |
|---|
8/23 | $1,949,837 | $2,575,893 | $3,275,277 |
|---|
9/23 | $1,833,955 | $2,453,080 | $3,097,155 |
|---|
10/23 | $1,704,218 | $2,401,500 | $3,053,059 |
|---|
11/23 | $2,043,046 | $2,620,818 | $3,385,876 |
|---|
12/23 | $2,229,464 | $2,739,884 | $3,535,809 |
|---|
1/24 | $2,185,379 | $2,785,926 | $3,623,998 |
|---|
2/24 | $2,444,853 | $2,934,682 | $3,871,252 |
|---|
3/24 | $2,467,526 | $3,029,104 | $3,939,403 |
|---|
4/24 | $2,231,983 | $2,905,381 | $3,772,310 |
|---|
5/24 | $2,179,081 | $3,049,444 | $3,998,140 |
|---|
6/24 | $2,259,694 | $3,158,864 | $4,267,741 |
|---|
7/24 | $2,281,107 | $3,197,315 | $4,195,145 |
|---|
8/24 | $2,371,797 | $3,274,872 | $4,282,521 |
|---|
9/24 | $2,497,756 | $3,344,813 | $4,403,847 |
|---|
10/24 | $2,604,820 | $3,314,481 | $4,389,274 |
|---|
11/24 | $3,111,173 | $3,509,044 | $4,673,964 |
|---|
12/24 | $3,035,631 | $3,425,395 | $4,715,222 |
|---|
|
|
| Average Annual Return [Table Text Block] |
AATR | 1 Year | 5 Years | 10 Years |
|---|
Class I | 36.16% | 8.62% | 11.74% |
|---|
S&P 500® Index | 25.02% | 14.53% | 13.10% |
|---|
Russell 1000® Growth Index | 33.36% | 18.96% | 16.78% |
|---|
|
|
| AssetsNet |
$ 194,996,435
|
|
| Holdings Count | Holding |
28
|
|
| Advisory Fees Paid, Amount |
$ 877,326
|
|
| InvestmentCompanyPortfolioTurnover |
57.00%
|
|
| Additional Fund Statistics [Text Block] |
Total Net Assets | $194,996,435 |
|---|
# of Portfolio Holdings | 28 |
|---|
Portfolio Turnover Rate | 57% |
|---|
Total Advisory Fees Paid | $877,326 |
|---|
|
|
| Holdings [Text Block] |
Sector Allocation (% of total investments)Value | Value |
|---|
Real Estate | 1.6% | Short-Term Investments | 2.3% | Industrials | 2.6% | Investment Company | 3.0% | Health Care | 5.8% | Financals | 8.0% | Communication Services | 10.7% | Information Technology | 31.6% | Consumer Discretionary | 34.4% |
Top Ten Holdings (% of total investments)Footnote ReferenceaTesla, Inc. | 9.5% | Cloudflare, Inc. | 9.4% | DoorDash, Inc. | 6.4% | Shopify, Inc. | 6.3% | ROBLOX Corp. | 5.4% | Trade Desk, Inc. | 5.3% | MercadoLibre, Inc. | 4.9% | Amazon.com, Inc. | 4.9% | Snowflake, Inc. | 4.9% | Crowdstrike Holdings, Inc. | 3.7% | Total | 60.7% |
| Footnote | Description | Footnotea | Excluding cash equivalents. |
|
|
| Material Fund Change [Text Block] |
|
|
| Updated Prospectus Web Address |
<span style="box-sizing: border-box; color: rgb(0, 0, 0); display: inline; flex-wrap: nowrap; font-size: 10.6667px; font-weight: 400; grid-area: auto; line-height: 16px; margin: 0px; overflow: visible; text-align: left;">www.morganstanley.com/im/shareholderreports</span>
|
|
| C000085092 |
|
|
| Shareholder Report [Line Items] |
|
|
| Fund Name |
Morgan Stanley Institutional Fund, Inc. - Advantage Portfolio
|
|
| Class Name |
Class L
|
|
| Trading Symbol |
MAPLX
|
|
| Annual or Semi-Annual Statement [Text Block] |
This annual shareholder report contains important information about Morgan Stanley Institutional Fund, Inc. - Advantage Portfolio for the period of January 1, 2024 to December 31, 2024.
|
|
| Shareholder Report Annual or Semi-Annual |
Annual Shareholder Report
|
|
| Additional Information [Text Block] |
You can find additional information about the Fund at www.morganstanley.com/im/shareholderreports. You can also request this information by contacting us at 1-800-869-6397.
|
|
| Additional Information Phone Number |
1-800-869-6397
|
|
| Additional Information Website |
<span style="box-sizing: border-box; color: rgb(0, 0, 0); display: inline; flex-wrap: nowrap; font-size: 10.6667px; font-weight: 400; grid-area: auto; line-height: 16px; margin: 0px; overflow: visible; text-align: left;">www.morganstanley.com/im/shareholderreports</span>
|
|
| Expenses [Text Block] |
What were the Fund costs for the last year?(based on a hypothetical $10,000 investment) Class Name | Costs of a $10,000 investment | Costs paid as a percentage of a $10,000 investment |
|---|
Class L | $117 | 0.99% |
|---|
|
|
| Expenses Paid, Amount |
$ 117
|
|
| Expense Ratio, Percent |
0.99%
|
|
| Factors Affecting Performance [Text Block] |
How did the Fund perform last year and what affected its performance?Key contributors to (↑) and detractors from (↓) performance, relative to the Russell 1000® Growth Index: ↑ Stock selection in information technology, led by a position in an enterprise analytics platform and Bitcoin developing company ↑ Average overweight and stock selection in consumer discretionary, led by a food delivery company ↑ No exposure to consumer staples, a sector that underperformed in the index ↓ Stock selection in health care, led lower by a biopharmaceutical royalties acquirer and a next-generation sequencing company (the sequencing company was sold during the period) ↓ Stock selection and average overweight in financials, ↓ Average underweight in information technology, which was one of the stronger performing sectors in the period |
|
| Line Graph [Table Text Block] |
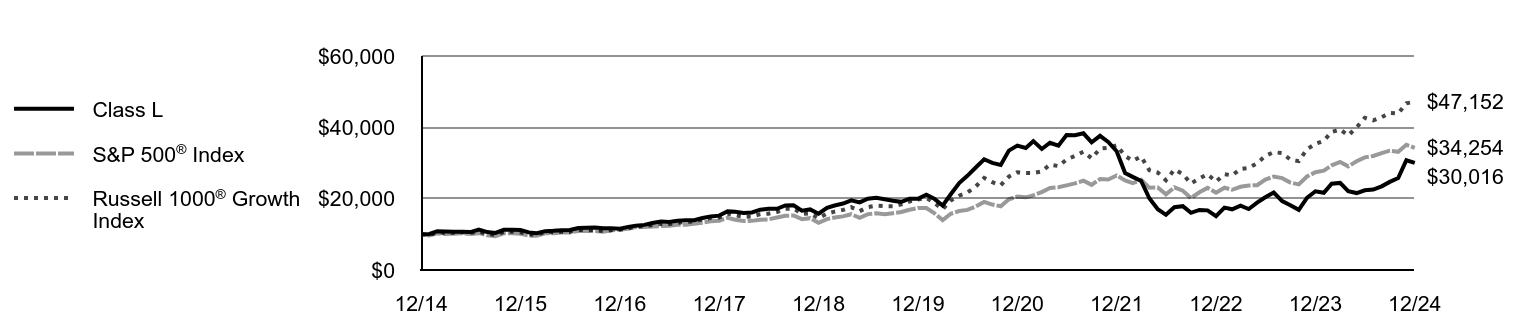 | Class L | S&P 500® Index | Russell 1000® Growth Index |
|---|
12/14 | $10,000 | $10,000 | $10,000 |
|---|
1/15 | $10,113 | $9,700 | $9,847 |
|---|
2/15 | $10,874 | $10,257 | $10,503 |
|---|
3/15 | $10,785 | $10,095 | $10,384 |
|---|
4/15 | $10,749 | $10,192 | $10,436 |
|---|
5/15 | $10,731 | $10,323 | $10,583 |
|---|
6/15 | $10,630 | $10,123 | $10,396 |
|---|
7/15 | $11,361 | $10,335 | $10,749 |
|---|
8/15 | $10,624 | $9,712 | $10,096 |
|---|
9/15 | $10,384 | $9,471 | $9,846 |
|---|
10/15 | $11,253 | $10,270 | $10,694 |
|---|
11/15 | $11,313 | $10,301 | $10,724 |
|---|
12/15 | $11,247 | $10,138 | $10,567 |
|---|
1/16 | $10,549 | $9,635 | $9,977 |
|---|
2/16 | $10,303 | $9,622 | $9,973 |
|---|
3/16 | $10,898 | $10,275 | $10,645 |
|---|
4/16 | $10,982 | $10,315 | $10,548 |
|---|
5/16 | $11,124 | $10,500 | $10,753 |
|---|
6/16 | $11,227 | $10,527 | $10,711 |
|---|
7/16 | $11,770 | $10,915 | $11,216 |
|---|
8/16 | $11,836 | $10,931 | $11,160 |
|---|
9/16 | $11,915 | $10,933 | $11,201 |
|---|
10/16 | $11,705 | $10,733 | $10,938 |
|---|
11/16 | $11,705 | $11,131 | $11,176 |
|---|
12/16 | $11,552 | $11,351 | $11,314 |
|---|
1/17 | $12,088 | $11,566 | $11,696 |
|---|
2/17 | $12,439 | $12,025 | $12,182 |
|---|
3/17 | $12,651 | $12,039 | $12,322 |
|---|
4/17 | $13,160 | $12,163 | $12,604 |
|---|
5/17 | $13,610 | $12,334 | $12,932 |
|---|
6/17 | $13,438 | $12,411 | $12,898 |
|---|
7/17 | $13,816 | $12,666 | $13,241 |
|---|
8/17 | $13,949 | $12,705 | $13,483 |
|---|
9/17 | $13,942 | $12,967 | $13,659 |
|---|
10/17 | $14,568 | $13,270 | $14,188 |
|---|
11/17 | $15,027 | $13,677 | $14,619 |
|---|
12/17 | $15,245 | $13,829 | $14,733 |
|---|
1/18 | $16,455 | $14,621 | $15,776 |
|---|
2/18 | $16,341 | $14,082 | $15,363 |
|---|
3/18 | $15,964 | $13,724 | $14,941 |
|---|
4/18 | $16,149 | $13,777 | $14,994 |
|---|
5/18 | $16,910 | $14,108 | $15,651 |
|---|
6/18 | $17,152 | $14,195 | $15,801 |
|---|
7/18 | $17,154 | $14,724 | $16,265 |
|---|
8/18 | $18,087 | $15,203 | $17,155 |
|---|
9/18 | $18,152 | $15,290 | $17,251 |
|---|
10/18 | $16,648 | $14,245 | $15,708 |
|---|
11/18 | $16,988 | $14,535 | $15,875 |
|---|
12/18 | $15,795 | $13,223 | $14,510 |
|---|
1/19 | $17,425 | $14,282 | $15,814 |
|---|
2/19 | $18,090 | $14,741 | $16,380 |
|---|
3/19 | $18,633 | $15,027 | $16,846 |
|---|
4/19 | $19,547 | $15,636 | $17,607 |
|---|
5/19 | $18,951 | $14,642 | $16,495 |
|---|
6/19 | $19,985 | $15,674 | $17,628 |
|---|
7/19 | $20,249 | $15,899 | $18,026 |
|---|
8/19 | $19,819 | $15,648 | $17,888 |
|---|
9/19 | $19,419 | $15,940 | $17,890 |
|---|
10/19 | $19,109 | $16,286 | $18,394 |
|---|
11/19 | $20,008 | $16,877 | $19,210 |
|---|
12/19 | $19,970 | $17,386 | $19,790 |
|---|
1/20 | $21,117 | $17,379 | $20,232 |
|---|
2/20 | $19,993 | $15,949 | $18,854 |
|---|
3/20 | $18,039 | $13,979 | $17,000 |
|---|
4/20 | $21,248 | $15,771 | $19,515 |
|---|
5/20 | $24,364 | $16,522 | $20,825 |
|---|
6/20 | $26,396 | $16,850 | $21,732 |
|---|
7/20 | $28,735 | $17,801 | $23,404 |
|---|
8/20 | $31,044 | $19,080 | $25,819 |
|---|
9/20 | $30,036 | $18,355 | $24,604 |
|---|
10/20 | $29,428 | $17,867 | $23,769 |
|---|
11/20 | $33,476 | $19,823 | $26,203 |
|---|
12/20 | $34,877 | $20,585 | $27,408 |
|---|
1/21 | $34,196 | $20,377 | $27,205 |
|---|
2/21 | $36,125 | $20,939 | $27,199 |
|---|
3/21 | $33,929 | $21,856 | $27,666 |
|---|
4/21 | $35,671 | $23,022 | $29,548 |
|---|
5/21 | $34,836 | $23,183 | $29,140 |
|---|
6/21 | $37,827 | $23,724 | $30,968 |
|---|
7/21 | $37,770 | $24,288 | $31,988 |
|---|
8/21 | $38,329 | $25,026 | $33,184 |
|---|
9/21 | $35,801 | $23,863 | $31,326 |
|---|
10/21 | $37,624 | $25,534 | $34,039 |
|---|
11/21 | $35,922 | $25,357 | $34,247 |
|---|
12/21 | $33,294 | $26,494 | $34,971 |
|---|
1/22 | $27,207 | $25,123 | $31,970 |
|---|
2/22 | $26,107 | $24,371 | $30,612 |
|---|
3/22 | $24,958 | $25,276 | $31,809 |
|---|
4/22 | $20,100 | $23,071 | $27,968 |
|---|
5/22 | $17,042 | $23,114 | $27,318 |
|---|
6/22 | $15,473 | $21,206 | $25,154 |
|---|
7/22 | $17,592 | $23,161 | $28,173 |
|---|
8/22 | $17,891 | $22,217 | $26,861 |
|---|
9/22 | $16,042 | $20,170 | $24,249 |
|---|
10/22 | $16,842 | $21,804 | $25,667 |
|---|
11/22 | $16,722 | $23,022 | $26,836 |
|---|
12/22 | $15,113 | $21,696 | $24,782 |
|---|
1/23 | $17,489 | $23,059 | $26,847 |
|---|
2/23 | $17,021 | $22,496 | $26,528 |
|---|
3/23 | $18,020 | $23,322 | $28,342 |
|---|
4/23 | $17,097 | $23,686 | $28,621 |
|---|
5/23 | $18,879 | $23,789 | $29,926 |
|---|
6/23 | $20,383 | $25,361 | $31,972 |
|---|
7/23 | $21,735 | $26,176 | $33,050 |
|---|
8/23 | $19,321 | $25,759 | $32,753 |
|---|
9/23 | $18,171 | $24,531 | $30,972 |
|---|
10/23 | $16,870 | $24,015 | $30,531 |
|---|
11/23 | $20,231 | $26,208 | $33,859 |
|---|
12/23 | $22,076 | $27,399 | $35,358 |
|---|
1/24 | $21,634 | $27,859 | $36,240 |
|---|
2/24 | $24,199 | $29,347 | $38,713 |
|---|
3/24 | $24,414 | $30,291 | $39,394 |
|---|
4/24 | $22,088 | $29,054 | $37,723 |
|---|
5/24 | $21,570 | $30,494 | $39,981 |
|---|
6/24 | $22,354 | $31,589 | $42,677 |
|---|
7/24 | $22,569 | $31,973 | $41,951 |
|---|
8/24 | $23,466 | $32,749 | $42,825 |
|---|
9/24 | $24,704 | $33,448 | $44,038 |
|---|
10/24 | $25,766 | $33,145 | $43,893 |
|---|
11/24 | $30,770 | $35,090 | $46,740 |
|---|
12/24 | $30,016 | $34,254 | $47,152 |
|---|
|
|
| Average Annual Return [Table Text Block] |
AATR | 1 Year | 5 Years | 10 Years |
|---|
Class L | 35.97% | 8.49% | 11.62% |
|---|
S&P 500® Index | 25.02% | 14.53% | 13.10% |
|---|
Russell 1000® Growth Index | 33.36% | 18.96% | 16.78% |
|---|
|
|
| AssetsNet |
$ 194,996,435
|
|
| Holdings Count | Holding |
28
|
|
| Advisory Fees Paid, Amount |
$ 877,326
|
|
| InvestmentCompanyPortfolioTurnover |
57.00%
|
|
| Additional Fund Statistics [Text Block] |
Total Net Assets | $194,996,435 |
|---|
# of Portfolio Holdings | 28 |
|---|
Portfolio Turnover Rate | 57% |
|---|
Total Advisory Fees Paid | $877,326 |
|---|
|
|
| Holdings [Text Block] |
Sector Allocation (% of total investments)Value | Value |
|---|
Real Estate | 1.6% | Short-Term Investments | 2.3% | Industrials | 2.6% | Investment Company | 3.0% | Health Care | 5.8% | Financals | 8.0% | Communication Services | 10.7% | Information Technology | 31.6% | Consumer Discretionary | 34.4% |
Top Ten Holdings (% of total investments)Footnote ReferenceaTesla, Inc. | 9.5% | Cloudflare, Inc. | 9.4% | DoorDash, Inc. | 6.4% | Shopify, Inc. | 6.3% | ROBLOX Corp. | 5.4% | Trade Desk, Inc. | 5.3% | MercadoLibre, Inc. | 4.9% | Amazon.com, Inc. | 4.9% | Snowflake, Inc. | 4.9% | Crowdstrike Holdings, Inc. | 3.7% | Total | 60.7% |
| Footnote | Description | Footnotea | Excluding cash equivalents. |
|
|
| Material Fund Change [Text Block] |
|
|
| Updated Prospectus Web Address |
<span style="box-sizing: border-box; color: rgb(0, 0, 0); display: inline; flex-wrap: nowrap; font-size: 10.6667px; font-weight: 400; grid-area: auto; line-height: 16px; margin: 0px; overflow: visible; text-align: left;">www.morganstanley.com/im/shareholderreports</span>
|
|
| C000126919 |
|
|
| Shareholder Report [Line Items] |
|
|
| Fund Name |
Morgan Stanley Institutional Fund, Inc. - Advantage Portfolio
|
|
| Class Name |
Class R6
|
|
| Trading Symbol |
MADSX
|
|
| Annual or Semi-Annual Statement [Text Block] |
This annual shareholder report contains important information about Morgan Stanley Institutional Fund, Inc. - Advantage Portfolio for the period of January 1, 2024 to December 31, 2024.
|
|
| Shareholder Report Annual or Semi-Annual |
Annual Shareholder Report
|
|
| Additional Information [Text Block] |
You can find additional information about the Fund at www.morganstanley.com/im/shareholderreports. You can also request this information by contacting us at 1-800-869-6397.
|
|
| Additional Information Phone Number |
1-800-869-6397
|
|
| Additional Information Website |
<span style="box-sizing: border-box; color: rgb(0, 0, 0); display: inline; flex-wrap: nowrap; font-size: 10.6667px; font-weight: 400; grid-area: auto; line-height: 16px; margin: 0px; overflow: visible; text-align: left;">www.morganstanley.com/im/shareholderreports</span>
|
|
| Expenses [Text Block] |
What were the Fund costs for the last year?(based on a hypothetical $10,000 investment) Class Name | Costs of a $10,000 investment | Costs paid as a percentage of a $10,000 investment |
|---|
Class R6 | $96 | 0.81% |
|---|
|
|
| Expenses Paid, Amount |
$ 96
|
|
| Expense Ratio, Percent |
0.81%
|
|
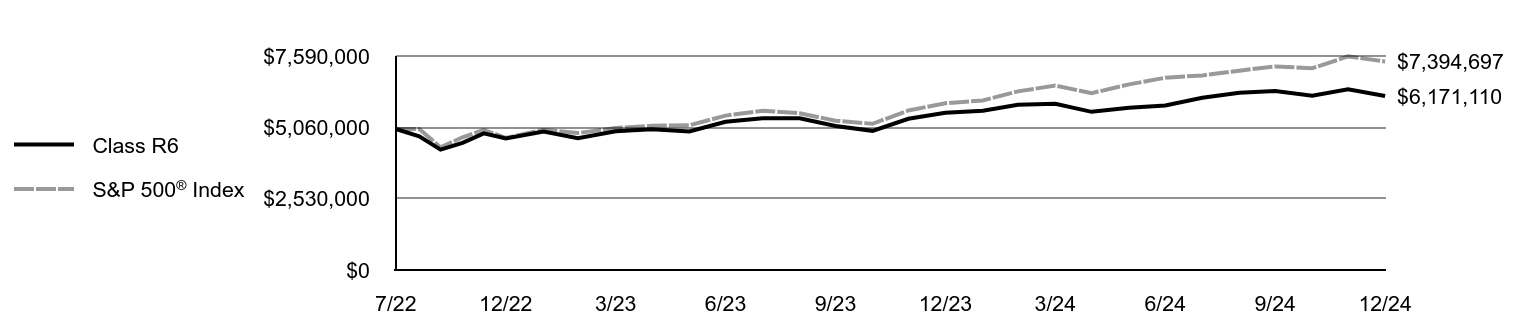
| Factors Affecting Performance [Text Block] |
How did the Fund perform last year and what affected its performance?Key contributors to (↑) and detractors from (↓) performance, relative to the Russell 1000® Growth Index: ↑ Stock selection in information technology, led by a position in an enterprise analytics platform and Bitcoin developing company ↑ Average overweight and stock selection in consumer discretionary, led by a food delivery company ↑ No exposure to consumer staples, a sector that underperformed in the index ↓ Stock selection in health care, led lower by a biopharmaceutical royalties acquirer and a next-generation sequencing company (the sequencing company was sold during the period) ↓ Stock selection and average overweight in financials, ↓ Average underweight in information technology, which was one of the stronger performing sectors in the period |
|
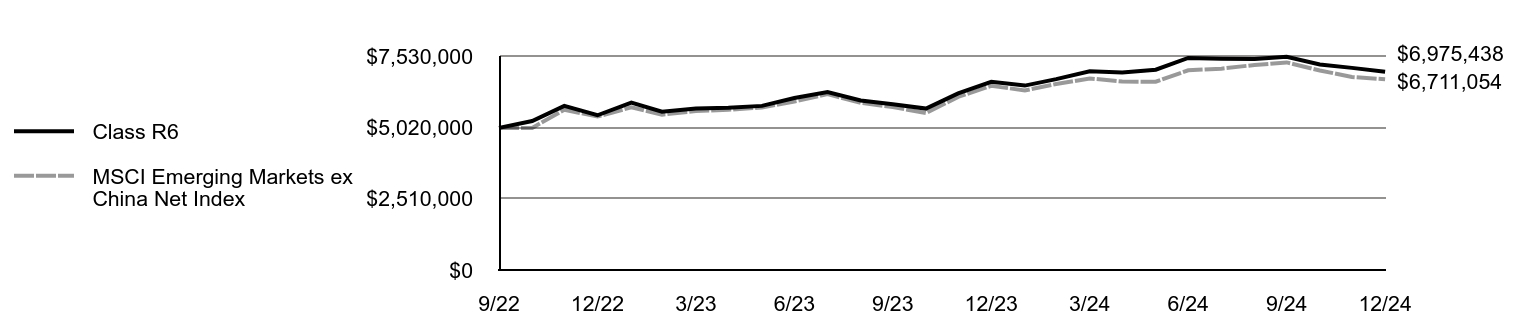
| Line Graph [Table Text Block] |
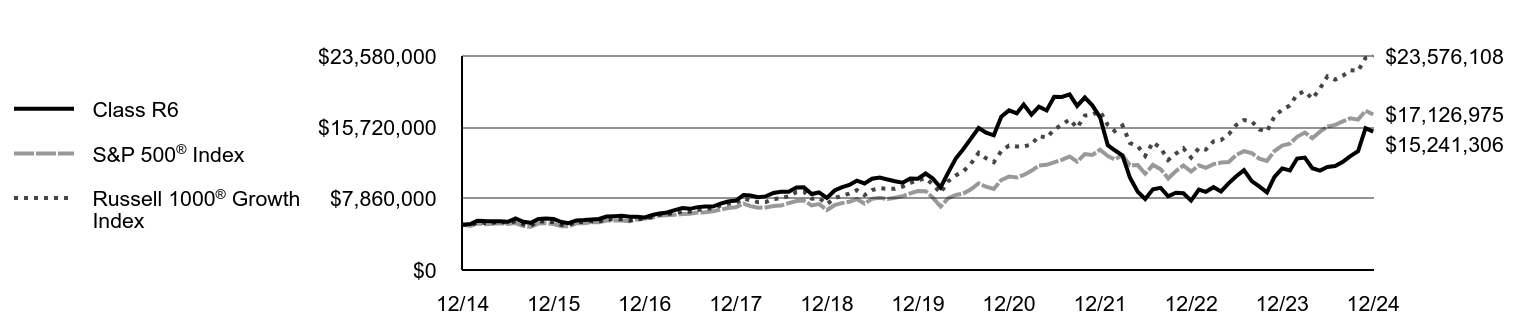 | Class R6 | S&P 500® Index | Russell 1000® Growth Index |
|---|
12/14 | $5,000,000 | $5,000,000 | $5,000,000 |
|---|
1/15 | $5,056,413 | $4,849,904 | $4,923,436 |
|---|
2/15 | $5,436,461 | $5,128,635 | $5,251,609 |
|---|
3/15 | $5,394,893 | $5,047,528 | $5,191,882 |
|---|
4/15 | $5,374,109 | $5,095,950 | $5,217,884 |
|---|
5/15 | $5,365,202 | $5,161,481 | $5,291,331 |
|---|
6/15 | $5,314,727 | $5,061,564 | $5,198,115 |
|---|
7/15 | $5,683,327 | $5,167,610 | $5,374,388 |
|---|
8/15 | $5,314,825 | $4,855,829 | $5,048,008 |
|---|
9/15 | $5,194,986 | $4,735,678 | $4,923,131 |
|---|
10/15 | $5,629,400 | $5,135,152 | $5,347,041 |
|---|
11/15 | $5,662,355 | $5,150,423 | $5,362,050 |
|---|
12/15 | $5,632,340 | $5,069,192 | $5,283,363 |
|---|
1/16 | $5,280,117 | $4,817,637 | $4,988,406 |
|---|
2/16 | $5,157,323 | $4,811,137 | $4,986,278 |
|---|
3/16 | $5,457,844 | $5,137,516 | $5,322,559 |
|---|
4/16 | $5,499,852 | $5,157,433 | $5,273,956 |
|---|
5/16 | $5,570,943 | $5,250,051 | $5,376,373 |
|---|
6/16 | $5,622,645 | $5,263,654 | $5,355,257 |
|---|
7/16 | $5,897,386 | $5,457,718 | $5,608,036 |
|---|
8/16 | $5,930,241 | $5,465,381 | $5,580,173 |
|---|
9/16 | $5,972,952 | $5,466,414 | $5,600,586 |
|---|
10/16 | $5,864,532 | $5,366,700 | $5,469,067 |
|---|
11/16 | $5,864,532 | $5,565,456 | $5,588,064 |
|---|
12/16 | $5,789,373 | $5,675,463 | $5,657,239 |
|---|
1/17 | $6,057,645 | $5,783,106 | $5,847,880 |
|---|
2/17 | $6,236,493 | $6,012,730 | $6,090,776 |
|---|
3/17 | $6,339,164 | $6,019,744 | $6,161,224 |
|---|
4/17 | $6,597,500 | $6,081,566 | $6,302,132 |
|---|
5/17 | $6,822,716 | $6,167,151 | $6,466,004 |
|---|
6/17 | $6,739,916 | $6,205,643 | $6,448,969 |
|---|
7/17 | $6,929,062 | $6,333,248 | $6,620,378 |
|---|
8/17 | $6,995,656 | $6,352,635 | $6,741,738 |
|---|
9/17 | $6,992,326 | $6,483,678 | $6,829,394 |
|---|
10/17 | $7,308,645 | $6,634,977 | $7,094,014 |
|---|
11/17 | $7,541,723 | $6,838,471 | $7,309,528 |
|---|
12/17 | $7,654,609 | $6,914,505 | $7,366,434 |
|---|
1/18 | $8,260,139 | $7,310,388 | $7,888,170 |
|---|
2/18 | $8,203,148 | $7,040,948 | $7,681,336 |
|---|
3/18 | $8,014,365 | $6,862,015 | $7,470,689 |
|---|
4/18 | $8,110,538 | $6,888,345 | $7,496,789 |
|---|
5/18 | $8,491,665 | $7,054,230 | $7,825,383 |
|---|
6/18 | $8,616,333 | $7,097,648 | $7,900,730 |
|---|
7/18 | $8,617,288 | $7,361,777 | $8,132,667 |
|---|
8/18 | $9,087,782 | $7,601,663 | $8,577,332 |
|---|
9/18 | $9,123,974 | $7,644,931 | $8,625,271 |
|---|
10/18 | $8,367,564 | $7,122,399 | $7,853,939 |
|---|
11/18 | $8,541,167 | $7,267,542 | $7,937,361 |
|---|
12/18 | $7,940,527 | $6,611,349 | $7,254,926 |
|---|
1/19 | $8,764,045 | $7,141,155 | $7,907,044 |
|---|
2/19 | $9,096,475 | $7,370,445 | $8,189,956 |
|---|
3/19 | $9,372,240 | $7,513,666 | $8,423,067 |
|---|
4/19 | $9,836,885 | $7,817,891 | $8,803,620 |
|---|
5/19 | $9,538,454 | $7,321,079 | $8,247,465 |
|---|
6/19 | $10,055,986 | $7,837,041 | $8,813,874 |
|---|
7/19 | $10,191,980 | $7,949,676 | $9,012,899 |
|---|
8/19 | $9,976,657 | $7,823,750 | $8,943,871 |
|---|
9/19 | $9,772,666 | $7,970,136 | $8,944,981 |
|---|
10/19 | $9,621,562 | $8,142,767 | $9,197,155 |
|---|
11/19 | $10,074,874 | $8,438,340 | $9,605,169 |
|---|
12/19 | $10,056,145 | $8,693,027 | $9,894,968 |
|---|
1/20 | $10,633,642 | $8,689,618 | $10,116,172 |
|---|
2/20 | $10,071,545 | $7,974,296 | $9,427,243 |
|---|
3/20 | $9,089,801 | $6,989,368 | $8,499,832 |
|---|
4/20 | $10,706,792 | $7,885,361 | $9,757,562 |
|---|
5/20 | $12,277,583 | $8,260,926 | $10,412,628 |
|---|
6/20 | $13,305,528 | $8,425,212 | $10,866,046 |
|---|
7/20 | $14,483,621 | $8,900,269 | $11,702,070 |
|---|
8/20 | $15,650,165 | $9,540,025 | $12,909,631 |
|---|
9/20 | $15,141,968 | $9,177,536 | $12,302,234 |
|---|
10/20 | $14,837,819 | $8,933,470 | $11,884,427 |
|---|
11/20 | $16,882,158 | $9,911,364 | $13,101,295 |
|---|
12/20 | $17,590,829 | $10,292,437 | $13,703,838 |
|---|
1/21 | $17,250,439 | $10,188,527 | $13,602,446 |
|---|
2/21 | $18,227,032 | $10,469,475 | $13,599,297 |
|---|
3/21 | $17,120,767 | $10,927,992 | $13,832,936 |
|---|
4/21 | $18,004,158 | $11,511,206 | $14,774,110 |
|---|
5/21 | $17,582,724 | $11,591,604 | $14,569,765 |
|---|
6/21 | $19,094,214 | $11,862,208 | $15,483,840 |
|---|
7/21 | $19,069,901 | $12,143,994 | $15,994,130 |
|---|
8/21 | $19,357,611 | $12,513,240 | $16,592,132 |
|---|
9/21 | $18,081,151 | $11,931,252 | $15,662,877 |
|---|
10/21 | $19,005,065 | $12,767,177 | $17,019,525 |
|---|
11/21 | $18,145,987 | $12,678,714 | $17,123,583 |
|---|
12/21 | $16,824,456 | $13,246,924 | $17,485,624 |
|---|
1/22 | $13,747,785 | $12,561,435 | $15,984,919 |
|---|
2/22 | $13,194,283 | $12,185,328 | $15,305,983 |
|---|
3/22 | $12,615,849 | $12,637,763 | $15,904,717 |
|---|
4/22 | $10,162,490 | $11,535,727 | $13,984,036 |
|---|
5/22 | $8,616,675 | $11,556,891 | $13,658,941 |
|---|
6/22 | $7,828,807 | $10,602,942 | $12,576,998 |
|---|
7/22 | $8,900,905 | $11,580,580 | $14,086,503 |
|---|
8/22 | $9,050,500 | $11,108,302 | $13,430,297 |
|---|
9/22 | $8,118,025 | $10,085,243 | $12,124,661 |
|---|
10/22 | $8,521,931 | $10,901,758 | $12,833,328 |
|---|
11/22 | $8,462,093 | $11,510,992 | $13,418,104 |
|---|
12/22 | $7,649,346 | $10,847,792 | $12,390,859 |
|---|
1/23 | $8,855,155 | $11,529,401 | $13,423,605 |
|---|
2/23 | $8,616,505 | $11,248,096 | $13,264,182 |
|---|
3/23 | $9,125,205 | $11,661,061 | $14,170,870 |
|---|
4/23 | $8,660,467 | $11,843,072 | $14,310,682 |
|---|
5/23 | $9,571,103 | $11,894,550 | $14,962,939 |
|---|
6/23 | $10,324,733 | $12,680,485 | $15,986,187 |
|---|
7/23 | $11,009,281 | $13,087,846 | $16,524,758 |
|---|
8/23 | $9,790,912 | $12,879,467 | $16,376,384 |
|---|
9/23 | $9,213,129 | $12,265,401 | $15,485,773 |
|---|
10/23 | $8,553,702 | $12,007,502 | $15,265,294 |
|---|
11/23 | $10,261,931 | $13,104,092 | $16,929,379 |
|---|
12/23 | $11,191,408 | $13,699,419 | $17,679,045 |
|---|
1/24 | $10,971,599 | $13,929,628 | $18,119,989 |
|---|
2/24 | $12,277,892 | $14,673,408 | $19,356,262 |
|---|
3/24 | $12,390,936 | $15,145,519 | $19,697,014 |
|---|
4/24 | $11,210,249 | $14,526,907 | $18,861,550 |
|---|
5/24 | $10,946,478 | $15,247,219 | $19,990,700 |
|---|
6/24 | $11,348,414 | $15,794,322 | $21,338,705 |
|---|
7/24 | $11,455,179 | $15,986,576 | $20,975,724 |
|---|
8/24 | $11,913,637 | $16,374,358 | $21,412,605 |
|---|
9/24 | $12,541,662 | $16,724,067 | $22,019,235 |
|---|
10/24 | $13,081,764 | $16,572,403 | $21,946,368 |
|---|
11/24 | $15,625,266 | $17,545,222 | $23,369,819 |
|---|
12/24 | $15,241,306 | $17,126,975 | $23,576,108 |
|---|
|
|
| Average Annual Return [Table Text Block] |
AATR | 1 Year | 5 Years | 10 Years |
|---|
Class R6 | 36.19% | 8.67% | 11.79% |
|---|
S&P 500® Index | 25.02% | 14.53% | 13.10% |
|---|
Russell 1000® Growth Index | 33.36% | 18.96% | 16.78% |
|---|
|
|
| AssetsNet |
$ 194,996,435
|
|
| Holdings Count | Holding |
28
|
|
| Advisory Fees Paid, Amount |
$ 877,326
|
|
| InvestmentCompanyPortfolioTurnover |
57.00%
|
|
| Additional Fund Statistics [Text Block] |
Total Net Assets | $194,996,435 |
|---|
# of Portfolio Holdings | 28 |
|---|
Portfolio Turnover Rate | 57% |
|---|
Total Advisory Fees Paid | $877,326 |
|---|
|
|
| Holdings [Text Block] |
Sector Allocation (% of total investments)Value | Value |
|---|
Real Estate | 1.6% | Short-Term Investments | 2.3% | Industrials | 2.6% | Investment Company | 3.0% | Health Care | 5.8% | Financals | 8.0% | Communication Services | 10.7% | Information Technology | 31.6% | Consumer Discretionary | 34.4% |
Top Ten Holdings (% of total investments)Footnote ReferenceaTesla, Inc. | 9.5% | Cloudflare, Inc. | 9.4% | DoorDash, Inc. | 6.4% | Shopify, Inc. | 6.3% | ROBLOX Corp. | 5.4% | Trade Desk, Inc. | 5.3% | MercadoLibre, Inc. | 4.9% | Amazon.com, Inc. | 4.9% | Snowflake, Inc. | 4.9% | Crowdstrike Holdings, Inc. | 3.7% | Total | 60.7% |
| Footnote | Description | Footnotea | Excluding cash equivalents. |
|
|
| Material Fund Change [Text Block] |
|
|
| Updated Prospectus Web Address |
<span style="box-sizing: border-box; color: rgb(0, 0, 0); display: inline; flex-wrap: nowrap; font-size: 10.6667px; font-weight: 400; grid-area: auto; line-height: 16px; margin: 0px; overflow: visible; text-align: left;">www.morganstanley.com/im/shareholderreports</span>
|
|
| C000236926 |
|
|
| Shareholder Report [Line Items] |
|
|
| Fund Name |
Morgan Stanley Institutional Fund, Inc. - American Resilience Portfolio
|
|
| Class Name |
Class A
|
|
| Trading Symbol |
MSCUX
|
|
| Annual or Semi-Annual Statement [Text Block] |
This annual shareholder report contains important information about Morgan Stanley Institutional Fund, Inc. - American Resilience Portfolio for the period of January 1, 2024 to December 31, 2024.
|
|
| Shareholder Report Annual or Semi-Annual |
Annual Shareholder Report
|
|
| Additional Information [Text Block] |
You can find additional information about the Fund at www.morganstanley.com/im/shareholderreports. You can also request this information by contacting us at 1-800-869-6397.
|
|
| Additional Information Phone Number |
1-800-869-6397
|
|
| Additional Information Website |
<span style="box-sizing: border-box; color: rgb(0, 0, 0); display: inline; flex-wrap: nowrap; font-size: 10.6667px; font-weight: 400; grid-area: auto; line-height: 16px; margin: 0px; overflow: visible; text-align: left;">www.morganstanley.com/im/shareholderreports</span>
|
|
| Expenses [Text Block] |
What were the Fund costs for the last year?(based on a hypothetical $10,000 investment) Class Name | Costs of a $10,000 investment | Costs paid as a percentage of a $10,000 investment |
|---|
Class A | $110 | 1.05% |
|---|
|
|
| Expenses Paid, Amount |
$ 110
|
|
| Expense Ratio, Percent |
1.05%
|
|
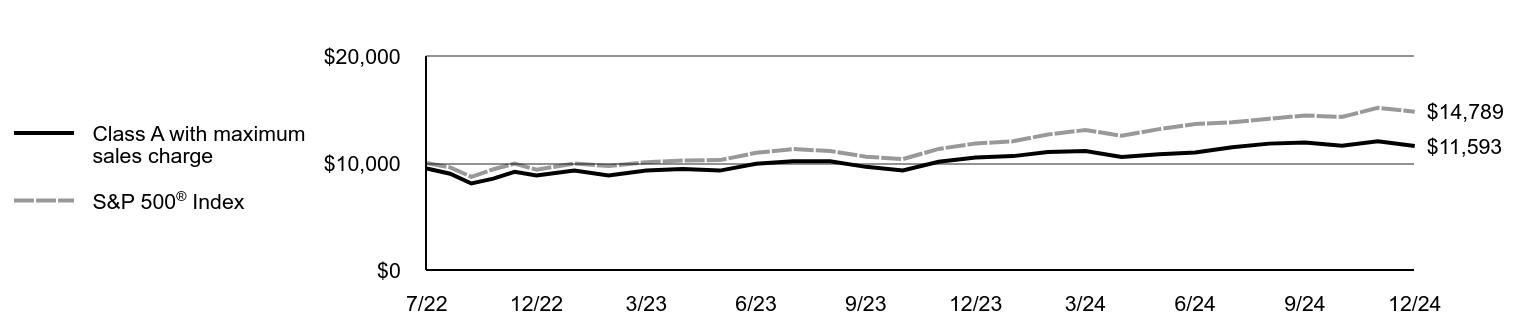
| Factors Affecting Performance [Text Block] |
How did the Fund perform last year and what affected its performance?Key contributors to (↑) and detractors from (↓) performance, relative to the S&P 500® Index: ↓ Stock selection in information technology (IT), financials and health care was the primary detractor ↓ The portfolio’s tilt toward software and IT services significantly lagged semiconductors and hardware. The relative performance impact of the “Magnificent Seven” was notable: the Portfolio owned Microsoft and Alphabet, but the Fund’s high quality bar and strict valuation discipline precluded it from owning the other five, which detracted significantly. ↓ Stock selection in financials lagged due to the strength of banks’ performance in the Index ↓ Consumer staples weakness was primarily down to Constellation Brands, which suffered due to Mexican tariff fears ↑ Financials sector overweight, consumer discretionary sector underweight ↑ Not owning low quality, cyclical sectors, specifically materials, energy and real estate |
|
| Line Graph [Table Text Block] |
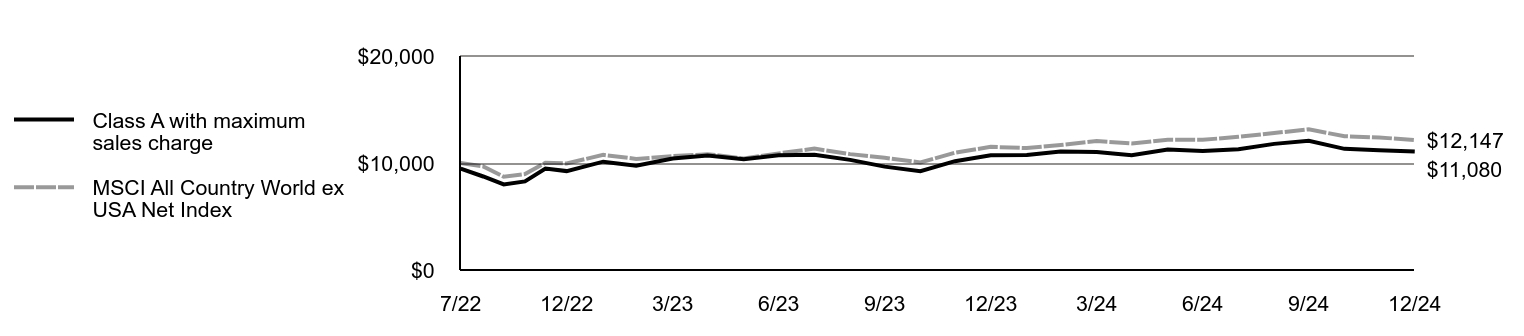
| Class A with maximum sales charge | S&P 500® Index |
|---|
7/22 | $9,479 | $10,000 |
|---|
8/22 | $8,995 | $9,592 |
|---|
9/22 | $8,085 | $8,709 |
|---|
10/22 | $8,540 | $9,414 |
|---|
11/22 | $9,175 | $9,940 |
|---|
12/22 | $8,825 | $9,367 |
|---|
1/23 | $9,289 | $9,956 |
|---|
2/23 | $8,844 | $9,713 |
|---|
3/23 | $9,308 | $10,069 |
|---|
4/23 | $9,431 | $10,227 |
|---|
5/23 | $9,289 | $10,271 |
|---|
6/23 | $9,924 | $10,950 |
|---|
7/23 | $10,161 | $11,302 |
|---|
8/23 | $10,152 | $11,122 |
|---|
9/23 | $9,640 | $10,591 |
|---|
10/23 | $9,308 | $10,369 |
|---|
11/23 | $10,114 | $11,316 |
|---|
12/23 | $10,519 | $11,830 |
|---|
1/24 | $10,643 | $12,028 |
|---|
2/24 | $11,035 | $12,671 |
|---|
3/24 | $11,112 | $13,078 |
|---|
4/24 | $10,557 | $12,544 |
|---|
5/24 | $10,825 | $13,166 |
|---|
6/24 | $10,988 | $13,639 |
|---|
7/24 | $11,476 | $13,805 |
|---|
8/24 | $11,811 | $14,139 |
|---|
9/24 | $11,926 | $14,441 |
|---|
10/24 | $11,610 | $14,311 |
|---|
11/24 | $12,040 | $15,151 |
|---|
12/24 | $11,593 | $14,789 |
|---|
|
|
| Average Annual Return [Table Text Block] |
AATR | 1 Year | Since 7/29/22
(Inception) |
|---|
Class A | 10.21% | 8.66% |
|---|
Class A, with 5.25% maximum front end sales charge | 4.41% | 6.28% |
|---|
S&P 500® Index | 25.02% | 17.52% |
|---|
|
|
| Performance Inception Date |
Jul. 29, 2022
|
|
| AssetsNet |
$ 1,369,354
|
|
| Holdings Count | Holding |
36
|
|
| Advisory Fees Paid, Amount |
$ 0
|
|
| InvestmentCompanyPortfolioTurnover |
43.00%
|
|
| Additional Fund Statistics [Text Block] |
Total Net Assets | $1,369,354 |
|---|
# of Portfolio Holdings | 36 |
|---|
Portfolio Turnover Rate | 43% |
|---|
Total Advisory Fees Paid (Net of Waivers) | $0 |
|---|
|
|
| Holdings [Text Block] |
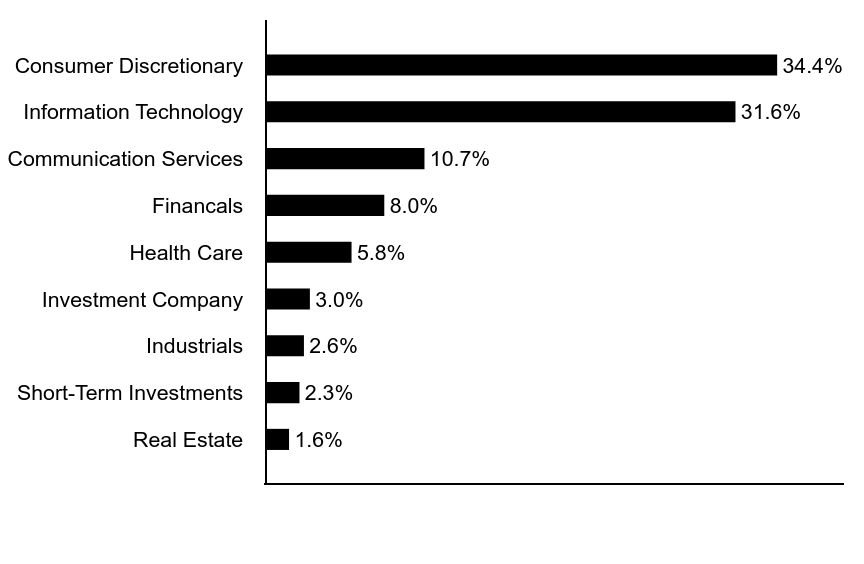
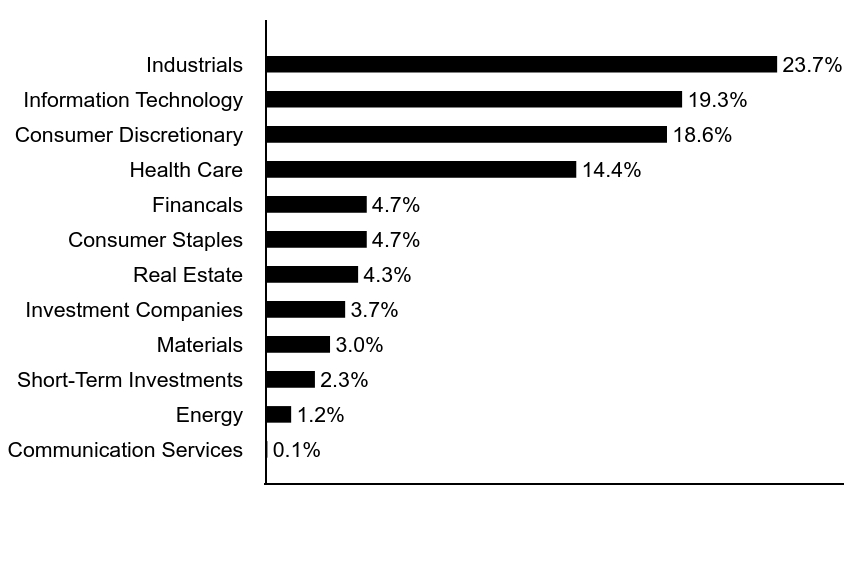
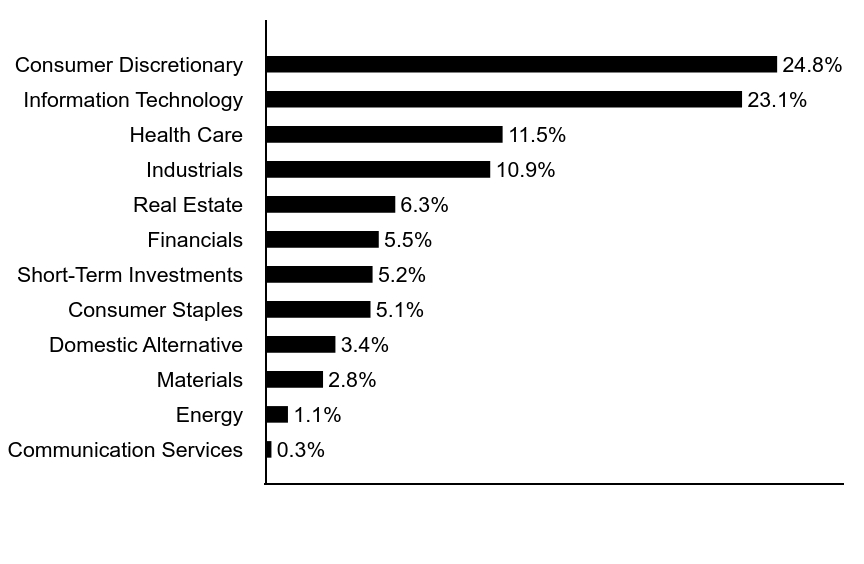
Sector Allocation (% of total investments)Value | Value |
|---|
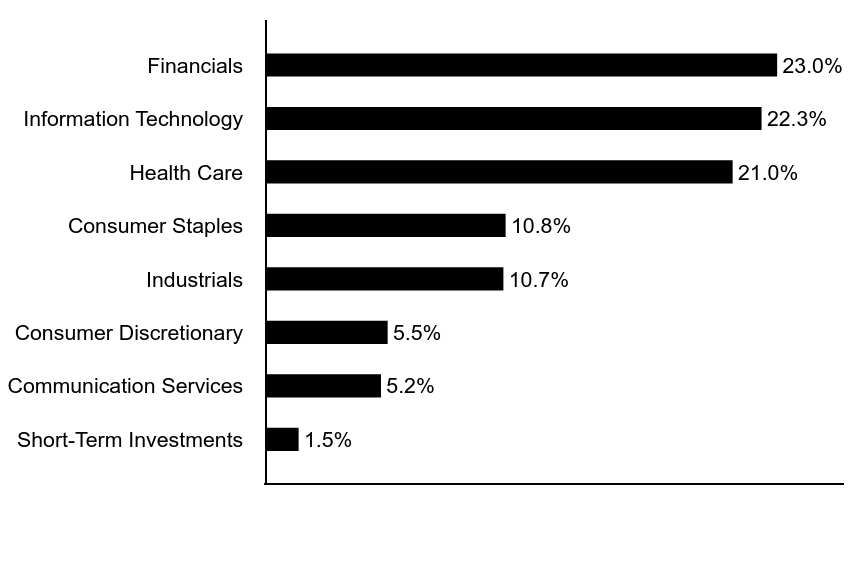
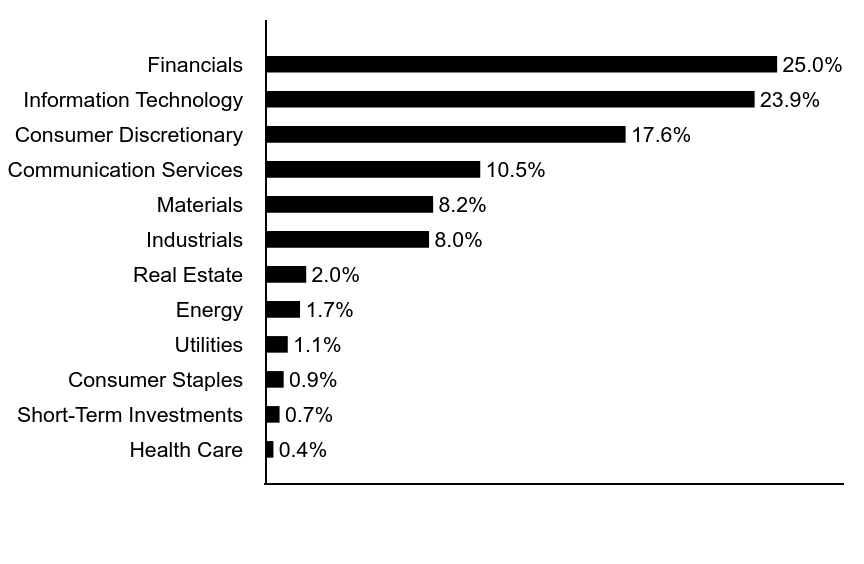
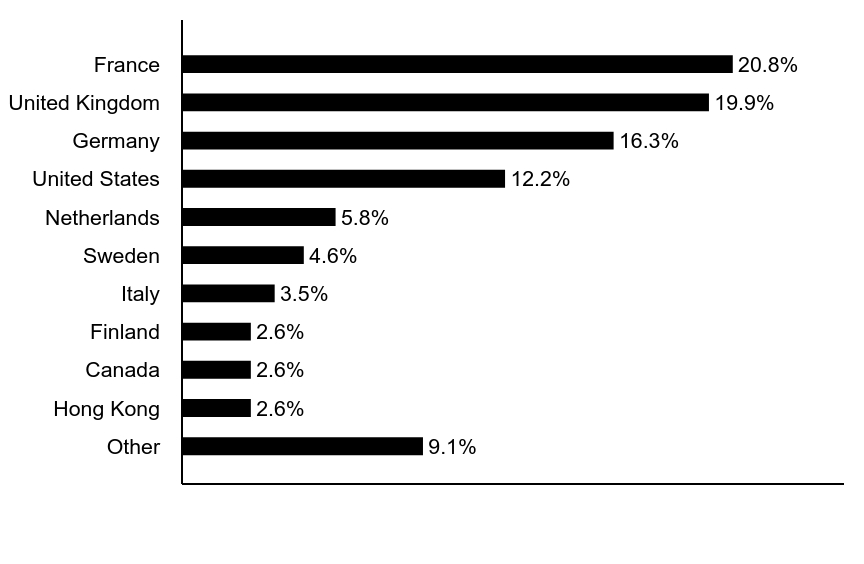
Short-Term Investments | 1.5% | Communication Services | 5.2% | Consumer Discretionary | 5.5% | Industrials | 10.7% | Consumer Staples | 10.8% | Health Care | 21.0% | Information Technology | 22.3% | Financials | 23.0% |
Top Ten Holdings (% of total investments)Footnote ReferenceaMicrosoft Corp. | 7.2% | Visa, Inc. | 6.5% | Alphabet, Inc. | 5.2% | Accenture PLC | 4.6% | Aon PLC | 4.1% | Texas Instruments, Inc. | 3.9% | Procter & Gamble Co. | 3.9% | Intercontinental Exchange, Inc. | 3.5% | Thermo Fisher Scientific, Inc. | 3.3% | Automatic Data Processing, Inc. | 3.2% | Total | 45.4% |
| Footnote | Description | Footnotea | Excluding cash equivalents. |
|
|
| Material Fund Change [Text Block] |
|
|
| Updated Prospectus Web Address |
<span style="box-sizing: border-box; color: rgb(0, 0, 0); display: inline; flex-wrap: nowrap; font-size: 10.6667px; font-weight: 400; grid-area: auto; line-height: 16px; margin: 0px; overflow: visible; text-align: left;">www.morganstanley.com/im/shareholderreports</span>
|
|
| C000236923 |
|
|
| Shareholder Report [Line Items] |
|
|
| Fund Name |
Morgan Stanley Institutional Fund, Inc. - American Resilience Portfolio
|
|
| Class Name |
Class C
|
|
| Trading Symbol |
MSBWX
|
|
| Annual or Semi-Annual Statement [Text Block] |
This annual shareholder report contains important information about Morgan Stanley Institutional Fund, Inc. - American Resilience Portfolio for the period of January 1, 2024 to December 31, 2024.
|
|
| Shareholder Report Annual or Semi-Annual |
Annual Shareholder Report
|
|
| Additional Information [Text Block] |
You can find additional information about the Fund at www.morganstanley.com/im/shareholderreports. You can also request this information by contacting us at 1-800-869-6397.
|
|
| Additional Information Phone Number |
1-800-869-6397
|
|
| Additional Information Website |
<span style="box-sizing: border-box; color: rgb(0, 0, 0); display: inline; flex-wrap: nowrap; font-size: 10.6667px; font-weight: 400; grid-area: auto; line-height: 16px; margin: 0px; overflow: visible; text-align: left;">www.morganstanley.com/im/shareholderreports</span>
|
|
| Expenses [Text Block] |
What were the Fund costs for the last year?(based on a hypothetical $10,000 investment) Class Name | Costs of a $10,000 investment | Costs paid as a percentage of a $10,000 investment |
|---|
Class C | $188 | 1.80% |
|---|
|
|
| Expenses Paid, Amount |
$ 188
|
|
| Expense Ratio, Percent |
1.80%
|
|
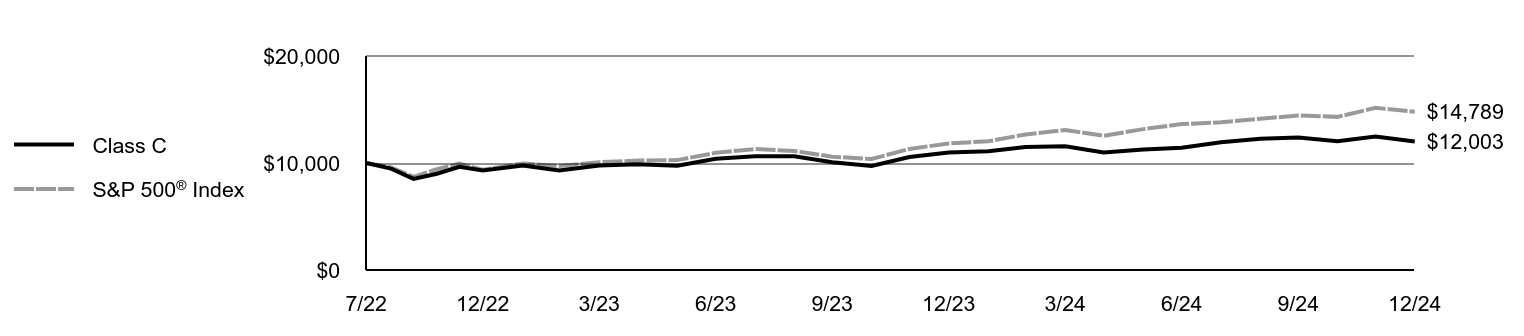
| Factors Affecting Performance [Text Block] |
How did the Fund perform last year and what affected its performance?Key contributors to (↑) and detractors from (↓) performance, relative to the S&P 500® Index: ↓ Stock selection in information technology (IT), financials and health care was the primary detractor ↓ The portfolio’s tilt toward software and IT services significantly lagged semiconductors and hardware. The relative performance impact of the “Magnificent Seven” was notable: the Portfolio owned Microsoft and Alphabet, but the Fund’s high quality bar and strict valuation discipline precluded it from owning the other five, which detracted significantly. ↓ Stock selection in financials lagged due to the strength of banks’ performance in the Index ↓ Consumer staples weakness was primarily down to Constellation Brands, which suffered due to Mexican tariff fears ↑ Financials sector overweight, consumer discretionary sector underweight ↑ Not owning low quality, cyclical sectors, specifically materials, energy and real estate |
|
| Line Graph [Table Text Block] |
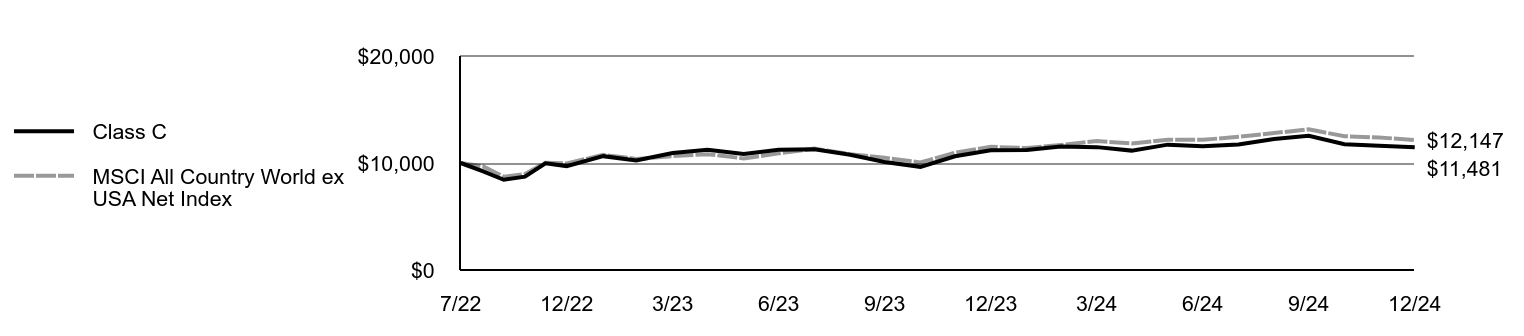
| Class C | S&P 500® Index |
|---|
7/22 | $10,000 | $10,000 |
|---|
8/22 | $9,480 | $9,592 |
|---|
9/22 | $8,520 | $8,709 |
|---|
10/22 | $9,000 | $9,414 |
|---|
11/22 | $9,650 | $9,940 |
|---|
12/22 | $9,290 | $9,367 |
|---|
1/23 | $9,760 | $9,956 |
|---|
2/23 | $9,290 | $9,713 |
|---|
3/23 | $9,770 | $10,069 |
|---|
4/23 | $9,890 | $10,227 |
|---|
5/23 | $9,740 | $10,271 |
|---|
6/23 | $10,400 | $10,950 |
|---|
7/23 | $10,640 | $11,302 |
|---|
8/23 | $10,630 | $11,122 |
|---|
9/23 | $10,080 | $10,591 |
|---|
10/23 | $9,730 | $10,369 |
|---|
11/23 | $10,560 | $11,316 |
|---|
12/23 | $10,981 | $11,830 |
|---|
1/24 | $11,102 | $12,028 |
|---|
2/24 | $11,503 | $12,671 |
|---|
3/24 | $11,573 | $13,078 |
|---|
4/24 | $10,991 | $12,544 |
|---|
5/24 | $11,262 | $13,166 |
|---|
6/24 | $11,423 | $13,639 |
|---|
7/24 | $11,934 | $13,805 |
|---|
8/24 | $12,265 | $14,139 |
|---|
9/24 | $12,385 | $14,441 |
|---|
10/24 | $12,044 | $14,311 |
|---|
11/24 | $12,486 | $15,151 |
|---|
12/24 | $12,003 | $14,789 |
|---|
|
|
| Average Annual Return [Table Text Block] |
AATR | 1 Year | Since 7/29/22
(Inception) |
|---|
Class C | 9.31% | 7.82% |
|---|
Class C, with 1% maximum contingent deferred sales charge | 8.31% | 7.82% |
|---|
S&P 500® Index | 25.02% | 17.52% |
|---|
|
|
| Performance Inception Date |
Jul. 29, 2022
|
|
| AssetsNet |
$ 1,369,354
|
|
| Holdings Count | Holding |
36
|
|
| Advisory Fees Paid, Amount |
$ 0
|
|
| InvestmentCompanyPortfolioTurnover |
43.00%
|
|
| Additional Fund Statistics [Text Block] |
Total Net Assets | $1,369,354 |
|---|
# of Portfolio Holdings | 36 |
|---|
Portfolio Turnover Rate | 43% |
|---|
Total Advisory Fees Paid (Net of Waivers) | $0 |
|---|
|
|
| Holdings [Text Block] |
Sector Allocation (% of total investments)Value | Value |
|---|
Short-Term Investments | 1.5% | Communication Services | 5.2% | Consumer Discretionary | 5.5% | Industrials | 10.7% | Consumer Staples | 10.8% | Health Care | 21.0% | Information Technology | 22.3% | Financials | 23.0% |
Top Ten Holdings (% of total investments)Footnote ReferenceaMicrosoft Corp. | 7.2% | Visa, Inc. | 6.5% | Alphabet, Inc. | 5.2% | Accenture PLC | 4.6% | Aon PLC | 4.1% | Texas Instruments, Inc. | 3.9% | Procter & Gamble Co. | 3.9% | Intercontinental Exchange, Inc. | 3.5% | Thermo Fisher Scientific, Inc. | 3.3% | Automatic Data Processing, Inc. | 3.2% | Total | 45.4% |
| Footnote | Description | Footnotea | Excluding cash equivalents. |
|
|
| Material Fund Change [Text Block] |
|
|
| Updated Prospectus Web Address |
<span style="box-sizing: border-box; color: rgb(0, 0, 0); display: inline; flex-wrap: nowrap; font-size: 10.6667px; font-weight: 400; grid-area: auto; line-height: 16px; margin: 0px; overflow: visible; text-align: left;">www.morganstanley.com/im/shareholderreports</span>
|
|
| C000236924 |
|
|
| Shareholder Report [Line Items] |
|
|
| Fund Name |
Morgan Stanley Institutional Fund, Inc. - American Resilience Portfolio
|
|
| Class Name |
Class I
|
|
| Trading Symbol |
MSBVX
|
|
| Annual or Semi-Annual Statement [Text Block] |
This annual shareholder report contains important information about Morgan Stanley Institutional Fund, Inc. - American Resilience Portfolio for the period of January 1, 2024 to December 31, 2024.
|
|
| Shareholder Report Annual or Semi-Annual |
Annual Shareholder Report
|
|
| Additional Information [Text Block] |
You can find additional information about the Fund at www.morganstanley.com/im/shareholderreports. You can also request this information by contacting us at 1-800-869-6397.
|
|
| Additional Information Phone Number |
1-800-869-6397
|
|
| Additional Information Website |
<span style="box-sizing: border-box; color: rgb(0, 0, 0); display: inline; flex-wrap: nowrap; font-size: 10.6667px; font-weight: 400; grid-area: auto; line-height: 16px; margin: 0px; overflow: visible; text-align: left;">www.morganstanley.com/im/shareholderreports</span>
|
|
| Expenses [Text Block] |
What were the Fund costs for the last year?(based on a hypothetical $10,000 investment) Class Name | Costs of a $10,000 investment | Costs paid as a percentage of a $10,000 investment |
|---|
Class I | $74 | 0.70% |
|---|
|
|
| Expenses Paid, Amount |
$ 74
|
|
| Expense Ratio, Percent |
0.70%
|
|
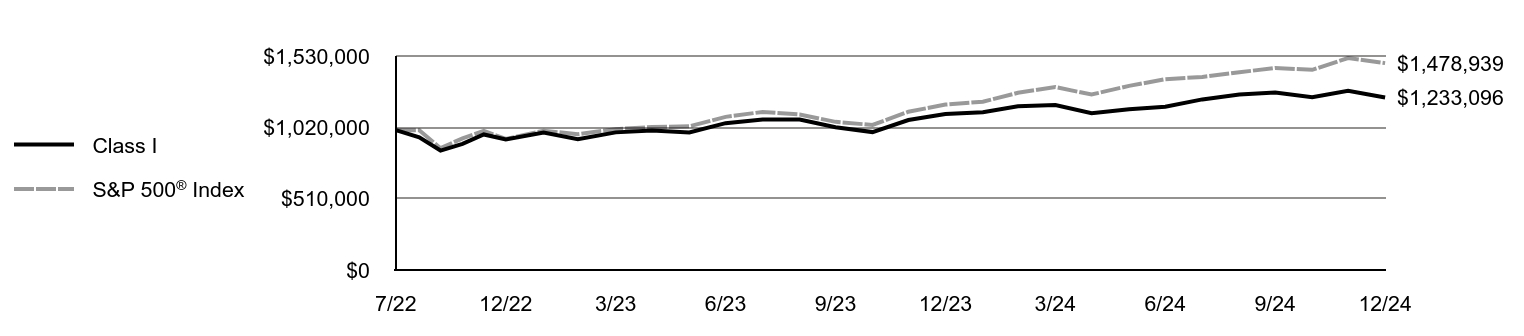
| Factors Affecting Performance [Text Block] |
How did the Fund perform last year and what affected its performance?Key contributors to (↑) and detractors from (↓) performance, relative to the S&P 500® Index: ↓ Stock selection in information technology (IT), financials and health care was the primary detractor ↓ The portfolio’s tilt toward software and IT services significantly lagged semiconductors and hardware. The relative performance impact of the “Magnificent Seven” was notable: the Portfolio owned Microsoft and Alphabet, but the Fund’s high quality bar and strict valuation discipline precluded it from owning the other five, which detracted significantly. ↓ Stock selection in financials lagged due to the strength of banks’ performance in the Index ↓ Consumer staples weakness was primarily down to Constellation Brands, which suffered due to Mexican tariff fears ↑ Financials sector overweight, consumer discretionary sector underweight ↑ Not owning low quality, cyclical sectors, specifically materials, energy and real estate |
|
| Line Graph [Table Text Block] |
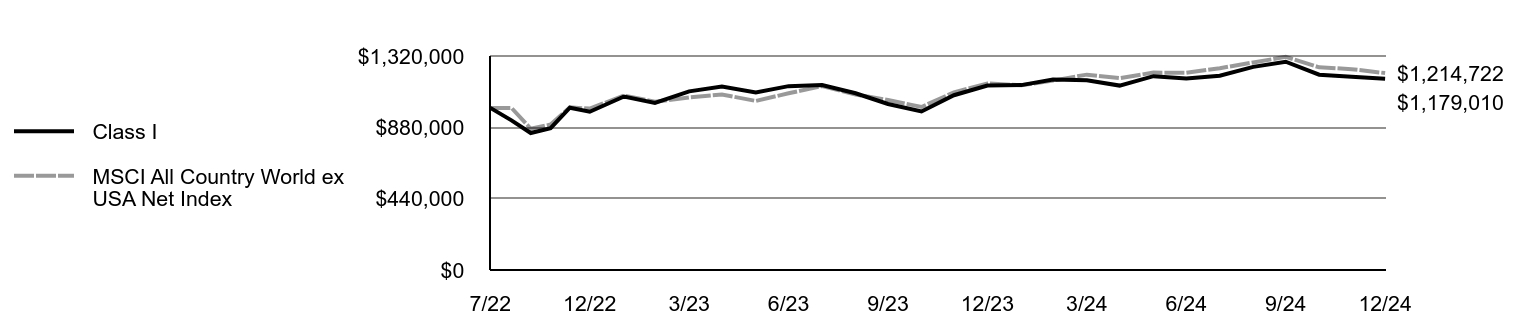
| Class I | S&P 500® Index |
|---|
7/22 | $1,000,000 | $1,000,000 |
|---|
8/22 | $949,000 | $1,000,000 |
|---|
9/22 | $854,000 | $870,875 |
|---|
10/22 | $902,000 | $941,383 |
|---|
11/22 | $969,000 | $993,991 |
|---|
12/22 | $933,000 | $936,723 |
|---|
1/23 | $982,000 | $995,581 |
|---|
2/23 | $935,000 | $971,289 |
|---|
3/23 | $984,000 | $1,006,950 |
|---|
4/23 | $997,000 | $1,022,667 |
|---|
5/23 | $983,000 | $1,027,112 |
|---|
6/23 | $1,050,000 | $1,094,978 |
|---|
7/23 | $1,076,000 | $1,130,155 |
|---|
8/23 | $1,076,000 | $1,112,161 |
|---|
9/23 | $1,021,000 | $1,059,135 |
|---|
10/23 | $986,000 | $1,036,865 |
|---|
11/23 | $1,072,000 | $1,131,557 |
|---|
12/23 | $1,115,319 | $1,182,965 |
|---|
1/24 | $1,128,488 | $1,202,844 |
|---|
2/24 | $1,170,021 | $1,267,070 |
|---|
3/24 | $1,179,138 | $1,307,838 |
|---|
4/24 | $1,120,384 | $1,254,420 |
|---|
5/24 | $1,149,761 | $1,316,620 |
|---|
6/24 | $1,166,982 | $1,363,863 |
|---|
7/24 | $1,219,658 | $1,380,464 |
|---|
8/24 | $1,255,114 | $1,413,950 |
|---|
9/24 | $1,268,283 | $1,444,148 |
|---|
10/24 | $1,234,854 | $1,431,051 |
|---|
11/24 | $1,281,452 | $1,515,056 |
|---|
12/24 | $1,233,096 | $1,478,939 |
|---|
|
|
| Average Annual Return [Table Text Block] |
AATR | 1 Year | Since 7/29/22
(Inception) |
|---|
Class I | 10.56% | 9.03% |
|---|
S&P 500® Index | 25.02% | 17.52% |
|---|
|
|
| Performance Inception Date |
Jul. 29, 2022
|
|
| AssetsNet |
$ 1,369,354
|
|
| Holdings Count | Holding |
36
|
|
| Advisory Fees Paid, Amount |
$ 0
|
|
| InvestmentCompanyPortfolioTurnover |
43.00%
|
|
| Additional Fund Statistics [Text Block] |
Total Net Assets | $1,369,354 |
|---|
# of Portfolio Holdings | 36 |
|---|
Portfolio Turnover Rate | 43% |
|---|
Total Advisory Fees Paid (Net of Waivers) | $0 |
|---|
|
|
| Holdings [Text Block] |
Sector Allocation (% of total investments)Value | Value |
|---|
Short-Term Investments | 1.5% | Communication Services | 5.2% | Consumer Discretionary | 5.5% | Industrials | 10.7% | Consumer Staples | 10.8% | Health Care | 21.0% | Information Technology | 22.3% | Financials | 23.0% |
Top Ten Holdings (% of total investments)Footnote ReferenceaMicrosoft Corp. | 7.2% | Visa, Inc. | 6.5% | Alphabet, Inc. | 5.2% | Accenture PLC | 4.6% | Aon PLC | 4.1% | Texas Instruments, Inc. | 3.9% | Procter & Gamble Co. | 3.9% | Intercontinental Exchange, Inc. | 3.5% | Thermo Fisher Scientific, Inc. | 3.3% | Automatic Data Processing, Inc. | 3.2% | Total | 45.4% |
| Footnote | Description | Footnotea | Excluding cash equivalents. |
|
|
| Material Fund Change [Text Block] |
|
|
| Updated Prospectus Web Address |
<span style="box-sizing: border-box; color: rgb(0, 0, 0); display: inline; flex-wrap: nowrap; font-size: 10.6667px; font-weight: 400; grid-area: auto; line-height: 16px; margin: 0px; overflow: visible; text-align: left;">www.morganstanley.com/im/shareholderreports</span>
|
|
| C000236925 |
|
|
| Shareholder Report [Line Items] |
|
|
| Fund Name |
Morgan Stanley Institutional Fund, Inc. - American Resilience Portfolio
|
|
| Class Name |
Class R6
|
|
| Trading Symbol |
MSBQX
|
|
| Annual or Semi-Annual Statement [Text Block] |
This annual shareholder report contains important information about Morgan Stanley Institutional Fund, Inc. - American Resilience Portfolio for the period of January 1, 2024 to December 31, 2024.
|
|
| Shareholder Report Annual or Semi-Annual |
Annual Shareholder Report
|
|
| Additional Information [Text Block] |
You can find additional information about the Fund at www.morganstanley.com/im/shareholderreports. You can also request this information by contacting us at 1-800-869-6397.
|
|
| Additional Information Phone Number |
1-800-869-6397
|
|
| Additional Information Website |
<span style="box-sizing: border-box; color: rgb(0, 0, 0); display: inline; flex-wrap: nowrap; font-size: 10.6667px; font-weight: 400; grid-area: auto; line-height: 16px; margin: 0px; overflow: visible; text-align: left;">www.morganstanley.com/im/shareholderreports</span>
|
|
| Expenses [Text Block] |
What were the Fund costs for the last year?(based on a hypothetical $10,000 investment) Class Name | Costs of a $10,000 investment | Costs paid as a percentage of a $10,000 investment |
|---|
Class R6 | $68 | 0.65% |
|---|
|
|
| Expenses Paid, Amount |
$ 68
|
|
| Expense Ratio, Percent |
0.65%
|
|
| Factors Affecting Performance [Text Block] |
How did the Fund perform last year and what affected its performance?Key contributors to (↑) and detractors from (↓) performance, relative to the S&P 500® Index: ↓ Stock selection in information technology (IT), financials and health care was the primary detractor ↓ The portfolio’s tilt toward software and IT services significantly lagged semiconductors and hardware. The relative performance impact of the “Magnificent Seven” was notable: the Portfolio owned Microsoft and Alphabet, but the Fund’s high quality bar and strict valuation discipline precluded it from owning the other five, which detracted significantly. ↓ Stock selection in financials lagged due to the strength of banks’ performance in the Index ↓ Consumer staples weakness was primarily down to Constellation Brands, which suffered due to Mexican tariff fears ↑ Financials sector overweight, consumer discretionary sector underweight ↑ Not owning low quality, cyclical sectors, specifically materials, energy and real estate |
|
| Line Graph [Table Text Block] |
| Class R6 | S&P 500® Index |
|---|
7/22 | $5,000,000 | $5,000,000 |
|---|
8/22 | $4,745,000 | $5,000,000 |
|---|
9/22 | $4,270,000 | $4,354,377 |
|---|
10/22 | $4,510,000 | $4,706,914 |
|---|
11/22 | $4,845,000 | $4,969,955 |
|---|
12/22 | $4,665,000 | $4,683,613 |
|---|
1/23 | $4,910,000 | $4,977,903 |
|---|
2/23 | $4,675,000 | $4,856,447 |
|---|
3/23 | $4,920,000 | $5,034,748 |
|---|
4/23 | $4,990,000 | $5,113,333 |
|---|
5/23 | $4,915,000 | $5,135,559 |
|---|
6/23 | $5,255,000 | $5,474,892 |
|---|
7/23 | $5,385,000 | $5,650,773 |
|---|
8/23 | $5,380,000 | $5,560,804 |
|---|
9/23 | $5,105,000 | $5,295,676 |
|---|
10/23 | $4,935,000 | $5,184,327 |
|---|
11/23 | $5,365,000 | $5,657,787 |
|---|
12/23 | $5,579,184 | $5,914,824 |
|---|
1/24 | $5,645,060 | $6,014,218 |
|---|
2/24 | $5,857,890 | $6,335,351 |
|---|
3/24 | $5,898,429 | $6,539,189 |
|---|
4/24 | $5,609,588 | $6,272,098 |
|---|
5/24 | $5,751,475 | $6,583,098 |
|---|
6/24 | $5,837,620 | $6,819,314 |
|---|
7/24 | $6,106,191 | $6,902,321 |
|---|
8/24 | $6,283,550 | $7,069,749 |
|---|
9/24 | $6,349,426 | $7,220,738 |
|---|
10/24 | $6,182,202 | $7,155,256 |
|---|
11/24 | $6,410,234 | $7,575,278 |
|---|
12/24 | $6,171,110 | $7,394,697 |
|---|
|
|
| Average Annual Return [Table Text Block] |
AATR | 1 Year | Since 7/29/22
(Inception) |
|---|
Class R6 | 10.61% | 9.07% |
|---|
S&P 500® Index | 25.02% | 17.52% |
|---|
|
|
| Performance Inception Date |
Jul. 29, 2022
|
|
| AssetsNet |
$ 1,369,354
|
|
| Holdings Count | Holding |
36
|
|
| Advisory Fees Paid, Amount |
$ 0
|
|
| InvestmentCompanyPortfolioTurnover |
43.00%
|
|
| Additional Fund Statistics [Text Block] |
Total Net Assets | $1,369,354 |
|---|
# of Portfolio Holdings | 36 |
|---|
Portfolio Turnover Rate | 43% |
|---|
Total Advisory Fees Paid (Net of Waivers) | $0 |
|---|
|
|
| Holdings [Text Block] |
Sector Allocation (% of total investments)Value | Value |
|---|
Short-Term Investments | 1.5% | Communication Services | 5.2% | Consumer Discretionary | 5.5% | Industrials | 10.7% | Consumer Staples | 10.8% | Health Care | 21.0% | Information Technology | 22.3% | Financials | 23.0% |
Top Ten Holdings (% of total investments)Footnote ReferenceaMicrosoft Corp. | 7.2% | Visa, Inc. | 6.5% | Alphabet, Inc. | 5.2% | Accenture PLC | 4.6% | Aon PLC | 4.1% | Texas Instruments, Inc. | 3.9% | Procter & Gamble Co. | 3.9% | Intercontinental Exchange, Inc. | 3.5% | Thermo Fisher Scientific, Inc. | 3.3% | Automatic Data Processing, Inc. | 3.2% | Total | 45.4% |
| Footnote | Description | Footnotea | Excluding cash equivalents. |
|
|
| Material Fund Change [Text Block] |
|
|
| Updated Prospectus Web Address |
<span style="box-sizing: border-box; color: rgb(0, 0, 0); display: inline; flex-wrap: nowrap; font-size: 10.6667px; font-weight: 400; grid-area: auto; line-height: 16px; margin: 0px; overflow: visible; text-align: left;">www.morganstanley.com/im/shareholderreports</span>
|
|
| C000163121 |
|
|
| Shareholder Report [Line Items] |
|
|
| Fund Name |
Morgan Stanley Institutional Fund, Inc. - Asia Opportunity Portfolio
|
|
| Class Name |
Class A
|
|
| Trading Symbol |
MSAUX
|
|
| Annual or Semi-Annual Statement [Text Block] |
This annual shareholder report contains important information about Morgan Stanley Institutional Fund, Inc. - Asia Opportunity Portfolio for the period of January 1, 2024 to December 31, 2024.
|
|
| Shareholder Report Annual or Semi-Annual |
Annual Shareholder Report
|
|
| Additional Information [Text Block] |
You can find additional information about the Fund at www.morganstanley.com/im/shareholderreports. You can also request this information by contacting us at 1-800-869-6397.
|
|
| Additional Information Phone Number |
1-800-869-6397
|
|
| Additional Information Website |
<span style="box-sizing: border-box; color: rgb(0, 0, 0); display: inline; flex-wrap: nowrap; font-size: 10.6667px; font-weight: 400; grid-area: auto; line-height: 16px; margin: 0px; overflow: visible; text-align: left;">www.morganstanley.com/im/shareholderreports</span>
|
|
| Expenses [Text Block] |
What were the Fund costs for the last year?(based on a hypothetical $10,000 investment) Class Name | Costs of a $10,000 investment | Costs paid as a percentage of a $10,000 investment |
|---|
Class A | $154 | 1.40% |
|---|
|
|
| Expenses Paid, Amount |
$ 154
|
|
| Expense Ratio, Percent |
1.40%
|
|
| Factors Affecting Performance [Text Block] |
How did the Fund perform last year and what affected its performance?Key contributors to (↑) and detractors from (↓) performance, relative to the MSCI All Country Asia ex Japan Net Index: ↑ Stock selection in consumer discretionary, led by a Chinese online travel agency, which was the largest positive contributor in the portfolio ↑ Stock selection in industrials, led by a holding in an operator of a Southeast Asian super app (an integrated app platform combining multiple services) ↑ No exposure to materials ↓ Stock selection in communication services, where a holding in a Korean search engine was the main detractor ↓ An underweight allocation to information technology, where exposure to a power management integrated circuit fabless integrated design manufacturer was the main detractor ↓ Stock selection in financials, where a Korean digital bank was the largest detractor in the portfolio |
|
| Line Graph [Table Text Block] |
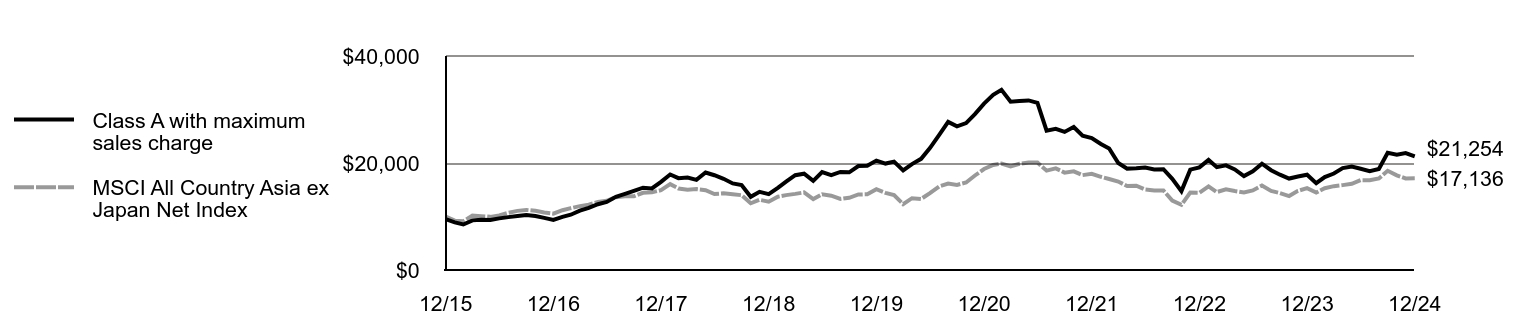 | Class A with maximum sales charge | MSCI All Country Asia ex Japan Net Index |
|---|
12/15 | $9,507 | $9,982 |
|---|
1/16 | $8,910 | $9,219 |
|---|
2/16 | $8,512 | $9,134 |
|---|
3/16 | $9,280 | $10,159 |
|---|
4/16 | $9,384 | $10,068 |
|---|
5/16 | $9,365 | $9,934 |
|---|
6/16 | $9,649 | $10,199 |
|---|
7/16 | $9,881 | $10,694 |
|---|
8/16 | $10,099 | $11,054 |
|---|
9/16 | $10,280 | $11,234 |
|---|
10/16 | $10,099 | $11,064 |
|---|
11/16 | $9,739 | $10,745 |
|---|
12/16 | $9,348 | $10,525 |
|---|
1/17 | $9,928 | $11,177 |
|---|
2/17 | $10,334 | $11,556 |
|---|
3/17 | $11,088 | $11,934 |
|---|
4/17 | $11,601 | $12,193 |
|---|
5/17 | $12,297 | $12,723 |
|---|
6/17 | $12,712 | $12,926 |
|---|
7/17 | $13,669 | $13,617 |
|---|
8/17 | $14,220 | $13,798 |
|---|
9/17 | $14,771 | $13,782 |
|---|
10/17 | $15,380 | $14,432 |
|---|
11/17 | $15,245 | $14,524 |
|---|
12/17 | $16,469 | $14,916 |
|---|
1/18 | $17,848 | $16,044 |
|---|
2/18 | $17,163 | $15,245 |
|---|
3/18 | $17,281 | $15,015 |
|---|
4/18 | $16,850 | $15,121 |
|---|
5/18 | $18,229 | $14,921 |
|---|
6/18 | $17,711 | $14,206 |
|---|
7/18 | $17,043 | $14,325 |
|---|
8/18 | $16,178 | $14,179 |
|---|
9/18 | $15,883 | $13,982 |
|---|
10/18 | $13,680 | $12,466 |
|---|
11/18 | $14,614 | $13,128 |
|---|
12/18 | $14,181 | $12,772 |
|---|
1/19 | $15,352 | $13,706 |
|---|
2/19 | $16,502 | $13,992 |
|---|
3/19 | $17,712 | $14,232 |
|---|
4/19 | $17,997 | $14,503 |
|---|
5/19 | $16,670 | $13,265 |
|---|
6/19 | $18,292 | $14,138 |
|---|
7/19 | $17,751 | $13,889 |
|---|
8/19 | $18,322 | $13,280 |
|---|
9/19 | $18,253 | $13,502 |
|---|
10/19 | $19,433 | $14,116 |
|---|
11/19 | $19,482 | $14,151 |
|---|
12/19 | $20,446 | $15,093 |
|---|
1/20 | $19,895 | $14,421 |
|---|
2/20 | $20,249 | $14,007 |
|---|
3/20 | $18,617 | $12,318 |
|---|
4/20 | $19,797 | $13,422 |
|---|
5/20 | $20,780 | $13,267 |
|---|
6/20 | $22,787 | $14,377 |
|---|
7/20 | $25,226 | $15,599 |
|---|
8/20 | $27,684 | $16,152 |
|---|
9/20 | $26,848 | $15,909 |
|---|
10/20 | $27,458 | $16,354 |
|---|
11/20 | $29,150 | $17,668 |
|---|
12/20 | $31,109 | $18,869 |
|---|
1/21 | $32,730 | $19,639 |
|---|
2/21 | $33,684 | $19,883 |
|---|
3/21 | $31,467 | $19,378 |
|---|
4/21 | $31,576 | $19,859 |
|---|
5/21 | $31,696 | $20,101 |
|---|
6/21 | $31,228 | $20,077 |
|---|
7/21 | $26,029 | $18,572 |
|---|
8/21 | $26,387 | $18,996 |
|---|
9/21 | $25,810 | $18,203 |
|---|
10/21 | $26,735 | $18,450 |
|---|
11/21 | $25,094 | $17,736 |
|---|
12/21 | $24,658 | $17,979 |
|---|
1/22 | $23,544 | $17,421 |
|---|
2/22 | $22,702 | $17,012 |
|---|
3/22 | $20,003 | $16,542 |
|---|
4/22 | $18,950 | $15,687 |
|---|
5/22 | $19,010 | $15,760 |
|---|
6/22 | $19,140 | $15,052 |
|---|
7/22 | $18,799 | $14,870 |
|---|
8/22 | $18,829 | $14,868 |
|---|
9/22 | $17,044 | $12,970 |
|---|
10/22 | $14,746 | $12,179 |
|---|
11/22 | $18,759 | $14,469 |
|---|
12/22 | $19,180 | $14,442 |
|---|
1/23 | $20,575 | $15,628 |
|---|
2/23 | $19,221 | $14,562 |
|---|
3/23 | $19,552 | $15,069 |
|---|
4/23 | $18,809 | $14,756 |
|---|
5/23 | $17,565 | $14,485 |
|---|
6/23 | $18,448 | $14,879 |
|---|
7/23 | $19,873 | $15,790 |
|---|
8/23 | $18,649 | $14,778 |
|---|
9/23 | $17,816 | $14,381 |
|---|
10/23 | $17,094 | $13,825 |
|---|
11/23 | $17,485 | $14,786 |
|---|
12/23 | $17,806 | $15,306 |
|---|
1/24 | $16,231 | $14,471 |
|---|
2/24 | $17,375 | $15,281 |
|---|
3/24 | $18,037 | $15,670 |
|---|
4/24 | $19,040 | $15,865 |
|---|
5/24 | $19,331 | $16,112 |
|---|
6/24 | $18,930 | $16,797 |
|---|
7/24 | $18,488 | $16,775 |
|---|
8/24 | $18,869 | $17,102 |
|---|
9/24 | $21,899 | $18,544 |
|---|
10/24 | $21,558 | $17,692 |
|---|
11/24 | $21,849 | $17,111 |
|---|
12/24 | $21,254 | $17,136 |
|---|
|
|
| Average Annual Return [Table Text Block] |
AATR | 1 Year | 5 Years | Since 12/29/15
(Inception) |
|---|
Class A | 19.36% | 0.78% | 9.38% |
|---|
Class A, with 5.25% maximum front end sales charge | 13.12% | (0.30)% | 8.73% |
|---|
MSCI All Country Asia ex Japan Net Index | 11.96% | 2.57% | 6.16% |
|---|
|
|
| Performance Inception Date |
Dec. 29, 2015
|
|
| AssetsNet |
$ 125,093,937
|
|
| Holdings Count | Holding |
32
|
|
| Advisory Fees Paid, Amount |
$ 814,793
|
|
| InvestmentCompanyPortfolioTurnover |
19.00%
|
|
| Additional Fund Statistics [Text Block] |
Total Net Assets | $125,093,937 |
|---|
# of Portfolio Holdings | 32 |
|---|
Portfolio Turnover Rate | 19% |
|---|
Total Advisory Fees Paid | $814,793 |
|---|
|
|
| Holdings [Text Block] |
Country Weightings (% of total investments)Value | Value |
|---|
United States | 1.3% | Hong Kong | 2.4% | Singapore | 4.4% | Taiwan | 5.1% | Korea, Republic of | 12.0% | India | 27.0% | China | 47.8% |
Top Ten Holdings (% of total investments)Footnote ReferenceaTrip.com Group Ltd. | 8.0% | ICICI Bank Ltd. | 6.8% | Coupang, Inc. | 6.2% | Meituan | 6.1% | HDFC Bank Ltd. | 5.2% | Taiwan Semiconductor Manufacturing Co. Ltd. | 5.1% | Zomato Ltd. | 4.8% | Qifu Technology, Inc. | 4.6% | Tencent Holdings Ltd. | 4.5% | Full Truck Alliance Co. Ltd. | 4.5% | Total | 55.8% |
| Footnote | Description | Footnotea | Excluding cash equivalents. |
|
|
| Material Fund Change [Text Block] |
|
|
| Updated Prospectus Web Address |
<span style="box-sizing: border-box; color: rgb(0, 0, 0); display: inline; flex-wrap: nowrap; font-size: 10.6667px; font-weight: 400; grid-area: auto; line-height: 16px; margin: 0px; overflow: visible; text-align: left;">www.morganstanley.com/im/shareholderreports</span>
|
|
| C000163122 |
|
|
| Shareholder Report [Line Items] |
|
|
| Fund Name |
Morgan Stanley Institutional Fund, Inc. - Asia Opportunity Portfolio
|
|
| Class Name |
Class C
|
|
| Trading Symbol |
MSAWX
|
|
| Annual or Semi-Annual Statement [Text Block] |
This annual shareholder report contains important information about Morgan Stanley Institutional Fund, Inc. - Asia Opportunity Portfolio for the period of January 1, 2024 to December 31, 2024.
|
|
| Shareholder Report Annual or Semi-Annual |
Annual Shareholder Report
|
|
| Additional Information [Text Block] |
You can find additional information about the Fund at www.morganstanley.com/im/shareholderreports. You can also request this information by contacting us at 1-800-869-6397.
|
|
| Additional Information Phone Number |
1-800-869-6397
|
|
| Additional Information Website |
<span style="box-sizing: border-box; color: rgb(0, 0, 0); display: inline; flex-wrap: nowrap; font-size: 10.6667px; font-weight: 400; grid-area: auto; line-height: 16px; margin: 0px; overflow: visible; text-align: left;">www.morganstanley.com/im/shareholderreports</span>
|
|
| Expenses [Text Block] |
What were the Fund costs for the last year?(based on a hypothetical $10,000 investment) Class Name | Costs of a $10,000 investment | Costs paid as a percentage of a $10,000 investment |
|---|
Class C | $235 | 2.15% |
|---|
|
|
| Expenses Paid, Amount |
$ 235
|
|
| Expense Ratio, Percent |
2.15%
|
|
| Factors Affecting Performance [Text Block] |
How did the Fund perform last year and what affected its performance?Key contributors to (↑) and detractors from (↓) performance, relative to the MSCI All Country Asia ex Japan Net Index: ↑ Stock selection in consumer discretionary, led by a Chinese online travel agency, which was the largest positive contributor in the portfolio ↑ Stock selection in industrials, led by a holding in an operator of a Southeast Asian super app (an integrated app platform combining multiple services) ↑ No exposure to materials ↓ Stock selection in communication services, where a holding in a Korean search engine was the main detractor ↓ An underweight allocation to information technology, where exposure to a power management integrated circuit fabless integrated design manufacturer was the main detractor ↓ Stock selection in financials, where a Korean digital bank was the largest detractor in the portfolio |
|
| Line Graph [Table Text Block] |
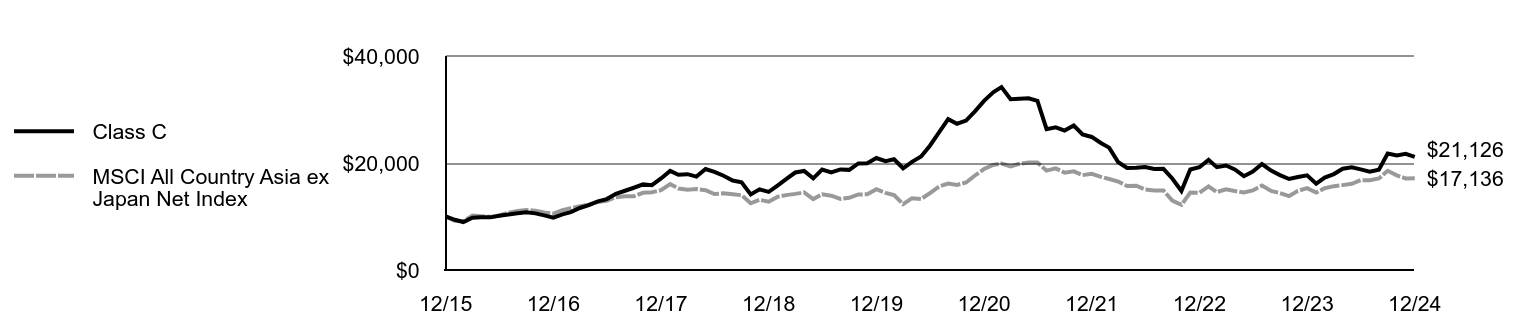 | Class C | MSCI All Country Asia ex Japan Net Index |
|---|
12/15 | $10,030 | $9,982 |
|---|
1/16 | $9,390 | $9,219 |
|---|
2/16 | $8,970 | $9,134 |
|---|
3/16 | $9,770 | $10,159 |
|---|
4/16 | $9,870 | $10,068 |
|---|
5/16 | $9,840 | $9,934 |
|---|
6/16 | $10,140 | $10,199 |
|---|
7/16 | $10,384 | $10,694 |
|---|
8/16 | $10,594 | $11,054 |
|---|
9/16 | $10,774 | $11,234 |
|---|
10/16 | $10,584 | $11,064 |
|---|
11/16 | $10,204 | $10,745 |
|---|
12/16 | $9,785 | $10,525 |
|---|
1/17 | $10,391 | $11,177 |
|---|
2/17 | $10,806 | $11,556 |
|---|
3/17 | $11,594 | $11,934 |
|---|
4/17 | $12,110 | $12,193 |
|---|
5/17 | $12,827 | $12,723 |
|---|
6/17 | $13,252 | $12,926 |
|---|
7/17 | $14,243 | $13,617 |
|---|
8/17 | $14,809 | $13,798 |
|---|
9/17 | $15,375 | $13,782 |
|---|
10/17 | $16,001 | $14,432 |
|---|
11/17 | $15,850 | $14,524 |
|---|
12/17 | $17,109 | $14,916 |
|---|
1/18 | $18,531 | $16,044 |
|---|
2/18 | $17,815 | $15,245 |
|---|
3/18 | $17,917 | $15,015 |
|---|
4/18 | $17,457 | $15,121 |
|---|
5/18 | $18,868 | $14,921 |
|---|
6/18 | $18,326 | $14,206 |
|---|
7/18 | $17,618 | $14,325 |
|---|
8/18 | $16,713 | $14,179 |
|---|
9/18 | $16,404 | $13,982 |
|---|
10/18 | $14,121 | $12,466 |
|---|
11/18 | $15,077 | $13,128 |
|---|
12/18 | $14,615 | $12,772 |
|---|
1/19 | $15,818 | $13,706 |
|---|
2/19 | $17,001 | $13,992 |
|---|
3/19 | $18,224 | $14,232 |
|---|
4/19 | $18,512 | $14,503 |
|---|
5/19 | $17,134 | $13,265 |
|---|
6/19 | $18,790 | $14,138 |
|---|
7/19 | $18,235 | $13,889 |
|---|
8/19 | $18,800 | $13,280 |
|---|
9/19 | $18,718 | $13,502 |
|---|
10/19 | $19,921 | $14,116 |
|---|
11/19 | $19,963 | $14,151 |
|---|
12/19 | $20,929 | $15,093 |
|---|
1/20 | $20,353 | $14,421 |
|---|
2/20 | $20,703 | $14,007 |
|---|
3/20 | $19,016 | $12,318 |
|---|
4/20 | $20,209 | $13,422 |
|---|
5/20 | $21,207 | $13,267 |
|---|
6/20 | $23,233 | $14,377 |
|---|
7/20 | $25,712 | $15,599 |
|---|
8/20 | $28,201 | $16,152 |
|---|
9/20 | $27,337 | $15,909 |
|---|
10/20 | $27,933 | $16,354 |
|---|
11/20 | $29,640 | $17,668 |
|---|
12/20 | $31,607 | $18,869 |
|---|
1/21 | $33,230 | $19,639 |
|---|
2/21 | $34,187 | $19,883 |
|---|
3/21 | $31,919 | $19,378 |
|---|
4/21 | $32,002 | $19,859 |
|---|
5/21 | $32,106 | $20,101 |
|---|
6/21 | $31,618 | $20,077 |
|---|
7/21 | $26,334 | $18,572 |
|---|
8/21 | $26,677 | $18,996 |
|---|
9/21 | $26,074 | $18,203 |
|---|
10/21 | $27,000 | $18,450 |
|---|
11/21 | $25,325 | $17,736 |
|---|
12/21 | $24,869 | $17,979 |
|---|
1/22 | $23,735 | $17,421 |
|---|
2/22 | $22,874 | $17,012 |
|---|
3/22 | $20,145 | $16,542 |
|---|
4/22 | $19,064 | $15,687 |
|---|
5/22 | $19,116 | $15,760 |
|---|
6/22 | $19,232 | $15,052 |
|---|
7/22 | $18,885 | $14,870 |
|---|
8/22 | $18,906 | $14,868 |
|---|
9/22 | $17,101 | $12,970 |
|---|
10/22 | $14,781 | $12,179 |
|---|
11/22 | $18,791 | $14,469 |
|---|
12/22 | $19,200 | $14,442 |
|---|
1/23 | $20,586 | $15,628 |
|---|
2/23 | $19,221 | $14,562 |
|---|
3/23 | $19,536 | $15,069 |
|---|
4/23 | $18,791 | $14,756 |
|---|
5/23 | $17,531 | $14,485 |
|---|
6/23 | $18,402 | $14,879 |
|---|
7/23 | $19,809 | $15,790 |
|---|
8/23 | $18,581 | $14,778 |
|---|
9/23 | $17,730 | $14,381 |
|---|
10/23 | $17,006 | $13,825 |
|---|
11/23 | $17,394 | $14,786 |
|---|
12/23 | $17,699 | $15,306 |
|---|
1/24 | $16,133 | $14,471 |
|---|
2/24 | $17,270 | $15,281 |
|---|
3/24 | $17,928 | $15,670 |
|---|
4/24 | $18,925 | $15,865 |
|---|
5/24 | $19,214 | $16,112 |
|---|
6/24 | $18,816 | $16,797 |
|---|
7/24 | $18,377 | $16,775 |
|---|
8/24 | $18,756 | $17,102 |
|---|
9/24 | $21,767 | $18,544 |
|---|
10/24 | $21,428 | $17,692 |
|---|
11/24 | $21,717 | $17,111 |
|---|
12/24 | $21,126 | $17,136 |
|---|
|
|
| Average Annual Return [Table Text Block] |
AATR | 1 Year | 5 Years | Since 12/29/15
(Inception) |
|---|
Class C, with conversion to Class A after 8 years | 18.47% | 0.04% | 8.66% |
|---|
Class C, with 1% maximum contingent deferred sales charge and conversion to Class A after 8 years | 17.47% | 0.04% | 8.66% |
|---|
MSCI All Country Asia ex Japan Net Index | 11.96% | 2.57% | 6.16% |
|---|
|
|
| Performance Inception Date |
Dec. 29, 2015
|
|
| AssetsNet |
$ 125,093,937
|
|
| Holdings Count | Holding |
32
|
|
| Advisory Fees Paid, Amount |
$ 814,793
|
|
| InvestmentCompanyPortfolioTurnover |
19.00%
|
|
| Additional Fund Statistics [Text Block] |
Total Net Assets | $125,093,937 |
|---|
# of Portfolio Holdings | 32 |
|---|
Portfolio Turnover Rate | 19% |
|---|
Total Advisory Fees Paid | $814,793 |
|---|
|
|
| Holdings [Text Block] |
Country Weightings (% of total investments)Value | Value |
|---|
United States | 1.3% | Hong Kong | 2.4% | Singapore | 4.4% | Taiwan | 5.1% | Korea, Republic of | 12.0% | India | 27.0% | China | 47.8% |
Top Ten Holdings (% of total investments)Footnote ReferenceaTrip.com Group Ltd. | 8.0% | ICICI Bank Ltd. | 6.8% | Coupang, Inc. | 6.2% | Meituan | 6.1% | HDFC Bank Ltd. | 5.2% | Taiwan Semiconductor Manufacturing Co. Ltd. | 5.1% | Zomato Ltd. | 4.8% | Qifu Technology, Inc. | 4.6% | Tencent Holdings Ltd. | 4.5% | Full Truck Alliance Co. Ltd. | 4.5% | Total | 55.8% |
| Footnote | Description | Footnotea | Excluding cash equivalents. |
|
|
| Material Fund Change [Text Block] |
|
|
| Updated Prospectus Web Address |
<span style="box-sizing: border-box; color: rgb(0, 0, 0); display: inline; flex-wrap: nowrap; font-size: 10.6667px; font-weight: 400; grid-area: auto; line-height: 16px; margin: 0px; overflow: visible; text-align: left;">www.morganstanley.com/im/shareholderreports</span>
|
|
| C000163120 |
|
|
| Shareholder Report [Line Items] |
|
|
| Fund Name |
Morgan Stanley Institutional Fund, Inc. - Asia Opportunity Portfolio
|
|
| Class Name |
Class I
|
|
| Trading Symbol |
MSAQX
|
|
| Annual or Semi-Annual Statement [Text Block] |
This annual shareholder report contains important information about Morgan Stanley Institutional Fund, Inc. - Asia Opportunity Portfolio for the period of January 1, 2024 to December 31, 2024.
|
|
| Shareholder Report Annual or Semi-Annual |
Annual Shareholder Report
|
|
| Additional Information [Text Block] |
You can find additional information about the Fund at www.morganstanley.com/im/shareholderreports. You can also request this information by contacting us at 1-800-869-6397.
|
|
| Additional Information Phone Number |
1-800-869-6397
|
|
| Additional Information Website |
<span style="box-sizing: border-box; color: rgb(0, 0, 0); display: inline; flex-wrap: nowrap; font-size: 10.6667px; font-weight: 400; grid-area: auto; line-height: 16px; margin: 0px; overflow: visible; text-align: left;">www.morganstanley.com/im/shareholderreports</span>
|
|
| Expenses [Text Block] |
What were the Fund costs for the last year?(based on a hypothetical $10,000 investment) Class Name | Costs of a $10,000 investment | Costs paid as a percentage of a $10,000 investment |
|---|
Class I | $121 | 1.10% |
|---|
|
|
| Expenses Paid, Amount |
$ 121
|
|
| Expense Ratio, Percent |
1.10%
|
|
| Factors Affecting Performance [Text Block] |
How did the Fund perform last year and what affected its performance?Key contributors to (↑) and detractors from (↓) performance, relative to the MSCI All Country Asia ex Japan Net Index: ↑ Stock selection in consumer discretionary, led by a Chinese online travel agency, which was the largest positive contributor in the portfolio ↑ Stock selection in industrials, led by a holding in an operator of a Southeast Asian super app (an integrated app platform combining multiple services) ↑ No exposure to materials ↓ Stock selection in communication services, where a holding in a Korean search engine was the main detractor ↓ An underweight allocation to information technology, where exposure to a power management integrated circuit fabless integrated design manufacturer was the main detractor ↓ Stock selection in financials, where a Korean digital bank was the largest detractor in the portfolio |
|
| Line Graph [Table Text Block] |
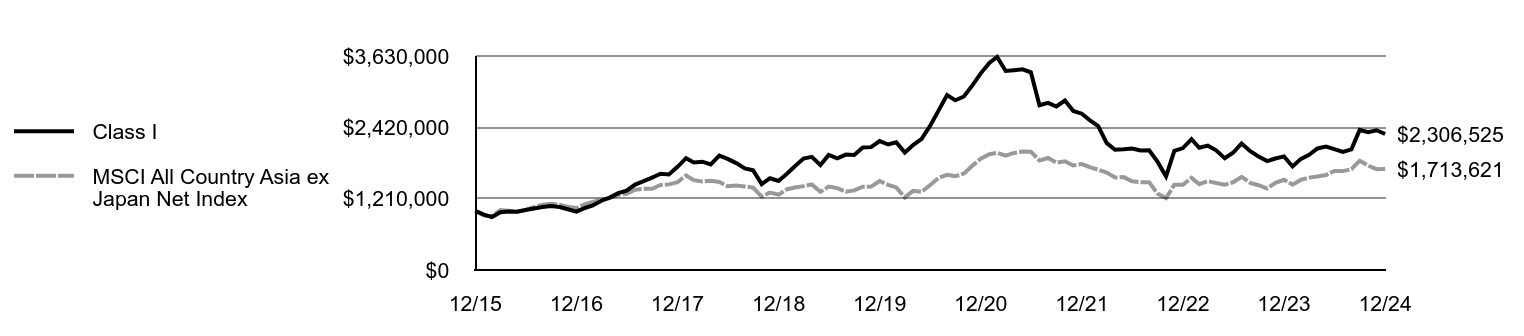 | Class I | MSCI All Country Asia ex Japan Net Index |
|---|
12/15 | $1,003,000 | $1,000,000 |
|---|
1/16 | $940,000 | $921,916 |
|---|
2/16 | $899,000 | $913,360 |
|---|
3/16 | $980,000 | $1,015,925 |
|---|
4/16 | $991,000 | $1,006,823 |
|---|
5/16 | $989,000 | $993,406 |
|---|
6/16 | $1,019,000 | $1,019,941 |
|---|
7/16 | $1,044,442 | $1,069,379 |
|---|
8/16 | $1,067,474 | $1,105,406 |
|---|
9/16 | $1,086,500 | $1,123,408 |
|---|
10/16 | $1,067,474 | $1,106,377 |
|---|
11/16 | $1,030,422 | $1,074,508 |
|---|
12/16 | $989,590 | $1,052,484 |
|---|
1/17 | $1,051,951 | $1,117,738 |
|---|
2/17 | $1,094,888 | $1,155,577 |
|---|
3/17 | $1,174,627 | $1,193,369 |
|---|
4/17 | $1,228,809 | $1,219,336 |
|---|
5/17 | $1,303,438 | $1,272,338 |
|---|
6/17 | $1,347,397 | $1,292,585 |
|---|
7/17 | $1,449,627 | $1,361,700 |
|---|
8/17 | $1,508,921 | $1,379,823 |
|---|
9/17 | $1,568,214 | $1,378,195 |
|---|
10/17 | $1,632,619 | $1,443,222 |
|---|
11/17 | $1,619,329 | $1,452,375 |
|---|
12/17 | $1,749,761 | $1,491,564 |
|---|
1/18 | $1,896,608 | $1,604,386 |
|---|
2/18 | $1,824,219 | $1,524,512 |
|---|
3/18 | $1,837,663 | $1,501,487 |
|---|
4/18 | $1,791,126 | $1,512,133 |
|---|
5/18 | $1,939,008 | $1,492,128 |
|---|
6/18 | $1,884,199 | $1,420,581 |
|---|
7/18 | $1,813,604 | $1,432,504 |
|---|
8/18 | $1,722,092 | $1,417,871 |
|---|
9/18 | $1,690,894 | $1,398,246 |
|---|
10/18 | $1,456,915 | $1,246,564 |
|---|
11/18 | $1,556,746 | $1,312,773 |
|---|
12/18 | $1,510,990 | $1,277,194 |
|---|
1/19 | $1,636,819 | $1,370,565 |
|---|
2/19 | $1,760,568 | $1,399,164 |
|---|
3/19 | $1,889,517 | $1,423,171 |
|---|
4/19 | $1,919,675 | $1,450,257 |
|---|
5/19 | $1,779,287 | $1,326,545 |
|---|
6/19 | $1,952,952 | $1,413,826 |
|---|
7/19 | $1,895,757 | $1,388,859 |
|---|
8/19 | $1,957,111 | $1,328,040 |
|---|
9/19 | $1,950,872 | $1,350,171 |
|---|
10/19 | $2,077,741 | $1,411,603 |
|---|
11/19 | $2,083,981 | $1,415,080 |
|---|
12/19 | $2,186,941 | $1,509,253 |
|---|
1/20 | $2,128,678 | $1,442,114 |
|---|
2/20 | $2,167,173 | $1,400,701 |
|---|
3/20 | $1,992,384 | $1,231,848 |
|---|
4/20 | $2,118,274 | $1,342,242 |
|---|
5/20 | $2,225,436 | $1,326,657 |
|---|
6/20 | $2,439,760 | $1,437,702 |
|---|
7/20 | $2,702,984 | $1,559,854 |
|---|
8/20 | $2,966,208 | $1,615,212 |
|---|
9/20 | $2,877,773 | $1,590,946 |
|---|
10/20 | $2,943,319 | $1,635,391 |
|---|
11/20 | $3,126,431 | $1,766,812 |
|---|
12/20 | $3,335,819 | $1,886,872 |
|---|
1/21 | $3,511,444 | $1,963,863 |
|---|
2/21 | $3,613,453 | $1,988,327 |
|---|
3/21 | $3,376,833 | $1,937,847 |
|---|
4/21 | $3,389,453 | $1,985,897 |
|---|
5/21 | $3,403,124 | $2,010,116 |
|---|
6/21 | $3,353,697 | $2,007,679 |
|---|
7/21 | $2,795,273 | $1,857,162 |
|---|
8/21 | $2,834,184 | $1,899,629 |
|---|
9/21 | $2,773,189 | $1,820,300 |
|---|
10/21 | $2,874,147 | $1,845,013 |
|---|
11/21 | $2,697,470 | $1,773,627 |
|---|
12/21 | $2,651,311 | $1,797,867 |
|---|
1/22 | $2,532,485 | $1,742,073 |
|---|
2/22 | $2,442,304 | $1,701,207 |
|---|
3/22 | $2,152,665 | $1,654,153 |
|---|
4/22 | $2,040,205 | $1,568,740 |
|---|
5/22 | $2,047,631 | $1,575,956 |
|---|
6/22 | $2,061,424 | $1,505,203 |
|---|
7/22 | $2,026,412 | $1,486,952 |
|---|
8/22 | $2,029,595 | $1,486,835 |
|---|
9/22 | $1,837,563 | $1,296,974 |
|---|
10/22 | $1,589,301 | $1,217,871 |
|---|
11/22 | $2,022,168 | $1,446,923 |
|---|
12/22 | $2,067,789 | $1,444,198 |
|---|
1/23 | $2,219,505 | $1,562,792 |
|---|
2/23 | $2,073,094 | $1,456,222 |
|---|
3/23 | $2,109,166 | $1,506,891 |
|---|
4/23 | $2,030,656 | $1,475,563 |
|---|
5/23 | $1,895,916 | $1,448,543 |
|---|
6/23 | $1,991,401 | $1,487,894 |
|---|
7/23 | $2,146,299 | $1,579,035 |
|---|
8/23 | $2,015,803 | $1,477,785 |
|---|
9/23 | $1,925,622 | $1,438,146 |
|---|
10/23 | $1,848,173 | $1,382,534 |
|---|
11/23 | $1,891,672 | $1,478,596 |
|---|
12/23 | $1,926,537 | $1,530,586 |
|---|
1/24 | $1,756,329 | $1,447,137 |
|---|
2/24 | $1,880,793 | $1,528,140 |
|---|
3/24 | $1,953,132 | $1,566,954 |
|---|
4/24 | $2,061,639 | $1,586,472 |
|---|
5/24 | $2,093,553 | $1,611,192 |
|---|
6/24 | $2,051,001 | $1,679,749 |
|---|
7/24 | $2,003,130 | $1,677,520 |
|---|
8/24 | $2,045,682 | $1,710,223 |
|---|
9/24 | $2,375,459 | $1,854,425 |
|---|
10/24 | $2,338,226 | $1,769,210 |
|---|
11/24 | $2,370,140 | $1,711,091 |
|---|
12/24 | $2,306,525 | $1,713,621 |
|---|
|
|
| Average Annual Return [Table Text Block] |
AATR | 1 Year | 5 Years | Since 12/29/15
(Inception) |
|---|
Class I | 19.72% | 1.07% | 9.72% |
|---|
MSCI All Country Asia ex Japan Net Index | 11.96% | 2.57% | 6.16% |
|---|
|
|
| Performance Inception Date |
Dec. 29, 2015
|
|
| AssetsNet |
$ 125,093,937
|
|
| Holdings Count | Holding |
32
|
|
| Advisory Fees Paid, Amount |
$ 814,793
|
|
| InvestmentCompanyPortfolioTurnover |
19.00%
|
|
| Additional Fund Statistics [Text Block] |
Total Net Assets | $125,093,937 |
|---|
# of Portfolio Holdings | 32 |
|---|
Portfolio Turnover Rate | 19% |
|---|
Total Advisory Fees Paid | $814,793 |
|---|
|
|
| Holdings [Text Block] |
Country Weightings (% of total investments)Value | Value |
|---|
United States | 1.3% | Hong Kong | 2.4% | Singapore | 4.4% | Taiwan | 5.1% | Korea, Republic of | 12.0% | India | 27.0% | China | 47.8% |
Top Ten Holdings (% of total investments)Footnote ReferenceaTrip.com Group Ltd. | 8.0% | ICICI Bank Ltd. | 6.8% | Coupang, Inc. | 6.2% | Meituan | 6.1% | HDFC Bank Ltd. | 5.2% | Taiwan Semiconductor Manufacturing Co. Ltd. | 5.1% | Zomato Ltd. | 4.8% | Qifu Technology, Inc. | 4.6% | Tencent Holdings Ltd. | 4.5% | Full Truck Alliance Co. Ltd. | 4.5% | Total | 55.8% |
| Footnote | Description | Footnotea | Excluding cash equivalents. |
|
|
| Material Fund Change [Text Block] |
|
|
| Updated Prospectus Web Address |
<span style="box-sizing: border-box; color: rgb(0, 0, 0); display: inline; flex-wrap: nowrap; font-size: 10.6667px; font-weight: 400; grid-area: auto; line-height: 16px; margin: 0px; overflow: visible; text-align: left;">www.morganstanley.com/im/shareholderreports</span>
|
|
| C000163123 |
|
|
| Shareholder Report [Line Items] |
|
|
| Fund Name |
Morgan Stanley Institutional Fund, Inc. - Asia Opportunity Portfolio
|
|
| Class Name |
Class R6
|
|
| Trading Symbol |
MSAYX
|
|
| Annual or Semi-Annual Statement [Text Block] |
This annual shareholder report contains important information about Morgan Stanley Institutional Fund, Inc. - Asia Opportunity Portfolio for the period of January 1, 2024 to December 31, 2024.
|
|
| Shareholder Report Annual or Semi-Annual |
Annual Shareholder Report
|
|
| Additional Information [Text Block] |
You can find additional information about the Fund at www.morganstanley.com/im/shareholderreports. You can also request this information by contacting us at 1-800-869-6397.
|
|
| Additional Information Phone Number |
1-800-869-6397
|
|
| Additional Information Website |
<span style="box-sizing: border-box; color: rgb(0, 0, 0); display: inline; flex-wrap: nowrap; font-size: 10.6667px; font-weight: 400; grid-area: auto; line-height: 16px; margin: 0px; overflow: visible; text-align: left;">www.morganstanley.com/im/shareholderreports</span>
|
|
| Expenses [Text Block] |
What were the Fund costs for the last year?(based on a hypothetical $10,000 investment) Class Name | Costs of a $10,000 investment | Costs paid as a percentage of a $10,000 investment |
|---|
Class R6 | $115 | 1.05% |
|---|
|
|
| Expenses Paid, Amount |
$ 115
|
|
| Expense Ratio, Percent |
1.05%
|
|
| Factors Affecting Performance [Text Block] |
How did the Fund perform last year and what affected its performance?Key contributors to (↑) and detractors from (↓) performance, relative to the MSCI All Country Asia ex Japan Net Index: ↑ Stock selection in consumer discretionary, led by a Chinese online travel agency, which was the largest positive contributor in the portfolio ↑ Stock selection in industrials, led by a holding in an operator of a Southeast Asian super app (an integrated app platform combining multiple services) ↑ No exposure to materials ↓ Stock selection in communication services, where a holding in a Korean search engine was the main detractor ↓ An underweight allocation to information technology, where exposure to a power management integrated circuit fabless integrated design manufacturer was the main detractor ↓ Stock selection in financials, where a Korean digital bank was the largest detractor in the portfolio |
|
| Line Graph [Table Text Block] |
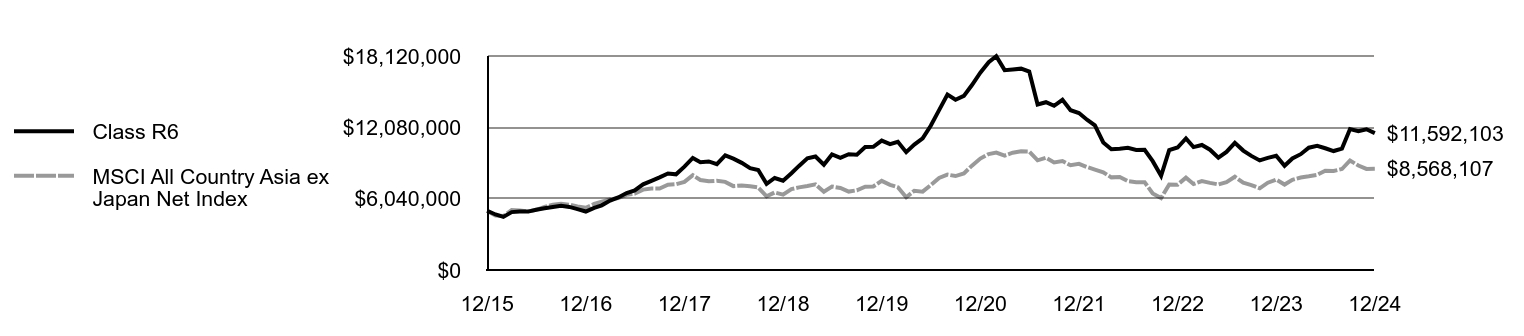 | Class R6 | MSCI All Country Asia ex Japan Net Index |
|---|
12/15 | $5,015,000 | $5,000,000 |
|---|
1/16 | $4,700,000 | $4,609,579 |
|---|
2/16 | $4,495,000 | $4,566,799 |
|---|
3/16 | $4,900,000 | $5,079,623 |
|---|
4/16 | $4,955,000 | $5,034,113 |
|---|
5/16 | $4,945,000 | $4,967,029 |
|---|
6/16 | $5,095,000 | $5,099,705 |
|---|
7/16 | $5,227,222 | $5,346,893 |
|---|
8/16 | $5,337,374 | $5,527,028 |
|---|
9/16 | $5,437,513 | $5,617,039 |
|---|
10/16 | $5,342,381 | $5,531,886 |
|---|
11/16 | $5,157,125 | $5,372,542 |
|---|
12/16 | $4,950,062 | $5,262,422 |
|---|
1/17 | $5,261,997 | $5,588,692 |
|---|
2/17 | $5,476,773 | $5,777,883 |
|---|
3/17 | $5,875,641 | $5,966,843 |
|---|
4/17 | $6,146,668 | $6,096,680 |
|---|
5/17 | $6,519,968 | $6,361,692 |
|---|
6/17 | $6,739,857 | $6,462,923 |
|---|
7/17 | $7,251,227 | $6,808,501 |
|---|
8/17 | $7,547,821 | $6,899,114 |
|---|
9/17 | $7,844,416 | $6,890,975 |
|---|
10/17 | $8,171,693 | $7,216,108 |
|---|
11/17 | $8,100,101 | $7,261,873 |
|---|
12/17 | $8,752,536 | $7,457,819 |
|---|
1/18 | $9,487,087 | $8,021,929 |
|---|
2/18 | $9,130,158 | $7,622,562 |
|---|
3/18 | $9,192,232 | $7,507,433 |
|---|
4/18 | $8,964,625 | $7,560,667 |
|---|
5/18 | $9,699,176 | $7,460,640 |
|---|
6/18 | $9,430,185 | $7,102,905 |
|---|
7/18 | $9,071,887 | $7,162,519 |
|---|
8/18 | $8,619,333 | $7,089,355 |
|---|
9/18 | $8,463,280 | $6,991,229 |
|---|
10/18 | $7,292,882 | $6,232,818 |
|---|
11/18 | $7,792,252 | $6,563,864 |
|---|
12/18 | $7,563,374 | $6,385,969 |
|---|
1/19 | $8,192,788 | $6,852,823 |
|---|
2/19 | $8,811,798 | $6,995,820 |
|---|
3/19 | $9,456,818 | $7,115,855 |
|---|
4/19 | $9,612,871 | $7,251,287 |
|---|
5/19 | $8,910,632 | $6,632,724 |
|---|
6/19 | $9,779,328 | $7,069,131 |
|---|
7/19 | $9,493,230 | $6,944,293 |
|---|
8/19 | $9,800,135 | $6,640,202 |
|---|
9/19 | $9,768,924 | $6,750,855 |
|---|
10/19 | $10,408,742 | $7,058,017 |
|---|
11/19 | $10,434,751 | $7,075,398 |
|---|
12/19 | $10,953,293 | $7,546,264 |
|---|
1/20 | $10,656,555 | $7,210,572 |
|---|
2/20 | $10,854,380 | $7,003,504 |
|---|
3/20 | $9,979,783 | $6,159,242 |
|---|
4/20 | $10,614,907 | $6,711,212 |
|---|
5/20 | $11,140,707 | $6,633,286 |
|---|
6/20 | $12,218,336 | $7,188,508 |
|---|
7/20 | $13,535,438 | $7,799,272 |
|---|
8/20 | $14,857,746 | $8,076,062 |
|---|
9/20 | $14,415,242 | $7,954,730 |
|---|
10/20 | $14,743,216 | $8,176,955 |
|---|
11/20 | $15,659,461 | $8,834,062 |
|---|
12/20 | $16,712,387 | $9,434,361 |
|---|
1/21 | $17,591,155 | $9,819,313 |
|---|
2/21 | $18,106,839 | $9,941,635 |
|---|
3/21 | $16,922,870 | $9,689,234 |
|---|
4/21 | $16,980,753 | $9,929,485 |
|---|
5/21 | $17,049,160 | $10,050,582 |
|---|
6/21 | $16,807,104 | $10,038,395 |
|---|
7/21 | $14,012,936 | $9,285,810 |
|---|
8/21 | $14,207,633 | $9,498,143 |
|---|
9/21 | $13,902,432 | $9,101,500 |
|---|
10/21 | $14,407,593 | $9,225,065 |
|---|
11/21 | $13,528,824 | $8,868,135 |
|---|
12/21 | $13,292,595 | $8,989,335 |
|---|
1/22 | $12,703,346 | $8,710,367 |
|---|
2/22 | $12,252,120 | $8,506,037 |
|---|
3/22 | $10,797,579 | $8,270,764 |
|---|
4/22 | $10,229,565 | $7,843,700 |
|---|
5/22 | $10,266,724 | $7,879,779 |
|---|
6/22 | $10,341,044 | $7,526,016 |
|---|
7/22 | $10,160,554 | $7,434,761 |
|---|
8/22 | $10,181,788 | $7,434,175 |
|---|
9/22 | $9,215,633 | $6,484,871 |
|---|
10/22 | $7,973,433 | $6,089,356 |
|---|
11/22 | $10,144,628 | $7,234,614 |
|---|
12/22 | $10,372,895 | $7,220,988 |
|---|
1/23 | $11,137,326 | $7,813,959 |
|---|
2/23 | $10,404,747 | $7,281,108 |
|---|
3/23 | $10,585,237 | $7,534,453 |
|---|
4/23 | $10,187,096 | $7,377,813 |
|---|
5/23 | $9,512,911 | $7,242,714 |
|---|
6/23 | $9,995,989 | $7,439,468 |
|---|
7/23 | $10,771,036 | $7,895,173 |
|---|
8/23 | $10,112,777 | $7,388,927 |
|---|
9/23 | $9,661,550 | $7,190,729 |
|---|
10/23 | $9,279,335 | $6,912,671 |
|---|
11/23 | $9,491,677 | $7,392,982 |
|---|
12/23 | $9,667,832 | $7,652,929 |
|---|
1/24 | $8,820,898 | $7,235,687 |
|---|
2/24 | $9,444,114 | $7,640,702 |
|---|
3/24 | $9,806,325 | $7,834,771 |
|---|
4/24 | $10,354,968 | $7,932,358 |
|---|
5/24 | $10,514,767 | $8,055,961 |
|---|
6/24 | $10,307,028 | $8,398,745 |
|---|
7/24 | $10,072,656 | $8,387,601 |
|---|
8/24 | $10,280,395 | $8,551,114 |
|---|
9/24 | $11,936,977 | $9,272,123 |
|---|
10/24 | $11,755,871 | $8,846,049 |
|---|
11/24 | $11,915,670 | $8,555,455 |
|---|
12/24 | $11,592,103 | $8,568,107 |
|---|
|
|
| Average Annual Return [Table Text Block] |
AATR | 1 Year | 5 Years | Since 12/29/15
(Inception) |
|---|
Class R6 | 19.90% | 1.14% | 9.79% |
|---|
MSCI All Country Asia ex Japan Net Index | 11.96% | 2.57% | 6.16% |
|---|
|
|
| Performance Inception Date |
Dec. 29, 2015
|
|
| AssetsNet |
$ 125,093,937
|
|
| Holdings Count | Holding |
32
|
|
| Advisory Fees Paid, Amount |
$ 814,793
|
|
| InvestmentCompanyPortfolioTurnover |
19.00%
|
|
| Additional Fund Statistics [Text Block] |
Total Net Assets | $125,093,937 |
|---|
# of Portfolio Holdings | 32 |
|---|
Portfolio Turnover Rate | 19% |
|---|
Total Advisory Fees Paid | $814,793 |
|---|
|
|
| Holdings [Text Block] |
Country Weightings (% of total investments)Value | Value |
|---|
United States | 1.3% | Hong Kong | 2.4% | Singapore | 4.4% | Taiwan | 5.1% | Korea, Republic of | 12.0% | India | 27.0% | China | 47.8% |
Top Ten Holdings (% of total investments)Footnote ReferenceaTrip.com Group Ltd. | 8.0% | ICICI Bank Ltd. | 6.8% | Coupang, Inc. | 6.2% | Meituan | 6.1% | HDFC Bank Ltd. | 5.2% | Taiwan Semiconductor Manufacturing Co. Ltd. | 5.1% | Zomato Ltd. | 4.8% | Qifu Technology, Inc. | 4.6% | Tencent Holdings Ltd. | 4.5% | Full Truck Alliance Co. Ltd. | 4.5% | Total | 55.8% |
| Footnote | Description | Footnotea | Excluding cash equivalents. |
|
|
| Material Fund Change [Text Block] |
|
|
| Updated Prospectus Web Address |
<span style="box-sizing: border-box; color: rgb(0, 0, 0); display: inline; flex-wrap: nowrap; font-size: 10.6667px; font-weight: 400; grid-area: auto; line-height: 16px; margin: 0px; overflow: visible; text-align: left;">www.morganstanley.com/im/shareholderreports</span>
|
|
| C000216355 |
|
|
| Shareholder Report [Line Items] |
|
|
| Fund Name |
Morgan Stanley Institutional Fund, Inc. - Developing Opportunity Portfolio
|
|
| Class Name |
Class A
|
|
| Trading Symbol |
MDOAX
|
|
| Annual or Semi-Annual Statement [Text Block] |
This annual shareholder report contains important information about Morgan Stanley Institutional Fund, Inc. - Developing Opportunity Portfolio for the period of January 1, 2024 to December 31, 2024.
|
|
| Shareholder Report Annual or Semi-Annual |
Annual Shareholder Report
|
|
| Additional Information [Text Block] |
You can find additional information about the Fund at www.morganstanley.com/im/shareholderreports. You can also request this information by contacting us at 1-800-869-6397.
|
|
| Additional Information Phone Number |
1-800-869-6397
|
|
| Additional Information Website |
<span style="box-sizing: border-box; color: rgb(0, 0, 0); display: inline; flex-wrap: nowrap; font-size: 10.6667px; font-weight: 400; grid-area: auto; line-height: 16px; margin: 0px; overflow: visible; text-align: left;">www.morganstanley.com/im/shareholderreports</span>
|
|
| Expenses [Text Block] |
What were the Fund costs for the last year?(based on a hypothetical $10,000 investment) Class Name | Costs of a $10,000 investment | Costs paid as a percentage of a $10,000 investment |
|---|
Class A | $159 | 1.47% |
|---|
|
|
| Expenses Paid, Amount |
$ 159
|
|
| Expense Ratio, Percent |
1.47%
|
|
| Factors Affecting Performance [Text Block] |
How did the Fund perform last year and what affected its performance?Key contributors to (↑) and detractors from (↓) performance, relative to the MSCI Emerging Markets Net Index: ↑ Stock selection in consumer discretionary, led by a Chinese online travel agency, which was the largest positive contributor in the portfolio ↑ Stock selection in industrials, led by a holding in an operator of a Southeast Asian super app (an integrated app platform combining multiple services) ↑ An underweight allocation to materials ↓ An underweight allocation to information technology, where a holding in an Argentinian IT services company was the main detractor ↓ Stock selection in communication services, where a Korean search engine was the largest detractor in the portfolio ↓ An underweight allocation to utilities, where exposure to a Brazilian water management company was the main detractor |
|
| Line Graph [Table Text Block] |
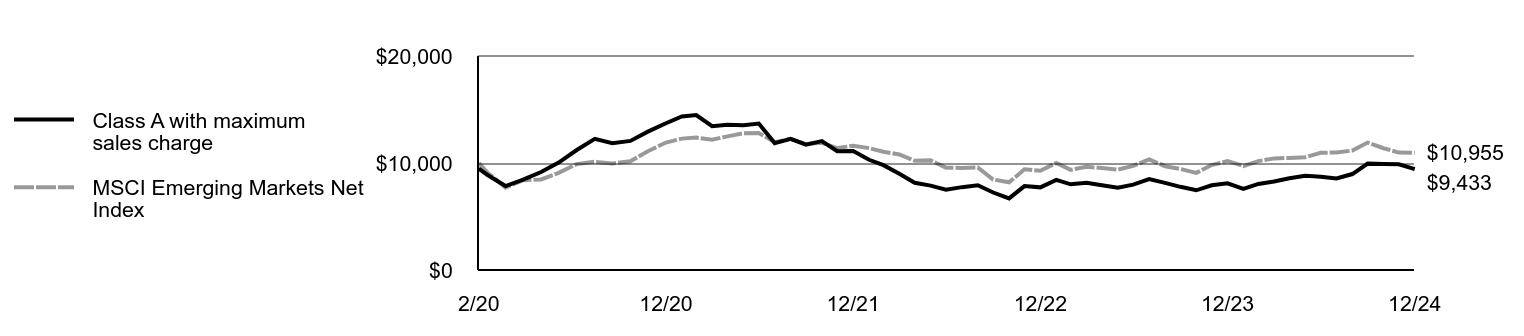 | Class A with maximum sales charge | MSCI Emerging Markets Net Index |
|---|
2/20 | $9,479 | $10,000 |
|---|
2/20 | $8,882 | $9,095 |
|---|
3/20 | $7,848 | $7,694 |
|---|
4/20 | $8,445 | $8,398 |
|---|
5/20 | $9,156 | $8,463 |
|---|
6/20 | $10,038 | $9,085 |
|---|
7/20 | $11,213 | $9,897 |
|---|
8/20 | $12,256 | $10,116 |
|---|
9/20 | $11,858 | $9,953 |
|---|
10/20 | $12,066 | $10,158 |
|---|
11/20 | $12,929 | $11,098 |
|---|
12/20 | $13,716 | $11,914 |
|---|
1/21 | $14,351 | $12,279 |
|---|
2/21 | $14,474 | $12,373 |
|---|
3/21 | $13,441 | $12,186 |
|---|
4/21 | $13,564 | $12,489 |
|---|
5/21 | $13,536 | $12,779 |
|---|
6/21 | $13,687 | $12,801 |
|---|
7/21 | $11,858 | $11,940 |
|---|
8/21 | $12,265 | $12,252 |
|---|
9/21 | $11,716 | $11,765 |
|---|
10/21 | $12,047 | $11,881 |
|---|
11/21 | $11,100 | $11,397 |
|---|
12/21 | $11,118 | $11,611 |
|---|
1/22 | $10,303 | $11,391 |
|---|
2/22 | $9,801 | $11,051 |
|---|
3/22 | $8,995 | $10,801 |
|---|
4/22 | $8,152 | $10,200 |
|---|
5/22 | $7,886 | $10,245 |
|---|
6/22 | $7,498 | $9,564 |
|---|
7/22 | $7,744 | $9,541 |
|---|
8/22 | $7,915 | $9,581 |
|---|
9/22 | $7,242 | $8,458 |
|---|
10/22 | $6,692 | $8,195 |
|---|
11/22 | $7,839 | $9,410 |
|---|
12/22 | $7,725 | $9,278 |
|---|
1/23 | $8,427 | $10,011 |
|---|
2/23 | $8,009 | $9,362 |
|---|
3/23 | $8,161 | $9,645 |
|---|
4/23 | $7,924 | $9,536 |
|---|
5/23 | $7,687 | $9,376 |
|---|
6/23 | $7,981 | $9,732 |
|---|
7/23 | $8,493 | $10,338 |
|---|
8/23 | $8,142 | $9,701 |
|---|
9/23 | $7,773 | $9,447 |
|---|
10/23 | $7,450 | $9,080 |
|---|
11/23 | $7,915 | $9,807 |
|---|
12/23 | $8,104 | $10,190 |
|---|
1/24 | $7,583 | $9,717 |
|---|
2/24 | $8,047 | $10,179 |
|---|
3/24 | $8,265 | $10,431 |
|---|
4/24 | $8,578 | $10,478 |
|---|
5/24 | $8,806 | $10,537 |
|---|
6/24 | $8,720 | $10,953 |
|---|
7/24 | $8,559 | $10,985 |
|---|
8/24 | $8,967 | $11,163 |
|---|
9/24 | $9,943 | $11,908 |
|---|
10/24 | $9,905 | $11,379 |
|---|
11/24 | $9,886 | $10,970 |
|---|
12/24 | $9,433 | $10,955 |
|---|
|
|
| Average Annual Return [Table Text Block] |
AATR | 1 Year | Since 2/14/20
(Inception) |
|---|
Class A | 16.40% | (0.10)% |
|---|
Class A, with 5.25% maximum front end sales charge | 10.33% | (1.19)% |
|---|
MSCI Emerging Markets Net Index | 7.50% | 1.89% |
|---|
|
|
| Performance Inception Date |
Feb. 14, 2020
|
|
| AssetsNet |
$ 30,908,547
|
|
| Holdings Count | Holding |
31
|
|
| Advisory Fees Paid, Amount |
$ 13,966
|
|
| InvestmentCompanyPortfolioTurnover |
29.00%
|
|
| Additional Fund Statistics [Text Block] |
Total Net Assets | $30,908,547 |
|---|
# of Portfolio Holdings | 31 |
|---|
Portfolio Turnover Rate | 29% |
|---|
Total Advisory Fees Paid | $13,966 |
|---|
|
|
| Holdings [Text Block] |
Country Weightings (% of total investments)Value | Value |
|---|
Poland | 1.0% | Singapore | 3.8% | Taiwan | 5.4% | Brazil | 6.3% | United States | 6.9% | Korea, Republic of | 11.2% | India | 26.5% | China | 38.9% |
Top Ten Holdings (% of total investments)Footnote ReferenceaMercadoLibre, Inc. | 6.9% | Trip.com Group Ltd. | 6.8% | Meituan | 6.4% | ICICI Bank Ltd. | 6.2% | Coupang, Inc. | 6.0% | Taiwan Semiconductor Manufacturing Co. Ltd. | 5.4% | HDFC Bank Ltd. | 5.0% | Zomato Ltd. | 4.9% | Grab Holdings Ltd. | 3.8% | Tencent Holdings Ltd. | 3.7% | Total | 55.1% |
| Footnote | Description | Footnotea | Excluding cash equivalents. |
|
|
| Material Fund Change [Text Block] |
|
|
| Updated Prospectus Web Address |
<span style="box-sizing: border-box; color: rgb(0, 0, 0); display: inline; flex-wrap: nowrap; font-size: 10.6667px; font-weight: 400; grid-area: auto; line-height: 16px; margin: 0px; overflow: visible; text-align: left;">www.morganstanley.com/im/shareholderreports</span>
|
|
| C000216357 |
|
|
| Shareholder Report [Line Items] |
|
|
| Fund Name |
Morgan Stanley Institutional Fund, Inc. - Developing Opportunity Portfolio
|
|
| Class Name |
Class C
|
|
| Trading Symbol |
MDOBX
|
|
| Annual or Semi-Annual Statement [Text Block] |
This annual shareholder report contains important information about Morgan Stanley Institutional Fund, Inc. - Developing Opportunity Portfolio for the period of January 1, 2024 to December 31, 2024.
|
|
| Shareholder Report Annual or Semi-Annual |
Annual Shareholder Report
|
|
| Additional Information [Text Block] |
You can find additional information about the Fund at www.morganstanley.com/im/shareholderreports. You can also request this information by contacting us at 1-800-869-6397.
|
|
| Additional Information Phone Number |
1-800-869-6397
|
|
| Additional Information Website |
<span style="box-sizing: border-box; color: rgb(0, 0, 0); display: inline; flex-wrap: nowrap; font-size: 10.6667px; font-weight: 400; grid-area: auto; line-height: 16px; margin: 0px; overflow: visible; text-align: left;">www.morganstanley.com/im/shareholderreports</span>
|
|
| Expenses [Text Block] |
What were the Fund costs for the last year?(based on a hypothetical $10,000 investment) Class Name | Costs of a $10,000 investment | Costs paid as a percentage of a $10,000 investment |
|---|
Class C | $243 | 2.25% |
|---|
|
|
| Expenses Paid, Amount |
$ 243
|
|
| Expense Ratio, Percent |
2.25%
|
|
| Factors Affecting Performance [Text Block] |
How did the Fund perform last year and what affected its performance?Key contributors to (↑) and detractors from (↓) performance, relative to the MSCI Emerging Markets Net Index: ↑ Stock selection in consumer discretionary, led by a Chinese online travel agency, which was the largest positive contributor in the portfolio ↑ Stock selection in industrials, led by a holding in an operator of a Southeast Asian super app (an integrated app platform combining multiple services) ↑ An underweight allocation to materials ↓ An underweight allocation to information technology, where a holding in an Argentinian IT services company was the main detractor ↓ Stock selection in communication services, where a Korean search engine was the largest detractor in the portfolio ↓ An underweight allocation to utilities, where exposure to a Brazilian water management company was the main detractor |
|
| Line Graph [Table Text Block] |
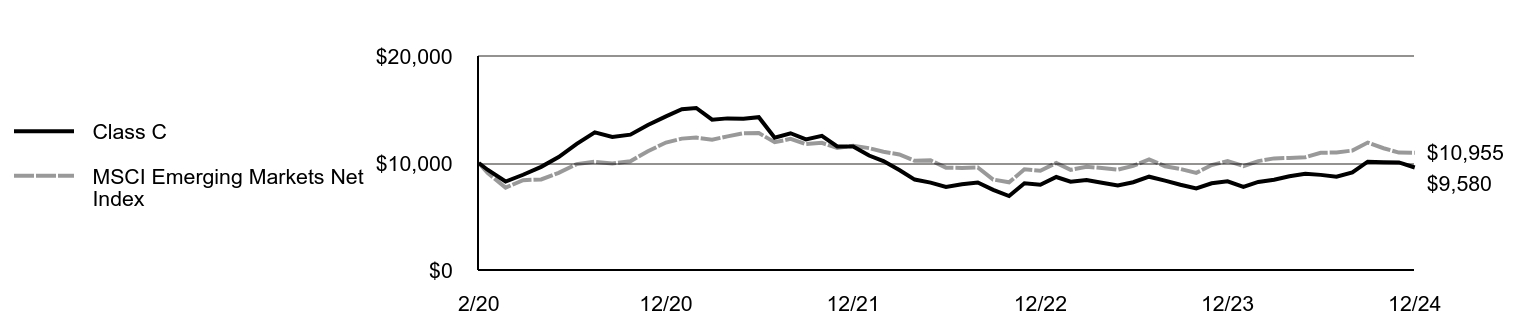 | Class C | MSCI Emerging Markets Net Index |
|---|
2/20 | $10,000 | $10,000 |
|---|
2/20 | $9,370 | $9,095 |
|---|
3/20 | $8,270 | $7,694 |
|---|
4/20 | $8,900 | $8,398 |
|---|
5/20 | $9,640 | $8,463 |
|---|
6/20 | $10,560 | $9,085 |
|---|
7/20 | $11,790 | $9,897 |
|---|
8/20 | $12,860 | $10,116 |
|---|
9/20 | $12,440 | $9,953 |
|---|
10/20 | $12,650 | $10,158 |
|---|
11/20 | $13,550 | $11,098 |
|---|
12/20 | $14,360 | $11,914 |
|---|
1/21 | $15,020 | $12,279 |
|---|
2/21 | $15,140 | $12,373 |
|---|
3/21 | $14,050 | $12,186 |
|---|
4/21 | $14,170 | $12,489 |
|---|
5/21 | $14,130 | $12,779 |
|---|
6/21 | $14,280 | $12,801 |
|---|
7/21 | $12,360 | $11,940 |
|---|
8/21 | $12,780 | $12,252 |
|---|
9/21 | $12,200 | $11,765 |
|---|
10/21 | $12,540 | $11,881 |
|---|
11/21 | $11,550 | $11,397 |
|---|
12/21 | $11,550 | $11,611 |
|---|
1/22 | $10,700 | $11,391 |
|---|
2/22 | $10,180 | $11,051 |
|---|
3/22 | $9,340 | $10,801 |
|---|
4/22 | $8,450 | $10,200 |
|---|
5/22 | $8,170 | $10,245 |
|---|
6/22 | $7,760 | $9,564 |
|---|
7/22 | $8,010 | $9,541 |
|---|
8/22 | $8,180 | $9,581 |
|---|
9/22 | $7,490 | $8,458 |
|---|
10/22 | $6,910 | $8,195 |
|---|
11/22 | $8,100 | $9,410 |
|---|
12/22 | $7,960 | $9,278 |
|---|
1/23 | $8,690 | $10,011 |
|---|
2/23 | $8,250 | $9,362 |
|---|
3/23 | $8,410 | $9,645 |
|---|
4/23 | $8,150 | $9,536 |
|---|
5/23 | $7,900 | $9,376 |
|---|
6/23 | $8,200 | $9,732 |
|---|
7/23 | $8,720 | $10,338 |
|---|
8/23 | $8,350 | $9,701 |
|---|
9/23 | $7,970 | $9,447 |
|---|
10/23 | $7,630 | $9,080 |
|---|
11/23 | $8,100 | $9,807 |
|---|
12/23 | $8,290 | $10,190 |
|---|
1/24 | $7,760 | $9,717 |
|---|
2/24 | $8,230 | $10,179 |
|---|
3/24 | $8,440 | $10,431 |
|---|
4/24 | $8,760 | $10,478 |
|---|
5/24 | $8,990 | $10,537 |
|---|
6/24 | $8,890 | $10,953 |
|---|
7/24 | $8,720 | $10,985 |
|---|
8/24 | $9,130 | $11,163 |
|---|
9/24 | $10,120 | $11,908 |
|---|
10/24 | $10,070 | $11,379 |
|---|
11/24 | $10,050 | $10,970 |
|---|
12/24 | $9,580 | $10,955 |
|---|
|
|
| Average Annual Return [Table Text Block] |
AATR | 1 Year | Since 2/14/20
(Inception) |
|---|
Class C | 15.56% | (0.88)% |
|---|
Class C, with 1% maximum contingent deferred sales charge | 14.56% | (0.88)% |
|---|
MSCI Emerging Markets Net Index | 7.50% | 1.89% |
|---|
|
|
| Performance Inception Date |
Feb. 14, 2020
|
|
| AssetsNet |
$ 30,908,547
|
|
| Holdings Count | Holding |
31
|
|
| Advisory Fees Paid, Amount |
$ 13,966
|
|
| InvestmentCompanyPortfolioTurnover |
29.00%
|
|
| Additional Fund Statistics [Text Block] |
Total Net Assets | $30,908,547 |
|---|
# of Portfolio Holdings | 31 |
|---|
Portfolio Turnover Rate | 29% |
|---|
Total Advisory Fees Paid | $13,966 |
|---|
|
|
| Holdings [Text Block] |
Country Weightings (% of total investments)Value | Value |
|---|
Poland | 1.0% | Singapore | 3.8% | Taiwan | 5.4% | Brazil | 6.3% | United States | 6.9% | Korea, Republic of | 11.2% | India | 26.5% | China | 38.9% |
Top Ten Holdings (% of total investments)Footnote ReferenceaMercadoLibre, Inc. | 6.9% | Trip.com Group Ltd. | 6.8% | Meituan | 6.4% | ICICI Bank Ltd. | 6.2% | Coupang, Inc. | 6.0% | Taiwan Semiconductor Manufacturing Co. Ltd. | 5.4% | HDFC Bank Ltd. | 5.0% | Zomato Ltd. | 4.9% | Grab Holdings Ltd. | 3.8% | Tencent Holdings Ltd. | 3.7% | Total | 55.1% |
| Footnote | Description | Footnotea | Excluding cash equivalents. |
|
|
| Material Fund Change [Text Block] |
|
|
| Updated Prospectus Web Address |
<span style="box-sizing: border-box; color: rgb(0, 0, 0); display: inline; flex-wrap: nowrap; font-size: 10.6667px; font-weight: 400; grid-area: auto; line-height: 16px; margin: 0px; overflow: visible; text-align: left;">www.morganstanley.com/im/shareholderreports</span>
|
|
| C000216354 |
|
|
| Shareholder Report [Line Items] |
|
|
| Fund Name |
Morgan Stanley Institutional Fund, Inc. - Developing Opportunity Portfolio
|
|
| Class Name |
Class I
|
|
| Trading Symbol |
MDOEX
|
|
| Annual or Semi-Annual Statement [Text Block] |
This annual shareholder report contains important information about Morgan Stanley Institutional Fund, Inc. - Developing Opportunity Portfolio for the period of January 1, 2024 to December 31, 2024.
|
|
| Shareholder Report Annual or Semi-Annual |
Annual Shareholder Report
|
|
| Additional Information [Text Block] |
You can find additional information about the Fund at www.morganstanley.com/im/shareholderreports. You can also request this information by contacting us at 1-800-869-6397.
|
|
| Additional Information Phone Number |
1-800-869-6397
|
|
| Additional Information Website |
<span style="box-sizing: border-box; color: rgb(0, 0, 0); display: inline; flex-wrap: nowrap; font-size: 10.6667px; font-weight: 400; grid-area: auto; line-height: 16px; margin: 0px; overflow: visible; text-align: left;">www.morganstanley.com/im/shareholderreports</span>
|
|
| Expenses [Text Block] |
What were the Fund costs for the last year?(based on a hypothetical $10,000 investment) Class Name | Costs of a $10,000 investment | Costs paid as a percentage of a $10,000 investment |
|---|
Class I | $125 | 1.15% |
|---|
|
|
| Expenses Paid, Amount |
$ 125
|
|
| Expense Ratio, Percent |
1.15%
|
|
| Factors Affecting Performance [Text Block] |
How did the Fund perform last year and what affected its performance?Key contributors to (↑) and detractors from (↓) performance, relative to the MSCI Emerging Markets Net Index: ↑ Stock selection in consumer discretionary, led by a Chinese online travel agency, which was the largest positive contributor in the portfolio ↑ Stock selection in industrials, led by a holding in an operator of a Southeast Asian super app (an integrated app platform combining multiple services) ↑ An underweight allocation to materials ↓ An underweight allocation to information technology, where a holding in an Argentinian IT services company was the main detractor ↓ Stock selection in communication services, where a Korean search engine was the largest detractor in the portfolio ↓ An underweight allocation to utilities, where exposure to a Brazilian water management company was the main detractor |
|
| Line Graph [Table Text Block] |
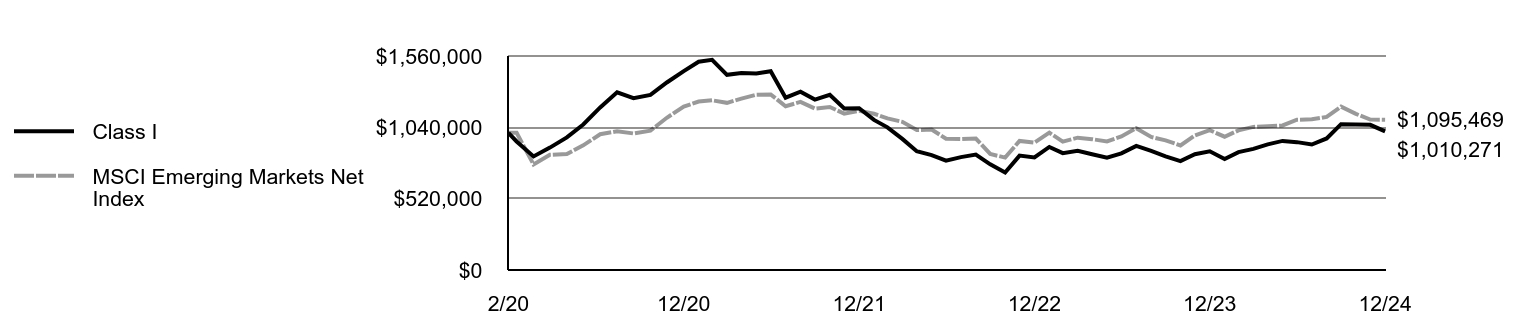 | Class I | MSCI Emerging Markets Net Index |
|---|
2/20 | $1,000,000 | $1,000,000 |
|---|
2/20 | $937,000 | $1,000,000 |
|---|
3/20 | $828,000 | $769,381 |
|---|
4/20 | $892,000 | $839,836 |
|---|
5/20 | $967,000 | $846,287 |
|---|
6/20 | $1,061,000 | $908,497 |
|---|
7/20 | $1,185,000 | $989,682 |
|---|
8/20 | $1,295,000 | $1,011,558 |
|---|
9/20 | $1,253,000 | $995,334 |
|---|
10/20 | $1,276,000 | $1,015,840 |
|---|
11/20 | $1,367,000 | $1,109,793 |
|---|
12/20 | $1,450,000 | $1,191,378 |
|---|
1/21 | $1,518,000 | $1,227,903 |
|---|
2/21 | $1,532,000 | $1,237,294 |
|---|
3/21 | $1,423,000 | $1,218,608 |
|---|
4/21 | $1,436,000 | $1,248,949 |
|---|
5/21 | $1,433,000 | $1,277,912 |
|---|
6/21 | $1,449,000 | $1,280,115 |
|---|
7/21 | $1,256,000 | $1,193,965 |
|---|
8/21 | $1,300,000 | $1,225,217 |
|---|
9/21 | $1,242,000 | $1,176,526 |
|---|
10/21 | $1,277,000 | $1,188,130 |
|---|
11/21 | $1,177,000 | $1,139,710 |
|---|
12/21 | $1,179,000 | $1,161,095 |
|---|
1/22 | $1,094,000 | $1,139,117 |
|---|
2/22 | $1,040,000 | $1,105,068 |
|---|
3/22 | $956,000 | $1,080,109 |
|---|
4/22 | $866,000 | $1,020,027 |
|---|
5/22 | $838,000 | $1,024,518 |
|---|
6/22 | $797,000 | $956,439 |
|---|
7/22 | $823,000 | $954,090 |
|---|
8/22 | $841,000 | $958,073 |
|---|
9/22 | $770,000 | $845,756 |
|---|
10/22 | $711,000 | $819,496 |
|---|
11/22 | $834,000 | $941,042 |
|---|
12/22 | $821,000 | $927,815 |
|---|
1/23 | $897,000 | $1,001,077 |
|---|
2/23 | $852,000 | $936,165 |
|---|
3/23 | $869,000 | $964,518 |
|---|
4/23 | $844,000 | $953,588 |
|---|
5/23 | $819,000 | $937,571 |
|---|
6/23 | $850,000 | $973,171 |
|---|
7/23 | $905,000 | $1,033,752 |
|---|
8/23 | $868,000 | $970,073 |
|---|
9/23 | $828,000 | $944,703 |
|---|
10/23 | $794,000 | $907,997 |
|---|
11/23 | $844,000 | $980,664 |
|---|
12/23 | $865,000 | $1,019,002 |
|---|
1/24 | $809,000 | $971,686 |
|---|
2/24 | $859,000 | $1,017,912 |
|---|
3/24 | $883,000 | $1,043,135 |
|---|
4/24 | $916,000 | $1,047,802 |
|---|
5/24 | $941,000 | $1,053,720 |
|---|
6/24 | $932,000 | $1,095,283 |
|---|
7/24 | $915,000 | $1,098,543 |
|---|
8/24 | $959,000 | $1,116,279 |
|---|
9/24 | $1,063,000 | $1,190,819 |
|---|
10/24 | $1,060,000 | $1,137,859 |
|---|
11/24 | $1,058,000 | $1,096,976 |
|---|
12/24 | $1,010,271 | $1,095,469 |
|---|
|
|
| Average Annual Return [Table Text Block] |
AATR | 1 Year | Since 2/14/20
(Inception) |
|---|
Class I | 16.79% | 0.21% |
|---|
MSCI Emerging Markets Net Index | 7.50% | 1.89% |
|---|
|
|
| Performance Inception Date |
Feb. 14, 2020
|
|
| AssetsNet |
$ 30,908,547
|
|
| Holdings Count | Holding |
31
|
|
| Advisory Fees Paid, Amount |
$ 13,966
|
|
| InvestmentCompanyPortfolioTurnover |
29.00%
|
|
| Additional Fund Statistics [Text Block] |
Total Net Assets | $30,908,547 |
|---|
# of Portfolio Holdings | 31 |
|---|
Portfolio Turnover Rate | 29% |
|---|
Total Advisory Fees Paid | $13,966 |
|---|
|
|
| Holdings [Text Block] |
Country Weightings (% of total investments)Value | Value |
|---|
Poland | 1.0% | Singapore | 3.8% | Taiwan | 5.4% | Brazil | 6.3% | United States | 6.9% | Korea, Republic of | 11.2% | India | 26.5% | China | 38.9% |
Top Ten Holdings (% of total investments)Footnote ReferenceaMercadoLibre, Inc. | 6.9% | Trip.com Group Ltd. | 6.8% | Meituan | 6.4% | ICICI Bank Ltd. | 6.2% | Coupang, Inc. | 6.0% | Taiwan Semiconductor Manufacturing Co. Ltd. | 5.4% | HDFC Bank Ltd. | 5.0% | Zomato Ltd. | 4.9% | Grab Holdings Ltd. | 3.8% | Tencent Holdings Ltd. | 3.7% | Total | 55.1% |
| Footnote | Description | Footnotea | Excluding cash equivalents. |
|
|
| Material Fund Change [Text Block] |
|
|
| Updated Prospectus Web Address |
<span style="box-sizing: border-box; color: rgb(0, 0, 0); display: inline; flex-wrap: nowrap; font-size: 10.6667px; font-weight: 400; grid-area: auto; line-height: 16px; margin: 0px; overflow: visible; text-align: left;">www.morganstanley.com/im/shareholderreports</span>
|
|
| C000216356 |
|
|
| Shareholder Report [Line Items] |
|
|
| Fund Name |
Morgan Stanley Institutional Fund, Inc. - Developing Opportunity Portfolio
|
|
| Class Name |
Class R6
|
|
| Trading Symbol |
MDODX
|
|
| Annual or Semi-Annual Statement [Text Block] |
This annual shareholder report contains important information about Morgan Stanley Institutional Fund, Inc. - Developing Opportunity Portfolio for the period of January 1, 2024 to December 31, 2024.
|
|
| Shareholder Report Annual or Semi-Annual |
Annual Shareholder Report
|
|
| Additional Information [Text Block] |
You can find additional information about the Fund at www.morganstanley.com/im/shareholderreports. You can also request this information by contacting us at 1-800-869-6397.
|
|
| Additional Information Phone Number |
1-800-869-6397
|
|
| Additional Information Website |
<span style="box-sizing: border-box; color: rgb(0, 0, 0); display: inline; flex-wrap: nowrap; font-size: 10.6667px; font-weight: 400; grid-area: auto; line-height: 16px; margin: 0px; overflow: visible; text-align: left;">www.morganstanley.com/im/shareholderreports</span>
|
|
| Expenses [Text Block] |
What were the Fund costs for the last year?(based on a hypothetical $10,000 investment) Class Name | Costs of a $10,000 investment | Costs paid as a percentage of a $10,000 investment |
|---|
Class R6 | $119 | 1.10% |
|---|
|
|
| Expenses Paid, Amount |
$ 119
|
|
| Expense Ratio, Percent |
1.10%
|
|
| Factors Affecting Performance [Text Block] |
How did the Fund perform last year and what affected its performance?Key contributors to (↑) and detractors from (↓) performance, relative to the MSCI Emerging Markets Net Index: ↑ Stock selection in consumer discretionary, led by a Chinese online travel agency, which was the largest positive contributor in the portfolio ↑ Stock selection in industrials, led by a holding in an operator of a Southeast Asian super app (an integrated app platform combining multiple services) ↑ An underweight allocation to materials ↓ An underweight allocation to information technology, where a holding in an Argentinian IT services company was the main detractor ↓ Stock selection in communication services, where a Korean search engine was the largest detractor in the portfolio ↓ An underweight allocation to utilities, where exposure to a Brazilian water management company was the main detractor |
|
| Line Graph [Table Text Block] |
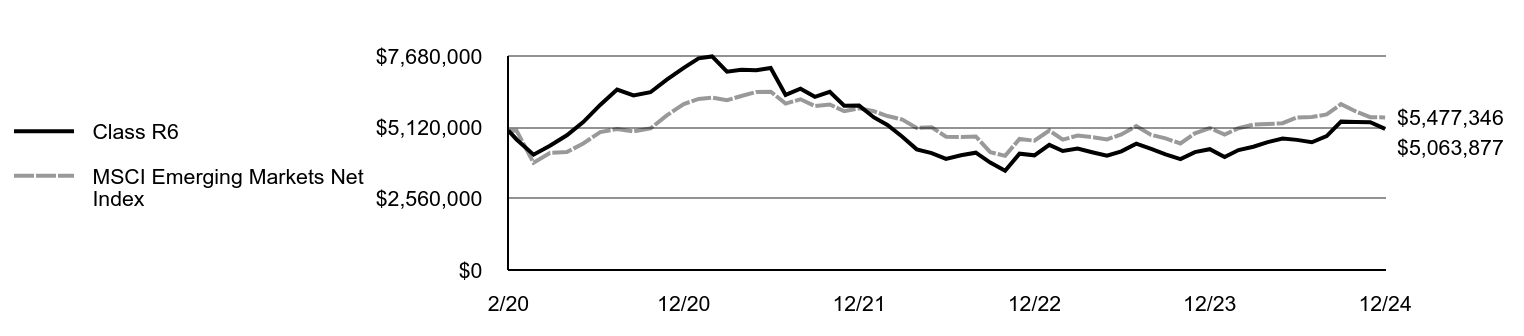 | Class R6 | MSCI Emerging Markets Net Index |
|---|
2/20 | $5,000,000 | $5,000,000 |
|---|
2/20 | $4,685,000 | $5,000,000 |
|---|
3/20 | $4,140,000 | $3,846,906 |
|---|
4/20 | $4,460,000 | $4,199,182 |
|---|
5/20 | $4,835,000 | $4,231,435 |
|---|
6/20 | $5,310,000 | $4,542,484 |
|---|
7/20 | $5,925,000 | $4,948,409 |
|---|
8/20 | $6,475,000 | $5,057,791 |
|---|
9/20 | $6,265,000 | $4,976,668 |
|---|
10/20 | $6,380,000 | $5,079,202 |
|---|
11/20 | $6,835,000 | $5,548,965 |
|---|
12/20 | $7,255,000 | $5,956,888 |
|---|
1/21 | $7,595,000 | $6,139,513 |
|---|
2/21 | $7,665,000 | $6,186,472 |
|---|
3/21 | $7,115,000 | $6,093,041 |
|---|
4/21 | $7,185,000 | $6,244,744 |
|---|
5/21 | $7,170,000 | $6,389,561 |
|---|
6/21 | $7,250,000 | $6,400,573 |
|---|
7/21 | $6,285,000 | $5,969,824 |
|---|
8/21 | $6,505,000 | $6,126,086 |
|---|
9/21 | $6,215,000 | $5,882,631 |
|---|
10/21 | $6,395,000 | $5,940,651 |
|---|
11/21 | $5,895,000 | $5,698,550 |
|---|
12/21 | $5,900,000 | $5,805,475 |
|---|
1/22 | $5,475,000 | $5,695,583 |
|---|
2/22 | $5,205,000 | $5,525,341 |
|---|
3/22 | $4,785,000 | $5,400,547 |
|---|
4/22 | $4,330,000 | $5,100,134 |
|---|
5/22 | $4,195,000 | $5,122,590 |
|---|
6/22 | $3,990,000 | $4,782,196 |
|---|
7/22 | $4,120,000 | $4,770,448 |
|---|
8/22 | $4,210,000 | $4,790,363 |
|---|
9/22 | $3,855,000 | $4,228,778 |
|---|
10/22 | $3,560,000 | $4,097,482 |
|---|
11/22 | $4,175,000 | $4,705,211 |
|---|
12/22 | $4,115,000 | $4,639,076 |
|---|
1/23 | $4,490,000 | $5,005,384 |
|---|
2/23 | $4,270,000 | $4,680,823 |
|---|
3/23 | $4,355,000 | $4,822,592 |
|---|
4/23 | $4,225,000 | $4,767,940 |
|---|
5/23 | $4,100,000 | $4,687,856 |
|---|
6/23 | $4,260,000 | $4,865,853 |
|---|
7/23 | $4,535,000 | $5,168,759 |
|---|
8/23 | $4,345,000 | $4,850,363 |
|---|
9/23 | $4,150,000 | $4,723,515 |
|---|
10/23 | $3,980,000 | $4,539,984 |
|---|
11/23 | $4,230,000 | $4,903,319 |
|---|
12/23 | $4,335,000 | $5,095,010 |
|---|
1/24 | $4,055,000 | $4,858,430 |
|---|
2/24 | $4,305,000 | $5,089,558 |
|---|
3/24 | $4,425,000 | $5,215,675 |
|---|
4/24 | $4,590,000 | $5,239,011 |
|---|
5/24 | $4,720,000 | $5,268,602 |
|---|
6/24 | $4,670,000 | $5,476,415 |
|---|
7/24 | $4,585,000 | $5,492,713 |
|---|
8/24 | $4,805,000 | $5,581,395 |
|---|
9/24 | $5,330,000 | $5,954,093 |
|---|
10/24 | $5,315,000 | $5,689,295 |
|---|
11/24 | $5,305,000 | $5,484,878 |
|---|
12/24 | $5,063,877 | $5,477,346 |
|---|
|
|
| Average Annual Return [Table Text Block] |
AATR | 1 Year | Since 2/14/20
(Inception) |
|---|
Class R6 | 16.81% | 0.26% |
|---|
MSCI Emerging Markets Net Index | 7.50% | 1.89% |
|---|
|
|
| Performance Inception Date |
Feb. 14, 2020
|
|
| AssetsNet |
$ 30,908,547
|
|
| Holdings Count | Holding |
31
|
|
| Advisory Fees Paid, Amount |
$ 13,966
|
|
| InvestmentCompanyPortfolioTurnover |
29.00%
|
|
| Additional Fund Statistics [Text Block] |
Total Net Assets | $30,908,547 |
|---|
# of Portfolio Holdings | 31 |
|---|
Portfolio Turnover Rate | 29% |
|---|
Total Advisory Fees Paid | $13,966 |
|---|
|
|
| Holdings [Text Block] |
Country Weightings (% of total investments)Value | Value |
|---|
Poland | 1.0% | Singapore | 3.8% | Taiwan | 5.4% | Brazil | 6.3% | United States | 6.9% | Korea, Republic of | 11.2% | India | 26.5% | China | 38.9% |
Top Ten Holdings (% of total investments)Footnote ReferenceaMercadoLibre, Inc. | 6.9% | Trip.com Group Ltd. | 6.8% | Meituan | 6.4% | ICICI Bank Ltd. | 6.2% | Coupang, Inc. | 6.0% | Taiwan Semiconductor Manufacturing Co. Ltd. | 5.4% | HDFC Bank Ltd. | 5.0% | Zomato Ltd. | 4.9% | Grab Holdings Ltd. | 3.8% | Tencent Holdings Ltd. | 3.7% | Total | 55.1% |
| Footnote | Description | Footnotea | Excluding cash equivalents. |
|
|
| Material Fund Change [Text Block] |
|
|
| Updated Prospectus Web Address |
<span style="box-sizing: border-box; color: rgb(0, 0, 0); display: inline; flex-wrap: nowrap; font-size: 10.6667px; font-weight: 400; grid-area: auto; line-height: 16px; margin: 0px; overflow: visible; text-align: left;">www.morganstanley.com/im/shareholderreports</span>
|
|
| C000236912 |
|
|
| Shareholder Report [Line Items] |
|
|
| Fund Name |
Morgan Stanley Institutional Fund, Inc. - Emerging Markets ex China Portfolio
|
|
| Class Name |
Class A
|
|
| Trading Symbol |
MSDQX
|
|
| Annual or Semi-Annual Statement [Text Block] |
This annual shareholder report contains important information about Morgan Stanley Institutional Fund, Inc. - Emerging Markets ex China Portfolio for the period of January 1, 2024 to December 31, 2024.
|
|
| Shareholder Report Annual or Semi-Annual |
Annual Shareholder Report
|
|
| Additional Information [Text Block] |
You can find additional information about the Fund at www.morganstanley.com/im/shareholderreports. You can also request this information by contacting us at 1-800-869-6397.
|
|
| Additional Information Phone Number |
1-800-869-6397
|
|
| Additional Information Website |
<span style="box-sizing: border-box; color: rgb(0, 0, 0); display: inline; flex-wrap: nowrap; font-size: 10.6667px; font-weight: 400; grid-area: auto; line-height: 16px; margin: 0px; overflow: visible; text-align: left;">www.morganstanley.com/im/shareholderreports</span>
|
|
| Expenses [Text Block] |
What were the Fund costs for the last year?(based on a hypothetical $10,000 investment) Class Name | Costs of a $10,000 investment | Costs paid as a percentage of a $10,000 investment |
|---|
Class A | $138 | 1.35% |
|---|
|
|
| Expenses Paid, Amount |
$ 138
|
|
| Expense Ratio, Percent |
1.35%
|
|
| Factors Affecting Performance [Text Block] |
How did the Fund perform last year and what affected its performance?Key contributors to (↑) and detractors from (↓) performance, relative to the MSCI Emerging Markets ex China Net Index: ↑ The underweight allocation to and positioning in Korea, where equities underperformed on currency weakness and political volatility ↑ Positioning in India, through allocations to select auto manufacturers, an online travel company and a hospital operator ↑ Stock selection in South Africa, through the allocation to a leading digital bank and select insurance and consumer goods companies ↓ Positioning in Poland, as the allocation to an apparel retailer (sold) underperformed following a short-seller report ↓ Overweight allocations to Mexico, which sold off following both the Mexico and U.S. elections, and Brazil, which underperformed on budget and fiscal risks ↓ Zero allocation to the United Arab Emirates |
|
| Line Graph [Table Text Block] |
| Class A with maximum sales charge | MSCI Emerging Markets ex China Net Index |
|---|
9/22 | $9,479 | $10,000 |
|---|
10/22 | $9,934 | $10,315 |
|---|
11/22 | $10,938 | $11,280 |
|---|
12/22 | $10,313 | $10,798 |
|---|
1/23 | $11,156 | $11,450 |
|---|
2/23 | $10,540 | $10,932 |
|---|
3/23 | $10,749 | $11,186 |
|---|
4/23 | $10,787 | $11,278 |
|---|
5/23 | $10,910 | $11,436 |
|---|
6/23 | $11,441 | $11,862 |
|---|
7/23 | $11,829 | $12,377 |
|---|
8/23 | $11,270 | $11,768 |
|---|
9/23 | $11,024 | $11,467 |
|---|
10/23 | $10,720 | $11,040 |
|---|
11/23 | $11,725 | $12,182 |
|---|
12/23 | $12,488 | $12,961 |
|---|
1/24 | $12,237 | $12,638 |
|---|
2/24 | $12,670 | $13,087 |
|---|
3/24 | $13,183 | $13,480 |
|---|
4/24 | $13,102 | $13,262 |
|---|
5/24 | $13,273 | $13,249 |
|---|
6/24 | $14,048 | $14,052 |
|---|
7/24 | $13,998 | $14,170 |
|---|
8/24 | $13,968 | $14,427 |
|---|
9/24 | $14,109 | $14,608 |
|---|
10/24 | $13,595 | $14,042 |
|---|
11/24 | $13,364 | $13,583 |
|---|
12/24 | $13,105 | $13,422 |
|---|
|
|
| Average Annual Return [Table Text Block] |
AATR | 1 Year | Since 9/30/22
(Inception) |
|---|
Class A | 4.94% | 15.47% |
|---|
Class A, with 5.25% maximum front end sales charge | (0.59)% | 12.76% |
|---|
MSCI Emerging Markets ex China Net Index | 3.56% | 13.96% |
|---|
|
|
| Performance Inception Date |
Sep. 30, 2022
|
|
| AssetsNet |
$ 6,969,773
|
|
| Holdings Count | Holding |
81
|
|
| Advisory Fees Paid, Amount |
$ 0
|
|
| InvestmentCompanyPortfolioTurnover |
32.00%
|
|
| Additional Fund Statistics [Text Block] |
Total Net Assets | $6,969,773 |
|---|
# of Portfolio Holdings | 81 |
|---|
Portfolio Turnover Rate | 32% |
|---|
Total Advisory Fees Paid (Net of Waivers) | $0 |
|---|
|
|
| Holdings [Text Block] |
Country Weightings (% of total investments)Value | Value |
|---|
Other | 6.3% | United Kingdom | 1.3% | Malaysia | 1.8% | Poland | 3.1% | Mexico | 4.3% | Indonesia | 4.7% | Brazil | 5.1% | South Africa | 6.2% | Korea, Republic of | 8.8% | Taiwan | 27.0% | India | 31.4% |
Top Ten Holdings (% of total investments)Footnote ReferenceaTaiwan Semiconductor Manufacturing Co. Ltd. | 17.3% | Samsung Electronics Co. Ltd. | 3.2% | HDFC Bank Ltd. | 3.1% | ICICI Bank Ltd. | 3.1% | Mahindra & Mahindra Ltd. | 2.9% | Reliance Industries Ltd. | 2.6% | Infosys Ltd. | 2.3% | State Bank of India | 2.3% | Capitec Bank Holdings Ltd. | 2.1% | Hon Hai Precision Industry Co. Ltd. | 2.1% | Total | 41.0% |
| Footnote | Description | Footnotea | Excluding cash equivalents. |
|
|
| Material Fund Change [Text Block] |
|
|
| Updated Prospectus Web Address |
<span style="box-sizing: border-box; color: rgb(0, 0, 0); display: inline; flex-wrap: nowrap; font-size: 10.6667px; font-weight: 400; grid-area: auto; line-height: 16px; margin: 0px; overflow: visible; text-align: left;">www.morganstanley.com/im/shareholderreports</span>
|
|
| C000236913 |
|
|
| Shareholder Report [Line Items] |
|
|
| Fund Name |
Morgan Stanley Institutional Fund, Inc. - Emerging Markets ex China Portfolio
|
|
| Class Name |
Class C
|
|
| Trading Symbol |
MSDOX
|
|
| Annual or Semi-Annual Statement [Text Block] |
This annual shareholder report contains important information about Morgan Stanley Institutional Fund, Inc. - Emerging Markets ex China Portfolio for the period of January 1, 2024 to December 31, 2024.
|
|
| Shareholder Report Annual or Semi-Annual |
Annual Shareholder Report
|
|
| Additional Information [Text Block] |
You can find additional information about the Fund at www.morganstanley.com/im/shareholderreports. You can also request this information by contacting us at 1-800-869-6397.
|
|
| Additional Information Phone Number |
1-800-869-6397
|
|
| Additional Information Website |
<span style="box-sizing: border-box; color: rgb(0, 0, 0); display: inline; flex-wrap: nowrap; font-size: 10.6667px; font-weight: 400; grid-area: auto; line-height: 16px; margin: 0px; overflow: visible; text-align: left;">www.morganstanley.com/im/shareholderreports</span>
|
|
| Expenses [Text Block] |
What were the Fund costs for the last year?(based on a hypothetical $10,000 investment) Class Name | Costs of a $10,000 investment | Costs paid as a percentage of a $10,000 investment |
|---|
Class C | $214 | 2.10% |
|---|
|
|
| Expenses Paid, Amount |
$ 214
|
|
| Expense Ratio, Percent |
2.10%
|
|
| Factors Affecting Performance [Text Block] |
How did the Fund perform last year and what affected its performance?Key contributors to (↑) and detractors from (↓) performance, relative to the MSCI Emerging Markets ex China Net Index: ↑ The underweight allocation to and positioning in Korea, where equities underperformed on currency weakness and political volatility ↑ Positioning in India, through allocations to select auto manufacturers, an online travel company and a hospital operator ↑ Stock selection in South Africa, through the allocation to a leading digital bank and select insurance and consumer goods companies ↓ Positioning in Poland, as the allocation to an apparel retailer (sold) underperformed following a short-seller report ↓ Overweight allocations to Mexico, which sold off following both the Mexico and U.S. elections, and Brazil, which underperformed on budget and fiscal risks ↓ Zero allocation to the United Arab Emirates |
|
| Line Graph [Table Text Block] |
| Class C | MSCI Emerging Markets ex China Net Index |
|---|
9/22 | $10,000 | $10,000 |
|---|
10/22 | $10,470 | $10,315 |
|---|
11/22 | $11,530 | $11,280 |
|---|
12/22 | $10,860 | $10,798 |
|---|
1/23 | $11,740 | $11,450 |
|---|
2/23 | $11,090 | $10,932 |
|---|
3/23 | $11,290 | $11,186 |
|---|
4/23 | $11,330 | $11,278 |
|---|
5/23 | $11,460 | $11,436 |
|---|
6/23 | $12,000 | $11,862 |
|---|
7/23 | $12,400 | $12,377 |
|---|
8/23 | $11,810 | $11,768 |
|---|
9/23 | $11,540 | $11,467 |
|---|
10/23 | $11,220 | $11,040 |
|---|
11/23 | $12,260 | $12,182 |
|---|
12/23 | $13,056 | $12,961 |
|---|
1/24 | $12,781 | $12,638 |
|---|
2/24 | $13,224 | $13,087 |
|---|
3/24 | $13,752 | $13,480 |
|---|
4/24 | $13,657 | $13,262 |
|---|
5/24 | $13,825 | $13,249 |
|---|
6/24 | $14,627 | $14,052 |
|---|
7/24 | $14,564 | $14,170 |
|---|
8/24 | $14,522 | $14,427 |
|---|
9/24 | $14,669 | $14,608 |
|---|
10/24 | $14,121 | $14,042 |
|---|
11/24 | $13,878 | $13,583 |
|---|
12/24 | $13,602 | $13,422 |
|---|
|
|
| Average Annual Return [Table Text Block] |
AATR | 1 Year | Since 9/30/22
(Inception) |
|---|
Class C | 4.19% | 14.64% |
|---|
Class C, with 1% maximum contingent deferred sales charge | 3.20% | 14.64% |
|---|
MSCI Emerging Markets ex China Net Index | 3.56% | 13.96% |
|---|
|
|
| Performance Inception Date |
Sep. 30, 2022
|
|
| AssetsNet |
$ 6,969,773
|
|
| Holdings Count | Holding |
81
|
|
| Advisory Fees Paid, Amount |
$ 0
|
|
| InvestmentCompanyPortfolioTurnover |
32.00%
|
|
| Additional Fund Statistics [Text Block] |
Total Net Assets | $6,969,773 |
|---|
# of Portfolio Holdings | 81 |
|---|
Portfolio Turnover Rate | 32% |
|---|
Total Advisory Fees Paid (Net of Waivers) | $0 |
|---|
|
|
| Holdings [Text Block] |
Country Weightings (% of total investments)Value | Value |
|---|
Other | 6.3% | United Kingdom | 1.3% | Malaysia | 1.8% | Poland | 3.1% | Mexico | 4.3% | Indonesia | 4.7% | Brazil | 5.1% | South Africa | 6.2% | Korea, Republic of | 8.8% | Taiwan | 27.0% | India | 31.4% |
Top Ten Holdings (% of total investments)Footnote ReferenceaTaiwan Semiconductor Manufacturing Co. Ltd. | 17.3% | Samsung Electronics Co. Ltd. | 3.2% | HDFC Bank Ltd. | 3.1% | ICICI Bank Ltd. | 3.1% | Mahindra & Mahindra Ltd. | 2.9% | Reliance Industries Ltd. | 2.6% | Infosys Ltd. | 2.3% | State Bank of India | 2.3% | Capitec Bank Holdings Ltd. | 2.1% | Hon Hai Precision Industry Co. Ltd. | 2.1% | Total | 41.0% |
| Footnote | Description | Footnotea | Excluding cash equivalents. |
|
|
| Material Fund Change [Text Block] |
|
|
| Updated Prospectus Web Address |
<span style="box-sizing: border-box; color: rgb(0, 0, 0); display: inline; flex-wrap: nowrap; font-size: 10.6667px; font-weight: 400; grid-area: auto; line-height: 16px; margin: 0px; overflow: visible; text-align: left;">www.morganstanley.com/im/shareholderreports</span>
|
|
| C000236914 |
|
|
| Shareholder Report [Line Items] |
|
|
| Fund Name |
Morgan Stanley Institutional Fund, Inc. - Emerging Markets ex China Portfolio
|
|
| Class Name |
Class I
|
|
| Trading Symbol |
MSDUX
|
|
| Annual or Semi-Annual Statement [Text Block] |
This annual shareholder report contains important information about Morgan Stanley Institutional Fund, Inc. - Emerging Markets ex China Portfolio for the period of January 1, 2024 to December 31, 2024.
|
|
| Shareholder Report Annual or Semi-Annual |
Annual Shareholder Report
|
|
| Additional Information [Text Block] |
You can find additional information about the Fund at www.morganstanley.com/im/shareholderreports. You can also request this information by contacting us at 1-800-869-6397.
|
|
| Additional Information Phone Number |
1-800-869-6397
|
|
| Additional Information Website |
<span style="box-sizing: border-box; color: rgb(0, 0, 0); display: inline; flex-wrap: nowrap; font-size: 10.6667px; font-weight: 400; grid-area: auto; line-height: 16px; margin: 0px; overflow: visible; text-align: left;">www.morganstanley.com/im/shareholderreports</span>
|
|
| Expenses [Text Block] |
What were the Fund costs for the last year?(based on a hypothetical $10,000 investment) Class Name | Costs of a $10,000 investment | Costs paid as a percentage of a $10,000 investment |
|---|
Class I | $101 | 0.98% |
|---|
|
|
| Expenses Paid, Amount |
$ 101
|
|
| Expense Ratio, Percent |
0.98%
|
|
| Factors Affecting Performance [Text Block] |
How did the Fund perform last year and what affected its performance?Key contributors to (↑) and detractors from (↓) performance, relative to the MSCI Emerging Markets ex China Net Index: ↑ The underweight allocation to and positioning in Korea, where equities underperformed on currency weakness and political volatility ↑ Positioning in India, through allocations to select auto manufacturers, an online travel company and a hospital operator ↑ Stock selection in South Africa, through the allocation to a leading digital bank and select insurance and consumer goods companies ↓ Positioning in Poland, as the allocation to an apparel retailer (sold) underperformed following a short-seller report ↓ Overweight allocations to Mexico, which sold off following both the Mexico and U.S. elections, and Brazil, which underperformed on budget and fiscal risks ↓ Zero allocation to the United Arab Emirates |
|
| Line Graph [Table Text Block] |
| Class I | MSCI Emerging Markets ex China Net Index |
|---|
9/22 | $1,000,000 | $1,000,000 |
|---|
10/22 | $1,048,000 | $1,000,000 |
|---|
11/22 | $1,155,000 | $1,127,979 |
|---|
12/22 | $1,089,000 | $1,079,771 |
|---|
1/23 | $1,178,000 | $1,145,006 |
|---|
2/23 | $1,114,000 | $1,093,201 |
|---|
3/23 | $1,136,000 | $1,118,592 |
|---|
4/23 | $1,141,000 | $1,127,759 |
|---|
5/23 | $1,154,000 | $1,143,647 |
|---|
6/23 | $1,210,000 | $1,186,244 |
|---|
7/23 | $1,251,000 | $1,237,685 |
|---|
8/23 | $1,193,000 | $1,176,768 |
|---|
9/23 | $1,167,000 | $1,146,687 |
|---|
10/23 | $1,136,000 | $1,103,985 |
|---|
11/23 | $1,242,000 | $1,218,155 |
|---|
12/23 | $1,323,941 | $1,296,060 |
|---|
1/24 | $1,297,313 | $1,263,820 |
|---|
2/24 | $1,343,113 | $1,308,724 |
|---|
3/24 | $1,398,499 | $1,348,031 |
|---|
4/24 | $1,389,978 | $1,326,236 |
|---|
5/24 | $1,408,085 | $1,324,854 |
|---|
6/24 | $1,492,229 | $1,405,207 |
|---|
7/24 | $1,486,904 | $1,417,009 |
|---|
8/24 | $1,483,709 | $1,442,715 |
|---|
9/24 | $1,499,685 | $1,460,844 |
|---|
10/24 | $1,445,364 | $1,404,181 |
|---|
11/24 | $1,420,867 | $1,358,278 |
|---|
12/24 | $1,394,275 | $1,342,211 |
|---|
|
|
| Average Annual Return [Table Text Block] |
AATR | 1 Year | Since 9/30/22
(Inception) |
|---|
Class I | 5.31% | 15.90% |
|---|
MSCI Emerging Markets ex China Net Index | 3.56% | 13.96% |
|---|
|
|
| Performance Inception Date |
Sep. 30, 2022
|
|
| AssetsNet |
$ 6,969,773
|
|
| Holdings Count | Holding |
81
|
|
| Advisory Fees Paid, Amount |
$ 0
|
|
| InvestmentCompanyPortfolioTurnover |
32.00%
|
|
| Additional Fund Statistics [Text Block] |
Total Net Assets | $6,969,773 |
|---|
# of Portfolio Holdings | 81 |
|---|
Portfolio Turnover Rate | 32% |
|---|
Total Advisory Fees Paid (Net of Waivers) | $0 |
|---|
|
|
| Holdings [Text Block] |
Country Weightings (% of total investments)Value | Value |
|---|
Other | 6.3% | United Kingdom | 1.3% | Malaysia | 1.8% | Poland | 3.1% | Mexico | 4.3% | Indonesia | 4.7% | Brazil | 5.1% | South Africa | 6.2% | Korea, Republic of | 8.8% | Taiwan | 27.0% | India | 31.4% |
Top Ten Holdings (% of total investments)Footnote ReferenceaTaiwan Semiconductor Manufacturing Co. Ltd. | 17.3% | Samsung Electronics Co. Ltd. | 3.2% | HDFC Bank Ltd. | 3.1% | ICICI Bank Ltd. | 3.1% | Mahindra & Mahindra Ltd. | 2.9% | Reliance Industries Ltd. | 2.6% | Infosys Ltd. | 2.3% | State Bank of India | 2.3% | Capitec Bank Holdings Ltd. | 2.1% | Hon Hai Precision Industry Co. Ltd. | 2.1% | Total | 41.0% |
| Footnote | Description | Footnotea | Excluding cash equivalents. |
|
|
| Material Fund Change [Text Block] |
|
|
| Updated Prospectus Web Address |
<span style="box-sizing: border-box; color: rgb(0, 0, 0); display: inline; flex-wrap: nowrap; font-size: 10.6667px; font-weight: 400; grid-area: auto; line-height: 16px; margin: 0px; overflow: visible; text-align: left;">www.morganstanley.com/im/shareholderreports</span>
|
|
| C000236911 |
|
|
| Shareholder Report [Line Items] |
|
|
| Fund Name |
Morgan Stanley Institutional Fund, Inc. - Emerging Markets ex China Portfolio
|
|
| Class Name |
Class R6
|
|
| Trading Symbol |
MSDMX
|
|
| Annual or Semi-Annual Statement [Text Block] |
This annual shareholder report contains important information about Morgan Stanley Institutional Fund, Inc. - Emerging Markets ex China Portfolio for the period of January 1, 2024 to December 31, 2024.
|
|
| Shareholder Report Annual or Semi-Annual |
Annual Shareholder Report
|
|
| Additional Information [Text Block] |
You can find additional information about the Fund at www.morganstanley.com/im/shareholderreports. You can also request this information by contacting us at 1-800-869-6397.
|
|
| Additional Information Phone Number |
1-800-869-6397
|
|
| Additional Information Website |
<span style="box-sizing: border-box; color: rgb(0, 0, 0); display: inline; flex-wrap: nowrap; font-size: 10.6667px; font-weight: 400; grid-area: auto; line-height: 16px; margin: 0px; overflow: visible; text-align: left;">www.morganstanley.com/im/shareholderreports</span>
|
|
| Expenses [Text Block] |
What were the Fund costs for the last year?(based on a hypothetical $10,000 investment) Class Name | Costs of a $10,000 investment | Costs paid as a percentage of a $10,000 investment |
|---|
Class R6 | $98 | 0.95% |
|---|
|
|
| Expenses Paid, Amount |
$ 98
|
|
| Expense Ratio, Percent |
0.95%
|
|
| Factors Affecting Performance [Text Block] |
How did the Fund perform last year and what affected its performance?Key contributors to (↑) and detractors from (↓) performance, relative to the MSCI Emerging Markets ex China Net Index: ↑ The underweight allocation to and positioning in Korea, where equities underperformed on currency weakness and political volatility ↑ Positioning in India, through allocations to select auto manufacturers, an online travel company and a hospital operator ↑ Stock selection in South Africa, through the allocation to a leading digital bank and select insurance and consumer goods companies ↓ Positioning in Poland, as the allocation to an apparel retailer (sold) underperformed following a short-seller report ↓ Overweight allocations to Mexico, which sold off following both the Mexico and U.S. elections, and Brazil, which underperformed on budget and fiscal risks ↓ Zero allocation to the United Arab Emirates |
|
| Line Graph [Table Text Block] |
| Class R6 | MSCI Emerging Markets ex China Net Index |
|---|
9/22 | $5,000,000 | $5,000,000 |
|---|
10/22 | $5,240,000 | $5,000,000 |
|---|
11/22 | $5,775,000 | $5,639,894 |
|---|
12/22 | $5,445,000 | $5,398,856 |
|---|
1/23 | $5,890,000 | $5,725,032 |
|---|
2/23 | $5,570,000 | $5,466,004 |
|---|
3/23 | $5,680,000 | $5,592,959 |
|---|
4/23 | $5,705,000 | $5,638,794 |
|---|
5/23 | $5,775,000 | $5,718,234 |
|---|
6/23 | $6,050,000 | $5,931,222 |
|---|
7/23 | $6,260,000 | $6,188,423 |
|---|
8/23 | $5,965,000 | $5,883,839 |
|---|
9/23 | $5,835,000 | $5,733,436 |
|---|
10/23 | $5,680,000 | $5,519,923 |
|---|
11/23 | $6,215,000 | $6,090,776 |
|---|
12/23 | $6,621,870 | $6,480,302 |
|---|
1/24 | $6,488,686 | $6,319,102 |
|---|
2/24 | $6,717,761 | $6,543,618 |
|---|
3/24 | $6,994,783 | $6,740,156 |
|---|
4/24 | $6,952,164 | $6,631,180 |
|---|
5/24 | $7,048,056 | $6,624,272 |
|---|
6/24 | $7,463,587 | $7,026,033 |
|---|
7/24 | $7,436,951 | $7,085,046 |
|---|
8/24 | $7,420,969 | $7,213,573 |
|---|
9/24 | $7,500,879 | $7,304,219 |
|---|
10/24 | $7,229,185 | $7,020,904 |
|---|
11/24 | $7,111,984 | $6,791,388 |
|---|
12/24 | $6,975,438 | $6,711,054 |
|---|
|
|
| Average Annual Return [Table Text Block] |
AATR | 1 Year | Since 9/30/22
(Inception) |
|---|
Class R6 | 5.34% | 15.93% |
|---|
MSCI Emerging Markets ex China Net Index | 3.56% | 13.96% |
|---|
|
|
| Performance Inception Date |
Sep. 30, 2022
|
|
| AssetsNet |
$ 6,969,773
|
|
| Holdings Count | Holding |
81
|
|
| Advisory Fees Paid, Amount |
$ 0
|
|
| InvestmentCompanyPortfolioTurnover |
32.00%
|
|
| Additional Fund Statistics [Text Block] |
Total Net Assets | $6,969,773 |
|---|
# of Portfolio Holdings | 81 |
|---|
Portfolio Turnover Rate | 32% |
|---|
Total Advisory Fees Paid (Net of Waivers) | $0 |
|---|
|
|
| Holdings [Text Block] |
Country Weightings (% of total investments)Value | Value |
|---|
Other | 6.3% | United Kingdom | 1.3% | Malaysia | 1.8% | Poland | 3.1% | Mexico | 4.3% | Indonesia | 4.7% | Brazil | 5.1% | South Africa | 6.2% | Korea, Republic of | 8.8% | Taiwan | 27.0% | India | 31.4% |
Top Ten Holdings (% of total investments)Footnote ReferenceaTaiwan Semiconductor Manufacturing Co. Ltd. | 17.3% | Samsung Electronics Co. Ltd. | 3.2% | HDFC Bank Ltd. | 3.1% | ICICI Bank Ltd. | 3.1% | Mahindra & Mahindra Ltd. | 2.9% | Reliance Industries Ltd. | 2.6% | Infosys Ltd. | 2.3% | State Bank of India | 2.3% | Capitec Bank Holdings Ltd. | 2.1% | Hon Hai Precision Industry Co. Ltd. | 2.1% | Total | 41.0% |
| Footnote | Description | Footnotea | Excluding cash equivalents. |
|
|
| Material Fund Change [Text Block] |
|
|
| Updated Prospectus Web Address |
<span style="box-sizing: border-box; color: rgb(0, 0, 0); display: inline; flex-wrap: nowrap; font-size: 10.6667px; font-weight: 400; grid-area: auto; line-height: 16px; margin: 0px; overflow: visible; text-align: left;">www.morganstanley.com/im/shareholderreports</span>
|
|
| C000149048 |
|
|
| Shareholder Report [Line Items] |
|
|
| Fund Name |
Morgan Stanley Institutional Fund, Inc. - Emerging Markets Leaders Portfolio
|
|
| Class Name |
Class A
|
|
| Trading Symbol |
MELAX
|
|
| Annual or Semi-Annual Statement [Text Block] |
This annual shareholder report contains important information about Morgan Stanley Institutional Fund, Inc. - Emerging Markets Leaders Portfolio for the period of January 1, 2024 to December 31, 2024.
|
|
| Shareholder Report Annual or Semi-Annual |
Annual Shareholder Report
|
|
| Additional Information [Text Block] |
You can find additional information about the Fund at www.morganstanley.com/im/shareholderreports. You can also request this information by contacting us at 1-800-869-6397.
|
|
| Additional Information Phone Number |
1-800-869-6397
|
|
| Additional Information Website |
<span style="box-sizing: border-box; color: rgb(0, 0, 0); display: inline; flex-wrap: nowrap; font-size: 10.6667px; font-weight: 400; grid-area: auto; line-height: 16px; margin: 0px; overflow: visible; text-align: left;">www.morganstanley.com/im/shareholderreports</span>
|
|
| Expenses [Text Block] |
What were the Fund costs for the last year?(based on a hypothetical $10,000 investment) Class Name | Costs of a $10,000 investment | Costs paid as a percentage of a $10,000 investment |
|---|
Class A | $138 | 1.37% |
|---|
|
|
| Expenses Paid, Amount |
$ 138
|
|
| Expense Ratio, Percent |
1.37%
|
|
| Factors Affecting Performance [Text Block] |
How did the Fund perform last year and what affected its performance?Key contributors to (↑) and detractors from (↓) performance, relative to the MSCI Emerging Net Markets Index: ↑ Underweight allocation and stock selection in Korea, led by zero exposure to a South Korean memory chipmaker ↑ Zero exposure to Indonesia and Saudi Arabia ↑ Stock selection and underweight in real estate, led by an Indian luxury real estate developer ↓ Underweight allocation and stock selection in China, as the broader China market rallied after the September 2024 policy stimulus announcements ↓ Stock selection and underweight to Taiwan, where exposure to an integrated circuit maker detracted as the company was impacted by the slower-than-expected recovery in non-artificial intelligence semiconductors in the second half of 2024 ↓ Stock selection and overweight in industrials, where exposure to a Brazilian rental car company was the main detractor due to higher-for-longer interest rates |
|
| Line Graph [Table Text Block] |
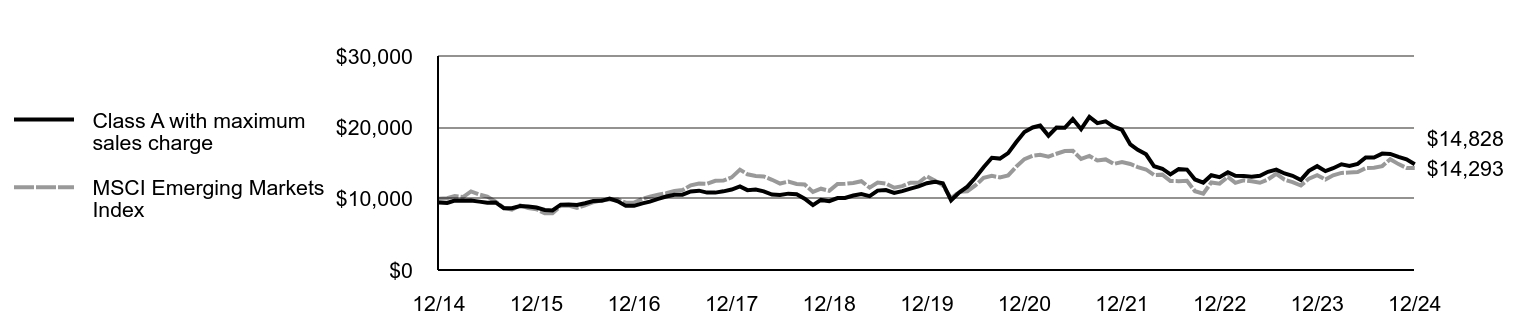 | Class A with maximum sales charge | MSCI Emerging Markets Index |
|---|
12/14 | $9,477 | $10,000 |
|---|
1/15 | $9,394 | $10,060 |
|---|
2/15 | $9,734 | $10,371 |
|---|
3/15 | $9,697 | $10,224 |
|---|
4/15 | $9,743 | $11,010 |
|---|
5/15 | $9,587 | $10,569 |
|---|
6/15 | $9,421 | $10,295 |
|---|
7/15 | $9,467 | $9,581 |
|---|
8/15 | $8,669 | $8,715 |
|---|
9/15 | $8,659 | $8,452 |
|---|
10/15 | $8,972 | $9,055 |
|---|
11/15 | $8,898 | $8,702 |
|---|
12/15 | $8,760 | $8,508 |
|---|
1/16 | $8,416 | $7,956 |
|---|
2/16 | $8,342 | $7,943 |
|---|
3/16 | $9,150 | $8,994 |
|---|
4/16 | $9,196 | $9,043 |
|---|
5/16 | $9,104 | $8,706 |
|---|
6/16 | $9,354 | $9,054 |
|---|
7/16 | $9,660 | $9,509 |
|---|
8/16 | $9,697 | $9,746 |
|---|
9/16 | $10,022 | $9,871 |
|---|
10/16 | $9,641 | $9,895 |
|---|
11/16 | $8,990 | $9,439 |
|---|
12/16 | $8,990 | $9,460 |
|---|
1/17 | $9,334 | $9,978 |
|---|
2/17 | $9,586 | $10,283 |
|---|
3/17 | $9,967 | $10,543 |
|---|
4/17 | $10,301 | $10,774 |
|---|
5/17 | $10,552 | $11,092 |
|---|
6/17 | $10,562 | $11,204 |
|---|
7/17 | $11,017 | $11,872 |
|---|
8/17 | $11,120 | $12,136 |
|---|
9/17 | $10,850 | $12,088 |
|---|
10/17 | $10,850 | $12,512 |
|---|
11/17 | $11,027 | $12,537 |
|---|
12/17 | $11,279 | $12,987 |
|---|
1/18 | $11,719 | $14,069 |
|---|
2/18 | $11,195 | $13,421 |
|---|
3/18 | $11,270 | $13,171 |
|---|
4/18 | $11,027 | $13,113 |
|---|
5/18 | $10,578 | $12,648 |
|---|
6/18 | $10,503 | $12,123 |
|---|
7/18 | $10,705 | $12,389 |
|---|
8/18 | $10,621 | $12,054 |
|---|
9/18 | $10,001 | $11,990 |
|---|
10/18 | $9,091 | $10,946 |
|---|
11/18 | $9,823 | $11,397 |
|---|
12/18 | $9,654 | $11,095 |
|---|
1/19 | $10,086 | $12,066 |
|---|
2/19 | $10,095 | $12,094 |
|---|
3/19 | $10,442 | $12,195 |
|---|
4/19 | $10,649 | $12,452 |
|---|
5/19 | $10,358 | $11,548 |
|---|
6/19 | $11,127 | $12,269 |
|---|
7/19 | $11,212 | $12,119 |
|---|
8/19 | $10,808 | $11,528 |
|---|
9/19 | $11,052 | $11,748 |
|---|
10/19 | $11,418 | $12,244 |
|---|
11/19 | $11,718 | $12,227 |
|---|
12/19 | $12,172 | $13,139 |
|---|
1/20 | $12,357 | $12,526 |
|---|
2/20 | $12,172 | $11,866 |
|---|
3/20 | $9,773 | $10,038 |
|---|
4/20 | $10,861 | $10,958 |
|---|
5/20 | $11,677 | $11,042 |
|---|
6/20 | $12,930 | $11,853 |
|---|
7/20 | $14,397 | $12,913 |
|---|
8/20 | $15,728 | $13,198 |
|---|
9/20 | $15,621 | $12,986 |
|---|
10/20 | $16,388 | $13,254 |
|---|
11/20 | $17,904 | $14,480 |
|---|
12/20 | $19,331 | $15,544 |
|---|
1/21 | $19,979 | $16,021 |
|---|
2/21 | $20,242 | $16,143 |
|---|
3/21 | $18,825 | $15,899 |
|---|
4/21 | $19,969 | $16,295 |
|---|
5/21 | $19,938 | $16,673 |
|---|
6/21 | $21,164 | $16,702 |
|---|
7/21 | $19,746 | $15,578 |
|---|
8/21 | $21,467 | $15,986 |
|---|
9/21 | $20,587 | $15,350 |
|---|
10/21 | $20,830 | $15,502 |
|---|
11/21 | $20,090 | $14,870 |
|---|
12/21 | $19,632 | $15,149 |
|---|
1/22 | $17,605 | $14,862 |
|---|
2/22 | $16,845 | $14,418 |
|---|
3/22 | $16,216 | $14,092 |
|---|
4/22 | $14,544 | $13,308 |
|---|
5/22 | $14,199 | $13,367 |
|---|
6/22 | $13,409 | $12,479 |
|---|
7/22 | $14,138 | $12,448 |
|---|
8/22 | $14,078 | $12,500 |
|---|
9/22 | $12,689 | $11,035 |
|---|
10/22 | $12,253 | $10,692 |
|---|
11/22 | $13,287 | $12,278 |
|---|
12/22 | $13,013 | $12,105 |
|---|
1/23 | $13,713 | $13,061 |
|---|
2/23 | $13,206 | $12,214 |
|---|
3/23 | $13,176 | $12,584 |
|---|
4/23 | $13,074 | $12,442 |
|---|
5/23 | $13,206 | $12,233 |
|---|
6/23 | $13,763 | $12,697 |
|---|
7/23 | $14,078 | $13,488 |
|---|
8/23 | $13,530 | $12,657 |
|---|
9/23 | $13,206 | $12,326 |
|---|
10/23 | $12,628 | $11,847 |
|---|
11/23 | $13,895 | $12,795 |
|---|
12/23 | $14,554 | $13,295 |
|---|
1/24 | $13,865 | $12,678 |
|---|
2/24 | $14,270 | $13,281 |
|---|
3/24 | $14,828 | $13,610 |
|---|
4/24 | $14,595 | $13,671 |
|---|
5/24 | $14,878 | $13,748 |
|---|
6/24 | $15,770 | $14,290 |
|---|
7/24 | $15,760 | $14,333 |
|---|
8/24 | $16,318 | $14,564 |
|---|
9/24 | $16,267 | $15,537 |
|---|
10/24 | $15,851 | $14,846 |
|---|
11/24 | $15,527 | $14,312 |
|---|
12/24 | $14,828 | $14,293 |
|---|
|
|
| Average Annual Return [Table Text Block] |
AATR | 1 Year | 5 Years | 10 Years |
|---|
Class A | 1.88% | 4.03% | 4.58% |
|---|
Class A, with 5.25% maximum front end sales charge | (3.50)% | 2.92% | 4.02% |
|---|
MSCI Emerging Markets Index | 7.50% | 1.70% | 3.64% |
|---|
|
|
| AssetsNet |
$ 188,147,993
|
|
| Holdings Count | Holding |
33
|
|
| Advisory Fees Paid, Amount |
$ 1,468,667
|
|
| InvestmentCompanyPortfolioTurnover |
58.00%
|
|
| Additional Fund Statistics [Text Block] |
Total Net Assets | $188,147,993 |
|---|
# of Portfolio Holdings | 33 |
|---|
Portfolio Turnover Rate | 58% |
|---|
Total Advisory Fees Paid | $1,468,667 |
|---|
|
|
| Holdings [Text Block] |
Country Weightings (% of total investments)Value | Value |
|---|
Korea, Republic of | 3.1% | Mexico | 3.5% | Argentina | 4.4% | Brazil | 10.5% | United States | 12.2% | Taiwan | 20.0% | India | 46.3% |
Top Ten Holdings (% of total investments)Footnote ReferenceaTaiwan Semiconductor Manufacturing Co. Ltd. | 11.0% | MercadoLibre, Inc. | 8.4% | KEI Industries Ltd. | 5.3% | HDFC Bank Ltd. | 5.3% | Varun Beverages Ltd. | 5.1% | Globant SA | 4.4% | ICICI Bank Ltd. | 4.4% | Localiza Rent a Car SA | 3.9% | Bharti Airtel Ltd. | 3.6% | TVS Motor Co. Ltd. | 3.2% | Total | 54.6% |
| Footnote | Description | Footnotea | Excluding cash equivalents. |
|
|
| Material Fund Change [Text Block] |
|
|
| Updated Prospectus Web Address |
<span style="box-sizing: border-box; color: rgb(0, 0, 0); display: inline; flex-wrap: nowrap; font-size: 10.6667px; font-weight: 400; grid-area: auto; line-height: 16px; margin: 0px; overflow: visible; text-align: left;">www.morganstanley.com/im/shareholderreports</span>
|
|
| C000155912 |
|
|
| Shareholder Report [Line Items] |
|
|
| Fund Name |
Morgan Stanley Institutional Fund, Inc. - Emerging Markets Leaders Portfolio
|
|
| Class Name |
Class C
|
|
| Trading Symbol |
MEMLX
|
|
| Annual or Semi-Annual Statement [Text Block] |
This annual shareholder report contains important information about Morgan Stanley Institutional Fund, Inc. - Emerging Markets Leaders Portfolio for the period of January 1, 2024 to December 31, 2024.
|
|
| Shareholder Report Annual or Semi-Annual |
Annual Shareholder Report
|
|
| Additional Information [Text Block] |
You can find additional information about the Fund at www.morganstanley.com/im/shareholderreports. You can also request this information by contacting us at 1-800-869-6397.
|
|
| Additional Information Phone Number |
1-800-869-6397
|
|
| Additional Information Website |
<span style="box-sizing: border-box; color: rgb(0, 0, 0); display: inline; flex-wrap: nowrap; font-size: 10.6667px; font-weight: 400; grid-area: auto; line-height: 16px; margin: 0px; overflow: visible; text-align: left;">www.morganstanley.com/im/shareholderreports</span>
|
|
| Expenses [Text Block] |
What were the Fund costs for the last year?(based on a hypothetical $10,000 investment) Class Name | Costs of a $10,000 investment | Costs paid as a percentage of a $10,000 investment |
|---|
Class C | $213 | 2.12% |
|---|
|
|
| Expenses Paid, Amount |
$ 213
|
|
| Expense Ratio, Percent |
2.12%
|
|
| Factors Affecting Performance [Text Block] |
How did the Fund perform last year and what affected its performance?Key contributors to (↑) and detractors from (↓) performance, relative to the MSCI Emerging Net Markets Index: ↑ Underweight allocation and stock selection in Korea, led by zero exposure to a South Korean memory chipmaker ↑ Zero exposure to Indonesia and Saudi Arabia ↑ Stock selection and underweight in real estate, led by an Indian luxury real estate developer ↓ Underweight allocation and stock selection in China, as the broader China market rallied after the September 2024 policy stimulus announcements ↓ Stock selection and underweight to Taiwan, where exposure to an integrated circuit maker detracted as the company was impacted by the slower-than-expected recovery in non-artificial intelligence semiconductors in the second half of 2024 ↓ Stock selection and overweight in industrials, where exposure to a Brazilian rental car company was the main detractor due to higher-for-longer interest rates |
|
| Line Graph [Table Text Block] |
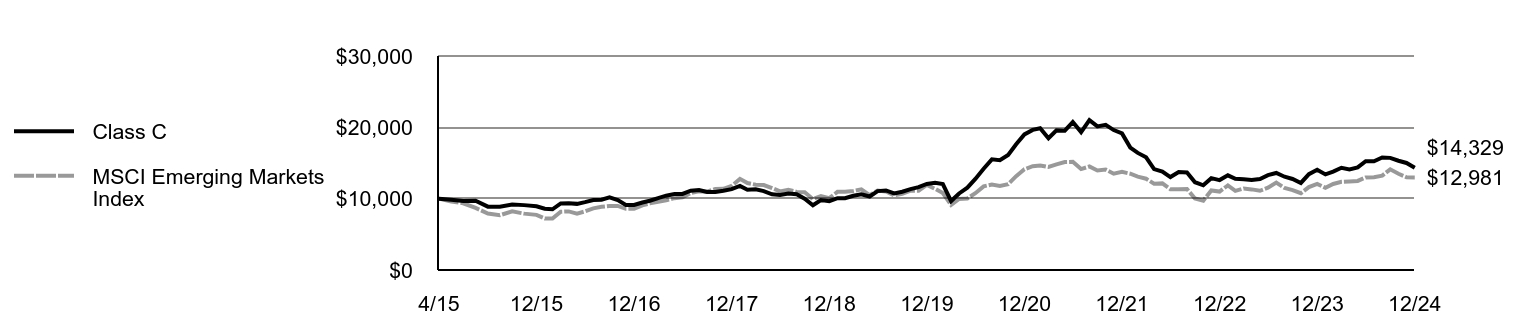 | Class C | MSCI Emerging Markets Index |
|---|
4/15 | $10,000 | $10,000 |
|---|
5/15 | $9,840 | $9,600 |
|---|
6/15 | $9,661 | $9,350 |
|---|
7/15 | $9,708 | $8,702 |
|---|
8/15 | $8,878 | $7,915 |
|---|
9/15 | $8,860 | $7,677 |
|---|
10/15 | $9,171 | $8,225 |
|---|
11/15 | $9,095 | $7,904 |
|---|
12/15 | $8,939 | $7,728 |
|---|
1/16 | $8,588 | $7,226 |
|---|
2/16 | $8,512 | $7,214 |
|---|
3/16 | $9,328 | $8,169 |
|---|
4/16 | $9,366 | $8,213 |
|---|
5/16 | $9,271 | $7,907 |
|---|
6/16 | $9,518 | $8,223 |
|---|
7/16 | $9,820 | $8,637 |
|---|
8/16 | $9,849 | $8,852 |
|---|
9/16 | $10,172 | $8,965 |
|---|
10/16 | $9,792 | $8,987 |
|---|
11/16 | $9,118 | $8,573 |
|---|
12/16 | $9,108 | $8,592 |
|---|
1/17 | $9,459 | $9,062 |
|---|
2/17 | $9,706 | $9,340 |
|---|
3/17 | $10,077 | $9,575 |
|---|
4/17 | $10,419 | $9,785 |
|---|
5/17 | $10,656 | $10,074 |
|---|
6/17 | $10,666 | $10,176 |
|---|
7/17 | $11,121 | $10,782 |
|---|
8/17 | $11,216 | $11,023 |
|---|
9/17 | $10,932 | $10,979 |
|---|
10/17 | $10,932 | $11,364 |
|---|
11/17 | $11,102 | $11,387 |
|---|
12/17 | $11,342 | $11,795 |
|---|
1/18 | $11,780 | $12,778 |
|---|
2/18 | $11,247 | $12,189 |
|---|
3/18 | $11,313 | $11,962 |
|---|
4/18 | $11,065 | $11,910 |
|---|
5/18 | $10,608 | $11,488 |
|---|
6/18 | $10,532 | $11,010 |
|---|
7/18 | $10,719 | $11,252 |
|---|
8/18 | $10,623 | $10,948 |
|---|
9/18 | $10,002 | $10,890 |
|---|
10/18 | $9,084 | $9,941 |
|---|
11/18 | $9,810 | $10,351 |
|---|
12/18 | $9,638 | $10,077 |
|---|
1/19 | $10,068 | $10,959 |
|---|
2/19 | $10,068 | $10,984 |
|---|
3/19 | $10,413 | $11,076 |
|---|
4/19 | $10,604 | $11,309 |
|---|
5/19 | $10,308 | $10,489 |
|---|
6/19 | $11,063 | $11,143 |
|---|
7/19 | $11,149 | $11,007 |
|---|
8/19 | $10,738 | $10,470 |
|---|
9/19 | $10,967 | $10,670 |
|---|
10/19 | $11,331 | $11,120 |
|---|
11/19 | $11,617 | $11,105 |
|---|
12/19 | $12,061 | $11,933 |
|---|
1/20 | $12,229 | $11,377 |
|---|
2/20 | $12,051 | $10,777 |
|---|
3/20 | $9,663 | $9,117 |
|---|
4/20 | $10,733 | $9,952 |
|---|
5/20 | $11,536 | $10,028 |
|---|
6/20 | $12,765 | $10,766 |
|---|
7/20 | $14,202 | $11,728 |
|---|
8/20 | $15,510 | $11,987 |
|---|
9/20 | $15,391 | $11,795 |
|---|
10/20 | $16,134 | $12,038 |
|---|
11/20 | $17,621 | $13,151 |
|---|
12/20 | $19,007 | $14,118 |
|---|
1/21 | $19,638 | $14,551 |
|---|
2/21 | $19,876 | $14,662 |
|---|
3/21 | $18,479 | $14,440 |
|---|
4/21 | $19,587 | $14,800 |
|---|
5/21 | $19,535 | $15,143 |
|---|
6/21 | $20,735 | $15,169 |
|---|
7/21 | $19,328 | $14,148 |
|---|
8/21 | $21,004 | $14,519 |
|---|
9/21 | $20,125 | $13,942 |
|---|
10/21 | $20,352 | $14,079 |
|---|
11/21 | $19,618 | $13,506 |
|---|
12/21 | $19,149 | $13,759 |
|---|
1/22 | $17,161 | $13,499 |
|---|
2/22 | $16,415 | $13,095 |
|---|
3/22 | $15,793 | $12,799 |
|---|
4/22 | $14,147 | $12,087 |
|---|
5/22 | $13,805 | $12,141 |
|---|
6/22 | $13,028 | $11,334 |
|---|
7/22 | $13,743 | $11,306 |
|---|
8/22 | $13,670 | $11,353 |
|---|
9/22 | $12,303 | $10,022 |
|---|
10/22 | $11,879 | $9,711 |
|---|
11/22 | $12,873 | $11,151 |
|---|
12/22 | $12,604 | $10,995 |
|---|
1/23 | $13,267 | $11,863 |
|---|
2/23 | $12,780 | $11,094 |
|---|
3/23 | $12,738 | $11,430 |
|---|
4/23 | $12,635 | $11,300 |
|---|
5/23 | $12,762 | $11,110 |
|---|
6/23 | $13,301 | $11,532 |
|---|
7/23 | $13,604 | $12,250 |
|---|
8/23 | $13,076 | $11,495 |
|---|
9/23 | $12,762 | $11,195 |
|---|
10/23 | $12,204 | $10,760 |
|---|
11/23 | $13,428 | $11,621 |
|---|
12/23 | $14,065 | $12,075 |
|---|
1/24 | $13,399 | $11,514 |
|---|
2/24 | $13,791 | $12,062 |
|---|
3/24 | $14,329 | $12,361 |
|---|
4/24 | $14,104 | $12,416 |
|---|
5/24 | $14,378 | $12,487 |
|---|
6/24 | $15,240 | $12,979 |
|---|
7/24 | $15,230 | $13,018 |
|---|
8/24 | $15,769 | $13,228 |
|---|
9/24 | $15,720 | $14,111 |
|---|
10/24 | $15,318 | $13,484 |
|---|
11/24 | $15,005 | $12,999 |
|---|
12/24 | $14,329 | $12,981 |
|---|
|
|
| Average Annual Return [Table Text Block] |
AATR | 1 Year | 5 Years | Since 4/30/15
(Inception) |
|---|
Class C, with conversion to Class A after 8 years | 1.11% | 3.24% | 3.79% |
|---|
Class C, with 1% maximum contingent deferred sales charge and conversion to Class A after 8 years | 0.11% | 3.24% | 3.79% |
|---|
MSCI Emerging Markets Index | 7.50% | 1.70% | 2.73% |
|---|
|
|
| Performance Inception Date |
Apr. 30, 2015
|
|
| AssetsNet |
$ 188,147,993
|
|
| Holdings Count | Holding |
33
|
|
| Advisory Fees Paid, Amount |
$ 1,468,667
|
|
| InvestmentCompanyPortfolioTurnover |
58.00%
|
|
| Additional Fund Statistics [Text Block] |
Total Net Assets | $188,147,993 |
|---|
# of Portfolio Holdings | 33 |
|---|
Portfolio Turnover Rate | 58% |
|---|
Total Advisory Fees Paid | $1,468,667 |
|---|
|
|
| Holdings [Text Block] |
Country Weightings (% of total investments)Value | Value |
|---|
Korea, Republic of | 3.1% | Mexico | 3.5% | Argentina | 4.4% | Brazil | 10.5% | United States | 12.2% | Taiwan | 20.0% | India | 46.3% |
Top Ten Holdings (% of total investments)Footnote ReferenceaTaiwan Semiconductor Manufacturing Co. Ltd. | 11.0% | MercadoLibre, Inc. | 8.4% | KEI Industries Ltd. | 5.3% | HDFC Bank Ltd. | 5.3% | Varun Beverages Ltd. | 5.1% | Globant SA | 4.4% | ICICI Bank Ltd. | 4.4% | Localiza Rent a Car SA | 3.9% | Bharti Airtel Ltd. | 3.6% | TVS Motor Co. Ltd. | 3.2% | Total | 54.6% |
| Footnote | Description | Footnotea | Excluding cash equivalents. |
|
|
| Material Fund Change [Text Block] |
|
|
| Updated Prospectus Web Address |
<span style="box-sizing: border-box; color: rgb(0, 0, 0); display: inline; flex-wrap: nowrap; font-size: 10.6667px; font-weight: 400; grid-area: auto; line-height: 16px; margin: 0px; overflow: visible; text-align: left;">www.morganstanley.com/im/shareholderreports</span>
|
|
| C000149047 |
|
|
| Shareholder Report [Line Items] |
|
|
| Fund Name |
Morgan Stanley Institutional Fund, Inc. - Emerging Markets Leaders Portfolio
|
|
| Class Name |
Class I
|
|
| Trading Symbol |
MELIX
|
|
| Annual or Semi-Annual Statement [Text Block] |
This annual shareholder report contains important information about Morgan Stanley Institutional Fund, Inc. - Emerging Markets Leaders Portfolio for the period of January 1, 2024 to December 31, 2024.
|
|
| Shareholder Report Annual or Semi-Annual |
Annual Shareholder Report
|
|
| Additional Information [Text Block] |
You can find additional information about the Fund at www.morganstanley.com/im/shareholderreports. You can also request this information by contacting us at 1-800-869-6397.
|
|
| Additional Information Phone Number |
1-800-869-6397
|
|
| Additional Information Website |
<span style="box-sizing: border-box; color: rgb(0, 0, 0); display: inline; flex-wrap: nowrap; font-size: 10.6667px; font-weight: 400; grid-area: auto; line-height: 16px; margin: 0px; overflow: visible; text-align: left;">www.morganstanley.com/im/shareholderreports</span>
|
|
| Expenses [Text Block] |
What were the Fund costs for the last year?(based on a hypothetical $10,000 investment) Class Name | Costs of a $10,000 investment | Costs paid as a percentage of a $10,000 investment |
|---|
Class I | $103 | 1.02% |
|---|
|
|
| Expenses Paid, Amount |
$ 103
|
|
| Expense Ratio, Percent |
1.02%
|
|
| Factors Affecting Performance [Text Block] |
How did the Fund perform last year and what affected its performance?Key contributors to (↑) and detractors from (↓) performance, relative to the MSCI Emerging Net Markets Index: ↑ Underweight allocation and stock selection in Korea, led by zero exposure to a South Korean memory chipmaker ↑ Zero exposure to Indonesia and Saudi Arabia ↑ Stock selection and underweight in real estate, led by an Indian luxury real estate developer ↓ Underweight allocation and stock selection in China, as the broader China market rallied after the September 2024 policy stimulus announcements ↓ Stock selection and underweight to Taiwan, where exposure to an integrated circuit maker detracted as the company was impacted by the slower-than-expected recovery in non-artificial intelligence semiconductors in the second half of 2024 ↓ Stock selection and overweight in industrials, where exposure to a Brazilian rental car company was the main detractor due to higher-for-longer interest rates |
|
| Line Graph [Table Text Block] |
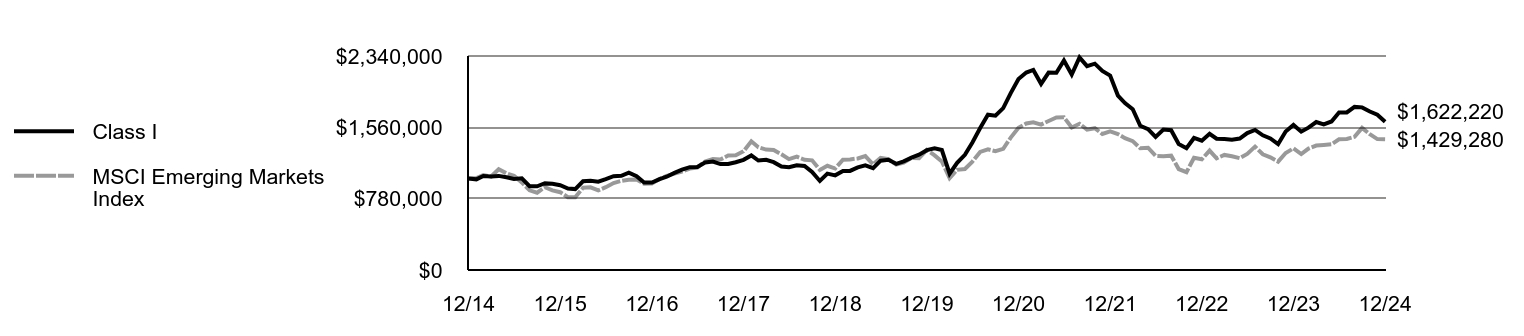 | Class I | MSCI Emerging Markets Index |
|---|
12/14 | $1,000,000 | $1,000,000 |
|---|
1/15 | $991,279 | $1,005,995 |
|---|
2/15 | $1,028,101 | $1,037,143 |
|---|
3/15 | $1,023,256 | $1,022,394 |
|---|
4/15 | $1,029,070 | $1,101,032 |
|---|
5/15 | $1,013,566 | $1,056,939 |
|---|
6/15 | $996,124 | $1,029,489 |
|---|
7/15 | $1,001,938 | $958,126 |
|---|
8/15 | $916,667 | $871,467 |
|---|
9/15 | $915,698 | $845,249 |
|---|
10/15 | $948,643 | $905,544 |
|---|
11/15 | $942,829 | $870,221 |
|---|
12/15 | $927,676 | $850,823 |
|---|
1/16 | $891,354 | $795,626 |
|---|
2/16 | $884,483 | $794,324 |
|---|
3/16 | $969,888 | $899,435 |
|---|
4/16 | $975,778 | $904,324 |
|---|
5/16 | $965,961 | $870,590 |
|---|
6/16 | $993,448 | $905,385 |
|---|
7/16 | $1,025,734 | $950,946 |
|---|
8/16 | $1,029,664 | $974,579 |
|---|
9/16 | $1,065,035 | $987,111 |
|---|
10/16 | $1,025,734 | $989,464 |
|---|
11/16 | $955,977 | $943,918 |
|---|
12/16 | $956,291 | $946,003 |
|---|
1/17 | $993,639 | $997,771 |
|---|
2/17 | $1,020,175 | $1,028,315 |
|---|
3/17 | $1,061,454 | $1,054,273 |
|---|
4/17 | $1,097,818 | $1,077,354 |
|---|
5/17 | $1,124,355 | $1,109,206 |
|---|
6/17 | $1,126,320 | $1,120,371 |
|---|
7/17 | $1,175,462 | $1,187,156 |
|---|
8/17 | $1,186,273 | $1,213,636 |
|---|
9/17 | $1,157,771 | $1,208,811 |
|---|
10/17 | $1,158,754 | $1,251,186 |
|---|
11/17 | $1,178,410 | $1,253,698 |
|---|
12/17 | $1,204,981 | $1,298,702 |
|---|
1/18 | $1,252,625 | $1,406,944 |
|---|
2/18 | $1,197,041 | $1,342,056 |
|---|
3/18 | $1,204,981 | $1,317,103 |
|---|
4/18 | $1,179,175 | $1,311,276 |
|---|
5/18 | $1,132,524 | $1,264,812 |
|---|
6/18 | $1,124,583 | $1,212,263 |
|---|
7/18 | $1,146,036 | $1,238,893 |
|---|
8/18 | $1,137,075 | $1,205,394 |
|---|
9/18 | $1,071,360 | $1,198,997 |
|---|
10/18 | $973,782 | $1,094,585 |
|---|
11/18 | $1,053,437 | $1,139,693 |
|---|
12/18 | $1,034,893 | $1,109,501 |
|---|
1/19 | $1,081,752 | $1,206,646 |
|---|
2/19 | $1,083,746 | $1,209,359 |
|---|
3/19 | $1,121,632 | $1,219,509 |
|---|
4/19 | $1,143,566 | $1,245,182 |
|---|
5/19 | $1,112,659 | $1,154,829 |
|---|
6/19 | $1,195,411 | $1,226,904 |
|---|
7/19 | $1,205,381 | $1,211,901 |
|---|
8/19 | $1,161,513 | $1,152,813 |
|---|
9/19 | $1,188,432 | $1,174,820 |
|---|
10/19 | $1,228,312 | $1,224,358 |
|---|
11/19 | $1,261,213 | $1,222,673 |
|---|
12/19 | $1,310,463 | $1,313,891 |
|---|
1/20 | $1,330,068 | $1,252,645 |
|---|
2/20 | $1,311,494 | $1,186,589 |
|---|
3/20 | $1,052,498 | $1,003,827 |
|---|
4/20 | $1,171,161 | $1,095,751 |
|---|
5/20 | $1,258,870 | $1,104,168 |
|---|
6/20 | $1,395,075 | $1,185,334 |
|---|
7/20 | $1,552,950 | $1,291,258 |
|---|
8/20 | $1,697,410 | $1,319,800 |
|---|
9/20 | $1,687,092 | $1,298,632 |
|---|
10/20 | $1,769,640 | $1,325,387 |
|---|
11/20 | $1,933,706 | $1,447,969 |
|---|
12/20 | $2,088,363 | $1,554,414 |
|---|
1/21 | $2,159,301 | $1,602,069 |
|---|
2/21 | $2,187,246 | $1,614,323 |
|---|
3/21 | $2,035,697 | $1,589,942 |
|---|
4/21 | $2,159,301 | $1,629,528 |
|---|
5/21 | $2,156,076 | $1,667,318 |
|---|
6/21 | $2,290,428 | $1,670,191 |
|---|
7/21 | $2,137,804 | $1,557,790 |
|---|
8/21 | $2,323,747 | $1,598,565 |
|---|
9/21 | $2,229,163 | $1,535,037 |
|---|
10/21 | $2,256,034 | $1,550,177 |
|---|
11/21 | $2,176,498 | $1,487,002 |
|---|
12/21 | $2,126,743 | $1,514,904 |
|---|
1/22 | $1,907,292 | $1,486,228 |
|---|
2/22 | $1,825,535 | $1,441,805 |
|---|
3/22 | $1,758,839 | $1,409,240 |
|---|
4/22 | $1,577,039 | $1,330,849 |
|---|
5/22 | $1,540,463 | $1,336,709 |
|---|
6/22 | $1,455,480 | $1,247,885 |
|---|
7/22 | $1,535,085 | $1,244,820 |
|---|
8/22 | $1,528,630 | $1,250,017 |
|---|
9/22 | $1,378,026 | $1,103,474 |
|---|
10/22 | $1,331,769 | $1,069,213 |
|---|
11/22 | $1,443,646 | $1,227,797 |
|---|
12/22 | $1,414,601 | $1,210,539 |
|---|
1/23 | $1,489,903 | $1,306,125 |
|---|
2/23 | $1,436,116 | $1,221,433 |
|---|
3/23 | $1,432,889 | $1,258,427 |
|---|
4/23 | $1,423,207 | $1,244,165 |
|---|
5/23 | $1,437,192 | $1,223,268 |
|---|
6/23 | $1,497,434 | $1,269,715 |
|---|
7/23 | $1,531,857 | $1,348,757 |
|---|
8/23 | $1,472,692 | $1,265,673 |
|---|
9/23 | $1,438,268 | $1,232,573 |
|---|
10/23 | $1,376,950 | $1,184,681 |
|---|
11/23 | $1,514,645 | $1,279,492 |
|---|
12/23 | $1,586,720 | $1,329,512 |
|---|
1/24 | $1,512,494 | $1,267,778 |
|---|
2/24 | $1,556,599 | $1,328,089 |
|---|
3/24 | $1,617,917 | $1,360,999 |
|---|
4/24 | $1,593,175 | $1,367,089 |
|---|
5/24 | $1,624,371 | $1,374,810 |
|---|
6/24 | $1,722,264 | $1,429,038 |
|---|
7/24 | $1,722,264 | $1,433,290 |
|---|
8/24 | $1,783,581 | $1,456,432 |
|---|
9/24 | $1,778,202 | $1,553,685 |
|---|
10/24 | $1,733,021 | $1,484,587 |
|---|
11/24 | $1,697,522 | $1,431,246 |
|---|
12/24 | $1,622,220 | $1,429,280 |
|---|
|
|
| Average Annual Return [Table Text Block] |
AATR | 1 Year | 5 Years | 10 Years |
|---|
Class I | 2.24% | 4.36% | 4.96% |
|---|
MSCI Emerging Markets Index | 7.50% | 1.70% | 3.64% |
|---|
|
|
| AssetsNet |
$ 188,147,993
|
|
| Holdings Count | Holding |
33
|
|
| Advisory Fees Paid, Amount |
$ 1,468,667
|
|
| InvestmentCompanyPortfolioTurnover |
58.00%
|
|
| Additional Fund Statistics [Text Block] |
Total Net Assets | $188,147,993 |
|---|
# of Portfolio Holdings | 33 |
|---|
Portfolio Turnover Rate | 58% |
|---|
Total Advisory Fees Paid | $1,468,667 |
|---|
|
|
| Holdings [Text Block] |
Country Weightings (% of total investments)Value | Value |
|---|
Korea, Republic of | 3.1% | Mexico | 3.5% | Argentina | 4.4% | Brazil | 10.5% | United States | 12.2% | Taiwan | 20.0% | India | 46.3% |
Top Ten Holdings (% of total investments)Footnote ReferenceaTaiwan Semiconductor Manufacturing Co. Ltd. | 11.0% | MercadoLibre, Inc. | 8.4% | KEI Industries Ltd. | 5.3% | HDFC Bank Ltd. | 5.3% | Varun Beverages Ltd. | 5.1% | Globant SA | 4.4% | ICICI Bank Ltd. | 4.4% | Localiza Rent a Car SA | 3.9% | Bharti Airtel Ltd. | 3.6% | TVS Motor Co. Ltd. | 3.2% | Total | 54.6% |
| Footnote | Description | Footnotea | Excluding cash equivalents. |
|
|
| Material Fund Change [Text Block] |
|
|
| Updated Prospectus Web Address |
<span style="box-sizing: border-box; color: rgb(0, 0, 0); display: inline; flex-wrap: nowrap; font-size: 10.6667px; font-weight: 400; grid-area: auto; line-height: 16px; margin: 0px; overflow: visible; text-align: left;">www.morganstanley.com/im/shareholderreports</span>
|
|
| C000226932 |
|
|
| Shareholder Report [Line Items] |
|
|
| Fund Name |
Morgan Stanley Institutional Fund, Inc. - Emerging Markets Leaders Portfolio
|
|
| Class Name |
Class IR
|
|
| Trading Symbol |
MSIWX
|
|
| Annual or Semi-Annual Statement [Text Block] |
This annual shareholder report contains important information about Morgan Stanley Institutional Fund, Inc. - Emerging Markets Leaders Portfolio for the period of January 1, 2024 to December 31, 2024.
|
|
| Shareholder Report Annual or Semi-Annual |
Annual Shareholder Report
|
|
| Additional Information [Text Block] |
You can find additional information about the Fund at www.morganstanley.com/im/shareholderreports. You can also request this information by contacting us at 1-800-869-6397.
|
|
| Additional Information Phone Number |
1-800-869-6397
|
|
| Additional Information Website |
<span style="box-sizing: border-box; color: rgb(0, 0, 0); display: inline; flex-wrap: nowrap; font-size: 10.6667px; font-weight: 400; grid-area: auto; line-height: 16px; margin: 0px; overflow: visible; text-align: left;">www.morganstanley.com/im/shareholderreports</span>
|
|
| Expenses [Text Block] |
What were the Fund costs for the last year?(based on a hypothetical $10,000 investment) Class Name | Costs of a $10,000 investment | Costs paid as a percentage of a $10,000 investment |
|---|
Class IR | $98 | 0.97% |
|---|
|
|
| Expenses Paid, Amount |
$ 98
|
|
| Expense Ratio, Percent |
0.97%
|
|
| Factors Affecting Performance [Text Block] |
How did the Fund perform last year and what affected its performance?Key contributors to (↑) and detractors from (↓) performance, relative to the MSCI Emerging Net Markets Index: ↑ Underweight allocation and stock selection in Korea, led by zero exposure to a South Korean memory chipmaker ↑ Zero exposure to Indonesia and Saudi Arabia ↑ Stock selection and underweight in real estate, led by an Indian luxury real estate developer ↓ Underweight allocation and stock selection in China, as the broader China market rallied after the September 2024 policy stimulus announcements ↓ Stock selection and underweight to Taiwan, where exposure to an integrated circuit maker detracted as the company was impacted by the slower-than-expected recovery in non-artificial intelligence semiconductors in the second half of 2024 ↓ Stock selection and overweight in industrials, where exposure to a Brazilian rental car company was the main detractor due to higher-for-longer interest rates |
|
| Line Graph [Table Text Block] |
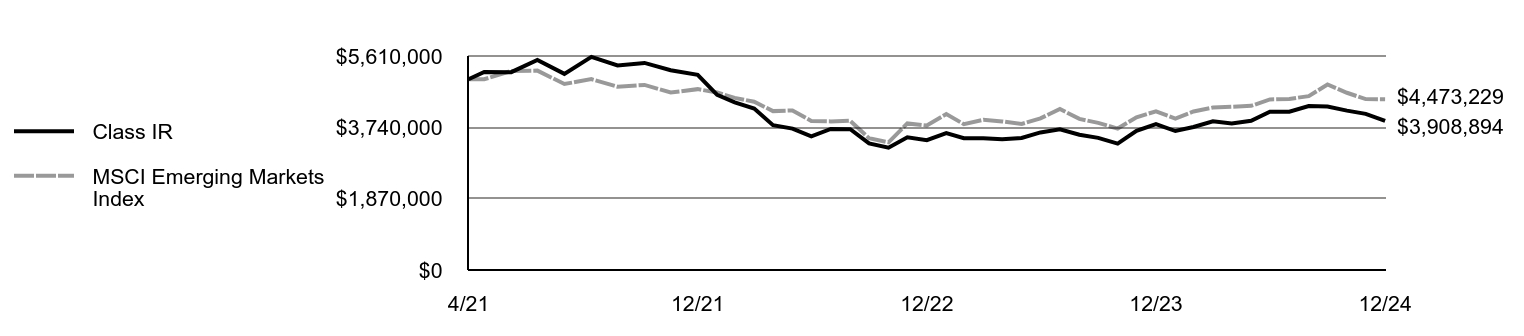 | Class IR | MSCI Emerging Markets Index |
|---|
4/21 | $5,000,000 | $5,000,000 |
|---|
4/21 | $5,193,598 | $5,000,000 |
|---|
5/21 | $5,185,854 | $5,218,216 |
|---|
6/21 | $5,508,518 | $5,227,209 |
|---|
7/21 | $5,141,972 | $4,875,426 |
|---|
8/21 | $5,588,539 | $5,003,041 |
|---|
9/21 | $5,363,965 | $4,804,217 |
|---|
10/21 | $5,428,498 | $4,851,600 |
|---|
11/21 | $5,237,481 | $4,653,882 |
|---|
12/21 | $5,117,990 | $4,741,205 |
|---|
1/22 | $4,590,948 | $4,651,459 |
|---|
2/22 | $4,394,599 | $4,512,426 |
|---|
3/22 | $4,231,836 | $4,410,510 |
|---|
4/22 | $3,797,802 | $4,165,169 |
|---|
5/22 | $3,707,378 | $4,183,508 |
|---|
6/22 | $3,503,278 | $3,905,515 |
|---|
7/22 | $3,697,044 | $3,895,921 |
|---|
8/22 | $3,689,293 | $3,912,186 |
|---|
9/22 | $3,317,264 | $3,453,551 |
|---|
10/22 | $3,206,171 | $3,346,324 |
|---|
11/22 | $3,477,443 | $3,842,643 |
|---|
12/22 | $3,405,104 | $3,788,633 |
|---|
1/23 | $3,588,535 | $4,087,789 |
|---|
2/23 | $3,456,775 | $3,822,727 |
|---|
3/23 | $3,451,608 | $3,938,507 |
|---|
4/23 | $3,425,772 | $3,893,873 |
|---|
5/23 | $3,461,942 | $3,828,470 |
|---|
6/23 | $3,606,620 | $3,973,837 |
|---|
7/23 | $3,689,293 | $4,221,213 |
|---|
8/23 | $3,547,199 | $3,961,186 |
|---|
9/23 | $3,464,525 | $3,857,592 |
|---|
10/23 | $3,314,680 | $3,707,706 |
|---|
11/23 | $3,647,957 | $4,004,434 |
|---|
12/23 | $3,823,637 | $4,160,984 |
|---|
1/24 | $3,642,789 | $3,967,775 |
|---|
2/24 | $3,748,715 | $4,156,531 |
|---|
3/24 | $3,895,976 | $4,259,528 |
|---|
4/24 | $3,839,138 | $4,278,587 |
|---|
5/24 | $3,914,061 | $4,302,753 |
|---|
6/24 | $4,149,163 | $4,472,469 |
|---|
7/24 | $4,149,163 | $4,485,779 |
|---|
8/24 | $4,296,425 | $4,558,204 |
|---|
9/24 | $4,283,507 | $4,862,578 |
|---|
10/24 | $4,177,582 | $4,646,324 |
|---|
11/24 | $4,092,325 | $4,479,380 |
|---|
12/24 | $3,908,894 | $4,473,229 |
|---|
|
|
| Average Annual Return [Table Text Block] |
AATR | 1 Year | Since 4/12/21
(Inception) |
|---|
Class IR | 2.23% | (6.40)% |
|---|
MSCI Emerging Markets Index | 7.50% | (2.95)% |
|---|
|
|
| Performance Inception Date |
Apr. 12, 2021
|
|
| AssetsNet |
$ 188,147,993
|
|
| Holdings Count | Holding |
33
|
|
| Advisory Fees Paid, Amount |
$ 1,468,667
|
|
| InvestmentCompanyPortfolioTurnover |
58.00%
|
|
| Additional Fund Statistics [Text Block] |
Total Net Assets | $188,147,993 |
|---|
# of Portfolio Holdings | 33 |
|---|
Portfolio Turnover Rate | 58% |
|---|
Total Advisory Fees Paid | $1,468,667 |
|---|
|
|
| Holdings [Text Block] |
Country Weightings (% of total investments)Value | Value |
|---|
Korea, Republic of | 3.1% | Mexico | 3.5% | Argentina | 4.4% | Brazil | 10.5% | United States | 12.2% | Taiwan | 20.0% | India | 46.3% |
Top Ten Holdings (% of total investments)Footnote ReferenceaTaiwan Semiconductor Manufacturing Co. Ltd. | 11.0% | MercadoLibre, Inc. | 8.4% | KEI Industries Ltd. | 5.3% | HDFC Bank Ltd. | 5.3% | Varun Beverages Ltd. | 5.1% | Globant SA | 4.4% | ICICI Bank Ltd. | 4.4% | Localiza Rent a Car SA | 3.9% | Bharti Airtel Ltd. | 3.6% | TVS Motor Co. Ltd. | 3.2% | Total | 54.6% |
| Footnote | Description | Footnotea | Excluding cash equivalents. |
|
|
| Material Fund Change [Text Block] |
|
|
| Updated Prospectus Web Address |
<span style="box-sizing: border-box; color: rgb(0, 0, 0); display: inline; flex-wrap: nowrap; font-size: 10.6667px; font-weight: 400; grid-area: auto; line-height: 16px; margin: 0px; overflow: visible; text-align: left;">www.morganstanley.com/im/shareholderreports</span>
|
|
| C000149050 |
|
|
| Shareholder Report [Line Items] |
|
|
| Fund Name |
Morgan Stanley Institutional Fund, Inc. - Emerging Markets Leaders Portfolio
|
|
| Class Name |
Class R6
|
|
| Trading Symbol |
MELSX
|
|
| Annual or Semi-Annual Statement [Text Block] |
This annual shareholder report contains important information about Morgan Stanley Institutional Fund, Inc. - Emerging Markets Leaders Portfolio for the period of January 1, 2024 to December 31, 2024.
|
|
| Shareholder Report Annual or Semi-Annual |
Annual Shareholder Report
|
|
| Additional Information [Text Block] |
You can find additional information about the Fund at www.morganstanley.com/im/shareholderreports. You can also request this information by contacting us at 1-800-869-6397.
|
|
| Additional Information Phone Number |
1-800-869-6397
|
|
| Additional Information Website |
<span style="box-sizing: border-box; color: rgb(0, 0, 0); display: inline; flex-wrap: nowrap; font-size: 10.6667px; font-weight: 400; grid-area: auto; line-height: 16px; margin: 0px; overflow: visible; text-align: left;">www.morganstanley.com/im/shareholderreports</span>
|
|
| Expenses [Text Block] |
What were the Fund costs for the last year?(based on a hypothetical $10,000 investment) Class Name | Costs of a $10,000 investment | Costs paid as a percentage of a $10,000 investment |
|---|
Class R6 | $98 | 0.97% |
|---|
|
|
| Expenses Paid, Amount |
$ 98
|
|
| Expense Ratio, Percent |
0.97%
|
|
| Factors Affecting Performance [Text Block] |
How did the Fund perform last year and what affected its performance?Key contributors to (↑) and detractors from (↓) performance, relative to the MSCI Emerging Net Markets Index: ↑ Underweight allocation and stock selection in Korea, led by zero exposure to a South Korean memory chipmaker ↑ Zero exposure to Indonesia and Saudi Arabia ↑ Stock selection and underweight in real estate, led by an Indian luxury real estate developer ↓ Underweight allocation and stock selection in China, as the broader China market rallied after the September 2024 policy stimulus announcements ↓ Stock selection and underweight to Taiwan, where exposure to an integrated circuit maker detracted as the company was impacted by the slower-than-expected recovery in non-artificial intelligence semiconductors in the second half of 2024 ↓ Stock selection and overweight in industrials, where exposure to a Brazilian rental car company was the main detractor due to higher-for-longer interest rates |
|
| Line Graph [Table Text Block] |
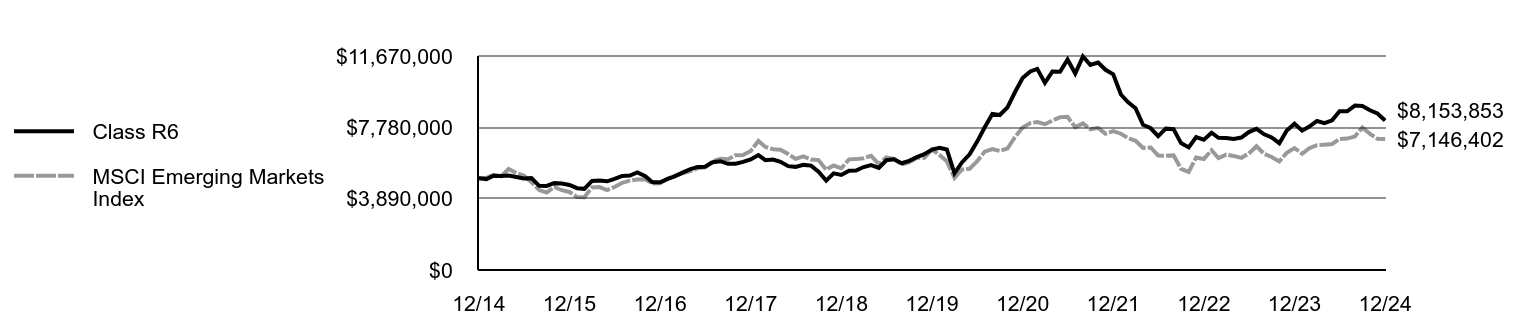 | Class R6 | MSCI Emerging Markets Index |
|---|
12/14 | $5,000,000 | $5,000,000 |
|---|
1/15 | $4,956,395 | $5,029,973 |
|---|
2/15 | $5,140,504 | $5,185,714 |
|---|
3/15 | $5,121,124 | $5,111,971 |
|---|
4/15 | $5,150,194 | $5,505,159 |
|---|
5/15 | $5,072,674 | $5,284,697 |
|---|
6/15 | $4,985,465 | $5,147,445 |
|---|
7/15 | $5,009,690 | $4,790,630 |
|---|
8/15 | $4,588,178 | $4,357,333 |
|---|
9/15 | $4,583,333 | $4,226,247 |
|---|
10/15 | $4,748,062 | $4,527,722 |
|---|
11/15 | $4,714,147 | $4,351,106 |
|---|
12/15 | $4,638,910 | $4,254,113 |
|---|
1/16 | $4,462,190 | $3,978,131 |
|---|
2/16 | $4,427,828 | $3,971,622 |
|---|
3/16 | $4,854,902 | $4,497,176 |
|---|
4/16 | $4,879,446 | $4,521,618 |
|---|
5/16 | $4,835,266 | $4,352,952 |
|---|
6/16 | $4,967,807 | $4,526,927 |
|---|
7/16 | $5,129,258 | $4,754,730 |
|---|
8/16 | $5,148,910 | $4,872,896 |
|---|
9/16 | $5,325,781 | $4,935,554 |
|---|
10/16 | $5,129,258 | $4,947,322 |
|---|
11/16 | $4,785,342 | $4,719,592 |
|---|
12/16 | $4,782,471 | $4,730,014 |
|---|
1/17 | $4,969,248 | $4,988,854 |
|---|
2/17 | $5,106,873 | $5,141,573 |
|---|
3/17 | $5,308,396 | $5,271,363 |
|---|
4/17 | $5,490,258 | $5,386,772 |
|---|
5/17 | $5,622,967 | $5,546,028 |
|---|
6/17 | $5,632,798 | $5,601,857 |
|---|
7/17 | $5,878,557 | $5,935,782 |
|---|
8/17 | $5,932,624 | $6,068,181 |
|---|
9/17 | $5,790,084 | $6,044,053 |
|---|
10/17 | $5,794,999 | $6,255,932 |
|---|
11/17 | $5,893,302 | $6,268,490 |
|---|
12/17 | $6,026,981 | $6,493,511 |
|---|
1/18 | $6,265,280 | $7,034,718 |
|---|
2/18 | $5,987,265 | $6,710,281 |
|---|
3/18 | $6,026,981 | $6,585,515 |
|---|
4/18 | $5,897,903 | $6,556,378 |
|---|
5/18 | $5,664,568 | $6,324,059 |
|---|
6/18 | $5,624,852 | $6,061,314 |
|---|
7/18 | $5,732,155 | $6,194,464 |
|---|
8/18 | $5,692,313 | $6,026,971 |
|---|
9/18 | $5,363,623 | $5,994,984 |
|---|
10/18 | $4,875,569 | $5,472,925 |
|---|
11/18 | $5,269,000 | $5,698,463 |
|---|
12/18 | $5,181,351 | $5,547,503 |
|---|
1/19 | $5,415,959 | $6,033,229 |
|---|
2/19 | $5,425,942 | $6,046,794 |
|---|
3/19 | $5,615,626 | $6,097,543 |
|---|
4/19 | $5,725,442 | $6,225,908 |
|---|
5/19 | $5,570,701 | $5,774,147 |
|---|
6/19 | $5,985,009 | $6,134,518 |
|---|
7/19 | $6,034,926 | $6,059,506 |
|---|
8/19 | $5,820,284 | $5,764,064 |
|---|
9/19 | $5,950,067 | $5,874,099 |
|---|
10/19 | $6,154,726 | $6,121,791 |
|---|
11/19 | $6,314,459 | $6,113,367 |
|---|
12/19 | $6,566,200 | $6,569,457 |
|---|
1/20 | $6,664,357 | $6,263,224 |
|---|
2/20 | $6,571,366 | $5,932,945 |
|---|
3/20 | $5,274,658 | $5,019,136 |
|---|
4/20 | $5,863,601 | $5,478,757 |
|---|
5/20 | $6,307,892 | $5,520,838 |
|---|
6/20 | $6,989,826 | $5,926,670 |
|---|
7/20 | $7,785,416 | $6,456,288 |
|---|
8/20 | $8,508,680 | $6,599,001 |
|---|
9/20 | $8,451,852 | $6,493,158 |
|---|
10/20 | $8,870,311 | $6,626,936 |
|---|
11/20 | $9,691,732 | $7,239,845 |
|---|
12/20 | $10,466,031 | $7,772,071 |
|---|
1/21 | $10,826,558 | $8,010,346 |
|---|
2/21 | $10,966,464 | $8,071,614 |
|---|
3/21 | $10,202,363 | $7,949,712 |
|---|
4/21 | $10,826,558 | $8,147,642 |
|---|
5/21 | $10,810,415 | $8,336,588 |
|---|
6/21 | $11,483,039 | $8,350,956 |
|---|
7/21 | $10,713,557 | $7,788,949 |
|---|
8/21 | $11,649,850 | $7,992,827 |
|---|
9/21 | $11,181,703 | $7,675,186 |
|---|
10/21 | $11,316,228 | $7,750,885 |
|---|
11/21 | $10,918,035 | $7,435,012 |
|---|
12/21 | $10,668,945 | $7,574,519 |
|---|
1/22 | $9,570,275 | $7,431,141 |
|---|
2/22 | $9,160,967 | $7,209,023 |
|---|
3/22 | $8,821,672 | $7,046,202 |
|---|
4/22 | $7,916,885 | $6,654,247 |
|---|
5/22 | $7,728,388 | $6,683,545 |
|---|
6/22 | $7,302,922 | $6,239,426 |
|---|
7/22 | $7,706,845 | $6,224,099 |
|---|
8/22 | $7,679,917 | $6,250,083 |
|---|
9/22 | $6,920,542 | $5,517,372 |
|---|
10/22 | $6,683,574 | $5,346,067 |
|---|
11/22 | $7,249,066 | $6,138,983 |
|---|
12/22 | $7,103,654 | $6,052,695 |
|---|
1/23 | $7,486,034 | $6,530,625 |
|---|
2/23 | $7,211,367 | $6,107,164 |
|---|
3/23 | $7,200,595 | $6,292,133 |
|---|
4/23 | $7,146,739 | $6,220,826 |
|---|
5/23 | $7,222,138 | $6,116,340 |
|---|
6/23 | $7,523,734 | $6,348,576 |
|---|
7/23 | $7,696,074 | $6,743,784 |
|---|
8/23 | $7,399,864 | $6,328,365 |
|---|
9/23 | $7,227,524 | $6,162,864 |
|---|
10/23 | $6,915,157 | $5,923,407 |
|---|
11/23 | $7,609,904 | $6,397,458 |
|---|
12/23 | $7,976,127 | $6,647,562 |
|---|
1/24 | $7,599,132 | $6,338,891 |
|---|
2/24 | $7,819,944 | $6,640,447 |
|---|
3/24 | $8,126,925 | $6,804,995 |
|---|
4/24 | $8,008,441 | $6,835,443 |
|---|
5/24 | $8,164,624 | $6,874,051 |
|---|
6/24 | $8,654,717 | $7,145,188 |
|---|
7/24 | $8,654,717 | $7,166,452 |
|---|
8/24 | $8,967,084 | $7,282,158 |
|---|
9/24 | $8,940,156 | $7,768,424 |
|---|
10/24 | $8,713,959 | $7,422,937 |
|---|
11/24 | $8,536,233 | $7,156,230 |
|---|
12/24 | $8,153,853 | $7,146,402 |
|---|
|
|
| Average Annual Return [Table Text Block] |
AATR | 1 Year | 5 Years | 10 Years |
|---|
Class R6 | 2.23% | 4.43% | 5.01% |
|---|
MSCI Emerging Markets Index | 7.50% | 1.70% | 3.64% |
|---|
|
|
| AssetsNet |
$ 188,147,993
|
|
| Holdings Count | Holding |
33
|
|
| Advisory Fees Paid, Amount |
$ 1,468,667
|
|
| InvestmentCompanyPortfolioTurnover |
58.00%
|
|
| Additional Fund Statistics [Text Block] |
Total Net Assets | $188,147,993 |
|---|
# of Portfolio Holdings | 33 |
|---|
Portfolio Turnover Rate | 58% |
|---|
Total Advisory Fees Paid | $1,468,667 |
|---|
|
|
| Holdings [Text Block] |
Country Weightings (% of total investments)Value | Value |
|---|
Korea, Republic of | 3.1% | Mexico | 3.5% | Argentina | 4.4% | Brazil | 10.5% | United States | 12.2% | Taiwan | 20.0% | India | 46.3% |
Top Ten Holdings (% of total investments)Footnote ReferenceaTaiwan Semiconductor Manufacturing Co. Ltd. | 11.0% | MercadoLibre, Inc. | 8.4% | KEI Industries Ltd. | 5.3% | HDFC Bank Ltd. | 5.3% | Varun Beverages Ltd. | 5.1% | Globant SA | 4.4% | ICICI Bank Ltd. | 4.4% | Localiza Rent a Car SA | 3.9% | Bharti Airtel Ltd. | 3.6% | TVS Motor Co. Ltd. | 3.2% | Total | 54.6% |
| Footnote | Description | Footnotea | Excluding cash equivalents. |
|
|
| Material Fund Change [Text Block] |
|
|
| Updated Prospectus Web Address |
<span style="box-sizing: border-box; color: rgb(0, 0, 0); display: inline; flex-wrap: nowrap; font-size: 10.6667px; font-weight: 400; grid-area: auto; line-height: 16px; margin: 0px; overflow: visible; text-align: left;">www.morganstanley.com/im/shareholderreports</span>
|
|
| C000007747 |
|
|
| Shareholder Report [Line Items] |
|
|
| Fund Name |
Morgan Stanley Institutional Fund, Inc. - Emerging Markets Portfolio
|
|
| Class Name |
Class A
|
|
| Trading Symbol |
MMKBX
|
|
| Annual or Semi-Annual Statement [Text Block] |
This annual shareholder report contains important information about Morgan Stanley Institutional Fund, Inc. - Emerging Markets Portfolio for the period of January 1, 2024 to December 31, 2024.
|
|
| Shareholder Report Annual or Semi-Annual |
Annual Shareholder Report
|
|
| Additional Information [Text Block] |
You can find additional information about the Fund at www.morganstanley.com/im/shareholderreports. You can also request this information by contacting us at 1-800-869-6397.
|
|
| Additional Information Phone Number |
1-800-869-6397
|
|
| Additional Information Website |
<span style="box-sizing: border-box; color: rgb(0, 0, 0); display: inline; flex-wrap: nowrap; font-size: 10.6667px; font-weight: 400; grid-area: auto; line-height: 16px; margin: 0px; overflow: visible; text-align: left;">www.morganstanley.com/im/shareholderreports</span>
|
|
| Expenses [Text Block] |
What were the Fund costs for the last year?(based on a hypothetical $10,000 investment) Class Name | Costs of a $10,000 investment | Costs paid as a percentage of a $10,000 investment |
|---|
Class A | $140 | 1.35% |
|---|
|
|
| Expenses Paid, Amount |
$ 140
|
|
| Expense Ratio, Percent |
1.35%
|
|
| Factors Affecting Performance [Text Block] |
How did the Fund perform last year and what affected its performance?Key contributors to ↑ and detractors from ↓ performance, relative to the MSCI Emerging Markets Index: ↑ Positioning in India, through the allocations to select consumer, industrial and health care companies
↑ The underweight allocation to and positioning in Korea, where equities underperformed on currency weakness and political volatility
↑ Stock selections in South Africa and Taiwan, through allocations to a leading bank and consumer company in South Africa and overweights to select technology companies in Taiwan
↓ Positioning in Poland, as the allocation to an apparel retailer (sold) underperformed following a short-seller report
↓ Overweight allocations to Mexico, which sold off following both the Mexico and U.S. elections, and Brazil, which underperformed on budget and fiscal risks
↓ Underweight allocation to China, which outperformed for the full year after rallying in September |
|
| Line Graph [Table Text Block] |
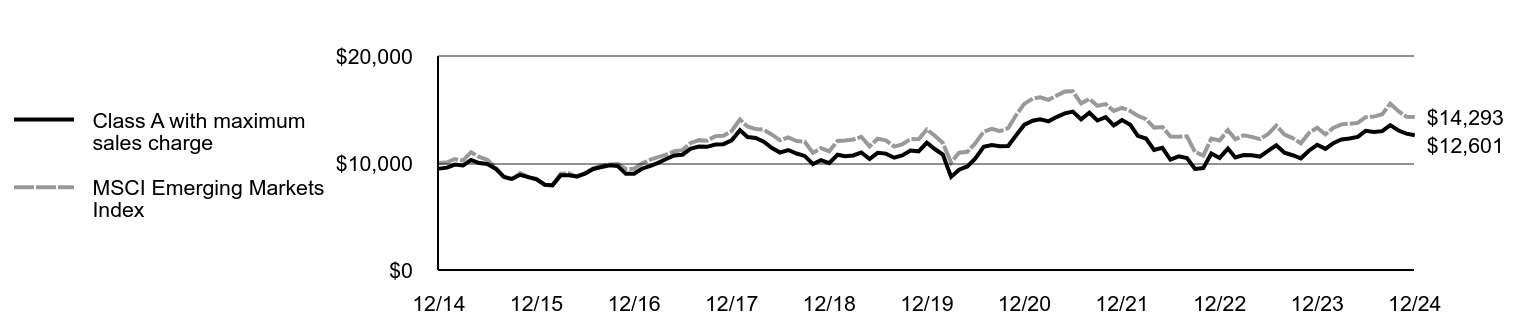 | Class A with maximum sales charge | MSCI Emerging Markets Index |
|---|
12/14 | $9,473 | $10,000 |
|---|
1/15 | $9,565 | $10,060 |
|---|
2/15 | $9,851 | $10,371 |
|---|
3/15 | $9,763 | $10,224 |
|---|
4/15 | $10,272 | $11,010 |
|---|
5/15 | $9,996 | $10,569 |
|---|
6/15 | $9,908 | $10,295 |
|---|
7/15 | $9,472 | $9,581 |
|---|
8/15 | $8,689 | $8,715 |
|---|
9/15 | $8,518 | $8,452 |
|---|
10/15 | $8,896 | $9,055 |
|---|
11/15 | $8,676 | $8,702 |
|---|
12/15 | $8,466 | $8,508 |
|---|
1/16 | $7,963 | $7,956 |
|---|
2/16 | $7,910 | $7,943 |
|---|
3/16 | $8,846 | $8,994 |
|---|
4/16 | $8,854 | $9,043 |
|---|
5/16 | $8,748 | $8,706 |
|---|
6/16 | $9,009 | $9,054 |
|---|
7/16 | $9,442 | $9,509 |
|---|
8/16 | $9,628 | $9,746 |
|---|
9/16 | $9,791 | $9,871 |
|---|
10/16 | $9,711 | $9,895 |
|---|
11/16 | $8,988 | $9,439 |
|---|
12/16 | $9,005 | $9,460 |
|---|
1/17 | $9,489 | $9,978 |
|---|
2/17 | $9,715 | $10,283 |
|---|
3/17 | $10,016 | $10,543 |
|---|
4/17 | $10,376 | $10,774 |
|---|
5/17 | $10,699 | $11,092 |
|---|
6/17 | $10,775 | $11,204 |
|---|
7/17 | $11,340 | $11,872 |
|---|
8/17 | $11,540 | $12,136 |
|---|
9/17 | $11,513 | $12,088 |
|---|
10/17 | $11,726 | $12,512 |
|---|
11/17 | $11,762 | $12,537 |
|---|
12/17 | $12,116 | $12,987 |
|---|
1/18 | $13,072 | $14,069 |
|---|
2/18 | $12,423 | $13,421 |
|---|
3/18 | $12,334 | $13,171 |
|---|
4/18 | $11,987 | $13,113 |
|---|
5/18 | $11,404 | $12,648 |
|---|
6/18 | $10,981 | $12,123 |
|---|
7/18 | $11,213 | $12,389 |
|---|
8/18 | $10,888 | $12,054 |
|---|
9/18 | $10,661 | $11,990 |
|---|
10/18 | $9,909 | $10,946 |
|---|
11/18 | $10,270 | $11,397 |
|---|
12/18 | $9,986 | $11,095 |
|---|
1/19 | $10,771 | $12,066 |
|---|
2/19 | $10,640 | $12,094 |
|---|
3/19 | $10,703 | $12,195 |
|---|
4/19 | $10,989 | $12,452 |
|---|
5/19 | $10,376 | $11,548 |
|---|
6/19 | $10,948 | $12,269 |
|---|
7/19 | $10,876 | $12,119 |
|---|
8/19 | $10,494 | $11,528 |
|---|
9/19 | $10,708 | $11,748 |
|---|
10/19 | $11,166 | $12,244 |
|---|
11/19 | $11,089 | $12,227 |
|---|
12/19 | $11,892 | $13,139 |
|---|
1/20 | $11,283 | $12,526 |
|---|
2/20 | $10,793 | $11,866 |
|---|
3/20 | $8,703 | $10,038 |
|---|
4/20 | $9,379 | $10,958 |
|---|
5/20 | $9,678 | $11,042 |
|---|
6/20 | $10,427 | $11,853 |
|---|
7/20 | $11,505 | $12,913 |
|---|
8/20 | $11,675 | $13,198 |
|---|
9/20 | $11,572 | $12,986 |
|---|
10/20 | $11,587 | $13,254 |
|---|
11/20 | $12,598 | $14,480 |
|---|
12/20 | $13,582 | $15,544 |
|---|
1/21 | $13,951 | $16,021 |
|---|
2/21 | $14,091 | $16,143 |
|---|
3/21 | $13,894 | $15,899 |
|---|
4/21 | $14,294 | $16,295 |
|---|
5/21 | $14,637 | $16,673 |
|---|
6/21 | $14,803 | $16,702 |
|---|
7/21 | $14,086 | $15,578 |
|---|
8/21 | $14,699 | $15,986 |
|---|
9/21 | $13,972 | $15,350 |
|---|
10/21 | $14,284 | $15,502 |
|---|
11/21 | $13,504 | $14,870 |
|---|
12/21 | $14,020 | $15,149 |
|---|
1/22 | $13,566 | $14,862 |
|---|
2/22 | $12,544 | $14,418 |
|---|
3/22 | $12,288 | $14,092 |
|---|
4/22 | $11,221 | $13,308 |
|---|
5/22 | $11,419 | $13,367 |
|---|
6/22 | $10,324 | $12,479 |
|---|
7/22 | $10,624 | $12,448 |
|---|
8/22 | $10,465 | $12,500 |
|---|
9/22 | $9,449 | $11,035 |
|---|
10/22 | $9,523 | $10,692 |
|---|
11/22 | $10,891 | $12,278 |
|---|
12/22 | $10,472 | $12,105 |
|---|
1/23 | $11,348 | $13,061 |
|---|
2/23 | $10,519 | $12,214 |
|---|
3/23 | $10,750 | $12,584 |
|---|
4/23 | $10,732 | $12,442 |
|---|
5/23 | $10,602 | $12,233 |
|---|
6/23 | $11,141 | $12,697 |
|---|
7/23 | $11,661 | $13,488 |
|---|
8/23 | $10,957 | $12,657 |
|---|
9/23 | $10,727 | $12,326 |
|---|
10/23 | $10,437 | $11,847 |
|---|
11/23 | $11,147 | $12,795 |
|---|
12/23 | $11,701 | $13,295 |
|---|
1/24 | $11,326 | $12,678 |
|---|
2/24 | $11,840 | $13,281 |
|---|
3/24 | $12,203 | $13,610 |
|---|
4/24 | $12,282 | $13,671 |
|---|
5/24 | $12,439 | $13,748 |
|---|
6/24 | $13,008 | $14,290 |
|---|
7/24 | $12,899 | $14,333 |
|---|
8/24 | $12,977 | $14,564 |
|---|
9/24 | $13,540 | $15,537 |
|---|
10/24 | $13,038 | $14,846 |
|---|
11/24 | $12,741 | $14,312 |
|---|
12/24 | $12,601 | $14,293 |
|---|
|
|
| Average Annual Return [Table Text Block] |
AATR | 1 Year | 5 Years | 10 Years |
|---|
Class A | 7.69% | 1.17% | 2.89% |
|---|
Class A, with 5.25% maximum front end sales charge | 2.05% | 0.08% | 2.34% |
|---|
MSCI Emerging Markets Index | 7.50% | 1.70% | 3.64% |
|---|
|
|
| AssetsNet |
$ 518,898,517
|
|
| Holdings Count | Holding |
97
|
|
| Advisory Fees Paid, Amount |
$ 3,648,970
|
|
| InvestmentCompanyPortfolioTurnover |
41.00%
|
|
| Additional Fund Statistics [Text Block] |
Total Net Assets | $518,898,517 |
|---|
# of Portfolio Holdings | 97 |
|---|
Portfolio Turnover Rate | 41% |
|---|
Total Advisory Fees Paid | $3,648,970 |
|---|
|
|
| Holdings [Text Block] |
Country Weightings (% of total investments)Value | Value |
|---|
Other | 5.0% | Poland | 2.0% | Indonesia | 2.6% | South Africa | 3.9% | Mexico | 4.5% | Brazil | 4.9% | United States | 4.9% | Korea, Republic of | 6.4% | Taiwan | 20.1% | China | 21.6% | India | 24.1% |
Top Ten Holdings (% of total investments)Footnote ReferenceaTaiwan Semiconductor Manufacturing Co. Ltd. | 12.7% | Tencent Holdings Ltd. | 5.1% | Mahindra & Mahindra Ltd. | 2.9% | Alibaba Group Holding Ltd. | 2.7% | China Construction Bank Corp. | 2.3% | WEG SA | 2.0% | Samsung Electronics Co. Ltd. | 2.0% | Reliance Industries Ltd. | 1.9% | ICICI Bank Ltd. | 1.9% | State Bank of India | 1.7% | Total | 35.2% |
| Footnote | Description | Footnotea | Excluding cash equivalents. |
|
|
| Material Fund Change [Text Block] |
|
|
| Updated Prospectus Web Address |
<span style="box-sizing: border-box; color: rgb(0, 0, 0); display: inline; flex-wrap: nowrap; font-size: 10.6667px; font-weight: 400; grid-area: auto; line-height: 16px; margin: 0px; overflow: visible; text-align: left;">www.morganstanley.com/im/shareholderreports</span>
|
|
| C000155890 |
|
|
| Shareholder Report [Line Items] |
|
|
| Fund Name |
Morgan Stanley Institutional Fund, Inc. - Emerging Markets Portfolio
|
|
| Class Name |
Class C
|
|
| Trading Symbol |
MSEPX
|
|
| Annual or Semi-Annual Statement [Text Block] |
This annual shareholder report contains important information about Morgan Stanley Institutional Fund, Inc. - Emerging Markets Portfolio for the period of January 1, 2024 to December 31, 2024.
|
|
| Shareholder Report Annual or Semi-Annual |
Annual Shareholder Report
|
|
| Additional Information [Text Block] |
You can find additional information about the Fund at www.morganstanley.com/im/shareholderreports. You can also request this information by contacting us at 1-800-869-6397.
|
|
| Additional Information Phone Number |
1-800-869-6397
|
|
| Additional Information Website |
<span style="box-sizing: border-box; color: rgb(0, 0, 0); display: inline; flex-wrap: nowrap; font-size: 10.6667px; font-weight: 400; grid-area: auto; line-height: 16px; margin: 0px; overflow: visible; text-align: left;">www.morganstanley.com/im/shareholderreports</span>
|
|
| Expenses [Text Block] |
What were the Fund costs for the last year?(based on a hypothetical $10,000 investment) Class Name | Costs of a $10,000 investment | Costs paid as a percentage of a $10,000 investment |
|---|
Class C | $217 | 2.10% |
|---|
|
|
| Expenses Paid, Amount |
$ 217
|
|
| Expense Ratio, Percent |
2.10%
|
|
| Factors Affecting Performance [Text Block] |
How did the Fund perform last year and what affected its performance?Key contributors to ↑ and detractors from ↓ performance, relative to the MSCI Emerging Markets Index: ↓ Positioning in Poland, as the allocation to an apparel retailer (sold) underperformed following a short-seller report
↓ Overweight allocations to Mexico, which sold off following both the Mexico and U.S. elections, and Brazil, which underperformed on budget and fiscal risks
↓ Underweight allocation to China, which outperformed for the full year after rallying in September
↑ Positioning in India, through the allocations to select consumer, industrial and health care companies
↑ The underweight allocation to and positioning in Korea, where equities underperformed on currency weakness and political volatility
↑ Stock selections in South Africa and Taiwan, through allocations to a leading bank and consumer company in South Africa and overweights to select technology companies in Taiwan |
|
| Line Graph [Table Text Block] |
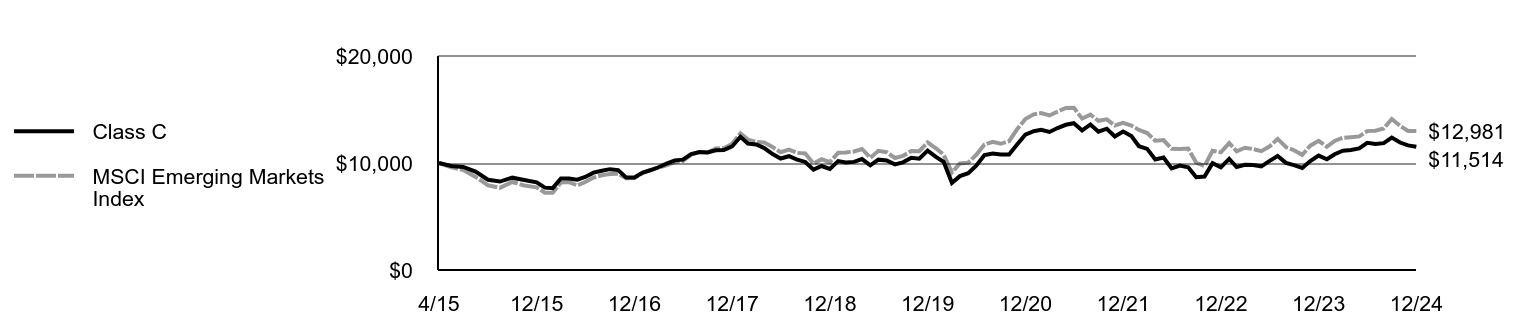 | Class C | MSCI Emerging Markets Index |
|---|
4/15 | $10,000 | $10,000 |
|---|
5/15 | $9,724 | $9,600 |
|---|
6/15 | $9,633 | $9,350 |
|---|
7/15 | $9,200 | $8,702 |
|---|
8/15 | $8,435 | $7,915 |
|---|
9/15 | $8,266 | $7,677 |
|---|
10/15 | $8,629 | $8,225 |
|---|
11/15 | $8,409 | $7,904 |
|---|
12/15 | $8,197 | $7,728 |
|---|
1/16 | $7,704 | $7,226 |
|---|
2/16 | $7,648 | $7,214 |
|---|
3/16 | $8,547 | $8,169 |
|---|
4/16 | $8,552 | $8,213 |
|---|
5/16 | $8,443 | $7,907 |
|---|
6/16 | $8,690 | $8,223 |
|---|
7/16 | $9,101 | $8,637 |
|---|
8/16 | $9,270 | $8,852 |
|---|
9/16 | $9,425 | $8,965 |
|---|
10/16 | $9,339 | $8,987 |
|---|
11/16 | $8,642 | $8,573 |
|---|
12/16 | $8,653 | $8,592 |
|---|
1/17 | $9,107 | $9,062 |
|---|
2/17 | $9,320 | $9,340 |
|---|
3/17 | $9,601 | $9,575 |
|---|
4/17 | $9,939 | $9,785 |
|---|
5/17 | $10,246 | $10,074 |
|---|
6/17 | $10,311 | $10,176 |
|---|
7/17 | $10,841 | $10,782 |
|---|
8/17 | $11,023 | $11,023 |
|---|
9/17 | $10,993 | $10,979 |
|---|
10/17 | $11,188 | $11,364 |
|---|
11/17 | $11,218 | $11,387 |
|---|
12/17 | $11,548 | $11,795 |
|---|
1/18 | $12,449 | $12,778 |
|---|
2/18 | $11,820 | $12,189 |
|---|
3/18 | $11,729 | $11,962 |
|---|
4/18 | $11,392 | $11,910 |
|---|
5/18 | $10,833 | $11,488 |
|---|
6/18 | $10,421 | $11,010 |
|---|
7/18 | $10,634 | $11,252 |
|---|
8/18 | $10,322 | $10,948 |
|---|
9/18 | $10,101 | $10,890 |
|---|
10/18 | $9,382 | $9,941 |
|---|
11/18 | $9,720 | $10,351 |
|---|
12/18 | $9,439 | $10,077 |
|---|
1/19 | $10,178 | $10,959 |
|---|
2/19 | $10,047 | $10,984 |
|---|
3/19 | $10,104 | $11,076 |
|---|
4/19 | $10,366 | $11,309 |
|---|
5/19 | $9,780 | $10,489 |
|---|
6/19 | $10,314 | $11,143 |
|---|
7/19 | $10,235 | $11,007 |
|---|
8/19 | $9,872 | $10,470 |
|---|
9/19 | $10,064 | $10,670 |
|---|
10/19 | $10,488 | $11,120 |
|---|
11/19 | $10,405 | $11,105 |
|---|
12/19 | $11,153 | $11,933 |
|---|
1/20 | $10,576 | $11,377 |
|---|
2/20 | $10,109 | $10,777 |
|---|
3/20 | $8,147 | $9,117 |
|---|
4/20 | $8,773 | $9,952 |
|---|
5/20 | $9,046 | $10,028 |
|---|
6/20 | $9,742 | $10,766 |
|---|
7/20 | $10,740 | $11,728 |
|---|
8/20 | $10,894 | $11,987 |
|---|
9/20 | $10,790 | $11,795 |
|---|
10/20 | $10,795 | $12,038 |
|---|
11/20 | $11,734 | $13,151 |
|---|
12/20 | $12,639 | $14,118 |
|---|
1/21 | $12,973 | $14,551 |
|---|
2/21 | $13,098 | $14,662 |
|---|
3/21 | $12,903 | $14,440 |
|---|
4/21 | $13,268 | $14,800 |
|---|
5/21 | $13,573 | $15,143 |
|---|
6/21 | $13,723 | $15,169 |
|---|
7/21 | $13,048 | $14,148 |
|---|
8/21 | $13,603 | $14,519 |
|---|
9/21 | $12,923 | $13,942 |
|---|
10/21 | $13,203 | $14,079 |
|---|
11/21 | $12,474 | $13,506 |
|---|
12/21 | $12,946 | $13,759 |
|---|
1/22 | $12,514 | $13,499 |
|---|
2/22 | $11,565 | $13,095 |
|---|
3/22 | $11,323 | $12,799 |
|---|
4/22 | $10,331 | $12,087 |
|---|
5/22 | $10,509 | $12,141 |
|---|
6/22 | $9,495 | $11,334 |
|---|
7/22 | $9,765 | $11,306 |
|---|
8/22 | $9,608 | $11,353 |
|---|
9/22 | $8,670 | $10,022 |
|---|
10/22 | $8,735 | $9,711 |
|---|
11/22 | $9,980 | $11,151 |
|---|
12/22 | $9,594 | $10,995 |
|---|
1/23 | $10,384 | $11,863 |
|---|
2/23 | $9,627 | $11,094 |
|---|
3/23 | $9,829 | $11,430 |
|---|
4/23 | $9,807 | $11,300 |
|---|
5/23 | $9,688 | $11,110 |
|---|
6/23 | $10,180 | $11,532 |
|---|
7/23 | $10,655 | $12,250 |
|---|
8/23 | $10,012 | $11,495 |
|---|
9/23 | $9,801 | $11,195 |
|---|
10/23 | $9,536 | $10,760 |
|---|
11/23 | $10,185 | $11,621 |
|---|
12/23 | $10,691 | $12,075 |
|---|
1/24 | $10,349 | $11,514 |
|---|
2/24 | $10,818 | $12,062 |
|---|
3/24 | $11,150 | $12,361 |
|---|
4/24 | $11,222 | $12,416 |
|---|
5/24 | $11,366 | $12,487 |
|---|
6/24 | $11,885 | $12,979 |
|---|
7/24 | $11,786 | $13,018 |
|---|
8/24 | $11,858 | $13,228 |
|---|
9/24 | $12,372 | $14,111 |
|---|
10/24 | $11,913 | $13,484 |
|---|
11/24 | $11,642 | $12,999 |
|---|
12/24 | $11,514 | $12,981 |
|---|
|
|
| Average Annual Return [Table Text Block] |
AATR | 1 Year | 5 Years | Since 4/30/15
(Inception) |
|---|
Class C, with conversion to Class A after 8 years | 6.89% | 0.40% | 1.47% |
|---|
Class C, with 1% maximum contingent deferred sales charge and conversion to Class A after 8 years | 5.89% | 0.40% | 1.47% |
|---|
MSCI Emerging Markets Index | 7.50% | 1.70% | 2.73% |
|---|
|
|
| Performance Inception Date |
Apr. 30, 2015
|
|
| AssetsNet |
$ 518,898,517
|
|
| Holdings Count | Holding |
97
|
|
| Advisory Fees Paid, Amount |
$ 3,648,970
|
|
| InvestmentCompanyPortfolioTurnover |
41.00%
|
|
| Additional Fund Statistics [Text Block] |
Total Net Assets | $518,898,517 |
|---|
# of Portfolio Holdings | 97 |
|---|
Portfolio Turnover Rate | 41% |
|---|
Total Advisory Fees Paid | $3,648,970 |
|---|
|
|
| Holdings [Text Block] |
Country Weightings (% of total investments)Value | Value |
|---|
Other | 5.0% | Poland | 2.0% | Indonesia | 2.6% | South Africa | 3.9% | Mexico | 4.5% | Brazil | 4.9% | United States | 4.9% | Korea, Republic of | 6.4% | Taiwan | 20.1% | China | 21.6% | India | 24.1% |
Top Ten Holdings (% of total investments)Footnote ReferenceaTaiwan Semiconductor Manufacturing Co. Ltd. | 12.7% | Tencent Holdings Ltd. | 5.1% | Mahindra & Mahindra Ltd. | 2.9% | Alibaba Group Holding Ltd. | 2.7% | China Construction Bank Corp. | 2.3% | WEG SA | 2.0% | Samsung Electronics Co. Ltd. | 2.0% | Reliance Industries Ltd. | 1.9% | ICICI Bank Ltd. | 1.9% | State Bank of India | 1.7% | Total | 35.2% |
| Footnote | Description | Footnotea | Excluding cash equivalents. |
|
|
| Material Fund Change [Text Block] |
|
|
| Updated Prospectus Web Address |
<span style="box-sizing: border-box; color: rgb(0, 0, 0); display: inline; flex-wrap: nowrap; font-size: 10.6667px; font-weight: 400; grid-area: auto; line-height: 16px; margin: 0px; overflow: visible; text-align: left;">www.morganstanley.com/im/shareholderreports</span>
|
|
| C000007746 |
|
|
| Shareholder Report [Line Items] |
|
|
| Fund Name |
Morgan Stanley Institutional Fund, Inc. - Emerging Markets Portfolio
|
|
| Class Name |
Class I
|
|
| Trading Symbol |
MGEMX
|
|
| Annual or Semi-Annual Statement [Text Block] |
This annual shareholder report contains important information about Morgan Stanley Institutional Fund, Inc. - Emerging Markets Portfolio for the period of January 1, 2024 to December 31, 2024.
|
|
| Shareholder Report Annual or Semi-Annual |
Annual Shareholder Report
|
|
| Additional Information [Text Block] |
You can find additional information about the Fund at www.morganstanley.com/im/shareholderreports. You can also request this information by contacting us at 1-800-869-6397.
|
|
| Additional Information Phone Number |
1-800-869-6397
|
|
| Additional Information Website |
<span style="box-sizing: border-box; color: rgb(0, 0, 0); display: inline; flex-wrap: nowrap; font-size: 10.6667px; font-weight: 400; grid-area: auto; line-height: 16px; margin: 0px; overflow: visible; text-align: left;">www.morganstanley.com/im/shareholderreports</span>
|
|
| Expenses [Text Block] |
What were the Fund costs for the last year?(based on a hypothetical $10,000 investment) Class Name | Costs of a $10,000 investment | Costs paid as a percentage of a $10,000 investment |
|---|
Class I | $103 | 0.99% |
|---|
|
|
| Expenses Paid, Amount |
$ 103
|
|
| Expense Ratio, Percent |
0.99%
|
|
| Factors Affecting Performance [Text Block] |
How did the Fund perform last year and what affected its performance?Key contributors to ↑ and detractors from ↓ performance, relative to the MSCI Emerging Markets Index: ↑ Positioning in India, through the allocations to select consumer, industrial and health care companies
↑ The underweight allocation to and positioning in Korea, where equities underperformed on currency weakness and political volatility
↑ Stock selections in South Africa and Taiwan, through allocations to a leading bank and consumer company in South Africa and overweights to select technology companies in Taiwan
↓ Positioning in Poland, as the allocation to an apparel retailer (sold) underperformed following a short-seller report
↓ Overweight allocations to Mexico, which sold off following both the Mexico and U.S. elections, and Brazil, which underperformed on budget and fiscal risks
↓ Underweight allocation to China, which outperformed for the full year after rallying in September |
|
| Line Graph [Table Text Block] |
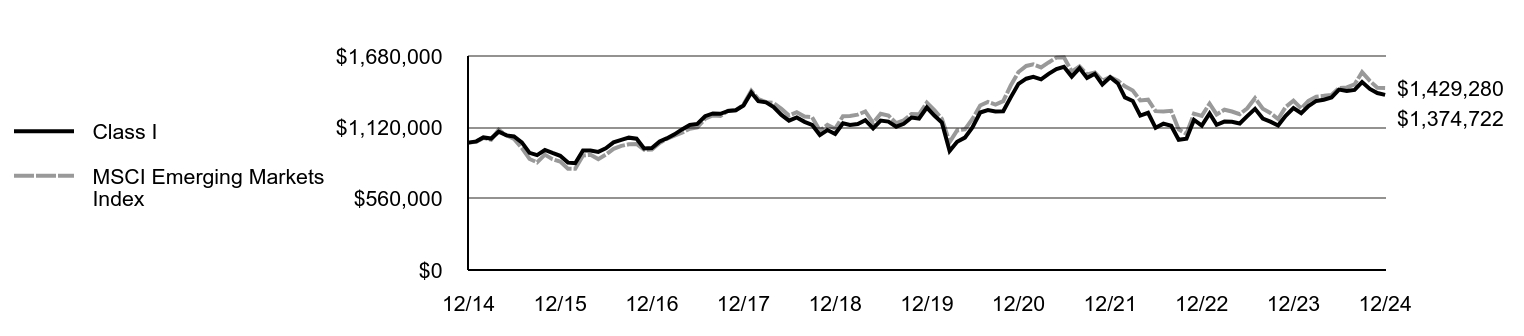 | Class I | MSCI Emerging Markets Index |
|---|
12/14 | $1,000,000 | $1,000,000 |
|---|
1/15 | $1,009,941 | $1,005,995 |
|---|
2/15 | $1,040,669 | $1,037,143 |
|---|
3/15 | $1,031,631 | $1,022,394 |
|---|
4/15 | $1,085,856 | $1,101,032 |
|---|
5/15 | $1,056,936 | $1,056,939 |
|---|
6/15 | $1,047,899 | $1,029,489 |
|---|
7/15 | $1,002,180 | $958,126 |
|---|
8/15 | $919,344 | $871,467 |
|---|
9/15 | $901,691 | $845,249 |
|---|
10/15 | $941,977 | $905,544 |
|---|
11/15 | $918,892 | $870,221 |
|---|
12/15 | $896,707 | $850,823 |
|---|
1/16 | $843,397 | $795,626 |
|---|
2/16 | $837,929 | $794,324 |
|---|
3/16 | $937,715 | $899,435 |
|---|
4/16 | $938,626 | $904,324 |
|---|
5/16 | $927,235 | $870,590 |
|---|
6/16 | $955,485 | $905,385 |
|---|
7/16 | $1,002,085 | $950,946 |
|---|
8/16 | $1,021,224 | $974,579 |
|---|
9/16 | $1,038,996 | $987,111 |
|---|
10/16 | $1,030,794 | $989,464 |
|---|
11/16 | $954,692 | $943,918 |
|---|
12/16 | $957,031 | $946,003 |
|---|
1/17 | $1,008,489 | $997,771 |
|---|
2/17 | $1,032,840 | $1,028,315 |
|---|
3/17 | $1,065,001 | $1,054,273 |
|---|
4/17 | $1,103,595 | $1,077,354 |
|---|
5/17 | $1,138,513 | $1,109,206 |
|---|
6/17 | $1,147,242 | $1,120,372 |
|---|
7/17 | $1,207,214 | $1,187,156 |
|---|
8/17 | $1,228,829 | $1,213,636 |
|---|
9/17 | $1,226,529 | $1,208,811 |
|---|
10/17 | $1,249,064 | $1,251,186 |
|---|
11/17 | $1,253,663 | $1,253,698 |
|---|
12/17 | $1,291,724 | $1,298,702 |
|---|
1/18 | $1,393,896 | $1,406,944 |
|---|
2/18 | $1,325,011 | $1,342,056 |
|---|
3/18 | $1,315,764 | $1,317,103 |
|---|
4/18 | $1,279,241 | $1,311,276 |
|---|
5/18 | $1,217,290 | $1,264,812 |
|---|
6/18 | $1,172,445 | $1,212,263 |
|---|
7/18 | $1,197,475 | $1,238,893 |
|---|
8/18 | $1,163,262 | $1,205,394 |
|---|
9/18 | $1,139,682 | $1,198,997 |
|---|
10/18 | $1,059,234 | $1,094,585 |
|---|
11/18 | $1,098,533 | $1,139,693 |
|---|
12/18 | $1,067,958 | $1,109,501 |
|---|
1/19 | $1,152,295 | $1,206,646 |
|---|
2/19 | $1,138,555 | $1,209,359 |
|---|
3/19 | $1,145,662 | $1,219,509 |
|---|
4/19 | $1,176,459 | $1,245,182 |
|---|
5/19 | $1,111,548 | $1,154,829 |
|---|
6/19 | $1,173,143 | $1,226,904 |
|---|
7/19 | $1,165,088 | $1,211,901 |
|---|
8/19 | $1,124,814 | $1,152,813 |
|---|
9/19 | $1,148,031 | $1,174,820 |
|---|
10/19 | $1,197,307 | $1,224,358 |
|---|
11/19 | $1,189,252 | $1,222,674 |
|---|
12/19 | $1,275,537 | $1,313,891 |
|---|
1/20 | $1,210,387 | $1,252,645 |
|---|
2/20 | $1,158,159 | $1,186,589 |
|---|
3/20 | $934,712 | $1,003,827 |
|---|
4/20 | $1,006,861 | $1,095,751 |
|---|
5/20 | $1,039,167 | $1,104,168 |
|---|
6/20 | $1,119,931 | $1,185,334 |
|---|
7/20 | $1,236,232 | $1,291,258 |
|---|
8/20 | $1,255,077 | $1,319,800 |
|---|
9/20 | $1,244,308 | $1,298,632 |
|---|
10/20 | $1,245,923 | $1,325,387 |
|---|
11/20 | $1,355,224 | $1,447,969 |
|---|
12/20 | $1,461,484 | $1,554,414 |
|---|
1/21 | $1,501,763 | $1,602,069 |
|---|
2/21 | $1,517,004 | $1,614,323 |
|---|
3/21 | $1,496,320 | $1,589,942 |
|---|
4/21 | $1,539,321 | $1,629,528 |
|---|
5/21 | $1,576,878 | $1,667,318 |
|---|
6/21 | $1,595,385 | $1,670,191 |
|---|
7/21 | $1,518,637 | $1,557,790 |
|---|
8/21 | $1,585,043 | $1,598,565 |
|---|
9/21 | $1,507,206 | $1,535,037 |
|---|
10/21 | $1,540,409 | $1,550,177 |
|---|
11/21 | $1,457,129 | $1,487,002 |
|---|
12/21 | $1,513,391 | $1,514,904 |
|---|
1/22 | $1,464,610 | $1,486,228 |
|---|
2/22 | $1,355,151 | $1,441,805 |
|---|
3/22 | $1,327,191 | $1,409,240 |
|---|
4/22 | $1,212,378 | $1,330,849 |
|---|
5/22 | $1,234,389 | $1,336,709 |
|---|
6/22 | $1,116,007 | $1,247,885 |
|---|
7/22 | $1,148,725 | $1,244,820 |
|---|
8/22 | $1,132,069 | $1,250,017 |
|---|
9/22 | $1,022,015 | $1,103,474 |
|---|
10/22 | $1,030,938 | $1,069,213 |
|---|
11/22 | $1,179,065 | $1,227,797 |
|---|
12/22 | $1,134,097 | $1,210,539 |
|---|
1/23 | $1,229,226 | $1,306,125 |
|---|
2/23 | $1,140,314 | $1,221,433 |
|---|
3/23 | $1,165,185 | $1,258,427 |
|---|
4/23 | $1,163,319 | $1,244,165 |
|---|
5/23 | $1,150,262 | $1,223,268 |
|---|
6/23 | $1,208,086 | $1,269,715 |
|---|
7/23 | $1,265,289 | $1,348,757 |
|---|
8/23 | $1,189,434 | $1,265,673 |
|---|
9/23 | $1,164,563 | $1,232,573 |
|---|
10/23 | $1,134,097 | $1,184,681 |
|---|
11/23 | $1,211,195 | $1,279,492 |
|---|
12/23 | $1,272,024 | $1,329,512 |
|---|
1/24 | $1,231,218 | $1,267,778 |
|---|
2/24 | $1,287,327 | $1,328,090 |
|---|
3/24 | $1,327,496 | $1,360,999 |
|---|
4/24 | $1,336,423 | $1,367,089 |
|---|
5/24 | $1,354,276 | $1,374,810 |
|---|
6/24 | $1,416,123 | $1,429,038 |
|---|
7/24 | $1,405,284 | $1,433,290 |
|---|
8/24 | $1,413,573 | $1,456,432 |
|---|
9/24 | $1,475,421 | $1,553,685 |
|---|
10/24 | $1,421,224 | $1,484,587 |
|---|
11/24 | $1,389,344 | $1,431,246 |
|---|
12/24 | $1,374,722 | $1,429,280 |
|---|
|
|
| Average Annual Return [Table Text Block] |
AATR | 1 Year | 5 Years | 10 Years |
|---|
Class I | 8.07% | 1.51% | 3.23% |
|---|
MSCI Emerging Markets Index | 7.50% | 1.70% | 3.64% |
|---|
|
|
| AssetsNet |
$ 518,898,517
|
|
| Holdings Count | Holding |
97
|
|
| Advisory Fees Paid, Amount |
$ 3,648,970
|
|
| InvestmentCompanyPortfolioTurnover |
41.00%
|
|
| Additional Fund Statistics [Text Block] |
Total Net Assets | $518,898,517 |
|---|
# of Portfolio Holdings | 97 |
|---|
Portfolio Turnover Rate | 41% |
|---|
Total Advisory Fees Paid | $3,648,970 |
|---|
|
|
| Holdings [Text Block] |
Country Weightings (% of total investments)Value | Value |
|---|
Other | 5.0% | Poland | 2.0% | Indonesia | 2.6% | South Africa | 3.9% | Mexico | 4.5% | Brazil | 4.9% | United States | 4.9% | Korea, Republic of | 6.4% | Taiwan | 20.1% | China | 21.6% | India | 24.1% |
Top Ten Holdings (% of total investments)Footnote ReferenceaTaiwan Semiconductor Manufacturing Co. Ltd. | 12.7% | Tencent Holdings Ltd. | 5.1% | Mahindra & Mahindra Ltd. | 2.9% | Alibaba Group Holding Ltd. | 2.7% | China Construction Bank Corp. | 2.3% | WEG SA | 2.0% | Samsung Electronics Co. Ltd. | 2.0% | Reliance Industries Ltd. | 1.9% | ICICI Bank Ltd. | 1.9% | State Bank of India | 1.7% | Total | 35.2% |
| Footnote | Description | Footnotea | Excluding cash equivalents. |
|
|
| Material Fund Change [Text Block] |
|
|
| Updated Prospectus Web Address |
<span style="box-sizing: border-box; color: rgb(0, 0, 0); display: inline; flex-wrap: nowrap; font-size: 10.6667px; font-weight: 400; grid-area: auto; line-height: 16px; margin: 0px; overflow: visible; text-align: left;">www.morganstanley.com/im/shareholderreports</span>
|
|
| C000198815 |
|
|
| Shareholder Report [Line Items] |
|
|
| Fund Name |
Morgan Stanley Institutional Fund, Inc. - Emerging Markets Portfolio
|
|
| Class Name |
Class IR
|
|
| Trading Symbol |
MRGEX
|
|
| Annual or Semi-Annual Statement [Text Block] |
This annual shareholder report contains important information about Morgan Stanley Institutional Fund, Inc. - Emerging Markets Portfolio for the period of January 1, 2024 to December 31, 2024.
|
|
| Shareholder Report Annual or Semi-Annual |
Annual Shareholder Report
|
|
| Additional Information [Text Block] |
You can find additional information about the Fund at www.morganstanley.com/im/shareholderreports. You can also request this information by contacting us at 1-800-869-6397.
|
|
| Additional Information Phone Number |
1-800-869-6397
|
|
| Additional Information Website |
<span style="box-sizing: border-box; color: rgb(0, 0, 0); display: inline; flex-wrap: nowrap; font-size: 10.6667px; font-weight: 400; grid-area: auto; line-height: 16px; margin: 0px; overflow: visible; text-align: left;">www.morganstanley.com/im/shareholderreports</span>
|
|
| Expenses [Text Block] |
What were the Fund costs for the last year?(based on a hypothetical $10,000 investment) Class Name | Costs of a $10,000 investment | Costs paid as a percentage of a $10,000 investment |
|---|
Class IR | $99 | 0.95% |
|---|
|
|
| Expenses Paid, Amount |
$ 99
|
|
| Expense Ratio, Percent |
0.95%
|
|
| Factors Affecting Performance [Text Block] |
How did the Fund perform last year and what affected its performance?Key contributors to ↑ and detractors from ↓ performance, relative to the MSCI Emerging Markets Index: ↑ Positioning in India, through the allocations to select consumer, industrial and health care companies
↑ The underweight allocation to and positioning in Korea, where equities underperformed on currency weakness and political volatility
↑ Stock selections in South Africa and Taiwan, through allocations to a leading bank and consumer company in South Africa and overweights to select technology companies in Taiwan
↓ Positioning in Poland, as the allocation to an apparel retailer (sold) underperformed following a short-seller report
↓ Overweight allocations to Mexico, which sold off following both the Mexico and U.S. elections, and Brazil, which underperformed on budget and fiscal risks
↓ Underweight allocation to China, which outperformed for the full year after rallying in September |
|
| Line Graph [Table Text Block] |
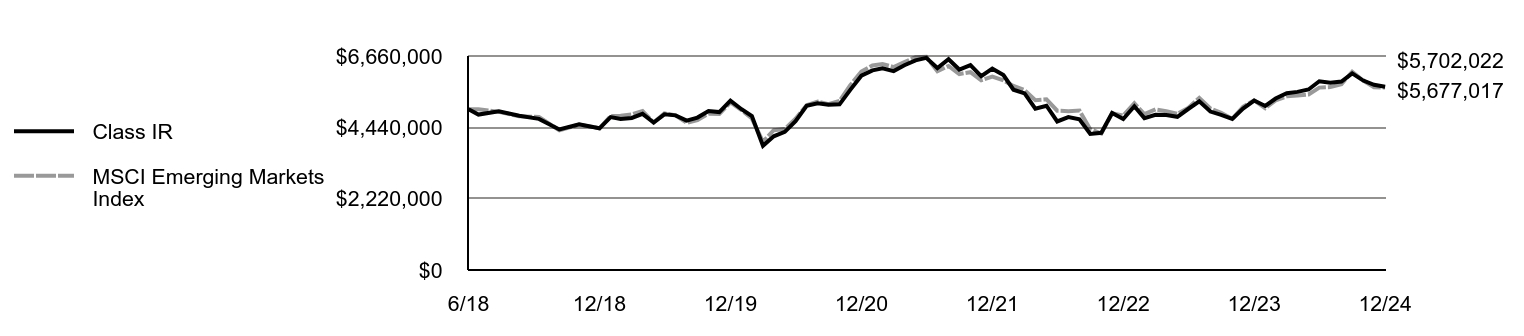 | Class IR | MSCI Emerging Markets Index |
|---|
6/18 | $5,000,000 | $5,000,000 |
|---|
6/18 | $4,837,972 | $5,000,000 |
|---|
7/18 | $4,941,175 | $4,920,809 |
|---|
8/18 | $4,802,014 | $4,787,754 |
|---|
9/18 | $4,702,885 | $4,762,344 |
|---|
10/18 | $4,373,093 | $4,347,627 |
|---|
11/18 | $4,535,130 | $4,526,791 |
|---|
12/18 | $4,409,110 | $4,406,871 |
|---|
1/19 | $4,757,301 | $4,792,725 |
|---|
2/19 | $4,700,573 | $4,803,501 |
|---|
3/19 | $4,731,871 | $4,843,816 |
|---|
4/19 | $4,859,019 | $4,945,787 |
|---|
5/19 | $4,591,030 | $4,586,914 |
|---|
6/19 | $4,843,370 | $4,873,188 |
|---|
7/19 | $4,812,072 | $4,813,599 |
|---|
8/19 | $4,647,758 | $4,578,904 |
|---|
9/19 | $4,743,608 | $4,666,314 |
|---|
10/19 | $4,947,045 | $4,863,078 |
|---|
11/19 | $4,913,791 | $4,856,386 |
|---|
12/19 | $5,270,265 | $5,218,698 |
|---|
1/20 | $5,003,191 | $4,975,431 |
|---|
2/20 | $4,787,306 | $4,713,060 |
|---|
3/20 | $3,863,674 | $3,987,142 |
|---|
4/20 | $4,161,907 | $4,352,259 |
|---|
5/20 | $4,297,670 | $4,385,688 |
|---|
6/20 | $4,631,513 | $4,708,076 |
|---|
7/20 | $5,112,246 | $5,128,798 |
|---|
8/20 | $5,190,143 | $5,242,168 |
|---|
9/20 | $5,145,631 | $5,158,087 |
|---|
10/20 | $5,154,533 | $5,264,359 |
|---|
11/20 | $5,606,334 | $5,751,246 |
|---|
12/20 | $6,046,416 | $6,174,041 |
|---|
1/21 | $6,213,058 | $6,363,323 |
|---|
2/21 | $6,278,364 | $6,411,994 |
|---|
3/21 | $6,190,539 | $6,315,156 |
|---|
4/21 | $6,370,693 | $6,472,389 |
|---|
5/21 | $6,526,076 | $6,622,486 |
|---|
6/21 | $6,602,641 | $6,633,899 |
|---|
7/21 | $6,285,120 | $6,187,448 |
|---|
8/21 | $6,559,854 | $6,349,406 |
|---|
9/21 | $6,237,829 | $6,097,077 |
|---|
10/21 | $6,377,449 | $6,157,211 |
|---|
11/21 | $6,032,904 | $5,906,285 |
|---|
12/21 | $6,265,946 | $6,017,107 |
|---|
1/22 | $6,066,362 | $5,903,210 |
|---|
2/22 | $5,610,523 | $5,726,762 |
|---|
3/22 | $5,497,179 | $5,597,419 |
|---|
4/22 | $5,021,627 | $5,286,055 |
|---|
5/22 | $5,112,795 | $5,309,328 |
|---|
6/22 | $4,622,460 | $4,956,526 |
|---|
7/22 | $4,760,444 | $4,944,350 |
|---|
8/22 | $4,688,988 | $4,964,991 |
|---|
9/22 | $4,235,612 | $4,382,934 |
|---|
10/22 | $4,270,108 | $4,246,851 |
|---|
11/22 | $4,886,108 | $4,876,735 |
|---|
12/22 | $4,700,894 | $4,808,189 |
|---|
1/23 | $5,095,428 | $5,187,851 |
|---|
2/23 | $4,726,680 | $4,851,458 |
|---|
3/23 | $4,829,827 | $4,998,395 |
|---|
4/23 | $4,824,669 | $4,941,750 |
|---|
5/23 | $4,767,939 | $4,858,747 |
|---|
6/23 | $5,010,333 | $5,043,233 |
|---|
7/23 | $5,247,569 | $5,357,181 |
|---|
8/23 | $4,930,394 | $5,027,178 |
|---|
9/23 | $4,829,827 | $4,895,706 |
|---|
10/23 | $4,700,894 | $4,705,484 |
|---|
11/23 | $5,023,226 | $5,082,064 |
|---|
12/23 | $5,273,521 | $5,280,744 |
|---|
1/24 | $5,104,176 | $5,035,540 |
|---|
2/24 | $5,337,026 | $5,275,092 |
|---|
3/24 | $5,503,725 | $5,405,807 |
|---|
4/24 | $5,543,415 | $5,429,994 |
|---|
5/24 | $5,617,504 | $5,460,664 |
|---|
6/24 | $5,874,168 | $5,676,052 |
|---|
7/24 | $5,826,540 | $5,692,944 |
|---|
8/24 | $5,863,584 | $5,784,859 |
|---|
9/24 | $6,120,248 | $6,171,144 |
|---|
10/24 | $5,895,336 | $5,896,693 |
|---|
11/24 | $5,763,035 | $5,684,823 |
|---|
12/24 | $5,702,022 | $5,677,017 |
|---|
|
|
| Average Annual Return [Table Text Block] |
AATR | 1 Year | 5 Years | Since 6/15/18
(Inception) |
|---|
Class IR | 8.13% | 1.59% | 2.03% |
|---|
MSCI Emerging Markets Index | 7.50% | 1.70% | 1.96% |
|---|
|
|
| Performance Inception Date |
Jun. 15, 2018
|
|
| AssetsNet |
$ 518,898,517
|
|
| Holdings Count | Holding |
97
|
|
| Advisory Fees Paid, Amount |
$ 3,648,970
|
|
| InvestmentCompanyPortfolioTurnover |
41.00%
|
|
| Additional Fund Statistics [Text Block] |
Total Net Assets | $518,898,517 |
|---|
# of Portfolio Holdings | 97 |
|---|
Portfolio Turnover Rate | 41% |
|---|
Total Advisory Fees Paid | $3,648,970 |
|---|
|
|
| Holdings [Text Block] |
Country Weightings (% of total investments)Value | Value |
|---|
Other | 5.0% | Poland | 2.0% | Indonesia | 2.6% | South Africa | 3.9% | Mexico | 4.5% | Brazil | 4.9% | United States | 4.9% | Korea, Republic of | 6.4% | Taiwan | 20.1% | China | 21.6% | India | 24.1% |
Top Ten Holdings (% of total investments)Footnote ReferenceaTaiwan Semiconductor Manufacturing Co. Ltd. | 12.7% | Tencent Holdings Ltd. | 5.1% | Mahindra & Mahindra Ltd. | 2.9% | Alibaba Group Holding Ltd. | 2.7% | China Construction Bank Corp. | 2.3% | WEG SA | 2.0% | Samsung Electronics Co. Ltd. | 2.0% | Reliance Industries Ltd. | 1.9% | ICICI Bank Ltd. | 1.9% | State Bank of India | 1.7% | Total | 35.2% |
| Footnote | Description | Footnotea | Excluding cash equivalents. |
|
|
| Material Fund Change [Text Block] |
|
|
| Updated Prospectus Web Address |
<span style="box-sizing: border-box; color: rgb(0, 0, 0); display: inline; flex-wrap: nowrap; font-size: 10.6667px; font-weight: 400; grid-area: auto; line-height: 16px; margin: 0px; overflow: visible; text-align: left;">www.morganstanley.com/im/shareholderreports</span>
|
|
| C000113803 |
|
|
| Shareholder Report [Line Items] |
|
|
| Fund Name |
Morgan Stanley Institutional Fund, Inc. - Emerging Markets Portfolio
|
|
| Class Name |
Class L
|
|
| Trading Symbol |
MSELX
|
|
| Annual or Semi-Annual Statement [Text Block] |
This annual shareholder report contains important information about Morgan Stanley Institutional Fund, Inc. - Emerging Markets Portfolio for the period of January 1, 2024 to December 31, 2024.
|
|
| Shareholder Report Annual or Semi-Annual |
Annual Shareholder Report
|
|
| Additional Information [Text Block] |
You can find additional information about the Fund at www.morganstanley.com/im/shareholderreports. You can also request this information by contacting us at 1-800-869-6397.
|
|
| Additional Information Phone Number |
1-800-869-6397
|
|
| Additional Information Website |
<span style="box-sizing: border-box; color: rgb(0, 0, 0); display: inline; flex-wrap: nowrap; font-size: 10.6667px; font-weight: 400; grid-area: auto; line-height: 16px; margin: 0px; overflow: visible; text-align: left;">www.morganstanley.com/im/shareholderreports</span>
|
|
| Expenses [Text Block] |
What were the Fund costs for the last year?(based on a hypothetical $10,000 investment) Class Name | Costs of a $10,000 investment | Costs paid as a percentage of a $10,000 investment |
|---|
Class L | $192 | 1.85% |
|---|
|
|
| Expenses Paid, Amount |
$ 192
|
|
| Expense Ratio, Percent |
1.85%
|
|
| Factors Affecting Performance [Text Block] |
How did the Fund perform last year and what affected its performance?Key contributors to ↑ and detractors from ↓ performance, relative to the MSCI Emerging Markets Index: ↓ Positioning in Poland, as the allocation to an apparel retailer (sold) underperformed following a short-seller report
↓ Overweight allocations to Mexico, which sold off following both the Mexico and U.S. elections, and Brazil, which underperformed on budget and fiscal risks
↓ Underweight allocation to China, which outperformed for the full year after rallying in September
↑ Positioning in India, through the allocations to select consumer, industrial and health care companies
↑ The underweight allocation to and positioning in Korea, where equities underperformed on currency weakness and political volatility
↑ Stock selections in South Africa and Taiwan, through allocations to a leading bank and consumer company in South Africa and overweights to select technology companies in Taiwan |
|
| Line Graph [Table Text Block] |
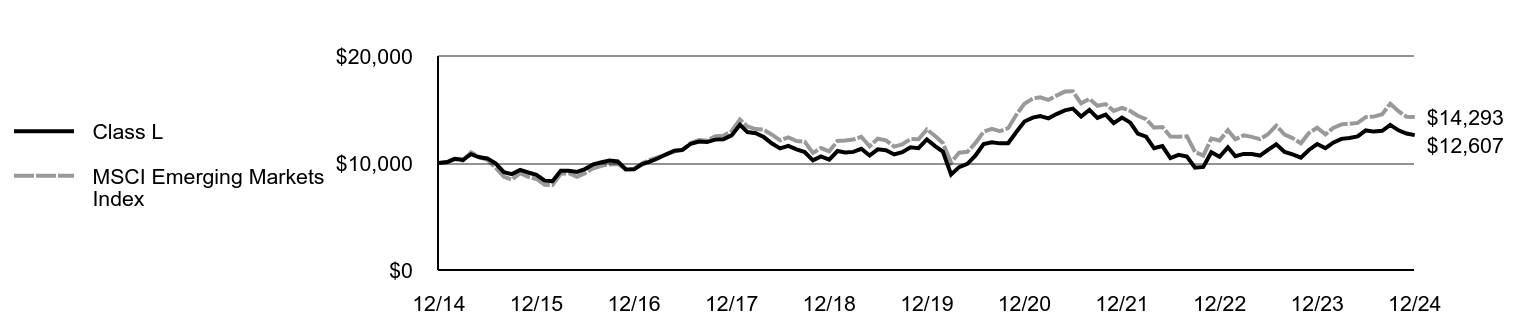 | Class L | MSCI Emerging Markets Index |
|---|
12/14 | $10,000 | $10,000 |
|---|
1/15 | $10,089 | $10,060 |
|---|
2/15 | $10,393 | $10,371 |
|---|
3/15 | $10,295 | $10,224 |
|---|
4/15 | $10,827 | $11,010 |
|---|
5/15 | $10,528 | $10,569 |
|---|
6/15 | $10,430 | $10,295 |
|---|
7/15 | $9,966 | $9,581 |
|---|
8/15 | $9,142 | $8,715 |
|---|
9/15 | $8,959 | $8,452 |
|---|
10/15 | $9,353 | $9,055 |
|---|
11/15 | $9,114 | $8,702 |
|---|
12/15 | $8,889 | $8,508 |
|---|
1/16 | $8,355 | $7,956 |
|---|
2/16 | $8,294 | $7,943 |
|---|
3/16 | $9,278 | $8,994 |
|---|
4/16 | $9,278 | $9,043 |
|---|
5/16 | $9,161 | $8,706 |
|---|
6/16 | $9,433 | $9,054 |
|---|
7/16 | $9,882 | $9,509 |
|---|
8/16 | $10,069 | $9,746 |
|---|
9/16 | $10,238 | $9,871 |
|---|
10/16 | $10,149 | $9,895 |
|---|
11/16 | $9,390 | $9,439 |
|---|
12/16 | $9,404 | $9,460 |
|---|
1/17 | $9,901 | $9,978 |
|---|
2/17 | $10,135 | $10,283 |
|---|
3/17 | $10,444 | $10,543 |
|---|
4/17 | $10,814 | $10,774 |
|---|
5/17 | $11,147 | $11,092 |
|---|
6/17 | $11,222 | $11,204 |
|---|
7/17 | $11,800 | $11,872 |
|---|
8/17 | $12,002 | $12,136 |
|---|
9/17 | $11,974 | $12,088 |
|---|
10/17 | $12,185 | $12,512 |
|---|
11/17 | $12,222 | $12,537 |
|---|
12/17 | $12,583 | $12,987 |
|---|
1/18 | $13,568 | $14,069 |
|---|
2/18 | $12,888 | $13,421 |
|---|
3/18 | $12,789 | $13,171 |
|---|
4/18 | $12,424 | $13,113 |
|---|
5/18 | $11,814 | $12,648 |
|---|
6/18 | $11,369 | $12,123 |
|---|
7/18 | $11,604 | $12,389 |
|---|
8/18 | $11,266 | $12,054 |
|---|
9/18 | $11,027 | $11,990 |
|---|
10/18 | $10,244 | $10,946 |
|---|
11/18 | $10,615 | $11,397 |
|---|
12/18 | $10,314 | $11,095 |
|---|
1/19 | $11,119 | $12,066 |
|---|
2/19 | $10,981 | $12,094 |
|---|
3/19 | $11,038 | $12,195 |
|---|
4/19 | $11,329 | $12,452 |
|---|
5/19 | $10,695 | $11,548 |
|---|
6/19 | $11,277 | $12,269 |
|---|
7/19 | $11,196 | $12,119 |
|---|
8/19 | $10,800 | $11,528 |
|---|
9/19 | $11,015 | $11,748 |
|---|
10/19 | $11,477 | $12,244 |
|---|
11/19 | $11,391 | $12,227 |
|---|
12/19 | $12,209 | $13,139 |
|---|
1/20 | $11,582 | $12,526 |
|---|
2/20 | $11,074 | $11,866 |
|---|
3/20 | $8,927 | $10,038 |
|---|
4/20 | $9,614 | $10,958 |
|---|
5/20 | $9,917 | $11,042 |
|---|
6/20 | $10,679 | $11,853 |
|---|
7/20 | $11,777 | $12,913 |
|---|
8/20 | $11,944 | $13,198 |
|---|
9/20 | $11,836 | $12,986 |
|---|
10/20 | $11,847 | $13,254 |
|---|
11/20 | $12,874 | $14,480 |
|---|
12/20 | $13,875 | $15,544 |
|---|
1/21 | $14,245 | $16,021 |
|---|
2/21 | $14,381 | $16,143 |
|---|
3/21 | $14,175 | $15,899 |
|---|
4/21 | $14,572 | $16,295 |
|---|
5/21 | $14,914 | $16,673 |
|---|
6/21 | $15,083 | $16,702 |
|---|
7/21 | $14,343 | $15,578 |
|---|
8/21 | $14,958 | $15,986 |
|---|
9/21 | $14,213 | $15,350 |
|---|
10/21 | $14,523 | $15,502 |
|---|
11/21 | $13,723 | $14,870 |
|---|
12/21 | $14,242 | $15,149 |
|---|
1/22 | $13,774 | $14,862 |
|---|
2/22 | $12,738 | $14,418 |
|---|
3/22 | $12,466 | $14,092 |
|---|
4/22 | $11,376 | $13,308 |
|---|
5/22 | $11,577 | $13,367 |
|---|
6/22 | $10,458 | $12,479 |
|---|
7/22 | $10,760 | $12,448 |
|---|
8/22 | $10,594 | $12,500 |
|---|
9/22 | $9,558 | $11,035 |
|---|
10/22 | $9,635 | $10,692 |
|---|
11/22 | $11,009 | $12,278 |
|---|
12/22 | $10,584 | $12,105 |
|---|
1/23 | $11,464 | $13,061 |
|---|
2/23 | $10,627 | $12,214 |
|---|
3/23 | $10,849 | $12,584 |
|---|
4/23 | $10,830 | $12,442 |
|---|
5/23 | $10,695 | $12,233 |
|---|
6/23 | $11,230 | $12,697 |
|---|
7/23 | $11,753 | $13,488 |
|---|
8/23 | $11,039 | $12,657 |
|---|
9/23 | $10,799 | $12,326 |
|---|
10/23 | $10,504 | $11,847 |
|---|
11/23 | $11,218 | $12,795 |
|---|
12/23 | $11,769 | $13,295 |
|---|
1/24 | $11,380 | $12,678 |
|---|
2/24 | $11,894 | $13,281 |
|---|
3/24 | $12,258 | $13,610 |
|---|
4/24 | $12,333 | $13,671 |
|---|
5/24 | $12,483 | $13,748 |
|---|
6/24 | $13,047 | $14,290 |
|---|
7/24 | $12,934 | $14,333 |
|---|
8/24 | $13,010 | $14,564 |
|---|
9/24 | $13,567 | $15,537 |
|---|
10/24 | $13,054 | $14,846 |
|---|
11/24 | $12,753 | $14,312 |
|---|
12/24 | $12,607 | $14,293 |
|---|
|
|
| Average Annual Return [Table Text Block] |
AATR | 1 Year | 5 Years | 10 Years |
|---|
Class L | 7.12% | 0.64% | 2.34% |
|---|
MSCI Emerging Markets Index | 7.50% | 1.70% | 3.64% |
|---|
|
|
| AssetsNet |
$ 518,898,517
|
|
| Holdings Count | Holding |
97
|
|
| Advisory Fees Paid, Amount |
$ 3,648,970
|
|
| InvestmentCompanyPortfolioTurnover |
41.00%
|
|
| Additional Fund Statistics [Text Block] |
Total Net Assets | $518,898,517 |
|---|
# of Portfolio Holdings | 97 |
|---|
Portfolio Turnover Rate | 41% |
|---|
Total Advisory Fees Paid | $3,648,970 |
|---|
|
|
| Holdings [Text Block] |
Country Weightings (% of total investments)Value | Value |
|---|
Other | 5.0% | Poland | 2.0% | Indonesia | 2.6% | South Africa | 3.9% | Mexico | 4.5% | Brazil | 4.9% | United States | 4.9% | Korea, Republic of | 6.4% | Taiwan | 20.1% | China | 21.6% | India | 24.1% |
Top Ten Holdings (% of total investments)Footnote ReferenceaTaiwan Semiconductor Manufacturing Co. Ltd. | 12.7% | Tencent Holdings Ltd. | 5.1% | Mahindra & Mahindra Ltd. | 2.9% | Alibaba Group Holding Ltd. | 2.7% | China Construction Bank Corp. | 2.3% | WEG SA | 2.0% | Samsung Electronics Co. Ltd. | 2.0% | Reliance Industries Ltd. | 1.9% | ICICI Bank Ltd. | 1.9% | State Bank of India | 1.7% | Total | 35.2% |
| Footnote | Description | Footnotea | Excluding cash equivalents. |
|
|
| Material Fund Change [Text Block] |
|
|
| Updated Prospectus Web Address |
<span style="box-sizing: border-box; color: rgb(0, 0, 0); display: inline; flex-wrap: nowrap; font-size: 10.6667px; font-weight: 400; grid-area: auto; line-height: 16px; margin: 0px; overflow: visible; text-align: left;">www.morganstanley.com/im/shareholderreports</span>
|
|
| C000126912 |
|
|
| Shareholder Report [Line Items] |
|
|
| Fund Name |
Morgan Stanley Institutional Fund, Inc. - Emerging Markets Portfolio
|
|
| Class Name |
Class R6
|
|
| Trading Symbol |
MMMPX
|
|
| Annual or Semi-Annual Statement [Text Block] |
This annual shareholder report contains important information about Morgan Stanley Institutional Fund, Inc. - Emerging Markets Portfolio for the period of January 1, 2024 to December 31, 2024.
|
|
| Shareholder Report Annual or Semi-Annual |
Annual Shareholder Report
|
|
| Additional Information [Text Block] |
You can find additional information about the Fund at www.morganstanley.com/im/shareholderreports. You can also request this information by contacting us at 1-800-869-6397.
|
|
| Additional Information Phone Number |
1-800-869-6397
|
|
| Additional Information Website |
<span style="box-sizing: border-box; color: rgb(0, 0, 0); display: inline; flex-wrap: nowrap; font-size: 10.6667px; font-weight: 400; grid-area: auto; line-height: 16px; margin: 0px; overflow: visible; text-align: left;">www.morganstanley.com/im/shareholderreports</span>
|
|
| Expenses [Text Block] |
What were the Fund costs for the last year?(based on a hypothetical $10,000 investment) Class Name | Costs of a $10,000 investment | Costs paid as a percentage of a $10,000 investment |
|---|
Class R6 | $99 | 0.95% |
|---|
|
|
| Expenses Paid, Amount |
$ 99
|
|
| Expense Ratio, Percent |
0.95%
|
|
| Factors Affecting Performance [Text Block] |
How did the Fund perform last year and what affected its performance?Key contributors to ↑ and detractors from ↓ performance, relative to the MSCI Emerging Markets Index: ↑ Positioning in India, through the allocations to select consumer, industrial and health care companies
↑ The underweight allocation to and positioning in Korea, where equities underperformed on currency weakness and political volatility
↑ Stock selections in South Africa and Taiwan, through allocations to a leading bank and consumer company in South Africa and overweights to select technology companies in Taiwan
↓ Positioning in Poland, as the allocation to an apparel retailer (sold) underperformed following a short-seller report
↓ Overweight allocations to Mexico, which sold off following both the Mexico and U.S. elections, and Brazil, which underperformed on budget and fiscal risks
↓ Underweight allocation to China, which outperformed for the full year after rallying in September |
|
| Line Graph [Table Text Block] |
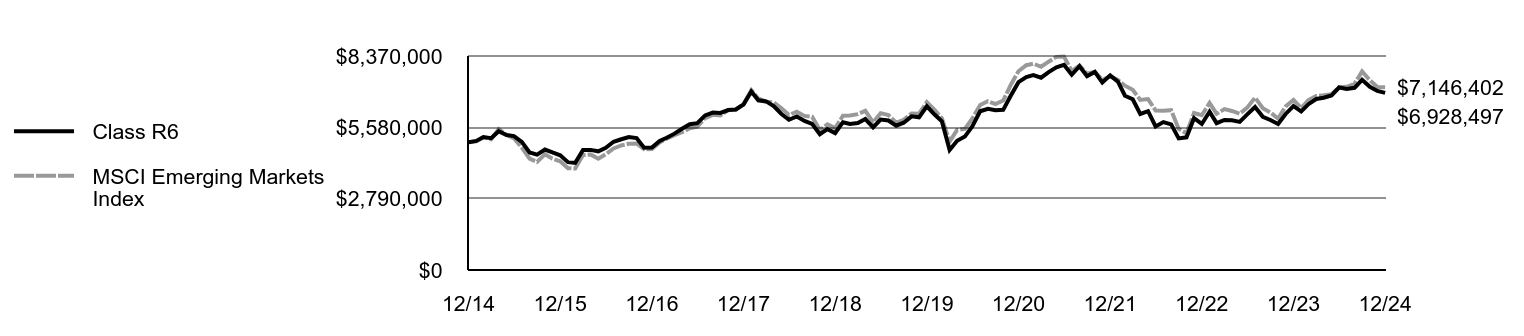 | Class R6 | MSCI Emerging Markets Index |
|---|
12/14 | $5,000,000 | $5,000,000 |
|---|
1/15 | $5,047,425 | $5,029,973 |
|---|
2/15 | $5,203,252 | $5,185,714 |
|---|
3/15 | $5,158,085 | $5,111,971 |
|---|
4/15 | $5,429,088 | $5,505,159 |
|---|
5/15 | $5,282,294 | $5,284,697 |
|---|
6/15 | $5,239,386 | $5,147,445 |
|---|
7/15 | $5,010,896 | $4,790,630 |
|---|
8/15 | $4,596,903 | $4,357,333 |
|---|
9/15 | $4,510,938 | $4,226,247 |
|---|
10/15 | $4,712,279 | $4,527,722 |
|---|
11/15 | $4,596,903 | $4,351,106 |
|---|
12/15 | $4,485,559 | $4,254,113 |
|---|
1/16 | $4,218,887 | $3,978,131 |
|---|
2/16 | $4,193,816 | $3,971,622 |
|---|
3/16 | $4,692,971 | $4,497,176 |
|---|
4/16 | $4,697,529 | $4,521,618 |
|---|
5/16 | $4,642,827 | $4,352,952 |
|---|
6/16 | $4,781,862 | $4,526,927 |
|---|
7/16 | $5,014,964 | $4,754,730 |
|---|
8/16 | $5,112,984 | $4,872,896 |
|---|
9/16 | $5,201,885 | $4,935,554 |
|---|
10/16 | $5,160,854 | $4,947,322 |
|---|
11/16 | $4,780,172 | $4,719,592 |
|---|
12/16 | $4,790,263 | $4,730,014 |
|---|
1/17 | $5,047,828 | $4,988,854 |
|---|
2/17 | $5,169,712 | $5,141,573 |
|---|
3/17 | $5,332,990 | $5,271,364 |
|---|
4/17 | $5,526,165 | $5,386,772 |
|---|
5/17 | $5,700,941 | $5,546,028 |
|---|
6/17 | $5,744,636 | $5,601,858 |
|---|
7/17 | $6,047,115 | $5,935,782 |
|---|
8/17 | $6,155,305 | $6,068,181 |
|---|
9/17 | $6,143,796 | $6,044,053 |
|---|
10/17 | $6,256,589 | $6,255,932 |
|---|
11/17 | $6,279,608 | $6,268,490 |
|---|
12/17 | $6,471,222 | $6,493,511 |
|---|
1/18 | $6,985,399 | $7,034,718 |
|---|
2/18 | $6,637,982 | $6,710,281 |
|---|
3/18 | $6,593,976 | $6,585,515 |
|---|
4/18 | $6,411,003 | $6,556,378 |
|---|
5/18 | $6,102,960 | $6,324,059 |
|---|
6/18 | $5,875,981 | $6,061,314 |
|---|
7/18 | $6,003,692 | $6,194,464 |
|---|
8/18 | $5,832,291 | $6,026,971 |
|---|
9/18 | $5,714,162 | $5,994,984 |
|---|
10/18 | $5,311,137 | $5,472,925 |
|---|
11/18 | $5,508,017 | $5,698,463 |
|---|
12/18 | $5,354,900 | $5,547,504 |
|---|
1/19 | $5,780,345 | $6,033,229 |
|---|
2/19 | $5,711,418 | $6,046,794 |
|---|
3/19 | $5,747,070 | $6,097,543 |
|---|
4/19 | $5,903,938 | $6,225,908 |
|---|
5/19 | $5,575,941 | $5,774,147 |
|---|
6/19 | $5,884,923 | $6,134,518 |
|---|
7/19 | $5,846,895 | $6,059,506 |
|---|
8/19 | $5,644,868 | $5,764,064 |
|---|
9/19 | $5,761,330 | $5,874,099 |
|---|
10/19 | $6,008,516 | $6,121,791 |
|---|
11/19 | $5,970,488 | $6,113,367 |
|---|
12/19 | $6,403,621 | $6,569,457 |
|---|
1/20 | $6,079,113 | $6,263,224 |
|---|
2/20 | $5,814,098 | $5,932,945 |
|---|
3/20 | $4,691,842 | $5,019,136 |
|---|
4/20 | $5,056,914 | $5,478,757 |
|---|
5/20 | $5,219,167 | $5,520,838 |
|---|
6/20 | $5,627,506 | $5,926,670 |
|---|
7/20 | $6,208,916 | $6,456,288 |
|---|
8/20 | $6,306,269 | $6,599,001 |
|---|
9/20 | $6,252,184 | $6,493,158 |
|---|
10/20 | $6,263,001 | $6,626,936 |
|---|
11/20 | $6,811,960 | $7,239,845 |
|---|
12/20 | $7,346,713 | $7,772,071 |
|---|
1/21 | $7,546,456 | $8,010,346 |
|---|
2/21 | $7,625,806 | $8,071,614 |
|---|
3/21 | $7,521,830 | $7,949,712 |
|---|
4/21 | $7,740,727 | $8,147,642 |
|---|
5/21 | $7,929,525 | $8,336,588 |
|---|
6/21 | $8,022,556 | $8,350,956 |
|---|
7/21 | $7,636,751 | $7,788,949 |
|---|
8/21 | $7,970,568 | $7,992,827 |
|---|
9/21 | $7,579,291 | $7,675,186 |
|---|
10/21 | $7,748,935 | $7,750,885 |
|---|
11/21 | $7,330,296 | $7,435,012 |
|---|
12/21 | $7,613,719 | $7,574,519 |
|---|
1/22 | $7,368,211 | $7,431,141 |
|---|
2/22 | $6,817,317 | $7,209,023 |
|---|
3/22 | $6,679,594 | $7,046,202 |
|---|
4/22 | $6,101,753 | $6,654,247 |
|---|
5/22 | $6,212,531 | $6,683,545 |
|---|
6/22 | $5,616,727 | $6,239,426 |
|---|
7/22 | $5,784,390 | $6,224,099 |
|---|
8/22 | $5,697,565 | $6,250,083 |
|---|
9/22 | $5,146,670 | $5,517,372 |
|---|
10/22 | $5,188,586 | $5,346,067 |
|---|
11/22 | $5,937,084 | $6,138,983 |
|---|
12/22 | $5,712,031 | $6,052,695 |
|---|
1/23 | $6,188,295 | $6,530,625 |
|---|
2/23 | $5,743,365 | $6,107,164 |
|---|
3/23 | $5,868,697 | $6,292,133 |
|---|
4/23 | $5,859,297 | $6,220,826 |
|---|
5/23 | $5,793,498 | $6,116,340 |
|---|
6/23 | $6,088,029 | $6,348,576 |
|---|
7/23 | $6,376,294 | $6,743,784 |
|---|
8/23 | $5,990,896 | $6,328,365 |
|---|
9/23 | $5,868,697 | $6,162,864 |
|---|
10/23 | $5,712,031 | $5,923,407 |
|---|
11/23 | $6,103,696 | $6,397,458 |
|---|
12/23 | $6,407,828 | $6,647,562 |
|---|
1/24 | $6,202,057 | $6,338,891 |
|---|
2/24 | $6,484,992 | $6,640,447 |
|---|
3/24 | $6,687,548 | $6,804,995 |
|---|
4/24 | $6,735,775 | $6,835,443 |
|---|
5/24 | $6,825,800 | $6,874,051 |
|---|
6/24 | $7,137,671 | $7,145,188 |
|---|
7/24 | $7,079,798 | $7,166,452 |
|---|
8/24 | $7,124,810 | $7,282,158 |
|---|
9/24 | $7,436,682 | $7,768,424 |
|---|
10/24 | $7,163,392 | $7,422,937 |
|---|
11/24 | $7,002,634 | $7,156,230 |
|---|
12/24 | $6,928,497 | $7,146,402 |
|---|
|
|
| Average Annual Return [Table Text Block] |
AATR | 1 Year | 5 Years | 10 Years |
|---|
Class R6 | 8.13% | 1.59% | 3.32% |
|---|
MSCI Emerging Markets Index | 7.50% | 1.70% | 3.64% |
|---|
|
|
| AssetsNet |
$ 518,898,517
|
|
| Holdings Count | Holding |
97
|
|
| Advisory Fees Paid, Amount |
$ 3,648,970
|
|
| InvestmentCompanyPortfolioTurnover |
41.00%
|
|
| Additional Fund Statistics [Text Block] |
Total Net Assets | $518,898,517 |
|---|
# of Portfolio Holdings | 97 |
|---|
Portfolio Turnover Rate | 41% |
|---|
Total Advisory Fees Paid | $3,648,970 |
|---|
|
|
| Holdings [Text Block] |
Country Weightings (% of total investments)Value | Value |
|---|
Other | 5.0% | Poland | 2.0% | Indonesia | 2.6% | South Africa | 3.9% | Mexico | 4.5% | Brazil | 4.9% | United States | 4.9% | Korea, Republic of | 6.4% | Taiwan | 20.1% | China | 21.6% | India | 24.1% |
Top Ten Holdings (% of total investments)Footnote ReferenceaTaiwan Semiconductor Manufacturing Co. Ltd. | 12.7% | Tencent Holdings Ltd. | 5.1% | Mahindra & Mahindra Ltd. | 2.9% | Alibaba Group Holding Ltd. | 2.7% | China Construction Bank Corp. | 2.3% | WEG SA | 2.0% | Samsung Electronics Co. Ltd. | 2.0% | Reliance Industries Ltd. | 1.9% | ICICI Bank Ltd. | 1.9% | State Bank of India | 1.7% | Total | 35.2% |
| Footnote | Description | Footnotea | Excluding cash equivalents. |
|
|
| Material Fund Change [Text Block] |
|
|
| Updated Prospectus Web Address |
<span style="box-sizing: border-box; color: rgb(0, 0, 0); display: inline; flex-wrap: nowrap; font-size: 10.6667px; font-weight: 400; grid-area: auto; line-height: 16px; margin: 0px; overflow: visible; text-align: left;">www.morganstanley.com/im/shareholderreports</span>
|
|
| C000169209 |
|
|
| Shareholder Report [Line Items] |
|
|
| Fund Name |
Morgan Stanley Institutional Fund, Inc. - Global Concentrated Portfolio
|
|
| Class Name |
Class A
|
|
| Trading Symbol |
MLNAX
|
|
| Annual or Semi-Annual Statement [Text Block] |
This annual shareholder report contains important information about Morgan Stanley Institutional Fund, Inc. - Global Concentrated Portfolio for the period of January 1, 2024 to December 31, 2024.
|
|
| Shareholder Report Annual or Semi-Annual |
Annual Shareholder Report
|
|
| Additional Information [Text Block] |
You can find additional information about the Fund at www.morganstanley.com/im/shareholderreports. You can also request this information by contacting us at 1-800-869-6397.
|
|
| Additional Information Phone Number |
1-800-869-6397
|
|
| Additional Information Website |
<span style="box-sizing: border-box; color: rgb(0, 0, 0); display: inline; flex-wrap: nowrap; font-size: 10.6667px; font-weight: 400; grid-area: auto; line-height: 16px; margin: 0px; overflow: visible; text-align: left;">www.morganstanley.com/im/shareholderreports</span>
|
|
| Expenses [Text Block] |
What were the Fund costs for the last year?(based on a hypothetical $10,000 investment) Class Name | Costs of a $10,000 investment | Costs paid as a percentage of a $10,000 investment |
|---|
Class A | $150 | 1.29% |
|---|
|
|
| Expenses Paid, Amount |
$ 150
|
|
| Expense Ratio, Percent |
1.29%
|
|
| Factors Affecting Performance [Text Block] |
How did the Fund perform last year and what affected its performance?Key contributors to (↑) and detractors from (↓) performance, relative to the MSCI World Index: ↑Stock selection in and overweight to financial services sector in the U.S., including positions in a leading global financial services company and a retail insurance holding company ↑ Stock selection in an artificial intelligence chip designer and a global provider of entertainment services ↑ Stock selection in the Asia ex-Japan technology sector, led by a position in a leading semiconductor manufacturer, specializing in artificial intelligence chips ↓ Not owning the full suite of uber-growth, mega-cap technology stocks ↓Overweight to quality stocks in Asia ex-Japan |
|
| Line Graph [Table Text Block] |
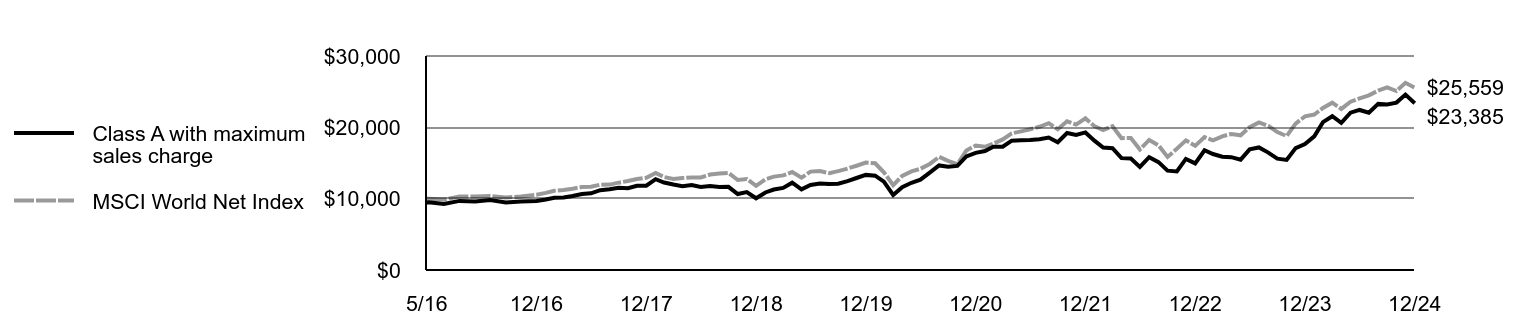 | Class A with maximum sales charge | MSCI World Net Index |
|---|
5/16 | $9,479 | $10,000 |
|---|
5/16 | $9,498 | $9,992 |
|---|
6/16 | $9,251 | $9,880 |
|---|
7/16 | $9,687 | $10,297 |
|---|
8/16 | $9,611 | $10,306 |
|---|
9/16 | $9,820 | $10,361 |
|---|
10/16 | $9,469 | $10,160 |
|---|
11/16 | $9,602 | $10,306 |
|---|
12/16 | $9,670 | $10,553 |
|---|
1/17 | $9,879 | $10,808 |
|---|
2/17 | $10,127 | $11,107 |
|---|
3/17 | $10,175 | $11,226 |
|---|
4/17 | $10,365 | $11,392 |
|---|
5/17 | $10,651 | $11,633 |
|---|
6/17 | $10,746 | $11,678 |
|---|
7/17 | $11,193 | $11,957 |
|---|
8/17 | $11,307 | $11,974 |
|---|
9/17 | $11,527 | $12,243 |
|---|
10/17 | $11,460 | $12,474 |
|---|
11/17 | $11,804 | $12,744 |
|---|
12/17 | $11,814 | $12,917 |
|---|
1/18 | $12,730 | $13,599 |
|---|
2/18 | $12,262 | $13,035 |
|---|
3/18 | $11,976 | $12,751 |
|---|
4/18 | $11,756 | $12,898 |
|---|
5/18 | $11,919 | $12,979 |
|---|
6/18 | $11,651 | $12,973 |
|---|
7/18 | $11,775 | $13,378 |
|---|
8/18 | $11,642 | $13,543 |
|---|
9/18 | $11,661 | $13,619 |
|---|
10/18 | $10,649 | $12,619 |
|---|
11/18 | $10,916 | $12,762 |
|---|
12/18 | $10,053 | $11,792 |
|---|
1/19 | $10,867 | $12,709 |
|---|
2/19 | $11,279 | $13,091 |
|---|
3/19 | $11,509 | $13,263 |
|---|
4/19 | $12,237 | $13,733 |
|---|
5/19 | $11,308 | $12,941 |
|---|
6/19 | $11,921 | $13,794 |
|---|
7/19 | $12,132 | $13,862 |
|---|
8/19 | $12,055 | $13,579 |
|---|
9/19 | $12,103 | $13,868 |
|---|
10/19 | $12,458 | $14,220 |
|---|
11/19 | $12,899 | $14,616 |
|---|
12/19 | $13,334 | $15,054 |
|---|
1/20 | $13,227 | $14,963 |
|---|
2/20 | $12,387 | $13,698 |
|---|
3/20 | $10,512 | $11,885 |
|---|
4/20 | $11,614 | $13,184 |
|---|
5/20 | $12,223 | $13,820 |
|---|
6/20 | $12,657 | $14,186 |
|---|
7/20 | $13,653 | $14,865 |
|---|
8/20 | $14,657 | $15,858 |
|---|
9/20 | $14,464 | $15,311 |
|---|
10/20 | $14,590 | $14,841 |
|---|
11/20 | $15,913 | $16,739 |
|---|
12/20 | $16,426 | $17,448 |
|---|
1/21 | $16,677 | $17,275 |
|---|
2/21 | $17,267 | $17,718 |
|---|
3/21 | $17,276 | $18,307 |
|---|
4/21 | $18,136 | $19,159 |
|---|
5/21 | $18,175 | $19,435 |
|---|
6/21 | $18,213 | $19,725 |
|---|
7/21 | $18,329 | $20,078 |
|---|
8/21 | $18,571 | $20,578 |
|---|
9/21 | $17,914 | $19,723 |
|---|
10/21 | $19,199 | $20,841 |
|---|
11/21 | $18,928 | $20,384 |
|---|
12/21 | $19,288 | $21,255 |
|---|
1/22 | $18,102 | $20,130 |
|---|
2/22 | $17,158 | $19,621 |
|---|
3/22 | $17,067 | $20,160 |
|---|
4/22 | $15,681 | $18,485 |
|---|
5/22 | $15,621 | $18,499 |
|---|
6/22 | $14,456 | $16,897 |
|---|
7/22 | $15,812 | $18,238 |
|---|
8/22 | $15,119 | $17,476 |
|---|
9/22 | $13,923 | $15,851 |
|---|
10/22 | $13,813 | $16,989 |
|---|
11/22 | $15,571 | $18,171 |
|---|
12/22 | $14,949 | $17,399 |
|---|
1/23 | $16,788 | $18,630 |
|---|
2/23 | $16,255 | $18,182 |
|---|
3/23 | $15,884 | $18,744 |
|---|
4/23 | $15,823 | $19,073 |
|---|
5/23 | $15,472 | $18,882 |
|---|
6/23 | $16,919 | $20,024 |
|---|
7/23 | $17,180 | $20,697 |
|---|
8/23 | $16,456 | $20,203 |
|---|
9/23 | $15,612 | $19,331 |
|---|
10/23 | $15,432 | $18,770 |
|---|
11/23 | $17,089 | $20,530 |
|---|
12/23 | $17,647 | $21,538 |
|---|
1/24 | $18,738 | $21,796 |
|---|
2/24 | $20,728 | $22,720 |
|---|
3/24 | $21,557 | $23,450 |
|---|
4/24 | $20,637 | $22,579 |
|---|
5/24 | $22,052 | $23,588 |
|---|
6/24 | $22,436 | $24,068 |
|---|
7/24 | $22,052 | $24,492 |
|---|
8/24 | $23,284 | $25,139 |
|---|
9/24 | $23,213 | $25,599 |
|---|
10/24 | $23,466 | $25,092 |
|---|
11/24 | $24,587 | $26,243 |
|---|
12/24 | $23,385 | $25,559 |
|---|
|
|
| Average Annual Return [Table Text Block] |
AATR | 1 Year | 5 Years | Since 5/27/16
(Inception) |
|---|
Class A | 32.51% | 11.89% | 11.08% |
|---|
Class A, with 5.25% maximum front end sales charge | 25.54% | 10.70% | 10.39% |
|---|
MSCI World Net Index | 18.67% | 11.17% | 11.53% |
|---|
|
|
| Performance Inception Date |
May 27, 2016
|
|
| AssetsNet |
$ 226,121,751
|
|
| Holdings Count | Holding |
21
|
|
| Advisory Fees Paid, Amount |
$ 1,247,474
|
|
| InvestmentCompanyPortfolioTurnover |
43.00%
|
|
| Additional Fund Statistics [Text Block] |
Total Net Assets | $226,121,751 |
|---|
# of Portfolio Holdings | 21 |
|---|
Portfolio Turnover Rate | 43% |
|---|
Total Advisory Fees Paid | $1,247,474 |
|---|
|
|
| Holdings [Text Block] |
Sector Allocation (% of total investments)Value | Value |
|---|
Short-Term Investments | 1.0% | Utilities | 1.8% | Health Care | 2.4% | Real Estate | 3.6% | Consumer Discretionary | 5.6% | Consumer Staples | 6.2% | Materials | 7.0% | Communication Services | 10.6% | Industrials | 12.0% | Information Technology | 24.0% | Financials | 25.8% |
Top Ten Holdings (% of total investments)Footnote ReferenceaNVIDIA Corp. | 10.1% | Microsoft Corp. | 7.2% | CRH PLC | 7.0% | Progressive Corp. | 6.9% | Taiwan Semiconductor Manufacturing Co. Ltd. | 6.8% | Costco Wholesale Corp. | 6.2% | Netflix, Inc. | 5.7% | Ferrari NV | 5.6% | Ameriprise Financial, Inc. | 5.4% | JPMorgan Chase & Co. | 5.2% | Total | 66.1% |
| Footnote | Description | Footnotea | Excluding cash equivalents. |
|
|
| Material Fund Change [Text Block] |
|
|
| Updated Prospectus Web Address |
<span style="box-sizing: border-box; color: rgb(0, 0, 0); display: inline; flex-wrap: nowrap; font-size: 10.6667px; font-weight: 400; grid-area: auto; line-height: 16px; margin: 0px; overflow: visible; text-align: left;">www.morganstanley.com/im/shareholderreports</span>
|
|
| C000169210 |
|
|
| Shareholder Report [Line Items] |
|
|
| Fund Name |
Morgan Stanley Institutional Fund, Inc. - Global Concentrated Portfolio
|
|
| Class Name |
Class C
|
|
| Trading Symbol |
MLNCX
|
|
| Annual or Semi-Annual Statement [Text Block] |
This annual shareholder report contains important information about Morgan Stanley Institutional Fund, Inc. - Global Concentrated Portfolio for the period of January 1, 2024 to December 31, 2024.
|
|
| Shareholder Report Annual or Semi-Annual |
Annual Shareholder Report
|
|
| Additional Information [Text Block] |
You can find additional information about the Fund at www.morganstanley.com/im/shareholderreports. You can also request this information by contacting us at 1-800-869-6397.
|
|
| Additional Information Phone Number |
1-800-869-6397
|
|
| Additional Information Website |
<span style="box-sizing: border-box; color: rgb(0, 0, 0); display: inline; flex-wrap: nowrap; font-size: 10.6667px; font-weight: 400; grid-area: auto; line-height: 16px; margin: 0px; overflow: visible; text-align: left;">www.morganstanley.com/im/shareholderreports</span>
|
|
| Expenses [Text Block] |
What were the Fund costs for the last year?(based on a hypothetical $10,000 investment) Class Name | Costs of a $10,000 investment | Costs paid as a percentage of a $10,000 investment |
|---|
Class C | $238 | 2.06% |
|---|
|
|
| Expenses Paid, Amount |
$ 238
|
|
| Expense Ratio, Percent |
2.06%
|
|
| Factors Affecting Performance [Text Block] |
How did the Fund perform last year and what affected its performance?Key contributors to (↑) and detractors from (↓) performance, relative to the MSCI World Index: ↑Stock selection in and overweight to financial services sector in the U.S., including positions in a leading global financial services company and a retail insurance holding company ↑ Stock selection in an artificial intelligence chip designer and a global provider of entertainment services ↑ Stock selection in the Asia ex-Japan technology sector, led by a position in a leading semiconductor manufacturer, specializing in artificial intelligence chips ↓ Not owning the full suite of uber-growth, mega-cap technology stocks ↓Overweight to quality stocks in Asia ex-Japan |
|
| Line Graph [Table Text Block] |
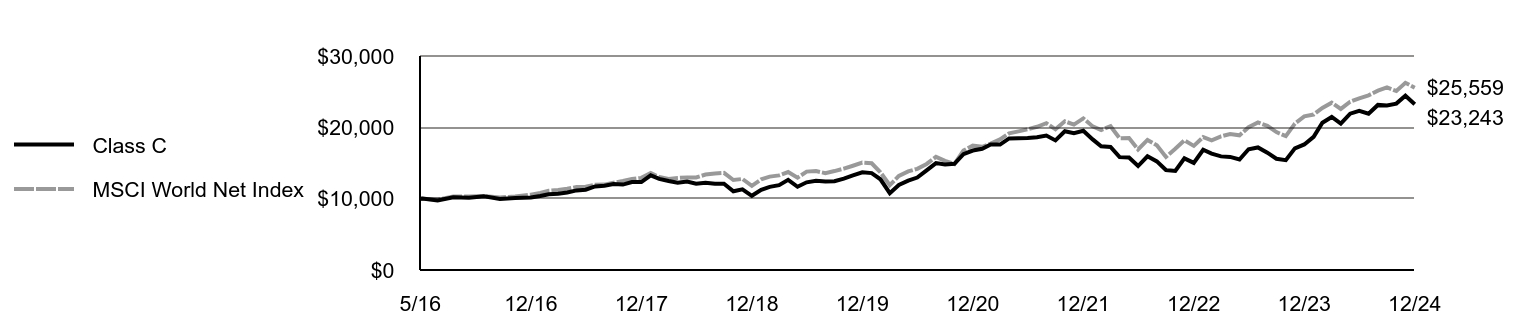 | Class C | MSCI World Net Index |
|---|
5/16 | $10,000 | $10,000 |
|---|
5/16 | $10,020 | $9,992 |
|---|
6/16 | $9,750 | $9,880 |
|---|
7/16 | $10,210 | $10,297 |
|---|
8/16 | $10,120 | $10,306 |
|---|
9/16 | $10,340 | $10,361 |
|---|
10/16 | $9,970 | $10,160 |
|---|
11/16 | $10,100 | $10,306 |
|---|
12/16 | $10,169 | $10,553 |
|---|
1/17 | $10,380 | $10,808 |
|---|
2/17 | $10,630 | $11,107 |
|---|
3/17 | $10,680 | $11,226 |
|---|
4/17 | $10,861 | $11,392 |
|---|
5/17 | $11,161 | $11,633 |
|---|
6/17 | $11,251 | $11,678 |
|---|
7/17 | $11,711 | $11,957 |
|---|
8/17 | $11,822 | $11,974 |
|---|
9/17 | $12,043 | $12,243 |
|---|
10/17 | $11,972 | $12,474 |
|---|
11/17 | $12,324 | $12,744 |
|---|
12/17 | $12,324 | $12,917 |
|---|
1/18 | $13,268 | $13,599 |
|---|
2/18 | $12,776 | $13,035 |
|---|
3/18 | $12,474 | $12,751 |
|---|
4/18 | $12,233 | $12,898 |
|---|
5/18 | $12,394 | $12,979 |
|---|
6/18 | $12,103 | $12,973 |
|---|
7/18 | $12,233 | $13,378 |
|---|
8/18 | $12,083 | $13,543 |
|---|
9/18 | $12,093 | $13,619 |
|---|
10/18 | $11,038 | $12,619 |
|---|
11/18 | $11,309 | $12,762 |
|---|
12/18 | $10,405 | $11,792 |
|---|
1/19 | $11,239 | $12,709 |
|---|
2/19 | $11,661 | $13,091 |
|---|
3/19 | $11,892 | $13,263 |
|---|
4/19 | $12,635 | $13,733 |
|---|
5/19 | $11,671 | $12,941 |
|---|
6/19 | $12,294 | $13,794 |
|---|
7/19 | $12,505 | $13,862 |
|---|
8/19 | $12,424 | $13,579 |
|---|
9/19 | $12,454 | $13,868 |
|---|
10/19 | $12,816 | $14,220 |
|---|
11/19 | $13,258 | $14,616 |
|---|
12/19 | $13,703 | $15,054 |
|---|
1/20 | $13,583 | $14,963 |
|---|
2/20 | $12,718 | $13,698 |
|---|
3/20 | $10,778 | $11,885 |
|---|
4/20 | $11,914 | $13,184 |
|---|
5/20 | $12,527 | $13,820 |
|---|
6/20 | $12,959 | $14,186 |
|---|
7/20 | $13,975 | $14,865 |
|---|
8/20 | $14,980 | $15,858 |
|---|
9/20 | $14,779 | $15,311 |
|---|
10/20 | $14,890 | $14,841 |
|---|
11/20 | $16,237 | $16,739 |
|---|
12/20 | $16,750 | $17,448 |
|---|
1/21 | $16,991 | $17,275 |
|---|
2/21 | $17,585 | $17,718 |
|---|
3/21 | $17,585 | $18,307 |
|---|
4/21 | $18,449 | $19,159 |
|---|
5/21 | $18,479 | $19,435 |
|---|
6/21 | $18,499 | $19,725 |
|---|
7/21 | $18,610 | $20,078 |
|---|
8/21 | $18,841 | $20,578 |
|---|
9/21 | $18,168 | $19,723 |
|---|
10/21 | $19,455 | $20,841 |
|---|
11/21 | $19,173 | $20,384 |
|---|
12/21 | $19,527 | $21,255 |
|---|
1/22 | $18,313 | $20,130 |
|---|
2/22 | $17,339 | $19,621 |
|---|
3/22 | $17,245 | $20,160 |
|---|
4/22 | $15,822 | $18,485 |
|---|
5/22 | $15,759 | $18,499 |
|---|
6/22 | $14,577 | $16,897 |
|---|
7/22 | $15,937 | $18,238 |
|---|
8/22 | $15,226 | $17,476 |
|---|
9/22 | $14,012 | $15,851 |
|---|
10/22 | $13,897 | $16,989 |
|---|
11/22 | $15,655 | $18,171 |
|---|
12/22 | $15,018 | $17,399 |
|---|
1/23 | $16,860 | $18,630 |
|---|
2/23 | $16,316 | $18,182 |
|---|
3/23 | $15,928 | $18,744 |
|---|
4/23 | $15,855 | $19,073 |
|---|
5/23 | $15,489 | $18,882 |
|---|
6/23 | $16,933 | $20,024 |
|---|
7/23 | $17,184 | $20,697 |
|---|
8/23 | $16,452 | $20,203 |
|---|
9/23 | $15,594 | $19,331 |
|---|
10/23 | $15,405 | $18,770 |
|---|
11/23 | $17,048 | $20,530 |
|---|
12/23 | $17,603 | $21,538 |
|---|
1/24 | $18,670 | $21,796 |
|---|
2/24 | $20,638 | $22,720 |
|---|
3/24 | $21,454 | $23,450 |
|---|
4/24 | $20,523 | $22,579 |
|---|
5/24 | $21,918 | $23,588 |
|---|
6/24 | $22,300 | $24,068 |
|---|
7/24 | $21,918 | $24,492 |
|---|
8/24 | $23,143 | $25,139 |
|---|
9/24 | $23,073 | $25,599 |
|---|
10/24 | $23,324 | $25,092 |
|---|
11/24 | $24,438 | $26,243 |
|---|
12/24 | $23,243 | $25,559 |
|---|
|
|
| Average Annual Return [Table Text Block] |
AATR | 1 Year | 5 Years | Since 5/27/16
(Inception) |
|---|
Class C, with conversion to Class A after 8 years | 31.45% | 11.05% | 10.31% |
|---|
Class C, with 1% maximum contingent deferred sales charge and conversion to Class A after 8 years | 30.45% | 11.05% | 10.31% |
|---|
MSCI World Net Index | 18.67% | 11.17% | 11.53% |
|---|
|
|
| Performance Inception Date |
May 27, 2016
|
|
| AssetsNet |
$ 226,121,751
|
|
| Holdings Count | Holding |
21
|
|
| Advisory Fees Paid, Amount |
$ 1,247,474
|
|
| InvestmentCompanyPortfolioTurnover |
43.00%
|
|
| Additional Fund Statistics [Text Block] |
Total Net Assets | $226,121,751 |
|---|
# of Portfolio Holdings | 21 |
|---|
Portfolio Turnover Rate | 43% |
|---|
Total Advisory Fees Paid | $1,247,474 |
|---|
|
|
| Holdings [Text Block] |
Sector Allocation (% of total investments)Value | Value |
|---|
Short-Term Investments | 1.0% | Utilities | 1.8% | Health Care | 2.4% | Real Estate | 3.6% | Consumer Discretionary | 5.6% | Consumer Staples | 6.2% | Materials | 7.0% | Communication Services | 10.6% | Industrials | 12.0% | Information Technology | 24.0% | Financials | 25.8% |
Top Ten Holdings (% of total investments)Footnote ReferenceaNVIDIA Corp. | 10.1% | Microsoft Corp. | 7.2% | CRH PLC | 7.0% | Progressive Corp. | 6.9% | Taiwan Semiconductor Manufacturing Co. Ltd. | 6.8% | Costco Wholesale Corp. | 6.2% | Netflix, Inc. | 5.7% | Ferrari NV | 5.6% | Ameriprise Financial, Inc. | 5.4% | JPMorgan Chase & Co. | 5.2% | Total | 66.1% |
| Footnote | Description | Footnotea | Excluding cash equivalents. |
|
|
| Material Fund Change [Text Block] |
|
|
| Updated Prospectus Web Address |
<span style="box-sizing: border-box; color: rgb(0, 0, 0); display: inline; flex-wrap: nowrap; font-size: 10.6667px; font-weight: 400; grid-area: auto; line-height: 16px; margin: 0px; overflow: visible; text-align: left;">www.morganstanley.com/im/shareholderreports</span>
|
|
| C000169208 |
|
|
| Shareholder Report [Line Items] |
|
|
| Fund Name |
Morgan Stanley Institutional Fund, Inc. - Global Concentrated Portfolio
|
|
| Class Name |
Class I
|
|
| Trading Symbol |
MLNIX
|
|
| Annual or Semi-Annual Statement [Text Block] |
This annual shareholder report contains important information about Morgan Stanley Institutional Fund, Inc. - Global Concentrated Portfolio for the period of January 1, 2024 to December 31, 2024.
|
|
| Shareholder Report Annual or Semi-Annual |
Annual Shareholder Report
|
|
| Additional Information [Text Block] |
You can find additional information about the Fund at www.morganstanley.com/im/shareholderreports. You can also request this information by contacting us at 1-800-869-6397.
|
|
| Additional Information Phone Number |
1-800-869-6397
|
|
| Additional Information Website |
<span style="box-sizing: border-box; color: rgb(0, 0, 0); display: inline; flex-wrap: nowrap; font-size: 10.6667px; font-weight: 400; grid-area: auto; line-height: 16px; margin: 0px; overflow: visible; text-align: left;">www.morganstanley.com/im/shareholderreports</span>
|
|
| Expenses [Text Block] |
What were the Fund costs for the last year?(based on a hypothetical $10,000 investment) Class Name | Costs of a $10,000 investment | Costs paid as a percentage of a $10,000 investment |
|---|
Class I | $116 | 1.00% |
|---|
|
|
| Expenses Paid, Amount |
$ 116
|
|
| Expense Ratio, Percent |
1.00%
|
|
| Factors Affecting Performance [Text Block] |
How did the Fund perform last year and what affected its performance?Key contributors to (↑) and detractors from (↓) performance, relative to the MSCI World Index: ↑Stock selection in and overweight to financial services sector in the U.S., including positions in a leading global financial services company and a retail insurance holding company ↑ Stock selection in an artificial intelligence chip designer and a global provider of entertainment services ↑ Stock selection in the Asia ex-Japan technology sector, led by a position in a leading semiconductor manufacturer, specializing in artificial intelligence chips ↓ Not owning the full suite of uber-growth, mega-cap technology stocks ↓Overweight to quality stocks in Asia ex-Japan |
|
| Line Graph [Table Text Block] |
 | Class I | MSCI World Net Index |
|---|
5/16 | $1,000,000 | $1,000,000 |
|---|
5/16 | $1,002,000 | $1,000,000 |
|---|
6/16 | $976,000 | $988,002 |
|---|
7/16 | $1,023,000 | $1,029,744 |
|---|
8/16 | $1,015,000 | $1,030,600 |
|---|
9/16 | $1,038,000 | $1,036,074 |
|---|
10/16 | $1,001,000 | $1,016,023 |
|---|
11/16 | $1,015,000 | $1,030,632 |
|---|
12/16 | $1,022,399 | $1,055,294 |
|---|
1/17 | $1,044,538 | $1,080,763 |
|---|
2/17 | $1,071,708 | $1,110,748 |
|---|
3/17 | $1,077,746 | $1,122,579 |
|---|
4/17 | $1,096,865 | $1,139,201 |
|---|
5/17 | $1,128,060 | $1,163,300 |
|---|
6/17 | $1,138,123 | $1,167,776 |
|---|
7/17 | $1,186,304 | $1,195,724 |
|---|
8/17 | $1,198,409 | $1,197,408 |
|---|
9/17 | $1,221,611 | $1,224,282 |
|---|
10/17 | $1,215,558 | $1,247,419 |
|---|
11/17 | $1,252,883 | $1,274,448 |
|---|
12/17 | $1,253,859 | $1,291,683 |
|---|
1/18 | $1,351,785 | $1,359,884 |
|---|
2/18 | $1,302,317 | $1,303,548 |
|---|
3/18 | $1,273,041 | $1,275,135 |
|---|
4/18 | $1,248,811 | $1,289,788 |
|---|
5/18 | $1,266,983 | $1,297,870 |
|---|
6/18 | $1,238,716 | $1,297,251 |
|---|
7/18 | $1,251,840 | $1,337,769 |
|---|
8/18 | $1,238,716 | $1,354,321 |
|---|
9/18 | $1,240,735 | $1,361,862 |
|---|
10/18 | $1,133,723 | $1,261,863 |
|---|
11/18 | $1,163,000 | $1,276,198 |
|---|
12/18 | $1,070,725 | $1,179,158 |
|---|
1/19 | $1,157,156 | $1,270,904 |
|---|
2/19 | $1,201,897 | $1,309,119 |
|---|
3/19 | $1,227,318 | $1,326,314 |
|---|
4/19 | $1,304,597 | $1,373,344 |
|---|
5/19 | $1,205,964 | $1,294,101 |
|---|
6/19 | $1,272,058 | $1,379,376 |
|---|
7/19 | $1,294,428 | $1,386,208 |
|---|
8/19 | $1,287,311 | $1,357,854 |
|---|
9/19 | $1,292,395 | $1,386,750 |
|---|
10/19 | $1,330,018 | $1,422,040 |
|---|
11/19 | $1,377,809 | $1,461,644 |
|---|
12/19 | $1,425,168 | $1,505,432 |
|---|
1/20 | $1,413,857 | $1,496,269 |
|---|
2/20 | $1,325,427 | $1,369,796 |
|---|
3/20 | $1,123,888 | $1,188,514 |
|---|
4/20 | $1,243,166 | $1,318,352 |
|---|
5/20 | $1,307,946 | $1,382,039 |
|---|
6/20 | $1,355,246 | $1,418,596 |
|---|
7/20 | $1,462,185 | $1,486,463 |
|---|
8/20 | $1,569,124 | $1,585,780 |
|---|
9/20 | $1,549,587 | $1,531,072 |
|---|
10/20 | $1,562,955 | $1,484,107 |
|---|
11/20 | $1,705,883 | $1,673,867 |
|---|
12/20 | $1,760,423 | $1,744,833 |
|---|
1/21 | $1,788,187 | $1,727,492 |
|---|
2/21 | $1,851,940 | $1,771,758 |
|---|
3/21 | $1,853,997 | $1,830,708 |
|---|
4/21 | $1,946,542 | $1,915,909 |
|---|
5/21 | $1,950,656 | $1,943,509 |
|---|
6/21 | $1,954,769 | $1,972,476 |
|---|
7/21 | $1,968,136 | $2,007,809 |
|---|
8/21 | $1,994,872 | $2,057,780 |
|---|
9/21 | $1,924,948 | $1,972,340 |
|---|
10/21 | $2,062,739 | $2,084,054 |
|---|
11/21 | $2,034,975 | $2,038,387 |
|---|
12/21 | $2,074,230 | $2,125,508 |
|---|
1/22 | $1,947,062 | $2,013,045 |
|---|
2/22 | $1,845,541 | $1,962,133 |
|---|
3/22 | $1,835,924 | $2,015,980 |
|---|
4/22 | $1,687,383 | $1,848,506 |
|---|
5/22 | $1,682,039 | $1,849,906 |
|---|
6/22 | $1,555,940 | $1,689,663 |
|---|
7/22 | $1,703,412 | $1,823,816 |
|---|
8/22 | $1,628,607 | $1,747,567 |
|---|
9/22 | $1,500,371 | $1,585,113 |
|---|
10/22 | $1,488,616 | $1,698,945 |
|---|
11/22 | $1,678,834 | $1,817,073 |
|---|
12/22 | $1,612,075 | $1,739,907 |
|---|
1/23 | $1,811,440 | $1,863,016 |
|---|
2/23 | $1,753,560 | $1,818,232 |
|---|
3/23 | $1,713,901 | $1,874,414 |
|---|
4/23 | $1,708,542 | $1,907,272 |
|---|
5/23 | $1,669,955 | $1,888,231 |
|---|
6/23 | $1,827,518 | $2,002,427 |
|---|
7/23 | $1,855,387 | $2,069,694 |
|---|
8/23 | $1,778,213 | $2,020,258 |
|---|
9/23 | $1,687,105 | $1,933,107 |
|---|
10/23 | $1,667,811 | $1,877,017 |
|---|
11/23 | $1,848,955 | $2,052,991 |
|---|
12/23 | $1,909,050 | $2,153,781 |
|---|
1/24 | $2,026,813 | $2,179,627 |
|---|
2/24 | $2,242,891 | $2,272,038 |
|---|
3/24 | $2,333,644 | $2,345,050 |
|---|
4/24 | $2,234,248 | $2,257,944 |
|---|
5/24 | $2,388,744 | $2,358,766 |
|---|
6/24 | $2,430,879 | $2,406,761 |
|---|
7/24 | $2,388,744 | $2,449,174 |
|---|
8/24 | $2,523,792 | $2,513,907 |
|---|
9/24 | $2,516,230 | $2,559,947 |
|---|
10/24 | $2,544,320 | $2,509,165 |
|---|
11/24 | $2,666,404 | $2,624,302 |
|---|
12/24 | $2,537,226 | $2,555,912 |
|---|
|
|
| Average Annual Return [Table Text Block] |
AATR | 1 Year | 5 Years | Since 5/27/16
(Inception) |
|---|
Class I | 32.91% | 12.23% | 11.44% |
|---|
MSCI World Net Index | 18.67% | 11.17% | 11.53% |
|---|
|
|
| Performance Inception Date |
May 27, 2016
|
|
| AssetsNet |
$ 226,121,751
|
|
| Holdings Count | Holding |
21
|
|
| Advisory Fees Paid, Amount |
$ 1,247,474
|
|
| InvestmentCompanyPortfolioTurnover |
43.00%
|
|
| Additional Fund Statistics [Text Block] |
Total Net Assets | $226,121,751 |
|---|
# of Portfolio Holdings | 21 |
|---|
Portfolio Turnover Rate | 43% |
|---|
Total Advisory Fees Paid | $1,247,474 |
|---|
|
|
| Holdings [Text Block] |
Sector Allocation (% of total investments)Value | Value |
|---|
Short-Term Investments | 1.0% | Utilities | 1.8% | Health Care | 2.4% | Real Estate | 3.6% | Consumer Discretionary | 5.6% | Consumer Staples | 6.2% | Materials | 7.0% | Communication Services | 10.6% | Industrials | 12.0% | Information Technology | 24.0% | Financials | 25.8% |
Top Ten Holdings (% of total investments)Footnote ReferenceaNVIDIA Corp. | 10.1% | Microsoft Corp. | 7.2% | CRH PLC | 7.0% | Progressive Corp. | 6.9% | Taiwan Semiconductor Manufacturing Co. Ltd. | 6.8% | Costco Wholesale Corp. | 6.2% | Netflix, Inc. | 5.7% | Ferrari NV | 5.6% | Ameriprise Financial, Inc. | 5.4% | JPMorgan Chase & Co. | 5.2% | Total | 66.1% |
| Footnote | Description | Footnotea | Excluding cash equivalents. |
|
|
| Material Fund Change [Text Block] |
|
|
| Updated Prospectus Web Address |
<span style="box-sizing: border-box; color: rgb(0, 0, 0); display: inline; flex-wrap: nowrap; font-size: 10.6667px; font-weight: 400; grid-area: auto; line-height: 16px; margin: 0px; overflow: visible; text-align: left;">www.morganstanley.com/im/shareholderreports</span>
|
|
| C000169211 |
|
|
| Shareholder Report [Line Items] |
|
|
| Fund Name |
Morgan Stanley Institutional Fund, Inc. - Global Concentrated Portfolio
|
|
| Class Name |
Class R6
|
|
| Trading Symbol |
MLNSX
|
|
| Annual or Semi-Annual Statement [Text Block] |
This annual shareholder report contains important information about Morgan Stanley Institutional Fund, Inc. - Global Concentrated Portfolio for the period of January 1, 2024 to December 31, 2024.
|
|
| Shareholder Report Annual or Semi-Annual |
Annual Shareholder Report
|
|
| Additional Information [Text Block] |
You can find additional information about the Fund at www.morganstanley.com/im/shareholderreports. You can also request this information by contacting us at 1-800-869-6397.
|
|
| Additional Information Phone Number |
1-800-869-6397
|
|
| Additional Information Website |
<span style="box-sizing: border-box; color: rgb(0, 0, 0); display: inline; flex-wrap: nowrap; font-size: 10.6667px; font-weight: 400; grid-area: auto; line-height: 16px; margin: 0px; overflow: visible; text-align: left;">www.morganstanley.com/im/shareholderreports</span>
|
|
| Expenses [Text Block] |
What were the Fund costs for the last year?(based on a hypothetical $10,000 investment) Class Name | Costs of a $10,000 investment | Costs paid as a percentage of a $10,000 investment |
|---|
Class R6 | $111 | 0.95% |
|---|
|
|
| Expenses Paid, Amount |
$ 111
|
|
| Expense Ratio, Percent |
0.95%
|
|
| Factors Affecting Performance [Text Block] |
How did the Fund perform last year and what affected its performance?Key contributors to (↑) and detractors from (↓) performance, relative to the MSCI World Index: ↑Stock selection in and overweight to financial services sector in the U.S., including positions in a leading global financial services company and a retail insurance holding company ↑ Stock selection in an artificial intelligence chip designer and a global provider of entertainment services ↑ Stock selection in the Asia ex-Japan technology sector, led by a position in a leading semiconductor manufacturer, specializing in artificial intelligence chips ↓ Not owning the full suite of uber-growth, mega-cap technology stocks ↓Overweight to quality stocks in Asia ex-Japan |
|
| Line Graph [Table Text Block] |
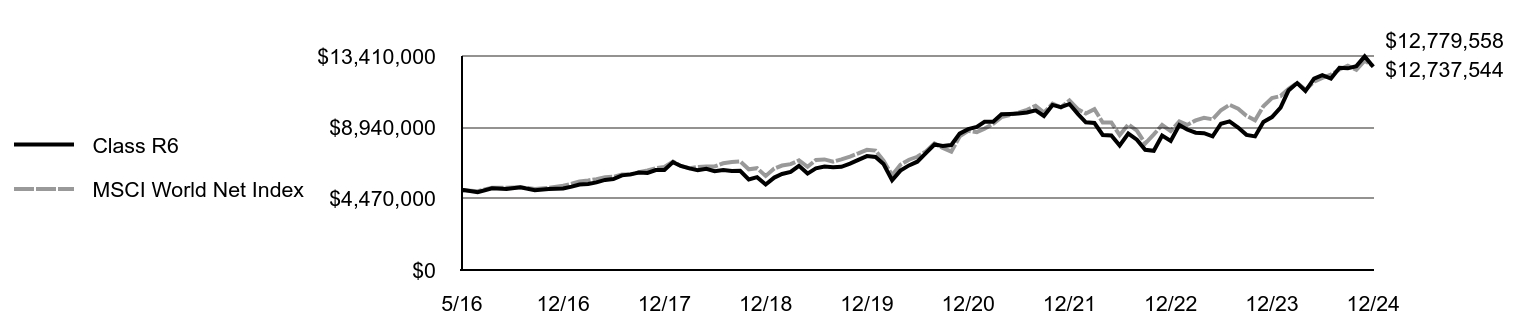 | Class R6 | MSCI World Net Index |
|---|
5/16 | $5,000,000 | $5,000,000 |
|---|
5/16 | $5,010,000 | $5,000,000 |
|---|
6/16 | $4,880,000 | $4,940,011 |
|---|
7/16 | $5,115,000 | $5,148,719 |
|---|
8/16 | $5,075,000 | $5,152,998 |
|---|
9/16 | $5,190,000 | $5,180,370 |
|---|
10/16 | $5,005,000 | $5,080,115 |
|---|
11/16 | $5,075,000 | $5,153,162 |
|---|
12/16 | $5,112,674 | $5,276,469 |
|---|
1/17 | $5,223,382 | $5,403,817 |
|---|
2/17 | $5,359,250 | $5,553,738 |
|---|
3/17 | $5,389,443 | $5,612,896 |
|---|
4/17 | $5,490,086 | $5,696,005 |
|---|
5/17 | $5,646,083 | $5,816,501 |
|---|
6/17 | $5,696,405 | $5,838,880 |
|---|
7/17 | $5,932,309 | $5,978,619 |
|---|
8/17 | $5,992,843 | $5,987,038 |
|---|
9/17 | $6,113,911 | $6,121,412 |
|---|
10/17 | $6,083,644 | $6,237,097 |
|---|
11/17 | $6,265,245 | $6,372,240 |
|---|
12/17 | $6,271,615 | $6,458,415 |
|---|
1/18 | $6,761,427 | $6,799,421 |
|---|
2/18 | $6,519,045 | $6,517,738 |
|---|
3/18 | $6,367,557 | $6,375,674 |
|---|
4/18 | $6,251,416 | $6,448,938 |
|---|
5/18 | $6,337,259 | $6,489,350 |
|---|
6/18 | $6,195,870 | $6,486,254 |
|---|
7/18 | $6,266,565 | $6,688,843 |
|---|
8/18 | $6,200,920 | $6,771,603 |
|---|
9/18 | $6,211,019 | $6,809,309 |
|---|
10/18 | $5,675,761 | $6,309,315 |
|---|
11/18 | $5,817,150 | $6,380,989 |
|---|
12/18 | $5,359,273 | $5,895,791 |
|---|
1/19 | $5,791,883 | $6,354,518 |
|---|
2/19 | $6,015,822 | $6,545,597 |
|---|
3/19 | $6,143,061 | $6,631,570 |
|---|
4/19 | $6,529,865 | $6,866,721 |
|---|
5/19 | $6,041,270 | $6,470,505 |
|---|
6/19 | $6,367,000 | $6,896,878 |
|---|
7/19 | $6,484,059 | $6,931,041 |
|---|
8/19 | $6,443,343 | $6,789,270 |
|---|
9/19 | $6,468,791 | $6,933,752 |
|---|
10/19 | $6,662,193 | $7,110,199 |
|---|
11/19 | $6,901,400 | $7,308,219 |
|---|
12/19 | $7,136,505 | $7,527,160 |
|---|
1/20 | $7,079,866 | $7,481,345 |
|---|
2/20 | $6,637,053 | $6,848,982 |
|---|
3/20 | $5,627,850 | $5,942,569 |
|---|
4/20 | $6,225,133 | $6,591,761 |
|---|
5/20 | $6,554,669 | $6,910,197 |
|---|
6/20 | $6,786,374 | $7,092,979 |
|---|
7/20 | $7,327,018 | $7,432,316 |
|---|
8/20 | $7,862,513 | $7,928,902 |
|---|
9/20 | $7,764,682 | $7,655,362 |
|---|
10/20 | $7,831,619 | $7,420,533 |
|---|
11/20 | $8,547,329 | $8,369,334 |
|---|
12/20 | $8,825,587 | $8,724,166 |
|---|
1/21 | $8,964,613 | $8,637,460 |
|---|
2/21 | $9,283,859 | $8,858,789 |
|---|
3/21 | $9,294,157 | $9,153,540 |
|---|
4/21 | $9,757,577 | $9,579,546 |
|---|
5/21 | $9,778,174 | $9,717,544 |
|---|
6/21 | $9,803,919 | $9,862,382 |
|---|
7/21 | $9,870,858 | $10,039,045 |
|---|
8/21 | $9,999,586 | $10,288,901 |
|---|
9/21 | $9,649,446 | $9,861,700 |
|---|
10/21 | $10,344,577 | $10,420,272 |
|---|
11/21 | $10,200,401 | $10,191,933 |
|---|
12/21 | $10,402,101 | $10,627,538 |
|---|
1/22 | $9,765,347 | $10,065,225 |
|---|
2/22 | $9,251,663 | $9,810,664 |
|---|
3/22 | $9,208,856 | $10,079,901 |
|---|
4/22 | $8,459,734 | $9,242,530 |
|---|
5/22 | $8,432,979 | $9,249,530 |
|---|
6/22 | $7,806,927 | $8,448,317 |
|---|
7/22 | $8,545,348 | $9,119,082 |
|---|
8/22 | $8,165,435 | $8,737,834 |
|---|
9/22 | $7,528,681 | $7,925,565 |
|---|
10/22 | $7,469,822 | $8,494,723 |
|---|
11/22 | $8,422,277 | $9,085,365 |
|---|
12/22 | $8,087,140 | $8,699,534 |
|---|
1/23 | $9,085,950 | $9,315,079 |
|---|
2/23 | $8,801,343 | $9,091,158 |
|---|
3/23 | $8,602,655 | $9,372,072 |
|---|
4/23 | $8,570,435 | $9,536,361 |
|---|
5/23 | $8,377,117 | $9,441,156 |
|---|
6/23 | $9,166,500 | $10,012,136 |
|---|
7/23 | $9,311,488 | $10,348,471 |
|---|
8/23 | $8,924,852 | $10,101,290 |
|---|
9/23 | $8,468,406 | $9,665,537 |
|---|
10/23 | $8,371,747 | $9,385,083 |
|---|
11/23 | $9,279,268 | $10,264,954 |
|---|
12/23 | $9,584,242 | $10,768,905 |
|---|
1/24 | $10,174,458 | $10,898,137 |
|---|
2/24 | $11,257,423 | $11,360,192 |
|---|
3/24 | $11,712,269 | $11,725,250 |
|---|
4/24 | $11,214,105 | $11,289,719 |
|---|
5/24 | $11,993,840 | $11,793,828 |
|---|
6/24 | $12,205,018 | $12,033,807 |
|---|
7/24 | $11,993,840 | $12,245,872 |
|---|
8/24 | $12,670,693 | $12,569,536 |
|---|
9/24 | $12,638,204 | $12,799,734 |
|---|
10/24 | $12,773,575 | $12,545,827 |
|---|
11/24 | $13,385,450 | $13,121,512 |
|---|
12/24 | $12,737,544 | $12,779,558 |
|---|
|
|
| Average Annual Return [Table Text Block] |
AATR | 1 Year | 5 Years | Since 5/27/16
(Inception) |
|---|
Class R6 | 32.90% | 12.28% | 11.49% |
|---|
MSCI World Net Index | 18.67% | 11.17% | 11.53% |
|---|
|
|
| Performance Inception Date |
May 27, 2016
|
|
| AssetsNet |
$ 226,121,751
|
|
| Holdings Count | Holding |
21
|
|
| Advisory Fees Paid, Amount |
$ 1,247,474
|
|
| InvestmentCompanyPortfolioTurnover |
43.00%
|
|
| Additional Fund Statistics [Text Block] |
Total Net Assets | $226,121,751 |
|---|
# of Portfolio Holdings | 21 |
|---|
Portfolio Turnover Rate | 43% |
|---|
Total Advisory Fees Paid | $1,247,474 |
|---|
|
|
| Holdings [Text Block] |
Sector Allocation (% of total investments)Value | Value |
|---|
Short-Term Investments | 1.0% | Utilities | 1.8% | Health Care | 2.4% | Real Estate | 3.6% | Consumer Discretionary | 5.6% | Consumer Staples | 6.2% | Materials | 7.0% | Communication Services | 10.6% | Industrials | 12.0% | Information Technology | 24.0% | Financials | 25.8% |
Top Ten Holdings (% of total investments)Footnote ReferenceaNVIDIA Corp. | 10.1% | Microsoft Corp. | 7.2% | CRH PLC | 7.0% | Progressive Corp. | 6.9% | Taiwan Semiconductor Manufacturing Co. Ltd. | 6.8% | Costco Wholesale Corp. | 6.2% | Netflix, Inc. | 5.7% | Ferrari NV | 5.6% | Ameriprise Financial, Inc. | 5.4% | JPMorgan Chase & Co. | 5.2% | Total | 66.1% |
| Footnote | Description | Footnotea | Excluding cash equivalents. |
|
|
| Material Fund Change [Text Block] |
|
|
| Updated Prospectus Web Address |
<span style="box-sizing: border-box; color: rgb(0, 0, 0); display: inline; flex-wrap: nowrap; font-size: 10.6667px; font-weight: 400; grid-area: auto; line-height: 16px; margin: 0px; overflow: visible; text-align: left;">www.morganstanley.com/im/shareholderreports</span>
|
|
| C000169213 |
|
|
| Shareholder Report [Line Items] |
|
|
| Fund Name |
Morgan Stanley Institutional Fund, Inc. - Global Core Portfolio
|
|
| Class Name |
Class A
|
|
| Trading Symbol |
MLMAX
|
|
| Annual or Semi-Annual Statement [Text Block] |
This annual shareholder report contains important information about Morgan Stanley Institutional Fund, Inc. - Global Core Portfolio for the period of January 1, 2024 to December 31, 2024.
|
|
| Shareholder Report Annual or Semi-Annual |
Annual Shareholder Report
|
|
| Additional Information [Text Block] |
You can find additional information about the Fund at www.morganstanley.com/im/shareholderreports. You can also request this information by contacting us at 1-800-869-6397.
|
|
| Additional Information Phone Number |
1-800-869-6397
|
|
| Additional Information Website |
<span style="box-sizing: border-box; color: rgb(0, 0, 0); display: inline; flex-wrap: nowrap; font-size: 10.6667px; font-weight: 400; grid-area: auto; line-height: 16px; margin: 0px; overflow: visible; text-align: left;">www.morganstanley.com/im/shareholderreports</span>
|
|
| Expenses [Text Block] |
What were the Fund costs for the last year?(based on a hypothetical $10,000 investment) Class Name | Costs of a $10,000 investment | Costs paid as a percentage of a $10,000 investment |
|---|
Class A | $145 | 1.30% |
|---|
|
|
| Expenses Paid, Amount |
$ 145
|
|
| Expense Ratio, Percent |
1.30%
|
|
| Factors Affecting Performance [Text Block] |
How did the Fund perform last year and what affected its performance?Key contributors to (↑) and detractors from (↓) performance, relative to the MSCI World Index: ↑ Stock selection in and overweight to the financial services sector in the U.S., including positions in a leading global financial services company and a financial services company specializing in retail wealth management ↑ Stock selection in an artificial intelligence chip designer and a global provider of entertainment services ↑ Underweight to health care stocks in the U.S. ↑ Stock selection in the Asia ex-Japan technology sector ↓ Overweight to quality stocks in Asia ex-Japan |
|
| Line Graph [Table Text Block] |
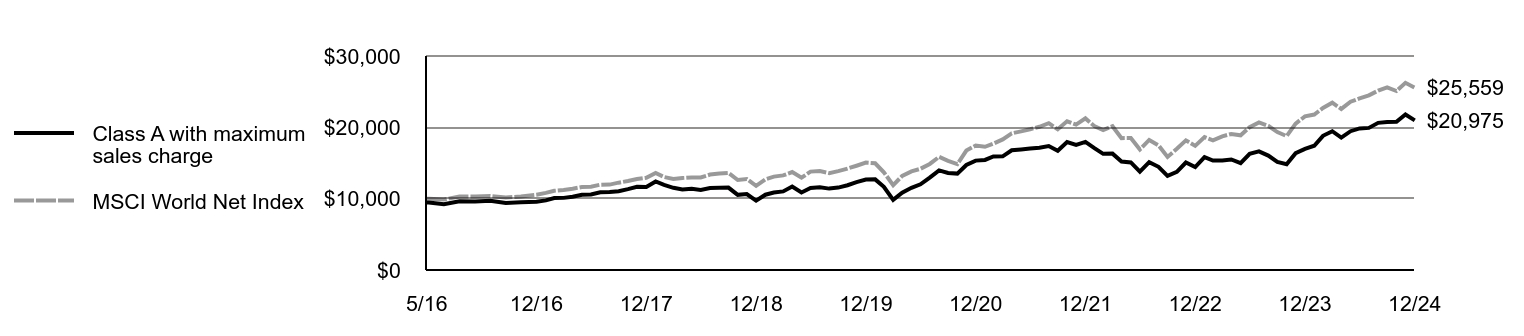 | Class A with maximum sales charge | MSCI World Net Index |
|---|
5/16 | $9,479 | $10,000 |
|---|
5/16 | $9,469 | $9,992 |
|---|
6/16 | $9,213 | $9,880 |
|---|
7/16 | $9,640 | $10,297 |
|---|
8/16 | $9,602 | $10,306 |
|---|
9/16 | $9,716 | $10,361 |
|---|
10/16 | $9,384 | $10,160 |
|---|
11/16 | $9,488 | $10,306 |
|---|
12/16 | $9,558 | $10,553 |
|---|
1/17 | $9,758 | $10,808 |
|---|
2/17 | $10,082 | $11,107 |
|---|
3/17 | $10,111 | $11,226 |
|---|
4/17 | $10,273 | $11,392 |
|---|
5/17 | $10,540 | $11,633 |
|---|
6/17 | $10,578 | $11,678 |
|---|
7/17 | $10,895 | $11,957 |
|---|
8/17 | $10,933 | $11,974 |
|---|
9/17 | $11,047 | $12,243 |
|---|
10/17 | $11,334 | $12,474 |
|---|
11/17 | $11,677 | $12,744 |
|---|
12/17 | $11,643 | $12,917 |
|---|
1/18 | $12,408 | $13,599 |
|---|
2/18 | $11,920 | $13,035 |
|---|
3/18 | $11,519 | $12,751 |
|---|
4/18 | $11,280 | $12,898 |
|---|
5/18 | $11,385 | $12,979 |
|---|
6/18 | $11,232 | $12,973 |
|---|
7/18 | $11,490 | $13,378 |
|---|
8/18 | $11,547 | $13,543 |
|---|
9/18 | $11,557 | $13,619 |
|---|
10/18 | $10,534 | $12,619 |
|---|
11/18 | $10,649 | $12,762 |
|---|
12/18 | $9,732 | $11,792 |
|---|
1/19 | $10,556 | $12,709 |
|---|
2/19 | $10,854 | $13,091 |
|---|
3/19 | $11,017 | $13,263 |
|---|
4/19 | $11,707 | $13,733 |
|---|
5/19 | $10,863 | $12,941 |
|---|
6/19 | $11,486 | $13,794 |
|---|
7/19 | $11,592 | $13,862 |
|---|
8/19 | $11,410 | $13,579 |
|---|
9/19 | $11,554 | $13,868 |
|---|
10/19 | $11,880 | $14,220 |
|---|
11/19 | $12,311 | $14,616 |
|---|
12/19 | $12,686 | $15,054 |
|---|
1/20 | $12,706 | $14,963 |
|---|
2/20 | $11,656 | $13,698 |
|---|
3/20 | $9,835 | $11,885 |
|---|
4/20 | $10,846 | $13,184 |
|---|
5/20 | $11,521 | $13,820 |
|---|
6/20 | $12,012 | $14,186 |
|---|
7/20 | $12,956 | $14,865 |
|---|
8/20 | $13,967 | $15,858 |
|---|
9/20 | $13,611 | $15,311 |
|---|
10/20 | $13,515 | $14,841 |
|---|
11/20 | $14,728 | $16,739 |
|---|
12/20 | $15,335 | $17,448 |
|---|
1/21 | $15,432 | $17,275 |
|---|
2/21 | $15,923 | $17,718 |
|---|
3/21 | $15,933 | $18,307 |
|---|
4/21 | $16,780 | $19,159 |
|---|
5/21 | $16,896 | $19,435 |
|---|
6/21 | $17,031 | $19,725 |
|---|
7/21 | $17,146 | $20,078 |
|---|
8/21 | $17,377 | $20,578 |
|---|
9/21 | $16,722 | $19,723 |
|---|
10/21 | $17,936 | $20,841 |
|---|
11/21 | $17,541 | $20,384 |
|---|
12/21 | $17,963 | $21,255 |
|---|
1/22 | $17,058 | $20,130 |
|---|
2/22 | $16,283 | $19,621 |
|---|
3/22 | $16,313 | $20,160 |
|---|
4/22 | $15,216 | $18,485 |
|---|
5/22 | $15,085 | $18,499 |
|---|
6/22 | $13,797 | $16,897 |
|---|
7/22 | $15,125 | $18,238 |
|---|
8/22 | $14,471 | $17,476 |
|---|
9/22 | $13,203 | $15,851 |
|---|
10/22 | $13,747 | $16,989 |
|---|
11/22 | $15,065 | $18,171 |
|---|
12/22 | $14,435 | $17,399 |
|---|
1/23 | $15,815 | $18,630 |
|---|
2/23 | $15,342 | $18,182 |
|---|
3/23 | $15,352 | $18,744 |
|---|
4/23 | $15,493 | $19,073 |
|---|
5/23 | $14,979 | $18,882 |
|---|
6/23 | $16,289 | $20,024 |
|---|
7/23 | $16,631 | $20,697 |
|---|
8/23 | $16,037 | $20,203 |
|---|
9/23 | $15,160 | $19,331 |
|---|
10/23 | $14,828 | $18,770 |
|---|
11/23 | $16,379 | $20,530 |
|---|
12/23 | $16,978 | $21,538 |
|---|
1/24 | $17,423 | $21,796 |
|---|
2/24 | $18,810 | $22,720 |
|---|
3/24 | $19,457 | $23,450 |
|---|
4/24 | $18,557 | $22,579 |
|---|
5/24 | $19,457 | $23,588 |
|---|
6/24 | $19,852 | $24,068 |
|---|
7/24 | $19,923 | $24,492 |
|---|
8/24 | $20,631 | $25,139 |
|---|
9/24 | $20,752 | $25,599 |
|---|
10/24 | $20,783 | $25,092 |
|---|
11/24 | $21,794 | $26,243 |
|---|
12/24 | $20,975 | $25,559 |
|---|
|
|
| Average Annual Return [Table Text Block] |
AATR | 1 Year | 5 Years | Since 5/27/16
(Inception) |
|---|
Class A | 23.54% | 10.58% | 9.68% |
|---|
Class A, with 5.25% maximum front end sales charge | 17.05% | 9.39% | 9.00% |
|---|
MSCI World Net Index | 18.67% | 11.17% | 11.53% |
|---|
|
|
| Performance Inception Date |
May 27, 2016
|
|
| AssetsNet |
$ 36,769,314
|
|
| Holdings Count | Holding |
47
|
|
| Advisory Fees Paid, Amount |
$ 9,576
|
|
| InvestmentCompanyPortfolioTurnover |
39.00%
|
|
| Additional Fund Statistics [Text Block] |
Total Net Assets | $36,769,314 |
|---|
# of Portfolio Holdings | 47 |
|---|
Portfolio Turnover Rate | 39% |
|---|
Total Advisory Fees Paid | $9,576 |
|---|
|
|
| Holdings [Text Block] |
Sector Allocation (% of total investments)Value | Value |
|---|
Health Care | 0.4% | Short-Term Investments | 0.7% | Consumer Staples | 0.9% | Utilities | 1.1% | Energy | 1.7% | Real Estate | 2.0% | Industrials | 8.0% | Materials | 8.2% | Communication Services | 10.5% | Consumer Discretionary | 17.6% | Information Technology | 23.9% | Financials | 25.0% |
Top Ten Holdings (% of total investments)Footnote ReferenceaCRH PLC | 6.7% | NVIDIA Corp. | 6.2% | Apple, Inc. | 5.6% | Ameriprise Financial, Inc. | 5.5% | Ferrari NV | 5.5% | JPMorgan Chase & Co. | 5.4% | Microsoft Corp. | 5.4% | Taiwan Semiconductor Manufacturing Co. Ltd. | 4.6% | Amazon.com, Inc. | 4.6% | TJX Cos., Inc. | 4.0% | Total | 53.5% |
| Footnote | Description | Footnotea | Excluding cash equivalents. |
|
|
| Material Fund Change [Text Block] |
|
|
| Updated Prospectus Web Address |
<span style="box-sizing: border-box; color: rgb(0, 0, 0); display: inline; flex-wrap: nowrap; font-size: 10.6667px; font-weight: 400; grid-area: auto; line-height: 16px; margin: 0px; overflow: visible; text-align: left;">www.morganstanley.com/im/shareholderreports</span>
|
|
| C000169214 |
|
|
| Shareholder Report [Line Items] |
|
|
| Fund Name |
Morgan Stanley Institutional Fund, Inc. - Global Core Portfolio
|
|
| Class Name |
Class C
|
|
| Trading Symbol |
MLMCX
|
|
| Annual or Semi-Annual Statement [Text Block] |
This annual shareholder report contains important information about Morgan Stanley Institutional Fund, Inc. - Global Core Portfolio for the period of January 1, 2024 to December 31, 2024.
|
|
| Shareholder Report Annual or Semi-Annual |
Annual Shareholder Report
|
|
| Additional Information [Text Block] |
You can find additional information about the Fund at www.morganstanley.com/im/shareholderreports. You can also request this information by contacting us at 1-800-869-6397.
|
|
| Additional Information Phone Number |
1-800-869-6397
|
|
| Additional Information Website |
<span style="box-sizing: border-box; color: rgb(0, 0, 0); display: inline; flex-wrap: nowrap; font-size: 10.6667px; font-weight: 400; grid-area: auto; line-height: 16px; margin: 0px; overflow: visible; text-align: left;">www.morganstanley.com/im/shareholderreports</span>
|
|
| Expenses [Text Block] |
What were the Fund costs for the last year?(based on a hypothetical $10,000 investment) Class Name | Costs of a $10,000 investment | Costs paid as a percentage of a $10,000 investment |
|---|
Class C | $234 | 2.10% |
|---|
|
|
| Expenses Paid, Amount |
$ 234
|
|
| Expense Ratio, Percent |
2.10%
|
|
| Factors Affecting Performance [Text Block] |
How did the Fund perform last year and what affected its performance?Key contributors to (↑) and detractors from (↓) performance, relative to the MSCI World Index: ↑ Stock selection in and overweight to the financial services sector in the U.S., including positions in a leading global financial services company and a financial services company specializing in retail wealth management ↑ Stock selection in an artificial intelligence chip designer and a global provider of entertainment services ↑ Underweight to health care stocks in the U.S. ↑ Stock selection in the Asia ex-Japan technology sector ↓ Overweight to quality stocks in Asia ex-Japan |
|
| Line Graph [Table Text Block] |
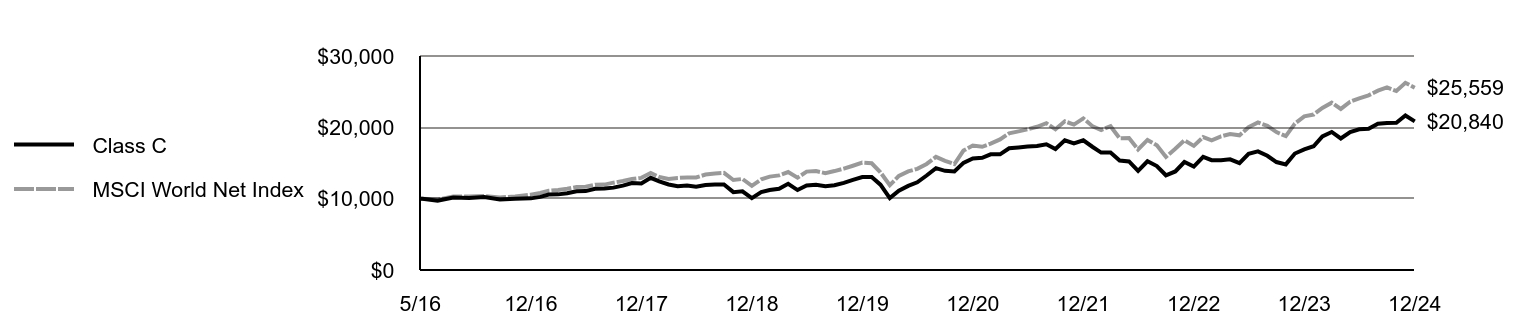 | Class C | MSCI World Net Index |
|---|
5/16 | $10,000 | $10,000 |
|---|
5/16 | $9,990 | $9,992 |
|---|
6/16 | $9,720 | $9,880 |
|---|
7/16 | $10,160 | $10,297 |
|---|
8/16 | $10,110 | $10,306 |
|---|
9/16 | $10,230 | $10,361 |
|---|
10/16 | $9,870 | $10,160 |
|---|
11/16 | $9,980 | $10,306 |
|---|
12/16 | $10,041 | $10,553 |
|---|
1/17 | $10,251 | $10,808 |
|---|
2/17 | $10,583 | $11,107 |
|---|
3/17 | $10,603 | $11,226 |
|---|
4/17 | $10,764 | $11,392 |
|---|
5/17 | $11,045 | $11,633 |
|---|
6/17 | $11,065 | $11,678 |
|---|
7/17 | $11,398 | $11,957 |
|---|
8/17 | $11,428 | $11,974 |
|---|
9/17 | $11,548 | $12,243 |
|---|
10/17 | $11,830 | $12,474 |
|---|
11/17 | $12,181 | $12,744 |
|---|
12/17 | $12,141 | $12,917 |
|---|
1/18 | $12,925 | $13,599 |
|---|
2/18 | $12,413 | $13,035 |
|---|
3/18 | $11,990 | $12,751 |
|---|
4/18 | $11,739 | $12,898 |
|---|
5/18 | $11,830 | $12,979 |
|---|
6/18 | $11,669 | $12,973 |
|---|
7/18 | $11,920 | $13,378 |
|---|
8/18 | $11,980 | $13,543 |
|---|
9/18 | $11,980 | $13,619 |
|---|
10/18 | $10,915 | $12,619 |
|---|
11/18 | $11,026 | $12,762 |
|---|
12/18 | $10,071 | $11,792 |
|---|
1/19 | $10,915 | $12,709 |
|---|
2/19 | $11,217 | $13,091 |
|---|
3/19 | $11,377 | $13,263 |
|---|
4/19 | $12,081 | $13,733 |
|---|
5/19 | $11,207 | $12,941 |
|---|
6/19 | $11,840 | $13,794 |
|---|
7/19 | $11,950 | $13,862 |
|---|
8/19 | $11,749 | $13,579 |
|---|
9/19 | $11,890 | $13,868 |
|---|
10/19 | $12,222 | $14,220 |
|---|
11/19 | $12,644 | $14,616 |
|---|
12/19 | $13,036 | $15,054 |
|---|
1/20 | $13,046 | $14,963 |
|---|
2/20 | $11,960 | $13,698 |
|---|
3/20 | $10,081 | $11,885 |
|---|
4/20 | $11,106 | $13,184 |
|---|
5/20 | $11,789 | $13,820 |
|---|
6/20 | $12,292 | $14,186 |
|---|
7/20 | $13,247 | $14,865 |
|---|
8/20 | $14,272 | $15,858 |
|---|
9/20 | $13,900 | $15,311 |
|---|
10/20 | $13,800 | $14,841 |
|---|
11/20 | $15,026 | $16,739 |
|---|
12/20 | $15,629 | $17,448 |
|---|
1/21 | $15,729 | $17,275 |
|---|
2/21 | $16,212 | $17,718 |
|---|
3/21 | $16,212 | $18,307 |
|---|
4/21 | $17,066 | $19,159 |
|---|
5/21 | $17,177 | $19,435 |
|---|
6/21 | $17,297 | $19,725 |
|---|
7/21 | $17,398 | $20,078 |
|---|
8/21 | $17,619 | $20,578 |
|---|
9/21 | $16,956 | $19,723 |
|---|
10/21 | $18,172 | $20,841 |
|---|
11/21 | $17,760 | $20,384 |
|---|
12/21 | $18,180 | $21,255 |
|---|
1/22 | $17,244 | $20,130 |
|---|
2/22 | $16,456 | $19,621 |
|---|
3/22 | $16,477 | $20,160 |
|---|
4/22 | $15,352 | $18,485 |
|---|
5/22 | $15,215 | $18,499 |
|---|
6/22 | $13,900 | $16,897 |
|---|
7/22 | $15,236 | $18,238 |
|---|
8/22 | $14,573 | $17,476 |
|---|
9/22 | $13,280 | $15,851 |
|---|
10/22 | $13,816 | $16,989 |
|---|
11/22 | $15,141 | $18,171 |
|---|
12/22 | $14,500 | $17,399 |
|---|
1/23 | $15,867 | $18,630 |
|---|
2/23 | $15,394 | $18,182 |
|---|
3/23 | $15,383 | $18,744 |
|---|
4/23 | $15,509 | $19,073 |
|---|
5/23 | $14,994 | $18,882 |
|---|
6/23 | $16,298 | $20,024 |
|---|
7/23 | $16,634 | $20,697 |
|---|
8/23 | $16,014 | $20,203 |
|---|
9/23 | $15,131 | $19,331 |
|---|
10/23 | $14,805 | $18,770 |
|---|
11/23 | $16,329 | $20,530 |
|---|
12/23 | $16,918 | $21,538 |
|---|
1/24 | $17,349 | $21,796 |
|---|
2/24 | $18,727 | $22,720 |
|---|
3/24 | $19,347 | $23,450 |
|---|
4/24 | $18,443 | $22,579 |
|---|
5/24 | $19,332 | $23,588 |
|---|
6/24 | $19,724 | $24,068 |
|---|
7/24 | $19,795 | $24,492 |
|---|
8/24 | $20,498 | $25,139 |
|---|
9/24 | $20,619 | $25,599 |
|---|
10/24 | $20,649 | $25,092 |
|---|
11/24 | $21,654 | $26,243 |
|---|
12/24 | $20,840 | $25,559 |
|---|
|
|
| Average Annual Return [Table Text Block] |
AATR | 1 Year | 5 Years | Since 5/27/16
(Inception) |
|---|
Class C, with conversion to Class A after 8 years | 22.62% | 9.74% | 8.92% |
|---|
Class C, with 1% maximum contingent deferred sales charge and conversion to Class A after 8 years | 21.62% | 9.74% | 8.92% |
|---|
MSCI World Net Index | 18.67% | 11.17% | 11.53% |
|---|
|
|
| Performance Inception Date |
May 27, 2016
|
|
| AssetsNet |
$ 36,769,314
|
|
| Holdings Count | Holding |
47
|
|
| Advisory Fees Paid, Amount |
$ 9,576
|
|
| InvestmentCompanyPortfolioTurnover |
39.00%
|
|
| Additional Fund Statistics [Text Block] |
Total Net Assets | $36,769,314 |
|---|
# of Portfolio Holdings | 47 |
|---|
Portfolio Turnover Rate | 39% |
|---|
Total Advisory Fees Paid | $9,576 |
|---|
|
|
| Holdings [Text Block] |
Sector Allocation (% of total investments)Value | Value |
|---|
Health Care | 0.4% | Short-Term Investments | 0.7% | Consumer Staples | 0.9% | Utilities | 1.1% | Energy | 1.7% | Real Estate | 2.0% | Industrials | 8.0% | Materials | 8.2% | Communication Services | 10.5% | Consumer Discretionary | 17.6% | Information Technology | 23.9% | Financials | 25.0% |
Top Ten Holdings (% of total investments)Footnote ReferenceaCRH PLC | 6.7% | NVIDIA Corp. | 6.2% | Apple, Inc. | 5.6% | Ameriprise Financial, Inc. | 5.5% | Ferrari NV | 5.5% | JPMorgan Chase & Co. | 5.4% | Microsoft Corp. | 5.4% | Taiwan Semiconductor Manufacturing Co. Ltd. | 4.6% | Amazon.com, Inc. | 4.6% | TJX Cos., Inc. | 4.0% | Total | 53.5% |
| Footnote | Description | Footnotea | Excluding cash equivalents. |
|
|
| Material Fund Change [Text Block] |
|
|
| Updated Prospectus Web Address |
<span style="box-sizing: border-box; color: rgb(0, 0, 0); display: inline; flex-wrap: nowrap; font-size: 10.6667px; font-weight: 400; grid-area: auto; line-height: 16px; margin: 0px; overflow: visible; text-align: left;">www.morganstanley.com/im/shareholderreports</span>
|
|
| C000169212 |
|
|
| Shareholder Report [Line Items] |
|
|
| Fund Name |
Morgan Stanley Institutional Fund, Inc. - Global Core Portfolio
|
|
| Class Name |
Class I
|
|
| Trading Symbol |
MLMIX
|
|
| Annual or Semi-Annual Statement [Text Block] |
This annual shareholder report contains important information about Morgan Stanley Institutional Fund, Inc. - Global Core Portfolio for the period of January 1, 2024 to December 31, 2024.
|
|
| Shareholder Report Annual or Semi-Annual |
Annual Shareholder Report
|
|
| Additional Information [Text Block] |
You can find additional information about the Fund at www.morganstanley.com/im/shareholderreports. You can also request this information by contacting us at 1-800-869-6397.
|
|
| Additional Information Phone Number |
1-800-869-6397
|
|
| Additional Information Website |
<span style="box-sizing: border-box; color: rgb(0, 0, 0); display: inline; flex-wrap: nowrap; font-size: 10.6667px; font-weight: 400; grid-area: auto; line-height: 16px; margin: 0px; overflow: visible; text-align: left;">www.morganstanley.com/im/shareholderreports</span>
|
|
| Expenses [Text Block] |
What were the Fund costs for the last year?(based on a hypothetical $10,000 investment) Class Name | Costs of a $10,000 investment | Costs paid as a percentage of a $10,000 investment |
|---|
Class I | $112 | 1.00% |
|---|
|
|
| Expenses Paid, Amount |
$ 112
|
|
| Expense Ratio, Percent |
1.00%
|
|
| Factors Affecting Performance [Text Block] |
How did the Fund perform last year and what affected its performance?Key contributors to (↑) and detractors from (↓) performance, relative to the MSCI World Index: ↑ Stock selection in and overweight to the financial services sector in the U.S., including positions in a leading global financial services company and a financial services company specializing in retail wealth management ↑ Stock selection in an artificial intelligence chip designer and a global provider of entertainment services ↑ Underweight to health care stocks in the U.S. ↑ Stock selection in the Asia ex-Japan technology sector ↓ Overweight to quality stocks in Asia ex-Japan |
|
| Line Graph [Table Text Block] |
 | Class I | MSCI World Net Index |
|---|
5/16 | $1,000,000 | $1,000,000 |
|---|
5/16 | $1,000,000 | $1,000,000 |
|---|
6/16 | $973,000 | $988,002 |
|---|
7/16 | $1,018,000 | $1,029,744 |
|---|
8/16 | $1,014,000 | $1,030,600 |
|---|
9/16 | $1,027,000 | $1,036,074 |
|---|
10/16 | $992,000 | $1,016,023 |
|---|
11/16 | $1,003,000 | $1,030,632 |
|---|
12/16 | $1,010,838 | $1,055,294 |
|---|
1/17 | $1,033,010 | $1,080,763 |
|---|
2/17 | $1,067,275 | $1,110,748 |
|---|
3/17 | $1,070,299 | $1,122,579 |
|---|
4/17 | $1,088,439 | $1,139,201 |
|---|
5/17 | $1,116,658 | $1,163,300 |
|---|
6/17 | $1,120,689 | $1,167,776 |
|---|
7/17 | $1,155,096 | $1,195,724 |
|---|
8/17 | $1,159,132 | $1,197,408 |
|---|
9/17 | $1,172,246 | $1,224,282 |
|---|
10/17 | $1,202,511 | $1,247,419 |
|---|
11/17 | $1,238,828 | $1,274,448 |
|---|
12/17 | $1,235,936 | $1,291,683 |
|---|
1/18 | $1,316,981 | $1,359,884 |
|---|
2/18 | $1,266,328 | $1,303,548 |
|---|
3/18 | $1,224,792 | $1,275,135 |
|---|
4/18 | $1,199,466 | $1,289,788 |
|---|
5/18 | $1,210,609 | $1,297,870 |
|---|
6/18 | $1,194,400 | $1,297,251 |
|---|
7/18 | $1,221,753 | $1,337,769 |
|---|
8/18 | $1,228,844 | $1,354,321 |
|---|
9/18 | $1,229,858 | $1,361,862 |
|---|
10/18 | $1,121,460 | $1,261,863 |
|---|
11/18 | $1,134,630 | $1,276,198 |
|---|
12/18 | $1,036,291 | $1,179,158 |
|---|
1/19 | $1,125,116 | $1,270,904 |
|---|
2/19 | $1,156,766 | $1,309,119 |
|---|
3/19 | $1,174,122 | $1,326,314 |
|---|
4/19 | $1,248,654 | $1,373,344 |
|---|
5/19 | $1,158,808 | $1,294,101 |
|---|
6/19 | $1,226,192 | $1,379,376 |
|---|
7/19 | $1,237,423 | $1,386,208 |
|---|
8/19 | $1,219,045 | $1,357,854 |
|---|
9/19 | $1,234,360 | $1,386,750 |
|---|
10/19 | $1,269,073 | $1,422,040 |
|---|
11/19 | $1,316,038 | $1,461,644 |
|---|
12/19 | $1,357,113 | $1,505,432 |
|---|
1/20 | $1,359,170 | $1,496,269 |
|---|
2/20 | $1,247,021 | $1,369,796 |
|---|
3/20 | $1,052,560 | $1,188,514 |
|---|
4/20 | $1,160,594 | $1,318,352 |
|---|
5/20 | $1,233,645 | $1,382,039 |
|---|
6/20 | $1,287,148 | $1,418,596 |
|---|
7/20 | $1,387,979 | $1,486,463 |
|---|
8/20 | $1,497,042 | $1,585,780 |
|---|
9/20 | $1,458,973 | $1,531,072 |
|---|
10/20 | $1,449,713 | $1,484,107 |
|---|
11/20 | $1,580,383 | $1,673,867 |
|---|
12/20 | $1,645,203 | $1,744,833 |
|---|
1/21 | $1,656,521 | $1,727,492 |
|---|
2/21 | $1,710,024 | $1,771,758 |
|---|
3/21 | $1,711,052 | $1,830,708 |
|---|
4/21 | $1,802,624 | $1,915,909 |
|---|
5/21 | $1,816,000 | $1,943,509 |
|---|
6/21 | $1,831,433 | $1,972,476 |
|---|
7/21 | $1,843,780 | $2,007,809 |
|---|
8/21 | $1,869,502 | $2,057,780 |
|---|
9/21 | $1,799,537 | $1,972,340 |
|---|
10/21 | $1,931,236 | $2,084,054 |
|---|
11/21 | $1,889,051 | $2,038,387 |
|---|
12/21 | $1,935,201 | $2,125,508 |
|---|
1/22 | $1,837,420 | $2,013,045 |
|---|
2/22 | $1,754,682 | $1,962,133 |
|---|
3/22 | $1,758,981 | $2,015,980 |
|---|
4/22 | $1,640,784 | $1,848,506 |
|---|
5/22 | $1,626,815 | $1,849,906 |
|---|
6/22 | $1,488,203 | $1,689,663 |
|---|
7/22 | $1,632,188 | $1,823,816 |
|---|
8/22 | $1,562,344 | $1,747,567 |
|---|
9/22 | $1,425,881 | $1,585,113 |
|---|
10/22 | $1,484,979 | $1,698,945 |
|---|
11/22 | $1,627,890 | $1,817,073 |
|---|
12/22 | $1,560,364 | $1,739,907 |
|---|
1/23 | $1,710,254 | $1,863,016 |
|---|
2/23 | $1,659,572 | $1,818,232 |
|---|
3/23 | $1,660,650 | $1,874,415 |
|---|
4/23 | $1,675,747 | $1,907,272 |
|---|
5/23 | $1,621,830 | $1,888,231 |
|---|
6/23 | $1,764,171 | $2,002,427 |
|---|
7/23 | $1,801,913 | $2,069,694 |
|---|
8/23 | $1,737,213 | $2,020,258 |
|---|
9/23 | $1,642,318 | $1,933,107 |
|---|
10/23 | $1,607,811 | $1,877,017 |
|---|
11/23 | $1,776,033 | $2,052,991 |
|---|
12/23 | $1,840,657 | $2,153,781 |
|---|
1/24 | $1,889,524 | $2,179,627 |
|---|
2/24 | $2,041,554 | $2,272,038 |
|---|
3/24 | $2,111,054 | $2,345,050 |
|---|
4/24 | $2,014,406 | $2,257,944 |
|---|
5/24 | $2,113,226 | $2,358,765 |
|---|
6/24 | $2,155,577 | $2,406,761 |
|---|
7/24 | $2,164,265 | $2,449,174 |
|---|
8/24 | $2,242,452 | $2,513,907 |
|---|
9/24 | $2,255,483 | $2,559,947 |
|---|
10/24 | $2,259,827 | $2,509,165 |
|---|
11/24 | $2,369,506 | $2,624,302 |
|---|
12/24 | $2,282,092 | $2,555,912 |
|---|
|
|
| Average Annual Return [Table Text Block] |
AATR | 1 Year | 5 Years | Since 5/27/16
(Inception) |
|---|
Class I | 23.98% | 10.95% | 10.07% |
|---|
MSCI World Net Index | 18.67% | 11.17% | 11.53% |
|---|
|
|
| Performance Inception Date |
May 27, 2016
|
|
| AssetsNet |
$ 36,769,314
|
|
| Holdings Count | Holding |
47
|
|
| Advisory Fees Paid, Amount |
$ 9,576
|
|
| InvestmentCompanyPortfolioTurnover |
39.00%
|
|
| Additional Fund Statistics [Text Block] |
Total Net Assets | $36,769,314 |
|---|
# of Portfolio Holdings | 47 |
|---|
Portfolio Turnover Rate | 39% |
|---|
Total Advisory Fees Paid | $9,576 |
|---|
|
|
| Holdings [Text Block] |
Sector Allocation (% of total investments)Value | Value |
|---|
Health Care | 0.4% | Short-Term Investments | 0.7% | Consumer Staples | 0.9% | Utilities | 1.1% | Energy | 1.7% | Real Estate | 2.0% | Industrials | 8.0% | Materials | 8.2% | Communication Services | 10.5% | Consumer Discretionary | 17.6% | Information Technology | 23.9% | Financials | 25.0% |
Top Ten Holdings (% of total investments)Footnote ReferenceaCRH PLC | 6.7% | NVIDIA Corp. | 6.2% | Apple, Inc. | 5.6% | Ameriprise Financial, Inc. | 5.5% | Ferrari NV | 5.5% | JPMorgan Chase & Co. | 5.4% | Microsoft Corp. | 5.4% | Taiwan Semiconductor Manufacturing Co. Ltd. | 4.6% | Amazon.com, Inc. | 4.6% | TJX Cos., Inc. | 4.0% | Total | 53.5% |
| Footnote | Description | Footnotea | Excluding cash equivalents. |
|
|
| Material Fund Change [Text Block] |
|
|
| Updated Prospectus Web Address |
<span style="box-sizing: border-box; color: rgb(0, 0, 0); display: inline; flex-wrap: nowrap; font-size: 10.6667px; font-weight: 400; grid-area: auto; line-height: 16px; margin: 0px; overflow: visible; text-align: left;">www.morganstanley.com/im/shareholderreports</span>
|
|
| C000169215 |
|
|
| Shareholder Report [Line Items] |
|
|
| Fund Name |
Morgan Stanley Institutional Fund, Inc. - Global Core Portfolio
|
|
| Class Name |
Class R6
|
|
| Trading Symbol |
MLMSX
|
|
| Annual or Semi-Annual Statement [Text Block] |
This annual shareholder report contains important information about Morgan Stanley Institutional Fund, Inc. - Global Core Portfolio for the period of January 1, 2024 to December 31, 2024.
|
|
| Shareholder Report Annual or Semi-Annual |
Annual Shareholder Report
|
|
| Additional Information [Text Block] |
You can find additional information about the Fund at www.morganstanley.com/im/shareholderreports. You can also request this information by contacting us at 1-800-869-6397.
|
|
| Additional Information Phone Number |
1-800-869-6397
|
|
| Additional Information Website |
<span style="box-sizing: border-box; color: rgb(0, 0, 0); display: inline; flex-wrap: nowrap; font-size: 10.6667px; font-weight: 400; grid-area: auto; line-height: 16px; margin: 0px; overflow: visible; text-align: left;">www.morganstanley.com/im/shareholderreports</span>
|
|
| Expenses [Text Block] |
What were the Fund costs for the last year?(based on a hypothetical $10,000 investment) Class Name | Costs of a $10,000 investment | Costs paid as a percentage of a $10,000 investment |
|---|
Class R6 | $106 | 0.95% |
|---|
|
|
| Expenses Paid, Amount |
$ 106
|
|
| Expense Ratio, Percent |
0.95%
|
|
| Factors Affecting Performance [Text Block] |
How did the Fund perform last year and what affected its performance?Key contributors to (↑) and detractors from (↓) performance, relative to the MSCI World Index: ↑ Stock selection in and overweight to the financial services sector in the U.S., including positions in a leading global financial services company and a financial services company specializing in retail wealth management ↑ Stock selection in an artificial intelligence chip designer and a global provider of entertainment services ↑ Underweight to health care stocks in the U.S. ↑ Stock selection in the Asia ex-Japan technology sector ↓ Overweight to quality stocks in Asia ex-Japan |
|
| Line Graph [Table Text Block] |
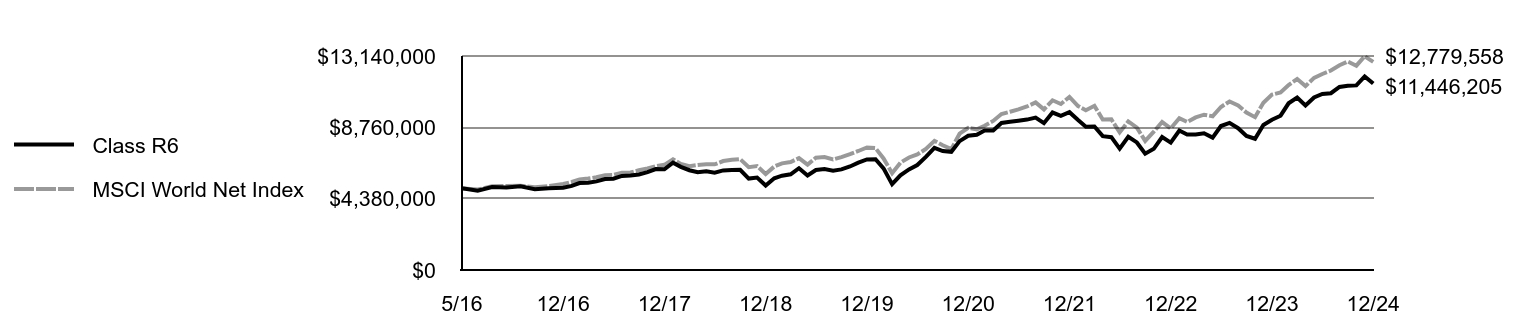 | Class R6 | MSCI World Net Index |
|---|
5/16 | $5,000,000 | $5,000,000 |
|---|
5/16 | $5,000,000 | $5,000,000 |
|---|
6/16 | $4,865,000 | $4,940,011 |
|---|
7/16 | $5,090,000 | $5,148,719 |
|---|
8/16 | $5,070,000 | $5,152,998 |
|---|
9/16 | $5,135,000 | $5,180,370 |
|---|
10/16 | $4,960,000 | $5,080,115 |
|---|
11/16 | $5,020,000 | $5,153,162 |
|---|
12/16 | $5,054,958 | $5,276,469 |
|---|
1/17 | $5,165,834 | $5,403,817 |
|---|
2/17 | $5,337,189 | $5,553,738 |
|---|
3/17 | $5,352,308 | $5,612,896 |
|---|
4/17 | $5,443,026 | $5,696,005 |
|---|
5/17 | $5,584,141 | $5,816,501 |
|---|
6/17 | $5,604,300 | $5,838,880 |
|---|
7/17 | $5,776,361 | $5,978,619 |
|---|
8/17 | $5,796,541 | $5,987,038 |
|---|
9/17 | $5,862,124 | $6,121,412 |
|---|
10/17 | $6,013,470 | $6,237,097 |
|---|
11/17 | $6,200,129 | $6,372,240 |
|---|
12/17 | $6,181,943 | $6,458,415 |
|---|
1/18 | $6,587,316 | $6,799,421 |
|---|
2/18 | $6,333,958 | $6,517,738 |
|---|
3/18 | $6,126,204 | $6,375,674 |
|---|
4/18 | $5,999,525 | $6,448,938 |
|---|
5/18 | $6,055,264 | $6,489,350 |
|---|
6/18 | $5,979,256 | $6,486,254 |
|---|
7/18 | $6,116,070 | $6,688,843 |
|---|
8/18 | $6,146,473 | $6,771,603 |
|---|
9/18 | $6,151,540 | $6,809,308 |
|---|
10/18 | $5,614,420 | $6,309,315 |
|---|
11/18 | $5,675,226 | $6,380,989 |
|---|
12/18 | $5,186,888 | $5,895,791 |
|---|
1/19 | $5,631,478 | $6,354,518 |
|---|
2/19 | $5,789,895 | $6,545,597 |
|---|
3/19 | $5,876,769 | $6,631,570 |
|---|
4/19 | $6,249,817 | $6,866,721 |
|---|
5/19 | $5,800,116 | $6,470,505 |
|---|
6/19 | $6,137,391 | $6,896,878 |
|---|
7/19 | $6,193,604 | $6,931,041 |
|---|
8/19 | $6,101,620 | $6,789,270 |
|---|
9/19 | $6,178,273 | $6,933,752 |
|---|
10/19 | $6,357,131 | $7,110,199 |
|---|
11/19 | $6,587,092 | $7,308,219 |
|---|
12/19 | $6,789,551 | $7,527,160 |
|---|
1/20 | $6,805,005 | $7,481,345 |
|---|
2/20 | $6,243,502 | $6,848,982 |
|---|
3/20 | $5,269,887 | $5,942,569 |
|---|
4/20 | $5,810,784 | $6,591,761 |
|---|
5/20 | $6,176,534 | $6,910,197 |
|---|
6/20 | $6,444,407 | $7,092,979 |
|---|
7/20 | $6,949,245 | $7,432,316 |
|---|
8/20 | $7,495,293 | $7,928,902 |
|---|
9/20 | $7,304,692 | $7,655,362 |
|---|
10/20 | $7,258,329 | $7,420,533 |
|---|
11/20 | $7,912,557 | $8,369,334 |
|---|
12/20 | $8,242,247 | $8,724,166 |
|---|
1/21 | $8,298,913 | $8,637,460 |
|---|
2/21 | $8,561,634 | $8,858,789 |
|---|
3/21 | $8,571,937 | $9,153,540 |
|---|
4/21 | $9,030,412 | $9,579,546 |
|---|
5/21 | $9,097,380 | $9,717,544 |
|---|
6/21 | $9,169,500 | $9,862,382 |
|---|
7/21 | $9,236,468 | $10,039,046 |
|---|
8/21 | $9,360,102 | $10,288,901 |
|---|
9/21 | $9,014,958 | $9,861,700 |
|---|
10/21 | $9,669,186 | $10,420,272 |
|---|
11/21 | $9,463,130 | $10,191,933 |
|---|
12/21 | $9,688,802 | $10,627,538 |
|---|
1/22 | $9,204,630 | $10,065,225 |
|---|
2/22 | $8,790,395 | $9,810,664 |
|---|
3/22 | $8,811,914 | $10,079,901 |
|---|
4/22 | $8,220,149 | $9,242,530 |
|---|
5/22 | $8,155,593 | $9,249,530 |
|---|
6/22 | $7,456,235 | $8,448,317 |
|---|
7/22 | $8,182,492 | $9,119,082 |
|---|
8/22 | $7,832,812 | $8,737,834 |
|---|
9/22 | $7,144,213 | $7,925,565 |
|---|
10/22 | $7,440,096 | $8,494,724 |
|---|
11/22 | $8,160,973 | $9,085,365 |
|---|
12/22 | $7,821,114 | $8,699,534 |
|---|
1/23 | $8,566,496 | $9,315,079 |
|---|
2/23 | $8,318,036 | $9,091,159 |
|---|
3/23 | $8,323,437 | $9,372,073 |
|---|
4/23 | $8,399,055 | $9,536,361 |
|---|
5/23 | $8,128,989 | $9,441,156 |
|---|
6/23 | $8,841,964 | $10,012,136 |
|---|
7/23 | $9,031,010 | $10,348,471 |
|---|
8/23 | $8,706,931 | $10,101,290 |
|---|
9/23 | $8,231,614 | $9,665,537 |
|---|
10/23 | $8,058,772 | $9,385,083 |
|---|
11/23 | $8,906,780 | $10,264,954 |
|---|
12/23 | $9,229,273 | $10,768,905 |
|---|
1/24 | $9,474,154 | $10,898,137 |
|---|
2/24 | $10,236,004 | $11,360,192 |
|---|
3/24 | $10,589,720 | $11,725,250 |
|---|
4/24 | $10,099,959 | $11,289,719 |
|---|
5/24 | $10,595,162 | $11,793,827 |
|---|
6/24 | $10,812,834 | $12,033,807 |
|---|
7/24 | $10,856,368 | $12,245,872 |
|---|
8/24 | $11,242,735 | $12,569,536 |
|---|
9/24 | $11,308,036 | $12,799,734 |
|---|
10/24 | $11,335,245 | $12,545,827 |
|---|
11/24 | $11,884,866 | $13,121,512 |
|---|
12/24 | $11,446,205 | $12,779,558 |
|---|
|
|
| Average Annual Return [Table Text Block] |
AATR | 1 Year | 5 Years | Since 5/27/16
(Inception) |
|---|
Class R6 | 24.02% | 11.01% | 10.11% |
|---|
MSCI World Net Index | 18.67% | 11.17% | 11.53% |
|---|
|
|
| Performance Inception Date |
May 27, 2016
|
|
| AssetsNet |
$ 36,769,314
|
|
| Holdings Count | Holding |
47
|
|
| Advisory Fees Paid, Amount |
$ 9,576
|
|
| InvestmentCompanyPortfolioTurnover |
39.00%
|
|
| Additional Fund Statistics [Text Block] |
Total Net Assets | $36,769,314 |
|---|
# of Portfolio Holdings | 47 |
|---|
Portfolio Turnover Rate | 39% |
|---|
Total Advisory Fees Paid | $9,576 |
|---|
|
|
| Holdings [Text Block] |
Sector Allocation (% of total investments)Value | Value |
|---|
Health Care | 0.4% | Short-Term Investments | 0.7% | Consumer Staples | 0.9% | Utilities | 1.1% | Energy | 1.7% | Real Estate | 2.0% | Industrials | 8.0% | Materials | 8.2% | Communication Services | 10.5% | Consumer Discretionary | 17.6% | Information Technology | 23.9% | Financials | 25.0% |
Top Ten Holdings (% of total investments)Footnote ReferenceaCRH PLC | 6.7% | NVIDIA Corp. | 6.2% | Apple, Inc. | 5.6% | Ameriprise Financial, Inc. | 5.5% | Ferrari NV | 5.5% | JPMorgan Chase & Co. | 5.4% | Microsoft Corp. | 5.4% | Taiwan Semiconductor Manufacturing Co. Ltd. | 4.6% | Amazon.com, Inc. | 4.6% | TJX Cos., Inc. | 4.0% | Total | 53.5% |
| Footnote | Description | Footnotea | Excluding cash equivalents. |
|
|
| Material Fund Change [Text Block] |
|
|
| Updated Prospectus Web Address |
<span style="box-sizing: border-box; color: rgb(0, 0, 0); display: inline; flex-wrap: nowrap; font-size: 10.6667px; font-weight: 400; grid-area: auto; line-height: 16px; margin: 0px; overflow: visible; text-align: left;">www.morganstanley.com/im/shareholderreports</span>
|
|
| C000204518 |
|
|
| Shareholder Report [Line Items] |
|
|
| Fund Name |
Morgan Stanley Institutional Fund, Inc. - Global Endurance Portfolio
|
|
| Class Name |
Class A
|
|
| Trading Symbol |
MSJAX
|
|
| Annual or Semi-Annual Statement [Text Block] |
This annual shareholder report contains important information about Morgan Stanley Institutional Fund, Inc. - Global Endurance Portfolio for the period of January 1, 2024 to December 31, 2024.
|
|
| Shareholder Report Annual or Semi-Annual |
Annual Shareholder Report
|
|
| Additional Information [Text Block] |
You can find additional information about the Fund at www.morganstanley.com/im/shareholderreports. You can also request this information by contacting us at 1-800-869-6397.
|
|
| Additional Information Phone Number |
1-800-869-6397
|
|
| Additional Information Website |
<span style="box-sizing: border-box; color: rgb(0, 0, 0); display: inline; flex-wrap: nowrap; font-size: 10.6667px; font-weight: 400; grid-area: auto; line-height: 16px; margin: 0px; overflow: visible; text-align: left;">www.morganstanley.com/im/shareholderreports</span>
|
|
| Expenses [Text Block] |
What were the Fund costs for the last year?(based on a hypothetical $10,000 investment) Class Name | Costs of a $10,000 investment | Costs paid as a percentage of a $10,000 investment |
|---|
Class A | $139 | 1.35% |
|---|
|
|
| Expenses Paid, Amount |
$ 139
|
|
| Expense Ratio, Percent |
1.35%
|
|
| Factors Affecting Performance [Text Block] |
How did the Fund perform last year and what affected its performance?Key contributors to (↑) and detractors from (↓) performance, relative to the MSCI All Country World Net Index: ↓ Stock selection and an average underweight in information technology, where a holding in a global edge network that focuses on content delivery, cybersecurity and cloud computing services was the largest detractor ↓ Stock selection and an average overweight in consumer discretionary, where the largest detractor was a holding in a contemporary carpets and floor coverings company ↓ Stock selection and average overweight in health care, driven by underperformance in a holding in an analytical testing and laboratory services provider ↑ Stock selection in utilities, led by position in a U.S. electric power producer ↑ Stock selection in financials, led by holding in a global payments platform ↑ No exposure to materials |
|
| Line Graph [Table Text Block] |
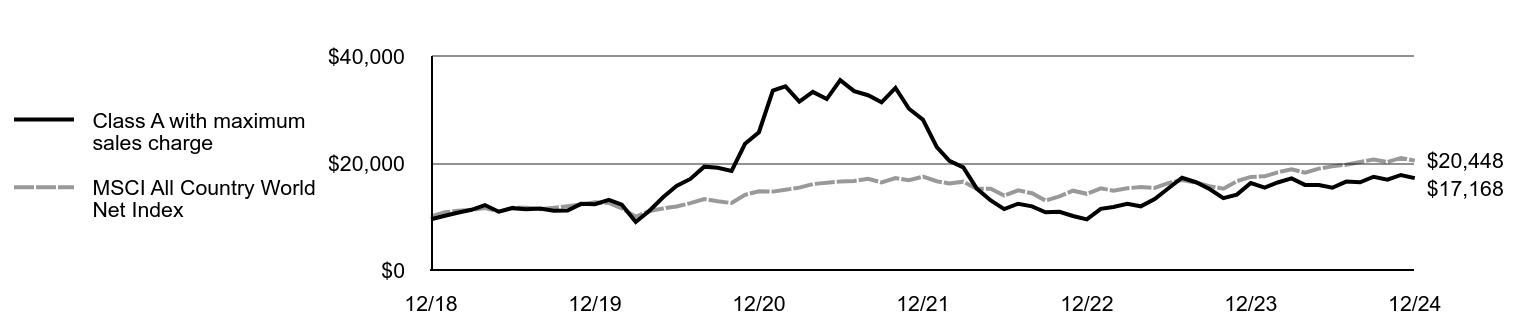 | Class A with maximum sales charge | MSCI All Country World Net Index |
|---|
12/18 | $9,479 | $10,000 |
|---|
1/19 | $10,133 | $10,790 |
|---|
2/19 | $10,711 | $11,078 |
|---|
3/19 | $11,251 | $11,218 |
|---|
4/19 | $12,142 | $11,596 |
|---|
5/19 | $10,891 | $10,908 |
|---|
6/19 | $11,564 | $11,623 |
|---|
7/19 | $11,355 | $11,657 |
|---|
8/19 | $11,479 | $11,380 |
|---|
9/19 | $11,062 | $11,620 |
|---|
10/19 | $11,100 | $11,938 |
|---|
11/19 | $12,360 | $12,229 |
|---|
12/19 | $12,313 | $12,660 |
|---|
1/20 | $13,109 | $12,520 |
|---|
2/20 | $12,209 | $11,509 |
|---|
3/20 | $8,976 | $9,955 |
|---|
4/20 | $11,033 | $11,021 |
|---|
5/20 | $13,602 | $11,501 |
|---|
6/20 | $15,725 | $11,868 |
|---|
7/20 | $17,024 | $12,496 |
|---|
8/20 | $19,318 | $13,261 |
|---|
9/20 | $19,100 | $12,833 |
|---|
10/20 | $18,531 | $12,521 |
|---|
11/20 | $23,592 | $14,065 |
|---|
12/20 | $25,746 | $14,718 |
|---|
1/21 | $33,529 | $14,651 |
|---|
2/21 | $34,321 | $14,990 |
|---|
3/21 | $31,476 | $15,390 |
|---|
4/21 | $33,285 | $16,063 |
|---|
5/21 | $31,955 | $16,313 |
|---|
6/21 | $35,485 | $16,528 |
|---|
7/21 | $33,431 | $16,642 |
|---|
8/21 | $32,669 | $17,059 |
|---|
9/21 | $31,349 | $16,354 |
|---|
10/21 | $34,028 | $17,189 |
|---|
11/21 | $30,146 | $16,775 |
|---|
12/21 | $28,114 | $17,446 |
|---|
1/22 | $22,983 | $16,589 |
|---|
2/22 | $20,392 | $16,161 |
|---|
3/22 | $19,173 | $16,511 |
|---|
4/22 | $15,219 | $15,189 |
|---|
5/22 | $13,007 | $15,207 |
|---|
6/22 | $11,379 | $13,925 |
|---|
7/22 | $12,382 | $14,897 |
|---|
8/22 | $11,891 | $14,349 |
|---|
9/22 | $10,795 | $12,975 |
|---|
10/22 | $10,877 | $13,758 |
|---|
11/22 | $10,088 | $14,825 |
|---|
12/22 | $9,453 | $14,242 |
|---|
1/23 | $11,440 | $15,263 |
|---|
2/23 | $11,788 | $14,825 |
|---|
3/23 | $12,372 | $15,283 |
|---|
4/23 | $11,901 | $15,502 |
|---|
5/23 | $13,263 | $15,336 |
|---|
6/23 | $15,240 | $16,227 |
|---|
7/23 | $17,237 | $16,821 |
|---|
8/23 | $16,407 | $16,351 |
|---|
9/23 | $15,137 | $15,674 |
|---|
10/23 | $13,427 | $15,203 |
|---|
11/23 | $14,093 | $16,606 |
|---|
12/23 | $16,262 | $17,404 |
|---|
1/24 | $15,378 | $17,506 |
|---|
2/24 | $16,356 | $18,257 |
|---|
3/24 | $17,126 | $18,831 |
|---|
4/24 | $15,909 | $18,209 |
|---|
5/24 | $15,888 | $18,949 |
|---|
6/24 | $15,378 | $19,371 |
|---|
7/24 | $16,523 | $19,683 |
|---|
8/24 | $16,387 | $20,183 |
|---|
9/24 | $17,428 | $20,652 |
|---|
10/24 | $16,887 | $20,188 |
|---|
11/24 | $17,761 | $20,944 |
|---|
12/24 | $17,168 | $20,448 |
|---|
|
|
| Average Annual Return [Table Text Block] |
AATR | 1 Year | 5 Years | Since 12/31/18
(Inception) |
|---|
Class A | 5.57% | 6.87% | 10.41% |
|---|
Class A, with 5.25% maximum front end sales charge | 0.00% | 5.73% | 9.43% |
|---|
MSCI All Country World Net Index | 17.49% | 10.06% | 12.66% |
|---|
|
|
| Performance Inception Date |
Dec. 31, 2018
|
|
| AssetsNet |
$ 27,993,056
|
|
| Holdings Count | Holding |
32
|
|
| Advisory Fees Paid, Amount |
$ 40,326
|
|
| InvestmentCompanyPortfolioTurnover |
157.00%
|
|
| Additional Fund Statistics [Text Block] |
Total Net Assets | $27,993,056 |
|---|
# of Portfolio Holdings | 32 |
|---|
Portfolio Turnover Rate | 157% |
|---|
Total Advisory Fees Paid | $40,326 |
|---|
|
|
| Holdings [Text Block] |
Sector Allocation (% of total investments)Value | Value |
|---|
Financials | 1.6% | Short-Term Investments | 2.6% | Industrials | 7.1% | Utilities | 8.3% | Health Care | 24.1% | Information Technology | 25.0% | Consumer Discretionary | 31.3% |
Top Ten Holdings (% of total investments)Footnote ReferenceaAppian Corp. | 11.7% | Victoria PLC | 10.6% | Talen Energy Corp. | 4.7% | Lithia Motors, Inc. | 4.5% | Babcock International Group PLC | 4.4% | Tesla, Inc. | 3.9% | Delivery Hero SE | 3.9% | Avadel Pharmaceuticals PLC | 3.7% | Vistra Corp. | 3.6% | Global-e Online Ltd. | 3.1% | Total | 54.1% |
| Footnote | Description | Footnotea | Excluding cash equivalents. |
|
|
| Material Fund Change [Text Block] |
|
|
| Updated Prospectus Web Address |
<span style="box-sizing: border-box; color: rgb(0, 0, 0); display: inline; flex-wrap: nowrap; font-size: 10.6667px; font-weight: 400; grid-area: auto; line-height: 16px; margin: 0px; overflow: visible; text-align: left;">www.morganstanley.com/im/shareholderreports</span>
|
|
| C000204519 |
|
|
| Shareholder Report [Line Items] |
|
|
| Fund Name |
Morgan Stanley Institutional Fund, Inc. - Global Endurance Portfolio
|
|
| Class Name |
Class C
|
|
| Trading Symbol |
MSJCX
|
|
| Annual or Semi-Annual Statement [Text Block] |
This annual shareholder report contains important information about Morgan Stanley Institutional Fund, Inc. - Global Endurance Portfolio for the period of January 1, 2024 to December 31, 2024.
|
|
| Shareholder Report Annual or Semi-Annual |
Annual Shareholder Report
|
|
| Additional Information [Text Block] |
You can find additional information about the Fund at www.morganstanley.com/im/shareholderreports. You can also request this information by contacting us at 1-800-869-6397.
|
|
| Additional Information Phone Number |
1-800-869-6397
|
|
| Additional Information Website |
<span style="box-sizing: border-box; color: rgb(0, 0, 0); display: inline; flex-wrap: nowrap; font-size: 10.6667px; font-weight: 400; grid-area: auto; line-height: 16px; margin: 0px; overflow: visible; text-align: left;">www.morganstanley.com/im/shareholderreports</span>
|
|
| Expenses [Text Block] |
What were the Fund costs for the last year?(based on a hypothetical $10,000 investment) Class Name | Costs of a $10,000 investment | Costs paid as a percentage of a $10,000 investment |
|---|
Class C | $215 | 2.10% |
|---|
|
|
| Expenses Paid, Amount |
$ 215
|
|
| Expense Ratio, Percent |
2.10%
|
|
| Factors Affecting Performance [Text Block] |
How did the Fund perform last year and what affected its performance?Key contributors to (↑) and detractors from (↓) performance, relative to the MSCI All Country World Net Index: ↓ Stock selection and an average underweight in information technology, where a holding in a global edge network that focuses on content delivery, cybersecurity and cloud computing services was the largest detractor ↓ Stock selection and an average overweight in consumer discretionary, where the largest detractor was a holding in a contemporary carpets and floor coverings company ↓ Stock selection and average overweight in health care, driven by underperformance in a holding in an analytical testing and laboratory services provider ↑ Stock selection in utilities, led by position in a U.S. electric power producer ↑ Stock selection in financials, led by holding in a global payments platform ↑ No exposure to materials |
|
| Line Graph [Table Text Block] |
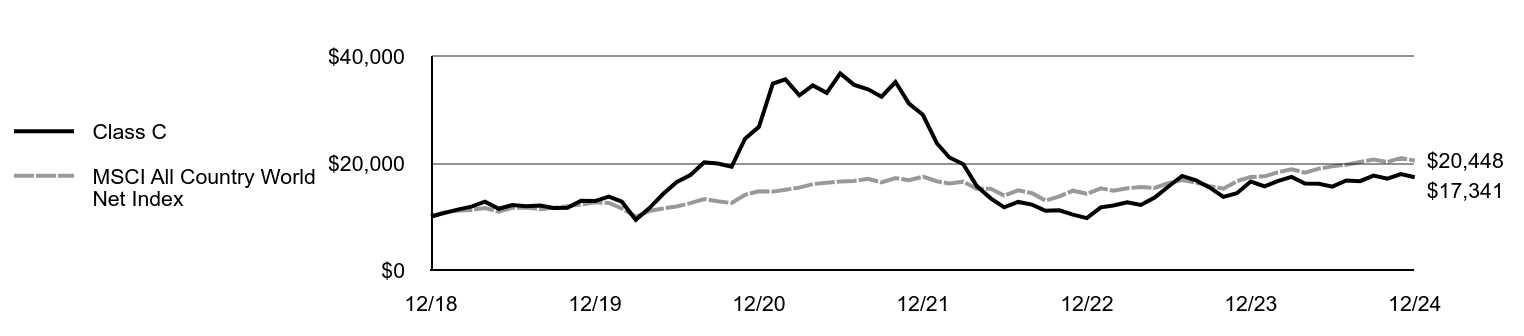 | Class C | MSCI All Country World Net Index |
|---|
12/18 | $10,000 | $10,000 |
|---|
1/19 | $10,690 | $10,790 |
|---|
2/19 | $11,290 | $11,078 |
|---|
3/19 | $11,840 | $11,218 |
|---|
4/19 | $12,770 | $11,596 |
|---|
5/19 | $11,450 | $10,908 |
|---|
6/19 | $12,150 | $11,623 |
|---|
7/19 | $11,920 | $11,657 |
|---|
8/19 | $12,050 | $11,380 |
|---|
9/19 | $11,600 | $11,620 |
|---|
10/19 | $11,640 | $11,938 |
|---|
11/19 | $12,950 | $12,229 |
|---|
12/19 | $12,890 | $12,660 |
|---|
1/20 | $13,720 | $12,520 |
|---|
2/20 | $12,770 | $11,509 |
|---|
3/20 | $9,380 | $9,955 |
|---|
4/20 | $11,520 | $11,021 |
|---|
5/20 | $14,200 | $11,501 |
|---|
6/20 | $16,400 | $11,868 |
|---|
7/20 | $17,740 | $12,496 |
|---|
8/20 | $20,130 | $13,261 |
|---|
9/20 | $19,890 | $12,833 |
|---|
10/20 | $19,290 | $12,521 |
|---|
11/20 | $24,540 | $14,065 |
|---|
12/20 | $26,758 | $14,718 |
|---|
1/21 | $34,828 | $14,651 |
|---|
2/21 | $35,633 | $14,990 |
|---|
3/21 | $32,651 | $15,390 |
|---|
4/21 | $34,508 | $16,063 |
|---|
5/21 | $33,115 | $16,313 |
|---|
6/21 | $36,748 | $16,528 |
|---|
7/21 | $34,601 | $16,642 |
|---|
8/21 | $33,786 | $17,059 |
|---|
9/21 | $32,403 | $16,354 |
|---|
10/21 | $35,138 | $17,189 |
|---|
11/21 | $31,113 | $16,775 |
|---|
12/21 | $29,010 | $17,446 |
|---|
1/22 | $23,697 | $16,589 |
|---|
2/22 | $21,035 | $16,161 |
|---|
3/22 | $19,758 | $16,511 |
|---|
4/22 | $15,679 | $15,189 |
|---|
5/22 | $13,396 | $15,207 |
|---|
6/22 | $11,708 | $13,925 |
|---|
7/22 | $12,725 | $14,897 |
|---|
8/22 | $12,216 | $14,349 |
|---|
9/22 | $11,080 | $12,975 |
|---|
10/22 | $11,167 | $13,758 |
|---|
11/22 | $10,344 | $14,825 |
|---|
12/22 | $9,695 | $14,242 |
|---|
1/23 | $11,719 | $15,263 |
|---|
2/23 | $12,065 | $14,825 |
|---|
3/23 | $12,660 | $15,283 |
|---|
4/23 | $12,162 | $15,502 |
|---|
5/23 | $13,547 | $15,336 |
|---|
6/23 | $15,560 | $16,227 |
|---|
7/23 | $17,594 | $16,821 |
|---|
8/23 | $16,739 | $16,351 |
|---|
9/23 | $15,430 | $15,674 |
|---|
10/23 | $13,677 | $15,203 |
|---|
11/23 | $14,348 | $16,606 |
|---|
12/23 | $16,542 | $17,404 |
|---|
1/24 | $15,634 | $17,506 |
|---|
2/24 | $16,630 | $18,257 |
|---|
3/24 | $17,395 | $18,831 |
|---|
4/24 | $16,148 | $18,209 |
|---|
5/24 | $16,115 | $18,949 |
|---|
6/24 | $15,590 | $19,371 |
|---|
7/24 | $16,739 | $19,683 |
|---|
8/24 | $16,597 | $20,183 |
|---|
9/24 | $17,636 | $20,652 |
|---|
10/24 | $17,067 | $20,188 |
|---|
11/24 | $17,942 | $20,944 |
|---|
12/24 | $17,341 | $20,448 |
|---|
|
|
| Average Annual Return [Table Text Block] |
AATR | 1 Year | 5 Years | Since 12/31/18
(Inception) |
|---|
Class C | 4.83% | 6.11% | 9.61% |
|---|
Class C, with 1% maximum contingent deferred sales charge | 3.83% | 6.11% | 9.61% |
|---|
MSCI All Country World Net Index | 17.49% | 10.06% | 12.66% |
|---|
|
|
| Performance Inception Date |
Dec. 31, 2018
|
|
| AssetsNet |
$ 27,993,056
|
|
| Holdings Count | Holding |
32
|
|
| Advisory Fees Paid, Amount |
$ 40,326
|
|
| InvestmentCompanyPortfolioTurnover |
157.00%
|
|
| Additional Fund Statistics [Text Block] |
Total Net Assets | $27,993,056 |
|---|
# of Portfolio Holdings | 32 |
|---|
Portfolio Turnover Rate | 157% |
|---|
Total Advisory Fees Paid | $40,326 |
|---|
|
|
| Holdings [Text Block] |
Sector Allocation (% of total investments)Value | Value |
|---|
Financials | 1.6% | Short-Term Investments | 2.6% | Industrials | 7.1% | Utilities | 8.3% | Health Care | 24.1% | Information Technology | 25.0% | Consumer Discretionary | 31.3% |
Top Ten Holdings (% of total investments)Footnote ReferenceaAppian Corp. | 11.7% | Victoria PLC | 10.6% | Talen Energy Corp. | 4.7% | Lithia Motors, Inc. | 4.5% | Babcock International Group PLC | 4.4% | Tesla, Inc. | 3.9% | Delivery Hero SE | 3.9% | Avadel Pharmaceuticals PLC | 3.7% | Vistra Corp. | 3.6% | Global-e Online Ltd. | 3.1% | Total | 54.1% |
| Footnote | Description | Footnotea | Excluding cash equivalents. |
|
|
| Material Fund Change [Text Block] |
|
|
| Updated Prospectus Web Address |
<span style="box-sizing: border-box; color: rgb(0, 0, 0); display: inline; flex-wrap: nowrap; font-size: 10.6667px; font-weight: 400; grid-area: auto; line-height: 16px; margin: 0px; overflow: visible; text-align: left;">www.morganstanley.com/im/shareholderreports</span>
|
|
| C000204520 |
|
|
| Shareholder Report [Line Items] |
|
|
| Fund Name |
Morgan Stanley Institutional Fund, Inc. - Global Endurance Portfolio
|
|
| Class Name |
Class I
|
|
| Trading Symbol |
MSJIX
|
|
| Annual or Semi-Annual Statement [Text Block] |
This annual shareholder report contains important information about Morgan Stanley Institutional Fund, Inc. - Global Endurance Portfolio for the period of January 1, 2024 to December 31, 2024.
|
|
| Shareholder Report Annual or Semi-Annual |
Annual Shareholder Report
|
|
| Additional Information [Text Block] |
You can find additional information about the Fund at www.morganstanley.com/im/shareholderreports. You can also request this information by contacting us at 1-800-869-6397.
|
|
| Additional Information Phone Number |
1-800-869-6397
|
|
| Additional Information Website |
<span style="box-sizing: border-box; color: rgb(0, 0, 0); display: inline; flex-wrap: nowrap; font-size: 10.6667px; font-weight: 400; grid-area: auto; line-height: 16px; margin: 0px; overflow: visible; text-align: left;">www.morganstanley.com/im/shareholderreports</span>
|
|
| Expenses [Text Block] |
What were the Fund costs for the last year?(based on a hypothetical $10,000 investment) Class Name | Costs of a $10,000 investment | Costs paid as a percentage of a $10,000 investment |
|---|
Class I | $103 | 1.00% |
|---|
|
|
| Expenses Paid, Amount |
$ 103
|
|
| Expense Ratio, Percent |
1.00%
|
|
| Factors Affecting Performance [Text Block] |
How did the Fund perform last year and what affected its performance?Key contributors to (↑) and detractors from (↓) performance, relative to the MSCI All Country World Net Index: ↓ Stock selection and an average underweight in information technology, where a holding in a global edge network that focuses on content delivery, cybersecurity and cloud computing services was the largest detractor ↓ Stock selection and an average overweight in consumer discretionary, where the largest detractor was a holding in a contemporary carpets and floor coverings company ↓ Stock selection and average overweight in health care, driven by underperformance in a holding in an analytical testing and laboratory services provider ↑ Stock selection in utilities, led by position in a U.S. electric power producer ↑ Stock selection in financials, led by holding in a global payments platform ↑ No exposure to materials |
|
| Line Graph [Table Text Block] |
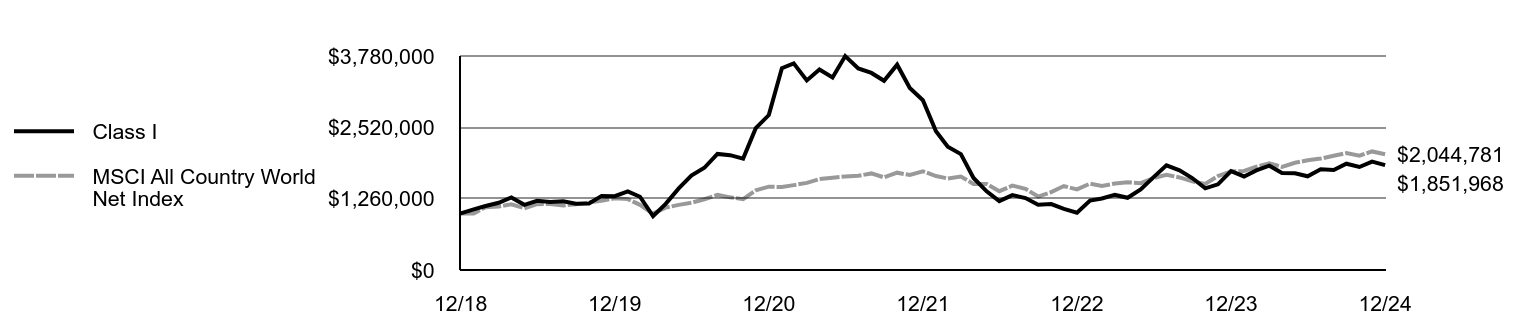 | Class I | MSCI All Country World Net Index |
|---|
12/18 | $1,000,000 | $1,000,000 |
|---|
1/19 | $1,070,000 | $1,000,000 |
|---|
2/19 | $1,131,000 | $1,107,819 |
|---|
3/19 | $1,188,000 | $1,121,751 |
|---|
4/19 | $1,282,000 | $1,159,627 |
|---|
5/19 | $1,151,000 | $1,090,839 |
|---|
6/19 | $1,222,000 | $1,162,267 |
|---|
7/19 | $1,200,000 | $1,165,673 |
|---|
8/19 | $1,214,000 | $1,138,020 |
|---|
9/19 | $1,170,000 | $1,161,966 |
|---|
10/19 | $1,175,000 | $1,193,767 |
|---|
11/19 | $1,309,000 | $1,222,909 |
|---|
12/19 | $1,303,000 | $1,265,974 |
|---|
1/20 | $1,389,000 | $1,251,990 |
|---|
2/20 | $1,294,000 | $1,150,867 |
|---|
3/20 | $951,000 | $995,496 |
|---|
4/20 | $1,169,000 | $1,102,139 |
|---|
5/20 | $1,442,000 | $1,150,072 |
|---|
6/20 | $1,667,000 | $1,186,820 |
|---|
7/20 | $1,806,000 | $1,249,587 |
|---|
8/20 | $2,050,000 | $1,326,068 |
|---|
9/20 | $2,028,000 | $1,283,312 |
|---|
10/20 | $1,968,000 | $1,252,116 |
|---|
11/20 | $2,506,000 | $1,406,455 |
|---|
12/20 | $2,736,680 | $1,471,756 |
|---|
1/21 | $3,563,568 | $1,465,063 |
|---|
2/21 | $3,649,251 | $1,498,999 |
|---|
3/21 | $3,347,813 | $1,539,036 |
|---|
4/21 | $3,541,889 | $1,606,327 |
|---|
5/21 | $3,401,494 | $1,631,325 |
|---|
6/21 | $3,778,291 | $1,652,821 |
|---|
7/21 | $3,560,471 | $1,664,211 |
|---|
8/21 | $3,480,983 | $1,705,865 |
|---|
9/21 | $3,341,619 | $1,635,396 |
|---|
10/21 | $3,626,540 | $1,718,872 |
|---|
11/21 | $3,213,612 | $1,677,481 |
|---|
12/21 | $2,999,112 | $1,744,581 |
|---|
1/22 | $2,452,247 | $1,658,900 |
|---|
2/22 | $2,176,653 | $1,616,056 |
|---|
3/22 | $2,046,961 | $1,651,058 |
|---|
4/22 | $1,625,465 | $1,518,904 |
|---|
5/22 | $1,389,859 | $1,520,682 |
|---|
6/22 | $1,215,856 | $1,392,494 |
|---|
7/22 | $1,322,851 | $1,489,735 |
|---|
8/22 | $1,270,975 | $1,434,891 |
|---|
9/22 | $1,154,253 | $1,297,530 |
|---|
10/22 | $1,163,980 | $1,375,832 |
|---|
11/22 | $1,079,680 | $1,482,546 |
|---|
12/22 | $1,012,673 | $1,424,206 |
|---|
1/23 | $1,225,583 | $1,526,289 |
|---|
2/23 | $1,262,329 | $1,482,545 |
|---|
3/23 | $1,326,094 | $1,528,256 |
|---|
4/23 | $1,275,298 | $1,550,221 |
|---|
5/23 | $1,422,281 | $1,533,617 |
|---|
6/23 | $1,635,191 | $1,622,661 |
|---|
7/23 | $1,849,182 | $1,682,063 |
|---|
8/23 | $1,761,640 | $1,635,059 |
|---|
9/23 | $1,624,384 | $1,567,448 |
|---|
10/23 | $1,441,735 | $1,520,320 |
|---|
11/23 | $1,513,065 | $1,660,639 |
|---|
12/23 | $1,747,427 | $1,740,406 |
|---|
1/24 | $1,652,733 | $1,750,609 |
|---|
2/24 | $1,759,539 | $1,825,734 |
|---|
3/24 | $1,842,120 | $1,883,056 |
|---|
4/24 | $1,712,192 | $1,820,928 |
|---|
5/24 | $1,709,990 | $1,894,883 |
|---|
6/24 | $1,654,935 | $1,937,086 |
|---|
7/24 | $1,779,358 | $1,968,326 |
|---|
8/24 | $1,766,145 | $2,018,315 |
|---|
9/24 | $1,877,355 | $2,065,203 |
|---|
10/24 | $1,818,998 | $2,018,845 |
|---|
11/24 | $1,914,792 | $2,094,358 |
|---|
12/24 | $1,851,968 | $2,044,781 |
|---|
|
|
| Average Annual Return [Table Text Block] |
AATR | 1 Year | 5 Years | Since 12/31/18
(Inception) |
|---|
Class I | 5.98% | 7.28% | 10.82% |
|---|
MSCI All Country World Net Index | 17.49% | 10.06% | 12.66% |
|---|
|
|
| Performance Inception Date |
Dec. 31, 2018
|
|
| AssetsNet |
$ 27,993,056
|
|
| Holdings Count | Holding |
32
|
|
| Advisory Fees Paid, Amount |
$ 40,326
|
|
| InvestmentCompanyPortfolioTurnover |
157.00%
|
|
| Additional Fund Statistics [Text Block] |
Total Net Assets | $27,993,056 |
|---|
# of Portfolio Holdings | 32 |
|---|
Portfolio Turnover Rate | 157% |
|---|
Total Advisory Fees Paid | $40,326 |
|---|
|
|
| Holdings [Text Block] |
Sector Allocation (% of total investments)Value | Value |
|---|
Financials | 1.6% | Short-Term Investments | 2.6% | Industrials | 7.1% | Utilities | 8.3% | Health Care | 24.1% | Information Technology | 25.0% | Consumer Discretionary | 31.3% |
Top Ten Holdings (% of total investments)Footnote ReferenceaAppian Corp. | 11.7% | Victoria PLC | 10.6% | Talen Energy Corp. | 4.7% | Lithia Motors, Inc. | 4.5% | Babcock International Group PLC | 4.4% | Tesla, Inc. | 3.9% | Delivery Hero SE | 3.9% | Avadel Pharmaceuticals PLC | 3.7% | Vistra Corp. | 3.6% | Global-e Online Ltd. | 3.1% | Total | 54.1% |
| Footnote | Description | Footnotea | Excluding cash equivalents. |
|
|
| Material Fund Change [Text Block] |
|
|
| Updated Prospectus Web Address |
<span style="box-sizing: border-box; color: rgb(0, 0, 0); display: inline; flex-wrap: nowrap; font-size: 10.6667px; font-weight: 400; grid-area: auto; line-height: 16px; margin: 0px; overflow: visible; text-align: left;">www.morganstanley.com/im/shareholderreports</span>
|
|
| C000204517 |
|
|
| Shareholder Report [Line Items] |
|
|
| Fund Name |
Morgan Stanley Institutional Fund, Inc. - Global Endurance Portfolio
|
|
| Class Name |
Class R6
|
|
| Trading Symbol |
MSJSX
|
|
| Annual or Semi-Annual Statement [Text Block] |
This annual shareholder report contains important information about Morgan Stanley Institutional Fund, Inc. - Global Endurance Portfolio for the period of January 1, 2024 to December 31, 2024.
|
|
| Shareholder Report Annual or Semi-Annual |
Annual Shareholder Report
|
|
| Additional Information [Text Block] |
You can find additional information about the Fund at www.morganstanley.com/im/shareholderreports. You can also request this information by contacting us at 1-800-869-6397.
|
|
| Additional Information Phone Number |
1-800-869-6397
|
|
| Additional Information Website |
<span style="box-sizing: border-box; color: rgb(0, 0, 0); display: inline; flex-wrap: nowrap; font-size: 10.6667px; font-weight: 400; grid-area: auto; line-height: 16px; margin: 0px; overflow: visible; text-align: left;">www.morganstanley.com/im/shareholderreports</span>
|
|
| Expenses [Text Block] |
What were the Fund costs for the last year?(based on a hypothetical $10,000 investment) Class Name | Costs of a $10,000 investment | Costs paid as a percentage of a $10,000 investment |
|---|
Class R6 | $98 | 0.95% |
|---|
|
|
| Expenses Paid, Amount |
$ 98
|
|
| Expense Ratio, Percent |
0.95%
|
|
| Factors Affecting Performance [Text Block] |
How did the Fund perform last year and what affected its performance?Key contributors to (↑) and detractors from (↓) performance, relative to the MSCI All Country World Net Index: ↓ Stock selection and an average underweight in information technology, where a holding in a global edge network that focuses on content delivery, cybersecurity and cloud computing services was the largest detractor ↓ Stock selection and an average overweight in consumer discretionary, where the largest detractor was a holding in a contemporary carpets and floor coverings company ↓ Stock selection and average overweight in health care, driven by underperformance in a holding in an analytical testing and laboratory services provider ↑ Stock selection in utilities, led by position in a U.S. electric power producer ↑ Stock selection in financials, led by holding in a global payments platform ↑ No exposure to materials |
|
| Line Graph [Table Text Block] |
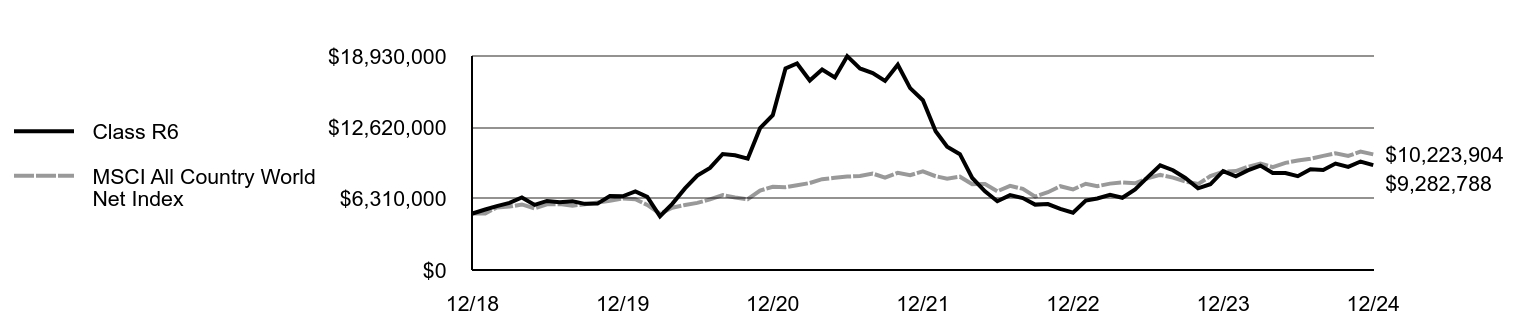 | Class R6 | MSCI All Country World Net Index |
|---|
12/18 | $5,000,000 | $5,000,000 |
|---|
1/19 | $5,350,000 | $5,000,000 |
|---|
2/19 | $5,655,000 | $5,539,093 |
|---|
3/19 | $5,940,000 | $5,608,753 |
|---|
4/19 | $6,410,000 | $5,798,136 |
|---|
5/19 | $5,755,000 | $5,454,196 |
|---|
6/19 | $6,110,000 | $5,811,335 |
|---|
7/19 | $6,000,000 | $5,828,363 |
|---|
8/19 | $6,075,000 | $5,690,101 |
|---|
9/19 | $5,850,000 | $5,809,829 |
|---|
10/19 | $5,875,000 | $5,968,837 |
|---|
11/19 | $6,545,000 | $6,114,545 |
|---|
12/19 | $6,520,000 | $6,329,870 |
|---|
1/20 | $6,945,000 | $6,259,951 |
|---|
2/20 | $6,470,000 | $5,754,336 |
|---|
3/20 | $4,755,000 | $4,977,481 |
|---|
4/20 | $5,850,000 | $5,510,694 |
|---|
5/20 | $7,215,000 | $5,750,360 |
|---|
6/20 | $8,345,000 | $5,934,099 |
|---|
7/20 | $9,035,000 | $6,247,935 |
|---|
8/20 | $10,260,000 | $6,630,341 |
|---|
9/20 | $10,150,000 | $6,416,558 |
|---|
10/20 | $9,850,000 | $6,260,580 |
|---|
11/20 | $12,545,000 | $7,032,277 |
|---|
12/20 | $13,696,971 | $7,358,782 |
|---|
1/21 | $17,837,556 | $7,325,314 |
|---|
2/21 | $18,266,071 | $7,494,994 |
|---|
3/21 | $16,758,526 | $7,695,180 |
|---|
4/21 | $17,729,137 | $8,031,633 |
|---|
5/21 | $17,026,993 | $8,156,624 |
|---|
6/21 | $18,916,586 | $8,264,107 |
|---|
7/21 | $17,827,231 | $8,321,053 |
|---|
8/21 | $17,424,530 | $8,529,323 |
|---|
9/21 | $16,727,549 | $8,176,979 |
|---|
10/21 | $18,157,651 | $8,594,361 |
|---|
11/21 | $16,092,522 | $8,387,405 |
|---|
12/21 | $15,014,602 | $8,722,905 |
|---|
1/22 | $12,279,761 | $8,294,502 |
|---|
2/22 | $10,901,531 | $8,080,278 |
|---|
3/22 | $10,247,547 | $8,255,289 |
|---|
4/22 | $8,139,665 | $7,594,521 |
|---|
5/22 | $6,961,414 | $7,603,408 |
|---|
6/22 | $6,085,832 | $6,962,469 |
|---|
7/22 | $6,626,315 | $7,448,675 |
|---|
8/22 | $6,366,883 | $7,174,453 |
|---|
9/22 | $5,783,162 | $6,487,648 |
|---|
10/22 | $5,831,805 | $6,879,158 |
|---|
11/22 | $5,404,824 | $7,412,729 |
|---|
12/22 | $5,069,725 | $7,121,031 |
|---|
1/23 | $6,134,476 | $7,631,444 |
|---|
2/23 | $6,323,644 | $7,412,727 |
|---|
3/23 | $6,642,529 | $7,641,280 |
|---|
4/23 | $6,388,502 | $7,751,105 |
|---|
5/23 | $7,123,558 | $7,668,087 |
|---|
6/23 | $8,188,309 | $8,113,303 |
|---|
7/23 | $9,263,869 | $8,410,314 |
|---|
8/23 | $8,826,078 | $8,175,297 |
|---|
9/23 | $8,139,665 | $7,837,242 |
|---|
10/23 | $7,226,250 | $7,601,601 |
|---|
11/23 | $7,582,968 | $8,303,197 |
|---|
12/23 | $8,753,387 | $8,702,032 |
|---|
1/24 | $8,285,144 | $8,753,046 |
|---|
2/24 | $8,813,983 | $9,128,668 |
|---|
3/24 | $9,232,647 | $9,415,280 |
|---|
4/24 | $8,577,107 | $9,104,642 |
|---|
5/24 | $8,571,598 | $9,474,414 |
|---|
6/24 | $8,296,161 | $9,685,430 |
|---|
7/24 | $8,918,649 | $9,841,631 |
|---|
8/24 | $8,852,544 | $10,091,574 |
|---|
9/24 | $9,414,436 | $10,326,013 |
|---|
10/24 | $9,122,472 | $10,094,227 |
|---|
11/24 | $9,596,224 | $10,471,788 |
|---|
12/24 | $9,282,788 | $10,223,904 |
|---|
|
|
| Average Annual Return [Table Text Block] |
AATR | 1 Year | 5 Years | Since 12/31/18
(Inception) |
|---|
Class R6 | 6.05% | 7.32% | 10.86% |
|---|
MSCI All Country World Net Index | 17.49% | 10.06% | 12.66% |
|---|
|
|
| Performance Inception Date |
Dec. 31, 2018
|
|
| AssetsNet |
$ 27,993,056
|
|
| Holdings Count | Holding |
32
|
|
| Advisory Fees Paid, Amount |
$ 40,326
|
|
| InvestmentCompanyPortfolioTurnover |
157.00%
|
|
| Additional Fund Statistics [Text Block] |
Total Net Assets | $27,993,056 |
|---|
# of Portfolio Holdings | 32 |
|---|
Portfolio Turnover Rate | 157% |
|---|
Total Advisory Fees Paid | $40,326 |
|---|
|
|
| Holdings [Text Block] |
Sector Allocation (% of total investments)Value | Value |
|---|
Financials | 1.6% | Short-Term Investments | 2.6% | Industrials | 7.1% | Utilities | 8.3% | Health Care | 24.1% | Information Technology | 25.0% | Consumer Discretionary | 31.3% |
Top Ten Holdings (% of total investments)Footnote ReferenceaAppian Corp. | 11.7% | Victoria PLC | 10.6% | Talen Energy Corp. | 4.7% | Lithia Motors, Inc. | 4.5% | Babcock International Group PLC | 4.4% | Tesla, Inc. | 3.9% | Delivery Hero SE | 3.9% | Avadel Pharmaceuticals PLC | 3.7% | Vistra Corp. | 3.6% | Global-e Online Ltd. | 3.1% | Total | 54.1% |
| Footnote | Description | Footnotea | Excluding cash equivalents. |
|
|
| Material Fund Change [Text Block] |
|
|
| Updated Prospectus Web Address |
<span style="box-sizing: border-box; color: rgb(0, 0, 0); display: inline; flex-wrap: nowrap; font-size: 10.6667px; font-weight: 400; grid-area: auto; line-height: 16px; margin: 0px; overflow: visible; text-align: left;">www.morganstanley.com/im/shareholderreports</span>
|
|
| C000007755 |
|
|
| Shareholder Report [Line Items] |
|
|
| Fund Name |
Morgan Stanley Institutional Fund, Inc. - Global Franchise Portfolio
|
|
| Class Name |
Class A
|
|
| Trading Symbol |
MSFBX
|
|
| Annual or Semi-Annual Statement [Text Block] |
This annual shareholder report contains important information about Morgan Stanley Institutional Fund, Inc. - Global Franchise Portfolio for the period of January 1, 2024 to December 31, 2024.
|
|
| Shareholder Report Annual or Semi-Annual |
Annual Shareholder Report
|
|
| Additional Information [Text Block] |
You can find additional information about the Fund at www.morganstanley.com/im/shareholderreports. You can also request this information by contacting us at 1-800-869-6397.
|
|
| Additional Information Phone Number |
1-800-869-6397
|
|
| Additional Information Website |
<span style="box-sizing: border-box; color: rgb(0, 0, 0); display: inline; flex-wrap: nowrap; font-size: 10.6667px; font-weight: 400; grid-area: auto; line-height: 16px; margin: 0px; overflow: visible; text-align: left;">www.morganstanley.com/im/shareholderreports</span>
|
|
| Expenses [Text Block] |
What were the Fund costs for the last year?(based on a hypothetical $10,000 investment) Class Name | Costs of a $10,000 investment | Costs paid as a percentage of a $10,000 investment |
|---|
Class A | $121 | 1.16% |
|---|
|
|
| Expenses Paid, Amount |
$ 121
|
|
| Expense Ratio, Percent |
1.16%
|
|
| Factors Affecting Performance [Text Block] |
How did the Fund perform last year and what affected its performance?Key contributors to (↑) and detractors from (↓) performance, relative to the MSCI World Net Index: ↓ Stock selection in information technology (IT) and consumer staples was the primary detractor ↓ The portfolio’s tilt toward software and IT services significantly lagged semiconductors and hardware. The relative performance impact of the “Magnificent Seven” was notable: the portfolio owned Microsoft and Alphabet, but the Fund’s high quality bar and strict valuation discipline precluded it from owning the other five, which detracted significantly. ↓ Consumer staples weakness was primarily down to stock-specific issues: Pernod Ricard and L’Oréal faced weakening U.S. and China demand and tariff threats, Constellation Brands suffered due to Mexican tariff fears, and we exited Reckitt Benckiser following a partial recovery in its share price ↑ Financials sector overweight ↑ Not owning the low quality, cyclical sectors, specifically materials, energy and real estate |
|
| Line Graph [Table Text Block] |
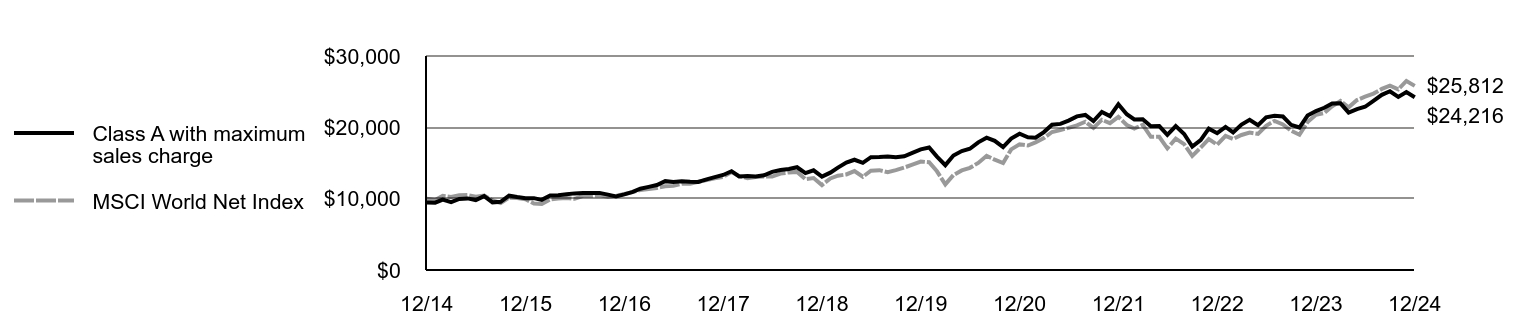 | Class A with maximum sales charge | MSCI World Net Index |
|---|
12/14 | $9,477 | $10,000 |
|---|
1/15 | $9,434 | $9,819 |
|---|
2/15 | $9,876 | $10,394 |
|---|
3/15 | $9,520 | $10,231 |
|---|
4/15 | $9,962 | $10,471 |
|---|
5/15 | $10,038 | $10,507 |
|---|
6/15 | $9,805 | $10,263 |
|---|
7/15 | $10,364 | $10,447 |
|---|
8/15 | $9,486 | $9,756 |
|---|
9/15 | $9,558 | $9,396 |
|---|
10/15 | $10,427 | $10,141 |
|---|
11/15 | $10,235 | $10,090 |
|---|
12/15 | $10,069 | $9,913 |
|---|
1/16 | $10,074 | $9,320 |
|---|
2/16 | $9,832 | $9,250 |
|---|
3/16 | $10,438 | $9,878 |
|---|
4/16 | $10,468 | $10,035 |
|---|
5/16 | $10,604 | $10,091 |
|---|
6/16 | $10,740 | $9,978 |
|---|
7/16 | $10,802 | $10,399 |
|---|
8/16 | $10,792 | $10,408 |
|---|
9/16 | $10,807 | $10,463 |
|---|
10/16 | $10,564 | $10,261 |
|---|
11/16 | $10,316 | $10,408 |
|---|
12/16 | $10,609 | $10,657 |
|---|
1/17 | $10,940 | $10,915 |
|---|
2/17 | $11,393 | $11,217 |
|---|
3/17 | $11,651 | $11,337 |
|---|
4/17 | $11,909 | $11,505 |
|---|
5/17 | $12,456 | $11,748 |
|---|
6/17 | $12,340 | $11,793 |
|---|
7/17 | $12,446 | $12,076 |
|---|
8/17 | $12,378 | $12,093 |
|---|
9/17 | $12,351 | $12,364 |
|---|
10/17 | $12,704 | $12,598 |
|---|
11/17 | $13,026 | $12,871 |
|---|
12/17 | $13,323 | $13,045 |
|---|
1/18 | $13,851 | $13,733 |
|---|
2/18 | $13,119 | $13,164 |
|---|
3/18 | $13,191 | $12,878 |
|---|
4/18 | $13,125 | $13,026 |
|---|
5/18 | $13,273 | $13,107 |
|---|
6/18 | $13,752 | $13,101 |
|---|
7/18 | $14,021 | $13,510 |
|---|
8/18 | $14,149 | $13,677 |
|---|
9/18 | $14,404 | $13,753 |
|---|
10/18 | $13,583 | $12,744 |
|---|
11/18 | $13,977 | $12,888 |
|---|
12/18 | $13,086 | $11,908 |
|---|
1/19 | $13,644 | $12,835 |
|---|
2/19 | $14,347 | $13,221 |
|---|
3/19 | $15,055 | $13,394 |
|---|
4/19 | $15,456 | $13,869 |
|---|
5/19 | $15,026 | $13,069 |
|---|
6/19 | $15,816 | $13,930 |
|---|
7/19 | $15,845 | $13,999 |
|---|
8/19 | $15,915 | $13,713 |
|---|
9/19 | $15,816 | $14,005 |
|---|
10/19 | $15,938 | $14,361 |
|---|
11/19 | $16,420 | $14,761 |
|---|
12/19 | $16,912 | $15,203 |
|---|
1/20 | $17,179 | $15,111 |
|---|
2/20 | $15,899 | $13,834 |
|---|
3/20 | $14,697 | $12,003 |
|---|
4/20 | $16,044 | $13,314 |
|---|
5/20 | $16,676 | $13,957 |
|---|
6/20 | $16,991 | $14,326 |
|---|
7/20 | $17,896 | $15,012 |
|---|
8/20 | $18,551 | $16,015 |
|---|
9/20 | $18,102 | $15,462 |
|---|
10/20 | $17,222 | $14,988 |
|---|
11/20 | $18,424 | $16,904 |
|---|
12/20 | $19,102 | $17,621 |
|---|
1/21 | $18,606 | $17,446 |
|---|
2/21 | $18,537 | $17,893 |
|---|
3/21 | $19,334 | $18,488 |
|---|
4/21 | $20,357 | $19,349 |
|---|
5/21 | $20,483 | $19,627 |
|---|
6/21 | $20,947 | $19,920 |
|---|
7/21 | $21,537 | $20,277 |
|---|
8/21 | $21,738 | $20,781 |
|---|
9/21 | $20,884 | $19,919 |
|---|
10/21 | $22,158 | $21,047 |
|---|
11/21 | $21,568 | $20,586 |
|---|
12/21 | $23,231 | $21,465 |
|---|
1/22 | $21,833 | $20,330 |
|---|
2/22 | $21,104 | $19,816 |
|---|
3/22 | $21,124 | $20,359 |
|---|
4/22 | $20,151 | $18,668 |
|---|
5/22 | $20,183 | $18,682 |
|---|
6/22 | $18,939 | $17,064 |
|---|
7/22 | $20,183 | $18,419 |
|---|
8/22 | $19,075 | $17,649 |
|---|
9/22 | $17,302 | $16,008 |
|---|
10/22 | $18,205 | $17,158 |
|---|
11/22 | $19,809 | $18,351 |
|---|
12/22 | $19,177 | $17,571 |
|---|
1/23 | $20,054 | $18,815 |
|---|
2/23 | $19,295 | $18,362 |
|---|
3/23 | $20,381 | $18,930 |
|---|
4/23 | $21,048 | $19,261 |
|---|
5/23 | $20,302 | $19,069 |
|---|
6/23 | $21,414 | $20,222 |
|---|
7/23 | $21,630 | $20,902 |
|---|
8/23 | $21,519 | $20,403 |
|---|
9/23 | $20,355 | $19,522 |
|---|
10/23 | $19,975 | $18,956 |
|---|
11/23 | $21,650 | $20,733 |
|---|
12/23 | $22,277 | $21,751 |
|---|
1/24 | $22,743 | $22,012 |
|---|
2/24 | $23,355 | $22,945 |
|---|
3/24 | $23,362 | $23,683 |
|---|
4/24 | $22,064 | $22,803 |
|---|
5/24 | $22,550 | $23,821 |
|---|
6/24 | $22,883 | $24,306 |
|---|
7/24 | $23,702 | $24,734 |
|---|
8/24 | $24,554 | $25,388 |
|---|
9/24 | $25,053 | $25,853 |
|---|
10/24 | $24,267 | $25,340 |
|---|
11/24 | $24,947 | $26,503 |
|---|
12/24 | $24,216 | $25,812 |
|---|
|
|
| Average Annual Return [Table Text Block] |
AATR | 1 Year | 5 Years | 10 Years |
|---|
Class A | 8.71% | 7.44% | 9.84% |
|---|
Class A, with 5.25% maximum front end sales charge | 3.01% | 6.29% | 9.25% |
|---|
MSCI World Net Index | 18.67% | 11.17% | 9.95% |
|---|
|
|
| AssetsNet |
$ 2,763,486,138
|
|
| Holdings Count | Holding |
39
|
|
| Advisory Fees Paid, Amount |
$ 20,891,138
|
|
| InvestmentCompanyPortfolioTurnover |
35.00%
|
|
| Additional Fund Statistics [Text Block] |
Total Net Assets | $2,763,486,138 |
|---|
# of Portfolio Holdings | 39 |
|---|
Portfolio Turnover Rate | 35% |
|---|
Total Advisory Fees Paid | $20,891,138 |
|---|
|
|
| Holdings [Text Block] |
Sector Allocation (% of total investments)Value | Value |
|---|
Short-Term Investments | 1.1% | Communication Services | 2.9% | Consumer Discretionary | 5.9% | Industrials | 11.8% | Health Care | 15.4% | Consumer Staples | 18.0% | Financals | 21.8% | Information Technology | 23.1% |
Top Ten Holdings (% of total investments)Footnote ReferenceaMicrosoft Corp. | 7.8% | SAP SE | 7.3% | Visa, Inc. | 6.6% | L'Oreal SA | 4.2% | Accenture PLC | 4.1% | Aon PLC | 4.1% | Procter & Gamble Co. | 3.3% | RELX PLC | 3.2% | Abbott Laboratories | 3.2% | Becton Dickinson & Co. | 3.1% | Total | 46.9% |
| Footnote | Description | Footnotea | Excluding cash equivalents. |
|
|
| Material Fund Change [Text Block] |
|
|
| Updated Prospectus Web Address |
<span style="box-sizing: border-box; color: rgb(0, 0, 0); display: inline; flex-wrap: nowrap; font-size: 10.6667px; font-weight: 400; grid-area: auto; line-height: 16px; margin: 0px; overflow: visible; text-align: left;">www.morganstanley.com/im/shareholderreports</span>
|
|
| C000155893 |
|
|
| Shareholder Report [Line Items] |
|
|
| Fund Name |
Morgan Stanley Institutional Fund, Inc. - Global Franchise Portfolio
|
|
| Class Name |
Class C
|
|
| Trading Symbol |
MSGFX
|
|
| Annual or Semi-Annual Statement [Text Block] |
This annual shareholder report contains important information about Morgan Stanley Institutional Fund, Inc. - Global Franchise Portfolio for the period of January 1, 2024 to December 31, 2024.
|
|
| Shareholder Report Annual or Semi-Annual |
Annual Shareholder Report
|
|
| Additional Information [Text Block] |
You can find additional information about the Fund at www.morganstanley.com/im/shareholderreports. You can also request this information by contacting us at 1-800-869-6397.
|
|
| Additional Information Phone Number |
1-800-869-6397
|
|
| Additional Information Website |
<span style="box-sizing: border-box; color: rgb(0, 0, 0); display: inline; flex-wrap: nowrap; font-size: 10.6667px; font-weight: 400; grid-area: auto; line-height: 16px; margin: 0px; overflow: visible; text-align: left;">www.morganstanley.com/im/shareholderreports</span>
|
|
| Expenses [Text Block] |
What were the Fund costs for the last year?(based on a hypothetical $10,000 investment) Class Name | Costs of a $10,000 investment | Costs paid as a percentage of a $10,000 investment |
|---|
Class C | $198 | 1.90% |
|---|
|
|
| Expenses Paid, Amount |
$ 198
|
|
| Expense Ratio, Percent |
1.90%
|
|
| Factors Affecting Performance [Text Block] |
How did the Fund perform last year and what affected its performance?Key contributors to (↑) and detractors from (↓) performance, relative to the MSCI World Net Index: ↓ Stock selection in information technology (IT) and consumer staples was the primary detractor ↓ The portfolio’s tilt toward software and IT services significantly lagged semiconductors and hardware. The relative performance impact of the “Magnificent Seven” was notable: the portfolio owned Microsoft and Alphabet, but the Fund’s high quality bar and strict valuation discipline precluded it from owning the other five, which detracted significantly. ↓ Consumer staples weakness was primarily down to stock-specific issues: Pernod Ricard and L’Oréal faced weakening U.S. and China demand and tariff threats, Constellation Brands suffered due to Mexican tariff fears, and we exited Reckitt Benckiser following a partial recovery in its share price ↑ Financials sector overweight ↑ Not owning the low quality, cyclical sectors, specifically materials, energy and real estate |
|
| Line Graph [Table Text Block] |
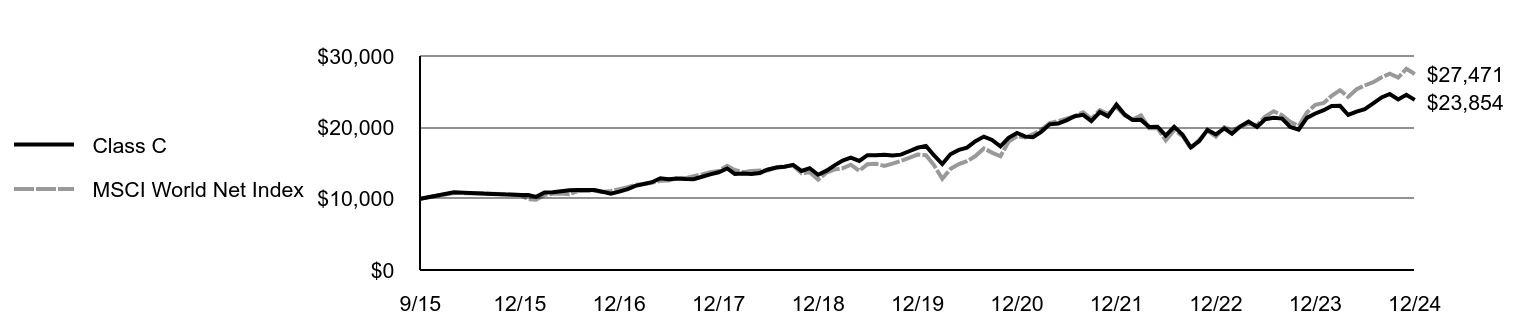 | Class C | MSCI World Net Index |
|---|
9/15 | $10,000 | $10,000 |
|---|
10/15 | $10,904 | $10,792 |
|---|
11/15 | $10,697 | $10,739 |
|---|
12/15 | $10,511 | $10,550 |
|---|
1/16 | $10,511 | $9,919 |
|---|
2/16 | $10,251 | $9,845 |
|---|
3/16 | $10,879 | $10,513 |
|---|
4/16 | $10,905 | $10,679 |
|---|
5/16 | $11,044 | $10,739 |
|---|
6/16 | $11,177 | $10,619 |
|---|
7/16 | $11,231 | $11,068 |
|---|
8/16 | $11,215 | $11,077 |
|---|
9/16 | $11,221 | $11,136 |
|---|
10/16 | $10,964 | $10,920 |
|---|
11/16 | $10,702 | $11,077 |
|---|
12/16 | $10,993 | $11,342 |
|---|
1/17 | $11,330 | $11,616 |
|---|
2/17 | $11,795 | $11,938 |
|---|
3/17 | $12,054 | $12,066 |
|---|
4/17 | $12,309 | $12,244 |
|---|
5/17 | $12,867 | $12,503 |
|---|
6/17 | $12,740 | $12,551 |
|---|
7/17 | $12,840 | $12,852 |
|---|
8/17 | $12,757 | $12,870 |
|---|
9/17 | $12,730 | $13,159 |
|---|
10/17 | $13,078 | $13,407 |
|---|
11/17 | $13,400 | $13,698 |
|---|
12/17 | $13,700 | $13,883 |
|---|
1/18 | $14,235 | $14,616 |
|---|
2/18 | $13,475 | $14,011 |
|---|
3/18 | $13,539 | $13,705 |
|---|
4/18 | $13,464 | $13,863 |
|---|
5/18 | $13,608 | $13,950 |
|---|
6/18 | $14,091 | $13,943 |
|---|
7/18 | $14,355 | $14,378 |
|---|
8/18 | $14,477 | $14,556 |
|---|
9/18 | $14,732 | $14,637 |
|---|
10/18 | $13,885 | $13,563 |
|---|
11/18 | $14,274 | $13,717 |
|---|
12/18 | $13,356 | $12,674 |
|---|
1/19 | $13,924 | $13,660 |
|---|
2/19 | $14,630 | $14,070 |
|---|
3/19 | $15,342 | $14,255 |
|---|
4/19 | $15,740 | $14,761 |
|---|
5/19 | $15,294 | $13,909 |
|---|
6/19 | $16,091 | $14,826 |
|---|
7/19 | $16,103 | $14,899 |
|---|
8/19 | $16,169 | $14,594 |
|---|
9/19 | $16,054 | $14,905 |
|---|
10/19 | $16,169 | $15,284 |
|---|
11/19 | $16,646 | $15,710 |
|---|
12/19 | $17,133 | $16,180 |
|---|
1/20 | $17,396 | $16,082 |
|---|
2/20 | $16,091 | $14,723 |
|---|
3/20 | $14,855 | $12,774 |
|---|
4/20 | $16,216 | $14,170 |
|---|
5/20 | $16,838 | $14,854 |
|---|
6/20 | $17,152 | $15,247 |
|---|
7/20 | $18,049 | $15,977 |
|---|
8/20 | $18,702 | $17,044 |
|---|
9/20 | $18,237 | $16,456 |
|---|
10/20 | $17,340 | $15,951 |
|---|
11/20 | $18,532 | $17,991 |
|---|
12/20 | $19,204 | $18,754 |
|---|
1/21 | $18,694 | $18,567 |
|---|
2/21 | $18,617 | $19,043 |
|---|
3/21 | $19,404 | $19,677 |
|---|
4/21 | $20,416 | $20,592 |
|---|
5/21 | $20,533 | $20,889 |
|---|
6/21 | $20,984 | $21,200 |
|---|
7/21 | $21,565 | $21,580 |
|---|
8/21 | $21,745 | $22,117 |
|---|
9/21 | $20,881 | $21,199 |
|---|
10/21 | $22,145 | $22,399 |
|---|
11/21 | $21,539 | $21,909 |
|---|
12/21 | $23,187 | $22,845 |
|---|
1/22 | $21,776 | $21,636 |
|---|
2/22 | $21,038 | $21,089 |
|---|
3/22 | $21,045 | $21,668 |
|---|
4/22 | $20,063 | $19,868 |
|---|
5/22 | $20,089 | $19,883 |
|---|
6/22 | $18,830 | $18,161 |
|---|
7/22 | $20,063 | $19,602 |
|---|
8/22 | $18,942 | $18,783 |
|---|
9/22 | $17,176 | $17,037 |
|---|
10/22 | $18,059 | $18,260 |
|---|
11/22 | $19,634 | $19,530 |
|---|
12/22 | $18,999 | $18,701 |
|---|
1/23 | $19,850 | $20,024 |
|---|
2/23 | $19,092 | $19,542 |
|---|
3/23 | $20,150 | $20,146 |
|---|
4/23 | $20,808 | $20,499 |
|---|
5/23 | $20,050 | $20,295 |
|---|
6/23 | $21,140 | $21,522 |
|---|
7/23 | $21,340 | $22,245 |
|---|
8/23 | $21,220 | $21,714 |
|---|
9/23 | $20,050 | $20,777 |
|---|
10/23 | $19,676 | $20,174 |
|---|
11/23 | $21,325 | $22,066 |
|---|
12/23 | $21,943 | $23,149 |
|---|
1/24 | $22,402 | $23,427 |
|---|
2/24 | $23,005 | $24,420 |
|---|
3/24 | $23,012 | $25,205 |
|---|
4/24 | $21,733 | $24,268 |
|---|
5/24 | $22,212 | $25,352 |
|---|
6/24 | $22,540 | $25,868 |
|---|
7/24 | $23,347 | $26,324 |
|---|
8/24 | $24,186 | $27,020 |
|---|
9/24 | $24,678 | $27,514 |
|---|
10/24 | $23,904 | $26,969 |
|---|
11/24 | $24,573 | $28,206 |
|---|
12/24 | $23,854 | $27,471 |
|---|
|
|
| Average Annual Return [Table Text Block] |
AATR | 1 Year | 5 Years | Since 9/30/15
(Inception) |
|---|
Class C, with conversion to Class A after 8 years | 7.90% | 6.65% | 9.85% |
|---|
Class C, with 1% maximum contingent deferred sales charge and conversion to Class A after 8 years | 6.94% | 6.65% | 9.85% |
|---|
MSCI World Net Index | 18.67% | 11.17% | 11.54% |
|---|
|
|
| Performance Inception Date |
Sep. 30, 2015
|
|
| AssetsNet |
$ 2,763,486,138
|
|
| Holdings Count | Holding |
39
|
|
| Advisory Fees Paid, Amount |
$ 20,891,138
|
|
| InvestmentCompanyPortfolioTurnover |
35.00%
|
|
| Additional Fund Statistics [Text Block] |
Total Net Assets | $2,763,486,138 |
|---|
# of Portfolio Holdings | 39 |
|---|
Portfolio Turnover Rate | 35% |
|---|
Total Advisory Fees Paid | $20,891,138 |
|---|
|
|
| Holdings [Text Block] |
Sector Allocation (% of total investments)Value | Value |
|---|
Short-Term Investments | 1.1% | Communication Services | 2.9% | Consumer Discretionary | 5.9% | Industrials | 11.8% | Health Care | 15.4% | Consumer Staples | 18.0% | Financals | 21.8% | Information Technology | 23.1% |
Top Ten Holdings (% of total investments)Footnote ReferenceaMicrosoft Corp. | 7.8% | SAP SE | 7.3% | Visa, Inc. | 6.6% | L'Oreal SA | 4.2% | Accenture PLC | 4.1% | Aon PLC | 4.1% | Procter & Gamble Co. | 3.3% | RELX PLC | 3.2% | Abbott Laboratories | 3.2% | Becton Dickinson & Co. | 3.1% | Total | 46.9% |
| Footnote | Description | Footnotea | Excluding cash equivalents. |
|
|
| Material Fund Change [Text Block] |
|
|
| Updated Prospectus Web Address |
<span style="box-sizing: border-box; color: rgb(0, 0, 0); display: inline; flex-wrap: nowrap; font-size: 10.6667px; font-weight: 400; grid-area: auto; line-height: 16px; margin: 0px; overflow: visible; text-align: left;">www.morganstanley.com/im/shareholderreports</span>
|
|
| C000007754 |
|
|
| Shareholder Report [Line Items] |
|
|
| Fund Name |
Morgan Stanley Institutional Fund, Inc. - Global Franchise Portfolio
|
|
| Class Name |
Class I
|
|
| Trading Symbol |
MSFAX
|
|
| Annual or Semi-Annual Statement [Text Block] |
This annual shareholder report contains important information about Morgan Stanley Institutional Fund, Inc. - Global Franchise Portfolio for the period of January 1, 2024 to December 31, 2024.
|
|
| Shareholder Report Annual or Semi-Annual |
Annual Shareholder Report
|
|
| Additional Information [Text Block] |
You can find additional information about the Fund at www.morganstanley.com/im/shareholderreports. You can also request this information by contacting us at 1-800-869-6397.
|
|
| Additional Information Phone Number |
1-800-869-6397
|
|
| Additional Information Website |
<span style="box-sizing: border-box; color: rgb(0, 0, 0); display: inline; flex-wrap: nowrap; font-size: 10.6667px; font-weight: 400; grid-area: auto; line-height: 16px; margin: 0px; overflow: visible; text-align: left;">www.morganstanley.com/im/shareholderreports</span>
|
|
| Expenses [Text Block] |
What were the Fund costs for the last year?(based on a hypothetical $10,000 investment) Class Name | Costs of a $10,000 investment | Costs paid as a percentage of a $10,000 investment |
|---|
Class I | $97 | 0.93% |
|---|
|
|
| Expenses Paid, Amount |
$ 97
|
|
| Expense Ratio, Percent |
0.93%
|
|
| Factors Affecting Performance [Text Block] |
How did the Fund perform last year and what affected its performance?Key contributors to (↑) and detractors from (↓) performance, relative to the MSCI World Net Index: ↓ Stock selection in information technology (IT) and consumer staples was the primary detractor ↓ The portfolio’s tilt toward software and IT services significantly lagged semiconductors and hardware. The relative performance impact of the “Magnificent Seven” was notable: the portfolio owned Microsoft and Alphabet, but the Fund’s high quality bar and strict valuation discipline precluded it from owning the other five, which detracted significantly. ↓ Consumer staples weakness was primarily down to stock-specific issues: Pernod Ricard and L’Oréal faced weakening U.S. and China demand and tariff threats, Constellation Brands suffered due to Mexican tariff fears, and we exited Reckitt Benckiser following a partial recovery in its share price ↑ Financials sector overweight ↑ Not owning the low quality, cyclical sectors, specifically materials, energy and real estate |
|
| Line Graph [Table Text Block] |
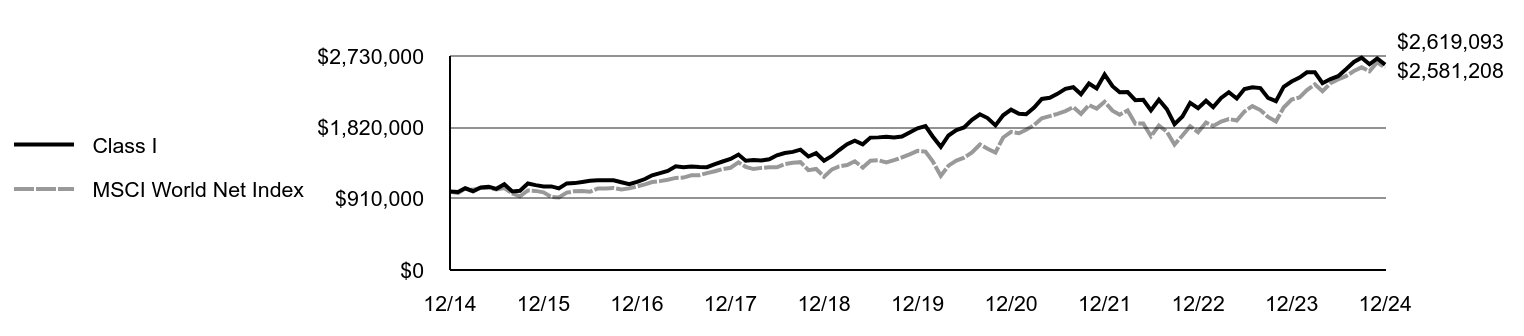 | Class I | MSCI World Net Index |
|---|
12/14 | $1,000,000 | $1,000,000 |
|---|
1/15 | $995,560 | $981,880 |
|---|
2/15 | $1,042,427 | $1,039,407 |
|---|
3/15 | $1,004,933 | $1,023,137 |
|---|
4/15 | $1,052,294 | $1,047,132 |
|---|
5/15 | $1,060,187 | $1,050,739 |
|---|
6/15 | $1,035,520 | $1,026,307 |
|---|
7/15 | $1,095,012 | $1,044,729 |
|---|
8/15 | $1,002,973 | $975,595 |
|---|
9/15 | $1,010,436 | $939,611 |
|---|
10/15 | $1,102,972 | $1,014,069 |
|---|
11/15 | $1,082,574 | $1,009,024 |
|---|
12/15 | $1,064,961 | $991,288 |
|---|
1/16 | $1,066,008 | $931,985 |
|---|
2/16 | $1,040,340 | $925,048 |
|---|
3/16 | $1,104,772 | $987,821 |
|---|
4/16 | $1,108,439 | $1,003,452 |
|---|
5/16 | $1,123,106 | $1,009,088 |
|---|
6/16 | $1,137,774 | $997,781 |
|---|
7/16 | $1,144,196 | $1,039,935 |
|---|
8/16 | $1,143,670 | $1,040,800 |
|---|
9/16 | $1,145,248 | $1,046,328 |
|---|
10/16 | $1,119,997 | $1,026,079 |
|---|
11/16 | $1,093,694 | $1,040,833 |
|---|
12/16 | $1,125,051 | $1,065,738 |
|---|
1/17 | $1,160,619 | $1,091,460 |
|---|
2/17 | $1,208,773 | $1,121,741 |
|---|
3/17 | $1,236,681 | $1,133,690 |
|---|
4/17 | $1,264,041 | $1,150,476 |
|---|
5/17 | $1,322,592 | $1,174,814 |
|---|
6/17 | $1,310,006 | $1,179,334 |
|---|
7/17 | $1,321,557 | $1,207,558 |
|---|
8/17 | $1,314,434 | $1,209,259 |
|---|
9/17 | $1,312,243 | $1,236,399 |
|---|
10/17 | $1,350,048 | $1,259,766 |
|---|
11/17 | $1,384,019 | $1,287,062 |
|---|
12/17 | $1,415,871 | $1,304,467 |
|---|
1/18 | $1,472,575 | $1,373,343 |
|---|
2/18 | $1,394,679 | $1,316,449 |
|---|
3/18 | $1,403,270 | $1,287,755 |
|---|
4/18 | $1,396,397 | $1,302,553 |
|---|
5/18 | $1,412,435 | $1,310,715 |
|---|
6/18 | $1,463,983 | $1,310,090 |
|---|
7/18 | $1,493,143 | $1,351,009 |
|---|
8/18 | $1,506,995 | $1,367,725 |
|---|
9/18 | $1,534,699 | $1,375,340 |
|---|
10/18 | $1,447,546 | $1,274,352 |
|---|
11/18 | $1,489,680 | $1,288,829 |
|---|
12/18 | $1,394,582 | $1,190,829 |
|---|
1/19 | $1,455,137 | $1,283,482 |
|---|
2/19 | $1,530,225 | $1,322,076 |
|---|
3/19 | $1,605,919 | $1,339,441 |
|---|
4/19 | $1,649,518 | $1,386,936 |
|---|
5/19 | $1,603,497 | $1,306,909 |
|---|
6/19 | $1,688,879 | $1,393,028 |
|---|
7/19 | $1,691,907 | $1,399,928 |
|---|
8/19 | $1,699,779 | $1,371,293 |
|---|
9/19 | $1,689,485 | $1,400,475 |
|---|
10/19 | $1,702,807 | $1,436,114 |
|---|
11/19 | $1,754,884 | $1,476,110 |
|---|
12/19 | $1,807,335 | $1,520,332 |
|---|
1/20 | $1,837,109 | $1,511,078 |
|---|
2/20 | $1,700,276 | $1,383,354 |
|---|
3/20 | $1,571,045 | $1,200,277 |
|---|
4/20 | $1,716,113 | $1,331,400 |
|---|
5/20 | $1,783,896 | $1,395,718 |
|---|
6/20 | $1,818,737 | $1,432,636 |
|---|
7/20 | $1,915,027 | $1,501,175 |
|---|
8/20 | $1,986,611 | $1,601,475 |
|---|
9/20 | $1,938,466 | $1,546,226 |
|---|
10/20 | $1,844,710 | $1,498,795 |
|---|
11/20 | $1,973,308 | $1,690,433 |
|---|
12/20 | $2,046,198 | $1,762,102 |
|---|
1/21 | $1,993,732 | $1,744,589 |
|---|
2/21 | $1,987,173 | $1,789,293 |
|---|
3/21 | $2,072,431 | $1,848,827 |
|---|
4/21 | $2,182,611 | $1,934,872 |
|---|
5/21 | $2,197,040 | $1,962,744 |
|---|
6/21 | $2,246,883 | $1,991,999 |
|---|
7/21 | $2,311,155 | $2,027,681 |
|---|
8/21 | $2,332,141 | $2,078,147 |
|---|
9/21 | $2,241,636 | $1,991,861 |
|---|
10/21 | $2,378,705 | $2,104,681 |
|---|
11/21 | $2,316,401 | $2,058,561 |
|---|
12/21 | $2,494,746 | $2,146,544 |
|---|
1/22 | $2,345,021 | $2,032,969 |
|---|
2/22 | $2,267,461 | $1,981,552 |
|---|
3/22 | $2,269,484 | $2,035,933 |
|---|
4/22 | $2,166,295 | $1,866,801 |
|---|
5/22 | $2,170,341 | $1,868,215 |
|---|
6/22 | $2,036,128 | $1,706,386 |
|---|
7/22 | $2,171,016 | $1,841,867 |
|---|
8/22 | $2,051,640 | $1,764,863 |
|---|
9/22 | $1,861,449 | $1,600,801 |
|---|
10/22 | $1,959,242 | $1,715,760 |
|---|
11/22 | $2,131,899 | $1,835,057 |
|---|
12/22 | $2,064,614 | $1,757,127 |
|---|
1/23 | $2,159,270 | $1,881,455 |
|---|
2/23 | $2,077,646 | $1,836,227 |
|---|
3/23 | $2,194,938 | $1,892,966 |
|---|
4/23 | $2,267,645 | $1,926,149 |
|---|
5/23 | $2,188,079 | $1,906,919 |
|---|
6/23 | $2,308,115 | $2,022,246 |
|---|
7/23 | $2,332,122 | $2,090,179 |
|---|
8/23 | $2,320,461 | $2,040,253 |
|---|
9/23 | $2,194,938 | $1,952,240 |
|---|
10/23 | $2,154,469 | $1,895,594 |
|---|
11/23 | $2,335,551 | $2,073,310 |
|---|
12/23 | $2,403,600 | $2,175,097 |
|---|
1/24 | $2,454,666 | $2,201,200 |
|---|
2/24 | $2,521,821 | $2,294,525 |
|---|
3/24 | $2,522,520 | $2,368,260 |
|---|
4/24 | $2,383,313 | $2,280,291 |
|---|
5/24 | $2,435,778 | $2,382,111 |
|---|
6/24 | $2,472,154 | $2,430,582 |
|---|
7/24 | $2,560,995 | $2,473,414 |
|---|
8/24 | $2,654,033 | $2,538,788 |
|---|
9/24 | $2,708,596 | $2,585,283 |
|---|
10/24 | $2,623,953 | $2,533,999 |
|---|
11/24 | $2,698,103 | $2,650,276 |
|---|
12/24 | $2,619,093 | $2,581,208 |
|---|
|
|
| Average Annual Return [Table Text Block] |
AATR | 1 Year | 5 Years | 10 Years |
|---|
Class I | 8.97% | 7.70% | 10.11% |
|---|
MSCI World Net Index | 18.67% | 11.17% | 9.95% |
|---|
|
|
| AssetsNet |
$ 2,763,486,138
|
|
| Holdings Count | Holding |
39
|
|
| Advisory Fees Paid, Amount |
$ 20,891,138
|
|
| InvestmentCompanyPortfolioTurnover |
35.00%
|
|
| Additional Fund Statistics [Text Block] |
Total Net Assets | $2,763,486,138 |
|---|
# of Portfolio Holdings | 39 |
|---|
Portfolio Turnover Rate | 35% |
|---|
Total Advisory Fees Paid | $20,891,138 |
|---|
|
|
| Holdings [Text Block] |
Sector Allocation (% of total investments)Value | Value |
|---|
Short-Term Investments | 1.1% | Communication Services | 2.9% | Consumer Discretionary | 5.9% | Industrials | 11.8% | Health Care | 15.4% | Consumer Staples | 18.0% | Financals | 21.8% | Information Technology | 23.1% |
Top Ten Holdings (% of total investments)Microsoft Corp. | 7.8% | SAP SE | 7.3% | Visa, Inc. | 6.6% | L'Oreal SA | 4.2% | Accenture PLC | 4.1% | Aon PLC | 4.1% | Procter & Gamble Co. | 3.3% | RELX PLC | 3.2% | Abbott Laboratories | 3.2% | Becton Dickinson & Co. | 3.1% | Total | 46.9% |
|
|
| Material Fund Change [Text Block] |
|
|
| Updated Prospectus Web Address |
<span style="box-sizing: border-box; color: rgb(0, 0, 0); display: inline; flex-wrap: nowrap; font-size: 10.6667px; font-weight: 400; grid-area: auto; line-height: 16px; margin: 0px; overflow: visible; text-align: left;">www.morganstanley.com/im/shareholderreports</span>
|
|
| C000113809 |
|
|
| Shareholder Report [Line Items] |
|
|
| Fund Name |
Morgan Stanley Institutional Fund, Inc. - Global Franchise Portfolio
|
|
| Class Name |
Class L
|
|
| Trading Symbol |
MSFLX
|
|
| Annual or Semi-Annual Statement [Text Block] |
This annual shareholder report contains important information about Morgan Stanley Institutional Fund, Inc. - Global Franchise Portfolio for the period of January 1, 2024 to December 31, 2024.
|
|
| Shareholder Report Annual or Semi-Annual |
Annual Shareholder Report
|
|
| Additional Information [Text Block] |
You can find additional information about the Fund at www.morganstanley.com/im/shareholderreports. You can also request this information by contacting us at 1-800-869-6397.
|
|
| Additional Information Phone Number |
1-800-869-6397
|
|
| Additional Information Website |
<span style="box-sizing: border-box; color: rgb(0, 0, 0); display: inline; flex-wrap: nowrap; font-size: 10.6667px; font-weight: 400; grid-area: auto; line-height: 16px; margin: 0px; overflow: visible; text-align: left;">www.morganstanley.com/im/shareholderreports</span>
|
|
| Expenses [Text Block] |
What were the Fund costs for the last year?(based on a hypothetical $10,000 investment) Class Name | Costs of a $10,000 investment | Costs paid as a percentage of a $10,000 investment |
|---|
Class L | $174 | 1.67% |
|---|
|
|
| Expenses Paid, Amount |
$ 174
|
|
| Expense Ratio, Percent |
1.67%
|
|
| Factors Affecting Performance [Text Block] |
How did the Fund perform last year and what affected its performance?Key contributors to (↑) and detractors from (↓) performance, relative to the MSCI World Net Index: ↓ Stock selection in information technology (IT) and consumer staples was the primary detractor ↓ The portfolio’s tilt toward software and IT services significantly lagged semiconductors and hardware. The relative performance impact of the “Magnificent Seven” was notable: the portfolio owned Microsoft and Alphabet, but the Fund’s high quality bar and strict valuation discipline precluded it from owning the other five, which detracted significantly. ↓ Consumer staples weakness was primarily down to stock-specific issues: Pernod Ricard and L’Oréal faced weakening U.S. and China demand and tariff threats, Constellation Brands suffered due to Mexican tariff fears, and we exited Reckitt Benckiser following a partial recovery in its share price ↑ Financials sector overweight ↑ Not owning the low quality, cyclical sectors, specifically materials, energy and real estate |
|
| Line Graph [Table Text Block] |
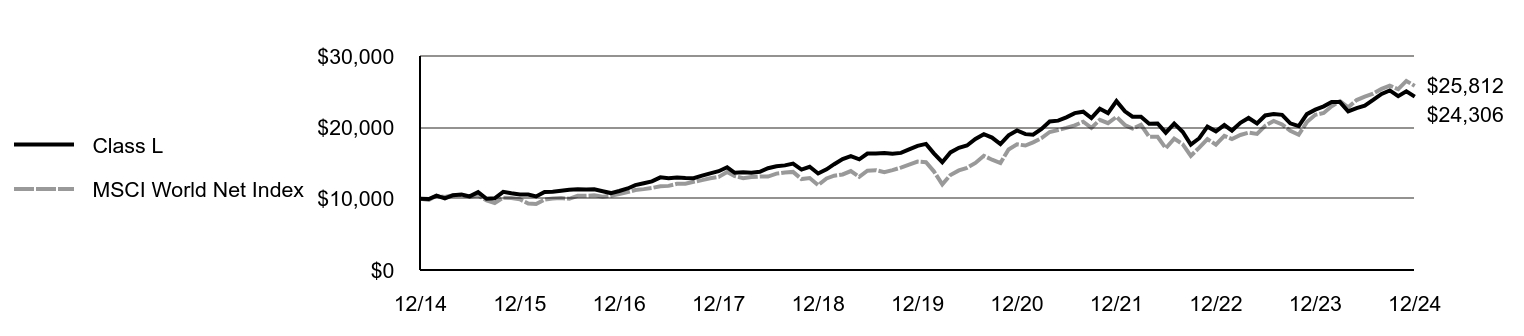 | Class L | MSCI World Net Index |
|---|
12/14 | $10,000 | $10,000 |
|---|
1/15 | $9,950 | $9,819 |
|---|
2/15 | $10,413 | $10,394 |
|---|
3/15 | $10,030 | $10,231 |
|---|
4/15 | $10,493 | $10,471 |
|---|
5/15 | $10,569 | $10,507 |
|---|
6/15 | $10,317 | $10,263 |
|---|
7/15 | $10,904 | $10,447 |
|---|
8/15 | $9,980 | $9,756 |
|---|
9/15 | $10,046 | $9,396 |
|---|
10/15 | $10,960 | $10,141 |
|---|
11/15 | $10,751 | $10,090 |
|---|
12/15 | $10,572 | $9,913 |
|---|
1/16 | $10,572 | $9,320 |
|---|
2/16 | $10,312 | $9,250 |
|---|
3/16 | $10,944 | $9,878 |
|---|
4/16 | $10,976 | $10,035 |
|---|
5/16 | $11,114 | $10,091 |
|---|
6/16 | $11,252 | $9,978 |
|---|
7/16 | $11,312 | $10,399 |
|---|
8/16 | $11,296 | $10,408 |
|---|
9/16 | $11,306 | $10,463 |
|---|
10/16 | $11,045 | $10,261 |
|---|
11/16 | $10,784 | $10,408 |
|---|
12/16 | $11,082 | $10,657 |
|---|
1/17 | $11,429 | $10,915 |
|---|
2/17 | $11,897 | $11,217 |
|---|
3/17 | $12,161 | $11,337 |
|---|
4/17 | $12,425 | $11,505 |
|---|
5/17 | $12,987 | $11,748 |
|---|
6/17 | $12,860 | $11,793 |
|---|
7/17 | $12,966 | $12,076 |
|---|
8/17 | $12,888 | $12,093 |
|---|
9/17 | $12,861 | $12,364 |
|---|
10/17 | $13,219 | $12,598 |
|---|
11/17 | $13,550 | $12,871 |
|---|
12/17 | $13,850 | $13,045 |
|---|
1/18 | $14,400 | $13,733 |
|---|
2/18 | $13,627 | $13,164 |
|---|
3/18 | $13,701 | $12,878 |
|---|
4/18 | $13,627 | $13,026 |
|---|
5/18 | $13,770 | $13,107 |
|---|
6/18 | $14,269 | $13,101 |
|---|
7/18 | $14,537 | $13,510 |
|---|
8/18 | $14,664 | $13,677 |
|---|
9/18 | $14,924 | $13,753 |
|---|
10/18 | $14,070 | $12,744 |
|---|
11/18 | $14,468 | $12,888 |
|---|
12/18 | $13,534 | $11,908 |
|---|
1/19 | $14,111 | $12,835 |
|---|
2/19 | $14,832 | $13,221 |
|---|
3/19 | $15,554 | $13,394 |
|---|
4/19 | $15,963 | $13,869 |
|---|
5/19 | $15,512 | $13,069 |
|---|
6/19 | $16,323 | $13,930 |
|---|
7/19 | $16,347 | $13,999 |
|---|
8/19 | $16,414 | $13,713 |
|---|
9/19 | $16,299 | $14,005 |
|---|
10/19 | $16,420 | $14,361 |
|---|
11/19 | $16,907 | $14,761 |
|---|
12/19 | $17,407 | $15,203 |
|---|
1/20 | $17,682 | $15,111 |
|---|
2/20 | $16,351 | $13,834 |
|---|
3/20 | $15,106 | $12,003 |
|---|
4/20 | $16,488 | $13,314 |
|---|
5/20 | $17,126 | $13,957 |
|---|
6/20 | $17,451 | $14,326 |
|---|
7/20 | $18,364 | $15,012 |
|---|
8/20 | $19,033 | $16,015 |
|---|
9/20 | $18,564 | $15,462 |
|---|
10/20 | $17,657 | $14,988 |
|---|
11/20 | $18,877 | $16,904 |
|---|
12/20 | $19,563 | $17,621 |
|---|
1/21 | $19,048 | $17,446 |
|---|
2/21 | $18,971 | $17,893 |
|---|
3/21 | $19,775 | $18,488 |
|---|
4/21 | $20,817 | $19,349 |
|---|
5/21 | $20,940 | $19,627 |
|---|
6/21 | $21,403 | $19,920 |
|---|
7/21 | $21,995 | $20,277 |
|---|
8/21 | $22,188 | $20,781 |
|---|
9/21 | $21,306 | $19,919 |
|---|
10/21 | $22,599 | $21,047 |
|---|
11/21 | $21,995 | $20,586 |
|---|
12/21 | $23,675 | $21,465 |
|---|
1/22 | $22,241 | $20,330 |
|---|
2/22 | $21,492 | $19,816 |
|---|
3/22 | $21,499 | $20,359 |
|---|
4/22 | $20,506 | $18,668 |
|---|
5/22 | $20,532 | $18,682 |
|---|
6/22 | $19,250 | $17,064 |
|---|
7/22 | $20,512 | $18,419 |
|---|
8/22 | $19,375 | $17,649 |
|---|
9/22 | $17,567 | $16,008 |
|---|
10/22 | $18,474 | $17,158 |
|---|
11/22 | $20,092 | $18,351 |
|---|
12/22 | $19,446 | $17,571 |
|---|
1/23 | $20,323 | $18,815 |
|---|
2/23 | $19,546 | $18,362 |
|---|
3/23 | $20,635 | $18,930 |
|---|
4/23 | $21,312 | $19,261 |
|---|
5/23 | $20,542 | $19,069 |
|---|
6/23 | $21,664 | $20,222 |
|---|
7/23 | $21,870 | $20,902 |
|---|
8/23 | $21,750 | $20,403 |
|---|
9/23 | $20,562 | $19,522 |
|---|
10/23 | $20,170 | $18,956 |
|---|
11/23 | $21,850 | $20,733 |
|---|
12/23 | $22,474 | $21,751 |
|---|
1/24 | $22,938 | $22,012 |
|---|
2/24 | $23,543 | $22,945 |
|---|
3/24 | $23,537 | $23,683 |
|---|
4/24 | $22,225 | $22,803 |
|---|
5/24 | $22,702 | $23,821 |
|---|
6/24 | $23,032 | $24,306 |
|---|
7/24 | $23,839 | $24,734 |
|---|
8/24 | $24,687 | $25,388 |
|---|
9/24 | $25,178 | $25,853 |
|---|
10/24 | $24,377 | $25,340 |
|---|
11/24 | $25,050 | $26,503 |
|---|
12/24 | $24,306 | $25,812 |
|---|
|
|
| Average Annual Return [Table Text Block] |
AATR | 1 Year | 5 Years | 10 Years |
|---|
Class L | 8.15% | 6.90% | 9.29% |
|---|
MSCI World Net Index | 18.67% | 11.17% | 9.95% |
|---|
|
|
| AssetsNet |
$ 2,763,486,138
|
|
| Holdings Count | Holding |
39
|
|
| Advisory Fees Paid, Amount |
$ 20,891,138
|
|
| InvestmentCompanyPortfolioTurnover |
35.00%
|
|
| Additional Fund Statistics [Text Block] |
Total Net Assets | $2,763,486,138 |
|---|
# of Portfolio Holdings | 39 |
|---|
Portfolio Turnover Rate | 35% |
|---|
Total Advisory Fees Paid | $20,891,138 |
|---|
|
|
| Holdings [Text Block] |
Sector Allocation (% of total investments)Value | Value |
|---|
Short-Term Investments | 1.1% | Communication Services | 2.9% | Consumer Discretionary | 5.9% | Industrials | 11.8% | Health Care | 15.4% | Consumer Staples | 18.0% | Financals | 21.8% | Information Technology | 23.1% |
Top Ten Holdings (% of total investments)Microsoft Corp. | 7.8% | SAP SE | 7.3% | Visa, Inc. | 6.6% | L'Oreal SA | 4.2% | Accenture PLC | 4.1% | Aon PLC | 4.1% | Procter & Gamble Co. | 3.3% | RELX PLC | 3.2% | Abbott Laboratories | 3.2% | Becton Dickinson & Co. | 3.1% | Total | 46.9% |
|
|
| Material Fund Change [Text Block] |
|
|
| Updated Prospectus Web Address |
<span style="box-sizing: border-box; color: rgb(0, 0, 0); display: inline; flex-wrap: nowrap; font-size: 10.6667px; font-weight: 400; grid-area: auto; line-height: 16px; margin: 0px; overflow: visible; text-align: left;">www.morganstanley.com/im/shareholderreports</span>
|
|
| C000156276 |
|
|
| Shareholder Report [Line Items] |
|
|
| Fund Name |
Morgan Stanley Institutional Fund, Inc. - Global Franchise Portfolio
|
|
| Class Name |
Class R6
|
|
| Trading Symbol |
MGISX
|
|
| Annual or Semi-Annual Statement [Text Block] |
This annual shareholder report contains important information about Morgan Stanley Institutional Fund, Inc. - Global Franchise Portfolio for the period of January 1, 2024 to December 31, 2024.
|
|
| Shareholder Report Annual or Semi-Annual |
Annual Shareholder Report
|
|
| Additional Information [Text Block] |
You can find additional information about the Fund at www.morganstanley.com/im/shareholderreports. You can also request this information by contacting us at 1-800-869-6397.
|
|
| Additional Information Phone Number |
1-800-869-6397
|
|
| Additional Information Website |
<span style="box-sizing: border-box; color: rgb(0, 0, 0); display: inline; flex-wrap: nowrap; font-size: 10.6667px; font-weight: 400; grid-area: auto; line-height: 16px; margin: 0px; overflow: visible; text-align: left;">www.morganstanley.com/im/shareholderreports</span>
|
|
| Expenses [Text Block] |
What were the Fund costs for the last year?(based on a hypothetical $10,000 investment) Class Name | Costs of a $10,000 investment | Costs paid as a percentage of a $10,000 investment |
|---|
Class R6 | $87 | 0.83% |
|---|
|
|
| Expenses Paid, Amount |
$ 87
|
|
| Expense Ratio, Percent |
0.83%
|
|
| Factors Affecting Performance [Text Block] |
How did the Fund perform last year and what affected its performance?Key contributors to (↑) and detractors from (↓) performance, relative to the MSCI World Net Index: ↓ Stock selection in information technology (IT) and consumer staples was the primary detractor ↓ The portfolio’s tilt toward software and IT services significantly lagged semiconductors and hardware. The relative performance impact of the “Magnificent Seven” was notable: the portfolio owned Microsoft and Alphabet, but the Fund’s high quality bar and strict valuation discipline precluded it from owning the other five, which detracted significantly. ↓ Consumer staples weakness was primarily down to stock-specific issues: Pernod Ricard and L’Oréal faced weakening U.S. and China demand and tariff threats, Constellation Brands suffered due to Mexican tariff fears, and we exited Reckitt Benckiser following a partial recovery in its share price ↑ Financials sector overweight ↑ Not owning the low quality, cyclical sectors, specifically materials, energy and real estate |
|
| Line Graph [Table Text Block] |
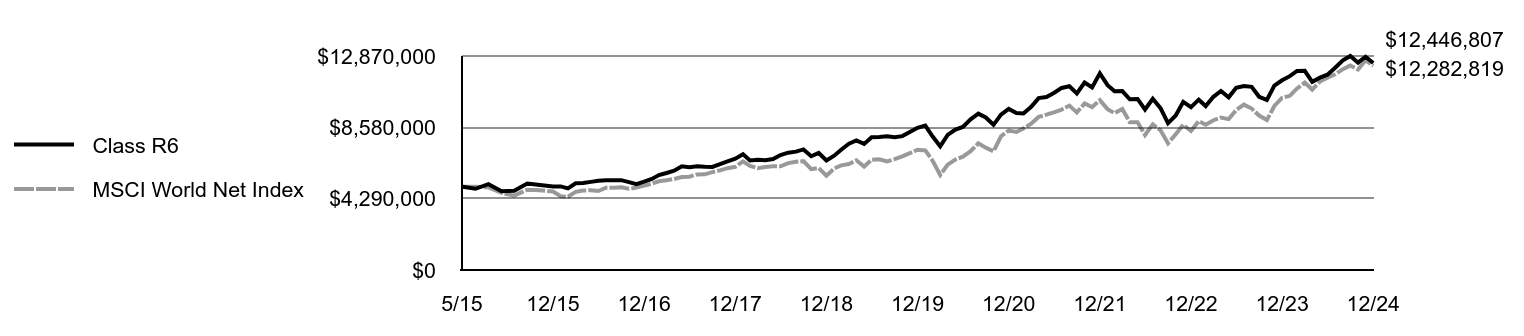 | Class R6 | MSCI World Net Index |
|---|
5/15 | $5,000,000 | $5,000,000 |
|---|
5/15 | $5,000,000 | $5,000,000 |
|---|
6/15 | $4,883,667 | $5,000,000 |
|---|
7/15 | $5,164,236 | $4,971,402 |
|---|
8/15 | $4,730,168 | $4,642,421 |
|---|
9/15 | $4,765,363 | $4,471,189 |
|---|
10/15 | $5,201,777 | $4,825,504 |
|---|
11/15 | $5,105,578 | $4,801,494 |
|---|
12/15 | $5,022,399 | $4,717,096 |
|---|
1/16 | $5,027,342 | $4,434,900 |
|---|
2/16 | $4,908,703 | $4,401,893 |
|---|
3/16 | $5,212,716 | $4,700,601 |
|---|
4/16 | $5,230,017 | $4,774,981 |
|---|
5/16 | $5,299,224 | $4,801,800 |
|---|
6/16 | $5,368,430 | $4,747,994 |
|---|
7/16 | $5,398,732 | $4,948,589 |
|---|
8/16 | $5,396,250 | $4,952,702 |
|---|
9/16 | $5,403,696 | $4,979,010 |
|---|
10/16 | $5,284,552 | $4,882,652 |
|---|
11/16 | $5,162,925 | $4,952,860 |
|---|
12/16 | $5,308,853 | $5,071,374 |
|---|
1/17 | $5,479,357 | $5,193,772 |
|---|
2/17 | $5,706,695 | $5,337,865 |
|---|
3/17 | $5,835,864 | $5,394,724 |
|---|
4/17 | $5,967,616 | $5,474,603 |
|---|
5/17 | $6,241,455 | $5,590,415 |
|---|
6/17 | $6,184,621 | $5,611,924 |
|---|
7/17 | $6,239,151 | $5,746,231 |
|---|
8/17 | $6,208,110 | $5,754,323 |
|---|
9/17 | $6,197,763 | $5,883,474 |
|---|
10/17 | $6,373,660 | $5,994,663 |
|---|
11/17 | $6,536,622 | $6,124,553 |
|---|
12/17 | $6,689,166 | $6,207,378 |
|---|
1/18 | $6,957,057 | $6,535,129 |
|---|
2/18 | $6,589,045 | $6,264,395 |
|---|
3/18 | $6,629,635 | $6,127,853 |
|---|
4/18 | $6,597,163 | $6,198,270 |
|---|
5/18 | $6,672,930 | $6,237,111 |
|---|
6/18 | $6,916,468 | $6,234,135 |
|---|
7/18 | $7,054,230 | $6,428,850 |
|---|
8/18 | $7,119,673 | $6,508,393 |
|---|
9/18 | $7,250,560 | $6,544,632 |
|---|
10/18 | $6,841,540 | $6,064,074 |
|---|
11/18 | $7,037,869 | $6,132,961 |
|---|
12/18 | $6,592,295 | $5,666,623 |
|---|
1/19 | $6,875,681 | $6,107,519 |
|---|
2/19 | $7,233,491 | $6,291,171 |
|---|
3/19 | $7,591,301 | $6,373,802 |
|---|
4/19 | $7,797,400 | $6,599,813 |
|---|
5/19 | $7,582,714 | $6,218,998 |
|---|
6/19 | $7,983,461 | $6,628,798 |
|---|
7/19 | $8,000,636 | $6,661,633 |
|---|
8/19 | $8,037,849 | $6,525,373 |
|---|
9/19 | $7,989,186 | $6,664,239 |
|---|
10/19 | $8,052,161 | $6,833,827 |
|---|
11/19 | $8,298,334 | $7,024,150 |
|---|
12/19 | $8,548,520 | $7,234,581 |
|---|
1/20 | $8,689,347 | $7,190,547 |
|---|
2/20 | $8,042,141 | $6,582,764 |
|---|
3/20 | $7,433,887 | $5,711,583 |
|---|
4/20 | $8,120,045 | $6,335,541 |
|---|
5/20 | $8,443,649 | $6,641,599 |
|---|
6/20 | $8,605,450 | $6,817,276 |
|---|
7/20 | $9,063,888 | $7,143,424 |
|---|
8/20 | $9,402,473 | $7,620,707 |
|---|
9/20 | $9,174,752 | $7,357,800 |
|---|
10/20 | $8,731,296 | $7,132,099 |
|---|
11/20 | $9,342,547 | $8,044,020 |
|---|
12/20 | $9,688,361 | $8,385,060 |
|---|
1/21 | $9,440,021 | $8,301,724 |
|---|
2/21 | $9,408,978 | $8,514,450 |
|---|
3/21 | $9,815,635 | $8,797,744 |
|---|
4/21 | $10,337,149 | $9,207,192 |
|---|
5/21 | $10,405,442 | $9,339,825 |
|---|
6/21 | $10,644,469 | $9,479,034 |
|---|
7/21 | $10,948,686 | $9,648,830 |
|---|
8/21 | $11,051,126 | $9,888,974 |
|---|
9/21 | $10,619,635 | $9,478,378 |
|---|
10/21 | $11,271,528 | $10,015,239 |
|---|
11/21 | $10,976,624 | $9,795,775 |
|---|
12/21 | $11,824,435 | $10,214,448 |
|---|
1/22 | $11,115,160 | $9,673,993 |
|---|
2/22 | $10,747,743 | $9,429,326 |
|---|
3/22 | $10,760,523 | $9,688,098 |
|---|
4/22 | $10,268,504 | $8,883,275 |
|---|
5/22 | $10,287,673 | $8,890,003 |
|---|
6/22 | $9,655,077 | $8,119,933 |
|---|
7/22 | $10,294,063 | $8,764,626 |
|---|
8/22 | $9,731,756 | $8,398,196 |
|---|
9/22 | $8,830,786 | $7,617,501 |
|---|
10/22 | $9,290,855 | $8,164,536 |
|---|
11/22 | $10,111,952 | $8,732,219 |
|---|
12/22 | $9,794,187 | $8,361,386 |
|---|
1/23 | $10,243,074 | $8,953,004 |
|---|
2/23 | $9,859,243 | $8,737,787 |
|---|
3/23 | $10,415,472 | $9,007,782 |
|---|
4/23 | $10,763,522 | $9,165,685 |
|---|
5/23 | $10,382,944 | $9,074,180 |
|---|
6/23 | $10,955,438 | $9,622,967 |
|---|
7/23 | $11,069,286 | $9,946,229 |
|---|
8/23 | $11,013,988 | $9,708,656 |
|---|
9/23 | $10,418,725 | $9,289,840 |
|---|
10/23 | $10,226,810 | $9,020,287 |
|---|
11/23 | $11,088,802 | $9,865,958 |
|---|
12/23 | $11,412,213 | $10,350,320 |
|---|
1/24 | $11,657,923 | $10,474,529 |
|---|
2/24 | $11,973,361 | $10,918,624 |
|---|
3/24 | $11,980,001 | $11,269,492 |
|---|
4/24 | $11,319,242 | $10,850,890 |
|---|
5/24 | $11,568,272 | $11,335,404 |
|---|
6/24 | $11,744,253 | $11,566,056 |
|---|
7/24 | $12,165,944 | $11,769,878 |
|---|
8/24 | $12,607,557 | $12,080,961 |
|---|
9/24 | $12,869,868 | $12,302,211 |
|---|
10/24 | $12,468,100 | $12,058,173 |
|---|
11/24 | $12,823,383 | $12,611,482 |
|---|
12/24 | $12,446,807 | $12,282,819 |
|---|
|
|
| Average Annual Return [Table Text Block] |
AATR | 1 Year | 5 Years | Since 5/29/15
(Inception) |
|---|
Class R6 | 9.07% | 7.80% | 9.98% |
|---|
MSCI World Net Index | 18.67% | 11.17% | 9.82% |
|---|
|
|
| Performance Inception Date |
May 29, 2015
|
|
| AssetsNet |
$ 2,763,486,138
|
|
| Holdings Count | Holding |
39
|
|
| Advisory Fees Paid, Amount |
$ 20,891,138
|
|
| InvestmentCompanyPortfolioTurnover |
35.00%
|
|
| Additional Fund Statistics [Text Block] |
Total Net Assets | $2,763,486,138 |
|---|
# of Portfolio Holdings | 39 |
|---|
Portfolio Turnover Rate | 35% |
|---|
Total Advisory Fees Paid | $20,891,138 |
|---|
|
|
| Holdings [Text Block] |
Sector Allocation (% of total investments)Value | Value |
|---|
Short-Term Investments | 1.1% | Communication Services | 2.9% | Consumer Discretionary | 5.9% | Industrials | 11.8% | Health Care | 15.4% | Consumer Staples | 18.0% | Financals | 21.8% | Information Technology | 23.1% |
Top Ten Holdings (% of total investments)Microsoft Corp. | 7.8% | SAP SE | 7.3% | Visa, Inc. | 6.6% | L'Oreal SA | 4.2% | Accenture PLC | 4.1% | Aon PLC | 4.1% | Procter & Gamble Co. | 3.3% | RELX PLC | 3.2% | Abbott Laboratories | 3.2% | Becton Dickinson & Co. | 3.1% | Total | 46.9% |
|
|
| Material Fund Change [Text Block] |
|
|
| Updated Prospectus Web Address |
<span style="box-sizing: border-box; color: rgb(0, 0, 0); display: inline; flex-wrap: nowrap; font-size: 10.6667px; font-weight: 400; grid-area: auto; line-height: 16px; margin: 0px; overflow: visible; text-align: left;">www.morganstanley.com/im/shareholderreports</span>
|
|
| C000094893 |
|
|
| Shareholder Report [Line Items] |
|
|
| Fund Name |
Morgan Stanley Institutional Fund, Inc. - Global Insight Portfolio
|
|
| Class Name |
Class A
|
|
| Trading Symbol |
MIGPX
|
|
| Annual or Semi-Annual Statement [Text Block] |
This annual shareholder report contains important information about Morgan Stanley Institutional Fund, Inc. - Global Insight Portfolio for the period of January 1, 2024 to December 31, 2024.
|
|
| Shareholder Report Annual or Semi-Annual |
Annual Shareholder Report
|
|
| Additional Information [Text Block] |
You can find additional information about the Fund at www.morganstanley.com/im/shareholderreports. You can also request this information by contacting us at 1-800-869-6397.
|
|
| Additional Information Phone Number |
1-800-869-6397
|
|
| Additional Information Website |
<span style="box-sizing: border-box; color: rgb(0, 0, 0); display: inline; flex-wrap: nowrap; font-size: 10.6667px; font-weight: 400; grid-area: auto; line-height: 16px; margin: 0px; overflow: visible; text-align: left;">www.morganstanley.com/im/shareholderreports</span>
|
|
| Expenses [Text Block] |
What were the Fund costs for the last year?(based on a hypothetical $10,000 investment) Class Name | Costs of a $10,000 investment | Costs paid as a percentage of a $10,000 investment |
|---|
Class A | $163 | 1.32% |
|---|
|
|
| Expenses Paid, Amount |
$ 163
|
|
| Expense Ratio, Percent |
1.32%
|
|
| Factors Affecting Performance [Text Block] |
How did the Fund perform last year and what affected its performance?Key contributors to (↑) and detractors from (↓) performance, relative to the MSCI All Country World Net Index: ↑ Stock selection and average overweight in consumer discretionary, led by a position in a leading seller of used cars online in the United States ↑ Stock selection in information technology, led by a position in an enterprise analytics platform and Bitcoin developing company ↑ Stock selection and average underweight in industrials, where an operator of a leading global ridesharing services platform (sold) and an operator of a Southeast Asian super app (an integrated app platform combining multiple services) contributed ↓ Stock selection in health care, where a position in an underperforming health care services provider was the largest detractor ↓ Average underweight to financials ↓ Stock selection in materials, driven by a position in a company that uses genetic engineering/synthetic biology technology to transform manufacturing of physical products (sold from the portfolio) |
|
| Line Graph [Table Text Block] |
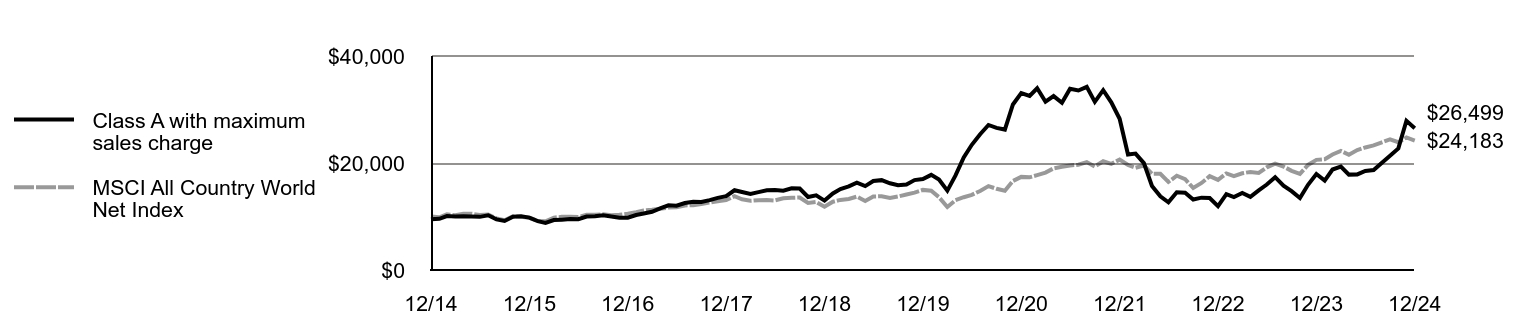 | Class A with maximum sales charge | MSCI All Country World Net Index |
|---|
12/14 | $9,478 | $10,000 |
|---|
1/15 | $9,575 | $9,844 |
|---|
2/15 | $10,075 | $10,392 |
|---|
3/15 | $10,000 | $10,231 |
|---|
4/15 | $10,052 | $10,528 |
|---|
5/15 | $10,007 | $10,514 |
|---|
6/15 | $9,933 | $10,266 |
|---|
7/15 | $10,222 | $10,355 |
|---|
8/15 | $9,470 | $9,646 |
|---|
9/15 | $9,158 | $9,296 |
|---|
10/15 | $9,956 | $10,026 |
|---|
11/15 | $10,040 | $9,943 |
|---|
12/15 | $9,800 | $9,764 |
|---|
1/16 | $9,130 | $9,175 |
|---|
2/16 | $8,795 | $9,112 |
|---|
3/16 | $9,330 | $9,787 |
|---|
4/16 | $9,409 | $9,931 |
|---|
5/16 | $9,521 | $9,944 |
|---|
6/16 | $9,489 | $9,884 |
|---|
7/16 | $9,995 | $10,310 |
|---|
8/16 | $10,068 | $10,344 |
|---|
9/16 | $10,237 | $10,408 |
|---|
10/16 | $10,011 | $10,231 |
|---|
11/16 | $9,778 | $10,309 |
|---|
12/16 | $9,789 | $10,531 |
|---|
1/17 | $10,286 | $10,819 |
|---|
2/17 | $10,547 | $11,123 |
|---|
3/17 | $10,889 | $11,259 |
|---|
4/17 | $11,533 | $11,434 |
|---|
5/17 | $12,087 | $11,687 |
|---|
6/17 | $12,006 | $11,740 |
|---|
7/17 | $12,519 | $12,068 |
|---|
8/17 | $12,748 | $12,114 |
|---|
9/17 | $12,699 | $12,348 |
|---|
10/17 | $13,066 | $12,605 |
|---|
11/17 | $13,481 | $12,849 |
|---|
12/17 | $13,805 | $13,056 |
|---|
1/18 | $14,903 | $13,793 |
|---|
2/18 | $14,567 | $13,213 |
|---|
3/18 | $14,231 | $12,931 |
|---|
4/18 | $14,558 | $13,054 |
|---|
5/18 | $14,894 | $13,070 |
|---|
6/18 | $14,966 | $13,000 |
|---|
7/18 | $14,821 | $13,392 |
|---|
8/18 | $15,264 | $13,497 |
|---|
9/18 | $15,218 | $13,555 |
|---|
10/18 | $13,647 | $12,540 |
|---|
11/18 | $13,946 | $12,723 |
|---|
12/18 | $12,972 | $11,827 |
|---|
1/19 | $14,315 | $12,761 |
|---|
2/19 | $15,129 | $13,102 |
|---|
3/19 | $15,621 | $13,267 |
|---|
4/19 | $16,312 | $13,715 |
|---|
5/19 | $15,678 | $12,901 |
|---|
6/19 | $16,634 | $13,746 |
|---|
7/19 | $16,794 | $13,786 |
|---|
8/19 | $16,208 | $13,459 |
|---|
9/19 | $15,839 | $13,742 |
|---|
10/19 | $15,981 | $14,119 |
|---|
11/19 | $16,804 | $14,463 |
|---|
12/19 | $16,998 | $14,973 |
|---|
1/20 | $17,782 | $14,807 |
|---|
2/20 | $16,921 | $13,611 |
|---|
3/20 | $14,841 | $11,774 |
|---|
4/20 | $17,637 | $13,035 |
|---|
5/20 | $21,023 | $13,602 |
|---|
6/20 | $23,403 | $14,036 |
|---|
7/20 | $25,377 | $14,779 |
|---|
8/20 | $27,108 | $15,683 |
|---|
9/20 | $26,557 | $15,178 |
|---|
10/20 | $26,247 | $14,809 |
|---|
11/20 | $30,940 | $16,634 |
|---|
12/20 | $33,056 | $17,406 |
|---|
1/21 | $32,535 | $17,327 |
|---|
2/21 | $33,968 | $17,729 |
|---|
3/21 | $31,452 | $18,202 |
|---|
4/21 | $32,505 | $18,998 |
|---|
5/21 | $31,252 | $19,294 |
|---|
6/21 | $33,858 | $19,548 |
|---|
7/21 | $33,547 | $19,682 |
|---|
8/21 | $34,239 | $20,175 |
|---|
9/21 | $31,432 | $19,342 |
|---|
10/21 | $33,607 | $20,329 |
|---|
11/21 | $31,352 | $19,839 |
|---|
12/21 | $28,266 | $20,633 |
|---|
1/22 | $21,587 | $19,620 |
|---|
2/22 | $21,764 | $19,113 |
|---|
3/22 | $19,989 | $19,527 |
|---|
4/22 | $15,698 | $17,964 |
|---|
5/22 | $13,778 | $17,985 |
|---|
6/22 | $12,665 | $16,469 |
|---|
7/22 | $14,520 | $17,619 |
|---|
8/22 | $14,440 | $16,970 |
|---|
9/22 | $13,181 | $15,346 |
|---|
10/22 | $13,520 | $16,272 |
|---|
11/22 | $13,455 | $17,534 |
|---|
12/22 | $11,919 | $16,844 |
|---|
1/23 | $14,180 | $18,051 |
|---|
2/23 | $13,615 | $17,534 |
|---|
3/23 | $14,390 | $18,075 |
|---|
4/23 | $13,679 | $18,334 |
|---|
5/23 | $14,891 | $18,138 |
|---|
6/23 | $15,973 | $19,191 |
|---|
7/23 | $17,346 | $19,894 |
|---|
8/23 | $15,747 | $19,338 |
|---|
9/23 | $14,745 | $18,538 |
|---|
10/23 | $13,453 | $17,981 |
|---|
11/23 | $15,924 | $19,640 |
|---|
12/23 | $17,943 | $20,584 |
|---|
1/24 | $16,716 | $20,704 |
|---|
2/24 | $18,783 | $21,593 |
|---|
3/24 | $19,332 | $22,271 |
|---|
4/24 | $17,830 | $21,536 |
|---|
5/24 | $17,862 | $22,411 |
|---|
6/24 | $18,508 | $22,910 |
|---|
7/24 | $18,686 | $23,279 |
|---|
8/24 | $20,059 | $23,870 |
|---|
9/24 | $21,351 | $24,425 |
|---|
10/24 | $22,724 | $23,877 |
|---|
11/24 | $27,892 | $24,770 |
|---|
12/24 | $26,499 | $24,183 |
|---|
|
|
| Average Annual Return [Table Text Block] |
AATR | 1 Year | 5 Years | 10 Years |
|---|
Class A | 47.68% | 9.29% | 10.83% |
|---|
Class A, with 5.25% maximum front end sales charge | 39.88% | 8.12% | 10.24% |
|---|
MSCI All Country World Net Index | 17.49% | 10.06% | 9.23% |
|---|
|
|
| AssetsNet |
$ 69,383,054
|
|
| Holdings Count | Holding |
31
|
|
| Advisory Fees Paid, Amount |
$ 274,227
|
|
| InvestmentCompanyPortfolioTurnover |
54.00%
|
|
| Additional Fund Statistics [Text Block] |
Total Net Assets | $69,383,054 |
|---|
# of Portfolio Holdings | 31 |
|---|
Portfolio Turnover Rate | 54% |
|---|
Total Advisory Fees Paid | $274,227 |
|---|
|
|
| Holdings [Text Block] |
Sector Allocation (% of total investments)Value | Value |
|---|
Short-Term Investments | 2.4% | Industrials | 2.6% | Investment Companies | 2.8% | Health Care | 6.3% | Communication Services | 9.1% | Financals | 12.6% | Information Technology | 29.8% | Consumer Discretionary | 34.4% |
Top Ten Holdings (% of total investments)Footnote ReferenceaTesla, Inc. | 8.9% | Cloudflare, Inc. | 8.2% | Global-e Online Ltd. | 6.6% | Affirm Holdings, Inc. | 6.3% | Shopify, Inc. | 6.3% | Adyen NV | 5.9% | MercadoLibre, Inc. | 5.4% | DoorDash, Inc. | 4.9% | Aurora Innovation, Inc. | 4.5% | Trade Desk, Inc. | 4.3% | Total | 61.3% |
| Footnote | Description | Footnotea | Excluding cash equivalents. |
|
|
| Material Fund Change [Text Block] |
|
|
| Updated Prospectus Web Address |
<span style="box-sizing: border-box; color: rgb(0, 0, 0); display: inline; flex-wrap: nowrap; font-size: 10.6667px; font-weight: 400; grid-area: auto; line-height: 16px; margin: 0px; overflow: visible; text-align: left;">www.morganstanley.com/im/shareholderreports</span>
|
|
| C000155902 |
|
|
| Shareholder Report [Line Items] |
|
|
| Fund Name |
Morgan Stanley Institutional Fund, Inc. - Global Insight Portfolio
|
|
| Class Name |
Class C
|
|
| Trading Symbol |
MSPTX
|
|
| Annual or Semi-Annual Statement [Text Block] |
This annual shareholder report contains important information about Morgan Stanley Institutional Fund, Inc. - Global Insight Portfolio for the period of January 1, 2024 to December 31, 2024.
|
|
| Shareholder Report Annual or Semi-Annual |
Annual Shareholder Report
|
|
| Additional Information [Text Block] |
You can find additional information about the Fund at www.morganstanley.com/im/shareholderreports. You can also request this information by contacting us at 1-800-869-6397.
|
|
| Additional Information Phone Number |
1-800-869-6397
|
|
| Additional Information Website |
<span style="box-sizing: border-box; color: rgb(0, 0, 0); display: inline; flex-wrap: nowrap; font-size: 10.6667px; font-weight: 400; grid-area: auto; line-height: 16px; margin: 0px; overflow: visible; text-align: left;">www.morganstanley.com/im/shareholderreports</span>
|
|
| Expenses [Text Block] |
What were the Fund costs for the last year?(based on a hypothetical $10,000 investment) Class Name | Costs of a $10,000 investment | Costs paid as a percentage of a $10,000 investment |
|---|
Class C | $259 | 2.10% |
|---|
|
|
| Expenses Paid, Amount |
$ 259
|
|
| Expense Ratio, Percent |
2.10%
|
|
| Factors Affecting Performance [Text Block] |
How did the Fund perform last year and what affected its performance?Key contributors to (↑) and detractors from (↓) performance, relative to the MSCI All Country World Net Index: ↑ Stock selection and average overweight in consumer discretionary, led by a position in a leading seller of used cars online in the United States ↑ Stock selection in information technology, led by a position in an enterprise analytics platform and Bitcoin developing company ↑ Stock selection and average underweight in industrials, where an operator of a leading global ridesharing services platform (sold) and an operator of a Southeast Asian super app (an integrated app platform combining multiple services) contributed ↓ Stock selection in health care, where a position in an underperforming health care services provider was the largest detractor ↓ Average underweight to financials ↓ Stock selection in materials, driven by a position in a company that uses genetic engineering/synthetic biology technology to transform manufacturing of physical products (sold from the portfolio) |
|
| Line Graph [Table Text Block] |
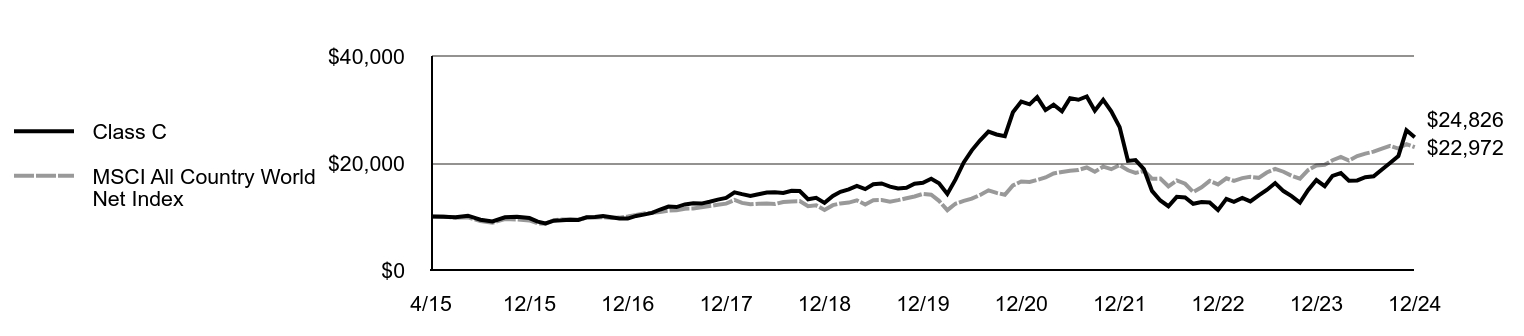 | Class C | MSCI All Country World Net Index |
|---|
4/15 | $10,000 | $10,000 |
|---|
5/15 | $9,947 | $9,987 |
|---|
6/15 | $9,865 | $9,752 |
|---|
7/15 | $10,148 | $9,837 |
|---|
8/15 | $9,396 | $9,162 |
|---|
9/15 | $9,089 | $8,830 |
|---|
10/15 | $9,864 | $9,523 |
|---|
11/15 | $9,948 | $9,445 |
|---|
12/15 | $9,706 | $9,274 |
|---|
1/16 | $9,029 | $8,715 |
|---|
2/16 | $8,691 | $8,655 |
|---|
3/16 | $9,215 | $9,296 |
|---|
4/16 | $9,287 | $9,434 |
|---|
5/16 | $9,400 | $9,446 |
|---|
6/16 | $9,352 | $9,388 |
|---|
7/16 | $9,847 | $9,793 |
|---|
8/16 | $9,913 | $9,826 |
|---|
9/16 | $10,076 | $9,886 |
|---|
10/16 | $9,847 | $9,718 |
|---|
11/16 | $9,611 | $9,792 |
|---|
12/16 | $9,614 | $10,004 |
|---|
1/17 | $10,101 | $10,277 |
|---|
2/17 | $10,348 | $10,566 |
|---|
3/17 | $10,678 | $10,695 |
|---|
4/17 | $11,305 | $10,861 |
|---|
5/17 | $11,849 | $11,101 |
|---|
6/17 | $11,758 | $11,152 |
|---|
7/17 | $12,253 | $11,463 |
|---|
8/17 | $12,459 | $11,507 |
|---|
9/17 | $12,409 | $11,730 |
|---|
10/17 | $12,764 | $11,973 |
|---|
11/17 | $13,160 | $12,205 |
|---|
12/17 | $13,462 | $12,402 |
|---|
1/18 | $14,522 | $13,101 |
|---|
2/18 | $14,181 | $12,551 |
|---|
3/18 | $13,849 | $12,283 |
|---|
4/18 | $14,154 | $12,400 |
|---|
5/18 | $14,476 | $12,415 |
|---|
6/18 | $14,532 | $12,348 |
|---|
7/18 | $14,393 | $12,720 |
|---|
8/18 | $14,806 | $12,820 |
|---|
9/18 | $14,750 | $12,876 |
|---|
10/18 | $13,228 | $11,911 |
|---|
11/18 | $13,494 | $12,086 |
|---|
12/18 | $12,550 | $11,234 |
|---|
1/19 | $13,841 | $12,121 |
|---|
2/19 | $14,611 | $12,446 |
|---|
3/19 | $15,083 | $12,602 |
|---|
4/19 | $15,738 | $13,028 |
|---|
5/19 | $15,122 | $12,255 |
|---|
6/19 | $16,027 | $13,057 |
|---|
7/19 | $16,172 | $13,095 |
|---|
8/19 | $15,594 | $12,785 |
|---|
9/19 | $15,228 | $13,054 |
|---|
10/19 | $15,353 | $13,411 |
|---|
11/19 | $16,133 | $13,738 |
|---|
12/19 | $16,312 | $14,222 |
|---|
1/20 | $17,052 | $14,065 |
|---|
2/20 | $16,213 | $12,929 |
|---|
3/20 | $14,211 | $11,184 |
|---|
4/20 | $16,884 | $12,382 |
|---|
5/20 | $20,109 | $12,920 |
|---|
6/20 | $22,367 | $13,333 |
|---|
7/20 | $24,241 | $14,038 |
|---|
8/20 | $25,878 | $14,897 |
|---|
9/20 | $25,336 | $14,417 |
|---|
10/20 | $25,020 | $14,067 |
|---|
11/20 | $29,478 | $15,800 |
|---|
12/20 | $31,477 | $16,534 |
|---|
1/21 | $30,965 | $16,459 |
|---|
2/21 | $32,307 | $16,840 |
|---|
3/21 | $29,889 | $17,290 |
|---|
4/21 | $30,883 | $18,046 |
|---|
5/21 | $29,664 | $18,327 |
|---|
6/21 | $32,122 | $18,568 |
|---|
7/21 | $31,815 | $18,696 |
|---|
8/21 | $32,440 | $19,164 |
|---|
9/21 | $29,766 | $18,372 |
|---|
10/21 | $31,805 | $19,310 |
|---|
11/21 | $29,654 | $18,845 |
|---|
12/21 | $26,711 | $19,599 |
|---|
1/22 | $20,398 | $18,637 |
|---|
2/22 | $20,554 | $18,155 |
|---|
3/22 | $18,854 | $18,548 |
|---|
4/22 | $14,795 | $17,064 |
|---|
5/22 | $12,991 | $17,084 |
|---|
6/22 | $11,916 | $15,644 |
|---|
7/22 | $13,668 | $16,736 |
|---|
8/22 | $13,564 | $16,120 |
|---|
9/22 | $12,384 | $14,577 |
|---|
10/22 | $12,696 | $15,456 |
|---|
11/22 | $12,627 | $16,655 |
|---|
12/22 | $11,201 | $16,000 |
|---|
1/23 | $13,302 | $17,147 |
|---|
2/23 | $12,746 | $16,655 |
|---|
3/23 | $13,476 | $17,169 |
|---|
4/23 | $12,816 | $17,416 |
|---|
5/23 | $13,951 | $17,229 |
|---|
6/23 | $14,964 | $18,229 |
|---|
7/23 | $16,251 | $18,897 |
|---|
8/23 | $14,753 | $18,369 |
|---|
9/23 | $13,814 | $17,609 |
|---|
10/23 | $12,604 | $17,080 |
|---|
11/23 | $14,919 | $18,656 |
|---|
12/23 | $16,810 | $19,552 |
|---|
1/24 | $15,660 | $19,667 |
|---|
2/24 | $17,597 | $20,511 |
|---|
3/24 | $18,112 | $21,155 |
|---|
4/24 | $16,704 | $20,457 |
|---|
5/24 | $16,735 | $21,288 |
|---|
6/24 | $17,340 | $21,762 |
|---|
7/24 | $17,506 | $22,113 |
|---|
8/24 | $18,793 | $22,674 |
|---|
9/24 | $20,003 | $23,201 |
|---|
10/24 | $21,289 | $22,680 |
|---|
11/24 | $26,131 | $23,529 |
|---|
12/24 | $24,826 | $22,972 |
|---|
|
|
| Average Annual Return [Table Text Block] |
AATR | 1 Year | 5 Years | Since 4/30/15
(Inception) |
|---|
Class C, with conversion to Class A after 8 years | 46.49% | 8.45% | 9.86% |
|---|
Class C, with 1% maximum contingent deferred sales charge and conversion to Class A after 8 years | 45.49% | 8.45% | 9.86% |
|---|
MSCI All Country World Net Index | 17.49% | 10.06% | 8.98% |
|---|
|
|
| Performance Inception Date |
Apr. 30, 2015
|
|
| AssetsNet |
$ 69,383,054
|
|
| Holdings Count | Holding |
31
|
|
| Advisory Fees Paid, Amount |
$ 274,227
|
|
| InvestmentCompanyPortfolioTurnover |
54.00%
|
|
| Additional Fund Statistics [Text Block] |
Total Net Assets | $69,383,054 |
|---|
# of Portfolio Holdings | 31 |
|---|
Portfolio Turnover Rate | 54% |
|---|
Total Advisory Fees Paid | $274,227 |
|---|
|
|
| Holdings [Text Block] |
Sector Allocation (% of total investments)Value | Value |
|---|
Short-Term Investments | 2.4% | Industrials | 2.6% | Investment Companies | 2.8% | Health Care | 6.3% | Communication Services | 9.1% | Financals | 12.6% | Information Technology | 29.8% | Consumer Discretionary | 34.4% |
Top Ten Holdings (% of total investments)Footnote ReferenceaTesla, Inc. | 8.9% | Cloudflare, Inc. | 8.2% | Global-e Online Ltd. | 6.6% | Affirm Holdings, Inc. | 6.3% | Shopify, Inc. | 6.3% | Adyen NV | 5.9% | MercadoLibre, Inc. | 5.4% | DoorDash, Inc. | 4.9% | Aurora Innovation, Inc. | 4.5% | Trade Desk, Inc. | 4.3% | Total | 61.3% |
| Footnote | Description | Footnotea | Excluding cash equivalents. |
|
|
| Material Fund Change [Text Block] |
|
|
| Updated Prospectus Web Address |
<span style="box-sizing: border-box; color: rgb(0, 0, 0); display: inline; flex-wrap: nowrap; font-size: 10.6667px; font-weight: 400; grid-area: auto; line-height: 16px; margin: 0px; overflow: visible; text-align: left;">www.morganstanley.com/im/shareholderreports</span>
|
|
| C000094891 |
|
|
| Shareholder Report [Line Items] |
|
|
| Fund Name |
Morgan Stanley Institutional Fund, Inc. - Global Insight Portfolio
|
|
| Class Name |
Class I
|
|
| Trading Symbol |
MIGIX
|
|
| Annual or Semi-Annual Statement [Text Block] |
This annual shareholder report contains important information about Morgan Stanley Institutional Fund, Inc. - Global Insight Portfolio for the period of January 1, 2024 to December 31, 2024.
|
|
| Shareholder Report Annual or Semi-Annual |
Annual Shareholder Report
|
|
| Additional Information [Text Block] |
You can find additional information about the Fund at www.morganstanley.com/im/shareholderreports. You can also request this information by contacting us at 1-800-869-6397.
|
|
| Additional Information Phone Number |
1-800-869-6397
|
|
| Additional Information Website |
<span style="box-sizing: border-box; color: rgb(0, 0, 0); display: inline; flex-wrap: nowrap; font-size: 10.6667px; font-weight: 400; grid-area: auto; line-height: 16px; margin: 0px; overflow: visible; text-align: left;">www.morganstanley.com/im/shareholderreports</span>
|
|
| Expenses [Text Block] |
What were the Fund costs for the last year?(based on a hypothetical $10,000 investment) Class Name | Costs of a $10,000 investment | Costs paid as a percentage of a $10,000 investment |
|---|
Class I | $124 | 1.00% |
|---|
|
|
| Expenses Paid, Amount |
$ 124
|
|
| Expense Ratio, Percent |
1.00%
|
|
| Factors Affecting Performance [Text Block] |
How did the Fund perform last year and what affected its performance?Key contributors to (↑) and detractors from (↓) performance, relative to the MSCI All Country World Net Index: ↑ Stock selection and average overweight in consumer discretionary, led by a position in a leading seller of used cars online in the United States ↑ Stock selection in information technology, led by a position in an enterprise analytics platform and Bitcoin developing company ↑ Stock selection and average underweight in industrials, where an operator of a leading global ridesharing services platform (sold) and an operator of a Southeast Asian super app (an integrated app platform combining multiple services) contributed ↓ Stock selection in health care, where a position in an underperforming health care services provider was the largest detractor ↓ Average underweight to financials ↓ Stock selection in materials, driven by a position in a company that uses genetic engineering/synthetic biology technology to transform manufacturing of physical products (sold from the portfolio) |
|
| Line Graph [Table Text Block] |
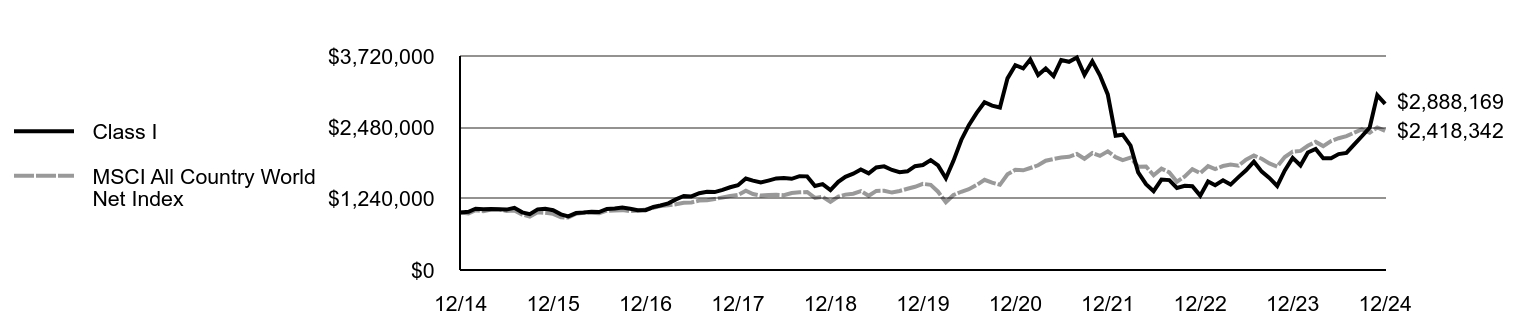 | Class I | MSCI All Country World Net Index |
|---|
12/14 | $1,000,000 | $1,000,000 |
|---|
1/15 | $1,010,989 | $984,369 |
|---|
2/15 | $1,064,364 | $1,039,171 |
|---|
3/15 | $1,056,515 | $1,023,066 |
|---|
4/15 | $1,062,009 | $1,052,752 |
|---|
5/15 | $1,058,085 | $1,051,379 |
|---|
6/15 | $1,050,235 | $1,026,626 |
|---|
7/15 | $1,081,411 | $1,035,542 |
|---|
8/15 | $1,002,107 | $964,555 |
|---|
9/15 | $970,065 | $929,611 |
|---|
10/15 | $1,054,175 | $1,002,568 |
|---|
11/15 | $1,063,788 | $994,291 |
|---|
12/15 | $1,038,522 | $976,361 |
|---|
1/16 | $967,943 | $917,476 |
|---|
2/16 | $931,813 | $911,160 |
|---|
3/16 | $989,789 | $978,686 |
|---|
4/16 | $998,191 | $993,133 |
|---|
5/16 | $1,010,795 | $994,387 |
|---|
6/16 | $1,007,434 | $988,364 |
|---|
7/16 | $1,060,792 | $1,030,959 |
|---|
8/16 | $1,069,285 | $1,034,426 |
|---|
9/16 | $1,087,970 | $1,040,765 |
|---|
10/16 | $1,064,190 | $1,023,101 |
|---|
11/16 | $1,039,560 | $1,030,876 |
|---|
12/16 | $1,040,741 | $1,053,144 |
|---|
1/17 | $1,094,839 | $1,081,941 |
|---|
2/17 | $1,122,318 | $1,112,291 |
|---|
3/17 | $1,159,242 | $1,125,898 |
|---|
4/17 | $1,227,938 | $1,143,445 |
|---|
5/17 | $1,288,046 | $1,168,695 |
|---|
6/17 | $1,279,459 | $1,174,010 |
|---|
7/17 | $1,334,416 | $1,206,819 |
|---|
8/17 | $1,358,460 | $1,211,443 |
|---|
9/17 | $1,354,166 | $1,234,848 |
|---|
10/17 | $1,393,666 | $1,260,490 |
|---|
11/17 | $1,438,318 | $1,284,891 |
|---|
12/17 | $1,473,256 | $1,305,605 |
|---|
1/18 | $1,589,741 | $1,379,263 |
|---|
2/18 | $1,554,414 | $1,321,337 |
|---|
3/18 | $1,520,041 | $1,293,051 |
|---|
4/18 | $1,554,414 | $1,305,399 |
|---|
5/18 | $1,591,651 | $1,307,029 |
|---|
6/18 | $1,599,289 | $1,299,951 |
|---|
7/18 | $1,584,913 | $1,339,153 |
|---|
8/18 | $1,631,557 | $1,349,674 |
|---|
9/18 | $1,627,670 | $1,355,548 |
|---|
10/18 | $1,460,530 | $1,253,965 |
|---|
11/18 | $1,493,005 | $1,272,304 |
|---|
12/18 | $1,388,564 | $1,182,690 |
|---|
1/19 | $1,532,792 | $1,276,075 |
|---|
2/19 | $1,620,323 | $1,310,206 |
|---|
3/19 | $1,674,035 | $1,326,684 |
|---|
4/19 | $1,747,641 | $1,371,480 |
|---|
5/19 | $1,680,998 | $1,290,125 |
|---|
6/19 | $1,783,449 | $1,374,602 |
|---|
7/19 | $1,801,354 | $1,378,630 |
|---|
8/19 | $1,738,689 | $1,345,925 |
|---|
9/19 | $1,698,902 | $1,374,246 |
|---|
10/19 | $1,714,817 | $1,411,857 |
|---|
11/19 | $1,804,338 | $1,446,323 |
|---|
12/19 | $1,825,803 | $1,497,255 |
|---|
1/20 | $1,910,180 | $1,480,717 |
|---|
2/20 | $1,817,670 | $1,361,120 |
|---|
3/20 | $1,595,036 | $1,177,364 |
|---|
4/20 | $1,896,965 | $1,303,489 |
|---|
5/20 | $2,260,905 | $1,360,179 |
|---|
6/20 | $2,517,087 | $1,403,640 |
|---|
7/20 | $2,730,572 | $1,477,875 |
|---|
8/20 | $2,916,609 | $1,568,328 |
|---|
9/20 | $2,857,646 | $1,517,760 |
|---|
10/20 | $2,825,115 | $1,480,866 |
|---|
11/20 | $3,331,379 | $1,663,401 |
|---|
12/20 | $3,559,865 | $1,740,632 |
|---|
1/21 | $3,504,095 | $1,732,716 |
|---|
2/21 | $3,658,780 | $1,772,851 |
|---|
3/21 | $3,388,344 | $1,820,203 |
|---|
4/21 | $3,504,095 | $1,899,787 |
|---|
5/21 | $3,369,403 | $1,929,352 |
|---|
6/21 | $3,650,362 | $1,954,776 |
|---|
7/21 | $3,618,793 | $1,968,246 |
|---|
8/21 | $3,693,505 | $2,017,510 |
|---|
9/21 | $3,392,553 | $1,934,167 |
|---|
10/21 | $3,628,264 | $2,032,894 |
|---|
11/21 | $3,385,187 | $1,983,941 |
|---|
12/21 | $3,052,559 | $2,063,299 |
|---|
1/22 | $2,332,741 | $1,961,966 |
|---|
2/22 | $2,352,736 | $1,911,293 |
|---|
3/22 | $2,161,118 | $1,952,690 |
|---|
4/22 | $1,696,236 | $1,796,393 |
|---|
5/22 | $1,491,288 | $1,798,496 |
|---|
6/22 | $1,369,652 | $1,646,889 |
|---|
7/22 | $1,571,268 | $1,761,895 |
|---|
8/22 | $1,562,937 | $1,697,031 |
|---|
9/22 | $1,426,305 | $1,534,576 |
|---|
10/22 | $1,464,628 | $1,627,183 |
|---|
11/22 | $1,456,297 | $1,753,393 |
|---|
12/22 | $1,292,622 | $1,684,395 |
|---|
1/23 | $1,537,803 | $1,805,127 |
|---|
2/23 | $1,474,423 | $1,753,392 |
|---|
3/23 | $1,559,486 | $1,807,454 |
|---|
4/23 | $1,484,431 | $1,833,431 |
|---|
5/23 | $1,614,527 | $1,813,794 |
|---|
6/23 | $1,732,948 | $1,919,105 |
|---|
7/23 | $1,883,059 | $1,989,360 |
|---|
8/23 | $1,709,597 | $1,933,769 |
|---|
9/23 | $1,601,184 | $1,853,806 |
|---|
10/23 | $1,461,080 | $1,798,068 |
|---|
11/23 | $1,731,280 | $1,964,022 |
|---|
12/23 | $1,949,775 | $2,058,362 |
|---|
1/24 | $1,818,011 | $2,070,429 |
|---|
2/24 | $2,043,177 | $2,159,278 |
|---|
3/24 | $2,103,221 | $2,227,072 |
|---|
4/24 | $1,941,435 | $2,153,594 |
|---|
5/24 | $1,943,103 | $2,241,060 |
|---|
6/24 | $2,014,823 | $2,290,973 |
|---|
7/24 | $2,034,837 | $2,327,921 |
|---|
8/24 | $2,184,948 | $2,387,042 |
|---|
9/24 | $2,325,052 | $2,442,495 |
|---|
10/24 | $2,476,831 | $2,387,669 |
|---|
11/24 | $3,040,581 | $2,476,977 |
|---|
12/24 | $2,888,169 | $2,418,342 |
|---|
|
|
| Average Annual Return [Table Text Block] |
AATR | 1 Year | 5 Years | 10 Years |
|---|
Class I | 48.13% | 9.61% | 11.19% |
|---|
MSCI All Country World Net Index | 17.49% | 10.06% | 9.23% |
|---|
|
|
| AssetsNet |
$ 69,383,054
|
|
| Holdings Count | Holding |
31
|
|
| Advisory Fees Paid, Amount |
$ 274,227
|
|
| InvestmentCompanyPortfolioTurnover |
54.00%
|
|
| Additional Fund Statistics [Text Block] |
Total Net Assets | $69,383,054 |
|---|
# of Portfolio Holdings | 31 |
|---|
Portfolio Turnover Rate | 54% |
|---|
Total Advisory Fees Paid | $274,227 |
|---|
|
|
| Holdings [Text Block] |
Sector Allocation (% of total investments)Value | Value |
|---|
Short-Term Investments | 2.4% | Industrials | 2.6% | Investment Companies | 2.8% | Health Care | 6.3% | Communication Services | 9.1% | Financals | 12.6% | Information Technology | 29.8% | Consumer Discretionary | 34.4% |
Top Ten Holdings (% of total investments)Footnote ReferenceaTesla, Inc. | 8.9% | Cloudflare, Inc. | 8.2% | Global-e Online Ltd. | 6.6% | Affirm Holdings, Inc. | 6.3% | Shopify, Inc. | 6.3% | Adyen NV | 5.9% | MercadoLibre, Inc. | 5.4% | DoorDash, Inc. | 4.9% | Aurora Innovation, Inc. | 4.5% | Trade Desk, Inc. | 4.3% | Total | 61.3% |
| Footnote | Description | Footnotea | Excluding cash equivalents. |
|
|
| Material Fund Change [Text Block] |
|
|
| Updated Prospectus Web Address |
<span style="box-sizing: border-box; color: rgb(0, 0, 0); display: inline; flex-wrap: nowrap; font-size: 10.6667px; font-weight: 400; grid-area: auto; line-height: 16px; margin: 0px; overflow: visible; text-align: left;">www.morganstanley.com/im/shareholderreports</span>
|
|
| C000094892 |
|
|
| Shareholder Report [Line Items] |
|
|
| Fund Name |
Morgan Stanley Institutional Fund, Inc. - Global Insight Portfolio
|
|
| Class Name |
Class L
|
|
| Trading Symbol |
MIGLX
|
|
| Annual or Semi-Annual Statement [Text Block] |
This annual shareholder report contains important information about Morgan Stanley Institutional Fund, Inc. - Global Insight Portfolio for the period of January 1, 2024 to December 31, 2024.
|
|
| Shareholder Report Annual or Semi-Annual |
Annual Shareholder Report
|
|
| Additional Information [Text Block] |
You can find additional information about the Fund at www.morganstanley.com/im/shareholderreports. You can also request this information by contacting us at 1-800-869-6397.
|
|
| Additional Information Phone Number |
1-800-869-6397
|
|
| Additional Information Website |
<span style="box-sizing: border-box; color: rgb(0, 0, 0); display: inline; flex-wrap: nowrap; font-size: 10.6667px; font-weight: 400; grid-area: auto; line-height: 16px; margin: 0px; overflow: visible; text-align: left;">www.morganstanley.com/im/shareholderreports</span>
|
|
| Expenses [Text Block] |
What were the Fund costs for the last year?(based on a hypothetical $10,000 investment) Class Name | Costs of a $10,000 investment | Costs paid as a percentage of a $10,000 investment |
|---|
Class L | $228 | 1.85% |
|---|
|
|
| Expenses Paid, Amount |
$ 228
|
|
| Expense Ratio, Percent |
1.85%
|
|
| Factors Affecting Performance [Text Block] |
How did the Fund perform last year and what affected its performance?Key contributors to (↑) and detractors from (↓) performance, relative to the MSCI All Country World Net Index: ↑ Stock selection and average overweight in consumer discretionary, led by a position in a leading seller of used cars online in the United States ↑ Stock selection in information technology, led by a position in an enterprise analytics platform and Bitcoin developing company ↑ Stock selection and average underweight in industrials, where an operator of a leading global ridesharing services platform (sold) and an operator of a Southeast Asian super app (an integrated app platform combining multiple services) contributed ↓ Stock selection in health care, where a position in an underperforming health care services provider was the largest detractor ↓ Average underweight to financials ↓ Stock selection in materials, driven by a position in a company that uses genetic engineering/synthetic biology technology to transform manufacturing of physical products (sold from the portfolio) |
|
| Line Graph [Table Text Block] |
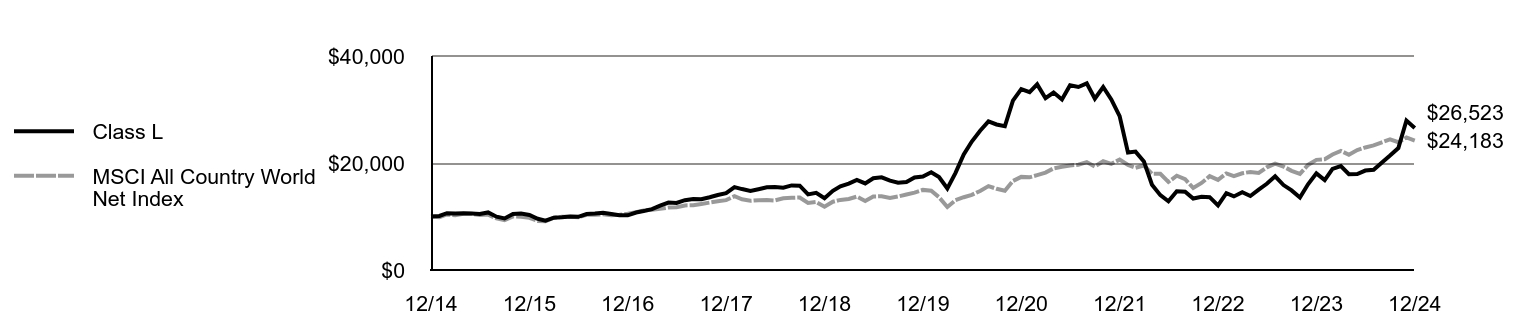 | Class L | MSCI All Country World Net Index |
|---|
12/14 | $10,000 | $10,000 |
|---|
1/15 | $10,104 | $9,844 |
|---|
2/15 | $10,621 | $10,392 |
|---|
3/15 | $10,541 | $10,231 |
|---|
4/15 | $10,589 | $10,528 |
|---|
5/15 | $10,541 | $10,514 |
|---|
6/15 | $10,454 | $10,266 |
|---|
7/15 | $10,754 | $10,355 |
|---|
8/15 | $9,960 | $9,646 |
|---|
9/15 | $9,635 | $9,296 |
|---|
10/15 | $10,462 | $10,026 |
|---|
11/15 | $10,552 | $9,943 |
|---|
12/15 | $10,296 | $9,764 |
|---|
1/16 | $9,581 | $9,175 |
|---|
2/16 | $9,223 | $9,112 |
|---|
3/16 | $9,785 | $9,787 |
|---|
4/16 | $9,862 | $9,931 |
|---|
5/16 | $9,981 | $9,944 |
|---|
6/16 | $9,938 | $9,884 |
|---|
7/16 | $10,462 | $10,310 |
|---|
8/16 | $10,540 | $10,344 |
|---|
9/16 | $10,712 | $10,408 |
|---|
10/16 | $10,471 | $10,231 |
|---|
11/16 | $10,221 | $10,309 |
|---|
12/16 | $10,224 | $10,531 |
|---|
1/17 | $10,747 | $10,819 |
|---|
2/17 | $11,017 | $11,123 |
|---|
3/17 | $11,365 | $11,259 |
|---|
4/17 | $12,036 | $11,434 |
|---|
5/17 | $12,611 | $11,687 |
|---|
6/17 | $12,524 | $11,740 |
|---|
7/17 | $13,046 | $12,068 |
|---|
8/17 | $13,272 | $12,114 |
|---|
9/17 | $13,220 | $12,348 |
|---|
10/17 | $13,603 | $12,605 |
|---|
11/17 | $14,021 | $12,849 |
|---|
12/17 | $14,348 | $13,056 |
|---|
1/18 | $15,487 | $13,793 |
|---|
2/18 | $15,127 | $13,213 |
|---|
3/18 | $14,776 | $12,931 |
|---|
4/18 | $15,107 | $13,054 |
|---|
5/18 | $15,448 | $13,070 |
|---|
6/18 | $15,516 | $13,000 |
|---|
7/18 | $15,369 | $13,392 |
|---|
8/18 | $15,805 | $13,497 |
|---|
9/18 | $15,756 | $13,555 |
|---|
10/18 | $14,131 | $12,540 |
|---|
11/18 | $14,432 | $12,723 |
|---|
12/18 | $13,416 | $11,827 |
|---|
1/19 | $14,797 | $12,761 |
|---|
2/19 | $15,630 | $13,102 |
|---|
3/19 | $16,138 | $13,267 |
|---|
4/19 | $16,839 | $13,715 |
|---|
5/19 | $16,179 | $12,901 |
|---|
6/19 | $17,154 | $13,746 |
|---|
7/19 | $17,316 | $13,786 |
|---|
8/19 | $16,697 | $13,459 |
|---|
9/19 | $16,311 | $13,742 |
|---|
10/19 | $16,453 | $14,119 |
|---|
11/19 | $17,296 | $14,463 |
|---|
12/19 | $17,484 | $14,973 |
|---|
1/20 | $18,285 | $14,807 |
|---|
2/20 | $17,391 | $13,611 |
|---|
3/20 | $15,249 | $11,774 |
|---|
4/20 | $18,118 | $13,035 |
|---|
5/20 | $21,580 | $13,602 |
|---|
6/20 | $24,012 | $14,036 |
|---|
7/20 | $26,019 | $14,779 |
|---|
8/20 | $27,786 | $15,683 |
|---|
9/20 | $27,204 | $15,178 |
|---|
10/20 | $26,871 | $14,809 |
|---|
11/20 | $31,663 | $16,634 |
|---|
12/20 | $33,812 | $17,406 |
|---|
1/21 | $33,251 | $17,327 |
|---|
2/21 | $34,697 | $17,729 |
|---|
3/21 | $32,107 | $18,202 |
|---|
4/21 | $33,175 | $18,998 |
|---|
5/21 | $31,881 | $19,294 |
|---|
6/21 | $34,524 | $19,548 |
|---|
7/21 | $34,200 | $19,682 |
|---|
8/21 | $34,880 | $20,175 |
|---|
9/21 | $32,010 | $19,342 |
|---|
10/21 | $34,211 | $20,329 |
|---|
11/21 | $31,891 | $19,839 |
|---|
12/21 | $28,753 | $20,633 |
|---|
1/22 | $21,947 | $19,620 |
|---|
2/22 | $22,127 | $19,113 |
|---|
3/22 | $20,291 | $19,527 |
|---|
4/22 | $15,934 | $17,964 |
|---|
5/22 | $13,989 | $17,985 |
|---|
6/22 | $12,837 | $16,469 |
|---|
7/22 | $14,728 | $17,619 |
|---|
8/22 | $14,638 | $16,970 |
|---|
9/22 | $13,359 | $15,346 |
|---|
10/22 | $13,683 | $16,272 |
|---|
11/22 | $13,611 | $17,534 |
|---|
12/22 | $12,059 | $16,844 |
|---|
1/23 | $14,348 | $18,051 |
|---|
2/23 | $13,753 | $17,534 |
|---|
3/23 | $14,528 | $18,075 |
|---|
4/23 | $13,825 | $18,334 |
|---|
5/23 | $15,033 | $18,138 |
|---|
6/23 | $16,114 | $19,191 |
|---|
7/23 | $17,502 | $19,894 |
|---|
8/23 | $15,880 | $19,338 |
|---|
9/23 | $14,871 | $18,538 |
|---|
10/23 | $13,537 | $17,981 |
|---|
11/23 | $16,024 | $19,640 |
|---|
12/23 | $18,061 | $20,584 |
|---|
1/24 | $16,817 | $20,704 |
|---|
2/24 | $18,890 | $21,593 |
|---|
3/24 | $19,431 | $22,271 |
|---|
4/24 | $17,917 | $21,536 |
|---|
5/24 | $17,935 | $22,411 |
|---|
6/24 | $18,584 | $22,910 |
|---|
7/24 | $18,746 | $23,279 |
|---|
8/24 | $20,116 | $23,870 |
|---|
9/24 | $21,396 | $24,425 |
|---|
10/24 | $22,784 | $23,877 |
|---|
11/24 | $27,939 | $24,770 |
|---|
12/24 | $26,523 | $24,183 |
|---|
|
|
| Average Annual Return [Table Text Block] |
AATR | 1 Year | 5 Years | 10 Years |
|---|
Class L | 46.85% | 8.69% | 10.25% |
|---|
MSCI All Country World Net Index | 17.49% | 10.06% | 9.23% |
|---|
|
|
| AssetsNet |
$ 69,383,054
|
|
| Holdings Count | Holding |
31
|
|
| Advisory Fees Paid, Amount |
$ 274,227
|
|
| InvestmentCompanyPortfolioTurnover |
54.00%
|
|
| Additional Fund Statistics [Text Block] |
Total Net Assets | $69,383,054 |
|---|
# of Portfolio Holdings | 31 |
|---|
Portfolio Turnover Rate | 54% |
|---|
Total Advisory Fees Paid | $274,227 |
|---|
|
|
| Holdings [Text Block] |
Sector Allocation (% of total investments)Value | Value |
|---|
Short-Term Investments | 2.4% | Industrials | 2.6% | Investment Companies | 2.8% | Health Care | 6.3% | Communication Services | 9.1% | Financals | 12.6% | Information Technology | 29.8% | Consumer Discretionary | 34.4% |
Top Ten Holdings (% of total investments)Footnote ReferenceaTesla, Inc. | 8.9% | Cloudflare, Inc. | 8.2% | Global-e Online Ltd. | 6.6% | Affirm Holdings, Inc. | 6.3% | Shopify, Inc. | 6.3% | Adyen NV | 5.9% | MercadoLibre, Inc. | 5.4% | DoorDash, Inc. | 4.9% | Aurora Innovation, Inc. | 4.5% | Trade Desk, Inc. | 4.3% | Total | 61.3% |
| Footnote | Description | Footnotea | Excluding cash equivalents. |
|
|
| Material Fund Change [Text Block] |
|
|
| Updated Prospectus Web Address |
<span style="box-sizing: border-box; color: rgb(0, 0, 0); display: inline; flex-wrap: nowrap; font-size: 10.6667px; font-weight: 400; grid-area: auto; line-height: 16px; margin: 0px; overflow: visible; text-align: left;">www.morganstanley.com/im/shareholderreports</span>
|
|
| C000228507 |
|
|
| Shareholder Report [Line Items] |
|
|
| Fund Name |
Morgan Stanley Institutional Fund, Inc. - Global Insight Portfolio
|
|
| Class Name |
Class R6
|
|
| Trading Symbol |
MGZZX
|
|
| Annual or Semi-Annual Statement [Text Block] |
This annual shareholder report contains important information about Morgan Stanley Institutional Fund, Inc. - Global Insight Portfolio for the period of January 1, 2024 to December 31, 2024.
|
|
| Shareholder Report Annual or Semi-Annual |
Annual Shareholder Report
|
|
| Additional Information [Text Block] |
You can find additional information about the Fund at www.morganstanley.com/im/shareholderreports. You can also request this information by contacting us at 1-800-869-6397.
|
|
| Additional Information Phone Number |
1-800-869-6397
|
|
| Additional Information Website |
<span style="box-sizing: border-box; color: rgb(0, 0, 0); display: inline; flex-wrap: nowrap; font-size: 10.6667px; font-weight: 400; grid-area: auto; line-height: 16px; margin: 0px; overflow: visible; text-align: left;">www.morganstanley.com/im/shareholderreports</span>
|
|
| Expenses [Text Block] |
What were the Fund costs for the last year?(based on a hypothetical $10,000 investment) Class Name | Costs of a $10,000 investment | Costs paid as a percentage of a $10,000 investment |
|---|
Class R6 | $118 | 0.95% |
|---|
|
|
| Expenses Paid, Amount |
$ 118
|
|
| Expense Ratio, Percent |
0.95%
|
|
| Factors Affecting Performance [Text Block] |
How did the Fund perform last year and what affected its performance?Key contributors to (↑) and detractors from (↓) performance, relative to the MSCI All Country World Net Index: ↑ Stock selection and average overweight in consumer discretionary, led by a position in a leading seller of used cars online in the United States ↑ Stock selection in information technology, led by a position in an enterprise analytics platform and Bitcoin developing company ↑ Stock selection and average underweight in industrials, where an operator of a leading global ridesharing services platform (sold) and an operator of a Southeast Asian super app (an integrated app platform combining multiple services) contributed ↓ Stock selection in health care, where a position in an underperforming health care services provider was the largest detractor ↓ Average underweight to financials ↓ Stock selection in materials, driven by a position in a company that uses genetic engineering/synthetic biology technology to transform manufacturing of physical products (sold from the portfolio) |
|
| Line Graph [Table Text Block] |
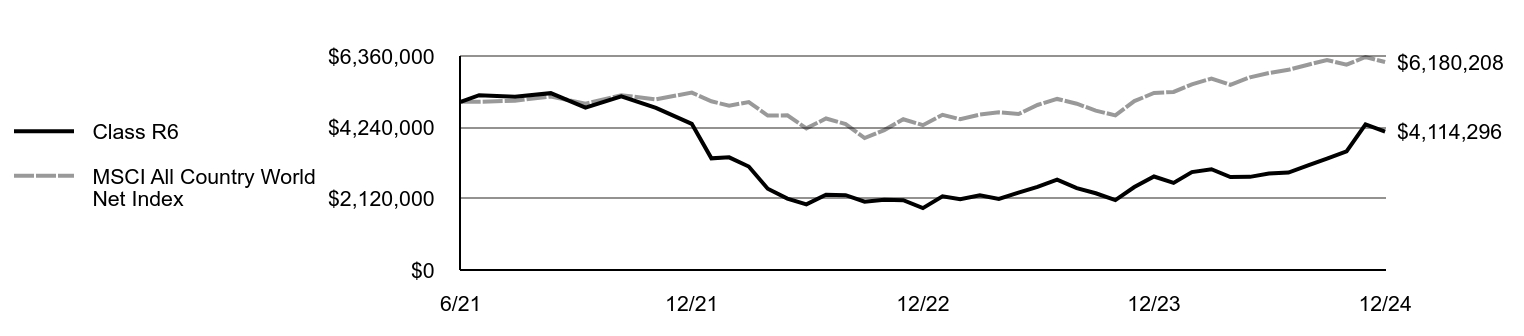 | Class R6 | MSCI All Country World Net Index |
|---|
6/21 | $5,000,000 | $5,000,000 |
|---|
6/21 | $5,194,669 | $5,000,000 |
|---|
7/21 | $5,149,745 | $5,029,961 |
|---|
8/21 | $5,256,065 | $5,155,858 |
|---|
9/21 | $4,827,793 | $4,942,870 |
|---|
10/21 | $5,163,223 | $5,195,172 |
|---|
11/21 | $4,817,311 | $5,070,070 |
|---|
12/21 | $4,344,401 | $5,272,875 |
|---|
1/22 | $3,318,838 | $5,013,912 |
|---|
2/22 | $3,347,325 | $4,884,416 |
|---|
3/22 | $3,074,317 | $4,990,208 |
|---|
4/22 | $2,414,348 | $4,590,782 |
|---|
5/22 | $2,122,347 | $4,596,155 |
|---|
6/22 | $1,949,046 | $4,208,716 |
|---|
7/22 | $2,236,298 | $4,502,621 |
|---|
8/22 | $2,224,428 | $4,336,857 |
|---|
9/22 | $2,032,135 | $3,921,693 |
|---|
10/22 | $2,084,363 | $4,158,356 |
|---|
11/22 | $2,074,867 | $4,480,892 |
|---|
12/22 | $1,839,296 | $4,304,564 |
|---|
1/23 | $2,188,620 | $4,613,102 |
|---|
2/23 | $2,100,695 | $4,480,890 |
|---|
3/23 | $2,219,513 | $4,619,048 |
|---|
4/23 | $2,112,577 | $4,685,435 |
|---|
5/23 | $2,300,308 | $4,635,252 |
|---|
6/23 | $2,469,029 | $4,904,379 |
|---|
7/23 | $2,682,901 | $5,083,918 |
|---|
8/23 | $2,433,384 | $4,941,854 |
|---|
9/23 | $2,281,298 | $4,737,504 |
|---|
10/23 | $2,079,308 | $4,595,062 |
|---|
11/23 | $2,464,277 | $5,019,167 |
|---|
12/23 | $2,777,955 | $5,260,258 |
|---|
1/24 | $2,587,847 | $5,291,095 |
|---|
2/24 | $2,911,031 | $5,518,153 |
|---|
3/24 | $2,994,203 | $5,691,406 |
|---|
4/24 | $2,763,697 | $5,503,630 |
|---|
5/24 | $2,768,450 | $5,727,152 |
|---|
6/24 | $2,868,257 | $5,854,708 |
|---|
7/24 | $2,896,773 | $5,949,130 |
|---|
8/24 | $3,110,644 | $6,100,217 |
|---|
9/24 | $3,312,634 | $6,241,931 |
|---|
10/24 | $3,526,506 | $6,101,820 |
|---|
11/24 | $4,329,713 | $6,330,050 |
|---|
12/24 | $4,114,296 | $6,180,208 |
|---|
|
|
| Average Annual Return [Table Text Block] |
AATR | 1 Year | Since 6/14/21
(Inception) |
|---|
Class R6 | 48.11% | (5.35)% |
|---|
MSCI All Country World Net Index | 17.49% | 6.16% |
|---|
|
|
| Performance Inception Date |
Jun. 14, 2021
|
|
| AssetsNet |
$ 69,383,054
|
|
| Holdings Count | Holding |
31
|
|
| Advisory Fees Paid, Amount |
$ 274,227
|
|
| InvestmentCompanyPortfolioTurnover |
54.00%
|
|
| Additional Fund Statistics [Text Block] |
Total Net Assets | $69,383,054 |
|---|
# of Portfolio Holdings | 31 |
|---|
Portfolio Turnover Rate | 54% |
|---|
Total Advisory Fees Paid | $274,227 |
|---|
|
|
| Holdings [Text Block] |
Sector Allocation (% of total investments)Value | Value |
|---|
Short-Term Investments | 2.4% | Industrials | 2.6% | Investment Companies | 2.8% | Health Care | 6.3% | Communication Services | 9.1% | Financals | 12.6% | Information Technology | 29.8% | Consumer Discretionary | 34.4% |
Top Ten Holdings (% of total investments)Footnote ReferenceaTesla, Inc. | 8.9% | Cloudflare, Inc. | 8.2% | Global-e Online Ltd. | 6.6% | Affirm Holdings, Inc. | 6.3% | Shopify, Inc. | 6.3% | Adyen NV | 5.9% | MercadoLibre, Inc. | 5.4% | DoorDash, Inc. | 4.9% | Aurora Innovation, Inc. | 4.5% | Trade Desk, Inc. | 4.3% | Total | 61.3% |
| Footnote | Description | Footnotea | Excluding cash equivalents. |
|
|
| Material Fund Change [Text Block] |
|
|
| Updated Prospectus Web Address |
<span style="box-sizing: border-box; color: rgb(0, 0, 0); display: inline; flex-wrap: nowrap; font-size: 10.6667px; font-weight: 400; grid-area: auto; line-height: 16px; margin: 0px; overflow: visible; text-align: left;">www.morganstanley.com/im/shareholderreports</span>
|
|
| C000085100 |
|
|
| Shareholder Report [Line Items] |
|
|
| Fund Name |
Morgan Stanley Institutional Fund, Inc. - Global Opportunity Portfolio
|
|
| Class Name |
Class A
|
|
| Trading Symbol |
MGGPX
|
|
| Annual or Semi-Annual Statement [Text Block] |
This annual shareholder report contains important information about Morgan Stanley Institutional Fund, Inc. - Global Opportunity Portfolio for the period of January 1, 2024 to December 31, 2024.
|
|
| Shareholder Report Annual or Semi-Annual |
Annual Shareholder Report
|
|
| Additional Information [Text Block] |
You can find additional information about the Fund at www.morganstanley.com/im/shareholderreports. You can also request this information by contacting us at 1-800-869-6397.
|
|
| Additional Information Phone Number |
1-800-869-6397
|
|
| Additional Information Website |
<span style="box-sizing: border-box; color: rgb(0, 0, 0); display: inline; flex-wrap: nowrap; font-size: 10.6667px; font-weight: 400; grid-area: auto; line-height: 16px; margin: 0px; overflow: visible; text-align: left;">www.morganstanley.com/im/shareholderreports</span>
|
|
| Expenses [Text Block] |
What were the Fund costs for the last year?(based on a hypothetical $10,000 investment) Class Name | Costs of a $10,000 investment | Costs paid as a percentage of a $10,000 investment |
|---|
Class A | $139 | 1.22% |
|---|
|
|
| Expenses Paid, Amount |
$ 139
|
|
| Expense Ratio, Percent |
1.22%
|
|
| Factors Affecting Performance [Text Block] |
How did the Fund perform last year and what affected its performance?Key contributors to (↑) and detractors from (↓) performance, relative to the MSCI All Country World Net Index: ↑ Stock selection in consumer discretionary, led by a holding in an online food delivery platform ↑ Stock selection in communication services, led by a social network, which was the largest positive contributor in the portfolio ↑ No exposure to health care ↓ Stock selection in financials, where exposure to an Indian private sector bank was the main detractor ↓ Stock selection and an underweight allocation to information technology, where a holding in a creative cloud software company was the main detractor ↓ Stock selection in industrials |
|
| Line Graph [Table Text Block] |
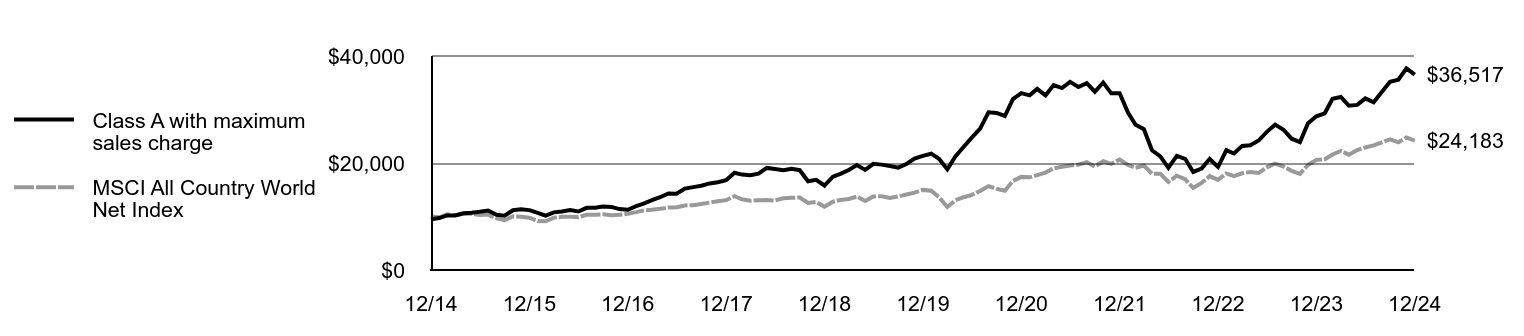 | Class A with maximum sales charge | MSCI All Country World Net Index |
|---|
12/14 | $9,476 | $10,000 |
|---|
1/15 | $9,703 | $9,844 |
|---|
2/15 | $10,207 | $10,392 |
|---|
3/15 | $10,207 | $10,231 |
|---|
4/15 | $10,614 | $10,528 |
|---|
5/15 | $10,710 | $10,514 |
|---|
6/15 | $10,876 | $10,266 |
|---|
7/15 | $11,106 | $10,355 |
|---|
8/15 | $10,330 | $9,646 |
|---|
9/15 | $10,136 | $9,296 |
|---|
10/15 | $11,175 | $10,026 |
|---|
11/15 | $11,341 | $9,943 |
|---|
12/15 | $11,197 | $9,764 |
|---|
1/16 | $10,666 | $9,175 |
|---|
2/16 | $10,156 | $9,112 |
|---|
3/16 | $10,771 | $9,787 |
|---|
4/16 | $10,932 | $9,931 |
|---|
5/16 | $11,197 | $9,944 |
|---|
6/16 | $10,932 | $9,884 |
|---|
7/16 | $11,625 | $10,310 |
|---|
8/16 | $11,633 | $10,344 |
|---|
9/16 | $11,879 | $10,408 |
|---|
10/16 | $11,797 | $10,231 |
|---|
11/16 | $11,386 | $10,309 |
|---|
12/16 | $11,267 | $10,531 |
|---|
1/17 | $11,920 | $10,819 |
|---|
2/17 | $12,423 | $11,123 |
|---|
3/17 | $13,053 | $11,259 |
|---|
4/17 | $13,601 | $11,434 |
|---|
5/17 | $14,307 | $11,687 |
|---|
6/17 | $14,254 | $11,740 |
|---|
7/17 | $15,223 | $12,068 |
|---|
8/17 | $15,493 | $12,114 |
|---|
9/17 | $15,756 | $12,348 |
|---|
10/17 | $16,183 | $12,605 |
|---|
11/17 | $16,394 | $12,849 |
|---|
12/17 | $16,791 | $13,056 |
|---|
1/18 | $18,185 | $13,793 |
|---|
2/18 | $17,831 | $13,213 |
|---|
3/18 | $17,710 | $12,931 |
|---|
4/18 | $17,996 | $13,054 |
|---|
5/18 | $19,082 | $13,070 |
|---|
6/18 | $18,863 | $13,000 |
|---|
7/18 | $18,642 | $13,392 |
|---|
8/18 | $18,908 | $13,497 |
|---|
9/18 | $18,657 | $13,555 |
|---|
10/18 | $16,586 | $12,540 |
|---|
11/18 | $16,844 | $12,723 |
|---|
12/18 | $15,789 | $11,827 |
|---|
1/19 | $17,443 | $12,761 |
|---|
2/19 | $17,967 | $13,102 |
|---|
3/19 | $18,687 | $13,267 |
|---|
4/19 | $19,621 | $13,715 |
|---|
5/19 | $18,703 | $12,901 |
|---|
6/19 | $19,848 | $13,746 |
|---|
7/19 | $19,697 | $13,786 |
|---|
8/19 | $19,454 | $13,459 |
|---|
9/19 | $19,143 | $13,742 |
|---|
10/19 | $19,818 | $14,119 |
|---|
11/19 | $20,812 | $14,463 |
|---|
12/19 | $21,320 | $14,973 |
|---|
1/20 | $21,738 | $14,807 |
|---|
2/20 | $20,782 | $13,611 |
|---|
3/20 | $18,809 | $11,774 |
|---|
4/20 | $21,206 | $13,035 |
|---|
5/20 | $23,043 | $13,602 |
|---|
6/20 | $24,750 | $14,036 |
|---|
7/20 | $26,427 | $14,779 |
|---|
8/20 | $29,484 | $15,683 |
|---|
9/20 | $29,355 | $15,178 |
|---|
10/20 | $28,786 | $14,809 |
|---|
11/20 | $31,950 | $16,634 |
|---|
12/20 | $33,053 | $17,406 |
|---|
1/21 | $32,646 | $17,327 |
|---|
2/21 | $33,844 | $17,729 |
|---|
3/21 | $32,631 | $18,202 |
|---|
4/21 | $34,574 | $18,998 |
|---|
5/21 | $33,998 | $19,294 |
|---|
6/21 | $35,157 | $19,548 |
|---|
7/21 | $34,205 | $19,682 |
|---|
8/21 | $34,927 | $20,175 |
|---|
9/21 | $33,322 | $19,342 |
|---|
10/21 | $35,042 | $20,329 |
|---|
11/21 | $33,022 | $19,839 |
|---|
12/21 | $33,035 | $20,633 |
|---|
1/22 | $29,413 | $19,620 |
|---|
2/22 | $27,150 | $19,113 |
|---|
3/22 | $26,317 | $19,527 |
|---|
4/22 | $22,371 | $17,964 |
|---|
5/22 | $21,239 | $17,985 |
|---|
6/22 | $19,105 | $16,469 |
|---|
7/22 | $21,320 | $17,619 |
|---|
8/22 | $20,787 | $16,970 |
|---|
9/22 | $18,329 | $15,346 |
|---|
10/22 | $18,976 | $16,272 |
|---|
11/22 | $20,754 | $17,534 |
|---|
12/22 | $19,246 | $16,844 |
|---|
1/23 | $22,396 | $18,051 |
|---|
2/23 | $21,774 | $17,534 |
|---|
3/23 | $23,198 | $18,075 |
|---|
4/23 | $23,328 | $18,334 |
|---|
5/23 | $24,201 | $18,138 |
|---|
6/23 | $25,826 | $19,191 |
|---|
7/23 | $27,170 | $19,894 |
|---|
8/23 | $26,227 | $19,338 |
|---|
9/23 | $24,542 | $18,538 |
|---|
10/23 | $23,900 | $17,981 |
|---|
11/23 | $27,441 | $19,640 |
|---|
12/23 | $28,733 | $20,584 |
|---|
1/24 | $29,297 | $20,704 |
|---|
2/24 | $32,005 | $21,593 |
|---|
3/24 | $32,334 | $22,271 |
|---|
4/24 | $30,702 | $21,536 |
|---|
5/24 | $30,856 | $22,411 |
|---|
6/24 | $32,087 | $22,910 |
|---|
7/24 | $31,338 | $23,279 |
|---|
8/24 | $33,329 | $23,870 |
|---|
9/24 | $35,185 | $24,425 |
|---|
10/24 | $35,575 | $23,877 |
|---|
11/24 | $37,688 | $24,770 |
|---|
12/24 | $36,517 | $24,183 |
|---|
|
|
| Average Annual Return [Table Text Block] |
AATR | 1 Year | 5 Years | 10 Years |
|---|
Class A | 27.09% | 11.36% | 14.44% |
|---|
Class A, with 5.25% maximum front end sales charge | 20.43% | 10.17% | 13.83% |
|---|
MSCI All Country World Net Index | 17.49% | 10.06% | 9.23% |
|---|
|
|
| AssetsNet |
$ 3,093,035,628
|
|
| Holdings Count | Holding |
36
|
|
| Advisory Fees Paid, Amount |
$ 22,188,836
|
|
| InvestmentCompanyPortfolioTurnover |
19.00%
|
|
| Additional Fund Statistics [Text Block] |
Total Net Assets | $3,093,035,628 |
|---|
# of Portfolio Holdings | 36 |
|---|
Portfolio Turnover Rate | 19% |
|---|
Total Advisory Fees Paid | $22,188,836 |
|---|
|
|
| Holdings [Text Block] |
Sector Allocation (% of total investments)Value | Value |
|---|
Short-Term Investments | 5.3% | Industrials | 14.0% | Communication Services | 15.1% | Information Technology | 17.4% | Financials | 18.0% | Consumer Discretionary | 30.2% |
Top Ten Holdings (% of total investments)Footnote ReferenceaServiceNow, Inc. | 6.9% | Meta Platforms, Inc. | 6.8% | DSV AS | 4.8% | Uber Technologies, Inc. | 4.8% | DoorDash, Inc. | 4.6% | MercadoLibre, Inc. | 4.4% | Amazon.com, Inc. | 4.4% | Spotify Technology SA | 4.0% | Schneider Electric SE | 3.6% | ICICI Bank Ltd. | 3.4% | Total | 47.7% |
| Footnote | Description | Footnotea | Excluding cash equivalents. |
|
|
| Material Fund Change [Text Block] |
|
|
| Updated Prospectus Web Address |
<span style="box-sizing: border-box; color: rgb(0, 0, 0); display: inline; flex-wrap: nowrap; font-size: 10.6667px; font-weight: 400; grid-area: auto; line-height: 16px; margin: 0px; overflow: visible; text-align: left;">www.morganstanley.com/im/shareholderreports</span>
|
|
| C000155900 |
|
|
| Shareholder Report [Line Items] |
|
|
| Fund Name |
Morgan Stanley Institutional Fund, Inc. - Global Opportunity Portfolio
|
|
| Class Name |
Class C
|
|
| Trading Symbol |
MSOPX
|
|
| Annual or Semi-Annual Statement [Text Block] |
This annual shareholder report contains important information about Morgan Stanley Institutional Fund, Inc. - Global Opportunity Portfolio for the period of January 1, 2024 to December 31, 2024.
|
|
| Shareholder Report Annual or Semi-Annual |
Annual Shareholder Report
|
|
| Additional Information [Text Block] |
You can find additional information about the Fund at www.morganstanley.com/im/shareholderreports. You can also request this information by contacting us at 1-800-869-6397.
|
|
| Additional Information Phone Number |
1-800-869-6397
|
|
| Additional Information Website |
<span style="box-sizing: border-box; color: rgb(0, 0, 0); display: inline; flex-wrap: nowrap; font-size: 10.6667px; font-weight: 400; grid-area: auto; line-height: 16px; margin: 0px; overflow: visible; text-align: left;">www.morganstanley.com/im/shareholderreports</span>
|
|
| Expenses [Text Block] |
What were the Fund costs for the last year?(based on a hypothetical $10,000 investment) Class Name | Costs of a $10,000 investment | Costs paid as a percentage of a $10,000 investment |
|---|
Class C | $219 | 1.94% |
|---|
|
|
| Expenses Paid, Amount |
$ 219
|
|
| Expense Ratio, Percent |
1.94%
|
|
| Factors Affecting Performance [Text Block] |
How did the Fund perform last year and what affected its performance?Key contributors to (↑) and detractors from (↓) performance, relative to the MSCI All Country World Net Index: ↑ Stock selection in consumer discretionary, led by a holding in an online food delivery platform ↑ Stock selection in communication services, led by a social network, which was the largest positive contributor in the portfolio ↑ No exposure to health care ↓ Stock selection in financials, where exposure to an Indian private sector bank was the main detractor ↓ Stock selection and an underweight allocation to information technology, where a holding in a creative cloud software company was the main detractor ↓ Stock selection in industrials |
|
| Line Graph [Table Text Block] |
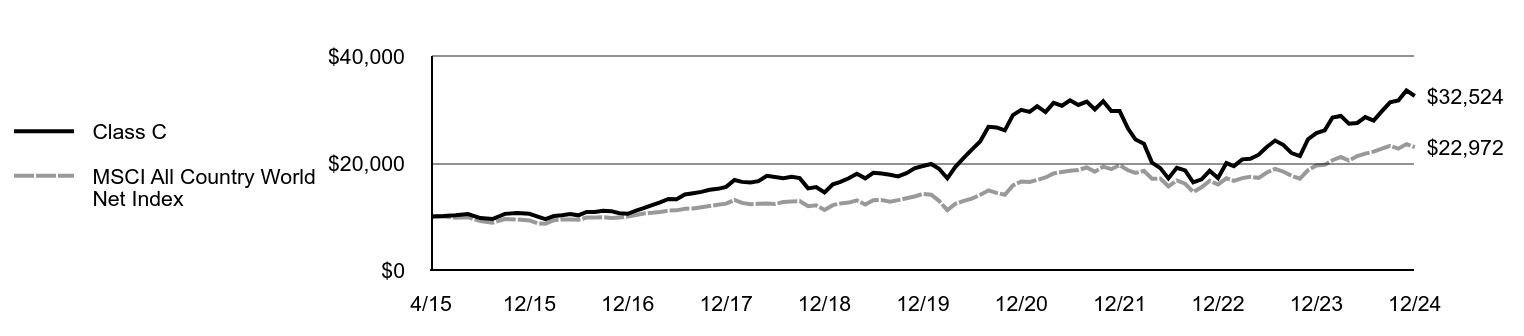 | Class C | MSCI All Country World Net Index |
|---|
4/15 | $10,000 | $10,000 |
|---|
5/15 | $10,085 | $9,987 |
|---|
6/15 | $10,236 | $9,752 |
|---|
7/15 | $10,448 | $9,837 |
|---|
8/15 | $9,710 | $9,162 |
|---|
9/15 | $9,519 | $8,830 |
|---|
10/15 | $10,494 | $9,523 |
|---|
11/15 | $10,639 | $9,445 |
|---|
12/15 | $10,495 | $9,274 |
|---|
1/16 | $9,990 | $8,715 |
|---|
2/16 | $9,512 | $8,655 |
|---|
3/16 | $10,090 | $9,296 |
|---|
4/16 | $10,230 | $9,434 |
|---|
5/16 | $10,475 | $9,446 |
|---|
6/16 | $10,216 | $9,388 |
|---|
7/16 | $10,855 | $9,793 |
|---|
8/16 | $10,855 | $9,826 |
|---|
9/16 | $11,090 | $9,886 |
|---|
10/16 | $10,998 | $9,718 |
|---|
11/16 | $10,607 | $9,792 |
|---|
12/16 | $10,500 | $10,004 |
|---|
1/17 | $11,093 | $10,277 |
|---|
2/17 | $11,558 | $10,566 |
|---|
3/17 | $12,137 | $10,695 |
|---|
4/17 | $12,637 | $10,861 |
|---|
5/17 | $13,288 | $11,101 |
|---|
6/17 | $13,230 | $11,152 |
|---|
7/17 | $14,117 | $11,463 |
|---|
8/17 | $14,360 | $11,507 |
|---|
9/17 | $14,603 | $11,730 |
|---|
10/17 | $14,989 | $11,973 |
|---|
11/17 | $15,168 | $12,205 |
|---|
12/17 | $15,531 | $12,402 |
|---|
1/18 | $16,816 | $13,101 |
|---|
2/18 | $16,471 | $12,551 |
|---|
3/18 | $16,357 | $12,283 |
|---|
4/18 | $16,615 | $12,400 |
|---|
5/18 | $17,605 | $12,415 |
|---|
6/18 | $17,390 | $12,348 |
|---|
7/18 | $17,172 | $12,720 |
|---|
8/18 | $17,404 | $12,820 |
|---|
9/18 | $17,172 | $12,876 |
|---|
10/18 | $15,257 | $11,911 |
|---|
11/18 | $15,488 | $12,086 |
|---|
12/18 | $14,505 | $11,234 |
|---|
1/19 | $16,016 | $12,121 |
|---|
2/19 | $16,486 | $12,446 |
|---|
3/19 | $17,136 | $12,602 |
|---|
4/19 | $17,989 | $13,028 |
|---|
5/19 | $17,136 | $12,255 |
|---|
6/19 | $18,177 | $13,057 |
|---|
7/19 | $18,018 | $13,095 |
|---|
8/19 | $17,787 | $12,785 |
|---|
9/19 | $17,490 | $13,054 |
|---|
10/19 | $18,097 | $13,411 |
|---|
11/19 | $18,994 | $13,738 |
|---|
12/19 | $19,442 | $14,222 |
|---|
1/20 | $19,817 | $14,065 |
|---|
2/20 | $18,929 | $12,929 |
|---|
3/20 | $17,129 | $11,184 |
|---|
4/20 | $19,297 | $12,382 |
|---|
5/20 | $20,959 | $12,920 |
|---|
6/20 | $22,499 | $13,333 |
|---|
7/20 | $24,009 | $14,038 |
|---|
8/20 | $26,763 | $14,897 |
|---|
9/20 | $26,640 | $14,417 |
|---|
10/20 | $26,098 | $14,067 |
|---|
11/20 | $28,953 | $15,800 |
|---|
12/20 | $29,938 | $16,534 |
|---|
1/21 | $29,551 | $16,459 |
|---|
2/21 | $30,619 | $16,840 |
|---|
3/21 | $29,499 | $17,290 |
|---|
4/21 | $31,241 | $18,046 |
|---|
5/21 | $30,700 | $18,327 |
|---|
6/21 | $31,732 | $18,568 |
|---|
7/21 | $30,846 | $18,696 |
|---|
8/21 | $31,483 | $19,164 |
|---|
9/21 | $30,019 | $18,372 |
|---|
10/21 | $31,556 | $19,310 |
|---|
11/21 | $29,719 | $18,845 |
|---|
12/21 | $29,709 | $19,599 |
|---|
1/22 | $26,439 | $18,637 |
|---|
2/22 | $24,390 | $18,155 |
|---|
3/22 | $23,625 | $18,548 |
|---|
4/22 | $20,077 | $17,064 |
|---|
5/22 | $19,041 | $17,084 |
|---|
6/22 | $17,124 | $15,644 |
|---|
7/22 | $19,095 | $16,736 |
|---|
8/22 | $18,608 | $16,120 |
|---|
9/22 | $16,397 | $14,577 |
|---|
10/22 | $16,961 | $15,456 |
|---|
11/22 | $18,546 | $16,655 |
|---|
12/22 | $17,188 | $16,000 |
|---|
1/23 | $19,987 | $17,147 |
|---|
2/23 | $19,422 | $16,655 |
|---|
3/23 | $20,680 | $17,169 |
|---|
4/23 | $20,778 | $17,416 |
|---|
5/23 | $21,555 | $17,229 |
|---|
6/23 | $23,002 | $18,229 |
|---|
7/23 | $24,199 | $18,897 |
|---|
8/23 | $23,359 | $18,369 |
|---|
9/23 | $21,858 | $17,609 |
|---|
10/23 | $21,287 | $17,080 |
|---|
11/23 | $24,440 | $18,656 |
|---|
12/23 | $25,591 | $19,552 |
|---|
1/24 | $26,094 | $19,667 |
|---|
2/24 | $28,506 | $20,511 |
|---|
3/24 | $28,798 | $21,155 |
|---|
4/24 | $27,345 | $20,457 |
|---|
5/24 | $27,482 | $21,288 |
|---|
6/24 | $28,579 | $21,762 |
|---|
7/24 | $27,912 | $22,113 |
|---|
8/24 | $29,684 | $22,674 |
|---|
9/24 | $31,338 | $23,201 |
|---|
10/24 | $31,685 | $22,680 |
|---|
11/24 | $33,567 | $23,529 |
|---|
12/24 | $32,524 | $22,972 |
|---|
|
|
| Average Annual Return [Table Text Block] |
AATR | 1 Year | 5 Years | Since 4/30/15
(Inception) |
|---|
Class C, with conversion to Class A after 8 years | 26.16% | 10.58% | 12.97% |
|---|
Class C, with 1% maximum contingent deferred sales charge and conversion to Class A after 8 years | 25.16% | 10.58% | 12.97% |
|---|
MSCI All Country World Net Index | 17.49% | 10.06% | 8.98% |
|---|
|
|
| Performance Inception Date |
Apr. 30, 2015
|
|
| AssetsNet |
$ 3,093,035,628
|
|
| Holdings Count | Holding |
36
|
|
| Advisory Fees Paid, Amount |
$ 22,188,836
|
|
| InvestmentCompanyPortfolioTurnover |
19.00%
|
|
| Additional Fund Statistics [Text Block] |
Total Net Assets | $3,093,035,628 |
|---|
# of Portfolio Holdings | 36 |
|---|
Portfolio Turnover Rate | 19% |
|---|
Total Advisory Fees Paid | $22,188,836 |
|---|
|
|
| Holdings [Text Block] |
Sector Allocation (% of total investments)Value | Value |
|---|
Short-Term Investments | 5.3% | Industrials | 14.0% | Communication Services | 15.1% | Information Technology | 17.4% | Financials | 18.0% | Consumer Discretionary | 30.2% |
Top Ten Holdings (% of total investments)Footnote ReferenceaServiceNow, Inc. | 6.9% | Meta Platforms, Inc. | 6.8% | DSV AS | 4.8% | Uber Technologies, Inc. | 4.8% | DoorDash, Inc. | 4.6% | MercadoLibre, Inc. | 4.4% | Amazon.com, Inc. | 4.4% | Spotify Technology SA | 4.0% | Schneider Electric SE | 3.6% | ICICI Bank Ltd. | 3.4% | Total | 47.7% |
| Footnote | Description | Footnotea | Excluding cash equivalents. |
|
|
| Material Fund Change [Text Block] |
|
|
| Updated Prospectus Web Address |
<span style="box-sizing: border-box; color: rgb(0, 0, 0); display: inline; flex-wrap: nowrap; font-size: 10.6667px; font-weight: 400; grid-area: auto; line-height: 16px; margin: 0px; overflow: visible; text-align: left;">www.morganstanley.com/im/shareholderreports</span>
|
|
| C000085098 |
|
|
| Shareholder Report [Line Items] |
|
|
| Fund Name |
Morgan Stanley Institutional Fund, Inc. - Global Opportunity Portfolio
|
|
| Class Name |
Class I
|
|
| Trading Symbol |
MGGIX
|
|
| Annual or Semi-Annual Statement [Text Block] |
This annual shareholder report contains important information about Morgan Stanley Institutional Fund, Inc. - Global Opportunity Portfolio for the period of January 1, 2024 to December 31, 2024.
|
|
| Shareholder Report Annual or Semi-Annual |
Annual Shareholder Report
|
|
| Additional Information [Text Block] |
You can find additional information about the Fund at www.morganstanley.com/im/shareholderreports. You can also request this information by contacting us at 1-800-869-6397.
|
|
| Additional Information Phone Number |
1-800-869-6397
|
|
| Additional Information Website |
<span style="box-sizing: border-box; color: rgb(0, 0, 0); display: inline; flex-wrap: nowrap; font-size: 10.6667px; font-weight: 400; grid-area: auto; line-height: 16px; margin: 0px; overflow: visible; text-align: left;">www.morganstanley.com/im/shareholderreports</span>
|
|
| Expenses [Text Block] |
What were the Fund costs for the last year?(based on a hypothetical $10,000 investment) Class Name | Costs of a $10,000 investment | Costs paid as a percentage of a $10,000 investment |
|---|
Class I | $106 | 0.93% |
|---|
|
|
| Expenses Paid, Amount |
$ 106
|
|
| Expense Ratio, Percent |
0.93%
|
|
| Factors Affecting Performance [Text Block] |
How did the Fund perform last year and what affected its performance?Key contributors to (↑) and detractors from (↓) performance, relative to the MSCI All Country World Net Index: ↑ Stock selection in consumer discretionary, led by a holding in an online food delivery platform ↑ Stock selection in communication services, led by a social network, which was the largest positive contributor in the portfolio ↑ No exposure to health care ↓ Stock selection in financials, where exposure to an Indian private sector bank was the main detractor ↓ Stock selection and an underweight allocation to information technology, where a holding in a creative cloud software company was the main detractor ↓ Stock selection in industrials |
|
| Line Graph [Table Text Block] |
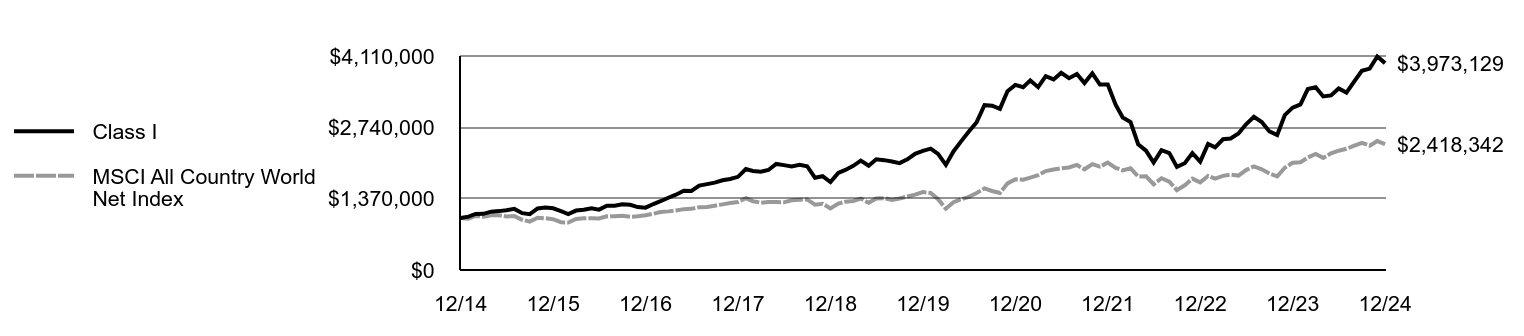 | Class I | MSCI All Country World Net Index |
|---|
12/14 | $1,000,000 | $1,000,000 |
|---|
1/15 | $1,024,320 | $984,369 |
|---|
2/15 | $1,077,253 | $1,039,171 |
|---|
3/15 | $1,077,969 | $1,023,066 |
|---|
4/15 | $1,120,887 | $1,052,752 |
|---|
5/15 | $1,130,901 | $1,051,379 |
|---|
6/15 | $1,149,499 | $1,026,626 |
|---|
7/15 | $1,174,057 | $1,035,542 |
|---|
8/15 | $1,092,146 | $964,555 |
|---|
9/15 | $1,072,027 | $929,611 |
|---|
10/15 | $1,181,960 | $1,002,568 |
|---|
11/15 | $1,199,923 | $994,291 |
|---|
12/15 | $1,184,973 | $976,361 |
|---|
1/16 | $1,129,201 | $917,476 |
|---|
2/16 | $1,075,602 | $911,160 |
|---|
3/16 | $1,141,514 | $978,686 |
|---|
4/16 | $1,158,898 | $993,133 |
|---|
5/16 | $1,187,146 | $994,387 |
|---|
6/16 | $1,159,622 | $988,364 |
|---|
7/16 | $1,232,967 | $1,030,959 |
|---|
8/16 | $1,233,740 | $1,034,426 |
|---|
9/16 | $1,261,569 | $1,040,765 |
|---|
10/16 | $1,252,292 | $1,023,101 |
|---|
11/16 | $1,209,003 | $1,030,876 |
|---|
12/16 | $1,197,416 | $1,053,144 |
|---|
1/17 | $1,266,573 | $1,081,941 |
|---|
2/17 | $1,320,965 | $1,112,291 |
|---|
3/17 | $1,387,791 | $1,125,898 |
|---|
4/17 | $1,446,069 | $1,143,445 |
|---|
5/17 | $1,522,218 | $1,168,695 |
|---|
6/17 | $1,516,779 | $1,174,010 |
|---|
7/17 | $1,620,125 | $1,206,819 |
|---|
8/17 | $1,649,653 | $1,211,443 |
|---|
9/17 | $1,678,403 | $1,234,848 |
|---|
10/17 | $1,724,248 | $1,260,490 |
|---|
11/17 | $1,746,783 | $1,284,891 |
|---|
12/17 | $1,789,439 | $1,305,605 |
|---|
1/18 | $1,939,209 | $1,379,263 |
|---|
2/18 | $1,900,986 | $1,321,337 |
|---|
3/18 | $1,889,285 | $1,293,051 |
|---|
4/18 | $1,920,487 | $1,305,399 |
|---|
5/18 | $2,036,715 | $1,307,029 |
|---|
6/18 | $2,014,094 | $1,299,951 |
|---|
7/18 | $1,990,418 | $1,339,153 |
|---|
8/18 | $2,019,469 | $1,349,674 |
|---|
9/18 | $1,993,558 | $1,355,548 |
|---|
10/18 | $1,772,924 | $1,253,965 |
|---|
11/18 | $1,801,190 | $1,272,304 |
|---|
12/18 | $1,688,125 | $1,182,690 |
|---|
1/19 | $1,865,575 | $1,276,075 |
|---|
2/19 | $1,922,107 | $1,310,206 |
|---|
3/19 | $1,999,840 | $1,326,684 |
|---|
4/19 | $2,100,342 | $1,371,480 |
|---|
5/19 | $2,002,980 | $1,290,125 |
|---|
6/19 | $2,126,253 | $1,374,602 |
|---|
7/19 | $2,109,764 | $1,378,630 |
|---|
8/19 | $2,084,638 | $1,345,925 |
|---|
9/19 | $2,051,661 | $1,374,246 |
|---|
10/19 | $2,124,682 | $1,411,857 |
|---|
11/19 | $2,231,466 | $1,446,323 |
|---|
12/19 | $2,286,428 | $1,497,255 |
|---|
1/20 | $2,331,968 | $1,480,717 |
|---|
2/20 | $2,229,111 | $1,361,120 |
|---|
3/20 | $2,018,684 | $1,177,364 |
|---|
4/20 | $2,277,006 | $1,303,489 |
|---|
5/20 | $2,474,870 | $1,360,179 |
|---|
6/20 | $2,657,816 | $1,403,640 |
|---|
7/20 | $2,839,191 | $1,477,875 |
|---|
8/20 | $3,168,179 | $1,568,328 |
|---|
9/20 | $3,155,617 | $1,517,760 |
|---|
10/20 | $3,094,373 | $1,480,866 |
|---|
11/20 | $3,435,139 | $1,663,401 |
|---|
12/20 | $3,554,776 | $1,740,632 |
|---|
1/21 | $3,511,880 | $1,732,716 |
|---|
2/21 | $3,641,362 | $1,772,851 |
|---|
3/21 | $3,511,880 | $1,820,203 |
|---|
4/21 | $3,721,592 | $1,899,787 |
|---|
5/21 | $3,660,426 | $1,929,352 |
|---|
6/21 | $3,785,936 | $1,954,776 |
|---|
7/21 | $3,684,257 | $1,968,246 |
|---|
8/21 | $3,763,694 | $2,017,510 |
|---|
9/21 | $3,591,317 | $1,934,167 |
|---|
10/21 | $3,777,992 | $2,032,894 |
|---|
11/21 | $3,561,131 | $1,983,941 |
|---|
12/21 | $3,562,505 | $2,063,299 |
|---|
1/22 | $3,173,626 | $1,961,966 |
|---|
2/22 | $2,929,115 | $1,911,293 |
|---|
3/22 | $2,839,823 | $1,952,690 |
|---|
4/22 | $2,415,060 | $1,796,393 |
|---|
5/22 | $2,293,222 | $1,798,496 |
|---|
6/22 | $2,063,733 | $1,646,889 |
|---|
7/22 | $2,303,236 | $1,761,895 |
|---|
8/22 | $2,246,490 | $1,697,031 |
|---|
9/22 | $1,981,117 | $1,534,576 |
|---|
10/22 | $2,051,215 | $1,627,183 |
|---|
11/22 | $2,243,986 | $1,753,393 |
|---|
12/22 | $2,082,749 | $1,684,395 |
|---|
1/23 | $2,422,706 | $1,805,127 |
|---|
2/23 | $2,356,148 | $1,753,392 |
|---|
3/23 | $2,510,767 | $1,807,454 |
|---|
4/23 | $2,525,103 | $1,833,431 |
|---|
5/23 | $2,620,332 | $1,813,794 |
|---|
6/23 | $2,798,502 | $1,919,105 |
|---|
7/23 | $2,943,905 | $1,989,360 |
|---|
8/23 | $2,842,533 | $1,933,769 |
|---|
9/23 | $2,661,290 | $1,853,806 |
|---|
10/23 | $2,591,661 | $1,798,068 |
|---|
11/23 | $2,975,648 | $1,964,022 |
|---|
12/23 | $3,117,859 | $2,058,362 |
|---|
1/24 | $3,179,567 | $2,070,429 |
|---|
2/24 | $3,474,514 | $2,159,278 |
|---|
3/24 | $3,511,121 | $2,227,072 |
|---|
4/24 | $3,333,316 | $2,153,594 |
|---|
5/24 | $3,352,143 | $2,241,060 |
|---|
6/24 | $3,486,019 | $2,290,973 |
|---|
7/24 | $3,406,530 | $2,327,921 |
|---|
8/24 | $3,623,033 | $2,387,042 |
|---|
9/24 | $3,825,940 | $2,442,495 |
|---|
10/24 | $3,868,822 | $2,387,669 |
|---|
11/24 | $4,099,969 | $2,476,977 |
|---|
12/24 | $3,973,129 | $2,418,342 |
|---|
|
|
| Average Annual Return [Table Text Block] |
AATR | 1 Year | 5 Years | 10 Years |
|---|
Class I | 27.43% | 11.69% | 14.79% |
|---|
MSCI All Country World Net Index | 17.49% | 10.06% | 9.23% |
|---|
|
|
| AssetsNet |
$ 3,093,035,628
|
|
| Holdings Count | Holding |
36
|
|
| Advisory Fees Paid, Amount |
$ 22,188,836
|
|
| InvestmentCompanyPortfolioTurnover |
19.00%
|
|
| Additional Fund Statistics [Text Block] |
Total Net Assets | $3,093,035,628 |
|---|
# of Portfolio Holdings | 36 |
|---|
Portfolio Turnover Rate | 19% |
|---|
Total Advisory Fees Paid | $22,188,836 |
|---|
|
|
| Holdings [Text Block] |
Sector Allocation (% of total investments)Value | Value |
|---|
Short-Term Investments | 5.3% | Industrials | 14.0% | Communication Services | 15.1% | Information Technology | 17.4% | Financials | 18.0% | Consumer Discretionary | 30.2% |
Top Ten Holdings (% of total investments)Footnote ReferenceaServiceNow, Inc. | 6.9% | Meta Platforms, Inc. | 6.8% | DSV AS | 4.8% | Uber Technologies, Inc. | 4.8% | DoorDash, Inc. | 4.6% | MercadoLibre, Inc. | 4.4% | Amazon.com, Inc. | 4.4% | Spotify Technology SA | 4.0% | Schneider Electric SE | 3.6% | ICICI Bank Ltd. | 3.4% | Total | 47.7% |
| Footnote | Description | Footnotea | Excluding cash equivalents. |
|
|
| Material Fund Change [Text Block] |
|
|
| Updated Prospectus Web Address |
<span style="box-sizing: border-box; color: rgb(0, 0, 0); display: inline; flex-wrap: nowrap; font-size: 10.6667px; font-weight: 400; grid-area: auto; line-height: 16px; margin: 0px; overflow: visible; text-align: left;">www.morganstanley.com/im/shareholderreports</span>
|
|
| C000198822 |
|
|
| Shareholder Report [Line Items] |
|
|
| Fund Name |
Morgan Stanley Institutional Fund, Inc. - Global Opportunity Portfolio
|
|
| Class Name |
Class IR
|
|
| Trading Symbol |
MGORX
|
|
| Annual or Semi-Annual Statement [Text Block] |
This annual shareholder report contains important information about Morgan Stanley Institutional Fund, Inc. - Global Opportunity Portfolio for the period of January 1, 2024 to December 31, 2024.
|
|
| Shareholder Report Annual or Semi-Annual |
Annual Shareholder Report
|
|
| Additional Information [Text Block] |
You can find additional information about the Fund at www.morganstanley.com/im/shareholderreports. You can also request this information by contacting us at 1-800-869-6397.
|
|
| Additional Information Phone Number |
1-800-869-6397
|
|
| Additional Information Website |
<span style="box-sizing: border-box; color: rgb(0, 0, 0); display: inline; flex-wrap: nowrap; font-size: 10.6667px; font-weight: 400; grid-area: auto; line-height: 16px; margin: 0px; overflow: visible; text-align: left;">www.morganstanley.com/im/shareholderreports</span>
|
|
| Expenses [Text Block] |
What were the Fund costs for the last year?(based on a hypothetical $10,000 investment) Class Name | Costs of a $10,000 investment | Costs paid as a percentage of a $10,000 investment |
|---|
Class IR | $97 | 0.85% |
|---|
|
|
| Expenses Paid, Amount |
$ 97
|
|
| Expense Ratio, Percent |
0.85%
|
|
| Factors Affecting Performance [Text Block] |
How did the Fund perform last year and what affected its performance?Key contributors to (↑) and detractors from (↓) performance, relative to the MSCI All Country World Net Index: ↑ Stock selection in consumer discretionary, led by a holding in an online food delivery platform ↑ Stock selection in communication services, led by a social network, which was the largest positive contributor in the portfolio ↑ No exposure to health care ↓ Stock selection in financials, where exposure to an Indian private sector bank was the main detractor ↓ Stock selection and an underweight allocation to information technology, where a holding in a creative cloud software company was the main detractor ↓ Stock selection in industrials |
|
| Line Graph [Table Text Block] |
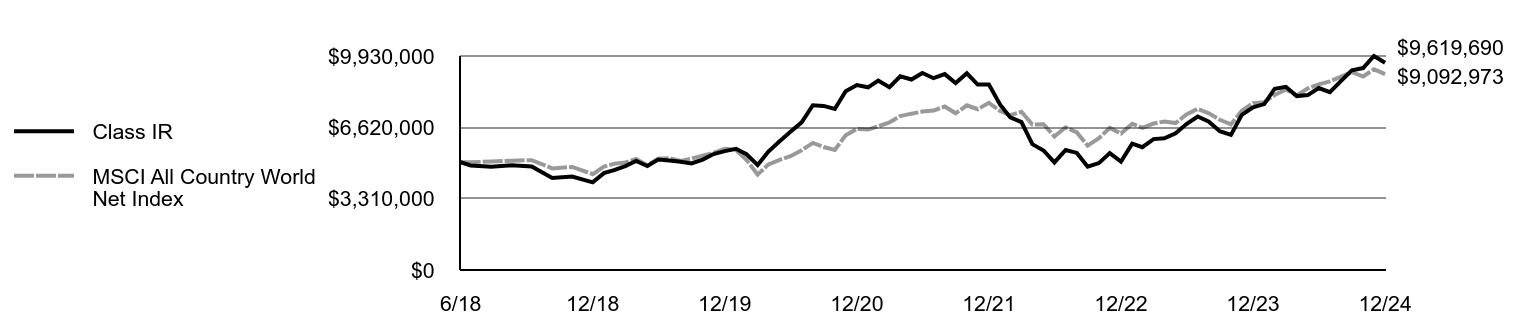 | Class IR | MSCI All Country World Net Index |
|---|
6/18 | $5,000,000 | $5,000,000 |
|---|
6/18 | $4,850,019 | $5,000,000 |
|---|
7/18 | $4,795,004 | $5,035,219 |
|---|
8/18 | $4,864,825 | $5,074,777 |
|---|
9/18 | $4,802,553 | $5,096,864 |
|---|
10/18 | $4,270,403 | $4,714,910 |
|---|
11/18 | $4,340,224 | $4,783,868 |
|---|
12/18 | $4,068,489 | $4,446,918 |
|---|
1/19 | $4,496,850 | $4,798,045 |
|---|
2/19 | $4,632,718 | $4,926,379 |
|---|
3/19 | $4,819,536 | $4,988,333 |
|---|
4/19 | $5,062,966 | $5,156,768 |
|---|
5/19 | $4,827,084 | $4,850,873 |
|---|
6/19 | $5,125,239 | $5,168,506 |
|---|
7/19 | $5,085,611 | $5,183,651 |
|---|
8/19 | $5,025,225 | $5,060,683 |
|---|
9/19 | $4,945,969 | $5,167,168 |
|---|
10/19 | $5,123,352 | $5,308,586 |
|---|
11/19 | $5,381,878 | $5,438,177 |
|---|
12/19 | $5,513,972 | $5,629,683 |
|---|
1/20 | $5,625,308 | $5,567,498 |
|---|
2/20 | $5,378,104 | $5,117,812 |
|---|
3/20 | $4,870,487 | $4,426,891 |
|---|
4/20 | $5,493,214 | $4,901,122 |
|---|
5/20 | $5,970,639 | $5,114,277 |
|---|
6/20 | $6,414,097 | $5,277,690 |
|---|
7/20 | $6,850,006 | $5,556,812 |
|---|
8/20 | $7,644,456 | $5,896,917 |
|---|
9/20 | $7,614,263 | $5,706,782 |
|---|
10/20 | $7,468,960 | $5,568,058 |
|---|
11/20 | $8,291,716 | $6,254,393 |
|---|
12/20 | $8,583,060 | $6,544,781 |
|---|
1/21 | $8,478,062 | $6,515,015 |
|---|
2/21 | $8,793,054 | $6,665,925 |
|---|
3/21 | $8,479,971 | $6,843,968 |
|---|
4/21 | $8,987,777 | $7,143,203 |
|---|
5/21 | $8,838,872 | $7,254,369 |
|---|
6/21 | $9,144,318 | $7,349,962 |
|---|
7/21 | $8,899,961 | $7,400,609 |
|---|
8/21 | $9,090,865 | $7,585,841 |
|---|
9/21 | $8,676,603 | $7,272,472 |
|---|
10/21 | $9,127,137 | $7,643,684 |
|---|
11/21 | $8,604,059 | $7,459,621 |
|---|
12/21 | $8,609,306 | $7,758,010 |
|---|
1/22 | $7,668,979 | $7,376,995 |
|---|
2/22 | $7,079,520 | $7,186,468 |
|---|
3/22 | $6,864,989 | $7,342,119 |
|---|
4/22 | $5,838,449 | $6,754,443 |
|---|
5/22 | $5,543,719 | $6,762,347 |
|---|
6/22 | $4,990,350 | $6,192,306 |
|---|
7/22 | $5,569,784 | $6,624,730 |
|---|
8/22 | $5,433,446 | $6,380,842 |
|---|
9/22 | $4,791,859 | $5,770,008 |
|---|
10/22 | $4,960,275 | $6,118,211 |
|---|
11/22 | $5,427,432 | $6,592,760 |
|---|
12/22 | $5,035,664 | $6,333,329 |
|---|
1/23 | $5,861,022 | $6,787,282 |
|---|
2/23 | $5,698,898 | $6,592,758 |
|---|
3/23 | $6,074,731 | $6,796,030 |
|---|
4/23 | $6,109,121 | $6,893,706 |
|---|
5/23 | $6,340,024 | $6,819,871 |
|---|
6/23 | $6,769,898 | $7,215,839 |
|---|
7/23 | $7,123,623 | $7,479,997 |
|---|
8/23 | $6,877,981 | $7,270,976 |
|---|
9/23 | $6,438,281 | $6,970,315 |
|---|
10/23 | $6,271,245 | $6,760,740 |
|---|
11/23 | $7,202,228 | $7,384,728 |
|---|
12/23 | $7,545,830 | $7,739,446 |
|---|
1/24 | $7,696,345 | $7,784,816 |
|---|
2/24 | $8,411,292 | $8,118,889 |
|---|
3/24 | $8,499,093 | $8,373,797 |
|---|
4/24 | $8,070,124 | $8,097,520 |
|---|
5/24 | $8,115,279 | $8,426,390 |
|---|
6/24 | $8,441,395 | $8,614,063 |
|---|
7/24 | $8,248,234 | $8,752,986 |
|---|
8/24 | $8,775,037 | $8,975,282 |
|---|
9/24 | $9,264,212 | $9,183,787 |
|---|
10/24 | $9,369,572 | $8,977,640 |
|---|
11/24 | $9,928,987 | $9,313,437 |
|---|
12/24 | $9,619,690 | $9,092,973 |
|---|
|
|
| Average Annual Return [Table Text Block] |
AATR | 1 Year | 5 Years | Since 6/15/18
(Inception) |
|---|
Class IR | 27.48% | 11.77% | 10.51% |
|---|
MSCI All Country World Net Index | 17.49% | 10.06% | 9.57% |
|---|
|
|
| Performance Inception Date |
Jun. 15, 2018
|
|
| AssetsNet |
$ 3,093,035,628
|
|
| Holdings Count | Holding |
36
|
|
| Advisory Fees Paid, Amount |
$ 22,188,836
|
|
| InvestmentCompanyPortfolioTurnover |
19.00%
|
|
| Additional Fund Statistics [Text Block] |
Total Net Assets | $3,093,035,628 |
|---|
# of Portfolio Holdings | 36 |
|---|
Portfolio Turnover Rate | 19% |
|---|
Total Advisory Fees Paid | $22,188,836 |
|---|
|
|
| Holdings [Text Block] |
Sector Allocation (% of total investments)Value | Value |
|---|
Short-Term Investments | 5.3% | Industrials | 14.0% | Communication Services | 15.1% | Information Technology | 17.4% | Financials | 18.0% | Consumer Discretionary | 30.2% |
Top Ten Holdings (% of total investments)Footnote ReferenceaServiceNow, Inc. | 6.9% | Meta Platforms, Inc. | 6.8% | DSV AS | 4.8% | Uber Technologies, Inc. | 4.8% | DoorDash, Inc. | 4.6% | MercadoLibre, Inc. | 4.4% | Amazon.com, Inc. | 4.4% | Spotify Technology SA | 4.0% | Schneider Electric SE | 3.6% | ICICI Bank Ltd. | 3.4% | Total | 47.7% |
| Footnote | Description | Footnotea | Excluding cash equivalents. |
|
|
| Material Fund Change [Text Block] |
|
|
| Updated Prospectus Web Address |
<span style="box-sizing: border-box; color: rgb(0, 0, 0); display: inline; flex-wrap: nowrap; font-size: 10.6667px; font-weight: 400; grid-area: auto; line-height: 16px; margin: 0px; overflow: visible; text-align: left;">www.morganstanley.com/im/shareholderreports</span>
|
|
| C000085099 |
|
|
| Shareholder Report [Line Items] |
|
|
| Fund Name |
Morgan Stanley Institutional Fund, Inc. - Global Opportunity Portfolio
|
|
| Class Name |
Class L
|
|
| Trading Symbol |
MGGLX
|
|
| Annual or Semi-Annual Statement [Text Block] |
This annual shareholder report contains important information about Morgan Stanley Institutional Fund, Inc. - Global Opportunity Portfolio for the period of January 1, 2024 to December 31, 2024.
|
|
| Shareholder Report Annual or Semi-Annual |
Annual Shareholder Report
|
|
| Additional Information [Text Block] |
You can find additional information about the Fund at www.morganstanley.com/im/shareholderreports. You can also request this information by contacting us at 1-800-869-6397.
|
|
| Additional Information Phone Number |
1-800-869-6397
|
|
| Additional Information Website |
<span style="box-sizing: border-box; color: rgb(0, 0, 0); display: inline; flex-wrap: nowrap; font-size: 10.6667px; font-weight: 400; grid-area: auto; line-height: 16px; margin: 0px; overflow: visible; text-align: left;">www.morganstanley.com/im/shareholderreports</span>
|
|
| Expenses [Text Block] |
What were the Fund costs for the last year?(based on a hypothetical $10,000 investment) Class Name | Costs of a $10,000 investment | Costs paid as a percentage of a $10,000 investment |
|---|
Class L | $146 | 1.29% |
|---|
|
|
| Expenses Paid, Amount |
$ 146
|
|
| Expense Ratio, Percent |
1.29%
|
|
| Factors Affecting Performance [Text Block] |
How did the Fund perform last year and what affected its performance?Key contributors to (↑) and detractors from (↓) performance, relative to the MSCI All Country World Net Index: ↑ Stock selection in consumer discretionary, led by a holding in an online food delivery platform ↑ Stock selection in communication services, led by a social network, which was the largest positive contributor in the portfolio ↑ No exposure to health care ↓ Stock selection in financials, where exposure to an Indian private sector bank was the main detractor ↓ Stock selection and an underweight allocation to information technology, where a holding in a creative cloud software company was the main detractor ↓ Stock selection in industrials |
|
| Line Graph [Table Text Block] |
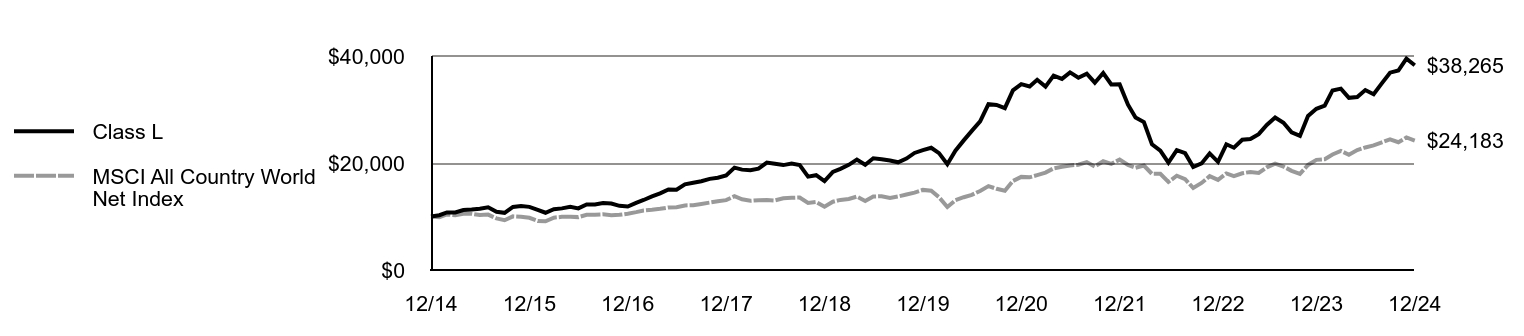 | Class L | MSCI All Country World Net Index |
|---|
12/14 | $10,000 | $10,000 |
|---|
1/15 | $10,235 | $9,844 |
|---|
2/15 | $10,764 | $10,392 |
|---|
3/15 | $10,764 | $10,231 |
|---|
4/15 | $11,197 | $10,528 |
|---|
5/15 | $11,292 | $10,514 |
|---|
6/15 | $11,468 | $10,266 |
|---|
7/15 | $11,713 | $10,355 |
|---|
8/15 | $10,894 | $9,646 |
|---|
9/15 | $10,688 | $9,296 |
|---|
10/15 | $11,787 | $10,026 |
|---|
11/15 | $11,957 | $9,943 |
|---|
12/15 | $11,803 | $9,764 |
|---|
1/16 | $11,238 | $9,175 |
|---|
2/16 | $10,702 | $9,112 |
|---|
3/16 | $11,357 | $9,787 |
|---|
4/16 | $11,520 | $9,931 |
|---|
5/16 | $11,803 | $9,944 |
|---|
6/16 | $11,520 | $9,884 |
|---|
7/16 | $12,244 | $10,310 |
|---|
8/16 | $12,251 | $10,344 |
|---|
9/16 | $12,522 | $10,408 |
|---|
10/16 | $12,426 | $10,231 |
|---|
11/16 | $11,997 | $10,309 |
|---|
12/16 | $11,870 | $10,531 |
|---|
1/17 | $12,558 | $10,819 |
|---|
2/17 | $13,085 | $11,123 |
|---|
3/17 | $13,749 | $11,259 |
|---|
4/17 | $14,317 | $11,434 |
|---|
5/17 | $15,061 | $11,687 |
|---|
6/17 | $15,013 | $11,740 |
|---|
7/17 | $16,021 | $12,068 |
|---|
8/17 | $16,309 | $12,114 |
|---|
9/17 | $16,589 | $12,348 |
|---|
10/17 | $17,037 | $12,605 |
|---|
11/17 | $17,253 | $12,849 |
|---|
12/17 | $17,676 | $13,056 |
|---|
1/18 | $19,137 | $13,793 |
|---|
2/18 | $18,760 | $13,213 |
|---|
3/18 | $18,639 | $12,931 |
|---|
4/18 | $18,945 | $13,054 |
|---|
5/18 | $20,077 | $13,070 |
|---|
6/18 | $19,844 | $13,000 |
|---|
7/18 | $19,608 | $13,392 |
|---|
8/18 | $19,891 | $13,497 |
|---|
9/18 | $19,633 | $13,555 |
|---|
10/18 | $17,449 | $12,540 |
|---|
11/18 | $17,724 | $12,723 |
|---|
12/18 | $16,608 | $11,827 |
|---|
1/19 | $18,347 | $12,761 |
|---|
2/19 | $18,897 | $13,102 |
|---|
3/19 | $19,649 | $13,267 |
|---|
4/19 | $20,635 | $13,715 |
|---|
5/19 | $19,673 | $12,901 |
|---|
6/19 | $20,878 | $13,746 |
|---|
7/19 | $20,708 | $13,786 |
|---|
8/19 | $20,457 | $13,459 |
|---|
9/19 | $20,126 | $13,742 |
|---|
10/19 | $20,837 | $14,119 |
|---|
11/19 | $21,880 | $14,463 |
|---|
12/19 | $22,414 | $14,973 |
|---|
1/20 | $22,851 | $14,807 |
|---|
2/20 | $21,840 | $13,611 |
|---|
3/20 | $19,778 | $11,774 |
|---|
4/20 | $22,293 | $13,035 |
|---|
5/20 | $24,225 | $13,602 |
|---|
6/20 | $26,012 | $14,036 |
|---|
7/20 | $27,775 | $14,779 |
|---|
8/20 | $30,985 | $15,683 |
|---|
9/20 | $30,856 | $15,178 |
|---|
10/20 | $30,249 | $14,809 |
|---|
11/20 | $33,573 | $16,634 |
|---|
12/20 | $34,740 | $17,406 |
|---|
1/21 | $34,306 | $17,327 |
|---|
2/21 | $35,559 | $17,729 |
|---|
3/21 | $34,282 | $18,202 |
|---|
4/21 | $36,328 | $18,998 |
|---|
5/21 | $35,714 | $19,294 |
|---|
6/21 | $36,934 | $19,548 |
|---|
7/21 | $35,935 | $19,682 |
|---|
8/21 | $36,696 | $20,175 |
|---|
9/21 | $35,010 | $19,342 |
|---|
10/21 | $36,811 | $20,329 |
|---|
11/21 | $34,691 | $19,839 |
|---|
12/21 | $34,697 | $20,633 |
|---|
1/22 | $30,893 | $19,620 |
|---|
2/22 | $28,513 | $19,113 |
|---|
3/22 | $27,642 | $19,527 |
|---|
4/22 | $23,493 | $17,964 |
|---|
5/22 | $22,303 | $17,985 |
|---|
6/22 | $20,069 | $16,469 |
|---|
7/22 | $22,389 | $17,619 |
|---|
8/22 | $21,829 | $16,970 |
|---|
9/22 | $19,241 | $15,346 |
|---|
10/22 | $19,914 | $16,272 |
|---|
11/22 | $21,786 | $17,534 |
|---|
12/22 | $20,202 | $16,844 |
|---|
1/23 | $23,499 | $18,051 |
|---|
2/23 | $22,855 | $17,534 |
|---|
3/23 | $24,337 | $18,075 |
|---|
4/23 | $24,477 | $18,334 |
|---|
5/23 | $25,390 | $18,138 |
|---|
6/23 | $27,097 | $19,191 |
|---|
7/23 | $28,504 | $19,894 |
|---|
8/23 | $27,516 | $19,338 |
|---|
9/23 | $25,744 | $18,538 |
|---|
10/23 | $25,057 | $17,981 |
|---|
11/23 | $28,773 | $19,640 |
|---|
12/23 | $30,136 | $20,584 |
|---|
1/24 | $30,718 | $20,704 |
|---|
2/24 | $33,565 | $21,593 |
|---|
3/24 | $33,905 | $22,271 |
|---|
4/24 | $32,180 | $21,536 |
|---|
5/24 | $32,345 | $22,411 |
|---|
6/24 | $33,631 | $22,910 |
|---|
7/24 | $32,850 | $23,279 |
|---|
8/24 | $34,938 | $23,870 |
|---|
9/24 | $36,884 | $24,425 |
|---|
10/24 | $37,279 | $23,877 |
|---|
11/24 | $39,499 | $24,770 |
|---|
12/24 | $38,265 | $24,183 |
|---|
|
|
| Average Annual Return [Table Text Block] |
AATR | 1 Year | 5 Years | 10 Years |
|---|
Class L | 26.98% | 11.29% | 14.36% |
|---|
MSCI All Country World Net Index | 17.49% | 10.06% | 9.23% |
|---|
|
|
| AssetsNet |
$ 3,093,035,628
|
|
| Holdings Count | Holding |
36
|
|
| Advisory Fees Paid, Amount |
$ 22,188,836
|
|
| InvestmentCompanyPortfolioTurnover |
19.00%
|
|
| Additional Fund Statistics [Text Block] |
Total Net Assets | $3,093,035,628 |
|---|
# of Portfolio Holdings | 36 |
|---|
Portfolio Turnover Rate | 19% |
|---|
Total Advisory Fees Paid | $22,188,836 |
|---|
|
|
| Holdings [Text Block] |
Sector Allocation (% of total investments)Value | Value |
|---|
Short-Term Investments | 5.3% | Industrials | 14.0% | Communication Services | 15.1% | Information Technology | 17.4% | Financials | 18.0% | Consumer Discretionary | 30.2% |
Top Ten Holdings (% of total investments)Footnote ReferenceaServiceNow, Inc. | 6.9% | Meta Platforms, Inc. | 6.8% | DSV AS | 4.8% | Uber Technologies, Inc. | 4.8% | DoorDash, Inc. | 4.6% | MercadoLibre, Inc. | 4.4% | Amazon.com, Inc. | 4.4% | Spotify Technology SA | 4.0% | Schneider Electric SE | 3.6% | ICICI Bank Ltd. | 3.4% | Total | 47.7% |
| Footnote | Description | Footnotea | Excluding cash equivalents. |
|
|
| Material Fund Change [Text Block] |
|
|
| Updated Prospectus Web Address |
<span style="box-sizing: border-box; color: rgb(0, 0, 0); display: inline; flex-wrap: nowrap; font-size: 10.6667px; font-weight: 400; grid-area: auto; line-height: 16px; margin: 0px; overflow: visible; text-align: left;">www.morganstanley.com/im/shareholderreports</span>
|
|
| C000126921 |
|
|
| Shareholder Report [Line Items] |
|
|
| Fund Name |
Morgan Stanley Institutional Fund, Inc. - Global Opportunity Portfolio
|
|
| Class Name |
Class R6
|
|
| Trading Symbol |
MGTSX
|
|
| Annual or Semi-Annual Statement [Text Block] |
This annual shareholder report contains important information about Morgan Stanley Institutional Fund, Inc. - Global Opportunity Portfolio for the period of January 1, 2024 to December 31, 2024.
|
|
| Shareholder Report Annual or Semi-Annual |
Annual Shareholder Report
|
|
| Additional Information [Text Block] |
You can find additional information about the Fund at www.morganstanley.com/im/shareholderreports. You can also request this information by contacting us at 1-800-869-6397.
|
|
| Additional Information Phone Number |
1-800-869-6397
|
|
| Additional Information Website |
<span style="box-sizing: border-box; color: rgb(0, 0, 0); display: inline; flex-wrap: nowrap; font-size: 10.6667px; font-weight: 400; grid-area: auto; line-height: 16px; margin: 0px; overflow: visible; text-align: left;">www.morganstanley.com/im/shareholderreports</span>
|
|
| Expenses [Text Block] |
What were the Fund costs for the last year?(based on a hypothetical $10,000 investment) Class Name | Costs of a $10,000 investment | Costs paid as a percentage of a $10,000 investment |
|---|
Class R6 | $97 | 0.85% |
|---|
|
|
| Expenses Paid, Amount |
$ 97
|
|
| Expense Ratio, Percent |
0.85%
|
|
| Factors Affecting Performance [Text Block] |
How did the Fund perform last year and what affected its performance?Key contributors to (↑) and detractors from (↓) performance, relative to the MSCI All Country World Net Index: ↑ Stock selection in consumer discretionary, led by a holding in an online food delivery platform ↑ Stock selection in communication services, led by a social network, which was the largest positive contributor in the portfolio ↑ No exposure to health care ↓ Stock selection in financials, where exposure to an Indian private sector bank was the main detractor ↓ Stock selection and an underweight allocation to information technology, where a holding in a creative cloud software company was the main detractor ↓ Stock selection in industrials |
|
| Line Graph [Table Text Block] |
 | Class R6 | MSCI All Country World Net Index |
|---|
12/14 | $5,000,000 | $5,000,000 |
|---|
1/15 | $5,121,602 | $4,921,847 |
|---|
2/15 | $5,389,843 | $5,195,853 |
|---|
3/15 | $5,389,843 | $5,115,328 |
|---|
4/15 | $5,608,011 | $5,263,762 |
|---|
5/15 | $5,658,083 | $5,256,895 |
|---|
6/15 | $5,747,496 | $5,133,131 |
|---|
7/15 | $5,873,860 | $5,177,710 |
|---|
8/15 | $5,464,306 | $4,822,776 |
|---|
9/15 | $5,360,122 | $4,648,053 |
|---|
10/15 | $5,913,378 | $5,012,840 |
|---|
11/15 | $6,003,192 | $4,971,453 |
|---|
12/15 | $5,932,064 | $4,881,803 |
|---|
1/16 | $5,649,585 | $4,587,378 |
|---|
2/16 | $5,381,592 | $4,555,802 |
|---|
3/16 | $5,714,772 | $4,893,431 |
|---|
4/16 | $5,798,067 | $4,965,663 |
|---|
5/16 | $5,942,928 | $4,971,937 |
|---|
6/16 | $5,805,310 | $4,941,819 |
|---|
7/16 | $6,171,997 | $5,154,794 |
|---|
8/16 | $6,179,727 | $5,172,128 |
|---|
9/16 | $6,314,993 | $5,203,826 |
|---|
10/16 | $6,272,481 | $5,115,503 |
|---|
11/16 | $6,056,055 | $5,154,379 |
|---|
12/16 | $5,998,126 | $5,265,722 |
|---|
1/17 | $6,343,873 | $5,409,704 |
|---|
2/17 | $6,615,809 | $5,561,453 |
|---|
3/17 | $6,953,786 | $5,629,489 |
|---|
4/17 | $7,245,146 | $5,717,223 |
|---|
5/17 | $7,625,856 | $5,843,475 |
|---|
6/17 | $7,598,662 | $5,870,048 |
|---|
7/17 | $8,115,340 | $6,034,097 |
|---|
8/17 | $8,262,963 | $6,057,214 |
|---|
9/17 | $8,410,585 | $6,174,239 |
|---|
10/17 | $8,639,788 | $6,302,449 |
|---|
11/17 | $8,752,447 | $6,424,454 |
|---|
12/17 | $8,969,605 | $6,528,027 |
|---|
1/18 | $9,718,372 | $6,896,316 |
|---|
2/18 | $9,527,280 | $6,606,683 |
|---|
3/18 | $9,468,783 | $6,465,255 |
|---|
4/18 | $9,624,776 | $6,526,995 |
|---|
5/18 | $10,205,851 | $6,535,144 |
|---|
6/18 | $10,092,756 | $6,499,754 |
|---|
7/18 | $9,970,466 | $6,695,765 |
|---|
8/18 | $10,115,705 | $6,748,370 |
|---|
9/18 | $9,986,168 | $6,777,740 |
|---|
10/18 | $8,879,210 | $6,269,824 |
|---|
11/18 | $9,020,524 | $6,361,522 |
|---|
12/18 | $8,451,344 | $5,913,452 |
|---|
1/19 | $9,342,405 | $6,380,376 |
|---|
2/19 | $9,625,033 | $6,551,032 |
|---|
3/19 | $10,013,645 | $6,633,418 |
|---|
4/19 | $10,520,019 | $6,857,400 |
|---|
5/19 | $10,029,347 | $6,450,625 |
|---|
6/19 | $10,645,632 | $6,873,010 |
|---|
7/19 | $10,567,124 | $6,893,149 |
|---|
8/19 | $10,441,512 | $6,729,627 |
|---|
9/19 | $10,276,646 | $6,871,229 |
|---|
10/19 | $10,641,706 | $7,059,286 |
|---|
11/19 | $11,179,483 | $7,231,614 |
|---|
12/19 | $11,454,260 | $7,486,276 |
|---|
1/20 | $11,685,857 | $7,403,583 |
|---|
2/20 | $11,171,633 | $6,805,598 |
|---|
3/20 | $10,119,631 | $5,886,819 |
|---|
4/20 | $11,411,081 | $6,517,445 |
|---|
5/20 | $12,404,202 | $6,800,896 |
|---|
6/20 | $13,326,666 | $7,018,201 |
|---|
7/20 | $14,233,429 | $7,389,373 |
|---|
8/20 | $15,882,089 | $7,841,640 |
|---|
9/20 | $15,819,283 | $7,588,801 |
|---|
10/20 | $15,517,029 | $7,404,328 |
|---|
11/20 | $17,228,495 | $8,317,007 |
|---|
12/20 | $17,830,569 | $8,703,161 |
|---|
1/21 | $17,612,155 | $8,663,579 |
|---|
2/21 | $18,267,398 | $8,864,257 |
|---|
3/21 | $17,616,126 | $9,101,015 |
|---|
4/21 | $18,672,458 | $9,498,935 |
|---|
5/21 | $18,362,707 | $9,646,761 |
|---|
6/21 | $18,998,094 | $9,773,880 |
|---|
7/21 | $18,485,813 | $9,841,229 |
|---|
8/21 | $18,886,901 | $10,087,549 |
|---|
9/21 | $18,025,157 | $9,670,834 |
|---|
10/21 | $18,962,354 | $10,164,468 |
|---|
11/21 | $17,874,252 | $9,919,703 |
|---|
12/21 | $17,889,164 | $10,316,496 |
|---|
1/22 | $15,932,993 | $9,809,828 |
|---|
2/22 | $14,710,908 | $9,556,467 |
|---|
3/22 | $14,264,617 | $9,763,451 |
|---|
4/22 | $12,133,266 | $8,981,966 |
|---|
5/22 | $11,520,138 | $8,992,478 |
|---|
6/22 | $10,368,958 | $8,234,445 |
|---|
7/22 | $11,574,360 | $8,809,477 |
|---|
8/22 | $11,286,565 | $8,485,157 |
|---|
9/22 | $9,951,864 | $7,672,878 |
|---|
10/22 | $10,306,394 | $8,135,914 |
|---|
11/22 | $11,278,223 | $8,766,963 |
|---|
12/22 | $10,463,197 | $8,421,975 |
|---|
1/23 | $12,175,542 | $9,025,635 |
|---|
2/23 | $11,843,296 | $8,766,961 |
|---|
3/23 | $12,620,241 | $9,037,269 |
|---|
4/23 | $12,691,801 | $9,167,157 |
|---|
5/23 | $13,172,280 | $9,068,972 |
|---|
6/23 | $14,066,789 | $9,595,525 |
|---|
7/23 | $14,797,731 | $9,946,798 |
|---|
8/23 | $14,291,694 | $9,668,845 |
|---|
9/23 | $13,376,740 | $9,269,031 |
|---|
10/23 | $13,029,159 | $8,990,340 |
|---|
11/23 | $14,966,409 | $9,820,111 |
|---|
12/23 | $15,676,288 | $10,291,810 |
|---|
1/24 | $15,989,501 | $10,352,143 |
|---|
2/24 | $17,472,040 | $10,796,388 |
|---|
3/24 | $17,659,968 | $11,135,361 |
|---|
4/24 | $16,767,312 | $10,767,972 |
|---|
5/24 | $16,861,276 | $11,205,299 |
|---|
6/24 | $17,539,903 | $11,454,865 |
|---|
7/24 | $17,137,947 | $11,639,603 |
|---|
8/24 | $18,228,971 | $11,935,208 |
|---|
9/24 | $19,252,132 | $12,212,476 |
|---|
10/24 | $19,466,160 | $11,938,345 |
|---|
11/24 | $20,635,487 | $12,384,883 |
|---|
12/24 | $19,997,432 | $12,091,712 |
|---|
|
|
| Average Annual Return [Table Text Block] |
AATR | 1 Year | 5 Years | 10 Years |
|---|
Class R6 | 27.56% | 11.79% | 14.87% |
|---|
MSCI All Country World Net Index | 17.49% | 10.06% | 9.23% |
|---|
|
|
| AssetsNet |
$ 3,093,035,628
|
|
| Holdings Count | Holding |
36
|
|
| Advisory Fees Paid, Amount |
$ 22,188,836
|
|
| InvestmentCompanyPortfolioTurnover |
19.00%
|
|
| Additional Fund Statistics [Text Block] |
Total Net Assets | $3,093,035,628 |
|---|
# of Portfolio Holdings | 36 |
|---|
Portfolio Turnover Rate | 19% |
|---|
Total Advisory Fees Paid | $22,188,836 |
|---|
|
|
| Holdings [Text Block] |
Sector Allocation (% of total investments)Value | Value |
|---|
Short-Term Investments | 5.3% | Industrials | 14.0% | Communication Services | 15.1% | Information Technology | 17.4% | Financials | 18.0% | Consumer Discretionary | 30.2% |
Top Ten Holdings (% of total investments)Footnote ReferenceaServiceNow, Inc. | 6.9% | Meta Platforms, Inc. | 6.8% | DSV AS | 4.8% | Uber Technologies, Inc. | 4.8% | DoorDash, Inc. | 4.6% | MercadoLibre, Inc. | 4.4% | Amazon.com, Inc. | 4.4% | Spotify Technology SA | 4.0% | Schneider Electric SE | 3.6% | ICICI Bank Ltd. | 3.4% | Total | 47.7% |
| Footnote | Description | Footnotea | Excluding cash equivalents. |
|
|
| Material Fund Change [Text Block] |
|
|
| Updated Prospectus Web Address |
<span style="box-sizing: border-box; color: rgb(0, 0, 0); display: inline; flex-wrap: nowrap; font-size: 10.6667px; font-weight: 400; grid-area: auto; line-height: 16px; margin: 0px; overflow: visible; text-align: left;">www.morganstanley.com/im/shareholderreports</span>
|
|
| C000211166 |
|
|
| Shareholder Report [Line Items] |
|
|
| Fund Name |
Morgan Stanley Institutional Fund, Inc. - Global Permanence Portfolio
|
|
| Class Name |
Class A
|
|
| Trading Symbol |
MGKAX
|
|
| Annual or Semi-Annual Statement [Text Block] |
This annual shareholder report contains important information about Morgan Stanley Institutional Fund, Inc. - Global Permanence Portfolio for the period of January 1, 2024 to December 31, 2024.
|
|
| Shareholder Report Annual or Semi-Annual |
Annual Shareholder Report
|
|
| Additional Information [Text Block] |
You can find additional information about the Fund at www.morganstanley.com/im/shareholderreports. You can also request this information by contacting us at 1-800-869-6397.
|
|
| Additional Information Phone Number |
1-800-869-6397
|
|
| Additional Information Website |
<span style="box-sizing: border-box; color: rgb(0, 0, 0); display: inline; flex-wrap: nowrap; font-size: 10.6667px; font-weight: 400; grid-area: auto; line-height: 16px; margin: 0px; overflow: visible; text-align: left;">www.morganstanley.com/im/shareholderreports</span>
|
|
| Expenses [Text Block] |
What were the Fund costs for the last year?(based on a hypothetical $10,000 investment) Class Name | Costs of a $10,000 investment | Costs paid as a percentage of a $10,000 investment |
|---|
Class A | $142 | 1.35% |
|---|
|
|
| Expenses Paid, Amount |
$ 142
|
|
| Expense Ratio, Percent |
1.35%
|
|
| Factors Affecting Performance [Text Block] |
How did the Fund perform last year and what affected its performance?Key contributors to (↑) and detractors from (↓) performance, relative to the MSCI All Country World Net Index: ↓ Stock selection and an average overweight in consumer discretionary, where the largest detractor was a contemporary carpets and floor coverings company ↓ Stock selection and an average overweight in industrials, where a leading North American Class 1 freight railway was the largest detractor ↓ Stock selection and an average overweight in health care, driven by underperformance in an analytical testing and laboratory services provider ↑ Stock selection and an average underweight in energy, led by a holding in a Texas landowner ↑ Stock selection in real estate, helped by a land holding company focusing on managing land and resources to support and promote oil and natural gas production ↑ Stock selection and an average underweight in materials, driven by a precious metals streaming and royalty company |
|
| Line Graph [Table Text Block] |
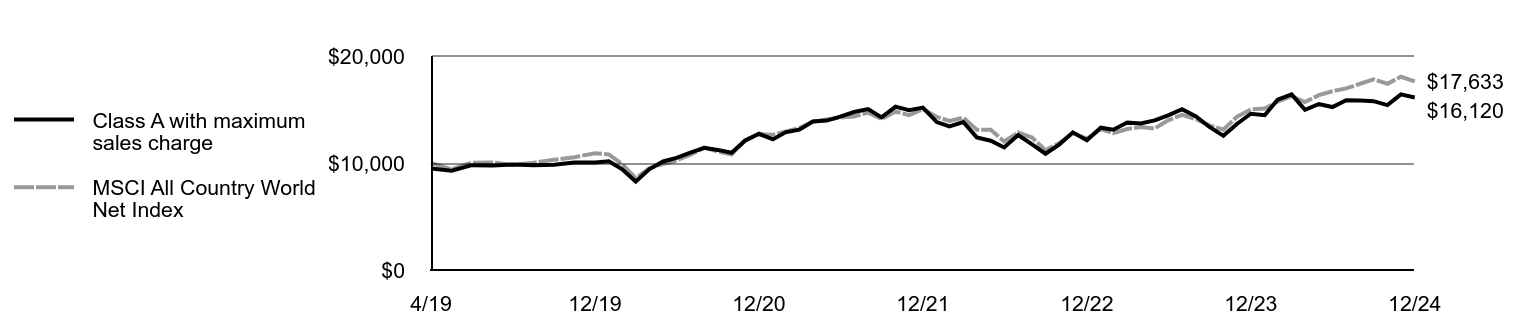 | Class A with maximum sales charge | MSCI All Country World Net Index |
|---|
4/19 | $9,479 | $10,000 |
|---|
5/19 | $9,280 | $9,407 |
|---|
6/19 | $9,801 | $10,023 |
|---|
7/19 | $9,773 | $10,052 |
|---|
8/19 | $9,858 | $9,814 |
|---|
9/19 | $9,791 | $10,020 |
|---|
10/19 | $9,839 | $10,294 |
|---|
11/19 | $10,047 | $10,546 |
|---|
12/19 | $10,057 | $10,917 |
|---|
1/20 | $10,152 | $10,796 |
|---|
2/20 | $9,431 | $9,924 |
|---|
3/20 | $8,265 | $8,585 |
|---|
4/20 | $9,412 | $9,504 |
|---|
5/20 | $10,142 | $9,918 |
|---|
6/20 | $10,483 | $10,234 |
|---|
7/20 | $10,976 | $10,776 |
|---|
8/20 | $11,412 | $11,435 |
|---|
9/20 | $11,223 | $11,067 |
|---|
10/20 | $10,957 | $10,798 |
|---|
11/20 | $12,085 | $12,129 |
|---|
12/20 | $12,729 | $12,692 |
|---|
1/21 | $12,206 | $12,634 |
|---|
2/21 | $12,863 | $12,927 |
|---|
3/21 | $13,110 | $13,272 |
|---|
4/21 | $13,881 | $13,852 |
|---|
5/21 | $13,967 | $14,068 |
|---|
6/21 | $14,338 | $14,253 |
|---|
7/21 | $14,767 | $14,351 |
|---|
8/21 | $15,034 | $14,710 |
|---|
9/21 | $14,262 | $14,103 |
|---|
10/21 | $15,272 | $14,823 |
|---|
11/21 | $14,929 | $14,466 |
|---|
12/21 | $15,182 | $15,044 |
|---|
1/22 | $13,821 | $14,305 |
|---|
2/22 | $13,419 | $13,936 |
|---|
3/22 | $13,832 | $14,238 |
|---|
4/22 | $12,393 | $13,098 |
|---|
5/22 | $12,081 | $13,114 |
|---|
6/22 | $11,456 | $12,008 |
|---|
7/22 | $12,616 | $12,847 |
|---|
8/22 | $11,746 | $12,374 |
|---|
9/22 | $10,865 | $11,189 |
|---|
10/22 | $11,746 | $11,864 |
|---|
11/22 | $12,862 | $12,785 |
|---|
12/22 | $12,129 | $12,282 |
|---|
1/23 | $13,298 | $13,162 |
|---|
2/23 | $13,105 | $12,785 |
|---|
3/23 | $13,787 | $13,179 |
|---|
4/23 | $13,696 | $13,368 |
|---|
5/23 | $13,980 | $13,225 |
|---|
6/23 | $14,457 | $13,993 |
|---|
7/23 | $15,036 | $14,505 |
|---|
8/23 | $14,354 | $14,100 |
|---|
9/23 | $13,366 | $13,517 |
|---|
10/23 | $12,537 | $13,110 |
|---|
11/23 | $13,650 | $14,320 |
|---|
12/23 | $14,605 | $15,008 |
|---|
1/24 | $14,462 | $15,096 |
|---|
2/24 | $15,920 | $15,744 |
|---|
3/24 | $16,410 | $16,238 |
|---|
4/24 | $14,964 | $15,703 |
|---|
5/24 | $15,514 | $16,340 |
|---|
6/24 | $15,227 | $16,704 |
|---|
7/24 | $15,860 | $16,974 |
|---|
8/24 | $15,836 | $17,405 |
|---|
9/24 | $15,776 | $17,809 |
|---|
10/24 | $15,406 | $17,409 |
|---|
11/24 | $16,410 | $18,061 |
|---|
12/24 | $16,120 | $17,633 |
|---|
|
|
| Average Annual Return [Table Text Block] |
AATR | 1 Year | 5 Years | Since 4/30/19
(Inception) |
|---|
Class A | 10.37% | 9.90% | 9.82% |
|---|
Class A, with 5.25% maximum front end sales charge | 4.55% | 8.71% | 8.78% |
|---|
MSCI All Country World Net Index | 17.49% | 10.06% | 10.52% |
|---|
|
|
| Performance Inception Date |
Apr. 30, 2019
|
|
| AssetsNet |
$ 3,861,216
|
|
| Holdings Count | Holding |
48
|
|
| Advisory Fees Paid, Amount |
$ 0
|
|
| InvestmentCompanyPortfolioTurnover |
62.00%
|
|
| Additional Fund Statistics [Text Block] |
Total Net Assets | $3,861,216 |
|---|
# of Portfolio Holdings | 48 |
|---|
Portfolio Turnover Rate | 62% |
|---|
Total Advisory Fees Paid (Net of Waivers) | $0 |
|---|
|
|
| Holdings [Text Block] |
Sector Allocation (% of total investments)Value | Value |
|---|
Communication Services | 0.1% | Energy | 1.2% | Short-Term Investments | 2.3% | Materials | 3.0% | Investment Companies | 3.7% | Real Estate | 4.3% | Consumer Staples | 4.7% | Financals | 4.7% | Health Care | 14.4% | Consumer Discretionary | 18.6% | Information Technology | 19.3% | Industrials | 23.7% |
Top Ten Holdings (% of total investments)Footnote ReferenceaCloudflare, Inc. | 11.0% | Royalty Pharma PLC | 5.1% | Eurofins Scientific SE | 5.1% | ASML Holding NV | 5.1% | Babcock International Group PLC | 5.1% | Rentokil Initial PLC | 5.0% | LVMH Moet Hennessy Louis Vuitton SE | 5.0% | Canadian National Railway Co. | 5.0% | Floor & Decor Holdings, Inc. | 4.7% | Core & Main, Inc. | 4.7% | Total | 55.8% |
| Footnote | Description | Footnotea | Excluding cash equivalents. |
|
|
| Material Fund Change [Text Block] |
|
|
| Updated Prospectus Web Address |
<span style="box-sizing: border-box; color: rgb(0, 0, 0); display: inline; flex-wrap: nowrap; font-size: 10.6667px; font-weight: 400; grid-area: auto; line-height: 16px; margin: 0px; overflow: visible; text-align: left;">www.morganstanley.com/im/shareholderreports</span>
|
|
| C000211167 |
|
|
| Shareholder Report [Line Items] |
|
|
| Fund Name |
Morgan Stanley Institutional Fund, Inc. - Global Permanence Portfolio
|
|
| Class Name |
Class C
|
|
| Trading Symbol |
MGKCX
|
|
| Annual or Semi-Annual Statement [Text Block] |
This annual shareholder report contains important information about Morgan Stanley Institutional Fund, Inc. - Global Permanence Portfolio for the period of January 1, 2024 to December 31, 2024.
|
|
| Shareholder Report Annual or Semi-Annual |
Annual Shareholder Report
|
|
| Additional Information [Text Block] |
You can find additional information about the Fund at www.morganstanley.com/im/shareholderreports. You can also request this information by contacting us at 1-800-869-6397.
|
|
| Additional Information Phone Number |
1-800-869-6397
|
|
| Additional Information Website |
<span style="box-sizing: border-box; color: rgb(0, 0, 0); display: inline; flex-wrap: nowrap; font-size: 10.6667px; font-weight: 400; grid-area: auto; line-height: 16px; margin: 0px; overflow: visible; text-align: left;">www.morganstanley.com/im/shareholderreports</span>
|
|
| Expenses [Text Block] |
What were the Fund costs for the last year?(based on a hypothetical $10,000 investment) Class Name | Costs of a $10,000 investment | Costs paid as a percentage of a $10,000 investment |
|---|
Class C | $220 | 2.10% |
|---|
|
|
| Expenses Paid, Amount |
$ 220
|
|
| Expense Ratio, Percent |
2.10%
|
|
| Factors Affecting Performance [Text Block] |
How did the Fund perform last year and what affected its performance?Key contributors to (↑) and detractors from (↓) performance, relative to the MSCI All Country World Net Index: ↓ Stock selection and an average overweight in consumer discretionary, where the largest detractor was a contemporary carpets and floor coverings company ↓ Stock selection and an average overweight in industrials, where a leading North American Class 1 freight railway was the largest detractor ↓ Stock selection and an average overweight in health care, driven by underperformance in an analytical testing and laboratory services provider ↑ Stock selection and an average underweight in energy, led by a holding in a Texas landowner ↑ Stock selection in real estate, helped by a land holding company focusing on managing land and resources to support and promote oil and natural gas production ↑ Stock selection and an average underweight in materials, driven by a precious metals streaming and royalty company |
|
| Line Graph [Table Text Block] |
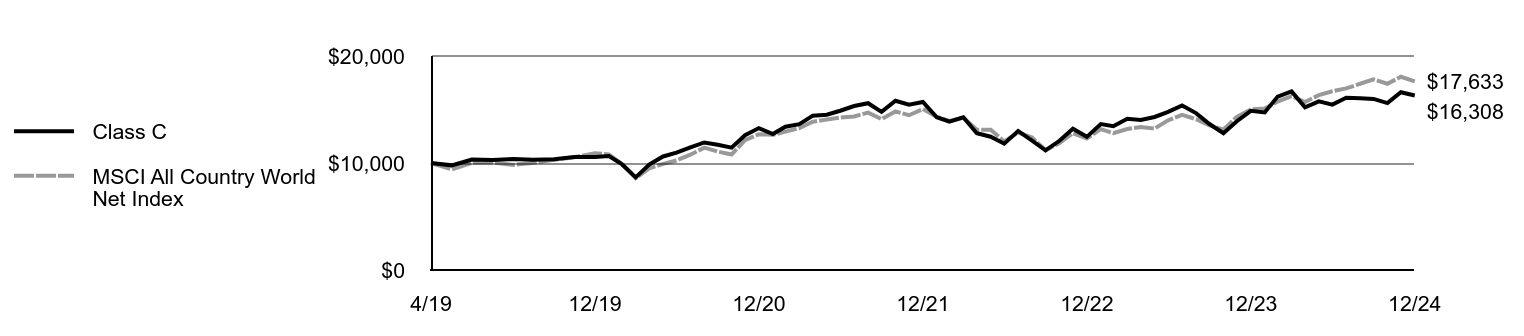 | Class C | MSCI All Country World Net Index |
|---|
4/19 | $10,000 | $10,000 |
|---|
5/19 | $9,780 | $9,407 |
|---|
6/19 | $10,330 | $10,023 |
|---|
7/19 | $10,290 | $10,052 |
|---|
8/19 | $10,370 | $9,814 |
|---|
9/19 | $10,300 | $10,020 |
|---|
10/19 | $10,340 | $10,294 |
|---|
11/19 | $10,550 | $10,546 |
|---|
12/19 | $10,560 | $10,917 |
|---|
1/20 | $10,650 | $10,796 |
|---|
2/20 | $9,890 | $9,924 |
|---|
3/20 | $8,660 | $8,585 |
|---|
4/20 | $9,850 | $9,504 |
|---|
5/20 | $10,610 | $9,918 |
|---|
6/20 | $10,970 | $10,234 |
|---|
7/20 | $11,470 | $10,776 |
|---|
8/20 | $11,920 | $11,435 |
|---|
9/20 | $11,710 | $11,067 |
|---|
10/20 | $11,430 | $10,798 |
|---|
11/20 | $12,600 | $12,129 |
|---|
12/20 | $13,263 | $12,692 |
|---|
1/21 | $12,702 | $12,634 |
|---|
2/21 | $13,393 | $12,927 |
|---|
3/21 | $13,634 | $13,272 |
|---|
4/21 | $14,425 | $13,852 |
|---|
5/21 | $14,515 | $14,068 |
|---|
6/21 | $14,886 | $14,253 |
|---|
7/21 | $15,327 | $14,351 |
|---|
8/21 | $15,587 | $14,710 |
|---|
9/21 | $14,776 | $14,103 |
|---|
10/21 | $15,818 | $14,823 |
|---|
11/21 | $15,457 | $14,466 |
|---|
12/21 | $15,702 | $15,044 |
|---|
1/22 | $14,277 | $14,305 |
|---|
2/22 | $13,865 | $13,936 |
|---|
3/22 | $14,277 | $14,238 |
|---|
4/22 | $12,783 | $13,098 |
|---|
5/22 | $12,453 | $13,114 |
|---|
6/22 | $11,806 | $12,008 |
|---|
7/22 | $12,994 | $12,847 |
|---|
8/22 | $12,088 | $12,374 |
|---|
9/22 | $11,182 | $11,189 |
|---|
10/22 | $12,076 | $11,864 |
|---|
11/22 | $13,206 | $12,785 |
|---|
12/22 | $12,444 | $12,282 |
|---|
1/23 | $13,643 | $13,162 |
|---|
2/23 | $13,440 | $12,785 |
|---|
3/23 | $14,135 | $13,179 |
|---|
4/23 | $14,027 | $13,368 |
|---|
5/23 | $14,303 | $13,225 |
|---|
6/23 | $14,782 | $13,993 |
|---|
7/23 | $15,370 | $14,505 |
|---|
8/23 | $14,662 | $14,100 |
|---|
9/23 | $13,643 | $13,517 |
|---|
10/23 | $12,792 | $13,110 |
|---|
11/23 | $13,907 | $14,320 |
|---|
12/23 | $14,879 | $15,008 |
|---|
1/24 | $14,727 | $15,096 |
|---|
2/24 | $16,206 | $15,744 |
|---|
3/24 | $16,687 | $16,238 |
|---|
4/24 | $15,208 | $15,703 |
|---|
5/24 | $15,764 | $16,340 |
|---|
6/24 | $15,460 | $16,704 |
|---|
7/24 | $16,092 | $16,974 |
|---|
8/24 | $16,055 | $17,405 |
|---|
9/24 | $15,991 | $17,809 |
|---|
10/24 | $15,599 | $17,409 |
|---|
11/24 | $16,611 | $18,061 |
|---|
12/24 | $16,308 | $17,633 |
|---|
|
|
| Average Annual Return [Table Text Block] |
AATR | 1 Year | 5 Years | Since 4/30/19
(Inception) |
|---|
Class C | 9.60% | 9.08% | 9.01% |
|---|
Class C, with 1% maximum contingent deferred sales charge | 8.70% | 9.08% | 9.01% |
|---|
MSCI All Country World Net Index | 17.49% | 10.06% | 10.52% |
|---|
|
|
| Performance Inception Date |
Apr. 30, 2019
|
|
| AssetsNet |
$ 3,861,216
|
|
| Holdings Count | Holding |
48
|
|
| Advisory Fees Paid, Amount |
$ 0
|
|
| InvestmentCompanyPortfolioTurnover |
62.00%
|
|
| Additional Fund Statistics [Text Block] |
Total Net Assets | $3,861,216 |
|---|
# of Portfolio Holdings | 48 |
|---|
Portfolio Turnover Rate | 62% |
|---|
Total Advisory Fees Paid (Net of Waivers) | $0 |
|---|
|
|
| Holdings [Text Block] |
Sector Allocation (% of total investments)Value | Value |
|---|
Communication Services | 0.1% | Energy | 1.2% | Short-Term Investments | 2.3% | Materials | 3.0% | Investment Companies | 3.7% | Real Estate | 4.3% | Consumer Staples | 4.7% | Financals | 4.7% | Health Care | 14.4% | Consumer Discretionary | 18.6% | Information Technology | 19.3% | Industrials | 23.7% |
Top Ten Holdings (% of total investments)Footnote ReferenceaCloudflare, Inc. | 11.0% | Royalty Pharma PLC | 5.1% | Eurofins Scientific SE | 5.1% | ASML Holding NV | 5.1% | Babcock International Group PLC | 5.1% | Rentokil Initial PLC | 5.0% | LVMH Moet Hennessy Louis Vuitton SE | 5.0% | Canadian National Railway Co. | 5.0% | Floor & Decor Holdings, Inc. | 4.7% | Core & Main, Inc. | 4.7% | Total | 55.8% |
| Footnote | Description | Footnotea | Excluding cash equivalents. |
|
|
| Material Fund Change [Text Block] |
|
|
| Updated Prospectus Web Address |
<span style="box-sizing: border-box; color: rgb(0, 0, 0); display: inline; flex-wrap: nowrap; font-size: 10.6667px; font-weight: 400; grid-area: auto; line-height: 16px; margin: 0px; overflow: visible; text-align: left;">www.morganstanley.com/im/shareholderreports</span>
|
|
| C000211168 |
|
|
| Shareholder Report [Line Items] |
|
|
| Fund Name |
Morgan Stanley Institutional Fund, Inc. - Global Permanence Portfolio
|
|
| Class Name |
Class I
|
|
| Trading Symbol |
MGKIX
|
|
| Annual or Semi-Annual Statement [Text Block] |
This annual shareholder report contains important information about Morgan Stanley Institutional Fund, Inc. - Global Permanence Portfolio for the period of January 1, 2024 to December 31, 2024.
|
|
| Shareholder Report Annual or Semi-Annual |
Annual Shareholder Report
|
|
| Additional Information [Text Block] |
You can find additional information about the Fund at www.morganstanley.com/im/shareholderreports. You can also request this information by contacting us at 1-800-869-6397.
|
|
| Additional Information Phone Number |
1-800-869-6397
|
|
| Additional Information Website |
<span style="box-sizing: border-box; color: rgb(0, 0, 0); display: inline; flex-wrap: nowrap; font-size: 10.6667px; font-weight: 400; grid-area: auto; line-height: 16px; margin: 0px; overflow: visible; text-align: left;">www.morganstanley.com/im/shareholderreports</span>
|
|
| Expenses [Text Block] |
What were the Fund costs for the last year?(based on a hypothetical $10,000 investment) Class Name | Costs of a $10,000 investment | Costs paid as a percentage of a $10,000 investment |
|---|
Class I | $105 | 1.00% |
|---|
|
|
| Expenses Paid, Amount |
$ 105
|
|
| Expense Ratio, Percent |
1.00%
|
|
| Factors Affecting Performance [Text Block] |
How did the Fund perform last year and what affected its performance?Key contributors to (↑) and detractors from (↓) performance, relative to the MSCI All Country World Net Index: ↓ Stock selection and an average overweight in consumer discretionary, where the largest detractor was a contemporary carpets and floor coverings company ↓ Stock selection and an average overweight in industrials, where a leading North American Class 1 freight railway was the largest detractor ↓ Stock selection and an average overweight in health care, driven by underperformance in an analytical testing and laboratory services provider ↑ Stock selection and an average underweight in energy, led by a holding in a Texas landowner ↑ Stock selection in real estate, helped by a land holding company focusing on managing land and resources to support and promote oil and natural gas production ↑ Stock selection and an average underweight in materials, driven by a precious metals streaming and royalty company |
|
| Line Graph [Table Text Block] |
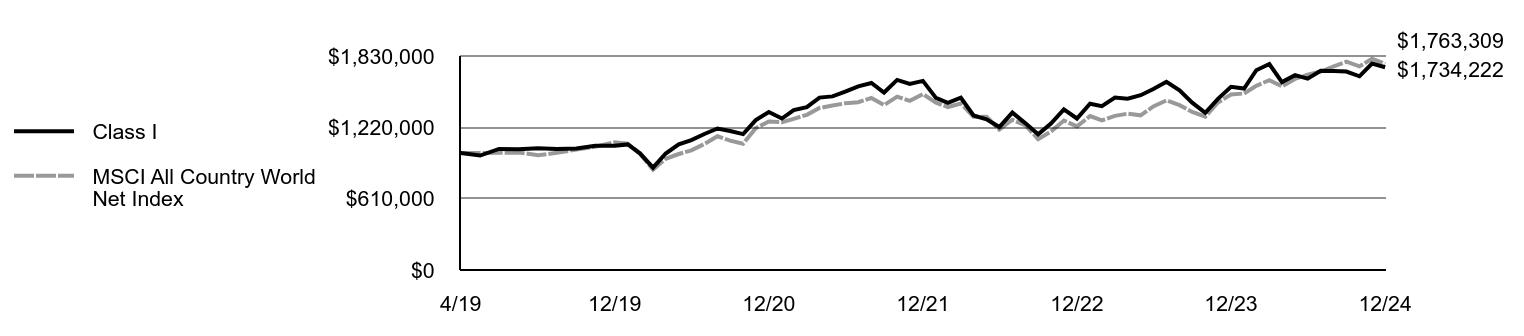 | Class I | MSCI All Country World Net Index |
|---|
4/19 | $1,000,000 | $1,000,000 |
|---|
5/19 | $979,000 | $1,000,000 |
|---|
6/19 | $1,035,000 | $1,002,276 |
|---|
7/19 | $1,032,000 | $1,005,213 |
|---|
8/19 | $1,041,000 | $981,367 |
|---|
9/19 | $1,034,000 | $1,002,017 |
|---|
10/19 | $1,040,000 | $1,029,441 |
|---|
11/19 | $1,062,000 | $1,054,571 |
|---|
12/19 | $1,063,000 | $1,091,708 |
|---|
1/20 | $1,074,000 | $1,079,649 |
|---|
2/20 | $998,000 | $992,446 |
|---|
3/20 | $875,000 | $858,462 |
|---|
4/20 | $996,000 | $950,425 |
|---|
5/20 | $1,074,000 | $991,760 |
|---|
6/20 | $1,111,000 | $1,023,449 |
|---|
7/20 | $1,163,000 | $1,077,577 |
|---|
8/20 | $1,210,000 | $1,143,530 |
|---|
9/20 | $1,189,000 | $1,106,659 |
|---|
10/20 | $1,162,000 | $1,079,757 |
|---|
11/20 | $1,282,000 | $1,212,851 |
|---|
12/20 | $1,350,640 | $1,269,163 |
|---|
1/21 | $1,295,244 | $1,263,391 |
|---|
2/21 | $1,366,755 | $1,292,656 |
|---|
3/21 | $1,392,942 | $1,327,182 |
|---|
4/21 | $1,474,524 | $1,385,209 |
|---|
5/21 | $1,484,596 | $1,406,767 |
|---|
6/21 | $1,524,883 | $1,425,304 |
|---|
7/21 | $1,570,207 | $1,435,126 |
|---|
8/21 | $1,599,415 | $1,471,046 |
|---|
9/21 | $1,517,833 | $1,410,277 |
|---|
10/21 | $1,625,602 | $1,482,263 |
|---|
11/21 | $1,590,351 | $1,446,569 |
|---|
12/21 | $1,617,056 | $1,504,433 |
|---|
1/22 | $1,472,087 | $1,430,546 |
|---|
2/22 | $1,429,657 | $1,393,599 |
|---|
3/22 | $1,473,266 | $1,423,783 |
|---|
4/22 | $1,321,225 | $1,309,821 |
|---|
5/22 | $1,288,223 | $1,311,354 |
|---|
6/22 | $1,222,221 | $1,200,812 |
|---|
7/22 | $1,345,975 | $1,284,667 |
|---|
8/22 | $1,254,044 | $1,237,372 |
|---|
9/22 | $1,159,755 | $1,118,920 |
|---|
10/22 | $1,254,044 | $1,186,443 |
|---|
11/22 | $1,374,262 | $1,278,468 |
|---|
12/22 | $1,295,628 | $1,228,159 |
|---|
1/23 | $1,421,592 | $1,316,189 |
|---|
2/23 | $1,401,198 | $1,278,467 |
|---|
3/23 | $1,474,377 | $1,317,886 |
|---|
4/23 | $1,464,779 | $1,336,827 |
|---|
5/23 | $1,494,771 | $1,322,509 |
|---|
6/23 | $1,547,556 | $1,399,295 |
|---|
7/23 | $1,609,938 | $1,450,520 |
|---|
8/23 | $1,536,759 | $1,409,987 |
|---|
9/23 | $1,431,189 | $1,351,683 |
|---|
10/23 | $1,343,614 | $1,311,042 |
|---|
11/23 | $1,463,580 | $1,432,046 |
|---|
12/23 | $1,566,727 | $1,500,833 |
|---|
1/24 | $1,551,566 | $1,509,631 |
|---|
2/24 | $1,708,238 | $1,574,414 |
|---|
3/24 | $1,761,305 | $1,623,846 |
|---|
4/24 | $1,607,159 | $1,570,270 |
|---|
5/24 | $1,666,543 | $1,634,045 |
|---|
6/24 | $1,636,219 | $1,670,439 |
|---|
7/24 | $1,704,448 | $1,697,378 |
|---|
8/24 | $1,701,921 | $1,740,486 |
|---|
9/24 | $1,696,867 | $1,780,919 |
|---|
10/24 | $1,656,435 | $1,740,943 |
|---|
11/24 | $1,765,095 | $1,806,061 |
|---|
12/24 | $1,734,222 | $1,763,309 |
|---|
|
|
| Average Annual Return [Table Text Block] |
AATR | 1 Year | 5 Years | Since 4/30/19
(Inception) |
|---|
Class I | 10.69% | 10.28% | 10.19% |
|---|
MSCI All Country World Net Index | 17.49% | 10.06% | 10.52% |
|---|
|
|
| Performance Inception Date |
Apr. 30, 2019
|
|
| AssetsNet |
$ 3,861,216
|
|
| Holdings Count | Holding |
48
|
|
| Advisory Fees Paid, Amount |
$ 0
|
|
| InvestmentCompanyPortfolioTurnover |
62.00%
|
|
| Additional Fund Statistics [Text Block] |
Total Net Assets | $3,861,216 |
|---|
# of Portfolio Holdings | 48 |
|---|
Portfolio Turnover Rate | 62% |
|---|
Total Advisory Fees Paid (Net of Waivers) | $0 |
|---|
|
|
| Holdings [Text Block] |
Sector Allocation (% of total investments)Value | Value |
|---|
Communication Services | 0.1% | Energy | 1.2% | Short-Term Investments | 2.3% | Materials | 3.0% | Investment Companies | 3.7% | Real Estate | 4.3% | Consumer Staples | 4.7% | Financals | 4.7% | Health Care | 14.4% | Consumer Discretionary | 18.6% | Information Technology | 19.3% | Industrials | 23.7% |
Top Ten Holdings (% of total investments)Footnote ReferenceaCloudflare, Inc. | 11.0% | Royalty Pharma PLC | 5.1% | Eurofins Scientific SE | 5.1% | ASML Holding NV | 5.1% | Babcock International Group PLC | 5.1% | Rentokil Initial PLC | 5.0% | LVMH Moet Hennessy Louis Vuitton SE | 5.0% | Canadian National Railway Co. | 5.0% | Floor & Decor Holdings, Inc. | 4.7% | Core & Main, Inc. | 4.7% | Total | 55.8% |
| Footnote | Description | Footnotea | Excluding cash equivalents. |
|
|
| Material Fund Change [Text Block] |
|
|
| Updated Prospectus Web Address |
<span style="box-sizing: border-box; color: rgb(0, 0, 0); display: inline; flex-wrap: nowrap; font-size: 10.6667px; font-weight: 400; grid-area: auto; line-height: 16px; margin: 0px; overflow: visible; text-align: left;">www.morganstanley.com/im/shareholderreports</span>
|
|
| C000211165 |
|
|
| Shareholder Report [Line Items] |
|
|
| Fund Name |
Morgan Stanley Institutional Fund, Inc. - Global Permanence Portfolio
|
|
| Class Name |
Class R6
|
|
| Trading Symbol |
MGKQX
|
|
| Annual or Semi-Annual Statement [Text Block] |
This annual shareholder report contains important information about Morgan Stanley Institutional Fund, Inc. - Global Permanence Portfolio for the period of January 1, 2024 to December 31, 2024.
|
|
| Shareholder Report Annual or Semi-Annual |
Annual Shareholder Report
|
|
| Additional Information [Text Block] |
You can find additional information about the Fund at www.morganstanley.com/im/shareholderreports. You can also request this information by contacting us at 1-800-869-6397.
|
|
| Additional Information Phone Number |
1-800-869-6397
|
|
| Additional Information Website |
<span style="box-sizing: border-box; color: rgb(0, 0, 0); display: inline; flex-wrap: nowrap; font-size: 10.6667px; font-weight: 400; grid-area: auto; line-height: 16px; margin: 0px; overflow: visible; text-align: left;">www.morganstanley.com/im/shareholderreports</span>
|
|
| Expenses [Text Block] |
What were the Fund costs for the last year?(based on a hypothetical $10,000 investment) Class Name | Costs of a $10,000 investment | Costs paid as a percentage of a $10,000 investment |
|---|
Class R6 | $100 | 0.95% |
|---|
|
|
| Expenses Paid, Amount |
$ 100
|
|
| Expense Ratio, Percent |
0.95%
|
|
| Factors Affecting Performance [Text Block] |
How did the Fund perform last year and what affected its performance?Key contributors to (↑) and detractors from (↓) performance, relative to the MSCI All Country World Net Index: ↓ Stock selection and an average overweight in consumer discretionary, where the largest detractor was a contemporary carpets and floor coverings company ↓ Stock selection and an average overweight in industrials, where a leading North American Class 1 freight railway was the largest detractor ↓ Stock selection and an average overweight in health care, driven by underperformance in an analytical testing and laboratory services provider ↑ Stock selection and an average underweight in energy, led by a holding in a Texas landowner ↑ Stock selection in real estate, helped by a land holding company focusing on managing land and resources to support and promote oil and natural gas production ↑ Stock selection and an average underweight in materials, driven by a precious metals streaming and royalty company |
|
| Line Graph [Table Text Block] |
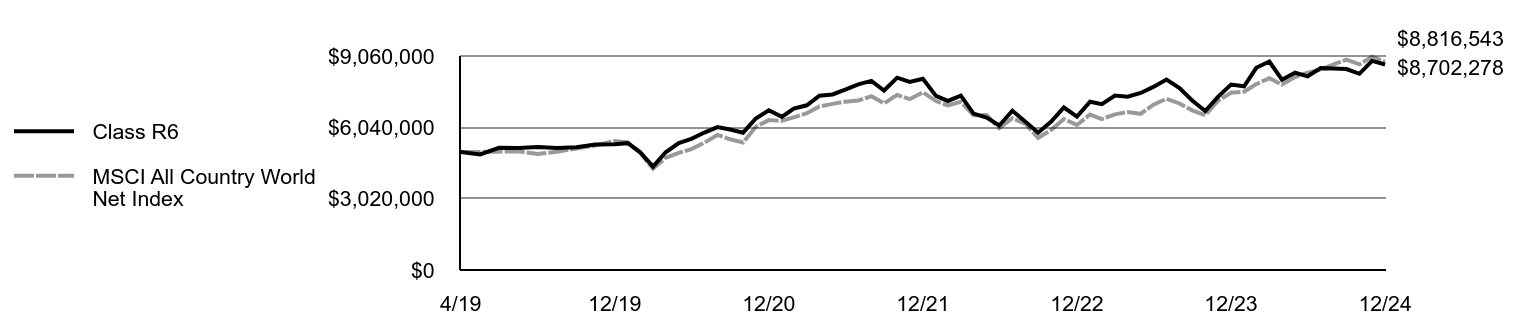 | Class R6 | MSCI All Country World Net Index |
|---|
4/19 | $5,000,000 | $5,000,000 |
|---|
5/19 | $4,895,000 | $5,000,000 |
|---|
6/19 | $5,175,000 | $5,011,382 |
|---|
7/19 | $5,160,000 | $5,026,066 |
|---|
8/19 | $5,205,000 | $4,906,836 |
|---|
9/19 | $5,170,000 | $5,010,084 |
|---|
10/19 | $5,200,000 | $5,147,203 |
|---|
11/19 | $5,315,000 | $5,272,854 |
|---|
12/19 | $5,320,000 | $5,458,539 |
|---|
1/20 | $5,370,000 | $5,398,244 |
|---|
2/20 | $4,995,000 | $4,962,229 |
|---|
3/20 | $4,375,000 | $4,292,312 |
|---|
4/20 | $4,985,000 | $4,752,126 |
|---|
5/20 | $5,375,000 | $4,958,801 |
|---|
6/20 | $5,555,000 | $5,117,247 |
|---|
7/20 | $5,820,000 | $5,387,883 |
|---|
8/20 | $6,050,000 | $5,717,649 |
|---|
9/20 | $5,950,000 | $5,533,293 |
|---|
10/20 | $5,815,000 | $5,398,787 |
|---|
11/20 | $6,415,000 | $6,064,257 |
|---|
12/20 | $6,761,060 | $6,345,817 |
|---|
1/21 | $6,483,967 | $6,316,956 |
|---|
2/21 | $6,836,631 | $6,463,279 |
|---|
3/21 | $6,972,658 | $6,635,909 |
|---|
4/21 | $7,380,740 | $6,926,047 |
|---|
5/21 | $7,431,120 | $7,033,833 |
|---|
6/21 | $7,632,642 | $7,126,520 |
|---|
7/21 | $7,859,354 | $7,175,628 |
|---|
8/21 | $8,005,458 | $7,355,229 |
|---|
9/21 | $7,597,376 | $7,051,386 |
|---|
10/21 | $8,141,485 | $7,411,314 |
|---|
11/21 | $7,960,115 | $7,232,846 |
|---|
12/21 | $8,093,663 | $7,522,163 |
|---|
1/22 | $7,368,594 | $7,152,732 |
|---|
2/22 | $7,156,378 | $6,967,996 |
|---|
3/22 | $7,380,383 | $7,118,916 |
|---|
4/22 | $6,619,945 | $6,549,105 |
|---|
5/22 | $6,454,888 | $6,556,769 |
|---|
6/22 | $6,118,880 | $6,004,058 |
|---|
7/22 | $6,743,737 | $6,423,336 |
|---|
8/22 | $6,278,042 | $6,186,862 |
|---|
9/22 | $5,812,347 | $5,594,598 |
|---|
10/22 | $6,283,937 | $5,932,215 |
|---|
11/22 | $6,879,319 | $6,392,338 |
|---|
12/22 | $6,491,924 | $6,140,793 |
|---|
1/23 | $7,121,917 | $6,580,946 |
|---|
2/23 | $7,019,918 | $6,392,336 |
|---|
3/23 | $7,385,914 | $6,589,428 |
|---|
4/23 | $7,337,914 | $6,684,135 |
|---|
5/23 | $7,493,913 | $6,612,545 |
|---|
6/23 | $7,751,910 | $6,996,475 |
|---|
7/23 | $8,063,906 | $7,252,602 |
|---|
8/23 | $7,697,910 | $7,049,936 |
|---|
9/23 | $7,175,916 | $6,758,415 |
|---|
10/23 | $6,731,922 | $6,555,211 |
|---|
11/23 | $7,331,915 | $7,160,229 |
|---|
12/23 | $7,852,135 | $7,504,164 |
|---|
1/24 | $7,776,268 | $7,548,155 |
|---|
2/24 | $8,560,217 | $7,872,072 |
|---|
3/24 | $8,825,749 | $8,119,230 |
|---|
4/24 | $8,054,444 | $7,851,352 |
|---|
5/24 | $8,351,586 | $8,170,224 |
|---|
6/24 | $8,199,854 | $8,352,193 |
|---|
7/24 | $8,547,573 | $8,486,892 |
|---|
8/24 | $8,534,929 | $8,702,430 |
|---|
9/24 | $8,509,640 | $8,904,597 |
|---|
10/24 | $8,307,331 | $8,704,717 |
|---|
11/24 | $8,851,037 | $9,030,305 |
|---|
12/24 | $8,702,278 | $8,816,543 |
|---|
|
|
| Average Annual Return [Table Text Block] |
AATR | 1 Year | 5 Years | Since 4/30/19
(Inception) |
|---|
Class R6 | 10.83% | 10.34% | 10.26% |
|---|
MSCI All Country World Net Index | 17.49% | 10.06% | 10.52% |
|---|
|
|
| Performance Inception Date |
Apr. 30, 2019
|
|
| AssetsNet |
$ 3,861,216
|
|
| Holdings Count | Holding |
48
|
|
| Advisory Fees Paid, Amount |
$ 0
|
|
| InvestmentCompanyPortfolioTurnover |
62.00%
|
|
| Additional Fund Statistics [Text Block] |
Total Net Assets | $3,861,216 |
|---|
# of Portfolio Holdings | 48 |
|---|
Portfolio Turnover Rate | 62% |
|---|
Total Advisory Fees Paid (Net of Waivers) | $0 |
|---|
|
|
| Holdings [Text Block] |
Sector Allocation (% of total investments)Value | Value |
|---|
Communication Services | 0.1% | Energy | 1.2% | Short-Term Investments | 2.3% | Materials | 3.0% | Investment Companies | 3.7% | Real Estate | 4.3% | Consumer Staples | 4.7% | Financals | 4.7% | Health Care | 14.4% | Consumer Discretionary | 18.6% | Information Technology | 19.3% | Industrials | 23.7% |
Top Ten Holdings (% of total investments)Footnote ReferenceaCloudflare, Inc. | 11.0% | Royalty Pharma PLC | 5.1% | Eurofins Scientific SE | 5.1% | ASML Holding NV | 5.1% | Babcock International Group PLC | 5.1% | Rentokil Initial PLC | 5.0% | LVMH Moet Hennessy Louis Vuitton SE | 5.0% | Canadian National Railway Co. | 5.0% | Floor & Decor Holdings, Inc. | 4.7% | Core & Main, Inc. | 4.7% | Total | 55.8% |
| Footnote | Description | Footnotea | Excluding cash equivalents. |
|
|
| Material Fund Change [Text Block] |
|
|
| Updated Prospectus Web Address |
<span style="box-sizing: border-box; color: rgb(0, 0, 0); display: inline; flex-wrap: nowrap; font-size: 10.6667px; font-weight: 400; grid-area: auto; line-height: 16px; margin: 0px; overflow: visible; text-align: left;">www.morganstanley.com/im/shareholderreports</span>
|
|
| C000129961 |
|
|
| Shareholder Report [Line Items] |
|
|
| Fund Name |
Morgan Stanley Institutional Fund, Inc. - Global Stars Portfolio
|
|
| Class Name |
Class A
|
|
| Trading Symbol |
MGQAX
|
|
| Annual or Semi-Annual Statement [Text Block] |
This annual shareholder report contains important information about Morgan Stanley Institutional Fund, Inc. - Global Stars Portfolio for the period of January 1, 2024 to December 31, 2024.
|
|
| Shareholder Report Annual or Semi-Annual |
Annual Shareholder Report
|
|
| Additional Information [Text Block] |
You can find additional information about the Fund at www.morganstanley.com/im/shareholderreports. You can also request this information by contacting us at 1-800-869-6397.
|
|
| Material Fund Change Notice [Text Block] |
This report describes changes to the Fund that occurred during the reporting period.
|
|
| Additional Information Phone Number |
1-800-869-6397
|
|
| Additional Information Website |
<span style="box-sizing: border-box; color: rgb(0, 0, 0); display: inline; flex-wrap: nowrap; font-size: 10.6667px; font-weight: 400; grid-area: auto; line-height: 16px; margin: 0px; overflow: visible; text-align: left;">www.morganstanley.com/im/shareholderreports</span>
|
|
| Expenses [Text Block] |
What were the Fund costs for the last year?(based on a hypothetical $10,000 investment) Class Name | Costs of a $10,000 investment | Costs paid as a percentage of a $10,000 investment |
|---|
Class A | $126 | 1.17% |
|---|
|
|
| Expenses Paid, Amount |
$ 126
|
|
| Expense Ratio, Percent |
1.17%
|
|
| Factors Affecting Performance [Text Block] |
How did the Fund perform last year and what affected its performance?Key contributors to (↑) and detractors from (↓) performance, relative to the MSCI World/MSCI AC World Blended Index: ↓ Stock selection, driven by weakness in health care, financials and information technology ↑ Sector allocation, aided by the zero weight in materials |
|
| Line Graph [Table Text Block] |
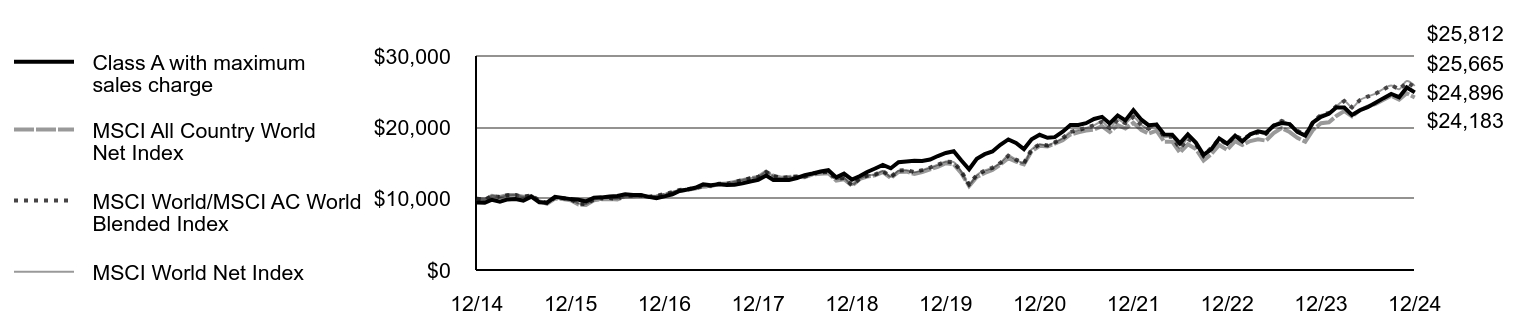 | Class A with maximum sales charge | MSCI All Country World Net Index | MSCI World/MSCI AC World Blended Index | MSCI World Net Index |
|---|
12/14 | $9,473 | $10,000 | $10,000 | $10,000 |
|---|
1/15 | $9,423 | $9,844 | $9,819 | $9,819 |
|---|
2/15 | $9,849 | $10,392 | $10,394 | $10,394 |
|---|
3/15 | $9,573 | $10,231 | $10,231 | $10,231 |
|---|
4/15 | $9,900 | $10,528 | $10,471 | $10,471 |
|---|
5/15 | $9,958 | $10,514 | $10,507 | $10,507 |
|---|
6/15 | $9,707 | $10,266 | $10,263 | $10,263 |
|---|
7/15 | $10,287 | $10,355 | $10,447 | $10,447 |
|---|
8/15 | $9,507 | $9,646 | $9,756 | $9,756 |
|---|
9/15 | $9,440 | $9,296 | $9,396 | $9,396 |
|---|
10/15 | $10,254 | $10,026 | $10,141 | $10,141 |
|---|
11/15 | $10,094 | $9,943 | $10,090 | $10,090 |
|---|
12/15 | $9,938 | $9,764 | $9,913 | $9,913 |
|---|
1/16 | $9,842 | $9,175 | $9,320 | $9,320 |
|---|
2/16 | $9,624 | $9,112 | $9,250 | $9,250 |
|---|
3/16 | $10,147 | $9,787 | $9,878 | $9,878 |
|---|
4/16 | $10,182 | $9,931 | $10,035 | $10,035 |
|---|
5/16 | $10,312 | $9,944 | $10,091 | $10,091 |
|---|
6/16 | $10,382 | $9,884 | $9,978 | $9,978 |
|---|
7/16 | $10,601 | $10,310 | $10,399 | $10,399 |
|---|
8/16 | $10,513 | $10,344 | $10,408 | $10,408 |
|---|
9/16 | $10,504 | $10,408 | $10,463 | $10,463 |
|---|
10/16 | $10,247 | $10,231 | $10,261 | $10,261 |
|---|
11/16 | $10,061 | $10,309 | $10,408 | $10,408 |
|---|
12/16 | $10,318 | $10,531 | $10,657 | $10,657 |
|---|
1/17 | $10,615 | $10,819 | $10,915 | $10,915 |
|---|
2/17 | $11,074 | $11,123 | $11,217 | $11,217 |
|---|
3/17 | $11,284 | $11,259 | $11,337 | $11,337 |
|---|
4/17 | $11,533 | $11,434 | $11,505 | $11,505 |
|---|
5/17 | $12,011 | $11,687 | $11,748 | $11,748 |
|---|
6/17 | $11,886 | $11,740 | $11,793 | $11,793 |
|---|
7/17 | $12,031 | $12,068 | $12,076 | $12,076 |
|---|
8/17 | $11,916 | $12,114 | $12,093 | $12,093 |
|---|
9/17 | $11,945 | $12,348 | $12,364 | $12,364 |
|---|
10/17 | $12,146 | $12,605 | $12,598 | $12,598 |
|---|
11/17 | $12,415 | $12,849 | $12,871 | $12,871 |
|---|
12/17 | $12,634 | $13,056 | $13,045 | $13,045 |
|---|
1/18 | $13,234 | $13,793 | $13,733 | $13,733 |
|---|
2/18 | $12,614 | $13,213 | $13,164 | $13,164 |
|---|
3/18 | $12,634 | $12,931 | $12,878 | $12,878 |
|---|
4/18 | $12,614 | $13,054 | $13,026 | $13,026 |
|---|
5/18 | $12,898 | $13,070 | $13,107 | $13,107 |
|---|
6/18 | $13,305 | $13,000 | $13,101 | $13,101 |
|---|
7/18 | $13,527 | $13,392 | $13,510 | $13,510 |
|---|
8/18 | $13,803 | $13,497 | $13,677 | $13,677 |
|---|
9/18 | $13,988 | $13,555 | $13,753 | $13,753 |
|---|
10/18 | $12,984 | $12,540 | $12,744 | $12,744 |
|---|
11/18 | $13,516 | $12,723 | $12,888 | $12,888 |
|---|
12/18 | $12,667 | $11,827 | $11,908 | $11,908 |
|---|
1/19 | $13,171 | $12,761 | $12,835 | $12,835 |
|---|
2/19 | $13,741 | $13,102 | $13,221 | $13,221 |
|---|
3/19 | $14,234 | $13,267 | $13,394 | $13,394 |
|---|
4/19 | $14,738 | $13,715 | $13,869 | $13,869 |
|---|
5/19 | $14,256 | $12,901 | $13,069 | $13,069 |
|---|
6/19 | $15,111 | $13,746 | $13,930 | $13,930 |
|---|
7/19 | $15,199 | $13,786 | $13,999 | $13,999 |
|---|
8/19 | $15,308 | $13,459 | $13,713 | $13,713 |
|---|
9/19 | $15,275 | $13,742 | $14,005 | $14,005 |
|---|
10/19 | $15,494 | $14,119 | $14,361 | $14,361 |
|---|
11/19 | $15,977 | $14,463 | $14,761 | $14,761 |
|---|
12/19 | $16,408 | $14,973 | $15,203 | $15,203 |
|---|
1/20 | $16,655 | $14,807 | $15,111 | $15,111 |
|---|
2/20 | $15,376 | $13,611 | $13,834 | $13,834 |
|---|
3/20 | $14,119 | $11,774 | $12,003 | $12,003 |
|---|
4/20 | $15,600 | $13,035 | $13,314 | $13,314 |
|---|
5/20 | $16,240 | $13,602 | $13,957 | $13,957 |
|---|
6/20 | $16,610 | $14,036 | $14,326 | $14,326 |
|---|
7/20 | $17,553 | $14,779 | $15,012 | $15,012 |
|---|
8/20 | $18,305 | $15,683 | $16,015 | $16,015 |
|---|
9/20 | $17,800 | $15,178 | $15,462 | $15,462 |
|---|
10/20 | $16,947 | $14,809 | $14,988 | $14,988 |
|---|
11/20 | $18,316 | $16,634 | $16,904 | $16,904 |
|---|
12/20 | $18,957 | $17,406 | $17,621 | $17,621 |
|---|
1/21 | $18,532 | $17,327 | $17,446 | $17,446 |
|---|
2/21 | $18,624 | $17,729 | $17,893 | $17,893 |
|---|
3/21 | $19,394 | $18,202 | $18,488 | $18,488 |
|---|
4/21 | $20,335 | $18,998 | $19,349 | $19,349 |
|---|
5/21 | $20,335 | $19,294 | $19,627 | $19,627 |
|---|
6/21 | $20,576 | $19,548 | $19,920 | $19,920 |
|---|
7/21 | $21,173 | $19,682 | $20,277 | $20,277 |
|---|
8/21 | $21,472 | $20,175 | $20,781 | $20,781 |
|---|
9/21 | $20,542 | $19,342 | $19,919 | $19,919 |
|---|
10/21 | $21,644 | $20,329 | $21,047 | $21,047 |
|---|
11/21 | $20,978 | $19,839 | $20,586 | $20,586 |
|---|
12/21 | $22,408 | $20,633 | $21,465 | $21,465 |
|---|
1/22 | $21,067 | $19,620 | $20,330 | $20,330 |
|---|
2/22 | $20,309 | $19,113 | $19,816 | $19,816 |
|---|
3/22 | $20,390 | $19,527 | $20,359 | $20,359 |
|---|
4/22 | $18,990 | $17,964 | $18,668 | $18,668 |
|---|
5/22 | $18,979 | $17,985 | $18,682 | $18,682 |
|---|
6/22 | $17,742 | $16,469 | $17,064 | $17,064 |
|---|
7/22 | $19,014 | $17,619 | $18,419 | $18,419 |
|---|
8/22 | $17,859 | $16,970 | $17,649 | $17,649 |
|---|
9/22 | $16,144 | $15,346 | $16,008 | $16,008 |
|---|
10/22 | $16,949 | $16,272 | $17,158 | $17,158 |
|---|
11/22 | $18,454 | $17,534 | $18,351 | $18,351 |
|---|
12/22 | $17,722 | $16,844 | $17,571 | $17,571 |
|---|
1/23 | $18,834 | $18,051 | $18,815 | $18,815 |
|---|
2/23 | $18,015 | $17,534 | $18,362 | $18,362 |
|---|
3/23 | $19,022 | $18,075 | $18,930 | $18,930 |
|---|
4/23 | $19,443 | $18,334 | $19,261 | $19,261 |
|---|
5/23 | $19,209 | $18,138 | $19,069 | $19,069 |
|---|
6/23 | $20,262 | $19,191 | $20,222 | $20,222 |
|---|
7/23 | $20,602 | $19,894 | $20,902 | $20,902 |
|---|
8/23 | $20,450 | $19,338 | $20,403 | $20,403 |
|---|
9/23 | $19,361 | $18,538 | $19,522 | $19,522 |
|---|
10/23 | $18,834 | $17,981 | $18,956 | $18,956 |
|---|
11/23 | $20,684 | $19,640 | $20,733 | $20,733 |
|---|
12/23 | $21,479 | $20,584 | $21,751 | $21,751 |
|---|
1/24 | $21,900 | $20,704 | $22,012 | $22,012 |
|---|
2/24 | $22,768 | $21,593 | $22,945 | $22,945 |
|---|
3/24 | $22,779 | $22,271 | $23,683 | $23,683 |
|---|
4/24 | $21,725 | $21,536 | $22,803 | $22,803 |
|---|
5/24 | $22,393 | $22,411 | $23,821 | $23,821 |
|---|
6/24 | $22,826 | $22,910 | $24,314 | $24,306 |
|---|
7/24 | $23,447 | $23,279 | $24,706 | $24,734 |
|---|
8/24 | $24,092 | $23,870 | $25,333 | $25,388 |
|---|
9/24 | $24,678 | $24,425 | $25,922 | $25,853 |
|---|
10/24 | $24,221 | $23,877 | $25,340 | $25,340 |
|---|
11/24 | $25,592 | $24,770 | $26,288 | $26,503 |
|---|
12/24 | $24,896 | $24,183 | $25,665 | $25,812 |
|---|
|
|
| Average Annual Return [Table Text Block] |
AATR | 1 Year | 5 Years | 10 Years |
|---|
Class A | 15.91% | 8.70% | 10.14% |
|---|
Class A, with 5.25% maximum front end sales charge | 9.80% | 7.53% | 9.55% |
|---|
MSCI All Country World Net Index | 17.49% | 10.06% | 9.23% |
|---|
MSCI World/MSCI AC World Blended Index | 18.00% | 11.04% | 9.88% |
|---|
MSCI World Net Index | 18.67% | 11.17% | 9.95% |
|---|
|
|
| Material Change Date |
|
Dec. 31, 2023
|
| AssetsNet |
$ 58,794,206
|
|
| Holdings Count | Holding |
37
|
|
| Advisory Fees Paid, Amount |
$ 183,142
|
|
| InvestmentCompanyPortfolioTurnover |
73.00%
|
|
| Additional Fund Statistics [Text Block] |
Total Net Assets | $58,794,206 |
|---|
# of Portfolio Holdings | 37 |
|---|
Portfolio Turnover Rate | 73% |
|---|
Total Advisory Fees Paid | $183,142 |
|---|
|
|
| Holdings [Text Block] |
Sector Allocation (% of total investments)Value | Value |
|---|
Short-Term Investments | 1.4% | Consumer Staples | 1.6% | Consumer Discretionary | 5.9% | Communication Services | 10.2% | Health Care | 15.7% | Industrials | 17.5% | Information Technology | 23.2% | Financials | 24.5% |
Top Ten Holdings (% of total investments)Footnote ReferenceaSAP SE | 7.9% | Alphabet, Inc. | 5.6% | Visa, Inc. | 4.7% | UnitedHealth Group, Inc. | 3.5% | Mastercard, Inc. | 3.4% | Galderma Group AG | 3.3% | Microsoft Corp. | 3.3% | Tradeweb Markets, Inc. | 3.2% | Aon PLC | 3.1% | Booking Holdings, Inc. | 3.0% | Total | 41.0% |
| Footnote | Description | Footnotea | Excluding cash equivalents. |
|
|
| Material Fund Change [Text Block] |
This is a summary of certain changes to the Fund since December 31, 2023. For more complete information, you may review the Fund's next prospectus, which we expect to be available by May 1, 2025 at www.morganstanley.com/im/shareholderreports or upon request by contacting us at 1-800-869-6397. Effective June 27, 2024, the Global Stars Portfolio was changed from Global Sustain Portfolio. |
|
| Material Fund Change Name [Text Block] |
Effective June 27, 2024, the Global Stars Portfolio was changed from Global Sustain Portfolio.
|
|
| Summary of Change Legend [Text Block] |
This is a summary of certain changes to the Fund since December 31, 2023. For more complete information, you may review the Fund's next prospectus, which we expect to be available by May 1, 2025 at www.morganstanley.com/im/shareholderreports or upon request by contacting us at 1-800-869-6397.
|
|
| Updated Prospectus Web Address |
<span style="box-sizing: border-box; color: rgb(0, 0, 0); display: inline; flex-wrap: nowrap; font-size: 10.6667px; font-weight: 400; grid-area: auto; line-height: 16px; margin: 0px; overflow: visible; text-align: left;">www.morganstanley.com/im/shareholderreports</span>
|
|
| C000155911 |
|
|
| Shareholder Report [Line Items] |
|
|
| Fund Name |
Morgan Stanley Institutional Fund, Inc. - Global Stars Portfolio
|
|
| Class Name |
Class C
|
|
| Trading Symbol |
MSGQX
|
|
| Annual or Semi-Annual Statement [Text Block] |
This annual shareholder report contains important information about Morgan Stanley Institutional Fund, Inc. - Global Stars Portfolio for the period of January 1, 2024 to December 31, 2024.
|
|
| Shareholder Report Annual or Semi-Annual |
Annual Shareholder Report
|
|
| Additional Information [Text Block] |
You can find additional information about the Fund at www.morganstanley.com/im/shareholderreports. You can also request this information by contacting us at 1-800-869-6397.
|
|
| Material Fund Change Notice [Text Block] |
This report describes changes to the Fund that occurred during the reporting period.
|
|
| Additional Information Phone Number |
1-800-869-6397
|
|
| Additional Information Website |
<span style="box-sizing: border-box; color: rgb(0, 0, 0); display: inline; flex-wrap: nowrap; font-size: 10.6667px; font-weight: 400; grid-area: auto; line-height: 16px; margin: 0px; overflow: visible; text-align: left;">www.morganstanley.com/im/shareholderreports</span>
|
|
| Expenses [Text Block] |
What were the Fund costs for the last year?(based on a hypothetical $10,000 investment) Class Name | Costs of a $10,000 investment | Costs paid as a percentage of a $10,000 investment |
|---|
Class C | $206 | 1.92% |
|---|
|
|
| Expenses Paid, Amount |
$ 206
|
|
| Expense Ratio, Percent |
1.92%
|
|
| Factors Affecting Performance [Text Block] |
How did the Fund perform last year and what affected its performance?Key contributors to (↑) and detractors from (↓) performance, relative to the MSCI World/MSCI AC World Blended Index: ↓ Stock selection, driven by weakness in health care, financials and information technology ↑ Sector allocation, aided by the zero weight in materials |
|
| Line Graph [Table Text Block] |
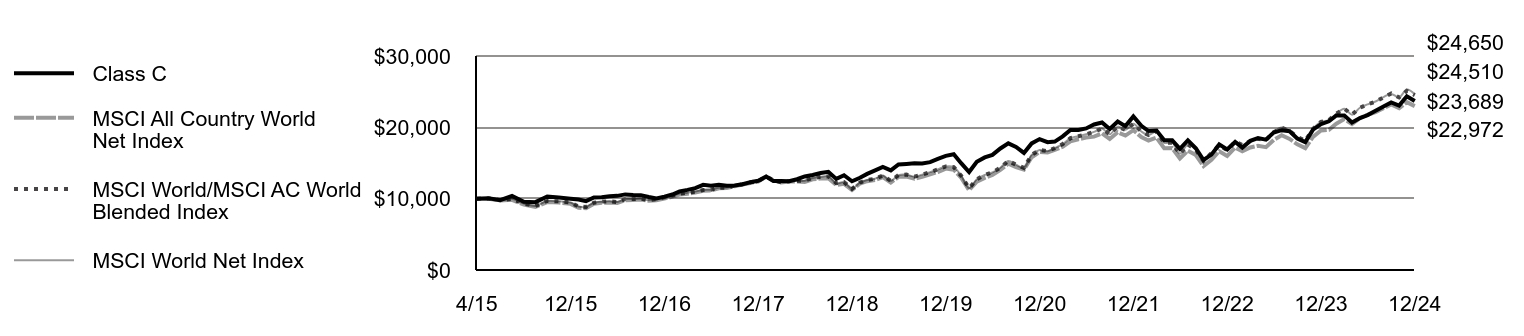 | Class C | MSCI All Country World Net Index | MSCI World/MSCI AC World Blended Index | MSCI World Net Index |
|---|
4/15 | $10,000 | $10,000 | $10,000 | $10,000 |
|---|
5/15 | $10,059 | $9,987 | $10,034 | $10,034 |
|---|
6/15 | $9,796 | $9,752 | $9,801 | $9,801 |
|---|
7/15 | $10,377 | $9,837 | $9,977 | $9,977 |
|---|
8/15 | $9,576 | $9,162 | $9,317 | $9,317 |
|---|
9/15 | $9,508 | $8,830 | $8,973 | $8,973 |
|---|
10/15 | $10,309 | $9,523 | $9,684 | $9,684 |
|---|
11/15 | $10,155 | $9,445 | $9,636 | $9,636 |
|---|
12/15 | $9,987 | $9,274 | $9,467 | $9,467 |
|---|
1/16 | $9,890 | $8,715 | $8,900 | $8,900 |
|---|
2/16 | $9,660 | $8,655 | $8,834 | $8,834 |
|---|
3/16 | $10,173 | $9,296 | $9,434 | $9,434 |
|---|
4/16 | $10,199 | $9,434 | $9,583 | $9,583 |
|---|
5/16 | $10,332 | $9,446 | $9,637 | $9,637 |
|---|
6/16 | $10,394 | $9,388 | $9,529 | $9,529 |
|---|
7/16 | $10,598 | $9,793 | $9,931 | $9,931 |
|---|
8/16 | $10,508 | $9,826 | $9,940 | $9,940 |
|---|
9/16 | $10,490 | $9,886 | $9,992 | $9,992 |
|---|
10/16 | $10,230 | $9,718 | $9,799 | $9,799 |
|---|
11/16 | $10,041 | $9,792 | $9,940 | $9,940 |
|---|
12/16 | $10,293 | $10,004 | $10,178 | $10,178 |
|---|
1/17 | $10,582 | $10,277 | $10,423 | $10,423 |
|---|
2/17 | $11,026 | $10,566 | $10,713 | $10,713 |
|---|
3/17 | $11,229 | $10,695 | $10,827 | $10,827 |
|---|
4/17 | $11,470 | $10,861 | $10,987 | $10,987 |
|---|
5/17 | $11,933 | $11,101 | $11,219 | $11,219 |
|---|
6/17 | $11,808 | $11,152 | $11,263 | $11,263 |
|---|
7/17 | $11,944 | $11,463 | $11,532 | $11,532 |
|---|
8/17 | $11,827 | $11,507 | $11,548 | $11,548 |
|---|
9/17 | $11,847 | $11,730 | $11,807 | $11,807 |
|---|
10/17 | $12,031 | $11,973 | $12,031 | $12,031 |
|---|
11/17 | $12,292 | $12,205 | $12,291 | $12,291 |
|---|
12/17 | $12,502 | $12,402 | $12,458 | $12,458 |
|---|
1/18 | $13,093 | $13,101 | $13,115 | $13,115 |
|---|
2/18 | $12,461 | $12,551 | $12,572 | $12,572 |
|---|
3/18 | $12,481 | $12,283 | $12,298 | $12,298 |
|---|
4/18 | $12,451 | $12,400 | $12,439 | $12,439 |
|---|
5/18 | $12,726 | $12,415 | $12,517 | $12,517 |
|---|
6/18 | $13,114 | $12,348 | $12,511 | $12,511 |
|---|
7/18 | $13,326 | $12,720 | $12,902 | $12,902 |
|---|
8/18 | $13,594 | $12,820 | $13,062 | $13,062 |
|---|
9/18 | $13,769 | $12,876 | $13,134 | $13,134 |
|---|
10/18 | $12,771 | $11,911 | $12,170 | $12,170 |
|---|
11/18 | $13,285 | $12,086 | $12,308 | $12,308 |
|---|
12/18 | $12,440 | $11,234 | $11,372 | $11,372 |
|---|
1/19 | $12,935 | $12,121 | $12,257 | $12,257 |
|---|
2/19 | $13,474 | $12,446 | $12,626 | $12,626 |
|---|
3/19 | $13,959 | $12,602 | $12,792 | $12,792 |
|---|
4/19 | $14,443 | $13,028 | $13,245 | $13,245 |
|---|
5/19 | $13,959 | $12,255 | $12,481 | $12,481 |
|---|
6/19 | $14,795 | $13,057 | $13,303 | $13,303 |
|---|
7/19 | $14,872 | $13,095 | $13,369 | $13,369 |
|---|
8/19 | $14,960 | $12,785 | $13,096 | $13,096 |
|---|
9/19 | $14,927 | $13,054 | $13,374 | $13,374 |
|---|
10/19 | $15,126 | $13,411 | $13,715 | $13,715 |
|---|
11/19 | $15,588 | $13,738 | $14,097 | $14,097 |
|---|
12/19 | $16,001 | $14,222 | $14,519 | $14,519 |
|---|
1/20 | $16,237 | $14,065 | $14,431 | $14,431 |
|---|
2/20 | $14,977 | $12,929 | $13,211 | $13,211 |
|---|
3/20 | $13,739 | $11,184 | $11,463 | $11,463 |
|---|
4/20 | $15,168 | $12,382 | $12,715 | $12,715 |
|---|
5/20 | $15,787 | $12,920 | $13,329 | $13,329 |
|---|
6/20 | $16,136 | $13,333 | $13,682 | $13,682 |
|---|
7/20 | $17,036 | $14,038 | $14,336 | $14,336 |
|---|
8/20 | $17,756 | $14,897 | $15,294 | $15,294 |
|---|
9/20 | $17,261 | $14,417 | $14,766 | $14,766 |
|---|
10/20 | $16,417 | $14,067 | $14,313 | $14,313 |
|---|
11/20 | $17,745 | $15,800 | $16,143 | $16,143 |
|---|
12/20 | $18,350 | $16,534 | $16,828 | $16,828 |
|---|
1/21 | $17,924 | $16,459 | $16,661 | $16,661 |
|---|
2/21 | $18,004 | $16,840 | $17,088 | $17,088 |
|---|
3/21 | $18,730 | $17,290 | $17,656 | $17,656 |
|---|
4/21 | $19,639 | $18,046 | $18,478 | $18,478 |
|---|
5/21 | $19,628 | $18,327 | $18,744 | $18,744 |
|---|
6/21 | $19,846 | $18,568 | $19,023 | $19,023 |
|---|
7/21 | $20,399 | $18,696 | $19,364 | $19,364 |
|---|
8/21 | $20,675 | $19,164 | $19,846 | $19,846 |
|---|
9/21 | $19,766 | $18,372 | $19,022 | $19,022 |
|---|
10/21 | $20,813 | $19,310 | $20,099 | $20,099 |
|---|
11/21 | $20,169 | $18,845 | $19,659 | $19,659 |
|---|
12/21 | $21,530 | $19,599 | $20,499 | $20,499 |
|---|
1/22 | $20,221 | $18,637 | $19,415 | $19,415 |
|---|
2/22 | $19,485 | $18,155 | $18,924 | $18,924 |
|---|
3/22 | $19,555 | $18,548 | $19,443 | $19,443 |
|---|
4/22 | $18,199 | $17,064 | $17,828 | $17,828 |
|---|
5/22 | $18,176 | $17,084 | $17,841 | $17,841 |
|---|
6/22 | $16,983 | $15,644 | $16,296 | $16,296 |
|---|
7/22 | $18,187 | $16,736 | $17,590 | $17,590 |
|---|
8/22 | $17,065 | $16,120 | $16,854 | $16,854 |
|---|
9/22 | $15,417 | $14,577 | $15,287 | $15,287 |
|---|
10/22 | $16,177 | $15,456 | $16,385 | $16,385 |
|---|
11/22 | $17,603 | $16,655 | $17,525 | $17,525 |
|---|
12/22 | $16,893 | $16,000 | $16,780 | $16,780 |
|---|
1/23 | $17,949 | $17,147 | $17,968 | $17,968 |
|---|
2/23 | $17,151 | $16,655 | $17,536 | $17,536 |
|---|
3/23 | $18,102 | $17,169 | $18,078 | $18,078 |
|---|
4/23 | $18,500 | $17,416 | $18,395 | $18,395 |
|---|
5/23 | $18,278 | $17,229 | $18,211 | $18,211 |
|---|
6/23 | $19,280 | $18,229 | $19,312 | $19,312 |
|---|
7/23 | $19,603 | $18,897 | $19,961 | $19,961 |
|---|
8/23 | $19,458 | $18,369 | $19,484 | $19,484 |
|---|
9/23 | $18,422 | $17,609 | $18,644 | $18,644 |
|---|
10/23 | $17,921 | $17,080 | $18,103 | $18,103 |
|---|
11/23 | $19,681 | $18,656 | $19,800 | $19,800 |
|---|
12/23 | $20,437 | $19,552 | $20,772 | $20,772 |
|---|
1/24 | $20,839 | $19,667 | $21,021 | $21,021 |
|---|
2/24 | $21,664 | $20,511 | $21,912 | $21,912 |
|---|
3/24 | $21,675 | $21,155 | $22,617 | $22,617 |
|---|
4/24 | $20,671 | $20,457 | $21,777 | $21,777 |
|---|
5/24 | $21,307 | $21,288 | $22,749 | $22,749 |
|---|
6/24 | $21,719 | $21,762 | $23,219 | $23,212 |
|---|
7/24 | $22,310 | $22,113 | $23,594 | $23,621 |
|---|
8/24 | $22,924 | $22,674 | $24,193 | $24,245 |
|---|
9/24 | $23,481 | $23,201 | $24,755 | $24,689 |
|---|
10/24 | $23,046 | $22,680 | $24,199 | $24,199 |
|---|
11/24 | $24,351 | $23,529 | $25,105 | $25,310 |
|---|
12/24 | $23,689 | $22,972 | $24,510 | $24,650 |
|---|
|
|
| Average Annual Return [Table Text Block] |
AATR | 1 Year | 5 Years | Since 4/30/15
(Inception) |
|---|
Class C, with conversion to Class A after 8 years | 15.03% | 7.89% | 9.33% |
|---|
Class C, with 1% maximum contingent deferred sales charge and conversion to Class A after 8 years | 14.16% | 7.89% | 9.33% |
|---|
MSCI All Country World Net Index | 17.49% | 10.06% | 8.98% |
|---|
MSCI World/MSCI AC World Blended Index | 18.00% | 11.04% | 9.71% |
|---|
MSCI World Net Index | 18.67% | 11.17% | 9.78% |
|---|
|
|
| Performance Inception Date |
Apr. 30, 2015
|
|
| Material Change Date |
|
Dec. 31, 2023
|
| AssetsNet |
$ 58,794,206
|
|
| Holdings Count | Holding |
37
|
|
| Advisory Fees Paid, Amount |
$ 183,142
|
|
| InvestmentCompanyPortfolioTurnover |
73.00%
|
|
| Additional Fund Statistics [Text Block] |
Total Net Assets | $58,794,206 |
|---|
# of Portfolio Holdings | 37 |
|---|
Portfolio Turnover Rate | 73% |
|---|
Total Advisory Fees Paid | $183,142 |
|---|
|
|
| Holdings [Text Block] |
Sector Allocation (% of total investments)Value | Value |
|---|
Short-Term Investments | 1.4% | Consumer Staples | 1.6% | Consumer Discretionary | 5.9% | Communication Services | 10.2% | Health Care | 15.7% | Industrials | 17.5% | Information Technology | 23.2% | Financials | 24.5% |
Top Ten Holdings (% of total investments)Footnote ReferenceaSAP SE | 7.9% | Alphabet, Inc. | 5.6% | Visa, Inc. | 4.7% | UnitedHealth Group, Inc. | 3.5% | Mastercard, Inc. | 3.4% | Galderma Group AG | 3.3% | Microsoft Corp. | 3.3% | Tradeweb Markets, Inc. | 3.2% | Aon PLC | 3.1% | Booking Holdings, Inc. | 3.0% | Total | 41.0% |
| Footnote | Description | Footnotea | Excluding cash equivalents. |
|
|
| Material Fund Change [Text Block] |
This is a summary of certain changes to the Fund since December 31, 2023. For more complete information, you may review the Fund's next prospectus, which we expect to be available by May 1, 2025 at www.morganstanley.com/im/shareholderreports or upon request by contacting us at 1-800-869-6397. Effective June 27, 2024, the Global Stars Portfolio was changed from Global Sustain Portfolio. |
|
| Material Fund Change Name [Text Block] |
Effective June 27, 2024, the Global Stars Portfolio was changed from Global Sustain Portfolio.
|
|
| Summary of Change Legend [Text Block] |
This is a summary of certain changes to the Fund since December 31, 2023. For more complete information, you may review the Fund's next prospectus, which we expect to be available by May 1, 2025 at www.morganstanley.com/im/shareholderreports or upon request by contacting us at 1-800-869-6397.
|
|
| Updated Prospectus Web Address |
<span style="box-sizing: border-box; color: rgb(0, 0, 0); display: inline; flex-wrap: nowrap; font-size: 10.6667px; font-weight: 400; grid-area: auto; line-height: 16px; margin: 0px; overflow: visible; text-align: left;">www.morganstanley.com/im/shareholderreports</span>
|
|
| C000129960 |
|
|
| Shareholder Report [Line Items] |
|
|
| Fund Name |
Morgan Stanley Institutional Fund, Inc. - Global Stars Portfolio
|
|
| Class Name |
Class I
|
|
| Trading Symbol |
MGQIX
|
|
| Annual or Semi-Annual Statement [Text Block] |
This annual shareholder report contains important information about Morgan Stanley Institutional Fund, Inc. - Global Stars Portfolio for the period of January 1, 2024 to December 31, 2024.
|
|
| Shareholder Report Annual or Semi-Annual |
Annual Shareholder Report
|
|
| Additional Information [Text Block] |
You can find additional information about the Fund at www.morganstanley.com/im/shareholderreports. You can also request this information by contacting us at 1-800-869-6397.
|
|
| Material Fund Change Notice [Text Block] |
This report describes changes to the Fund that occurred during the reporting period.
|
|
| Additional Information Phone Number |
1-800-869-6397
|
|
| Additional Information Website |
<span style="box-sizing: border-box; color: rgb(0, 0, 0); display: inline; flex-wrap: nowrap; font-size: 10.6667px; font-weight: 400; grid-area: auto; line-height: 16px; margin: 0px; overflow: visible; text-align: left;">www.morganstanley.com/im/shareholderreports</span>
|
|
| Expenses [Text Block] |
What were the Fund costs for the last year?(based on a hypothetical $10,000 investment) Class Name | Costs of a $10,000 investment | Costs paid as a percentage of a $10,000 investment |
|---|
Class I | $92 | 0.85% |
|---|
|
|
| Expenses Paid, Amount |
$ 92
|
|
| Expense Ratio, Percent |
0.85%
|
|
| Factors Affecting Performance [Text Block] |
How did the Fund perform last year and what affected its performance?Key contributors to (↑) and detractors from (↓) performance, relative to the MSCI World/MSCI AC World Blended Index: ↓ Stock selection, driven by weakness in health care, financials and information technology ↑ Sector allocation, aided by the zero weight in materials |
|
| Line Graph [Table Text Block] |
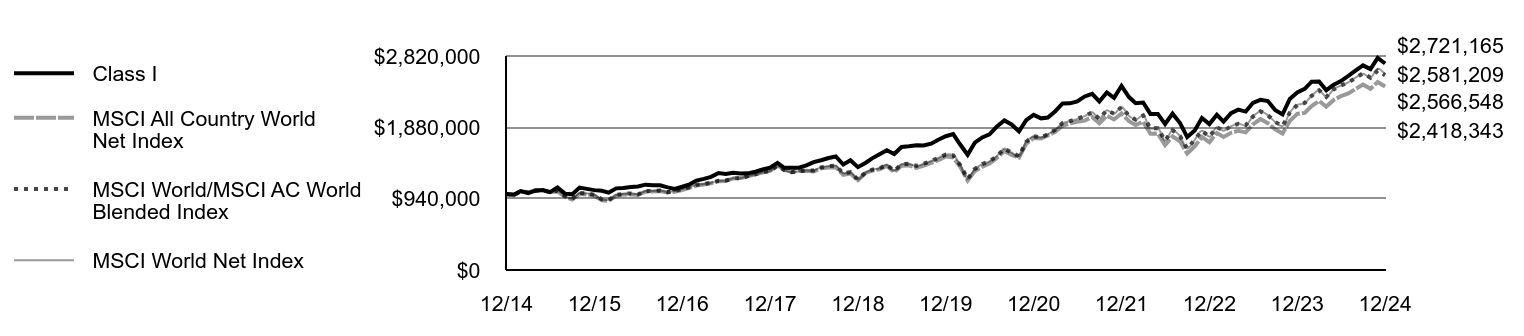 | Class I | MSCI All Country World Net Index | MSCI World/MSCI AC World Blended Index | MSCI World Net Index |
|---|
12/14 | $1,000,000 | $1,000,000 | $1,000,000 | $1,000,000 |
|---|
1/15 | $995,591 | $984,369 | $981,880 | $981,880 |
|---|
2/15 | $1,040,564 | $1,039,171 | $1,039,407 | $1,039,407 |
|---|
3/15 | $1,011,464 | $1,023,066 | $1,023,137 | $1,023,137 |
|---|
4/15 | $1,045,855 | $1,052,753 | $1,047,132 | $1,047,132 |
|---|
5/15 | $1,052,910 | $1,051,379 | $1,050,739 | $1,050,739 |
|---|
6/15 | $1,026,455 | $1,026,626 | $1,026,307 | $1,026,307 |
|---|
7/15 | $1,088,485 | $1,035,542 | $1,044,729 | $1,044,729 |
|---|
8/15 | $1,006,252 | $964,555 | $975,595 | $975,595 |
|---|
9/15 | $999,178 | $929,611 | $939,611 | $939,611 |
|---|
10/15 | $1,085,832 | $1,002,568 | $1,014,069 | $1,014,069 |
|---|
11/15 | $1,069,032 | $994,291 | $1,009,024 | $1,009,024 |
|---|
12/15 | $1,052,654 | $976,361 | $991,288 | $991,288 |
|---|
1/16 | $1,043,436 | $917,476 | $931,985 | $931,985 |
|---|
2/16 | $1,020,392 | $911,160 | $925,048 | $925,048 |
|---|
3/16 | $1,075,698 | $978,686 | $987,821 | $987,821 |
|---|
4/16 | $1,079,385 | $993,133 | $1,003,452 | $1,003,452 |
|---|
5/16 | $1,094,133 | $994,388 | $1,009,088 | $1,009,088 |
|---|
6/16 | $1,101,507 | $988,364 | $997,781 | $997,781 |
|---|
7/16 | $1,124,642 | $1,030,959 | $1,039,935 | $1,039,935 |
|---|
8/16 | $1,117,151 | $1,034,426 | $1,040,800 | $1,040,800 |
|---|
9/16 | $1,115,278 | $1,040,765 | $1,046,328 | $1,046,328 |
|---|
10/16 | $1,088,122 | $1,023,101 | $1,026,079 | $1,026,079 |
|---|
11/16 | $1,069,394 | $1,030,876 | $1,040,833 | $1,040,833 |
|---|
12/16 | $1,096,858 | $1,053,145 | $1,065,738 | $1,065,738 |
|---|
1/17 | $1,129,327 | $1,081,941 | $1,091,460 | $1,091,460 |
|---|
2/17 | $1,178,031 | $1,112,291 | $1,121,741 | $1,121,741 |
|---|
3/17 | $1,200,354 | $1,125,898 | $1,133,690 | $1,133,690 |
|---|
4/17 | $1,227,750 | $1,143,445 | $1,150,476 | $1,150,476 |
|---|
5/17 | $1,278,484 | $1,168,695 | $1,174,814 | $1,174,814 |
|---|
6/17 | $1,266,308 | $1,174,010 | $1,179,334 | $1,179,334 |
|---|
7/17 | $1,281,643 | $1,206,819 | $1,207,558 | $1,207,558 |
|---|
8/17 | $1,270,436 | $1,211,443 | $1,209,259 | $1,209,259 |
|---|
9/17 | $1,273,493 | $1,234,848 | $1,236,399 | $1,236,399 |
|---|
10/17 | $1,294,887 | $1,260,490 | $1,259,766 | $1,259,766 |
|---|
11/17 | $1,324,432 | $1,284,891 | $1,287,061 | $1,287,061 |
|---|
12/17 | $1,347,587 | $1,305,605 | $1,304,467 | $1,304,467 |
|---|
1/18 | $1,412,427 | $1,379,263 | $1,373,343 | $1,373,343 |
|---|
2/18 | $1,346,507 | $1,321,336 | $1,316,449 | $1,316,449 |
|---|
3/18 | $1,348,668 | $1,293,051 | $1,287,755 | $1,287,755 |
|---|
4/18 | $1,347,587 | $1,305,399 | $1,302,553 | $1,302,553 |
|---|
5/18 | $1,377,846 | $1,307,029 | $1,310,715 | $1,310,715 |
|---|
6/18 | $1,421,072 | $1,299,951 | $1,310,090 | $1,310,090 |
|---|
7/18 | $1,445,787 | $1,339,153 | $1,351,009 | $1,351,009 |
|---|
8/18 | $1,476,316 | $1,349,674 | $1,367,725 | $1,367,725 |
|---|
9/18 | $1,495,942 | $1,355,548 | $1,375,340 | $1,375,340 |
|---|
10/18 | $1,390,180 | $1,253,965 | $1,274,352 | $1,274,352 |
|---|
11/18 | $1,446,877 | $1,272,304 | $1,288,828 | $1,288,828 |
|---|
12/18 | $1,355,625 | $1,182,690 | $1,190,828 | $1,190,828 |
|---|
1/19 | $1,410,646 | $1,276,075 | $1,283,482 | $1,283,482 |
|---|
2/19 | $1,471,520 | $1,310,206 | $1,322,076 | $1,322,076 |
|---|
3/19 | $1,525,371 | $1,326,684 | $1,339,441 | $1,339,441 |
|---|
4/19 | $1,579,221 | $1,371,480 | $1,386,936 | $1,386,936 |
|---|
5/19 | $1,528,883 | $1,290,125 | $1,306,909 | $1,306,909 |
|---|
6/19 | $1,621,365 | $1,374,602 | $1,393,027 | $1,393,027 |
|---|
7/19 | $1,630,730 | $1,378,630 | $1,399,928 | $1,399,928 |
|---|
8/19 | $1,643,607 | $1,345,925 | $1,371,293 | $1,371,293 |
|---|
9/19 | $1,640,095 | $1,374,246 | $1,400,475 | $1,400,475 |
|---|
10/19 | $1,664,679 | $1,411,857 | $1,436,114 | $1,436,114 |
|---|
11/19 | $1,716,188 | $1,446,323 | $1,476,110 | $1,476,110 |
|---|
12/19 | $1,762,719 | $1,497,255 | $1,520,331 | $1,520,331 |
|---|
1/20 | $1,790,374 | $1,480,717 | $1,511,078 | $1,511,078 |
|---|
2/20 | $1,653,301 | $1,361,120 | $1,383,353 | $1,383,353 |
|---|
3/20 | $1,518,632 | $1,177,364 | $1,200,277 | $1,200,277 |
|---|
4/20 | $1,677,349 | $1,303,489 | $1,331,400 | $1,331,400 |
|---|
5/20 | $1,747,088 | $1,360,179 | $1,395,718 | $1,395,718 |
|---|
6/20 | $1,787,970 | $1,403,640 | $1,432,636 | $1,432,636 |
|---|
7/20 | $1,890,174 | $1,477,875 | $1,501,175 | $1,501,175 |
|---|
8/20 | $1,970,734 | $1,568,328 | $1,601,475 | $1,601,475 |
|---|
9/20 | $1,917,829 | $1,517,760 | $1,546,226 | $1,546,226 |
|---|
10/20 | $1,826,446 | $1,480,866 | $1,498,795 | $1,498,795 |
|---|
11/20 | $1,974,342 | $1,663,401 | $1,690,434 | $1,690,434 |
|---|
12/20 | $2,044,024 | $1,740,632 | $1,762,102 | $1,762,102 |
|---|
1/21 | $1,998,382 | $1,732,716 | $1,744,589 | $1,744,589 |
|---|
2/21 | $2,008,251 | $1,772,852 | $1,789,294 | $1,789,294 |
|---|
3/21 | $2,092,134 | $1,820,203 | $1,848,827 | $1,848,827 |
|---|
4/21 | $2,194,520 | $1,899,787 | $1,934,872 | $1,934,872 |
|---|
5/21 | $2,195,754 | $1,929,352 | $1,962,744 | $1,962,744 |
|---|
6/21 | $2,221,658 | $1,954,776 | $1,991,999 | $1,991,999 |
|---|
7/21 | $2,287,038 | $1,968,246 | $2,027,681 | $2,027,681 |
|---|
8/21 | $2,320,344 | $2,017,510 | $2,078,147 | $2,078,147 |
|---|
9/21 | $2,220,425 | $1,934,167 | $1,991,861 | $1,991,861 |
|---|
10/21 | $2,340,081 | $2,032,894 | $2,104,681 | $2,104,681 |
|---|
11/21 | $2,268,534 | $1,983,940 | $2,058,561 | $2,058,561 |
|---|
12/21 | $2,424,655 | $2,063,299 | $2,146,544 | $2,146,544 |
|---|
1/22 | $2,278,924 | $1,961,966 | $2,032,969 | $2,032,969 |
|---|
2/22 | $2,198,521 | $1,911,293 | $1,981,553 | $1,981,553 |
|---|
3/22 | $2,207,315 | $1,952,690 | $2,035,933 | $2,035,933 |
|---|
4/22 | $2,056,560 | $1,796,393 | $1,866,801 | $1,866,801 |
|---|
5/22 | $2,056,560 | $1,798,496 | $1,868,215 | $1,868,215 |
|---|
6/22 | $1,923,392 | $1,646,889 | $1,706,387 | $1,706,387 |
|---|
7/22 | $2,060,328 | $1,761,895 | $1,841,868 | $1,841,868 |
|---|
8/22 | $1,935,955 | $1,697,031 | $1,764,863 | $1,764,863 |
|---|
9/22 | $1,751,279 | $1,534,576 | $1,600,802 | $1,600,802 |
|---|
10/22 | $1,839,220 | $1,627,183 | $1,715,760 | $1,715,760 |
|---|
11/22 | $2,002,539 | $1,753,393 | $1,835,057 | $1,835,057 |
|---|
12/22 | $1,923,111 | $1,684,395 | $1,757,127 | $1,757,127 |
|---|
1/23 | $2,045,836 | $1,805,127 | $1,881,455 | $1,881,455 |
|---|
2/23 | $1,956,006 | $1,753,392 | $1,836,228 | $1,836,228 |
|---|
3/23 | $2,066,079 | $1,807,454 | $1,892,966 | $1,892,966 |
|---|
4/23 | $2,112,892 | $1,833,431 | $1,926,149 | $1,926,149 |
|---|
5/23 | $2,087,587 | $1,813,795 | $1,906,920 | $1,906,920 |
|---|
6/23 | $2,202,721 | $1,919,105 | $2,022,246 | $2,022,246 |
|---|
7/23 | $2,241,942 | $1,989,360 | $2,090,179 | $2,090,179 |
|---|
8/23 | $2,225,495 | $1,933,769 | $2,040,254 | $2,040,254 |
|---|
9/23 | $2,107,831 | $1,853,806 | $1,952,240 | $1,952,240 |
|---|
10/23 | $2,050,897 | $1,798,068 | $1,895,595 | $1,895,595 |
|---|
11/23 | $2,253,329 | $1,964,022 | $2,073,311 | $2,073,311 |
|---|
12/23 | $2,340,287 | $2,058,362 | $2,175,098 | $2,175,098 |
|---|
1/24 | $2,386,050 | $2,070,429 | $2,201,200 | $2,201,200 |
|---|
2/24 | $2,481,390 | $2,159,278 | $2,294,526 | $2,294,526 |
|---|
3/24 | $2,483,933 | $2,227,072 | $2,368,260 | $2,368,260 |
|---|
4/24 | $2,369,524 | $2,153,595 | $2,280,292 | $2,280,292 |
|---|
5/24 | $2,441,983 | $2,241,060 | $2,382,112 | $2,382,112 |
|---|
6/24 | $2,490,289 | $2,290,973 | $2,431,373 | $2,430,583 |
|---|
7/24 | $2,558,934 | $2,327,921 | $2,470,585 | $2,473,415 |
|---|
8/24 | $2,630,121 | $2,387,042 | $2,533,329 | $2,538,789 |
|---|
9/24 | $2,696,224 | $2,442,495 | $2,592,181 | $2,585,284 |
|---|
10/24 | $2,646,647 | $2,387,669 | $2,533,995 | $2,534,000 |
|---|
11/24 | $2,795,378 | $2,476,977 | $2,628,776 | $2,650,277 |
|---|
12/24 | $2,721,165 | $2,418,343 | $2,566,548 | $2,581,209 |
|---|
|
|
| Average Annual Return [Table Text Block] |
AATR | 1 Year | 5 Years | 10 Years |
|---|
Class I | 16.27% | 9.07% | 10.53% |
|---|
MSCI All Country World Net Index | 17.49% | 10.06% | 9.23% |
|---|
MSCI World/MSCI AC World Blended Index | 18.00% | 11.04% | 9.88% |
|---|
MSCI World Net Index | 18.67% | 11.17% | 9.95% |
|---|
|
|
| Material Change Date |
|
Dec. 31, 2023
|
| AssetsNet |
$ 58,794,206
|
|
| Holdings Count | Holding |
37
|
|
| Advisory Fees Paid, Amount |
$ 183,142
|
|
| InvestmentCompanyPortfolioTurnover |
73.00%
|
|
| Additional Fund Statistics [Text Block] |
Total Net Assets | $58,794,206 |
|---|
# of Portfolio Holdings | 37 |
|---|
Portfolio Turnover Rate | 73% |
|---|
Total Advisory Fees Paid | $183,142 |
|---|
|
|
| Holdings [Text Block] |
Sector Allocation (% of total investments)Value | Value |
|---|
Short-Term Investments | 1.4% | Consumer Staples | 1.6% | Consumer Discretionary | 5.9% | Communication Services | 10.2% | Health Care | 15.7% | Industrials | 17.5% | Information Technology | 23.2% | Financials | 24.5% |
Top Ten Holdings (% of total investments)Footnote ReferenceaSAP SE | 7.9% | Alphabet, Inc. | 5.6% | Visa, Inc. | 4.7% | UnitedHealth Group, Inc. | 3.5% | Mastercard, Inc. | 3.4% | Galderma Group AG | 3.3% | Microsoft Corp. | 3.3% | Tradeweb Markets, Inc. | 3.2% | Aon PLC | 3.1% | Booking Holdings, Inc. | 3.0% | Total | 41.0% |
| Footnote | Description | Footnotea | Excluding cash equivalents. |
|
|
| Material Fund Change [Text Block] |
This is a summary of certain changes to the Fund since December 31, 2023. For more complete information, you may review the Fund's next prospectus, which we expect to be available by May 1, 2025 at www.morganstanley.com/im/shareholderreports or upon request by contacting us at 1-800-869-6397. Effective June 27, 2024, the Global Stars Portfolio was changed from Global Sustain Portfolio. |
|
| Material Fund Change Name [Text Block] |
Effective June 27, 2024, the Global Stars Portfolio was changed from Global Sustain Portfolio.
|
|
| Summary of Change Legend [Text Block] |
This is a summary of certain changes to the Fund since December 31, 2023. For more complete information, you may review the Fund's next prospectus, which we expect to be available by May 1, 2025 at www.morganstanley.com/im/shareholderreports or upon request by contacting us at 1-800-869-6397.
|
|
| Updated Prospectus Web Address |
<span style="box-sizing: border-box; color: rgb(0, 0, 0); display: inline; flex-wrap: nowrap; font-size: 10.6667px; font-weight: 400; grid-area: auto; line-height: 16px; margin: 0px; overflow: visible; text-align: left;">www.morganstanley.com/im/shareholderreports</span>
|
|
| C000129962 |
|
|
| Shareholder Report [Line Items] |
|
|
| Fund Name |
Morgan Stanley Institutional Fund, Inc. - Global Stars Portfolio
|
|
| Class Name |
Class L
|
|
| Trading Symbol |
MGQLX
|
|
| Annual or Semi-Annual Statement [Text Block] |
This annual shareholder report contains important information about Morgan Stanley Institutional Fund, Inc. - Global Stars Portfolio for the period of January 1, 2024 to December 31, 2024.
|
|
| Shareholder Report Annual or Semi-Annual |
Annual Shareholder Report
|
|
| Additional Information [Text Block] |
You can find additional information about the Fund at www.morganstanley.com/im/shareholderreports. You can also request this information by contacting us at 1-800-869-6397.
|
|
| Material Fund Change Notice [Text Block] |
This report describes changes to the Fund that occurred during the reporting period.
|
|
| Additional Information Phone Number |
1-800-869-6397
|
|
| Additional Information Website |
<span style="box-sizing: border-box; color: rgb(0, 0, 0); display: inline; flex-wrap: nowrap; font-size: 10.6667px; font-weight: 400; grid-area: auto; line-height: 16px; margin: 0px; overflow: visible; text-align: left;">www.morganstanley.com/im/shareholderreports</span>
|
|
| Expenses [Text Block] |
What were the Fund costs for the last year?(based on a hypothetical $10,000 investment) Class Name | Costs of a $10,000 investment | Costs paid as a percentage of a $10,000 investment |
|---|
Class L | $183 | 1.70% |
|---|
|
|
| Expenses Paid, Amount |
$ 183
|
|
| Expense Ratio, Percent |
1.70%
|
|
| Factors Affecting Performance [Text Block] |
How did the Fund perform last year and what affected its performance?Key contributors to (↑) and detractors from (↓) performance, relative to the MSCI World/MSCI AC World Blended Index: ↓ Stock selection, driven by weakness in health care, financials and information technology ↑ Sector allocation, aided by the zero weight in materials |
|
| Line Graph [Table Text Block] |
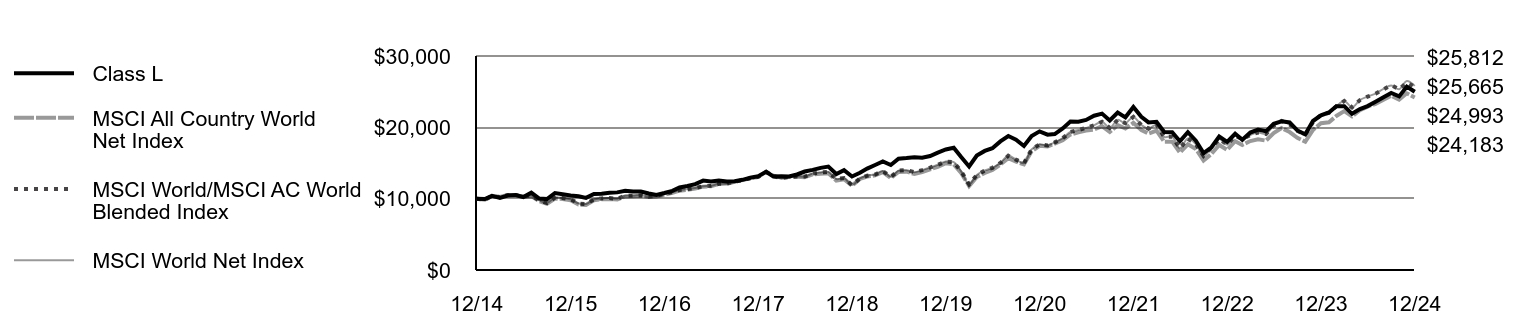 | Class L | MSCI All Country World Net Index | MSCI World/MSCI AC World Blended Index | MSCI World Net Index |
|---|
12/14 | $10,000 | $10,000 | $10,000 | $10,000 |
|---|
1/15 | $9,947 | $9,844 | $9,819 | $9,819 |
|---|
2/15 | $10,390 | $10,392 | $10,394 | $10,394 |
|---|
3/15 | $10,098 | $10,231 | $10,231 | $10,231 |
|---|
4/15 | $10,434 | $10,528 | $10,471 | $10,471 |
|---|
5/15 | $10,496 | $10,514 | $10,507 | $10,507 |
|---|
6/15 | $10,230 | $10,266 | $10,263 | $10,263 |
|---|
7/15 | $10,836 | $10,355 | $10,447 | $10,447 |
|---|
8/15 | $10,010 | $9,646 | $9,756 | $9,756 |
|---|
9/15 | $9,938 | $9,296 | $9,396 | $9,396 |
|---|
10/15 | $10,774 | $10,026 | $10,141 | $10,141 |
|---|
11/15 | $10,614 | $9,943 | $10,090 | $10,090 |
|---|
12/15 | $10,449 | $9,764 | $9,913 | $9,913 |
|---|
1/16 | $10,339 | $9,175 | $9,320 | $9,320 |
|---|
2/16 | $10,109 | $9,112 | $9,250 | $9,250 |
|---|
3/16 | $10,651 | $9,787 | $9,878 | $9,878 |
|---|
4/16 | $10,679 | $9,931 | $10,035 | $10,035 |
|---|
5/16 | $10,816 | $9,944 | $10,091 | $10,091 |
|---|
6/16 | $10,881 | $9,884 | $9,978 | $9,978 |
|---|
7/16 | $11,102 | $10,310 | $10,399 | $10,399 |
|---|
8/16 | $11,018 | $10,344 | $10,408 | $10,408 |
|---|
9/16 | $10,990 | $10,408 | $10,463 | $10,463 |
|---|
10/16 | $10,719 | $10,231 | $10,261 | $10,261 |
|---|
11/16 | $10,523 | $10,309 | $10,408 | $10,408 |
|---|
12/16 | $10,794 | $10,531 | $10,657 | $10,657 |
|---|
1/17 | $11,095 | $10,819 | $10,915 | $10,915 |
|---|
2/17 | $11,567 | $11,123 | $11,217 | $11,217 |
|---|
3/17 | $11,778 | $11,259 | $11,337 | $11,337 |
|---|
4/17 | $12,038 | $11,434 | $11,505 | $11,505 |
|---|
5/17 | $12,530 | $11,687 | $11,748 | $11,748 |
|---|
6/17 | $12,400 | $11,740 | $11,793 | $11,793 |
|---|
7/17 | $12,541 | $12,068 | $12,076 | $12,076 |
|---|
8/17 | $12,420 | $12,114 | $12,093 | $12,093 |
|---|
9/17 | $12,450 | $12,348 | $12,364 | $12,364 |
|---|
10/17 | $12,642 | $12,605 | $12,598 | $12,598 |
|---|
11/17 | $12,924 | $12,849 | $12,871 | $12,871 |
|---|
12/17 | $13,147 | $13,056 | $13,045 | $13,045 |
|---|
1/18 | $13,762 | $13,793 | $13,733 | $13,733 |
|---|
2/18 | $13,105 | $13,213 | $13,164 | $13,164 |
|---|
3/18 | $13,126 | $12,931 | $12,878 | $12,878 |
|---|
4/18 | $13,105 | $13,054 | $13,026 | $13,026 |
|---|
5/18 | $13,391 | $13,070 | $13,107 | $13,107 |
|---|
6/18 | $13,804 | $13,000 | $13,101 | $13,101 |
|---|
7/18 | $14,036 | $13,392 | $13,510 | $13,510 |
|---|
8/18 | $14,314 | $13,497 | $13,677 | $13,677 |
|---|
9/18 | $14,495 | $13,555 | $13,753 | $13,753 |
|---|
10/18 | $13,458 | $12,540 | $12,744 | $12,744 |
|---|
11/18 | $14,004 | $12,723 | $12,888 | $12,888 |
|---|
12/18 | $13,114 | $11,827 | $11,908 | $11,908 |
|---|
1/19 | $13,628 | $12,761 | $12,835 | $12,835 |
|---|
2/19 | $14,211 | $13,102 | $13,221 | $13,221 |
|---|
3/19 | $14,714 | $13,267 | $13,394 | $13,394 |
|---|
4/19 | $15,228 | $13,715 | $13,869 | $13,869 |
|---|
5/19 | $14,725 | $12,901 | $13,069 | $13,069 |
|---|
6/19 | $15,605 | $13,746 | $13,930 | $13,930 |
|---|
7/19 | $15,685 | $13,786 | $13,999 | $13,999 |
|---|
8/19 | $15,799 | $13,459 | $13,713 | $13,713 |
|---|
9/19 | $15,753 | $13,742 | $14,005 | $14,005 |
|---|
10/19 | $15,982 | $14,119 | $14,361 | $14,361 |
|---|
11/19 | $16,462 | $14,463 | $14,761 | $14,761 |
|---|
12/19 | $16,901 | $14,973 | $15,203 | $15,203 |
|---|
1/20 | $17,146 | $14,807 | $15,111 | $15,111 |
|---|
2/20 | $15,827 | $13,611 | $13,834 | $13,834 |
|---|
3/20 | $14,520 | $11,774 | $12,003 | $12,003 |
|---|
4/20 | $16,037 | $13,035 | $13,314 | $13,314 |
|---|
5/20 | $16,691 | $13,602 | $13,957 | $13,957 |
|---|
6/20 | $17,076 | $14,036 | $14,326 | $14,326 |
|---|
7/20 | $18,033 | $14,779 | $15,012 | $15,012 |
|---|
8/20 | $18,780 | $15,683 | $16,015 | $16,015 |
|---|
9/20 | $18,267 | $15,178 | $15,462 | $15,462 |
|---|
10/20 | $17,380 | $14,809 | $14,988 | $14,988 |
|---|
11/20 | $18,780 | $16,634 | $16,904 | $16,904 |
|---|
12/20 | $19,431 | $17,406 | $17,621 | $17,621 |
|---|
1/21 | $18,978 | $17,327 | $17,446 | $17,446 |
|---|
2/21 | $19,061 | $17,729 | $17,893 | $17,893 |
|---|
3/21 | $19,849 | $18,202 | $18,488 | $18,488 |
|---|
4/21 | $20,804 | $18,998 | $19,349 | $19,349 |
|---|
5/21 | $20,792 | $19,294 | $19,627 | $19,627 |
|---|
6/21 | $21,031 | $19,548 | $19,920 | $19,920 |
|---|
7/21 | $21,628 | $19,682 | $20,277 | $20,277 |
|---|
8/21 | $21,926 | $20,175 | $20,781 | $20,781 |
|---|
9/21 | $20,959 | $19,342 | $19,919 | $19,919 |
|---|
10/21 | $22,081 | $20,329 | $21,047 | $21,047 |
|---|
11/21 | $21,401 | $19,839 | $20,586 | $20,586 |
|---|
12/21 | $22,848 | $20,633 | $21,465 | $21,465 |
|---|
1/22 | $21,467 | $19,620 | $20,330 | $20,330 |
|---|
2/22 | $20,692 | $19,113 | $19,816 | $19,816 |
|---|
3/22 | $20,765 | $19,527 | $20,359 | $20,359 |
|---|
4/22 | $19,335 | $17,964 | $18,668 | $18,668 |
|---|
5/22 | $19,311 | $17,985 | $18,682 | $18,682 |
|---|
6/22 | $18,051 | $16,469 | $17,064 | $17,064 |
|---|
7/22 | $19,323 | $17,619 | $18,419 | $18,419 |
|---|
8/22 | $18,136 | $16,970 | $17,649 | $17,649 |
|---|
9/22 | $16,391 | $15,346 | $16,008 | $16,008 |
|---|
10/22 | $17,203 | $16,272 | $17,158 | $17,158 |
|---|
11/22 | $18,717 | $17,534 | $18,351 | $18,351 |
|---|
12/22 | $17,970 | $16,844 | $17,571 | $17,571 |
|---|
1/23 | $19,100 | $18,051 | $18,815 | $18,815 |
|---|
2/23 | $18,261 | $17,534 | $18,362 | $18,362 |
|---|
3/23 | $19,271 | $18,075 | $18,930 | $18,930 |
|---|
4/23 | $19,684 | $18,334 | $19,261 | $19,261 |
|---|
5/23 | $19,441 | $18,138 | $19,069 | $19,069 |
|---|
6/23 | $20,498 | $19,191 | $20,222 | $20,222 |
|---|
7/23 | $20,839 | $19,894 | $20,902 | $20,902 |
|---|
8/23 | $20,681 | $19,338 | $20,403 | $20,403 |
|---|
9/23 | $19,562 | $18,538 | $19,522 | $19,522 |
|---|
10/23 | $19,027 | $17,981 | $18,956 | $18,956 |
|---|
11/23 | $20,888 | $19,640 | $20,733 | $20,733 |
|---|
12/23 | $21,678 | $20,584 | $21,751 | $21,751 |
|---|
1/24 | $22,091 | $20,704 | $22,012 | $22,012 |
|---|
2/24 | $22,967 | $21,593 | $22,945 | $22,945 |
|---|
3/24 | $22,967 | $22,271 | $23,683 | $23,683 |
|---|
4/24 | $21,897 | $21,536 | $22,803 | $22,803 |
|---|
5/24 | $22,553 | $22,411 | $23,821 | $23,821 |
|---|
6/24 | $22,979 | $22,910 | $24,314 | $24,306 |
|---|
7/24 | $23,599 | $23,279 | $24,706 | $24,734 |
|---|
8/24 | $24,231 | $23,870 | $25,333 | $25,388 |
|---|
9/24 | $24,815 | $24,425 | $25,922 | $25,853 |
|---|
10/24 | $24,340 | $23,877 | $25,340 | $25,340 |
|---|
11/24 | $25,702 | $24,770 | $26,288 | $26,503 |
|---|
12/24 | $24,993 | $24,183 | $25,665 | $25,812 |
|---|
|
|
| Average Annual Return [Table Text Block] |
AATR | 1 Year | 5 Years | 10 Years |
|---|
Class L | 15.29% | 8.14% | 9.59% |
|---|
MSCI All Country World Net Index | 17.49% | 10.06% | 9.23% |
|---|
MSCI World/MSCI AC World Blended Index | 18.00% | 11.04% | 9.88% |
|---|
MSCI World Net Index | 18.67% | 11.17% | 9.95% |
|---|
|
|
| Material Change Date |
|
Dec. 31, 2023
|
| AssetsNet |
$ 58,794,206
|
|
| Holdings Count | Holding |
37
|
|
| Advisory Fees Paid, Amount |
$ 183,142
|
|
| InvestmentCompanyPortfolioTurnover |
73.00%
|
|
| Additional Fund Statistics [Text Block] |
Total Net Assets | $58,794,206 |
|---|
# of Portfolio Holdings | 37 |
|---|
Portfolio Turnover Rate | 73% |
|---|
Total Advisory Fees Paid | $183,142 |
|---|
|
|
| Holdings [Text Block] |
Sector Allocation (% of total investments)Value | Value |
|---|
Short-Term Investments | 1.4% | Consumer Staples | 1.6% | Consumer Discretionary | 5.9% | Communication Services | 10.2% | Health Care | 15.7% | Industrials | 17.5% | Information Technology | 23.2% | Financials | 24.5% |
Top Ten Holdings (% of total investments)Footnote ReferenceaSAP SE | 7.9% | Alphabet, Inc. | 5.6% | Visa, Inc. | 4.7% | UnitedHealth Group, Inc. | 3.5% | Mastercard, Inc. | 3.4% | Galderma Group AG | 3.3% | Microsoft Corp. | 3.3% | Tradeweb Markets, Inc. | 3.2% | Aon PLC | 3.1% | Booking Holdings, Inc. | 3.0% | Total | 41.0% |
| Footnote | Description | Footnotea | Excluding cash equivalents. |
|
|
| Material Fund Change [Text Block] |
This is a summary of certain changes to the Fund since December 31, 2023. For more complete information, you may review the Fund's next prospectus, which we expect to be available by May 1, 2025 at www.morganstanley.com/im/shareholderreports or upon request by contacting us at 1-800-869-6397. Effective June 27, 2024, the Global Stars Portfolio was changed from Global Sustain Portfolio. |
|
| Material Fund Change Name [Text Block] |
Effective June 27, 2024, the Global Stars Portfolio was changed from Global Sustain Portfolio.
|
|
| Summary of Change Legend [Text Block] |
This is a summary of certain changes to the Fund since December 31, 2023. For more complete information, you may review the Fund's next prospectus, which we expect to be available by May 1, 2025 at www.morganstanley.com/im/shareholderreports or upon request by contacting us at 1-800-869-6397.
|
|
| Updated Prospectus Web Address |
<span style="box-sizing: border-box; color: rgb(0, 0, 0); display: inline; flex-wrap: nowrap; font-size: 10.6667px; font-weight: 400; grid-area: auto; line-height: 16px; margin: 0px; overflow: visible; text-align: left;">www.morganstanley.com/im/shareholderreports</span>
|
|
| C000129963 |
|
|
| Shareholder Report [Line Items] |
|
|
| Fund Name |
Morgan Stanley Institutional Fund, Inc. - Global Stars Portfolio
|
|
| Class Name |
Class R6
|
|
| Trading Symbol |
MGQSX
|
|
| Annual or Semi-Annual Statement [Text Block] |
This annual shareholder report contains important information about Morgan Stanley Institutional Fund, Inc. - Global Stars Portfolio for the period of January 1, 2024 to December 31, 2024.
|
|
| Shareholder Report Annual or Semi-Annual |
Annual Shareholder Report
|
|
| Additional Information [Text Block] |
You can find additional information about the Fund at www.morganstanley.com/im/shareholderreports. You can also request this information by contacting us at 1-800-869-6397.
|
|
| Material Fund Change Notice [Text Block] |
This report describes changes to the Fund that occurred during the reporting period.
|
|
| Additional Information Phone Number |
1-800-869-6397
|
|
| Additional Information Website |
<span style="box-sizing: border-box; color: rgb(0, 0, 0); display: inline; flex-wrap: nowrap; font-size: 10.6667px; font-weight: 400; grid-area: auto; line-height: 16px; margin: 0px; overflow: visible; text-align: left;">www.morganstanley.com/im/shareholderreports</span>
|
|
| Expenses [Text Block] |
What were the Fund costs for the last year?(based on a hypothetical $10,000 investment) Class Name | Costs of a $10,000 investment | Costs paid as a percentage of a $10,000 investment |
|---|
Class R6 | $92 | 0.85% |
|---|
|
|
| Expenses Paid, Amount |
$ 92
|
|
| Expense Ratio, Percent |
0.85%
|
|
| Factors Affecting Performance [Text Block] |
How did the Fund perform last year and what affected its performance?Key contributors to (↑) and detractors from (↓) performance, relative to the MSCI World/MSCI AC World Blended Index: ↓ Stock selection, driven by weakness in health care, financials and information technology ↑ Sector allocation, aided by the zero weight in materials |
|
| Line Graph [Table Text Block] |
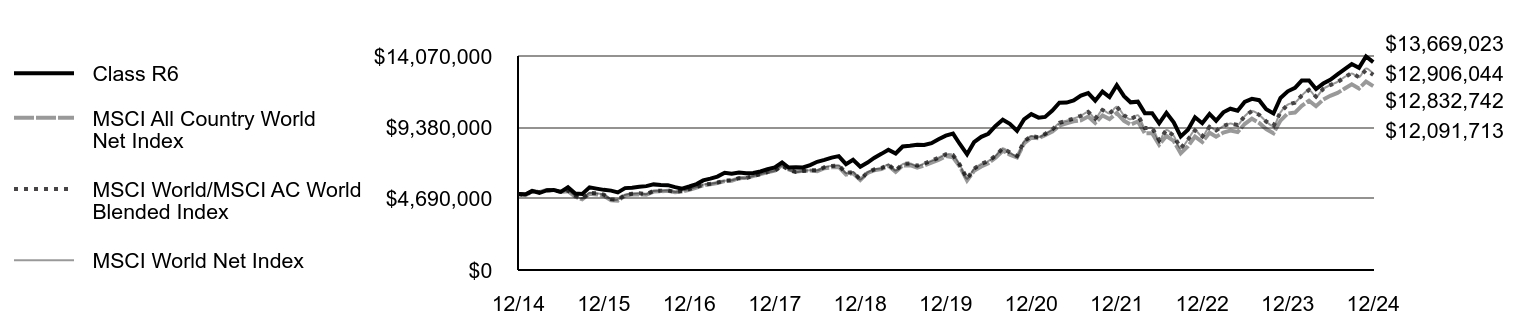 | Class R6 | MSCI All Country World Net Index | MSCI World/MSCI AC World Blended Index | MSCI World Net Index |
|---|
12/14 | $5,000,000 | $5,000,000 | $5,000,000 | $5,000,000 |
|---|
1/15 | $4,977,954 | $4,921,847 | $4,909,402 | $4,909,402 |
|---|
2/15 | $5,202,822 | $5,195,853 | $5,197,036 | $5,197,036 |
|---|
3/15 | $5,061,728 | $5,115,328 | $5,115,685 | $5,115,685 |
|---|
4/15 | $5,233,686 | $5,263,763 | $5,235,661 | $5,235,661 |
|---|
5/15 | $5,264,550 | $5,256,895 | $5,253,696 | $5,253,696 |
|---|
6/15 | $5,136,684 | $5,133,131 | $5,131,536 | $5,131,536 |
|---|
7/15 | $5,446,833 | $5,177,711 | $5,223,647 | $5,223,647 |
|---|
8/15 | $5,031,246 | $4,822,776 | $4,877,974 | $4,877,974 |
|---|
9/15 | $5,000,298 | $4,648,053 | $4,698,053 | $4,698,053 |
|---|
10/15 | $5,433,569 | $5,012,840 | $5,070,346 | $5,070,346 |
|---|
11/15 | $5,349,568 | $4,971,454 | $5,045,118 | $5,045,118 |
|---|
12/15 | $5,268,903 | $4,881,804 | $4,956,438 | $4,956,438 |
|---|
1/16 | $5,218,196 | $4,587,379 | $4,659,923 | $4,659,923 |
|---|
2/16 | $5,102,953 | $4,555,802 | $4,625,241 | $4,625,241 |
|---|
3/16 | $5,384,146 | $4,893,431 | $4,939,106 | $4,939,106 |
|---|
4/16 | $5,402,585 | $4,965,664 | $5,017,260 | $5,017,260 |
|---|
5/16 | $5,471,730 | $4,971,938 | $5,045,440 | $5,045,440 |
|---|
6/16 | $5,513,218 | $4,941,819 | $4,988,904 | $4,988,904 |
|---|
7/16 | $5,628,991 | $5,154,794 | $5,199,677 | $5,199,677 |
|---|
8/16 | $5,586,844 | $5,172,129 | $5,203,998 | $5,203,998 |
|---|
9/16 | $5,577,478 | $5,203,827 | $5,231,641 | $5,231,641 |
|---|
10/16 | $5,446,353 | $5,115,504 | $5,130,394 | $5,130,394 |
|---|
11/16 | $5,348,010 | $5,154,379 | $5,204,164 | $5,204,164 |
|---|
12/16 | $5,488,754 | $5,265,723 | $5,328,691 | $5,328,691 |
|---|
1/17 | $5,651,234 | $5,409,704 | $5,457,300 | $5,457,300 |
|---|
2/17 | $5,889,875 | $5,561,453 | $5,608,704 | $5,608,704 |
|---|
3/17 | $6,006,657 | $5,629,489 | $5,668,448 | $5,668,448 |
|---|
4/17 | $6,143,749 | $5,717,223 | $5,752,380 | $5,752,380 |
|---|
5/17 | $6,397,623 | $5,843,476 | $5,874,069 | $5,874,069 |
|---|
6/17 | $6,336,693 | $5,870,048 | $5,896,669 | $5,896,669 |
|---|
7/17 | $6,413,432 | $6,034,097 | $6,037,790 | $6,037,790 |
|---|
8/17 | $6,357,353 | $6,057,214 | $6,046,293 | $6,046,293 |
|---|
9/17 | $6,372,647 | $6,174,240 | $6,181,997 | $6,181,997 |
|---|
10/17 | $6,479,707 | $6,302,450 | $6,298,828 | $6,298,828 |
|---|
11/17 | $6,627,553 | $6,424,454 | $6,435,307 | $6,435,307 |
|---|
12/17 | $6,746,492 | $6,528,027 | $6,522,335 | $6,522,335 |
|---|
1/18 | $7,071,103 | $6,896,316 | $6,866,716 | $6,866,716 |
|---|
2/18 | $6,735,672 | $6,606,682 | $6,582,245 | $6,582,245 |
|---|
3/18 | $6,751,902 | $6,465,255 | $6,438,776 | $6,438,776 |
|---|
4/18 | $6,746,492 | $6,526,996 | $6,512,765 | $6,512,765 |
|---|
5/18 | $6,897,977 | $6,535,145 | $6,553,577 | $6,553,577 |
|---|
6/18 | $7,114,384 | $6,499,754 | $6,550,451 | $6,550,451 |
|---|
7/18 | $7,238,113 | $6,695,765 | $6,755,044 | $6,755,044 |
|---|
8/18 | $7,390,954 | $6,748,370 | $6,838,623 | $6,838,623 |
|---|
9/18 | $7,489,209 | $6,777,740 | $6,876,701 | $6,876,701 |
|---|
10/18 | $6,959,724 | $6,269,824 | $6,371,759 | $6,371,759 |
|---|
11/18 | $7,243,572 | $6,361,522 | $6,444,142 | $6,444,142 |
|---|
12/18 | $6,790,884 | $5,913,452 | $5,954,142 | $5,954,142 |
|---|
1/19 | $7,060,642 | $6,380,376 | $6,417,409 | $6,417,409 |
|---|
2/19 | $7,371,451 | $6,551,032 | $6,610,379 | $6,610,379 |
|---|
3/19 | $7,635,346 | $6,633,418 | $6,697,203 | $6,697,203 |
|---|
4/19 | $7,910,969 | $6,857,399 | $6,934,681 | $6,934,681 |
|---|
5/19 | $7,658,803 | $6,450,625 | $6,534,544 | $6,534,544 |
|---|
6/19 | $8,122,084 | $6,873,009 | $6,965,137 | $6,965,137 |
|---|
7/19 | $8,168,999 | $6,893,149 | $6,999,638 | $6,999,638 |
|---|
8/19 | $8,227,642 | $6,729,627 | $6,856,463 | $6,856,463 |
|---|
9/19 | $8,215,913 | $6,871,230 | $7,002,376 | $7,002,376 |
|---|
10/19 | $8,339,064 | $7,059,286 | $7,180,569 | $7,180,569 |
|---|
11/19 | $8,597,094 | $7,231,614 | $7,380,549 | $7,380,549 |
|---|
12/19 | $8,833,313 | $7,486,277 | $7,601,657 | $7,601,657 |
|---|
1/20 | $8,971,898 | $7,403,584 | $7,555,388 | $7,555,388 |
|---|
2/20 | $8,284,996 | $6,805,598 | $6,916,767 | $6,916,767 |
|---|
3/20 | $7,604,120 | $5,886,820 | $6,001,384 | $6,001,384 |
|---|
4/20 | $8,405,506 | $6,517,446 | $6,657,001 | $6,657,001 |
|---|
5/20 | $8,754,982 | $6,800,896 | $6,978,588 | $6,978,588 |
|---|
6/20 | $8,959,847 | $7,018,202 | $7,163,180 | $7,163,180 |
|---|
7/20 | $9,472,011 | $7,389,374 | $7,505,876 | $7,505,876 |
|---|
8/20 | $9,875,716 | $7,841,641 | $8,007,377 | $8,007,377 |
|---|
9/20 | $9,610,596 | $7,588,801 | $7,731,130 | $7,731,130 |
|---|
10/20 | $9,152,662 | $7,404,328 | $7,493,977 | $7,493,977 |
|---|
11/20 | $9,899,818 | $8,317,007 | $8,452,168 | $8,452,168 |
|---|
12/20 | $10,246,563 | $8,703,162 | $8,810,512 | $8,810,512 |
|---|
1/21 | $10,017,762 | $8,663,580 | $8,722,947 | $8,722,947 |
|---|
2/21 | $10,067,232 | $8,864,258 | $8,946,468 | $8,946,468 |
|---|
3/21 | $10,487,731 | $9,101,017 | $9,244,135 | $9,244,135 |
|---|
4/21 | $11,000,987 | $9,498,936 | $9,674,358 | $9,674,358 |
|---|
5/21 | $11,007,170 | $9,646,762 | $9,813,721 | $9,813,721 |
|---|
6/21 | $11,143,214 | $9,773,880 | $9,959,993 | $9,959,993 |
|---|
7/21 | $11,464,772 | $9,841,230 | $10,138,404 | $10,138,404 |
|---|
8/21 | $11,631,735 | $10,087,549 | $10,390,733 | $10,390,733 |
|---|
9/21 | $11,130,846 | $9,670,835 | $9,959,305 | $9,959,305 |
|---|
10/21 | $11,730,675 | $10,164,468 | $10,523,405 | $10,523,405 |
|---|
11/21 | $11,372,015 | $9,919,702 | $10,292,805 | $10,292,805 |
|---|
12/21 | $12,152,825 | $10,316,495 | $10,732,722 | $10,732,722 |
|---|
1/22 | $11,428,317 | $9,809,828 | $10,164,844 | $10,164,844 |
|---|
2/22 | $11,025,113 | $9,556,467 | $9,907,763 | $9,907,763 |
|---|
3/22 | $11,069,214 | $9,763,451 | $10,179,665 | $10,179,665 |
|---|
4/22 | $10,313,206 | $8,981,967 | $9,334,007 | $9,334,007 |
|---|
5/22 | $10,313,206 | $8,992,478 | $9,341,077 | $9,341,077 |
|---|
6/22 | $9,645,399 | $8,234,445 | $8,531,934 | $8,531,934 |
|---|
7/22 | $10,332,106 | $8,809,476 | $9,209,338 | $9,209,338 |
|---|
8/22 | $9,708,400 | $8,485,156 | $8,824,316 | $8,824,316 |
|---|
9/22 | $8,782,290 | $7,672,878 | $8,004,008 | $8,004,008 |
|---|
10/22 | $9,223,295 | $8,135,914 | $8,578,799 | $8,578,799 |
|---|
11/22 | $10,042,303 | $8,766,963 | $9,175,287 | $9,175,287 |
|---|
12/22 | $9,649,544 | $8,421,974 | $8,785,637 | $8,785,637 |
|---|
1/23 | $10,258,988 | $9,025,635 | $9,407,274 | $9,407,274 |
|---|
2/23 | $9,814,602 | $8,766,960 | $9,181,138 | $9,181,138 |
|---|
3/23 | $10,366,911 | $9,037,268 | $9,464,832 | $9,464,832 |
|---|
4/23 | $10,601,801 | $9,167,157 | $9,630,747 | $9,630,747 |
|---|
5/23 | $10,474,833 | $9,068,973 | $9,534,599 | $9,534,599 |
|---|
6/23 | $11,052,536 | $9,595,525 | $10,111,231 | $10,111,231 |
|---|
7/23 | $11,249,336 | $9,946,798 | $10,450,895 | $10,450,895 |
|---|
8/23 | $11,166,807 | $9,668,846 | $10,201,268 | $10,201,268 |
|---|
9/23 | $10,576,408 | $9,269,031 | $9,761,202 | $9,761,202 |
|---|
10/23 | $10,290,730 | $8,990,340 | $9,477,973 | $9,477,973 |
|---|
11/23 | $11,306,472 | $9,820,111 | $10,366,553 | $10,366,553 |
|---|
12/23 | $11,748,014 | $10,291,810 | $10,875,490 | $10,875,490 |
|---|
1/24 | $11,977,741 | $10,352,144 | $11,006,002 | $11,006,002 |
|---|
2/24 | $12,456,340 | $10,796,389 | $11,472,631 | $11,472,631 |
|---|
3/24 | $12,462,722 | $11,135,362 | $11,841,301 | $11,841,301 |
|---|
4/24 | $11,894,784 | $10,767,973 | $11,401,460 | $11,401,460 |
|---|
5/24 | $12,258,519 | $11,205,299 | $11,910,558 | $11,910,558 |
|---|
6/24 | $12,507,391 | $11,454,864 | $12,156,865 | $12,152,913 |
|---|
7/24 | $12,858,364 | $11,639,603 | $12,352,924 | $12,367,076 |
|---|
8/24 | $13,209,336 | $11,935,208 | $12,666,645 | $12,693,944 |
|---|
9/24 | $13,541,165 | $12,212,476 | $12,960,905 | $12,926,420 |
|---|
10/24 | $13,292,294 | $11,938,345 | $12,669,975 | $12,670,000 |
|---|
11/24 | $14,045,290 | $12,384,883 | $13,143,879 | $13,251,383 |
|---|
12/24 | $13,669,023 | $12,091,713 | $12,832,742 | $12,906,044 |
|---|
|
|
| Average Annual Return [Table Text Block] |
AATR | 1 Year | 5 Years | 10 Years |
|---|
Class R6 | 16.35% | 9.12% | 10.58% |
|---|
MSCI All Country World Net Index | 17.49% | 10.06% | 9.23% |
|---|
MSCI World/MSCI AC World Blended Index | 18.00% | 11.04% | 9.88% |
|---|
MSCI World Net Index | 18.67% | 11.17% | 9.95% |
|---|
|
|
| Material Change Date |
|
Dec. 31, 2023
|
| AssetsNet |
$ 58,794,206
|
|
| Holdings Count | Holding |
37
|
|
| Advisory Fees Paid, Amount |
$ 183,142
|
|
| InvestmentCompanyPortfolioTurnover |
73.00%
|
|
| Additional Fund Statistics [Text Block] |
Total Net Assets | $58,794,206 |
|---|
# of Portfolio Holdings | 37 |
|---|
Portfolio Turnover Rate | 73% |
|---|
Total Advisory Fees Paid | $183,142 |
|---|
|
|
| Holdings [Text Block] |
Sector Allocation (% of total investments)Value | Value |
|---|
Short-Term Investments | 1.4% | Consumer Staples | 1.6% | Consumer Discretionary | 5.9% | Communication Services | 10.2% | Health Care | 15.7% | Industrials | 17.5% | Information Technology | 23.2% | Financials | 24.5% |
Top Ten Holdings (% of total investments)Footnote ReferenceaSAP SE | 7.9% | Alphabet, Inc. | 5.6% | Visa, Inc. | 4.7% | UnitedHealth Group, Inc. | 3.5% | Mastercard, Inc. | 3.4% | Galderma Group AG | 3.3% | Microsoft Corp. | 3.3% | Tradeweb Markets, Inc. | 3.2% | Aon PLC | 3.1% | Booking Holdings, Inc. | 3.0% | Total | 41.0% |
| Footnote | Description | Footnotea | Excluding cash equivalents. |
|
|
| Material Fund Change [Text Block] |
This is a summary of certain changes to the Fund since December 31, 2023. For more complete information, you may review the Fund's next prospectus, which we expect to be available by May 1, 2025 at www.morganstanley.com/im/shareholderreports or upon request by contacting us at 1-800-869-6397. Effective June 27, 2024, the Global Stars Portfolio was changed from Global Sustain Portfolio. |
|
| Material Fund Change Name [Text Block] |
Effective June 27, 2024, the Global Stars Portfolio was changed from Global Sustain Portfolio.
|
|
| Summary of Change Legend [Text Block] |
This is a summary of certain changes to the Fund since December 31, 2023. For more complete information, you may review the Fund's next prospectus, which we expect to be available by May 1, 2025 at www.morganstanley.com/im/shareholderreports or upon request by contacting us at 1-800-869-6397.
|
|
| Updated Prospectus Web Address |
<span style="box-sizing: border-box; color: rgb(0, 0, 0); display: inline; flex-wrap: nowrap; font-size: 10.6667px; font-weight: 400; grid-area: auto; line-height: 16px; margin: 0px; overflow: visible; text-align: left;">www.morganstanley.com/im/shareholderreports</span>
|
|
| C000007751 |
|
|
| Shareholder Report [Line Items] |
|
|
| Fund Name |
Morgan Stanley Institutional Fund, Inc. - Growth Portfolio
|
|
| Class Name |
Class A
|
|
| Trading Symbol |
MSEGX
|
|
| Annual or Semi-Annual Statement [Text Block] |
This annual shareholder report contains important information about Morgan Stanley Institutional Fund, Inc. - Growth Portfolio for the period of January 1, 2024 to December 31, 2024.
|
|
| Shareholder Report Annual or Semi-Annual |
Annual Shareholder Report
|
|
| Additional Information [Text Block] |
You can find additional information about the Fund at www.morganstanley.com/im/shareholderreports. You can also request this information by contacting us at 1-800-869-6397.
|
|
| Additional Information Phone Number |
1-800-869-6397
|
|
| Additional Information Website |
<span style="box-sizing: border-box; color: rgb(0, 0, 0); display: inline; flex-wrap: nowrap; font-size: 10.6667px; font-weight: 400; grid-area: auto; line-height: 16px; margin: 0px; overflow: visible; text-align: left;">www.morganstanley.com/im/shareholderreports</span>
|
|
| Expenses [Text Block] |
What were the Fund costs for the last year?(based on a hypothetical $10,000 investment) Class Name | Costs of a $10,000 investment | Costs paid as a percentage of a $10,000 investment |
|---|
Class A | $106 | 0.86% |
|---|
|
|
| Expenses Paid, Amount |
$ 106
|
|
| Expense Ratio, Percent |
0.86%
|
|
| Factors Affecting Performance [Text Block] |
How did the Fund perform last year and what affected its performance?Key contributors to (↑) and detractors from (↓) performance, relative to the Russell 1000® Growth Index: ↑ Stock selection and average overweight in consumer discretionary, led by a position in a leading seller of used cars online in the United States ↑ Stock selection in information technology, led by a position in an enterprise analytics platform and Bitcoin developing company ↑ Stock selection and an average underweight in industrials, led by a global mobility and food delivery platform ↓ Stock selection in health care, where a position in an underperforming health care services provider was the largest detractor ↓ Average underweight to information technology ↓ Average underweight and stock selection in communication services, which lagged primarily because of underweight exposures to some of the “Magnificent 7” companies that drove significant performance gains within the Index in 2024 |
|
| Line Graph [Table Text Block] |
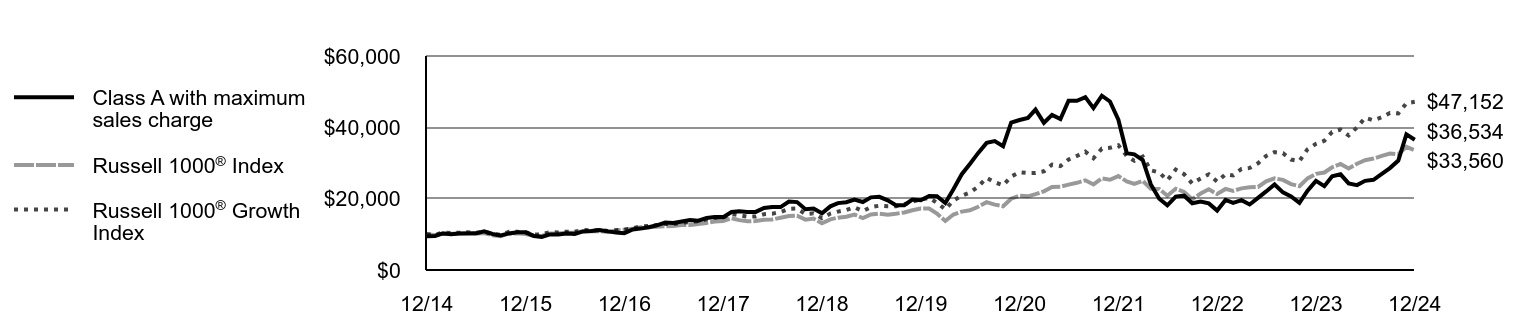 | Class A with maximum sales charge | Russell 1000® Index | Russell 1000® Growth Index |
|---|
12/14 | $9,476 | $10,000 | $10,000 |
|---|
1/15 | $9,528 | $9,725 | $9,847 |
|---|
2/15 | $10,255 | $10,287 | $10,503 |
|---|
3/15 | $10,057 | $10,159 | $10,384 |
|---|
4/15 | $10,242 | $10,231 | $10,436 |
|---|
5/15 | $10,265 | $10,365 | $10,583 |
|---|
6/15 | $10,277 | $10,171 | $10,396 |
|---|
7/15 | $10,857 | $10,367 | $10,749 |
|---|
8/15 | $10,112 | $9,743 | $10,096 |
|---|
9/15 | $9,669 | $9,476 | $9,846 |
|---|
10/15 | $10,253 | $10,243 | $10,694 |
|---|
11/15 | $10,611 | $10,277 | $10,724 |
|---|
12/15 | $10,568 | $10,092 | $10,567 |
|---|
1/16 | $9,552 | $9,549 | $9,977 |
|---|
2/16 | $9,275 | $9,545 | $9,973 |
|---|
3/16 | $9,971 | $10,210 | $10,645 |
|---|
4/16 | $9,947 | $10,266 | $10,548 |
|---|
5/16 | $10,216 | $10,446 | $10,753 |
|---|
6/16 | $10,130 | $10,469 | $10,711 |
|---|
7/16 | $10,821 | $10,868 | $11,216 |
|---|
8/16 | $10,910 | $10,882 | $11,160 |
|---|
9/16 | $11,227 | $10,891 | $11,201 |
|---|
10/16 | $10,827 | $10,679 | $10,938 |
|---|
11/16 | $10,544 | $11,100 | $11,176 |
|---|
12/16 | $10,335 | $11,308 | $11,314 |
|---|
1/17 | $11,382 | $11,536 | $11,696 |
|---|
2/17 | $11,607 | $11,982 | $12,182 |
|---|
3/17 | $12,002 | $11,990 | $12,322 |
|---|
4/17 | $12,529 | $12,116 | $12,604 |
|---|
5/17 | $13,317 | $12,271 | $12,932 |
|---|
6/17 | $13,180 | $12,357 | $12,898 |
|---|
7/17 | $13,599 | $12,601 | $13,241 |
|---|
8/17 | $13,985 | $12,641 | $13,483 |
|---|
9/17 | $13,814 | $12,910 | $13,659 |
|---|
10/17 | $14,565 | $13,206 | $14,188 |
|---|
11/17 | $14,861 | $13,609 | $14,619 |
|---|
12/17 | $14,826 | $13,761 | $14,733 |
|---|
1/18 | $16,250 | $14,516 | $15,776 |
|---|
2/18 | $16,470 | $13,983 | $15,363 |
|---|
3/18 | $16,257 | $13,666 | $14,941 |
|---|
4/18 | $16,287 | $13,712 | $14,994 |
|---|
5/18 | $17,383 | $14,062 | $15,651 |
|---|
6/18 | $17,689 | $14,153 | $15,801 |
|---|
7/18 | $17,638 | $14,642 | $16,265 |
|---|
8/18 | $19,202 | $15,146 | $17,155 |
|---|
9/18 | $19,041 | $15,204 | $17,251 |
|---|
10/18 | $17,054 | $14,128 | $15,708 |
|---|
11/18 | $17,257 | $14,415 | $15,875 |
|---|
12/18 | $15,921 | $13,102 | $14,510 |
|---|
1/19 | $17,850 | $14,200 | $15,814 |
|---|
2/19 | $18,751 | $14,681 | $16,380 |
|---|
3/19 | $19,008 | $14,937 | $16,846 |
|---|
4/19 | $19,755 | $15,540 | $17,607 |
|---|
5/19 | $19,056 | $14,550 | $16,495 |
|---|
6/19 | $20,370 | $15,571 | $17,628 |
|---|
7/19 | $20,511 | $15,813 | $18,026 |
|---|
8/19 | $19,538 | $15,523 | $17,888 |
|---|
9/19 | $18,160 | $15,792 | $17,890 |
|---|
10/19 | $18,176 | $16,127 | $18,394 |
|---|
11/19 | $19,739 | $16,736 | $19,210 |
|---|
12/19 | $19,553 | $17,220 | $19,790 |
|---|
1/20 | $20,774 | $17,238 | $20,232 |
|---|
2/20 | $20,702 | $15,830 | $18,854 |
|---|
3/20 | $18,795 | $13,738 | $17,000 |
|---|
4/20 | $22,650 | $15,553 | $19,515 |
|---|
5/20 | $26,850 | $16,374 | $20,825 |
|---|
6/20 | $29,736 | $16,736 | $21,732 |
|---|
7/20 | $32,832 | $17,716 | $23,404 |
|---|
8/20 | $35,633 | $19,016 | $25,819 |
|---|
9/20 | $36,122 | $18,321 | $24,604 |
|---|
10/20 | $34,695 | $17,879 | $23,769 |
|---|
11/20 | $41,328 | $19,985 | $26,203 |
|---|
12/20 | $42,057 | $20,830 | $27,408 |
|---|
1/21 | $42,659 | $20,658 | $27,205 |
|---|
2/21 | $44,966 | $21,257 | $27,199 |
|---|
3/21 | $41,283 | $22,061 | $27,666 |
|---|
4/21 | $43,502 | $23,249 | $29,548 |
|---|
5/21 | $42,328 | $23,359 | $29,140 |
|---|
6/21 | $47,465 | $23,944 | $30,968 |
|---|
7/21 | $47,431 | $24,442 | $31,988 |
|---|
8/21 | $48,471 | $25,149 | $33,184 |
|---|
9/21 | $45,390 | $23,994 | $31,326 |
|---|
10/21 | $48,870 | $25,659 | $34,039 |
|---|
11/21 | $47,244 | $25,315 | $34,247 |
|---|
12/21 | $42,125 | $26,340 | $34,971 |
|---|
1/22 | $32,773 | $24,855 | $31,970 |
|---|
2/22 | $32,444 | $24,173 | $30,612 |
|---|
3/22 | $30,849 | $24,989 | $31,809 |
|---|
4/22 | $24,004 | $22,761 | $27,968 |
|---|
5/22 | $19,970 | $22,727 | $27,318 |
|---|
6/22 | $18,127 | $20,823 | $25,154 |
|---|
7/22 | $20,572 | $22,763 | $28,173 |
|---|
8/22 | $20,839 | $21,889 | $26,861 |
|---|
9/22 | $18,723 | $19,863 | $24,249 |
|---|
10/22 | $19,195 | $21,456 | $25,667 |
|---|
11/22 | $18,673 | $22,617 | $26,836 |
|---|
12/22 | $16,665 | $21,302 | $24,782 |
|---|
1/23 | $19,634 | $22,730 | $26,847 |
|---|
2/23 | $18,821 | $22,189 | $26,528 |
|---|
3/23 | $19,583 | $22,891 | $28,342 |
|---|
4/23 | $18,371 | $23,175 | $28,621 |
|---|
5/23 | $20,236 | $23,283 | $29,926 |
|---|
6/23 | $22,029 | $24,855 | $31,972 |
|---|
7/23 | $23,974 | $25,710 | $33,050 |
|---|
8/23 | $21,753 | $25,260 | $32,753 |
|---|
9/23 | $20,643 | $24,073 | $30,972 |
|---|
10/23 | $18,835 | $23,491 | $30,531 |
|---|
11/23 | $22,232 | $25,685 | $33,859 |
|---|
12/23 | $24,976 | $26,953 | $35,358 |
|---|
1/24 | $23,517 | $27,329 | $36,240 |
|---|
2/24 | $26,282 | $28,805 | $38,713 |
|---|
3/24 | $26,827 | $29,728 | $39,394 |
|---|
4/24 | $24,279 | $28,463 | $37,723 |
|---|
5/24 | $23,807 | $29,804 | $39,981 |
|---|
6/24 | $25,005 | $30,790 | $42,677 |
|---|
7/24 | $25,295 | $31,238 | $41,951 |
|---|
8/24 | $26,943 | $31,979 | $42,825 |
|---|
9/24 | $28,569 | $32,663 | $44,038 |
|---|
10/24 | $30,688 | $32,434 | $43,893 |
|---|
11/24 | $38,019 | $34,522 | $46,740 |
|---|
12/24 | $36,534 | $33,560 | $47,152 |
|---|
|
|
| Average Annual Return [Table Text Block] |
AATR | 1 Year | 5 Years | 10 Years |
|---|
Class A | 46.28% | 13.32% | 14.45% |
|---|
Class A, with 5.25% maximum front end sales charge | 38.58% | 12.10% | 13.83% |
|---|
Russell 1000® Index | 24.51% | 14.28% | 12.87% |
|---|
Russell 1000® Growth Index | 33.36% | 18.96% | 16.78% |
|---|
|
|
| AssetsNet |
$ 4,190,946,959
|
|
| Holdings Count | Holding |
33
|
|
| Advisory Fees Paid, Amount |
$ 17,778,316
|
|
| InvestmentCompanyPortfolioTurnover |
39.00%
|
|
| Additional Fund Statistics [Text Block] |
Total Net Assets | $4,190,946,959 |
|---|
# of Portfolio Holdings | 33 |
|---|
Portfolio Turnover Rate | 39% |
|---|
Total Advisory Fees Paid | $17,778,316 |
|---|
|
|
| Holdings [Text Block] |
Sector Allocation (% of total investments)Value | Value |
|---|
Short-Term Investments | 2.8% | Investment Company | 2.9% | Health Care | 4.7% | Financials | 9.7% | Communication Services | 11.3% | Consumer Discretionary | 33.3% | Information Technology | 35.3% |
Top Ten Holdings (% of total investments)Footnote ReferenceaTesla, Inc. | 9.1% | Cloudflare, Inc. | 8.8% | DoorDash, Inc. | 6.7% | Shopify, Inc. | 6.4% | Trade Desk, Inc. | 6.2% | Affirm Holdings, Inc. | 6.2% | ROBLOX Corp. | 5.1% | MercadoLibre, Inc. | 4.9% | Samsara, Inc. | 4.8% | Carvana Co. | 4.6% | Total | 62.8% |
| Footnote | Description | Footnotea | Excluding cash equivalents. |
|
|
| Material Fund Change [Text Block] |
|
|
| Updated Prospectus Web Address |
<span style="box-sizing: border-box; color: rgb(0, 0, 0); display: inline; flex-wrap: nowrap; font-size: 10.6667px; font-weight: 400; grid-area: auto; line-height: 16px; margin: 0px; overflow: visible; text-align: left;">www.morganstanley.com/im/shareholderreports</span>
|
|
| C000155892 |
|
|
| Shareholder Report [Line Items] |
|
|
| Fund Name |
Morgan Stanley Institutional Fund, Inc. - Growth Portfolio
|
|
| Class Name |
Class C
|
|
| Trading Symbol |
MSGUX
|
|
| Annual or Semi-Annual Statement [Text Block] |
This annual shareholder report contains important information about Morgan Stanley Institutional Fund, Inc. - Growth Portfolio for the period of January 1, 2024 to December 31, 2024.
|
|
| Shareholder Report Annual or Semi-Annual |
Annual Shareholder Report
|
|
| Additional Information [Text Block] |
You can find additional information about the Fund at www.morganstanley.com/im/shareholderreports. You can also request this information by contacting us at 1-800-869-6397.
|
|
| Additional Information Phone Number |
1-800-869-6397
|
|
| Additional Information Website |
<span style="box-sizing: border-box; color: rgb(0, 0, 0); display: inline; flex-wrap: nowrap; font-size: 10.6667px; font-weight: 400; grid-area: auto; line-height: 16px; margin: 0px; overflow: visible; text-align: left;">www.morganstanley.com/im/shareholderreports</span>
|
|
| Expenses [Text Block] |
What were the Fund costs for the last year?(based on a hypothetical $10,000 investment) Class Name | Costs of a $10,000 investment | Costs paid as a percentage of a $10,000 investment |
|---|
Class C | $197 | 1.61% |
|---|
|
|
| Expenses Paid, Amount |
$ 197
|
|
| Expense Ratio, Percent |
1.61%
|
|
| Factors Affecting Performance [Text Block] |
How did the Fund perform last year and what affected its performance?Key contributors to (↑) and detractors from (↓) performance, relative to the Russell 1000® Growth Index: ↑ Stock selection and average overweight in consumer discretionary, led by a position in a leading seller of used cars online in the United States ↑ Stock selection in information technology, led by a position in an enterprise analytics platform and Bitcoin developing company ↑ Stock selection and an average underweight in industrials, led by a global mobility and food delivery platform ↓ Stock selection in health care, where a position in an underperforming health care services provider was the largest detractor ↓ Average underweight to information technology ↓ Average underweight and stock selection in communication services, which lagged primarily because of underweight exposures to some of the “Magnificent 7” companies that drove significant performance gains within the Index in 2024 |
|
| Line Graph [Table Text Block] |
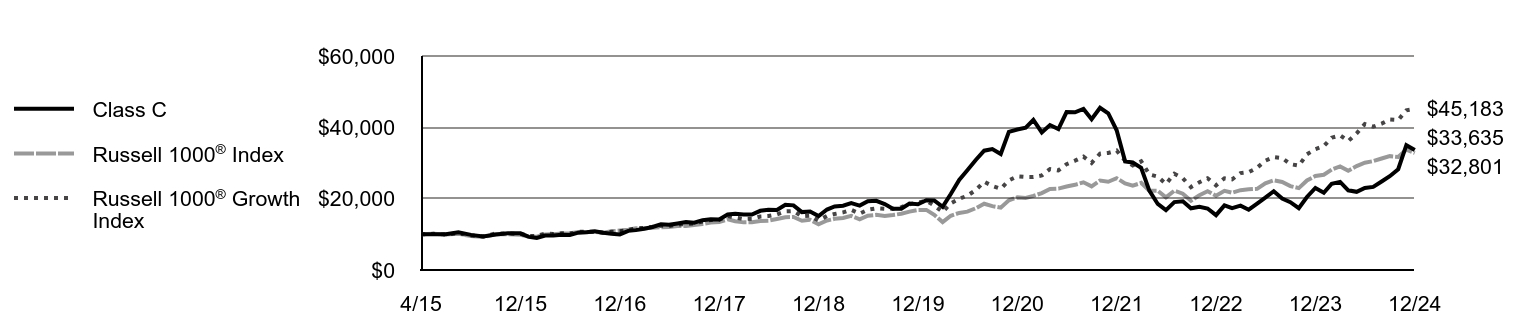 | Class C | Russell 1000® Index | Russell 1000® Growth Index |
|---|
4/15 | $10,000 | $10,000 | $10,000 |
|---|
5/15 | $10,015 | $10,131 | $10,141 |
|---|
6/15 | $10,020 | $9,941 | $9,962 |
|---|
7/15 | $10,581 | $10,132 | $10,300 |
|---|
8/15 | $9,851 | $9,523 | $9,674 |
|---|
9/15 | $9,413 | $9,262 | $9,435 |
|---|
10/15 | $9,978 | $10,011 | $10,248 |
|---|
11/15 | $10,321 | $10,044 | $10,276 |
|---|
12/15 | $10,271 | $9,864 | $10,125 |
|---|
1/16 | $9,279 | $9,333 | $9,560 |
|---|
2/16 | $9,009 | $9,330 | $9,556 |
|---|
3/16 | $9,677 | $9,979 | $10,201 |
|---|
4/16 | $9,648 | $10,034 | $10,107 |
|---|
5/16 | $9,902 | $10,209 | $10,304 |
|---|
6/16 | $9,811 | $10,233 | $10,263 |
|---|
7/16 | $10,474 | $10,622 | $10,748 |
|---|
8/16 | $10,554 | $10,636 | $10,694 |
|---|
9/16 | $10,853 | $10,645 | $10,733 |
|---|
10/16 | $10,460 | $10,437 | $10,481 |
|---|
11/16 | $10,178 | $10,849 | $10,709 |
|---|
12/16 | $9,970 | $11,053 | $10,842 |
|---|
1/17 | $10,973 | $11,275 | $11,207 |
|---|
2/17 | $11,182 | $11,711 | $11,673 |
|---|
3/17 | $11,556 | $11,719 | $11,808 |
|---|
4/17 | $12,054 | $11,843 | $12,078 |
|---|
5/17 | $12,805 | $11,994 | $12,392 |
|---|
6/17 | $12,665 | $12,077 | $12,359 |
|---|
7/17 | $13,062 | $12,317 | $12,688 |
|---|
8/17 | $13,424 | $12,355 | $12,920 |
|---|
9/17 | $13,249 | $12,618 | $13,088 |
|---|
10/17 | $13,963 | $12,908 | $13,596 |
|---|
11/17 | $14,240 | $13,301 | $14,009 |
|---|
12/17 | $14,194 | $13,450 | $14,118 |
|---|
1/18 | $15,548 | $14,188 | $15,118 |
|---|
2/18 | $15,751 | $13,667 | $14,721 |
|---|
3/18 | $15,540 | $13,357 | $14,317 |
|---|
4/18 | $15,555 | $13,402 | $14,367 |
|---|
5/18 | $16,593 | $13,744 | $14,997 |
|---|
6/18 | $16,874 | $13,833 | $15,142 |
|---|
7/18 | $16,816 | $14,311 | $15,586 |
|---|
8/18 | $18,298 | $14,804 | $16,438 |
|---|
9/18 | $18,133 | $14,860 | $16,530 |
|---|
10/18 | $16,230 | $13,808 | $15,052 |
|---|
11/18 | $16,411 | $14,089 | $15,212 |
|---|
12/18 | $15,132 | $12,806 | $13,904 |
|---|
1/19 | $16,956 | $13,879 | $15,154 |
|---|
2/19 | $17,803 | $14,349 | $15,696 |
|---|
3/19 | $18,035 | $14,599 | $16,143 |
|---|
4/19 | $18,731 | $15,189 | $16,872 |
|---|
5/19 | $18,059 | $14,221 | $15,806 |
|---|
6/19 | $19,293 | $15,219 | $16,892 |
|---|
7/19 | $19,411 | $15,455 | $17,273 |
|---|
8/19 | $18,478 | $15,172 | $17,141 |
|---|
9/19 | $17,168 | $15,435 | $17,143 |
|---|
10/19 | $17,172 | $15,762 | $17,626 |
|---|
11/19 | $18,637 | $16,358 | $18,408 |
|---|
12/19 | $18,448 | $16,831 | $18,964 |
|---|
1/20 | $19,585 | $16,849 | $19,387 |
|---|
2/20 | $19,507 | $15,472 | $18,067 |
|---|
3/20 | $17,696 | $13,427 | $16,290 |
|---|
4/20 | $21,319 | $15,202 | $18,700 |
|---|
5/20 | $25,253 | $16,004 | $19,956 |
|---|
6/20 | $27,950 | $16,358 | $20,825 |
|---|
7/20 | $30,843 | $17,315 | $22,427 |
|---|
8/20 | $33,452 | $18,586 | $24,741 |
|---|
9/20 | $33,888 | $17,907 | $23,577 |
|---|
10/20 | $32,531 | $17,475 | $22,776 |
|---|
11/20 | $38,731 | $19,533 | $25,108 |
|---|
12/20 | $39,382 | $20,359 | $26,263 |
|---|
1/21 | $39,921 | $20,191 | $26,069 |
|---|
2/21 | $42,061 | $20,776 | $26,063 |
|---|
3/21 | $38,589 | $21,563 | $26,511 |
|---|
4/21 | $40,643 | $22,723 | $28,314 |
|---|
5/21 | $39,520 | $22,831 | $27,923 |
|---|
6/21 | $44,287 | $23,403 | $29,675 |
|---|
7/21 | $44,231 | $23,889 | $30,653 |
|---|
8/21 | $45,172 | $24,581 | $31,799 |
|---|
9/21 | $42,274 | $23,452 | $30,018 |
|---|
10/21 | $45,492 | $25,079 | $32,618 |
|---|
11/21 | $43,952 | $24,743 | $32,817 |
|---|
12/21 | $39,165 | $25,745 | $33,511 |
|---|
1/22 | $30,455 | $24,293 | $30,635 |
|---|
2/22 | $30,132 | $23,627 | $29,334 |
|---|
3/22 | $28,631 | $24,424 | $30,481 |
|---|
4/22 | $22,265 | $22,247 | $26,800 |
|---|
5/22 | $18,512 | $22,213 | $26,177 |
|---|
6/22 | $16,794 | $20,353 | $24,104 |
|---|
7/22 | $19,046 | $22,248 | $26,997 |
|---|
8/22 | $19,283 | $21,394 | $25,739 |
|---|
9/22 | $17,314 | $19,414 | $23,237 |
|---|
10/22 | $17,736 | $20,971 | $24,595 |
|---|
11/22 | $17,242 | $22,106 | $25,716 |
|---|
12/22 | $15,381 | $20,821 | $23,747 |
|---|
1/23 | $18,106 | $22,216 | $25,726 |
|---|
2/23 | $17,348 | $21,688 | $25,421 |
|---|
3/23 | $18,035 | $22,374 | $27,158 |
|---|
4/23 | $16,913 | $22,651 | $27,426 |
|---|
5/23 | $18,631 | $22,757 | $28,676 |
|---|
6/23 | $20,281 | $24,294 | $30,637 |
|---|
7/23 | $22,072 | $25,129 | $31,669 |
|---|
8/23 | $20,027 | $24,689 | $31,385 |
|---|
9/23 | $19,005 | $23,529 | $29,678 |
|---|
10/23 | $17,341 | $22,960 | $29,256 |
|---|
11/23 | $20,468 | $25,105 | $32,445 |
|---|
12/23 | $22,994 | $26,344 | $33,882 |
|---|
1/24 | $21,651 | $26,711 | $34,727 |
|---|
2/24 | $24,197 | $28,154 | $37,096 |
|---|
3/24 | $24,698 | $29,056 | $37,749 |
|---|
4/24 | $22,353 | $27,820 | $36,148 |
|---|
5/24 | $21,918 | $29,130 | $38,312 |
|---|
6/24 | $23,021 | $30,094 | $40,895 |
|---|
7/24 | $23,288 | $30,532 | $40,200 |
|---|
8/24 | $24,805 | $31,256 | $41,037 |
|---|
9/24 | $26,302 | $31,924 | $42,200 |
|---|
10/24 | $28,253 | $31,701 | $42,060 |
|---|
11/24 | $35,003 | $33,742 | $44,788 |
|---|
12/24 | $33,635 | $32,801 | $45,183 |
|---|
|
|
| Average Annual Return [Table Text Block] |
AATR | 1 Year | 5 Years | Since 4/30/15
(Inception) |
|---|
Class C, with conversion to Class A after 8 years | 45.20% | 12.48% | 13.36% |
|---|
Class C, with 1% maximum contingent deferred sales charge and conversion to Class A after 8 years | 44.20% | 12.48% | 13.36% |
|---|
Russell 1000® Index | 24.51% | 14.28% | 13.07% |
|---|
Russell 1000® Growth Index | 33.36% | 18.96% | 16.88% |
|---|
|
|
| Performance Inception Date |
Apr. 30, 2015
|
|
| AssetsNet |
$ 4,190,946,959
|
|
| Holdings Count | Holding |
33
|
|
| Advisory Fees Paid, Amount |
$ 17,778,316
|
|
| InvestmentCompanyPortfolioTurnover |
39.00%
|
|
| Additional Fund Statistics [Text Block] |
Total Net Assets | $4,190,946,959 |
|---|
# of Portfolio Holdings | 33 |
|---|
Portfolio Turnover Rate | 39% |
|---|
Total Advisory Fees Paid | $17,778,316 |
|---|
|
|
| Holdings [Text Block] |
Sector Allocation (% of total investments)Value | Value |
|---|
Short-Term Investments | 2.8% | Investment Company | 2.9% | Health Care | 4.7% | Financials | 9.7% | Communication Services | 11.3% | Consumer Discretionary | 33.3% | Information Technology | 35.3% |
Top Ten Holdings (% of total investments)Footnote ReferenceaTesla, Inc. | 9.1% | Cloudflare, Inc. | 8.8% | DoorDash, Inc. | 6.7% | Shopify, Inc. | 6.4% | Trade Desk, Inc. | 6.2% | Affirm Holdings, Inc. | 6.2% | ROBLOX Corp. | 5.1% | MercadoLibre, Inc. | 4.9% | Samsara, Inc. | 4.8% | Carvana Co. | 4.6% | Total | 62.8% |
| Footnote | Description | Footnotea | Excluding cash equivalents. |
|
|
| Material Fund Change [Text Block] |
|
|
| Updated Prospectus Web Address |
<span style="box-sizing: border-box; color: rgb(0, 0, 0); display: inline; flex-wrap: nowrap; font-size: 10.6667px; font-weight: 400; grid-area: auto; line-height: 16px; margin: 0px; overflow: visible; text-align: left;">www.morganstanley.com/im/shareholderreports</span>
|
|
| C000007750 |
|
|
| Shareholder Report [Line Items] |
|
|
| Fund Name |
Morgan Stanley Institutional Fund, Inc. - Growth Portfolio
|
|
| Class Name |
Class I
|
|
| Trading Symbol |
MSEQX
|
|
| Annual or Semi-Annual Statement [Text Block] |
This annual shareholder report contains important information about Morgan Stanley Institutional Fund, Inc. - Growth Portfolio for the period of January 1, 2024 to December 31, 2024.
|
|
| Shareholder Report Annual or Semi-Annual |
Annual Shareholder Report
|
|
| Additional Information [Text Block] |
You can find additional information about the Fund at www.morganstanley.com/im/shareholderreports. You can also request this information by contacting us at 1-800-869-6397.
|
|
| Additional Information Phone Number |
1-800-869-6397
|
|
| Additional Information Website |
<span style="box-sizing: border-box; color: rgb(0, 0, 0); display: inline; flex-wrap: nowrap; font-size: 10.6667px; font-weight: 400; grid-area: auto; line-height: 16px; margin: 0px; overflow: visible; text-align: left;">www.morganstanley.com/im/shareholderreports</span>
|
|
| Expenses [Text Block] |
What were the Fund costs for the last year?(based on a hypothetical $10,000 investment) Class Name | Costs of a $10,000 investment | Costs paid as a percentage of a $10,000 investment |
|---|
Class I | $75 | 0.61% |
|---|
|
|
| Expenses Paid, Amount |
$ 75
|
|
| Expense Ratio, Percent |
0.61%
|
|
| Factors Affecting Performance [Text Block] |
How did the Fund perform last year and what affected its performance?Key contributors to (↑) and detractors from (↓) performance, relative to the Russell 1000® Growth Index: ↑ Stock selection and average overweight in consumer discretionary, led by a position in a leading seller of used cars online in the United States ↑ Stock selection in information technology, led by a position in an enterprise analytics platform and Bitcoin developing company ↑ Stock selection and an average underweight in industrials, led by a global mobility and food delivery platform ↓ Stock selection in health care, where a position in an underperforming health care services provider was the largest detractor ↓ Average underweight to information technology ↓ Average underweight and stock selection in communication services, which lagged primarily because of underweight exposures to some of the “Magnificent 7” companies that drove significant performance gains within the Index in 2024 |
|
| Line Graph [Table Text Block] |
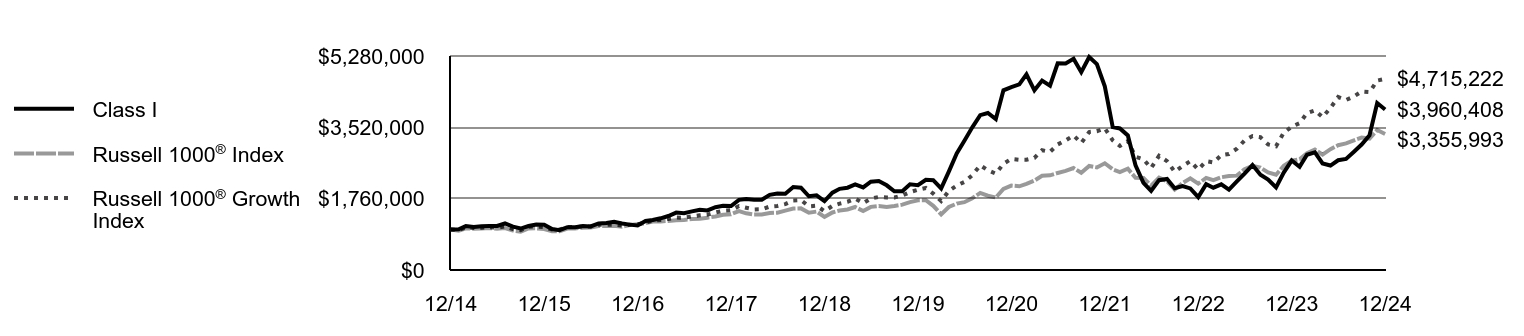 | Class I | Russell 1000® Index | Russell 1000® Growth Index |
|---|
12/14 | $1,000,000 | $1,000,000 | $1,000,000 |
|---|
1/15 | $1,005,664 | $972,533 | $984,687 |
|---|
2/15 | $1,082,389 | $1,028,726 | $1,050,322 |
|---|
3/15 | $1,062,049 | $1,015,916 | $1,038,376 |
|---|
4/15 | $1,081,874 | $1,023,128 | $1,043,577 |
|---|
5/15 | $1,084,449 | $1,036,513 | $1,058,266 |
|---|
6/15 | $1,085,994 | $1,017,068 | $1,039,623 |
|---|
7/15 | $1,147,904 | $1,036,672 | $1,074,878 |
|---|
8/15 | $1,069,491 | $974,313 | $1,009,602 |
|---|
9/15 | $1,023,014 | $947,609 | $984,626 |
|---|
10/15 | $1,085,329 | $1,024,279 | $1,069,408 |
|---|
11/15 | $1,123,497 | $1,027,663 | $1,072,410 |
|---|
12/15 | $1,119,137 | $1,009,175 | $1,056,673 |
|---|
1/16 | $1,011,762 | $954,857 | $997,681 |
|---|
2/16 | $982,704 | $954,529 | $997,256 |
|---|
3/16 | $1,056,594 | $1,021,022 | $1,064,512 |
|---|
4/16 | $1,054,380 | $1,026,575 | $1,054,791 |
|---|
5/16 | $1,083,161 | $1,044,552 | $1,075,274 |
|---|
6/16 | $1,074,305 | $1,046,918 | $1,071,051 |
|---|
7/16 | $1,147,679 | $1,086,799 | $1,121,607 |
|---|
8/16 | $1,157,365 | $1,088,243 | $1,116,035 |
|---|
9/16 | $1,191,414 | $1,089,105 | $1,120,117 |
|---|
10/16 | $1,149,147 | $1,067,867 | $1,093,813 |
|---|
11/16 | $1,119,501 | $1,109,966 | $1,117,613 |
|---|
12/16 | $1,097,751 | $1,130,819 | $1,131,448 |
|---|
1/17 | $1,209,117 | $1,153,558 | $1,169,576 |
|---|
2/17 | $1,233,137 | $1,198,210 | $1,218,155 |
|---|
3/17 | $1,275,562 | $1,198,967 | $1,232,245 |
|---|
4/17 | $1,331,713 | $1,211,643 | $1,260,426 |
|---|
5/17 | $1,415,628 | $1,227,106 | $1,293,201 |
|---|
6/17 | $1,401,590 | $1,235,674 | $1,289,794 |
|---|
7/17 | $1,446,749 | $1,260,145 | $1,324,076 |
|---|
8/17 | $1,487,929 | $1,264,087 | $1,348,348 |
|---|
9/17 | $1,470,052 | $1,291,006 | $1,365,879 |
|---|
10/17 | $1,550,179 | $1,320,616 | $1,418,803 |
|---|
11/17 | $1,582,421 | $1,360,890 | $1,461,906 |
|---|
12/17 | $1,578,866 | $1,376,061 | $1,473,287 |
|---|
1/18 | $1,730,877 | $1,451,597 | $1,577,634 |
|---|
2/18 | $1,754,380 | $1,398,304 | $1,536,267 |
|---|
3/18 | $1,732,393 | $1,366,566 | $1,494,138 |
|---|
4/18 | $1,735,805 | $1,371,211 | $1,499,358 |
|---|
5/18 | $1,853,320 | $1,406,212 | $1,565,077 |
|---|
6/18 | $1,886,300 | $1,415,306 | $1,580,146 |
|---|
7/18 | $1,881,541 | $1,464,150 | $1,626,533 |
|---|
8/18 | $2,048,505 | $1,514,601 | $1,715,466 |
|---|
9/18 | $2,031,847 | $1,520,352 | $1,725,054 |
|---|
10/18 | $1,819,946 | $1,412,767 | $1,570,788 |
|---|
11/18 | $1,842,027 | $1,441,518 | $1,587,472 |
|---|
12/18 | $1,699,814 | $1,310,229 | $1,450,985 |
|---|
1/19 | $1,906,642 | $1,420,030 | $1,581,409 |
|---|
2/19 | $2,002,727 | $1,468,110 | $1,637,991 |
|---|
3/19 | $2,030,820 | $1,493,669 | $1,684,613 |
|---|
4/19 | $2,111,026 | $1,553,990 | $1,760,724 |
|---|
5/19 | $2,036,927 | $1,454,963 | $1,649,493 |
|---|
6/19 | $2,177,798 | $1,557,107 | $1,762,775 |
|---|
7/19 | $2,193,269 | $1,581,289 | $1,802,580 |
|---|
8/19 | $2,089,855 | $1,552,327 | $1,788,774 |
|---|
9/19 | $1,942,877 | $1,579,234 | $1,788,996 |
|---|
10/19 | $1,944,913 | $1,612,704 | $1,839,431 |
|---|
11/19 | $2,112,655 | $1,673,650 | $1,921,034 |
|---|
12/19 | $2,093,495 | $1,721,983 | $1,978,994 |
|---|
1/20 | $2,224,084 | $1,723,841 | $2,023,234 |
|---|
2/20 | $2,216,854 | $1,582,974 | $1,885,448 |
|---|
3/20 | $2,013,063 | $1,373,785 | $1,699,966 |
|---|
4/20 | $2,426,972 | $1,555,321 | $1,951,512 |
|---|
5/20 | $2,877,482 | $1,637,382 | $2,082,526 |
|---|
6/20 | $3,187,010 | $1,673,590 | $2,173,209 |
|---|
7/20 | $3,520,036 | $1,771,589 | $2,340,414 |
|---|
8/20 | $3,820,526 | $1,901,618 | $2,581,926 |
|---|
9/20 | $3,873,847 | $1,832,118 | $2,460,447 |
|---|
10/20 | $3,721,568 | $1,787,937 | $2,376,885 |
|---|
11/20 | $4,434,160 | $1,998,480 | $2,620,259 |
|---|
12/20 | $4,513,043 | $2,082,967 | $2,740,768 |
|---|
1/21 | $4,578,664 | $2,065,812 | $2,720,489 |
|---|
2/21 | $4,827,333 | $2,125,680 | $2,719,859 |
|---|
3/21 | $4,432,620 | $2,206,123 | $2,766,587 |
|---|
4/21 | $4,672,408 | $2,324,880 | $2,954,822 |
|---|
5/21 | $4,547,087 | $2,335,916 | $2,913,953 |
|---|
6/21 | $5,099,684 | $2,394,447 | $3,096,768 |
|---|
7/21 | $5,097,711 | $2,444,189 | $3,198,826 |
|---|
8/21 | $5,210,697 | $2,514,930 | $3,318,426 |
|---|
9/21 | $4,880,126 | $2,399,409 | $3,132,575 |
|---|
10/21 | $5,255,596 | $2,565,897 | $3,403,905 |
|---|
11/21 | $5,081,922 | $2,531,477 | $3,424,717 |
|---|
12/21 | $4,532,250 | $2,634,015 | $3,497,125 |
|---|
1/22 | $3,527,456 | $2,485,509 | $3,196,984 |
|---|
2/22 | $3,492,682 | $2,417,303 | $3,061,197 |
|---|
3/22 | $3,321,251 | $2,498,876 | $3,180,943 |
|---|
4/22 | $2,584,890 | $2,276,125 | $2,796,807 |
|---|
5/22 | $2,150,516 | $2,272,665 | $2,731,788 |
|---|
6/22 | $1,952,851 | $2,082,329 | $2,515,399 |
|---|
7/22 | $2,216,404 | $2,276,276 | $2,817,300 |
|---|
8/22 | $2,246,298 | $2,188,876 | $2,686,059 |
|---|
9/22 | $2,018,129 | $1,986,345 | $2,424,932 |
|---|
10/22 | $2,069,376 | $2,145,650 | $2,566,666 |
|---|
11/22 | $2,013,249 | $2,261,724 | $2,683,621 |
|---|
12/22 | $1,797,597 | $2,130,209 | $2,478,172 |
|---|
1/23 | $2,118,170 | $2,273,029 | $2,684,721 |
|---|
2/23 | $2,030,996 | $2,218,941 | $2,652,836 |
|---|
3/23 | $2,113,249 | $2,289,133 | $2,834,174 |
|---|
4/23 | $1,983,192 | $2,317,498 | $2,862,136 |
|---|
5/23 | $2,184,956 | $2,328,292 | $2,992,588 |
|---|
6/23 | $2,378,986 | $2,485,539 | $3,197,237 |
|---|
7/23 | $2,589,186 | $2,571,013 | $3,304,952 |
|---|
8/23 | $2,350,163 | $2,526,038 | $3,275,277 |
|---|
9/23 | $2,231,354 | $2,407,324 | $3,097,155 |
|---|
10/23 | $2,035,917 | $2,349,141 | $3,053,059 |
|---|
11/23 | $2,403,592 | $2,568,540 | $3,385,876 |
|---|
12/23 | $2,700,965 | $2,695,338 | $3,535,809 |
|---|
1/24 | $2,544,194 | $2,732,927 | $3,623,998 |
|---|
2/24 | $2,843,676 | $2,880,509 | $3,871,252 |
|---|
3/24 | $2,902,729 | $2,972,850 | $3,939,403 |
|---|
4/24 | $2,627,852 | $2,846,348 | $3,772,310 |
|---|
5/24 | $2,577,235 | $2,980,382 | $3,998,140 |
|---|
6/24 | $2,707,292 | $3,079,023 | $4,267,741 |
|---|
7/24 | $2,738,928 | $3,123,832 | $4,195,145 |
|---|
8/24 | $2,918,195 | $3,197,877 | $4,282,521 |
|---|
9/24 | $3,095,354 | $3,266,253 | $4,403,847 |
|---|
10/24 | $3,325,238 | $3,243,431 | $4,389,274 |
|---|
11/24 | $4,120,343 | $3,452,240 | $4,673,964 |
|---|
12/24 | $3,960,408 | $3,355,993 | $4,715,222 |
|---|
|
|
| Average Annual Return [Table Text Block] |
AATR | 1 Year | 5 Years | 10 Years |
|---|
Class I | 46.63% | 13.60% | 14.76% |
|---|
Russell 1000® Index | 24.51% | 14.28% | 12.87% |
|---|
Russell 1000® Growth Index | 33.36% | 18.96% | 16.78% |
|---|
|
|
| AssetsNet |
$ 4,190,946,959
|
|
| Holdings Count | Holding |
33
|
|
| Advisory Fees Paid, Amount |
$ 17,778,316
|
|
| InvestmentCompanyPortfolioTurnover |
39.00%
|
|
| Additional Fund Statistics [Text Block] |
Total Net Assets | $4,190,946,959 |
|---|
# of Portfolio Holdings | 33 |
|---|
Portfolio Turnover Rate | 39% |
|---|
Total Advisory Fees Paid | $17,778,316 |
|---|
|
|
| Holdings [Text Block] |
Sector Allocation (% of total investments)Value | Value |
|---|
Short-Term Investments | 2.8% | Investment Company | 2.9% | Health Care | 4.7% | Financials | 9.7% | Communication Services | 11.3% | Consumer Discretionary | 33.3% | Information Technology | 35.3% |
Top Ten Holdings (% of total investments)Footnote ReferenceaTesla, Inc. | 9.1% | Cloudflare, Inc. | 8.8% | DoorDash, Inc. | 6.7% | Shopify, Inc. | 6.4% | Trade Desk, Inc. | 6.2% | Affirm Holdings, Inc. | 6.2% | ROBLOX Corp. | 5.1% | MercadoLibre, Inc. | 4.9% | Samsara, Inc. | 4.8% | Carvana Co. | 4.6% | Total | 62.8% |
| Footnote | Description | Footnotea | Excluding cash equivalents. |
|
|
| Material Fund Change [Text Block] |
|
|
| Updated Prospectus Web Address |
<span style="box-sizing: border-box; color: rgb(0, 0, 0); display: inline; flex-wrap: nowrap; font-size: 10.6667px; font-weight: 400; grid-area: auto; line-height: 16px; margin: 0px; overflow: visible; text-align: left;">www.morganstanley.com/im/shareholderreports</span>
|
|
| C000198816 |
|
|
| Shareholder Report [Line Items] |
|
|
| Fund Name |
Morgan Stanley Institutional Fund, Inc. - Growth Portfolio
|
|
| Class Name |
Class IR
|
|
| Trading Symbol |
MGHRX
|
|
| Annual or Semi-Annual Statement [Text Block] |
This annual shareholder report contains important information about Morgan Stanley Institutional Fund, Inc. - Growth Portfolio for the period of January 1, 2024 to December 31, 2024.
|
|
| Shareholder Report Annual or Semi-Annual |
Annual Shareholder Report
|
|
| Additional Information [Text Block] |
You can find additional information about the Fund at www.morganstanley.com/im/shareholderreports. You can also request this information by contacting us at 1-800-869-6397.
|
|
| Additional Information Phone Number |
1-800-869-6397
|
|
| Additional Information Website |
<span style="box-sizing: border-box; color: rgb(0, 0, 0); display: inline; flex-wrap: nowrap; font-size: 10.6667px; font-weight: 400; grid-area: auto; line-height: 16px; margin: 0px; overflow: visible; text-align: left;">www.morganstanley.com/im/shareholderreports</span>
|
|
| Expenses [Text Block] |
What were the Fund costs for the last year?(based on a hypothetical $10,000 investment) Class Name | Costs of a $10,000 investment | Costs paid as a percentage of a $10,000 investment |
|---|
Class IR | $64 | 0.52% |
|---|
|
|
| Expenses Paid, Amount |
$ 64
|
|
| Expense Ratio, Percent |
0.52%
|
|
| Factors Affecting Performance [Text Block] |
How did the Fund perform last year and what affected its performance?Key contributors to (↑) and detractors from (↓) performance, relative to the Russell 1000® Growth Index: ↑ Stock selection and average overweight in consumer discretionary, led by a position in a leading seller of used cars online in the United States ↑ Stock selection in information technology, led by a position in an enterprise analytics platform and Bitcoin developing company ↑ Stock selection and an average underweight in industrials, led by a global mobility and food delivery platform ↓ Stock selection in health care, where a position in an underperforming health care services provider was the largest detractor ↓ Average underweight to information technology ↓ Average underweight and stock selection in communication services, which lagged primarily because of underweight exposures to some of the “Magnificent 7” companies that drove significant performance gains within the Index in 2024 |
|
| Line Graph [Table Text Block] |
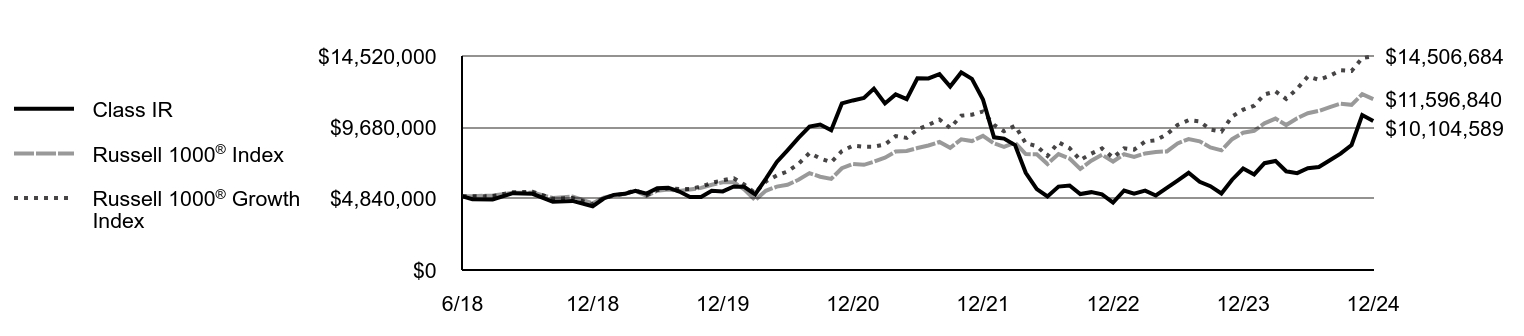 | Class IR | Russell 1000® Index | Russell 1000® Growth Index |
|---|
6/18 | $5,000,000 | $5,000,000 | $5,000,000 |
|---|
6/18 | $4,798,696 | $5,000,000 | $5,000,000 |
|---|
7/18 | $4,785,687 | $5,059,461 | $5,004,135 |
|---|
8/18 | $5,211,756 | $5,233,797 | $5,277,743 |
|---|
9/18 | $5,169,639 | $5,253,671 | $5,307,240 |
|---|
10/18 | $4,630,931 | $4,881,904 | $4,832,630 |
|---|
11/18 | $4,686,761 | $4,981,253 | $4,883,961 |
|---|
12/18 | $4,326,237 | $4,527,576 | $4,464,050 |
|---|
1/19 | $4,852,095 | $4,907,002 | $4,865,306 |
|---|
2/19 | $5,098,044 | $5,073,145 | $5,039,385 |
|---|
3/19 | $5,169,050 | $5,161,466 | $5,182,822 |
|---|
4/19 | $5,373,837 | $5,369,908 | $5,416,981 |
|---|
5/19 | $5,185,516 | $5,027,714 | $5,074,772 |
|---|
6/19 | $5,544,663 | $5,380,681 | $5,423,290 |
|---|
7/19 | $5,583,768 | $5,464,242 | $5,545,753 |
|---|
8/19 | $5,320,325 | $5,364,161 | $5,503,279 |
|---|
9/19 | $4,946,770 | $5,457,141 | $5,503,962 |
|---|
10/19 | $4,952,944 | $5,572,797 | $5,659,128 |
|---|
11/19 | $5,381,040 | $5,783,401 | $5,910,184 |
|---|
12/19 | $5,332,721 | $5,950,418 | $6,088,501 |
|---|
1/20 | $5,665,944 | $5,956,841 | $6,224,611 |
|---|
2/20 | $5,647,685 | $5,470,064 | $5,800,704 |
|---|
3/20 | $5,129,591 | $4,747,199 | $5,230,056 |
|---|
4/20 | $6,184,039 | $5,374,507 | $6,003,954 |
|---|
5/20 | $7,332,063 | $5,658,073 | $6,407,024 |
|---|
6/20 | $8,121,757 | $5,783,194 | $6,686,018 |
|---|
7/20 | $8,969,652 | $6,121,835 | $7,200,434 |
|---|
8/20 | $9,736,523 | $6,571,160 | $7,943,463 |
|---|
9/20 | $9,873,464 | $6,330,999 | $7,569,723 |
|---|
10/20 | $9,485,464 | $6,178,328 | $7,312,641 |
|---|
11/20 | $11,303,359 | $6,905,870 | $8,061,396 |
|---|
12/20 | $11,504,929 | $7,197,820 | $8,432,148 |
|---|
1/21 | $11,671,757 | $7,138,539 | $8,369,760 |
|---|
2/21 | $12,306,701 | $7,345,418 | $8,367,823 |
|---|
3/21 | $11,300,751 | $7,623,393 | $8,511,584 |
|---|
4/21 | $11,913,285 | $8,033,765 | $9,090,701 |
|---|
5/21 | $11,594,568 | $8,071,901 | $8,964,964 |
|---|
6/21 | $13,005,139 | $8,274,161 | $9,527,406 |
|---|
7/21 | $13,000,159 | $8,446,046 | $9,841,394 |
|---|
8/21 | $13,288,996 | $8,690,495 | $10,209,353 |
|---|
9/21 | $12,447,385 | $8,291,305 | $9,637,570 |
|---|
10/21 | $13,407,270 | $8,866,616 | $10,472,333 |
|---|
11/21 | $12,965,299 | $8,747,674 | $10,536,362 |
|---|
12/21 | $11,564,756 | $9,102,003 | $10,759,130 |
|---|
1/22 | $9,000,611 | $8,588,829 | $9,835,727 |
|---|
2/22 | $8,913,092 | $8,353,140 | $9,417,969 |
|---|
3/22 | $8,478,569 | $8,635,019 | $9,786,378 |
|---|
4/22 | $6,597,684 | $7,865,289 | $8,604,558 |
|---|
5/22 | $5,490,649 | $7,853,334 | $8,404,523 |
|---|
6/22 | $4,987,032 | $7,195,617 | $7,738,789 |
|---|
7/22 | $5,661,080 | $7,865,813 | $8,667,607 |
|---|
8/22 | $5,736,315 | $7,563,795 | $8,263,835 |
|---|
9/22 | $5,152,857 | $6,863,936 | $7,460,460 |
|---|
10/22 | $5,281,832 | $7,414,425 | $7,896,512 |
|---|
11/22 | $5,137,503 | $7,815,529 | $8,256,333 |
|---|
12/22 | $4,578,500 | $7,361,070 | $7,624,255 |
|---|
1/23 | $5,394,260 | $7,854,591 | $8,259,718 |
|---|
2/23 | $5,175,312 | $7,667,686 | $8,161,623 |
|---|
3/23 | $5,383,666 | $7,910,240 | $8,719,519 |
|---|
4/23 | $5,053,477 | $8,008,256 | $8,805,547 |
|---|
5/23 | $5,567,301 | $8,045,556 | $9,206,889 |
|---|
6/23 | $6,063,467 | $8,588,935 | $9,836,507 |
|---|
7/23 | $6,598,478 | $8,884,294 | $10,167,897 |
|---|
8/23 | $5,989,307 | $8,728,881 | $10,076,601 |
|---|
9/23 | $5,685,604 | $8,318,657 | $9,528,596 |
|---|
10/23 | $5,189,438 | $8,117,602 | $9,392,932 |
|---|
11/23 | $6,127,032 | $8,875,748 | $10,416,866 |
|---|
12/23 | $6,882,759 | $9,313,906 | $10,878,145 |
|---|
1/24 | $6,483,707 | $9,443,798 | $11,149,463 |
|---|
2/24 | $7,248,262 | $9,953,776 | $11,910,158 |
|---|
3/24 | $7,400,113 | $10,272,866 | $12,119,827 |
|---|
4/24 | $6,699,124 | $9,835,731 | $11,605,755 |
|---|
5/24 | $6,571,993 | $10,298,893 | $12,300,536 |
|---|
6/24 | $6,903,947 | $10,639,754 | $13,129,981 |
|---|
7/24 | $6,985,170 | $10,794,593 | $12,906,634 |
|---|
8/24 | $7,442,490 | $11,050,461 | $13,175,452 |
|---|
9/24 | $7,896,279 | $11,286,740 | $13,548,720 |
|---|
10/24 | $8,484,262 | $11,207,877 | $13,503,884 |
|---|
11/24 | $10,513,069 | $11,929,429 | $14,379,751 |
|---|
12/24 | $10,104,589 | $11,596,840 | $14,506,684 |
|---|
|
|
| Average Annual Return [Table Text Block] |
AATR | 1 Year | 5 Years | Since 6/15/18
(Inception) |
|---|
Class IR | 46.81% | 13.64% | 11.35% |
|---|
Russell 1000® Index | 24.51% | 14.28% | 13.72% |
|---|
Russell 1000® Growth Index | 33.36% | 18.96% | 17.67% |
|---|
|
|
| Performance Inception Date |
Jun. 15, 2018
|
|
| AssetsNet |
$ 4,190,946,959
|
|
| Holdings Count | Holding |
33
|
|
| Advisory Fees Paid, Amount |
$ 17,778,316
|
|
| InvestmentCompanyPortfolioTurnover |
39.00%
|
|
| Additional Fund Statistics [Text Block] |
Total Net Assets | $4,190,946,959 |
|---|
# of Portfolio Holdings | 33 |
|---|
Portfolio Turnover Rate | 39% |
|---|
Total Advisory Fees Paid | $17,778,316 |
|---|
|
|
| Holdings [Text Block] |
Sector Allocation (% of total investments)Value | Value |
|---|
Short-Term Investments | 2.8% | Investment Company | 2.9% | Health Care | 4.7% | Financials | 9.7% | Communication Services | 11.3% | Consumer Discretionary | 33.3% | Information Technology | 35.3% |
Top Ten Holdings (% of total investments)Footnote ReferenceaTesla, Inc. | 9.1% | Cloudflare, Inc. | 8.8% | DoorDash, Inc. | 6.7% | Shopify, Inc. | 6.4% | Trade Desk, Inc. | 6.2% | Affirm Holdings, Inc. | 6.2% | ROBLOX Corp. | 5.1% | MercadoLibre, Inc. | 4.9% | Samsara, Inc. | 4.8% | Carvana Co. | 4.6% | Total | 62.8% |
| Footnote | Description | Footnotea | Excluding cash equivalents. |
|
|
| Material Fund Change [Text Block] |
|
|
| Updated Prospectus Web Address |
<span style="box-sizing: border-box; color: rgb(0, 0, 0); display: inline; flex-wrap: nowrap; font-size: 10.6667px; font-weight: 400; grid-area: auto; line-height: 16px; margin: 0px; overflow: visible; text-align: left;">www.morganstanley.com/im/shareholderreports</span>
|
|
| C000113805 |
|
|
| Shareholder Report [Line Items] |
|
|
| Fund Name |
Morgan Stanley Institutional Fund, Inc. - Growth Portfolio
|
|
| Class Name |
Class L
|
|
| Trading Symbol |
MSHLX
|
|
| Annual or Semi-Annual Statement [Text Block] |
This annual shareholder report contains important information about Morgan Stanley Institutional Fund, Inc. - Growth Portfolio for the period of January 1, 2024 to December 31, 2024.
|
|
| Shareholder Report Annual or Semi-Annual |
Annual Shareholder Report
|
|
| Additional Information [Text Block] |
You can find additional information about the Fund at www.morganstanley.com/im/shareholderreports. You can also request this information by contacting us at 1-800-869-6397.
|
|
| Additional Information Phone Number |
1-800-869-6397
|
|
| Additional Information Website |
<span style="box-sizing: border-box; color: rgb(0, 0, 0); display: inline; flex-wrap: nowrap; font-size: 10.6667px; font-weight: 400; grid-area: auto; line-height: 16px; margin: 0px; overflow: visible; text-align: left;">www.morganstanley.com/im/shareholderreports</span>
|
|
| Expenses [Text Block] |
What were the Fund costs for the last year?(based on a hypothetical $10,000 investment) Class Name | Costs of a $10,000 investment | Costs paid as a percentage of a $10,000 investment |
|---|
Class L | $167 | 1.36% |
|---|
|
|
| Expenses Paid, Amount |
$ 167
|
|
| Expense Ratio, Percent |
1.36%
|
|
| Factors Affecting Performance [Text Block] |
How did the Fund perform last year and what affected its performance?Key contributors to (↑) and detractors from (↓) performance, relative to the Russell 1000® Growth Index: ↑ Stock selection and average overweight in consumer discretionary, led by a position in a leading seller of used cars online in the United States ↑ Stock selection in information technology, led by a position in an enterprise analytics platform and Bitcoin developing company ↑ Stock selection and an average underweight in industrials, led by a global mobility and food delivery platform ↓ Stock selection in health care, where a position in an underperforming health care services provider was the largest detractor ↓ Average underweight to information technology ↓ Average underweight and stock selection in communication services, which lagged primarily because of underweight exposures to some of the “Magnificent 7” companies that drove significant performance gains within the Index in 2024 |
|
| Line Graph [Table Text Block] |
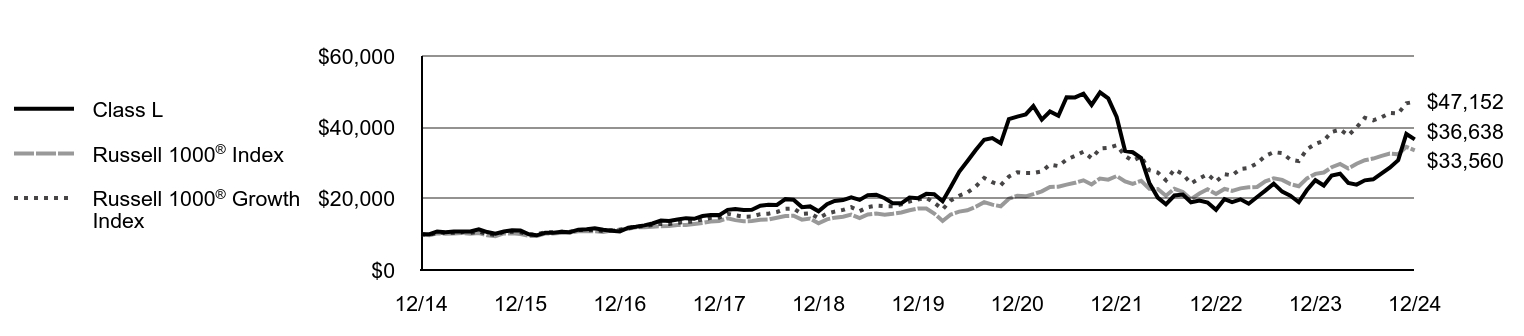 | Class L | Russell 1000® Index | Russell 1000® Growth Index |
|---|
12/14 | $10,000 | $10,000 | $10,000 |
|---|
1/15 | $10,051 | $9,725 | $9,847 |
|---|
2/15 | $10,811 | $10,287 | $10,503 |
|---|
3/15 | $10,602 | $10,159 | $10,384 |
|---|
4/15 | $10,789 | $10,231 | $10,436 |
|---|
5/15 | $10,808 | $10,365 | $10,583 |
|---|
6/15 | $10,816 | $10,171 | $10,396 |
|---|
7/15 | $11,422 | $10,367 | $10,749 |
|---|
8/15 | $10,634 | $9,743 | $10,096 |
|---|
9/15 | $10,161 | $9,476 | $9,846 |
|---|
10/15 | $10,774 | $10,243 | $10,694 |
|---|
11/15 | $11,136 | $10,277 | $10,724 |
|---|
12/15 | $11,085 | $10,092 | $10,567 |
|---|
1/16 | $10,014 | $9,549 | $9,977 |
|---|
2/16 | $9,722 | $9,545 | $9,973 |
|---|
3/16 | $10,444 | $10,210 | $10,645 |
|---|
4/16 | $10,415 | $10,266 | $10,548 |
|---|
5/16 | $10,692 | $10,446 | $10,753 |
|---|
6/16 | $10,597 | $10,469 | $10,711 |
|---|
7/16 | $11,316 | $10,868 | $11,216 |
|---|
8/16 | $11,402 | $10,882 | $11,160 |
|---|
9/16 | $11,730 | $10,891 | $11,201 |
|---|
10/16 | $11,306 | $10,679 | $10,938 |
|---|
11/16 | $11,005 | $11,100 | $11,176 |
|---|
12/16 | $10,784 | $11,308 | $11,314 |
|---|
1/17 | $11,872 | $11,536 | $11,696 |
|---|
2/17 | $12,101 | $11,982 | $12,182 |
|---|
3/17 | $12,508 | $11,990 | $12,322 |
|---|
4/17 | $13,048 | $12,116 | $12,604 |
|---|
5/17 | $13,865 | $12,271 | $12,932 |
|---|
6/17 | $13,714 | $12,357 | $12,898 |
|---|
7/17 | $14,145 | $12,601 | $13,241 |
|---|
8/17 | $14,539 | $12,641 | $13,483 |
|---|
9/17 | $14,354 | $12,910 | $13,659 |
|---|
10/17 | $15,130 | $13,206 | $14,188 |
|---|
11/17 | $15,432 | $13,609 | $14,619 |
|---|
12/17 | $15,387 | $13,761 | $14,733 |
|---|
1/18 | $16,857 | $14,516 | $15,776 |
|---|
2/18 | $17,076 | $13,983 | $15,363 |
|---|
3/18 | $16,853 | $13,666 | $14,941 |
|---|
4/18 | $16,874 | $13,712 | $14,994 |
|---|
5/18 | $18,004 | $14,062 | $15,651 |
|---|
6/18 | $18,316 | $14,153 | $15,801 |
|---|
7/18 | $18,252 | $14,642 | $16,265 |
|---|
8/18 | $19,866 | $15,146 | $17,155 |
|---|
9/18 | $19,692 | $15,204 | $17,251 |
|---|
10/18 | $17,630 | $14,128 | $15,708 |
|---|
11/18 | $17,829 | $14,415 | $15,875 |
|---|
12/18 | $16,447 | $13,102 | $14,510 |
|---|
1/19 | $18,433 | $14,200 | $15,814 |
|---|
2/19 | $19,353 | $14,681 | $16,380 |
|---|
3/19 | $19,612 | $14,937 | $16,846 |
|---|
4/19 | $20,370 | $15,540 | $17,607 |
|---|
5/19 | $19,643 | $14,550 | $16,495 |
|---|
6/19 | $20,993 | $15,571 | $17,628 |
|---|
7/19 | $21,124 | $15,813 | $18,026 |
|---|
8/19 | $20,116 | $15,523 | $17,888 |
|---|
9/19 | $18,691 | $15,792 | $17,890 |
|---|
10/19 | $18,700 | $16,127 | $18,394 |
|---|
11/19 | $20,300 | $16,736 | $19,210 |
|---|
12/19 | $20,101 | $17,220 | $19,790 |
|---|
1/20 | $21,344 | $17,238 | $20,232 |
|---|
2/20 | $21,260 | $15,830 | $18,854 |
|---|
3/20 | $19,298 | $13,738 | $17,000 |
|---|
4/20 | $23,247 | $15,553 | $19,515 |
|---|
5/20 | $27,546 | $16,374 | $20,825 |
|---|
6/20 | $30,495 | $16,736 | $21,732 |
|---|
7/20 | $33,655 | $17,716 | $23,404 |
|---|
8/20 | $36,510 | $19,016 | $25,819 |
|---|
9/20 | $36,998 | $18,321 | $24,604 |
|---|
10/20 | $35,519 | $17,879 | $23,769 |
|---|
11/20 | $42,293 | $19,985 | $26,203 |
|---|
12/20 | $43,019 | $20,830 | $27,408 |
|---|
1/21 | $43,614 | $20,658 | $27,205 |
|---|
2/21 | $45,960 | $21,257 | $27,199 |
|---|
3/21 | $42,179 | $22,061 | $27,666 |
|---|
4/21 | $44,432 | $23,249 | $29,548 |
|---|
5/21 | $43,216 | $23,359 | $29,140 |
|---|
6/21 | $48,437 | $23,944 | $30,968 |
|---|
7/21 | $48,388 | $24,442 | $31,988 |
|---|
8/21 | $49,424 | $25,149 | $33,184 |
|---|
9/21 | $46,266 | $23,994 | $31,326 |
|---|
10/21 | $49,795 | $25,659 | $34,039 |
|---|
11/21 | $48,120 | $25,315 | $34,247 |
|---|
12/21 | $42,891 | $26,340 | $34,971 |
|---|
1/22 | $33,357 | $24,855 | $31,970 |
|---|
2/22 | $33,013 | $24,173 | $30,612 |
|---|
3/22 | $31,376 | $24,989 | $31,809 |
|---|
4/22 | $24,400 | $22,761 | $27,968 |
|---|
5/22 | $20,297 | $22,727 | $27,318 |
|---|
6/22 | $18,414 | $20,823 | $25,154 |
|---|
7/22 | $20,887 | $22,763 | $28,173 |
|---|
8/22 | $21,154 | $21,889 | $26,861 |
|---|
9/22 | $18,997 | $19,863 | $24,249 |
|---|
10/22 | $19,468 | $21,456 | $25,667 |
|---|
11/22 | $18,927 | $22,617 | $26,836 |
|---|
12/22 | $16,885 | $21,302 | $24,782 |
|---|
1/23 | $19,878 | $22,730 | $26,847 |
|---|
2/23 | $19,048 | $22,189 | $26,528 |
|---|
3/23 | $19,811 | $22,891 | $28,342 |
|---|
4/23 | $18,579 | $23,175 | $28,621 |
|---|
5/23 | $20,457 | $23,283 | $29,926 |
|---|
6/23 | $22,260 | $24,855 | $31,972 |
|---|
7/23 | $24,213 | $25,710 | $33,050 |
|---|
8/23 | $21,966 | $25,260 | $32,753 |
|---|
9/23 | $20,834 | $24,073 | $30,972 |
|---|
10/23 | $19,007 | $23,491 | $30,531 |
|---|
11/23 | $22,419 | $25,685 | $33,859 |
|---|
12/23 | $25,177 | $26,953 | $35,358 |
|---|
1/24 | $23,693 | $27,329 | $36,240 |
|---|
2/24 | $26,477 | $28,805 | $38,713 |
|---|
3/24 | $27,005 | $29,728 | $39,394 |
|---|
4/24 | $24,431 | $28,463 | $37,723 |
|---|
5/24 | $23,945 | $29,804 | $39,981 |
|---|
6/24 | $25,144 | $30,790 | $42,677 |
|---|
7/24 | $25,420 | $31,238 | $41,951 |
|---|
8/24 | $27,072 | $31,979 | $42,825 |
|---|
9/24 | $28,690 | $32,663 | $44,038 |
|---|
10/24 | $30,803 | $32,434 | $43,893 |
|---|
11/24 | $38,147 | $34,522 | $46,740 |
|---|
12/24 | $36,638 | $33,560 | $47,152 |
|---|
|
|
| Average Annual Return [Table Text Block] |
AATR | 1 Year | 5 Years | 10 Years |
|---|
Class L | 45.52% | 12.76% | 13.87% |
|---|
Russell 1000® Index | 24.51% | 14.28% | 12.87% |
|---|
Russell 1000® Growth Index | 33.36% | 18.96% | 16.78% |
|---|
|
|
| AssetsNet |
$ 4,190,946,959
|
|
| Holdings Count | Holding |
33
|
|
| Advisory Fees Paid, Amount |
$ 17,778,316
|
|
| InvestmentCompanyPortfolioTurnover |
39.00%
|
|
| Additional Fund Statistics [Text Block] |
Total Net Assets | $4,190,946,959 |
|---|
# of Portfolio Holdings | 33 |
|---|
Portfolio Turnover Rate | 39% |
|---|
Total Advisory Fees Paid | $17,778,316 |
|---|
|
|
| Holdings [Text Block] |
Sector Allocation (% of total investments)Value | Value |
|---|
Short-Term Investments | 2.8% | Investment Company | 2.9% | Health Care | 4.7% | Financials | 9.7% | Communication Services | 11.3% | Consumer Discretionary | 33.3% | Information Technology | 35.3% |
Top Ten Holdings (% of total investments)Footnote ReferenceaTesla, Inc. | 9.1% | Cloudflare, Inc. | 8.8% | DoorDash, Inc. | 6.7% | Shopify, Inc. | 6.4% | Trade Desk, Inc. | 6.2% | Affirm Holdings, Inc. | 6.2% | ROBLOX Corp. | 5.1% | MercadoLibre, Inc. | 4.9% | Samsara, Inc. | 4.8% | Carvana Co. | 4.6% | Total | 62.8% |
| Footnote | Description | Footnotea | Excluding cash equivalents. |
|
|
| Material Fund Change [Text Block] |
|
|
| Updated Prospectus Web Address |
<span style="box-sizing: border-box; color: rgb(0, 0, 0); display: inline; flex-wrap: nowrap; font-size: 10.6667px; font-weight: 400; grid-area: auto; line-height: 16px; margin: 0px; overflow: visible; text-align: left;">www.morganstanley.com/im/shareholderreports</span>
|
|
| C000126914 |
|
|
| Shareholder Report [Line Items] |
|
|
| Fund Name |
Morgan Stanley Institutional Fund, Inc. - Growth Portfolio
|
|
| Class Name |
Class R6
|
|
| Trading Symbol |
MGRPX
|
|
| Annual or Semi-Annual Statement [Text Block] |
This annual shareholder report contains important information about Morgan Stanley Institutional Fund, Inc. - Growth Portfolio for the period of January 1, 2024 to December 31, 2024.
|
|
| Shareholder Report Annual or Semi-Annual |
Annual Shareholder Report
|
|
| Additional Information [Text Block] |
You can find additional information about the Fund at www.morganstanley.com/im/shareholderreports. You can also request this information by contacting us at 1-800-869-6397.
|
|
| Additional Information Phone Number |
1-800-869-6397
|
|
| Additional Information Website |
<span style="box-sizing: border-box; color: rgb(0, 0, 0); display: inline; flex-wrap: nowrap; font-size: 10.6667px; font-weight: 400; grid-area: auto; line-height: 16px; margin: 0px; overflow: visible; text-align: left;">www.morganstanley.com/im/shareholderreports</span>
|
|
| Expenses [Text Block] |
What were the Fund costs for the last year?(based on a hypothetical $10,000 investment) Class Name | Costs of a $10,000 investment | Costs paid as a percentage of a $10,000 investment |
|---|
Class R6 | $64 | 0.52% |
|---|
|
|
| Expenses Paid, Amount |
$ 64
|
|
| Expense Ratio, Percent |
0.52%
|
|
| Factors Affecting Performance [Text Block] |
How did the Fund perform last year and what affected its performance?Key contributors to (↑) and detractors from (↓) performance, relative to the Russell 1000® Growth Index: ↑ Stock selection and average overweight in consumer discretionary, led by a position in a leading seller of used cars online in the United States ↑ Stock selection in information technology, led by a position in an enterprise analytics platform and Bitcoin developing company ↑ Stock selection and an average underweight in industrials, led by a global mobility and food delivery platform ↓ Stock selection in health care, where a position in an underperforming health care services provider was the largest detractor ↓ Average underweight to information technology ↓ Average underweight and stock selection in communication services, which lagged primarily because of underweight exposures to some of the “Magnificent 7” companies that drove significant performance gains within the Index in 2024 |
|
| Line Graph [Table Text Block] |
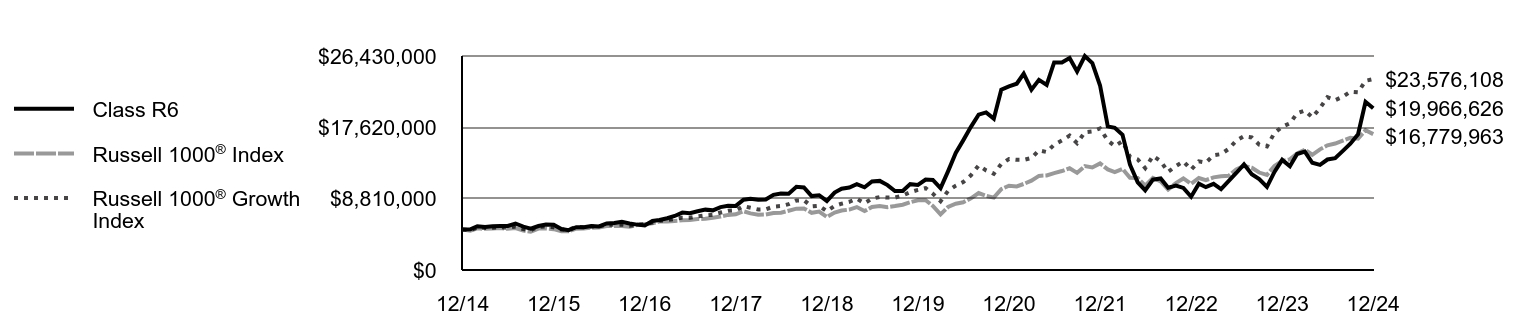 | Class R6 | Russell 1000® Index | Russell 1000® Growth Index |
|---|
12/14 | $5,000,000 | $5,000,000 | $5,000,000 |
|---|
1/15 | $5,028,270 | $4,862,663 | $4,923,436 |
|---|
2/15 | $5,412,490 | $5,143,631 | $5,251,609 |
|---|
3/15 | $5,310,974 | $5,079,580 | $5,191,882 |
|---|
4/15 | $5,409,920 | $5,115,638 | $5,217,884 |
|---|
5/15 | $5,422,770 | $5,182,565 | $5,291,331 |
|---|
6/15 | $5,431,766 | $5,085,341 | $5,198,115 |
|---|
7/15 | $5,740,757 | $5,183,361 | $5,374,388 |
|---|
8/15 | $5,349,400 | $4,871,566 | $5,048,008 |
|---|
9/15 | $5,116,142 | $4,738,047 | $4,923,131 |
|---|
10/15 | $5,428,449 | $5,121,396 | $5,347,041 |
|---|
11/15 | $5,620,240 | $5,138,314 | $5,362,050 |
|---|
12/15 | $5,598,489 | $5,045,874 | $5,283,363 |
|---|
1/16 | $5,061,288 | $4,774,284 | $4,988,406 |
|---|
2/16 | $4,917,666 | $4,772,646 | $4,986,278 |
|---|
3/16 | $5,287,768 | $5,105,112 | $5,322,559 |
|---|
4/16 | $5,276,721 | $5,132,875 | $5,273,956 |
|---|
5/16 | $5,420,342 | $5,222,761 | $5,376,372 |
|---|
6/16 | $5,376,151 | $5,234,588 | $5,355,257 |
|---|
7/16 | $5,745,076 | $5,433,997 | $5,608,036 |
|---|
8/16 | $5,794,867 | $5,441,216 | $5,580,173 |
|---|
9/16 | $5,964,745 | $5,445,523 | $5,600,585 |
|---|
10/16 | $5,753,862 | $5,339,335 | $5,469,067 |
|---|
11/16 | $5,605,952 | $5,549,830 | $5,588,064 |
|---|
12/16 | $5,495,906 | $5,654,094 | $5,657,239 |
|---|
1/17 | $6,054,521 | $5,767,790 | $5,847,880 |
|---|
2/17 | $6,175,892 | $5,991,050 | $6,090,776 |
|---|
3/17 | $6,389,068 | $5,994,835 | $6,161,223 |
|---|
4/17 | $6,670,710 | $6,058,214 | $6,302,132 |
|---|
5/17 | $7,092,395 | $6,135,531 | $6,466,004 |
|---|
6/17 | $7,020,817 | $6,178,371 | $6,448,969 |
|---|
7/17 | $7,247,604 | $6,300,725 | $6,620,378 |
|---|
8/17 | $7,454,587 | $6,320,434 | $6,741,738 |
|---|
9/17 | $7,365,425 | $6,455,028 | $6,829,394 |
|---|
10/17 | $7,768,247 | $6,603,080 | $7,094,014 |
|---|
11/17 | $7,929,057 | $6,804,448 | $7,309,528 |
|---|
12/17 | $7,913,205 | $6,880,305 | $7,366,434 |
|---|
1/18 | $8,674,490 | $7,257,987 | $7,888,170 |
|---|
2/18 | $8,793,500 | $6,991,521 | $7,681,336 |
|---|
3/18 | $8,683,935 | $6,832,830 | $7,470,689 |
|---|
4/18 | $8,700,937 | $6,856,054 | $7,496,788 |
|---|
5/18 | $9,290,319 | $7,031,062 | $7,825,383 |
|---|
6/18 | $9,456,554 | $7,076,529 | $7,900,729 |
|---|
7/18 | $9,430,918 | $7,320,750 | $8,132,667 |
|---|
8/18 | $10,270,551 | $7,573,004 | $8,577,332 |
|---|
9/18 | $10,187,553 | $7,601,761 | $8,625,271 |
|---|
10/18 | $9,125,947 | $7,063,835 | $7,853,939 |
|---|
11/18 | $9,235,968 | $7,207,588 | $7,937,361 |
|---|
12/18 | $8,525,502 | $6,551,143 | $7,254,926 |
|---|
1/19 | $9,561,784 | $7,100,150 | $7,907,044 |
|---|
2/19 | $10,046,464 | $7,340,551 | $8,189,956 |
|---|
3/19 | $10,186,393 | $7,468,346 | $8,423,067 |
|---|
4/19 | $10,589,955 | $7,769,949 | $8,803,620 |
|---|
5/19 | $10,218,840 | $7,274,815 | $8,247,465 |
|---|
6/19 | $10,926,595 | $7,785,537 | $8,813,873 |
|---|
7/19 | $11,003,657 | $7,906,445 | $9,012,899 |
|---|
8/19 | $10,484,502 | $7,761,634 | $8,943,871 |
|---|
9/19 | $9,748,356 | $7,896,170 | $8,944,981 |
|---|
10/19 | $9,760,523 | $8,063,518 | $9,197,155 |
|---|
11/19 | $10,604,151 | $8,368,250 | $9,605,169 |
|---|
12/19 | $10,508,703 | $8,609,914 | $9,894,968 |
|---|
1/20 | $11,165,356 | $8,619,207 | $10,116,171 |
|---|
2/20 | $11,129,375 | $7,914,870 | $9,427,242 |
|---|
3/20 | $10,108,414 | $6,868,924 | $8,499,832 |
|---|
4/20 | $12,186,317 | $7,776,603 | $9,757,562 |
|---|
5/20 | $14,448,623 | $8,186,908 | $10,412,628 |
|---|
6/20 | $16,007,050 | $8,367,951 | $10,866,045 |
|---|
7/20 | $17,677,918 | $8,857,945 | $11,702,069 |
|---|
8/20 | $19,189,121 | $9,508,092 | $12,909,631 |
|---|
9/20 | $19,458,978 | $9,160,592 | $12,302,233 |
|---|
10/20 | $18,694,382 | $8,939,687 | $11,884,426 |
|---|
11/20 | $22,274,492 | $9,992,399 | $13,101,294 |
|---|
12/20 | $22,673,960 | $10,414,834 | $13,703,838 |
|---|
1/21 | $23,002,710 | $10,329,058 | $13,602,445 |
|---|
2/21 | $24,253,924 | $10,628,399 | $13,599,297 |
|---|
3/21 | $22,271,609 | $11,030,613 | $13,832,936 |
|---|
4/21 | $23,478,662 | $11,624,398 | $14,774,110 |
|---|
5/21 | $22,850,602 | $11,679,579 | $14,569,764 |
|---|
6/21 | $25,630,259 | $11,972,237 | $15,483,839 |
|---|
7/21 | $25,620,446 | $12,220,945 | $15,994,129 |
|---|
8/21 | $26,189,626 | $12,574,648 | $16,592,132 |
|---|
9/21 | $24,531,154 | $11,997,043 | $15,662,876 |
|---|
10/21 | $26,422,695 | $12,829,485 | $17,019,524 |
|---|
11/21 | $25,551,752 | $12,657,384 | $17,123,583 |
|---|
12/21 | $22,789,401 | $13,170,077 | $17,485,623 |
|---|
1/22 | $17,739,545 | $12,427,544 | $15,984,918 |
|---|
2/22 | $17,567,082 | $12,086,515 | $15,305,983 |
|---|
3/22 | $16,707,790 | $12,494,378 | $15,904,717 |
|---|
4/22 | $13,004,361 | $11,380,623 | $13,984,036 |
|---|
5/22 | $10,822,847 | $11,363,324 | $13,658,941 |
|---|
6/22 | $9,827,400 | $10,411,645 | $12,576,997 |
|---|
7/22 | $11,155,672 | $11,381,381 | $14,086,502 |
|---|
8/22 | $11,306,956 | $10,944,378 | $13,430,296 |
|---|
9/22 | $10,160,224 | $9,931,723 | $12,124,660 |
|---|
10/22 | $10,420,432 | $10,728,249 | $12,833,328 |
|---|
11/22 | $10,136,019 | $11,308,622 | $13,418,104 |
|---|
12/22 | $9,051,606 | $10,651,046 | $12,390,859 |
|---|
1/23 | $10,665,728 | $11,365,143 | $13,423,605 |
|---|
2/23 | $10,230,889 | $11,094,703 | $13,264,182 |
|---|
3/23 | $10,644,855 | $11,445,664 | $14,170,870 |
|---|
4/23 | $9,990,858 | $11,587,488 | $14,310,682 |
|---|
5/23 | $11,006,641 | $11,641,458 | $14,962,938 |
|---|
6/23 | $11,984,159 | $12,427,697 | $15,986,187 |
|---|
7/23 | $13,045,166 | $12,855,064 | $16,524,758 |
|---|
8/23 | $11,838,053 | $12,630,191 | $16,376,384 |
|---|
9/23 | $11,239,715 | $12,036,620 | $15,485,773 |
|---|
10/23 | $10,258,718 | $11,745,705 | $15,265,294 |
|---|
11/23 | $12,109,393 | $12,842,699 | $16,929,379 |
|---|
12/23 | $13,605,238 | $13,476,689 | $17,679,045 |
|---|
1/24 | $12,815,571 | $13,664,634 | $18,119,989 |
|---|
2/24 | $14,328,810 | $14,402,543 | $19,356,262 |
|---|
3/24 | $14,627,979 | $14,864,248 | $19,697,014 |
|---|
4/24 | $13,243,452 | $14,231,740 | $18,861,550 |
|---|
5/24 | $12,989,506 | $14,901,908 | $19,990,700 |
|---|
6/24 | $13,646,983 | $15,395,115 | $21,338,705 |
|---|
7/24 | $13,803,525 | $15,619,158 | $20,975,724 |
|---|
8/24 | $14,711,468 | $15,989,384 | $21,412,605 |
|---|
9/24 | $15,602,018 | $16,331,266 | $22,019,235 |
|---|
10/24 | $16,763,908 | $16,217,156 | $21,946,368 |
|---|
11/24 | $20,774,861 | $17,261,200 | $23,369,819 |
|---|
12/24 | $19,966,626 | $16,779,963 | $23,576,108 |
|---|
|
|
| Average Annual Return [Table Text Block] |
AATR | 1 Year | 5 Years | 10 Years |
|---|
Class R6 | 46.76% | 13.70% | 14.85% |
|---|
Russell 1000® Index | 24.51% | 14.28% | 12.87% |
|---|
Russell 1000® Growth Index | 33.36% | 18.96% | 16.78% |
|---|
|
|
| AssetsNet |
$ 4,190,946,959
|
|
| Holdings Count | Holding |
33
|
|
| Advisory Fees Paid, Amount |
$ 17,778,316
|
|
| InvestmentCompanyPortfolioTurnover |
39.00%
|
|
| Additional Fund Statistics [Text Block] |
Total Net Assets | $4,190,946,959 |
|---|
# of Portfolio Holdings | 33 |
|---|
Portfolio Turnover Rate | 39% |
|---|
Total Advisory Fees Paid | $17,778,316 |
|---|
|
|
| Holdings [Text Block] |
Sector Allocation (% of total investments)Value | Value |
|---|
Short-Term Investments | 2.8% | Investment Company | 2.9% | Health Care | 4.7% | Financials | 9.7% | Communication Services | 11.3% | Consumer Discretionary | 33.3% | Information Technology | 35.3% |
Top Ten Holdings (% of total investments)Footnote ReferenceaTesla, Inc. | 9.1% | Cloudflare, Inc. | 8.8% | DoorDash, Inc. | 6.7% | Shopify, Inc. | 6.4% | Trade Desk, Inc. | 6.2% | Affirm Holdings, Inc. | 6.2% | ROBLOX Corp. | 5.1% | MercadoLibre, Inc. | 4.9% | Samsara, Inc. | 4.8% | Carvana Co. | 4.6% | Total | 62.8% |
| Footnote | Description | Footnotea | Excluding cash equivalents. |
|
|
| Material Fund Change [Text Block] |
|
|
| Updated Prospectus Web Address |
<span style="box-sizing: border-box; color: rgb(0, 0, 0); display: inline; flex-wrap: nowrap; font-size: 10.6667px; font-weight: 400; grid-area: auto; line-height: 16px; margin: 0px; overflow: visible; text-align: left;">www.morganstanley.com/im/shareholderreports</span>
|
|
| C000007745 |
|
|
| Shareholder Report [Line Items] |
|
|
| Fund Name |
Morgan Stanley Institutional Fund, Inc. - Inception Portfolio
|
|
| Class Name |
Class A
|
|
| Trading Symbol |
MSSMX
|
|
| Annual or Semi-Annual Statement [Text Block] |
This annual shareholder report contains important information about Morgan Stanley Institutional Fund, Inc. - Inception Portfolio for the period of January 1, 2024 to December 31, 2024.
|
|
| Shareholder Report Annual or Semi-Annual |
Annual Shareholder Report
|
|
| Additional Information [Text Block] |
You can find additional information about the Fund at www.morganstanley.com/im/shareholderreports. You can also request this information by contacting us at 1-800-869-6397.
|
|
| Additional Information Phone Number |
1-800-869-6397
|
|
| Additional Information Website |
<span style="box-sizing: border-box; color: rgb(0, 0, 0); display: inline; flex-wrap: nowrap; font-size: 10.6667px; font-weight: 400; grid-area: auto; line-height: 16px; margin: 0px; overflow: visible; text-align: left;">www.morganstanley.com/im/shareholderreports</span>
|
|
| Expenses [Text Block] |
What were the Fund costs for the last year?(based on a hypothetical $10,000 investment) Class Name | Costs of a $10,000 investment | Costs paid as a percentage of a $10,000 investment |
|---|
Class A | $147 | 1.28% |
|---|
|
|
| Expenses Paid, Amount |
$ 147
|
|
| Expense Ratio, Percent |
1.28%
|
|
| Factors Affecting Performance [Text Block] |
How did the Fund perform last year and what affected its performance?Key contributors to (↑) and detractors from (↓) performance, relative to the Russell 2000® Growth Index: ↑ Stock selection and average overweight in information technology, led by a position in an enterprise analytics platform and Bitcoin developing company ↑ Stock selection in consumer discretionary, led by a position in a leading seller of used cars online in the United States ↑ Average underweight in health care, which was one of the weaker performing sectors in the period ↓ Stock selection in health care, where a position in an underperforming health care services provider was the largest detractor in the portfolio ↓ Stock selection in communication services, due to a holding in a financial services advertising platform that underperformed ↓ Average underweight in industrials, a sector that outperformed the index |
|
| Line Graph [Table Text Block] |
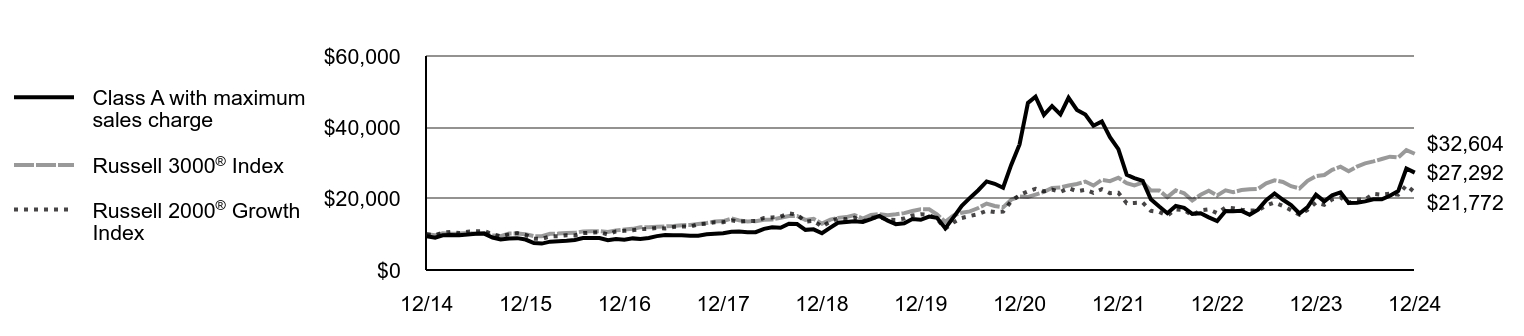 | Class A with maximum sales charge | Russell 3000® Index | Russell 2000® Growth Index |
|---|
12/14 | $9,472 | $10,000 | $10,000 |
|---|
1/15 | $9,034 | $9,722 | $9,772 |
|---|
2/15 | $9,714 | $10,285 | $10,475 |
|---|
3/15 | $9,847 | $10,180 | $10,663 |
|---|
4/15 | $9,752 | $10,226 | $10,349 |
|---|
5/15 | $9,924 | $10,368 | $10,730 |
|---|
6/15 | $10,165 | $10,194 | $10,874 |
|---|
7/15 | $10,210 | $10,365 | $10,918 |
|---|
8/15 | $9,116 | $9,739 | $10,091 |
|---|
9/15 | $8,581 | $9,455 | $9,453 |
|---|
10/15 | $8,829 | $10,202 | $9,990 |
|---|
11/15 | $8,931 | $10,258 | $10,356 |
|---|
12/15 | $8,536 | $10,048 | $9,862 |
|---|
1/16 | $7,554 | $9,481 | $8,793 |
|---|
2/16 | $7,407 | $9,478 | $8,731 |
|---|
3/16 | $7,944 | $10,145 | $9,400 |
|---|
4/16 | $8,062 | $10,208 | $9,494 |
|---|
5/16 | $8,188 | $10,391 | $9,750 |
|---|
6/16 | $8,397 | $10,412 | $9,705 |
|---|
7/16 | $8,971 | $10,825 | $10,339 |
|---|
8/16 | $8,999 | $10,853 | $10,449 |
|---|
9/16 | $8,956 | $10,870 | $10,600 |
|---|
10/16 | $8,331 | $10,635 | $9,941 |
|---|
11/16 | $8,658 | $11,111 | $10,830 |
|---|
12/16 | $8,474 | $11,327 | $10,978 |
|---|
1/17 | $8,864 | $11,541 | $11,156 |
|---|
2/17 | $8,676 | $11,970 | $11,430 |
|---|
3/17 | $8,995 | $11,978 | $11,565 |
|---|
4/17 | $9,493 | $12,105 | $11,778 |
|---|
5/17 | $9,826 | $12,229 | $11,671 |
|---|
6/17 | $9,754 | $12,339 | $12,073 |
|---|
7/17 | $9,732 | $12,572 | $12,176 |
|---|
8/17 | $9,595 | $12,596 | $12,161 |
|---|
9/17 | $9,627 | $12,903 | $12,823 |
|---|
10/17 | $10,024 | $13,185 | $13,022 |
|---|
11/17 | $10,145 | $13,585 | $13,396 |
|---|
12/17 | $10,302 | $13,721 | $13,411 |
|---|
1/18 | $10,692 | $14,444 | $13,934 |
|---|
2/18 | $10,795 | $13,912 | $13,538 |
|---|
3/18 | $10,577 | $13,633 | $13,720 |
|---|
4/18 | $10,612 | $13,684 | $13,733 |
|---|
5/18 | $11,540 | $14,071 | $14,598 |
|---|
6/18 | $11,964 | $14,163 | $14,712 |
|---|
7/18 | $11,861 | $14,633 | $14,965 |
|---|
8/18 | $12,984 | $15,147 | $15,897 |
|---|
9/18 | $12,892 | $15,172 | $15,525 |
|---|
10/18 | $11,253 | $14,055 | $13,560 |
|---|
11/18 | $11,402 | $14,336 | $13,772 |
|---|
12/18 | $10,304 | $13,002 | $12,163 |
|---|
1/19 | $11,861 | $14,118 | $13,568 |
|---|
2/19 | $13,229 | $14,614 | $14,444 |
|---|
3/19 | $13,444 | $14,828 | $14,248 |
|---|
4/19 | $13,699 | $15,420 | $14,682 |
|---|
5/19 | $13,471 | $14,422 | $13,593 |
|---|
6/19 | $14,262 | $15,435 | $14,640 |
|---|
7/19 | $15,161 | $15,664 | $14,783 |
|---|
8/19 | $13,846 | $15,345 | $14,145 |
|---|
9/19 | $12,840 | $15,614 | $14,029 |
|---|
10/19 | $13,095 | $15,950 | $14,428 |
|---|
11/19 | $14,289 | $16,557 | $15,278 |
|---|
12/19 | $14,087 | $17,035 | $15,628 |
|---|
1/20 | $14,981 | $17,016 | $15,456 |
|---|
2/20 | $14,633 | $15,623 | $14,340 |
|---|
3/20 | $11,687 | $13,475 | $11,601 |
|---|
4/20 | $14,749 | $15,259 | $13,329 |
|---|
5/20 | $17,977 | $16,075 | $14,589 |
|---|
6/20 | $20,212 | $16,443 | $15,149 |
|---|
7/20 | $22,364 | $17,376 | $15,670 |
|---|
8/20 | $24,830 | $18,635 | $16,589 |
|---|
9/20 | $24,168 | $17,957 | $16,234 |
|---|
10/20 | $23,059 | $17,569 | $16,357 |
|---|
11/20 | $29,465 | $19,707 | $19,241 |
|---|
12/20 | $35,198 | $20,593 | $21,040 |
|---|
1/21 | $46,843 | $20,501 | $22,054 |
|---|
2/21 | $48,595 | $21,142 | $22,782 |
|---|
3/21 | $43,489 | $21,900 | $22,066 |
|---|
4/21 | $45,976 | $23,029 | $22,547 |
|---|
5/21 | $43,621 | $23,134 | $21,903 |
|---|
6/21 | $48,294 | $23,705 | $22,930 |
|---|
7/21 | $44,883 | $24,105 | $22,095 |
|---|
8/21 | $43,564 | $24,793 | $22,496 |
|---|
9/21 | $40,455 | $23,681 | $21,634 |
|---|
10/21 | $41,661 | $25,282 | $22,647 |
|---|
11/21 | $37,233 | $24,897 | $21,541 |
|---|
12/21 | $33,896 | $25,877 | $21,636 |
|---|
1/22 | $26,680 | $24,355 | $18,736 |
|---|
2/22 | $25,756 | $23,741 | $18,818 |
|---|
3/22 | $24,986 | $24,512 | $18,904 |
|---|
4/22 | $19,850 | $22,312 | $16,585 |
|---|
5/22 | $17,796 | $22,282 | $16,272 |
|---|
6/22 | $15,921 | $20,418 | $15,264 |
|---|
7/22 | $17,975 | $22,333 | $16,973 |
|---|
8/22 | $17,410 | $21,500 | $16,814 |
|---|
9/22 | $15,741 | $19,506 | $15,301 |
|---|
10/22 | $15,921 | $21,106 | $16,754 |
|---|
11/22 | $14,765 | $22,208 | $17,026 |
|---|
12/22 | $13,704 | $20,907 | $15,933 |
|---|
1/23 | $16,558 | $22,347 | $17,518 |
|---|
2/23 | $16,455 | $21,825 | $17,329 |
|---|
3/23 | $16,584 | $22,408 | $16,901 |
|---|
4/23 | $15,478 | $22,647 | $16,705 |
|---|
5/23 | $16,918 | $22,735 | $16,708 |
|---|
6/23 | $19,566 | $24,288 | $18,093 |
|---|
7/23 | $21,469 | $25,158 | $18,939 |
|---|
8/23 | $19,695 | $24,673 | $17,953 |
|---|
9/23 | $18,203 | $23,497 | $16,769 |
|---|
10/23 | $15,838 | $22,875 | $15,476 |
|---|
11/23 | $17,638 | $25,008 | $16,885 |
|---|
12/23 | $21,134 | $26,334 | $18,906 |
|---|
1/24 | $19,232 | $26,626 | $18,300 |
|---|
2/24 | $20,954 | $28,067 | $19,787 |
|---|
3/24 | $21,751 | $28,973 | $20,340 |
|---|
4/24 | $18,820 | $27,698 | $18,774 |
|---|
5/24 | $18,846 | $29,006 | $19,779 |
|---|
6/24 | $19,232 | $29,904 | $19,746 |
|---|
7/24 | $19,849 | $30,460 | $21,363 |
|---|
8/24 | $19,823 | $31,123 | $21,126 |
|---|
9/24 | $20,826 | $31,767 | $21,407 |
|---|
10/24 | $22,189 | $31,534 | $21,123 |
|---|
11/24 | $28,462 | $33,632 | $23,713 |
|---|
12/24 | $27,292 | $32,604 | $21,772 |
|---|
|
|
| Average Annual Return [Table Text Block] |
AATR | 1 Year | 5 Years | 10 Years |
|---|
Class A | 29.14% | 14.14% | 11.16% |
|---|
Class A, with 5.25% maximum front end sales charge | 22.29% | 12.92% | 10.56% |
|---|
Russell 3000® Index | 23.81% | 13.86% | 12.55% |
|---|
Russell 2000® Growth Index | 15.15% | 6.86% | 8.09% |
|---|
|
|
| AssetsNet |
$ 383,113,019
|
|
| Holdings Count | Holding |
55
|
|
| Advisory Fees Paid, Amount |
$ 2,623,653
|
|
| InvestmentCompanyPortfolioTurnover |
100.00%
|
|
| Additional Fund Statistics [Text Block] |
Total Net Assets | $383,113,019 |
|---|
# of Portfolio Holdings | 55 |
|---|
Portfolio Turnover Rate | 100% |
|---|
Total Advisory Fees Paid | $2,623,653 |
|---|
|
|
| Holdings [Text Block] |
Sector Allocation (% of total investments)Value | Value |
|---|
Materials | 0.2% | Real Estate | 1.2% | Industrials | 3.0% | Investment Companies | 3.1% | Communication Services | 6.8% | Financials | 6.8% | Short-Term Investments | 7.4% | Consumer Staples | 8.1% | Health Care | 16.1% | Consumer Discretionary | 20.4% | Information Technology | 26.9% |
Top Ten Holdings (% of total investments)Footnote ReferenceaGlobal-e Online Ltd. | 8.2% | Peloton Interactive, Inc. | 7.9% | Cloudflare, Inc. | 7.3% | Affirm Holdings, Inc. | 5.8% | Roivant Sciences Ltd. | 4.8% | ZoomInfo Technologies, Inc. | 4.8% | Bill Holdings, Inc. | 4.7% | IonQ, Inc. | 4.7% | Oddity Tech Ltd. | 4.6% | Aurora Innovation, Inc. | 4.3% | Total | 57.1% |
| Footnote | Description | Footnotea | Excluding cash equivalents. |
|
|
| Material Fund Change [Text Block] |
|
|
| Updated Prospectus Web Address |
<span style="box-sizing: border-box; color: rgb(0, 0, 0); display: inline; flex-wrap: nowrap; font-size: 10.6667px; font-weight: 400; grid-area: auto; line-height: 16px; margin: 0px; overflow: visible; text-align: left;">www.morganstanley.com/im/shareholderreports</span>
|
|
| C000155889 |
|
|
| Shareholder Report [Line Items] |
|
|
| Fund Name |
Morgan Stanley Institutional Fund, Inc. - Inception Portfolio
|
|
| Class Name |
Class C
|
|
| Trading Symbol |
MSCOX
|
|
| Annual or Semi-Annual Statement [Text Block] |
This annual shareholder report contains important information about Morgan Stanley Institutional Fund, Inc. - Inception Portfolio for the period of January 1, 2024 to December 31, 2024.
|
|
| Shareholder Report Annual or Semi-Annual |
Annual Shareholder Report
|
|
| Additional Information [Text Block] |
You can find additional information about the Fund at www.morganstanley.com/im/shareholderreports. You can also request this information by contacting us at 1-800-869-6397.
|
|
| Additional Information Phone Number |
1-800-869-6397
|
|
| Additional Information Website |
<span style="box-sizing: border-box; color: rgb(0, 0, 0); display: inline; flex-wrap: nowrap; font-size: 10.6667px; font-weight: 400; grid-area: auto; line-height: 16px; margin: 0px; overflow: visible; text-align: left;">www.morganstanley.com/im/shareholderreports</span>
|
|
| Expenses [Text Block] |
What were the Fund costs for the last year?(based on a hypothetical $10,000 investment) Class Name | Costs of a $10,000 investment | Costs paid as a percentage of a $10,000 investment |
|---|
Class C | $238 | 2.09% |
|---|
|
|
| Expenses Paid, Amount |
$ 238
|
|
| Expense Ratio, Percent |
2.09%
|
|
| Factors Affecting Performance [Text Block] |
How did the Fund perform last year and what affected its performance?Key contributors to (↑) and detractors from (↓) performance, relative to the Russell 2000® Growth Index: ↑ Stock selection and average overweight in information technology, led by a position in an enterprise analytics platform and Bitcoin developing company ↑ Stock selection in consumer discretionary, led by a position in a leading seller of used cars online in the United States ↑ Average underweight in health care, which was one of the weaker performing sectors in the period ↓ Stock selection in health care, where a position in an underperforming health care services provider was the largest detractor in the portfolio ↓ Stock selection in communication services, due to a holding in a financial services advertising platform that underperformed ↓ Average underweight in industrials, a sector that outperformed the index |
|
| Line Graph [Table Text Block] |
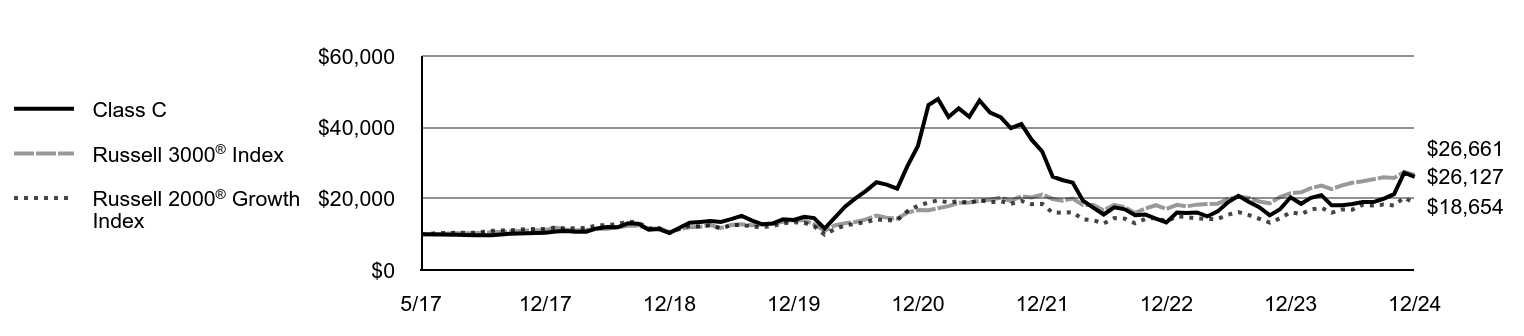 | Class C | Russell 3000® Index | Russell 2000® Growth Index |
|---|
5/17 | $10,000 | $10,000 | $10,000 |
|---|
6/17 | $9,919 | $10,090 | $10,344 |
|---|
7/17 | $9,889 | $10,280 | $10,432 |
|---|
8/17 | $9,741 | $10,300 | $10,420 |
|---|
9/17 | $9,765 | $10,552 | $10,987 |
|---|
10/17 | $10,169 | $10,782 | $11,158 |
|---|
11/17 | $10,285 | $11,109 | $11,478 |
|---|
12/17 | $10,436 | $11,220 | $11,491 |
|---|
1/18 | $10,822 | $11,812 | $11,939 |
|---|
2/18 | $10,915 | $11,376 | $11,599 |
|---|
3/18 | $10,705 | $11,148 | $11,755 |
|---|
4/18 | $10,728 | $11,190 | $11,767 |
|---|
5/18 | $11,663 | $11,506 | $12,508 |
|---|
6/18 | $12,072 | $11,581 | $12,606 |
|---|
7/18 | $11,967 | $11,966 | $12,822 |
|---|
8/18 | $13,089 | $12,386 | $13,621 |
|---|
9/18 | $12,984 | $12,406 | $13,302 |
|---|
10/18 | $11,324 | $11,493 | $11,619 |
|---|
11/18 | $11,465 | $11,723 | $11,800 |
|---|
12/18 | $10,355 | $10,632 | $10,422 |
|---|
1/19 | $11,905 | $11,545 | $11,625 |
|---|
2/19 | $13,276 | $11,951 | $12,376 |
|---|
3/19 | $13,482 | $12,125 | $12,208 |
|---|
4/19 | $13,729 | $12,609 | $12,580 |
|---|
5/19 | $13,482 | $11,793 | $11,647 |
|---|
6/19 | $14,264 | $12,622 | $12,544 |
|---|
7/19 | $15,155 | $12,809 | $12,666 |
|---|
8/19 | $13,839 | $12,548 | $12,120 |
|---|
9/19 | $12,824 | $12,768 | $12,020 |
|---|
10/19 | $13,057 | $13,043 | $12,362 |
|---|
11/19 | $14,250 | $13,539 | $13,090 |
|---|
12/19 | $14,029 | $13,930 | $13,390 |
|---|
1/20 | $14,914 | $13,915 | $13,243 |
|---|
2/20 | $14,556 | $12,776 | $12,287 |
|---|
3/20 | $11,628 | $11,019 | $9,940 |
|---|
4/20 | $14,659 | $12,478 | $11,421 |
|---|
5/20 | $17,842 | $13,145 | $12,500 |
|---|
6/20 | $20,055 | $13,446 | $12,980 |
|---|
7/20 | $22,184 | $14,209 | $13,426 |
|---|
8/20 | $24,601 | $15,239 | $14,214 |
|---|
9/20 | $23,937 | $14,684 | $13,909 |
|---|
10/20 | $22,814 | $14,367 | $14,015 |
|---|
11/20 | $29,130 | $16,115 | $16,486 |
|---|
12/20 | $34,786 | $16,840 | $18,027 |
|---|
1/21 | $46,265 | $16,765 | $18,896 |
|---|
2/21 | $47,960 | $17,289 | $19,520 |
|---|
3/21 | $42,893 | $17,908 | $18,906 |
|---|
4/21 | $45,329 | $18,832 | $19,318 |
|---|
5/21 | $42,971 | $18,918 | $18,767 |
|---|
6/21 | $47,531 | $19,384 | $19,647 |
|---|
7/21 | $44,160 | $19,712 | $18,931 |
|---|
8/21 | $42,835 | $20,274 | $19,275 |
|---|
9/21 | $39,756 | $19,364 | $18,536 |
|---|
10/21 | $40,925 | $20,674 | $19,404 |
|---|
11/21 | $36,540 | $20,359 | $18,457 |
|---|
12/21 | $33,265 | $21,161 | $18,538 |
|---|
1/22 | $26,158 | $19,916 | $16,054 |
|---|
2/22 | $25,239 | $19,414 | $16,124 |
|---|
3/22 | $24,483 | $20,044 | $16,197 |
|---|
4/22 | $19,429 | $18,245 | $14,210 |
|---|
5/22 | $17,403 | $18,221 | $13,942 |
|---|
6/22 | $15,565 | $16,696 | $13,079 |
|---|
7/22 | $17,565 | $18,263 | $14,543 |
|---|
8/22 | $16,997 | $17,581 | $14,406 |
|---|
9/22 | $15,349 | $15,951 | $13,110 |
|---|
10/22 | $15,538 | $17,259 | $14,355 |
|---|
11/22 | $14,403 | $18,160 | $14,589 |
|---|
12/22 | $13,340 | $17,097 | $13,652 |
|---|
1/23 | $16,100 | $18,274 | $15,010 |
|---|
2/23 | $15,992 | $17,847 | $14,848 |
|---|
3/23 | $16,127 | $18,324 | $14,481 |
|---|
4/23 | $15,018 | $18,519 | $14,313 |
|---|
5/23 | $16,425 | $18,591 | $14,315 |
|---|
6/23 | $18,968 | $19,861 | $15,502 |
|---|
7/23 | $20,809 | $20,573 | $16,227 |
|---|
8/23 | $19,077 | $20,176 | $15,383 |
|---|
9/23 | $17,616 | $19,215 | $14,368 |
|---|
10/23 | $15,315 | $18,705 | $13,260 |
|---|
11/23 | $17,047 | $20,450 | $14,467 |
|---|
12/23 | $20,403 | $21,534 | $16,199 |
|---|
1/24 | $18,563 | $21,773 | $15,680 |
|---|
2/24 | $20,213 | $22,952 | $16,953 |
|---|
3/24 | $20,971 | $23,692 | $17,428 |
|---|
4/24 | $18,130 | $22,649 | $16,086 |
|---|
5/24 | $18,157 | $23,720 | $16,947 |
|---|
6/24 | $18,508 | $24,454 | $16,919 |
|---|
7/24 | $19,077 | $24,908 | $18,304 |
|---|
8/24 | $19,050 | $25,451 | $18,101 |
|---|
9/24 | $19,970 | $25,977 | $18,342 |
|---|
10/24 | $21,269 | $25,786 | $18,098 |
|---|
11/24 | $27,276 | $27,502 | $20,318 |
|---|
12/24 | $26,127 | $26,661 | $18,654 |
|---|
|
|
| Average Annual Return [Table Text Block] |
AATR | 1 Year | 5 Years | Since 5/31/17
(Inception) |
|---|
Class C | 28.06% | 13.24% | 13.50% |
|---|
Class C, with 1% maximum contingent deferred sales charge | 27.06% | 13.24% | 13.50% |
|---|
Russell 3000® Index | 23.81% | 13.86% | 13.80% |
|---|
Russell 2000® Growth Index | 15.15% | 6.86% | 8.57% |
|---|
|
|
| Performance Inception Date |
May 31, 2017
|
|
| AssetsNet |
$ 383,113,019
|
|
| Holdings Count | Holding |
55
|
|
| Advisory Fees Paid, Amount |
$ 2,623,653
|
|
| InvestmentCompanyPortfolioTurnover |
100.00%
|
|
| Additional Fund Statistics [Text Block] |
Total Net Assets | $383,113,019 |
|---|
# of Portfolio Holdings | 55 |
|---|
Portfolio Turnover Rate | 100% |
|---|
Total Advisory Fees Paid | $2,623,653 |
|---|
|
|
| Holdings [Text Block] |
Sector Allocation (% of total investments)Value | Value |
|---|
Materials | 0.2% | Real Estate | 1.2% | Industrials | 3.0% | Investment Companies | 3.1% | Communication Services | 6.8% | Financials | 6.8% | Short-Term Investments | 7.4% | Consumer Staples | 8.1% | Health Care | 16.1% | Consumer Discretionary | 20.4% | Information Technology | 26.9% |
Top Ten Holdings (% of total investments)Footnote ReferenceaGlobal-e Online Ltd. | 8.2% | Peloton Interactive, Inc. | 7.9% | Cloudflare, Inc. | 7.3% | Affirm Holdings, Inc. | 5.8% | Roivant Sciences Ltd. | 4.8% | ZoomInfo Technologies, Inc. | 4.8% | Bill Holdings, Inc. | 4.7% | IonQ, Inc. | 4.7% | Oddity Tech Ltd. | 4.6% | Aurora Innovation, Inc. | 4.3% | Total | 57.1% |
| Footnote | Description | Footnotea | Excluding cash equivalents. |
|
|
| Material Fund Change [Text Block] |
|
|
| Updated Prospectus Web Address |
<span style="box-sizing: border-box; color: rgb(0, 0, 0); display: inline; flex-wrap: nowrap; font-size: 10.6667px; font-weight: 400; grid-area: auto; line-height: 16px; margin: 0px; overflow: visible; text-align: left;">www.morganstanley.com/im/shareholderreports</span>
|
|
| C000007744 |
|
|
| Shareholder Report [Line Items] |
|
|
| Fund Name |
Morgan Stanley Institutional Fund, Inc. - Inception Portfolio
|
|
| Class Name |
Class I
|
|
| Trading Symbol |
MSSGX
|
|
| Annual or Semi-Annual Statement [Text Block] |
This annual shareholder report contains important information about Morgan Stanley Institutional Fund, Inc. - Inception Portfolio for the period of January 1, 2024 to December 31, 2024.
|
|
| Shareholder Report Annual or Semi-Annual |
Annual Shareholder Report
|
|
| Additional Information [Text Block] |
You can find additional information about the Fund at www.morganstanley.com/im/shareholderreports. You can also request this information by contacting us at 1-800-869-6397.
|
|
| Additional Information Phone Number |
1-800-869-6397
|
|
| Additional Information Website |
<span style="box-sizing: border-box; color: rgb(0, 0, 0); display: inline; flex-wrap: nowrap; font-size: 10.6667px; font-weight: 400; grid-area: auto; line-height: 16px; margin: 0px; overflow: visible; text-align: left;">www.morganstanley.com/im/shareholderreports</span>
|
|
| Expenses [Text Block] |
What were the Fund costs for the last year?(based on a hypothetical $10,000 investment) Class Name | Costs of a $10,000 investment | Costs paid as a percentage of a $10,000 investment |
|---|
Class I | $108 | 0.94% |
|---|
|
|
| Expenses Paid, Amount |
$ 108
|
|
| Expense Ratio, Percent |
0.94%
|
|
| Factors Affecting Performance [Text Block] |
How did the Fund perform last year and what affected its performance?Key contributors to (↑) and detractors from (↓) performance, relative to the Russell 2000® Growth Index: ↑ Stock selection and average overweight in information technology, led by a position in an enterprise analytics platform and Bitcoin developing company ↑ Stock selection in consumer discretionary, led by a position in a leading seller of used cars online in the United States ↑ Average underweight in health care, which was one of the weaker performing sectors in the period ↓ Stock selection in health care, where a position in an underperforming health care services provider was the largest detractor in the portfolio ↓ Stock selection in communication services, due to a holding in a financial services advertising platform that underperformed ↓ Average underweight in industrials, a sector that outperformed the index |
|
| Line Graph [Table Text Block] |
 | Class I | Russell 3000® Index | Russell 2000® Growth Index |
|---|
12/14 | $1,000,000 | $1,000,000 | $1,000,000 |
|---|
1/15 | $954,573 | $972,168 | $977,170 |
|---|
2/15 | $1,026,045 | $1,028,458 | $1,047,493 |
|---|
3/15 | $1,040,581 | $1,018,003 | $1,066,298 |
|---|
4/15 | $1,030,285 | $1,022,607 | $1,034,930 |
|---|
5/15 | $1,049,061 | $1,036,751 | $1,072,954 |
|---|
6/15 | $1,075,106 | $1,019,406 | $1,087,378 |
|---|
7/15 | $1,080,008 | $1,036,456 | $1,091,817 |
|---|
8/15 | $964,791 | $973,886 | $1,009,079 |
|---|
9/15 | $908,396 | $945,507 | $945,349 |
|---|
10/15 | $934,471 | $1,020,188 | $998,972 |
|---|
11/15 | $945,386 | $1,025,843 | $1,035,579 |
|---|
12/15 | $904,156 | $1,004,788 | $986,183 |
|---|
1/16 | $800,260 | $948,092 | $879,331 |
|---|
2/16 | $785,136 | $947,787 | $873,115 |
|---|
3/16 | $842,345 | $1,014,517 | $940,001 |
|---|
4/16 | $854,839 | $1,020,804 | $949,374 |
|---|
5/16 | $867,990 | $1,039,067 | $974,951 |
|---|
6/16 | $890,347 | $1,041,203 | $970,466 |
|---|
7/16 | $951,738 | $1,082,526 | $1,033,923 |
|---|
8/16 | $955,083 | $1,085,287 | $1,044,914 |
|---|
9/16 | $951,070 | $1,086,993 | $1,059,959 |
|---|
10/16 | $884,856 | $1,063,475 | $994,088 |
|---|
11/16 | $920,304 | $1,111,068 | $1,083,028 |
|---|
12/16 | $900,968 | $1,132,748 | $1,097,801 |
|---|
1/17 | $942,416 | $1,154,069 | $1,115,625 |
|---|
2/17 | $922,032 | $1,196,991 | $1,142,981 |
|---|
3/17 | $956,684 | $1,197,805 | $1,156,520 |
|---|
4/17 | $1,009,683 | $1,210,501 | $1,177,819 |
|---|
5/17 | $1,045,694 | $1,222,890 | $1,167,107 |
|---|
6/17 | $1,038,220 | $1,233,926 | $1,207,277 |
|---|
7/17 | $1,036,185 | $1,257,191 | $1,217,553 |
|---|
8/17 | $1,021,929 | $1,259,613 | $1,216,131 |
|---|
9/17 | $1,025,680 | $1,290,333 | $1,282,350 |
|---|
10/17 | $1,068,448 | $1,318,490 | $1,302,217 |
|---|
11/17 | $1,081,204 | $1,358,527 | $1,339,604 |
|---|
12/17 | $1,097,986 | $1,372,105 | $1,341,147 |
|---|
1/18 | $1,140,294 | $1,444,429 | $1,393,427 |
|---|
2/18 | $1,151,374 | $1,391,188 | $1,353,754 |
|---|
3/18 | $1,129,213 | $1,363,261 | $1,371,984 |
|---|
4/18 | $1,132,235 | $1,368,443 | $1,373,327 |
|---|
5/18 | $1,231,960 | $1,407,074 | $1,459,793 |
|---|
6/18 | $1,276,283 | $1,416,276 | $1,471,215 |
|---|
7/18 | $1,267,217 | $1,463,277 | $1,496,508 |
|---|
8/18 | $1,387,089 | $1,514,664 | $1,589,677 |
|---|
9/18 | $1,377,015 | $1,517,171 | $1,552,473 |
|---|
10/18 | $1,202,748 | $1,405,458 | $1,356,029 |
|---|
11/18 | $1,217,858 | $1,433,607 | $1,377,242 |
|---|
12/18 | $1,101,159 | $1,300,182 | $1,216,313 |
|---|
1/19 | $1,268,279 | $1,411,782 | $1,356,777 |
|---|
2/19 | $1,414,795 | $1,461,433 | $1,444,396 |
|---|
3/19 | $1,437,688 | $1,482,773 | $1,424,848 |
|---|
4/19 | $1,465,160 | $1,541,983 | $1,468,238 |
|---|
5/19 | $1,441,122 | $1,442,198 | $1,359,308 |
|---|
6/19 | $1,525,827 | $1,543,493 | $1,464,004 |
|---|
7/19 | $1,623,122 | $1,566,437 | $1,478,313 |
|---|
8/19 | $1,482,330 | $1,534,505 | $1,414,520 |
|---|
9/19 | $1,375,877 | $1,561,437 | $1,402,910 |
|---|
10/19 | $1,402,204 | $1,595,050 | $1,442,830 |
|---|
11/19 | $1,531,550 | $1,655,680 | $1,527,753 |
|---|
12/19 | $1,509,807 | $1,703,486 | $1,562,761 |
|---|
1/20 | $1,605,518 | $1,701,625 | $1,545,555 |
|---|
2/20 | $1,569,121 | $1,562,308 | $1,433,968 |
|---|
3/20 | $1,255,027 | $1,347,463 | $1,160,117 |
|---|
4/20 | $1,582,602 | $1,525,921 | $1,332,909 |
|---|
5/20 | $1,929,049 | $1,607,525 | $1,458,866 |
|---|
6/20 | $2,169,000 | $1,644,276 | $1,514,929 |
|---|
7/20 | $2,402,211 | $1,737,643 | $1,566,989 |
|---|
8/20 | $2,666,428 | $1,863,526 | $1,658,913 |
|---|
9/20 | $2,596,329 | $1,795,673 | $1,623,367 |
|---|
10/20 | $2,477,702 | $1,756,917 | $1,635,702 |
|---|
11/20 | $3,165,203 | $1,970,651 | $1,924,133 |
|---|
12/20 | $3,783,112 | $2,059,307 | $2,103,982 |
|---|
1/21 | $5,036,231 | $2,050,147 | $2,205,424 |
|---|
2/21 | $5,224,793 | $2,114,229 | $2,278,242 |
|---|
3/21 | $4,676,924 | $2,190,009 | $2,206,556 |
|---|
4/21 | $4,945,662 | $2,302,902 | $2,254,667 |
|---|
5/21 | $4,691,772 | $2,313,415 | $2,190,274 |
|---|
6/21 | $5,195,098 | $2,370,461 | $2,292,997 |
|---|
7/21 | $4,831,337 | $2,410,547 | $2,209,482 |
|---|
8/21 | $4,688,802 | $2,479,291 | $2,249,638 |
|---|
9/21 | $4,356,221 | $2,368,050 | $2,163,384 |
|---|
10/21 | $4,488,363 | $2,528,188 | $2,264,686 |
|---|
11/21 | $4,011,762 | $2,489,706 | $2,154,079 |
|---|
12/21 | $3,657,178 | $2,587,747 | $2,163,626 |
|---|
1/22 | $2,879,843 | $2,435,494 | $1,873,638 |
|---|
2/22 | $2,779,899 | $2,374,146 | $1,881,812 |
|---|
3/22 | $2,696,613 | $2,451,154 | $1,890,416 |
|---|
4/22 | $2,143,225 | $2,231,182 | $1,658,476 |
|---|
5/22 | $1,922,980 | $2,228,191 | $1,627,157 |
|---|
6/22 | $1,719,392 | $2,041,783 | $1,526,429 |
|---|
7/22 | $1,943,338 | $2,233,339 | $1,697,331 |
|---|
8/22 | $1,880,411 | $2,149,993 | $1,681,378 |
|---|
9/22 | $1,700,884 | $1,950,626 | $1,530,121 |
|---|
10/22 | $1,723,093 | $2,110,589 | $1,675,362 |
|---|
11/22 | $1,599,090 | $2,220,753 | $1,702,641 |
|---|
12/22 | $1,484,075 | $2,090,721 | $1,593,348 |
|---|
1/23 | $1,790,549 | $2,234,714 | $1,751,842 |
|---|
2/23 | $1,781,261 | $2,182,483 | $1,732,865 |
|---|
3/23 | $1,796,121 | $2,240,841 | $1,690,107 |
|---|
4/23 | $1,675,389 | $2,264,715 | $1,670,472 |
|---|
5/23 | $1,833,269 | $2,273,527 | $1,670,772 |
|---|
6/23 | $2,121,169 | $2,428,776 | $1,809,303 |
|---|
7/23 | $2,325,484 | $2,515,839 | $1,893,893 |
|---|
8/23 | $2,134,170 | $2,467,274 | $1,795,306 |
|---|
9/23 | $1,974,433 | $2,349,748 | $1,676,887 |
|---|
10/23 | $1,718,109 | $2,287,459 | $1,547,563 |
|---|
11/23 | $1,913,138 | $2,500,760 | $1,688,450 |
|---|
12/23 | $2,292,051 | $2,633,405 | $1,890,642 |
|---|
1/24 | $2,087,735 | $2,662,591 | $1,830,010 |
|---|
2/24 | $2,275,334 | $2,806,718 | $1,978,654 |
|---|
3/24 | $2,362,633 | $2,897,256 | $2,033,988 |
|---|
4/24 | $2,045,014 | $2,769,771 | $1,877,373 |
|---|
5/24 | $2,048,729 | $2,900,635 | $1,977,908 |
|---|
6/24 | $2,091,450 | $2,990,431 | $1,974,612 |
|---|
7/24 | $2,160,174 | $3,046,020 | $2,136,256 |
|---|
8/24 | $2,156,459 | $3,112,328 | $2,112,602 |
|---|
9/24 | $2,266,047 | $3,176,709 | $2,140,679 |
|---|
10/24 | $2,414,640 | $3,153,381 | $2,112,276 |
|---|
11/24 | $3,100,026 | $3,363,157 | $2,371,274 |
|---|
12/24 | $2,971,441 | $3,260,361 | $2,177,155 |
|---|
|
|
| Average Annual Return [Table Text Block] |
AATR | 1 Year | 5 Years | 10 Years |
|---|
Class I | 29.64% | 14.50% | 11.51% |
|---|
Russell 3000® Index | 23.81% | 13.86% | 12.55% |
|---|
Russell 2000® Growth Index | 15.15% | 6.86% | 8.09% |
|---|
|
|
| AssetsNet |
$ 383,113,019
|
|
| Holdings Count | Holding |
55
|
|
| Advisory Fees Paid, Amount |
$ 2,623,653
|
|
| InvestmentCompanyPortfolioTurnover |
100.00%
|
|
| Additional Fund Statistics [Text Block] |
Total Net Assets | $383,113,019 |
|---|
# of Portfolio Holdings | 55 |
|---|
Portfolio Turnover Rate | 100% |
|---|
Total Advisory Fees Paid | $2,623,653 |
|---|
|
|
| Holdings [Text Block] |
Sector Allocation (% of total investments)Value | Value |
|---|
Materials | 0.2% | Real Estate | 1.2% | Industrials | 3.0% | Investment Companies | 3.1% | Communication Services | 6.8% | Financials | 6.8% | Short-Term Investments | 7.4% | Consumer Staples | 8.1% | Health Care | 16.1% | Consumer Discretionary | 20.4% | Information Technology | 26.9% |
Top Ten Holdings (% of total investments)Footnote ReferenceaGlobal-e Online Ltd. | 8.2% | Peloton Interactive, Inc. | 7.9% | Cloudflare, Inc. | 7.3% | Affirm Holdings, Inc. | 5.8% | Roivant Sciences Ltd. | 4.8% | ZoomInfo Technologies, Inc. | 4.8% | Bill Holdings, Inc. | 4.7% | IonQ, Inc. | 4.7% | Oddity Tech Ltd. | 4.6% | Aurora Innovation, Inc. | 4.3% | Total | 57.1% |
| Footnote | Description | Footnotea | Excluding cash equivalents. |
|
|
| Material Fund Change [Text Block] |
|
|
| Updated Prospectus Web Address |
<span style="box-sizing: border-box; color: rgb(0, 0, 0); display: inline; flex-wrap: nowrap; font-size: 10.6667px; font-weight: 400; grid-area: auto; line-height: 16px; margin: 0px; overflow: visible; text-align: left;">www.morganstanley.com/im/shareholderreports</span>
|
|
| C000104303 |
|
|
| Shareholder Report [Line Items] |
|
|
| Fund Name |
Morgan Stanley Institutional Fund, Inc. - Inception Portfolio
|
|
| Class Name |
Class L
|
|
| Trading Symbol |
MSSLX
|
|
| Annual or Semi-Annual Statement [Text Block] |
This annual shareholder report contains important information about Morgan Stanley Institutional Fund, Inc. - Inception Portfolio for the period of January 1, 2024 to December 31, 2024.
|
|
| Shareholder Report Annual or Semi-Annual |
Annual Shareholder Report
|
|
| Additional Information [Text Block] |
You can find additional information about the Fund at www.morganstanley.com/im/shareholderreports. You can also request this information by contacting us at 1-800-869-6397.
|
|
| Additional Information Phone Number |
1-800-869-6397
|
|
| Additional Information Website |
<span style="box-sizing: border-box; color: rgb(0, 0, 0); display: inline; flex-wrap: nowrap; font-size: 10.6667px; font-weight: 400; grid-area: auto; line-height: 16px; margin: 0px; overflow: visible; text-align: left;">www.morganstanley.com/im/shareholderreports</span>
|
|
| Expenses [Text Block] |
What were the Fund costs for the last year?(based on a hypothetical $10,000 investment) Class Name | Costs of a $10,000 investment | Costs paid as a percentage of a $10,000 investment |
|---|
Class L | $211 | 1.85% |
|---|
|
|
| Expenses Paid, Amount |
$ 211
|
|
| Expense Ratio, Percent |
1.85%
|
|
| Factors Affecting Performance [Text Block] |
How did the Fund perform last year and what affected its performance?Key contributors to (↑) and detractors from (↓) performance, relative to the Russell 2000® Growth Index: ↑ Stock selection and average overweight in information technology, led by a position in an enterprise analytics platform and Bitcoin developing company ↑ Stock selection in consumer discretionary, led by a position in a leading seller of used cars online in the United States ↑ Average underweight in health care, which was one of the weaker performing sectors in the period ↓ Stock selection in health care, where a position in an underperforming health care services provider was the largest detractor in the portfolio ↓ Stock selection in communication services, due to a holding in a financial services advertising platform that underperformed ↓ Average underweight in industrials, a sector that outperformed the index |
|
| Line Graph [Table Text Block] |
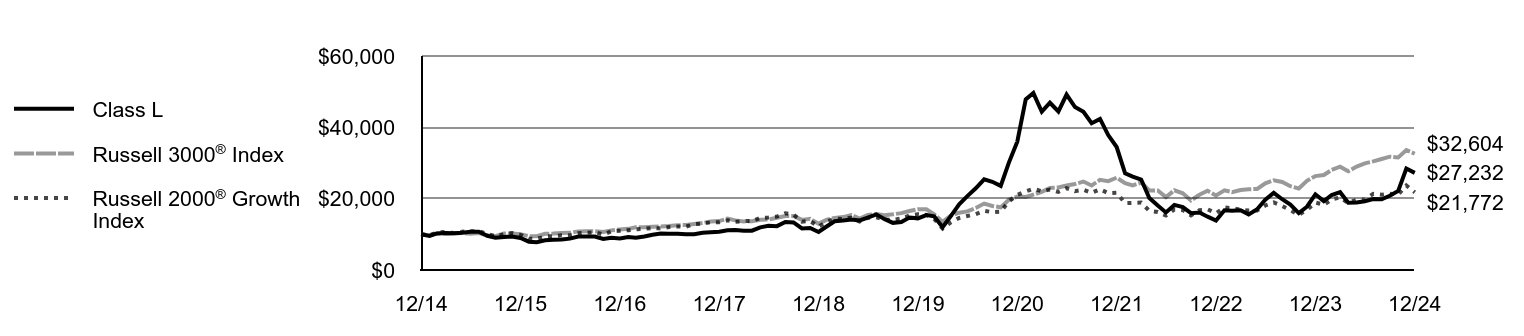 | Class L | Russell 3000® Index | Russell 2000® Growth Index |
|---|
12/14 | $10,000 | $10,000 | $10,000 |
|---|
1/15 | $9,541 | $9,722 | $9,772 |
|---|
2/15 | $10,246 | $10,285 | $10,475 |
|---|
3/15 | $10,390 | $10,180 | $10,663 |
|---|
4/15 | $10,281 | $10,226 | $10,349 |
|---|
5/15 | $10,452 | $10,368 | $10,730 |
|---|
6/15 | $10,705 | $10,194 | $10,874 |
|---|
7/15 | $10,754 | $10,365 | $10,918 |
|---|
8/15 | $9,595 | $9,739 | $10,091 |
|---|
9/15 | $9,026 | $9,455 | $9,453 |
|---|
10/15 | $9,280 | $10,202 | $9,990 |
|---|
11/15 | $9,383 | $10,258 | $10,356 |
|---|
12/15 | $8,964 | $10,048 | $9,862 |
|---|
1/16 | $7,934 | $9,481 | $8,793 |
|---|
2/16 | $7,776 | $9,478 | $8,731 |
|---|
3/16 | $8,333 | $10,145 | $9,400 |
|---|
4/16 | $8,453 | $10,208 | $9,494 |
|---|
5/16 | $8,581 | $10,391 | $9,750 |
|---|
6/16 | $8,799 | $10,412 | $9,705 |
|---|
7/16 | $9,396 | $10,825 | $10,339 |
|---|
8/16 | $9,426 | $10,853 | $10,449 |
|---|
9/16 | $9,373 | $10,870 | $10,600 |
|---|
10/16 | $8,713 | $10,635 | $9,941 |
|---|
11/16 | $9,051 | $11,111 | $10,830 |
|---|
12/16 | $8,859 | $11,327 | $10,978 |
|---|
1/17 | $9,258 | $11,541 | $11,156 |
|---|
2/17 | $9,063 | $11,970 | $11,430 |
|---|
3/17 | $9,383 | $11,978 | $11,565 |
|---|
4/17 | $9,899 | $12,105 | $11,778 |
|---|
5/17 | $10,250 | $12,229 | $11,671 |
|---|
6/17 | $10,164 | $12,339 | $12,073 |
|---|
7/17 | $10,140 | $12,572 | $12,176 |
|---|
8/17 | $9,990 | $12,596 | $12,161 |
|---|
9/17 | $10,026 | $12,903 | $12,823 |
|---|
10/17 | $10,439 | $13,185 | $13,022 |
|---|
11/17 | $10,553 | $13,585 | $13,396 |
|---|
12/17 | $10,715 | $13,721 | $13,411 |
|---|
1/18 | $11,121 | $14,444 | $13,934 |
|---|
2/18 | $11,209 | $13,912 | $13,538 |
|---|
3/18 | $10,981 | $13,633 | $13,720 |
|---|
4/18 | $11,019 | $13,684 | $13,733 |
|---|
5/18 | $11,969 | $14,071 | $14,598 |
|---|
6/18 | $12,400 | $14,163 | $14,712 |
|---|
7/18 | $12,299 | $14,633 | $14,965 |
|---|
8/18 | $13,451 | $15,147 | $15,897 |
|---|
9/18 | $13,337 | $15,172 | $15,525 |
|---|
10/18 | $11,653 | $14,055 | $13,560 |
|---|
11/18 | $11,792 | $14,336 | $13,772 |
|---|
12/18 | $10,654 | $13,002 | $12,163 |
|---|
1/19 | $12,259 | $14,118 | $13,568 |
|---|
2/19 | $13,670 | $14,614 | $14,444 |
|---|
3/19 | $13,880 | $14,828 | $14,248 |
|---|
4/19 | $14,135 | $15,420 | $14,682 |
|---|
5/19 | $13,880 | $14,422 | $13,593 |
|---|
6/19 | $14,690 | $15,435 | $14,640 |
|---|
7/19 | $15,605 | $15,664 | $14,783 |
|---|
8/19 | $14,255 | $15,345 | $14,145 |
|---|
9/19 | $13,220 | $15,614 | $14,029 |
|---|
10/19 | $13,460 | $15,950 | $14,428 |
|---|
11/19 | $14,690 | $16,557 | $15,278 |
|---|
12/19 | $14,480 | $17,035 | $15,628 |
|---|
1/20 | $15,387 | $17,016 | $15,456 |
|---|
2/20 | $15,028 | $15,623 | $14,340 |
|---|
3/20 | $12,003 | $13,475 | $11,601 |
|---|
4/20 | $15,122 | $15,259 | $13,329 |
|---|
5/20 | $18,430 | $16,075 | $14,589 |
|---|
6/20 | $20,717 | $16,443 | $15,149 |
|---|
7/20 | $22,910 | $17,376 | $15,670 |
|---|
8/20 | $25,424 | $18,635 | $16,589 |
|---|
9/20 | $24,725 | $17,957 | $16,234 |
|---|
10/20 | $23,591 | $17,569 | $16,357 |
|---|
11/20 | $30,112 | $19,707 | $19,241 |
|---|
12/20 | $35,981 | $20,593 | $21,040 |
|---|
1/21 | $47,836 | $20,501 | $22,054 |
|---|
2/21 | $49,607 | $21,142 | $22,782 |
|---|
3/21 | $44,380 | $21,900 | $22,066 |
|---|
4/21 | $46,895 | $23,029 | $22,547 |
|---|
5/21 | $44,445 | $23,134 | $21,903 |
|---|
6/21 | $49,192 | $23,705 | $22,930 |
|---|
7/21 | $45,692 | $24,105 | $22,095 |
|---|
8/21 | $44,336 | $24,793 | $22,496 |
|---|
9/21 | $41,164 | $23,681 | $21,634 |
|---|
10/21 | $42,367 | $25,282 | $22,647 |
|---|
11/21 | $37,840 | $24,897 | $21,541 |
|---|
12/21 | $34,480 | $25,877 | $21,636 |
|---|
1/22 | $27,114 | $24,355 | $18,736 |
|---|
2/22 | $26,173 | $23,741 | $18,818 |
|---|
3/22 | $25,358 | $24,512 | $18,904 |
|---|
4/22 | $20,155 | $22,312 | $16,585 |
|---|
5/22 | $18,055 | $22,282 | $16,272 |
|---|
6/22 | $16,143 | $20,418 | $15,264 |
|---|
7/22 | $18,243 | $22,333 | $16,973 |
|---|
8/22 | $17,616 | $21,500 | $16,814 |
|---|
9/22 | $15,923 | $19,506 | $15,301 |
|---|
10/22 | $16,111 | $21,106 | $16,754 |
|---|
11/22 | $14,952 | $22,208 | $17,026 |
|---|
12/22 | $13,875 | $20,907 | $15,933 |
|---|
1/23 | $16,732 | $22,347 | $17,518 |
|---|
2/23 | $16,638 | $21,825 | $17,329 |
|---|
3/23 | $16,763 | $22,408 | $16,901 |
|---|
4/23 | $15,602 | $22,647 | $16,705 |
|---|
5/23 | $17,046 | $22,735 | $16,708 |
|---|
6/23 | $19,714 | $24,288 | $18,093 |
|---|
7/23 | $21,629 | $25,158 | $18,939 |
|---|
8/23 | $19,840 | $24,673 | $17,953 |
|---|
9/23 | $18,333 | $23,497 | $16,769 |
|---|
10/23 | $15,947 | $22,875 | $15,476 |
|---|
11/23 | $17,737 | $25,008 | $16,885 |
|---|
12/23 | $21,221 | $26,334 | $18,906 |
|---|
1/24 | $19,306 | $26,626 | $18,300 |
|---|
2/24 | $21,033 | $28,067 | $19,787 |
|---|
3/24 | $21,818 | $28,973 | $20,340 |
|---|
4/24 | $18,867 | $27,698 | $18,774 |
|---|
5/24 | $18,898 | $29,006 | $19,779 |
|---|
6/24 | $19,275 | $29,904 | $19,746 |
|---|
7/24 | $19,871 | $30,460 | $21,363 |
|---|
8/24 | $19,840 | $31,123 | $21,126 |
|---|
9/24 | $20,813 | $31,767 | $21,407 |
|---|
10/24 | $22,163 | $31,534 | $21,123 |
|---|
11/24 | $28,441 | $33,632 | $23,713 |
|---|
12/24 | $27,232 | $32,604 | $21,772 |
|---|
|
|
| Average Annual Return [Table Text Block] |
AATR | 1 Year | 5 Years | 10 Years |
|---|
Class L | 28.33% | 13.47% | 10.54% |
|---|
Russell 3000® Index | 23.81% | 13.86% | 12.55% |
|---|
Russell 2000® Growth Index | 15.15% | 6.86% | 8.09% |
|---|
|
|
| AssetsNet |
$ 383,113,019
|
|
| Holdings Count | Holding |
55
|
|
| Advisory Fees Paid, Amount |
$ 2,623,653
|
|
| InvestmentCompanyPortfolioTurnover |
100.00%
|
|
| Additional Fund Statistics [Text Block] |
Total Net Assets | $383,113,019 |
|---|
# of Portfolio Holdings | 55 |
|---|
Portfolio Turnover Rate | 100% |
|---|
Total Advisory Fees Paid | $2,623,653 |
|---|
|
|
| Holdings [Text Block] |
Sector Allocation (% of total investments)Value | Value |
|---|
Materials | 0.2% | Real Estate | 1.2% | Industrials | 3.0% | Investment Companies | 3.1% | Communication Services | 6.8% | Financials | 6.8% | Short-Term Investments | 7.4% | Consumer Staples | 8.1% | Health Care | 16.1% | Consumer Discretionary | 20.4% | Information Technology | 26.9% |
Top Ten Holdings (% of total investments)Footnote ReferenceaGlobal-e Online Ltd. | 8.2% | Peloton Interactive, Inc. | 7.9% | Cloudflare, Inc. | 7.3% | Affirm Holdings, Inc. | 5.8% | Roivant Sciences Ltd. | 4.8% | ZoomInfo Technologies, Inc. | 4.8% | Bill Holdings, Inc. | 4.7% | IonQ, Inc. | 4.7% | Oddity Tech Ltd. | 4.6% | Aurora Innovation, Inc. | 4.3% | Total | 57.1% |
| Footnote | Description | Footnotea | Excluding cash equivalents. |
|
|
| Material Fund Change [Text Block] |
|
|
| Updated Prospectus Web Address |
<span style="box-sizing: border-box; color: rgb(0, 0, 0); display: inline; flex-wrap: nowrap; font-size: 10.6667px; font-weight: 400; grid-area: auto; line-height: 16px; margin: 0px; overflow: visible; text-align: left;">www.morganstanley.com/im/shareholderreports</span>
|
|
| C000129402 |
|
|
| Shareholder Report [Line Items] |
|
|
| Fund Name |
Morgan Stanley Institutional Fund, Inc. - Inception Portfolio
|
|
| Class Name |
Class R6
|
|
| Trading Symbol |
MFLLX
|
|
| Annual or Semi-Annual Statement [Text Block] |
This annual shareholder report contains important information about Morgan Stanley Institutional Fund, Inc. - Inception Portfolio for the period of January 1, 2024 to December 31, 2024.
|
|
| Shareholder Report Annual or Semi-Annual |
Annual Shareholder Report
|
|
| Additional Information [Text Block] |
You can find additional information about the Fund at www.morganstanley.com/im/shareholderreports. You can also request this information by contacting us at 1-800-869-6397.
|
|
| Additional Information Phone Number |
1-800-869-6397
|
|
| Additional Information Website |
<span style="box-sizing: border-box; color: rgb(0, 0, 0); display: inline; flex-wrap: nowrap; font-size: 10.6667px; font-weight: 400; grid-area: auto; line-height: 16px; margin: 0px; overflow: visible; text-align: left;">www.morganstanley.com/im/shareholderreports</span>
|
|
| Expenses [Text Block] |
What were the Fund costs for the last year?(based on a hypothetical $10,000 investment) Class Name | Costs of a $10,000 investment | Costs paid as a percentage of a $10,000 investment |
|---|
Class R6 | $107 | 0.93% |
|---|
|
|
| Expenses Paid, Amount |
$ 107
|
|
| Expense Ratio, Percent |
0.93%
|
|
| Factors Affecting Performance [Text Block] |
How did the Fund perform last year and what affected its performance?Key contributors to (↑) and detractors from (↓) performance, relative to the Russell 2000® Growth Index: ↑ Stock selection and average overweight in information technology, led by a position in an enterprise analytics platform and Bitcoin developing company ↑ Stock selection in consumer discretionary, led by a position in a leading seller of used cars online in the United States ↑ Average underweight in health care, which was one of the weaker performing sectors in the period ↓ Stock selection in health care, where a position in an underperforming health care services provider was the largest detractor in the portfolio ↓ Stock selection in communication services, due to a holding in a financial services advertising platform that underperformed ↓ Average underweight in industrials, a sector that outperformed the index |
|
| Line Graph [Table Text Block] |
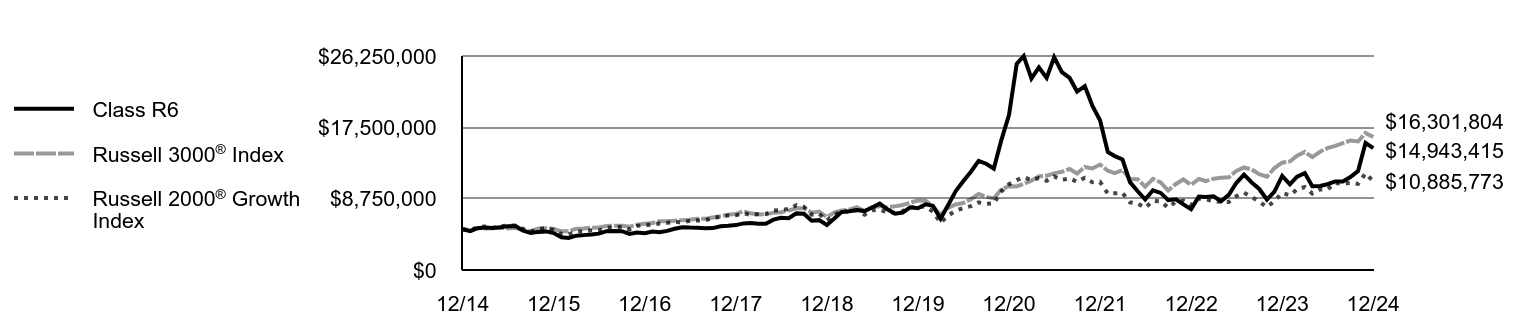 | Class R6 | Russell 3000® Index | Russell 2000® Growth Index |
|---|
12/14 | $5,000,000 | $5,000,000 | $5,000,000 |
|---|
1/15 | $4,773,002 | $4,860,842 | $4,885,849 |
|---|
2/15 | $5,130,145 | $5,142,290 | $5,237,464 |
|---|
3/15 | $5,205,811 | $5,090,013 | $5,331,492 |
|---|
4/15 | $5,154,358 | $5,113,037 | $5,174,650 |
|---|
5/15 | $5,248,184 | $5,183,757 | $5,364,771 |
|---|
6/15 | $5,378,329 | $5,097,030 | $5,436,889 |
|---|
7/15 | $5,405,856 | $5,182,280 | $5,459,086 |
|---|
8/15 | $4,827,090 | $4,869,429 | $5,045,393 |
|---|
9/15 | $4,545,283 | $4,727,534 | $4,726,744 |
|---|
10/15 | $4,675,581 | $5,100,940 | $4,994,859 |
|---|
11/15 | $4,733,154 | $5,129,217 | $5,177,897 |
|---|
12/15 | $4,524,104 | $5,023,938 | $4,930,917 |
|---|
1/16 | $4,004,998 | $4,740,461 | $4,396,655 |
|---|
2/16 | $3,929,432 | $4,738,934 | $4,365,575 |
|---|
3/16 | $4,215,269 | $5,072,584 | $4,700,003 |
|---|
4/16 | $4,277,693 | $5,104,021 | $4,746,870 |
|---|
5/16 | $4,346,688 | $5,195,334 | $4,874,756 |
|---|
6/16 | $4,458,394 | $5,206,017 | $4,852,330 |
|---|
7/16 | $4,765,176 | $5,412,628 | $5,169,616 |
|---|
8/16 | $4,785,226 | $5,426,434 | $5,224,570 |
|---|
9/16 | $4,761,835 | $5,434,965 | $5,299,794 |
|---|
10/16 | $4,431,013 | $5,317,376 | $4,970,439 |
|---|
11/16 | $4,608,119 | $5,555,340 | $5,415,139 |
|---|
12/16 | $4,511,519 | $5,663,742 | $5,489,003 |
|---|
1/17 | $4,718,594 | $5,770,345 | $5,578,126 |
|---|
2/17 | $4,620,148 | $5,984,953 | $5,714,906 |
|---|
3/17 | $4,793,277 | $5,989,025 | $5,782,599 |
|---|
4/17 | $5,058,061 | $6,052,507 | $5,889,095 |
|---|
5/17 | $5,241,373 | $6,114,448 | $5,835,536 |
|---|
6/17 | $5,204,032 | $6,169,628 | $6,036,386 |
|---|
7/17 | $5,193,870 | $6,285,956 | $6,087,766 |
|---|
8/17 | $5,122,670 | $6,298,067 | $6,080,654 |
|---|
9/17 | $5,141,407 | $6,451,663 | $6,411,748 |
|---|
10/17 | $5,355,008 | $6,592,452 | $6,511,084 |
|---|
11/17 | $5,418,713 | $6,792,633 | $6,698,019 |
|---|
12/17 | $5,507,522 | $6,860,525 | $6,705,735 |
|---|
1/18 | $5,718,576 | $7,222,147 | $6,967,137 |
|---|
2/18 | $5,773,852 | $6,955,941 | $6,768,771 |
|---|
3/18 | $5,663,300 | $6,816,307 | $6,859,922 |
|---|
4/18 | $5,678,375 | $6,842,214 | $6,866,635 |
|---|
5/18 | $6,180,886 | $7,035,372 | $7,298,965 |
|---|
6/18 | $6,407,016 | $7,081,382 | $7,356,074 |
|---|
7/18 | $6,356,765 | $7,316,384 | $7,482,538 |
|---|
8/18 | $6,959,779 | $7,573,319 | $7,948,385 |
|---|
9/18 | $6,909,527 | $7,585,855 | $7,762,367 |
|---|
10/18 | $6,035,158 | $7,027,288 | $6,780,146 |
|---|
11/18 | $6,115,560 | $7,168,035 | $6,886,208 |
|---|
12/18 | $5,528,630 | $6,500,910 | $6,081,566 |
|---|
1/19 | $6,361,633 | $7,058,910 | $6,783,883 |
|---|
2/19 | $7,103,348 | $7,307,165 | $7,221,979 |
|---|
3/19 | $7,217,458 | $7,413,863 | $7,124,242 |
|---|
4/19 | $7,354,390 | $7,709,913 | $7,341,188 |
|---|
5/19 | $7,228,869 | $7,210,990 | $6,796,539 |
|---|
6/19 | $7,662,487 | $7,717,466 | $7,320,019 |
|---|
7/19 | $8,141,749 | $7,832,186 | $7,391,564 |
|---|
8/19 | $7,439,972 | $7,672,525 | $7,072,600 |
|---|
9/19 | $6,903,655 | $7,807,184 | $7,014,548 |
|---|
10/19 | $7,040,587 | $7,975,248 | $7,214,149 |
|---|
11/19 | $7,685,309 | $8,278,402 | $7,638,764 |
|---|
12/19 | $7,576,701 | $8,517,431 | $7,813,806 |
|---|
1/20 | $8,059,892 | $8,508,127 | $7,727,774 |
|---|
2/20 | $7,871,985 | $7,811,539 | $7,169,842 |
|---|
3/20 | $6,294,903 | $6,737,313 | $5,800,584 |
|---|
4/20 | $7,945,806 | $7,629,604 | $6,664,546 |
|---|
5/20 | $9,683,950 | $8,037,624 | $7,294,331 |
|---|
6/20 | $10,891,928 | $8,221,379 | $7,574,646 |
|---|
7/20 | $12,059,639 | $8,688,216 | $7,834,947 |
|---|
8/20 | $13,388,414 | $9,317,629 | $8,294,565 |
|---|
9/20 | $13,032,732 | $8,978,365 | $8,116,837 |
|---|
10/20 | $12,442,165 | $8,784,583 | $8,178,512 |
|---|
11/20 | $15,898,322 | $9,853,255 | $9,620,667 |
|---|
12/20 | $19,001,801 | $10,296,534 | $10,519,908 |
|---|
1/21 | $25,293,886 | $10,250,735 | $11,027,120 |
|---|
2/21 | $26,246,561 | $10,571,145 | $11,391,212 |
|---|
3/21 | $23,491,927 | $10,950,045 | $11,032,780 |
|---|
4/21 | $24,843,396 | $11,514,512 | $11,273,333 |
|---|
5/21 | $23,573,163 | $11,567,075 | $10,951,370 |
|---|
6/21 | $26,098,859 | $11,852,306 | $11,464,985 |
|---|
7/21 | $24,267,360 | $12,052,736 | $11,047,411 |
|---|
8/21 | $23,558,393 | $12,396,454 | $11,248,190 |
|---|
9/21 | $21,889,366 | $11,840,251 | $10,816,921 |
|---|
10/21 | $22,554,023 | $12,640,942 | $11,323,428 |
|---|
11/21 | $20,161,258 | $12,448,531 | $10,770,397 |
|---|
12/21 | $18,375,800 | $12,938,737 | $10,818,128 |
|---|
1/22 | $14,468,989 | $12,177,472 | $9,368,188 |
|---|
2/22 | $13,972,595 | $11,870,730 | $9,409,060 |
|---|
3/22 | $13,558,932 | $12,255,772 | $9,452,079 |
|---|
4/22 | $10,773,606 | $11,155,911 | $8,292,378 |
|---|
5/22 | $9,661,314 | $11,140,954 | $8,135,786 |
|---|
6/22 | $8,640,947 | $10,208,916 | $7,632,145 |
|---|
7/22 | $9,771,624 | $11,166,696 | $8,486,656 |
|---|
8/22 | $9,459,079 | $10,749,963 | $8,406,889 |
|---|
9/22 | $8,558,214 | $9,753,128 | $7,650,604 |
|---|
10/22 | $8,668,524 | $10,552,943 | $8,376,810 |
|---|
11/22 | $8,043,434 | $11,103,767 | $8,513,206 |
|---|
12/22 | $7,462,765 | $10,453,603 | $7,966,741 |
|---|
1/23 | $9,014,429 | $11,173,571 | $8,759,210 |
|---|
2/23 | $8,959,013 | $10,912,414 | $8,664,324 |
|---|
3/23 | $9,042,138 | $11,204,203 | $8,450,537 |
|---|
4/23 | $8,432,555 | $11,323,577 | $8,352,359 |
|---|
5/23 | $9,217,623 | $11,367,634 | $8,353,862 |
|---|
6/23 | $10,667,690 | $12,143,878 | $9,046,514 |
|---|
7/23 | $11,702,133 | $12,579,197 | $9,469,467 |
|---|
8/23 | $10,741,579 | $12,336,371 | $8,976,532 |
|---|
9/23 | $9,938,039 | $11,748,738 | $8,384,433 |
|---|
10/23 | $8,644,986 | $11,437,294 | $7,737,815 |
|---|
11/23 | $9,624,012 | $12,503,802 | $8,442,252 |
|---|
12/23 | $11,535,883 | $13,167,027 | $9,453,211 |
|---|
1/24 | $10,501,441 | $13,312,954 | $9,150,051 |
|---|
2/24 | $11,443,522 | $14,033,591 | $9,893,268 |
|---|
3/24 | $11,886,855 | $14,486,278 | $10,169,938 |
|---|
4/24 | $10,279,774 | $13,848,857 | $9,386,863 |
|---|
5/24 | $10,307,483 | $14,503,174 | $9,889,541 |
|---|
6/24 | $10,519,913 | $14,952,155 | $9,873,061 |
|---|
7/24 | $10,861,648 | $15,230,100 | $10,681,280 |
|---|
8/24 | $10,852,412 | $15,561,640 | $10,563,010 |
|---|
9/24 | $11,397,342 | $15,883,546 | $10,703,393 |
|---|
10/24 | $12,145,466 | $15,766,903 | $10,561,382 |
|---|
11/24 | $15,590,529 | $16,815,783 | $11,856,369 |
|---|
12/24 | $14,943,415 | $16,301,804 | $10,885,773 |
|---|
|
|
| Average Annual Return [Table Text Block] |
AATR | 1 Year | 5 Years | 10 Years |
|---|
Class R6 | 29.54% | 14.55% | 11.57% |
|---|
Russell 3000® Index | 23.81% | 13.86% | 12.55% |
|---|
Russell 2000® Growth Index | 15.15% | 6.86% | 8.09% |
|---|
|
|
| AssetsNet |
$ 383,113,019
|
|
| Holdings Count | Holding |
55
|
|
| Advisory Fees Paid, Amount |
$ 2,623,653
|
|
| InvestmentCompanyPortfolioTurnover |
100.00%
|
|
| Additional Fund Statistics [Text Block] |
Total Net Assets | $383,113,019 |
|---|
# of Portfolio Holdings | 55 |
|---|
Portfolio Turnover Rate | 100% |
|---|
Total Advisory Fees Paid | $2,623,653 |
|---|
|
|
| Holdings [Text Block] |
Sector Allocation (% of total investments)Value | Value |
|---|
Materials | 0.2% | Real Estate | 1.2% | Industrials | 3.0% | Investment Companies | 3.1% | Communication Services | 6.8% | Financials | 6.8% | Short-Term Investments | 7.4% | Consumer Staples | 8.1% | Health Care | 16.1% | Consumer Discretionary | 20.4% | Information Technology | 26.9% |
Top Ten Holdings (% of total investments)Footnote ReferenceaGlobal-e Online Ltd. | 8.2% | Peloton Interactive, Inc. | 7.9% | Cloudflare, Inc. | 7.3% | Affirm Holdings, Inc. | 5.8% | Roivant Sciences Ltd. | 4.8% | ZoomInfo Technologies, Inc. | 4.8% | Bill Holdings, Inc. | 4.7% | IonQ, Inc. | 4.7% | Oddity Tech Ltd. | 4.6% | Aurora Innovation, Inc. | 4.3% | Total | 57.1% |
| Footnote | Description | Footnotea | Excluding cash equivalents. |
|
|
| Material Fund Change [Text Block] |
|
|
| Updated Prospectus Web Address |
<span style="box-sizing: border-box; color: rgb(0, 0, 0); display: inline; flex-wrap: nowrap; font-size: 10.6667px; font-weight: 400; grid-area: auto; line-height: 16px; margin: 0px; overflow: visible; text-align: left;">www.morganstanley.com/im/shareholderreports</span>
|
|
| C000094900 |
|
|
| Shareholder Report [Line Items] |
|
|
| Fund Name |
Morgan Stanley Institutional Fund, Inc. - International Advantage Portfolio
|
|
| Class Name |
Class A
|
|
| Trading Symbol |
MFAPX
|
|
| Annual or Semi-Annual Statement [Text Block] |
This annual shareholder report contains important information about Morgan Stanley Institutional Fund, Inc. - International Advantage Portfolio for the period of January 1, 2024 to December 31, 2024.
|
|
| Shareholder Report Annual or Semi-Annual |
Annual Shareholder Report
|
|
| Additional Information [Text Block] |
You can find additional information about the Fund at www.morganstanley.com/im/shareholderreports. You can also request this information by contacting us at 1-800-869-6397.
|
|
| Additional Information Phone Number |
1-800-869-6397
|
|
| Additional Information Website |
<span style="box-sizing: border-box; color: rgb(0, 0, 0); display: inline; flex-wrap: nowrap; font-size: 10.6667px; font-weight: 400; grid-area: auto; line-height: 16px; margin: 0px; overflow: visible; text-align: left;">www.morganstanley.com/im/shareholderreports</span>
|
|
| Expenses [Text Block] |
What were the Fund costs for the last year?(based on a hypothetical $10,000 investment) Class Name | Costs of a $10,000 investment | Costs paid as a percentage of a $10,000 investment |
|---|
Class A | $132 | 1.28% |
|---|
|
|
| Expenses Paid, Amount |
$ 132
|
|
| Expense Ratio, Percent |
1.28%
|
|
| Factors Affecting Performance [Text Block] |
How did the Fund perform last year and what affected its performance?Key contributors to (↑) and detractors from (↓) performance, relative to the MSCI All Country World ex USA Net Index: ↑ Stock selection in communication services, led by a Swedish audio streaming platform, which was the largest positive contributor in the portfolio ↑ Stock selection in information technology, led by a holding in a Taiwanese semiconductor foundry service provider ↑ No exposure to materials ↓ Stock selection in consumer discretionary, where exposure to an Italian luxury brand was the main detractor ↓ Stock selection in financials, where a position in a Pan-Asian life insurance group was the main detractor ↓ Stock selection in health care, where a provider of products and solutions in the aesthetic dentistry market was the largest detractor across the portfolio |
|
| Line Graph [Table Text Block] |
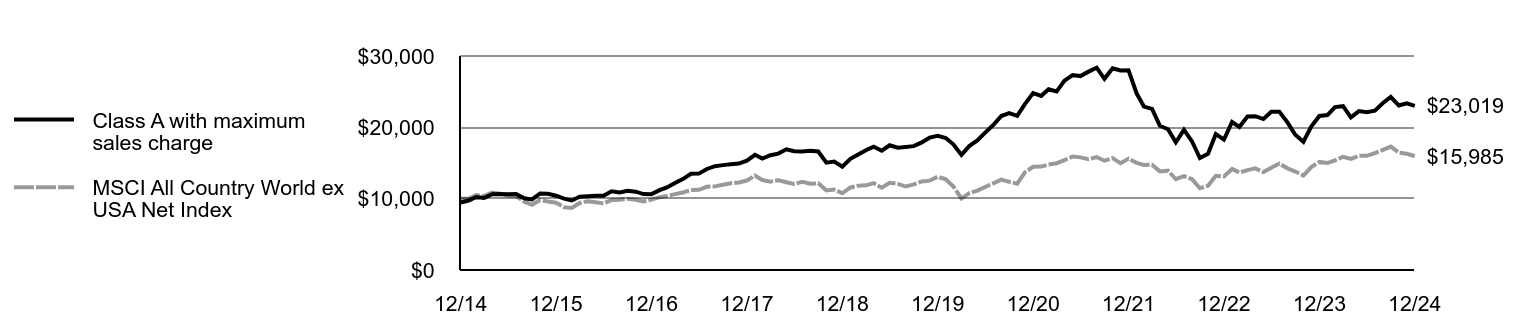 | Class A with maximum sales charge | MSCI All Country World ex USA Net Index |
|---|
12/14 | $9,472 | $10,000 |
|---|
1/15 | $9,740 | $9,985 |
|---|
2/15 | $10,237 | $10,519 |
|---|
3/15 | $10,107 | $10,349 |
|---|
4/15 | $10,636 | $10,872 |
|---|
5/15 | $10,666 | $10,702 |
|---|
6/15 | $10,628 | $10,403 |
|---|
7/15 | $10,655 | $10,375 |
|---|
8/15 | $10,046 | $9,582 |
|---|
9/15 | $9,890 | $9,137 |
|---|
10/15 | $10,734 | $9,818 |
|---|
11/15 | $10,687 | $9,615 |
|---|
12/15 | $10,412 | $9,434 |
|---|
1/16 | $10,006 | $8,792 |
|---|
2/16 | $9,742 | $8,692 |
|---|
3/16 | $10,271 | $9,398 |
|---|
4/16 | $10,332 | $9,646 |
|---|
5/16 | $10,420 | $9,483 |
|---|
6/16 | $10,403 | $9,338 |
|---|
7/16 | $11,037 | $9,800 |
|---|
8/16 | $10,861 | $9,862 |
|---|
9/16 | $11,108 | $9,983 |
|---|
10/16 | $10,985 | $9,840 |
|---|
11/16 | $10,641 | $9,612 |
|---|
12/16 | $10,633 | $9,858 |
|---|
1/17 | $11,189 | $10,207 |
|---|
2/17 | $11,575 | $10,370 |
|---|
3/17 | $12,184 | $10,633 |
|---|
4/17 | $12,749 | $10,860 |
|---|
5/17 | $13,484 | $11,213 |
|---|
6/17 | $13,511 | $11,248 |
|---|
7/17 | $14,164 | $11,662 |
|---|
8/17 | $14,559 | $11,723 |
|---|
9/17 | $14,703 | $11,941 |
|---|
10/17 | $14,811 | $12,165 |
|---|
11/17 | $14,927 | $12,264 |
|---|
12/17 | $15,331 | $12,538 |
|---|
1/18 | $16,155 | $13,237 |
|---|
2/18 | $15,624 | $12,613 |
|---|
3/18 | $16,090 | $12,390 |
|---|
4/18 | $16,319 | $12,588 |
|---|
5/18 | $16,923 | $12,297 |
|---|
6/18 | $16,649 | $12,066 |
|---|
7/18 | $16,612 | $12,355 |
|---|
8/18 | $16,731 | $12,096 |
|---|
9/18 | $16,612 | $12,151 |
|---|
10/18 | $15,046 | $11,163 |
|---|
11/18 | $15,192 | $11,269 |
|---|
12/18 | $14,491 | $10,758 |
|---|
1/19 | $15,581 | $11,571 |
|---|
2/19 | $16,167 | $11,797 |
|---|
3/19 | $16,791 | $11,868 |
|---|
4/19 | $17,276 | $12,181 |
|---|
5/19 | $16,726 | $11,527 |
|---|
6/19 | $17,481 | $12,222 |
|---|
7/19 | $17,136 | $12,074 |
|---|
8/19 | $17,238 | $11,701 |
|---|
9/19 | $17,359 | $12,002 |
|---|
10/19 | $17,890 | $12,421 |
|---|
11/19 | $18,552 | $12,530 |
|---|
12/19 | $18,797 | $13,073 |
|---|
1/20 | $18,508 | $12,722 |
|---|
2/20 | $17,623 | $11,716 |
|---|
3/20 | $16,140 | $10,020 |
|---|
4/20 | $17,371 | $10,779 |
|---|
5/20 | $18,173 | $11,132 |
|---|
6/20 | $19,254 | $11,635 |
|---|
7/20 | $20,327 | $12,153 |
|---|
8/20 | $21,585 | $12,674 |
|---|
9/20 | $21,986 | $12,362 |
|---|
10/20 | $21,613 | $12,096 |
|---|
11/20 | $23,301 | $13,724 |
|---|
12/20 | $24,794 | $14,465 |
|---|
1/21 | $24,412 | $14,497 |
|---|
2/21 | $25,335 | $14,784 |
|---|
3/21 | $25,018 | $14,971 |
|---|
4/21 | $26,539 | $15,411 |
|---|
5/21 | $27,331 | $15,893 |
|---|
6/21 | $27,182 | $15,790 |
|---|
7/21 | $27,807 | $15,530 |
|---|
8/21 | $28,358 | $15,825 |
|---|
9/21 | $26,800 | $15,319 |
|---|
10/21 | $28,274 | $15,684 |
|---|
11/21 | $27,966 | $14,978 |
|---|
12/21 | $27,984 | $15,597 |
|---|
1/22 | $24,751 | $15,022 |
|---|
2/22 | $22,913 | $14,725 |
|---|
3/22 | $22,593 | $14,748 |
|---|
4/22 | $20,218 | $13,822 |
|---|
5/22 | $19,728 | $13,922 |
|---|
6/22 | $17,899 | $12,724 |
|---|
7/22 | $19,652 | $13,160 |
|---|
8/22 | $18,022 | $12,736 |
|---|
9/22 | $15,693 | $11,464 |
|---|
10/22 | $16,297 | $11,806 |
|---|
11/22 | $19,049 | $13,200 |
|---|
12/22 | $18,285 | $13,101 |
|---|
1/23 | $20,751 | $14,164 |
|---|
2/23 | $20,051 | $13,666 |
|---|
3/23 | $21,520 | $14,001 |
|---|
4/23 | $21,569 | $14,244 |
|---|
5/23 | $21,165 | $13,726 |
|---|
6/23 | $22,181 | $14,342 |
|---|
7/23 | $22,171 | $14,925 |
|---|
8/23 | $20,692 | $14,251 |
|---|
9/23 | $18,966 | $13,801 |
|---|
10/23 | $17,979 | $13,231 |
|---|
11/23 | $20,100 | $14,422 |
|---|
12/23 | $21,589 | $15,147 |
|---|
1/24 | $21,717 | $14,996 |
|---|
2/24 | $22,832 | $15,376 |
|---|
3/24 | $22,970 | $15,857 |
|---|
4/24 | $21,402 | $15,572 |
|---|
5/24 | $22,270 | $16,024 |
|---|
6/24 | $22,112 | $16,009 |
|---|
7/24 | $22,329 | $16,379 |
|---|
8/24 | $23,414 | $16,846 |
|---|
9/24 | $24,252 | $17,300 |
|---|
10/24 | $23,059 | $16,451 |
|---|
11/24 | $23,354 | $16,302 |
|---|
12/24 | $23,019 | $15,985 |
|---|
|
|
| Average Annual Return [Table Text Block] |
AATR | 1 Year | 5 Years | 10 Years |
|---|
Class A | 6.62% | 4.14% | 9.29% |
|---|
Class A, with 5.25% maximum front end sales charge | 1.04% | 3.02% | 8.69% |
|---|
MSCI All Country World ex USA Net Index | 5.53% | 4.10% | 4.80% |
|---|
|
|
| AssetsNet |
$ 2,744,697,984
|
|
| Holdings Count | Holding |
34
|
|
| Advisory Fees Paid, Amount |
$ 23,306,085
|
|
| InvestmentCompanyPortfolioTurnover |
26.00%
|
|
| Additional Fund Statistics [Text Block] |
Total Net Assets | $2,744,697,984 |
|---|
# of Portfolio Holdings | 34 |
|---|
Portfolio Turnover Rate | 26% |
|---|
Total Advisory Fees Paid | $23,306,085 |
|---|
|
|
| Holdings [Text Block] |
Country Weightings (% of total investments)Value | Value |
|---|
Other | 15.6% | Netherlands | 5.4% | Italy | 5.4% | Taiwan | 5.5% | Switzerland | 5.7% | Sweden | 6.1% | United States | 7.8% | India | 8.2% | Denmark | 8.3% | Canada | 10.6% | France | 21.4% |
Top Ten Holdings (% of total investments)Footnote ReferenceaHermes International SCA | 8.8% | DSV AS | 8.3% | Spotify Technology SA | 6.1% | Taiwan Semiconductor Manufacturing Co. Ltd. | 5.5% | Moncler SpA | 5.4% | Schneider Electric SE | 5.2% | MercadoLibre, Inc. | 4.4% | Keyence Corp. | 4.1% | L'Oreal SA | 3.8% | ASML Holding NV | 3.8% | Total | 55.4% |
| Footnote | Description | Footnotea | Excluding cash equivalents. |
|
|
| Material Fund Change [Text Block] |
|
|
| Updated Prospectus Web Address |
<span style="box-sizing: border-box; color: rgb(0, 0, 0); display: inline; flex-wrap: nowrap; font-size: 10.6667px; font-weight: 400; grid-area: auto; line-height: 16px; margin: 0px; overflow: visible; text-align: left;">www.morganstanley.com/im/shareholderreports</span>
|
|
| C000155904 |
|
|
| Shareholder Report [Line Items] |
|
|
| Fund Name |
Morgan Stanley Institutional Fund, Inc. - International Advantage Portfolio
|
|
| Class Name |
Class C
|
|
| Trading Symbol |
MSIAX
|
|
| Annual or Semi-Annual Statement [Text Block] |
This annual shareholder report contains important information about Morgan Stanley Institutional Fund, Inc. - International Advantage Portfolio for the period of January 1, 2024 to December 31, 2024.
|
|
| Shareholder Report Annual or Semi-Annual |
Annual Shareholder Report
|
|
| Additional Information [Text Block] |
You can find additional information about the Fund at www.morganstanley.com/im/shareholderreports. You can also request this information by contacting us at 1-800-869-6397.
|
|
| Additional Information Phone Number |
1-800-869-6397
|
|
| Additional Information Website |
<span style="box-sizing: border-box; color: rgb(0, 0, 0); display: inline; flex-wrap: nowrap; font-size: 10.6667px; font-weight: 400; grid-area: auto; line-height: 16px; margin: 0px; overflow: visible; text-align: left;">www.morganstanley.com/im/shareholderreports</span>
|
|
| Expenses [Text Block] |
What were the Fund costs for the last year?(based on a hypothetical $10,000 investment) Class Name | Costs of a $10,000 investment | Costs paid as a percentage of a $10,000 investment |
|---|
Class C | $206 | 2.00% |
|---|
|
|
| Expenses Paid, Amount |
$ 206
|
|
| Expense Ratio, Percent |
2.00%
|
|
| Factors Affecting Performance [Text Block] |
How did the Fund perform last year and what affected its performance?Key contributors to (↑) and detractors from (↓) performance, relative to the MSCI All Country World ex USA Net Index: ↑ Stock selection in communication services, led by a Swedish audio streaming platform, which was the largest positive contributor in the portfolio ↑ Stock selection in information technology, led by a holding in a Taiwanese semiconductor foundry service provider ↑ No exposure to materials ↓ Stock selection in consumer discretionary, where exposure to an Italian luxury brand was the main detractor ↓ Stock selection in financials, where a position in a Pan-Asian life insurance group was the main detractor ↓ Stock selection in health care, where a provider of products and solutions in the aesthetic dentistry market was the largest detractor across the portfolio |
|
| Line Graph [Table Text Block] |
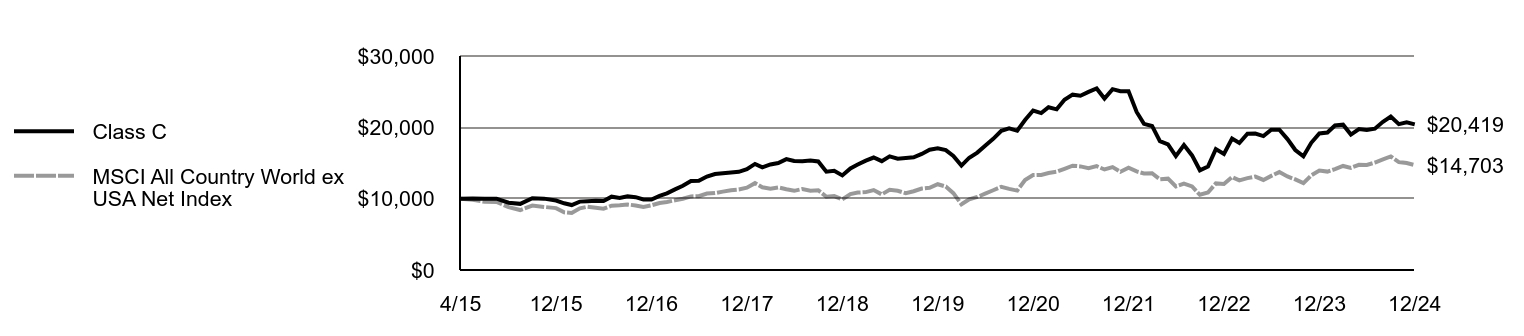 | Class C | MSCI All Country World ex USA Net Index |
|---|
4/15 | $10,000 | $10,000 |
|---|
5/15 | $10,022 | $9,844 |
|---|
6/15 | $9,986 | $9,569 |
|---|
7/15 | $10,004 | $9,543 |
|---|
8/15 | $9,428 | $8,813 |
|---|
9/15 | $9,272 | $8,405 |
|---|
10/15 | $10,056 | $9,030 |
|---|
11/15 | $10,004 | $8,844 |
|---|
12/15 | $9,737 | $8,677 |
|---|
1/16 | $9,353 | $8,087 |
|---|
2/16 | $9,103 | $7,995 |
|---|
3/16 | $9,587 | $8,645 |
|---|
4/16 | $9,645 | $8,872 |
|---|
5/16 | $9,720 | $8,722 |
|---|
6/16 | $9,687 | $8,589 |
|---|
7/16 | $10,279 | $9,014 |
|---|
8/16 | $10,112 | $9,071 |
|---|
9/16 | $10,338 | $9,183 |
|---|
10/16 | $10,212 | $9,051 |
|---|
11/16 | $9,887 | $8,841 |
|---|
12/16 | $9,871 | $9,067 |
|---|
1/17 | $10,381 | $9,389 |
|---|
2/17 | $10,737 | $9,538 |
|---|
3/17 | $11,297 | $9,780 |
|---|
4/17 | $11,807 | $9,989 |
|---|
5/17 | $12,477 | $10,314 |
|---|
6/17 | $12,494 | $10,346 |
|---|
7/17 | $13,096 | $10,727 |
|---|
8/17 | $13,453 | $10,783 |
|---|
9/17 | $13,571 | $10,983 |
|---|
10/17 | $13,665 | $11,190 |
|---|
11/17 | $13,767 | $11,281 |
|---|
12/17 | $14,132 | $11,533 |
|---|
1/18 | $14,869 | $12,175 |
|---|
2/18 | $14,383 | $11,601 |
|---|
3/18 | $14,800 | $11,397 |
|---|
4/18 | $14,999 | $11,578 |
|---|
5/18 | $15,545 | $11,311 |
|---|
6/18 | $15,285 | $11,099 |
|---|
7/18 | $15,241 | $11,364 |
|---|
8/18 | $15,345 | $11,126 |
|---|
9/18 | $15,215 | $11,177 |
|---|
10/18 | $13,775 | $10,268 |
|---|
11/18 | $13,905 | $10,365 |
|---|
12/18 | $13,259 | $9,896 |
|---|
1/19 | $14,247 | $10,643 |
|---|
2/19 | $14,777 | $10,851 |
|---|
3/19 | $15,333 | $10,916 |
|---|
4/19 | $15,765 | $11,204 |
|---|
5/19 | $15,253 | $10,603 |
|---|
6/19 | $15,933 | $11,242 |
|---|
7/19 | $15,607 | $11,105 |
|---|
8/19 | $15,695 | $10,763 |
|---|
9/19 | $15,792 | $11,039 |
|---|
10/19 | $16,269 | $11,425 |
|---|
11/19 | $16,860 | $11,525 |
|---|
12/19 | $17,067 | $12,024 |
|---|
1/20 | $16,801 | $11,701 |
|---|
2/20 | $15,988 | $10,777 |
|---|
3/20 | $14,636 | $9,216 |
|---|
4/20 | $15,741 | $9,915 |
|---|
5/20 | $16,457 | $10,239 |
|---|
6/20 | $17,429 | $10,702 |
|---|
7/20 | $18,383 | $11,179 |
|---|
8/20 | $19,515 | $11,657 |
|---|
9/20 | $19,859 | $11,371 |
|---|
10/20 | $19,515 | $11,126 |
|---|
11/20 | $21,026 | $12,623 |
|---|
12/20 | $22,362 | $13,305 |
|---|
1/21 | $21,999 | $13,334 |
|---|
2/21 | $22,822 | $13,598 |
|---|
3/21 | $22,521 | $13,770 |
|---|
4/21 | $23,874 | $14,176 |
|---|
5/21 | $24,581 | $14,619 |
|---|
6/21 | $24,431 | $14,524 |
|---|
7/21 | $24,970 | $14,285 |
|---|
8/21 | $25,457 | $14,556 |
|---|
9/21 | $24,033 | $14,090 |
|---|
10/21 | $25,351 | $14,427 |
|---|
11/21 | $25,059 | $13,777 |
|---|
12/21 | $25,059 | $14,346 |
|---|
1/22 | $22,153 | $13,818 |
|---|
2/22 | $20,490 | $13,544 |
|---|
3/22 | $20,195 | $13,566 |
|---|
4/22 | $18,068 | $12,714 |
|---|
5/22 | $17,612 | $12,805 |
|---|
6/22 | $15,967 | $11,704 |
|---|
7/22 | $17,522 | $12,104 |
|---|
8/22 | $16,065 | $11,715 |
|---|
9/22 | $13,982 | $10,544 |
|---|
10/22 | $14,510 | $10,859 |
|---|
11/22 | $16,950 | $12,141 |
|---|
12/22 | $16,262 | $12,050 |
|---|
1/23 | $18,438 | $13,028 |
|---|
2/23 | $17,810 | $12,571 |
|---|
3/23 | $19,095 | $12,878 |
|---|
4/23 | $19,133 | $13,102 |
|---|
5/23 | $18,774 | $12,625 |
|---|
6/23 | $19,675 | $13,192 |
|---|
7/23 | $19,667 | $13,728 |
|---|
8/23 | $18,354 | $13,108 |
|---|
9/23 | $16,823 | $12,694 |
|---|
10/23 | $15,948 | $12,170 |
|---|
11/23 | $17,829 | $13,266 |
|---|
12/23 | $19,150 | $13,932 |
|---|
1/24 | $19,264 | $13,794 |
|---|
2/24 | $20,253 | $14,143 |
|---|
3/24 | $20,375 | $14,585 |
|---|
4/24 | $18,984 | $14,323 |
|---|
5/24 | $19,754 | $14,739 |
|---|
6/24 | $19,614 | $14,725 |
|---|
7/24 | $19,807 | $15,066 |
|---|
8/24 | $20,769 | $15,495 |
|---|
9/24 | $21,512 | $15,912 |
|---|
10/24 | $20,454 | $15,132 |
|---|
11/24 | $20,716 | $14,995 |
|---|
12/24 | $20,419 | $14,703 |
|---|
|
|
| Average Annual Return [Table Text Block] |
AATR | 1 Year | 5 Years | Since 4/30/15
(Inception) |
|---|
Class C, with conversion to Class A after 8 years | 5.86% | 3.40% | 7.66% |
|---|
Class C, with 1% maximum contingent deferred sales charge and conversion to Class A after 8 years | 4.86% | 3.40% | 7.66% |
|---|
MSCI All Country World ex USA Net Index | 5.53% | 4.10% | 4.07% |
|---|
|
|
| Performance Inception Date |
Apr. 30, 2015
|
|
| AssetsNet |
$ 2,744,697,984
|
|
| Holdings Count | Holding |
34
|
|
| Advisory Fees Paid, Amount |
$ 23,306,085
|
|
| InvestmentCompanyPortfolioTurnover |
26.00%
|
|
| Additional Fund Statistics [Text Block] |
Total Net Assets | $2,744,697,984 |
|---|
# of Portfolio Holdings | 34 |
|---|
Portfolio Turnover Rate | 26% |
|---|
Total Advisory Fees Paid | $23,306,085 |
|---|
|
|
| Holdings [Text Block] |
Country Weightings (% of total investments)Value | Value |
|---|
Other | 15.6% | Netherlands | 5.4% | Italy | 5.4% | Taiwan | 5.5% | Switzerland | 5.7% | Sweden | 6.1% | United States | 7.8% | India | 8.2% | Denmark | 8.3% | Canada | 10.6% | France | 21.4% |
Top Ten Holdings (% of total investments)Footnote ReferenceaHermes International SCA | 8.8% | DSV AS | 8.3% | Spotify Technology SA | 6.1% | Taiwan Semiconductor Manufacturing Co. Ltd. | 5.5% | Moncler SpA | 5.4% | Schneider Electric SE | 5.2% | MercadoLibre, Inc. | 4.4% | Keyence Corp. | 4.1% | L'Oreal SA | 3.8% | ASML Holding NV | 3.8% | Total | 55.4% |
| Footnote | Description | Footnotea | Excluding cash equivalents. |
|
|
| Material Fund Change [Text Block] |
|
|
| Updated Prospectus Web Address |
<span style="box-sizing: border-box; color: rgb(0, 0, 0); display: inline; flex-wrap: nowrap; font-size: 10.6667px; font-weight: 400; grid-area: auto; line-height: 16px; margin: 0px; overflow: visible; text-align: left;">www.morganstanley.com/im/shareholderreports</span>
|
|
| C000094898 |
|
|
| Shareholder Report [Line Items] |
|
|
| Fund Name |
Morgan Stanley Institutional Fund, Inc. - International Advantage Portfolio
|
|
| Class Name |
Class I
|
|
| Trading Symbol |
MFAIX
|
|
| Annual or Semi-Annual Statement [Text Block] |
This annual shareholder report contains important information about Morgan Stanley Institutional Fund, Inc. - International Advantage Portfolio for the period of January 1, 2024 to December 31, 2024.
|
|
| Shareholder Report Annual or Semi-Annual |
Annual Shareholder Report
|
|
| Additional Information [Text Block] |
You can find additional information about the Fund at www.morganstanley.com/im/shareholderreports. You can also request this information by contacting us at 1-800-869-6397.
|
|
| Additional Information Phone Number |
1-800-869-6397
|
|
| Additional Information Website |
<span style="box-sizing: border-box; color: rgb(0, 0, 0); display: inline; flex-wrap: nowrap; font-size: 10.6667px; font-weight: 400; grid-area: auto; line-height: 16px; margin: 0px; overflow: visible; text-align: left;">www.morganstanley.com/im/shareholderreports</span>
|
|
| Expenses [Text Block] |
What were the Fund costs for the last year?(based on a hypothetical $10,000 investment) Class Name | Costs of a $10,000 investment | Costs paid as a percentage of a $10,000 investment |
|---|
Class I | $103 | 1.00% |
|---|
|
|
| Expenses Paid, Amount |
$ 103
|
|
| Expense Ratio, Percent |
1.00%
|
|
| Factors Affecting Performance [Text Block] |
How did the Fund perform last year and what affected its performance?Key contributors to (↑) and detractors from (↓) performance, relative to the MSCI All Country World ex USA Net Index: ↑ Stock selection in communication services, led by a Swedish audio streaming platform, which was the largest positive contributor in the portfolio ↑ Stock selection in information technology, led by a holding in a Taiwanese semiconductor foundry service provider ↑ No exposure to materials ↓ Stock selection in consumer discretionary, where exposure to an Italian luxury brand was the main detractor ↓ Stock selection in financials, where a position in a Pan-Asian life insurance group was the main detractor ↓ Stock selection in health care, where a provider of products and solutions in the aesthetic dentistry market was the largest detractor across the portfolio |
|
| Line Graph [Table Text Block] |
 | Class I | MSCI All Country World ex USA Net Index |
|---|
12/14 | $1,000,000 | $1,000,000 |
|---|
1/15 | $1,028,317 | $998,518 |
|---|
2/15 | $1,081,715 | $1,051,901 |
|---|
3/15 | $1,067,961 | $1,034,899 |
|---|
4/15 | $1,124,595 | $1,087,181 |
|---|
5/15 | $1,127,832 | $1,070,204 |
|---|
6/15 | $1,124,595 | $1,040,349 |
|---|
7/15 | $1,127,511 | $1,037,456 |
|---|
8/15 | $1,063,129 | $958,158 |
|---|
9/15 | $1,046,621 | $913,734 |
|---|
10/15 | $1,135,765 | $981,755 |
|---|
11/15 | $1,131,638 | $961,488 |
|---|
12/15 | $1,102,331 | $943,379 |
|---|
1/16 | $1,060,364 | $879,207 |
|---|
2/16 | $1,031,453 | $869,158 |
|---|
3/16 | $1,088,342 | $939,829 |
|---|
4/16 | $1,095,802 | $964,564 |
|---|
5/16 | $1,105,128 | $948,283 |
|---|
6/16 | $1,103,263 | $933,775 |
|---|
7/16 | $1,171,343 | $979,953 |
|---|
8/16 | $1,152,691 | $986,151 |
|---|
9/16 | $1,179,736 | $998,311 |
|---|
10/16 | $1,166,680 | $983,958 |
|---|
11/16 | $1,130,309 | $961,198 |
|---|
12/16 | $1,129,510 | $985,785 |
|---|
1/17 | $1,189,257 | $1,020,706 |
|---|
2/17 | $1,230,986 | $1,036,982 |
|---|
3/17 | $1,295,475 | $1,063,271 |
|---|
4/17 | $1,355,222 | $1,086,034 |
|---|
5/17 | $1,433,937 | $1,121,275 |
|---|
6/17 | $1,437,731 | $1,124,757 |
|---|
7/17 | $1,507,768 | $1,166,213 |
|---|
8/17 | $1,550,495 | $1,172,315 |
|---|
9/17 | $1,565,686 | $1,194,078 |
|---|
10/17 | $1,578,029 | $1,216,542 |
|---|
11/17 | $1,591,322 | $1,226,424 |
|---|
12/17 | $1,634,982 | $1,253,836 |
|---|
1/18 | $1,722,104 | $1,323,669 |
|---|
2/18 | $1,666,927 | $1,261,255 |
|---|
3/18 | $1,716,295 | $1,239,011 |
|---|
4/18 | $1,741,464 | $1,258,792 |
|---|
5/18 | $1,806,321 | $1,229,727 |
|---|
6/18 | $1,778,249 | $1,206,613 |
|---|
7/18 | $1,774,335 | $1,235,471 |
|---|
8/18 | $1,787,894 | $1,209,613 |
|---|
9/18 | $1,774,335 | $1,215,123 |
|---|
10/18 | $1,607,749 | $1,116,288 |
|---|
11/18 | $1,624,213 | $1,126,854 |
|---|
12/18 | $1,550,049 | $1,075,850 |
|---|
1/19 | $1,667,238 | $1,157,139 |
|---|
2/19 | $1,730,264 | $1,179,748 |
|---|
3/19 | $1,798,214 | $1,186,775 |
|---|
4/19 | $1,850,408 | $1,218,127 |
|---|
5/19 | $1,791,321 | $1,152,749 |
|---|
6/19 | $1,873,058 | $1,222,161 |
|---|
7/19 | $1,836,621 | $1,207,368 |
|---|
8/19 | $1,847,453 | $1,170,080 |
|---|
9/19 | $1,861,240 | $1,200,190 |
|---|
10/19 | $1,919,342 | $1,242,068 |
|---|
11/19 | $1,990,247 | $1,253,017 |
|---|
12/19 | $2,016,528 | $1,307,279 |
|---|
1/20 | $1,986,945 | $1,272,161 |
|---|
2/20 | $1,892,282 | $1,171,603 |
|---|
3/20 | $1,733,523 | $1,001,963 |
|---|
4/20 | $1,865,658 | $1,077,893 |
|---|
5/20 | $1,952,433 | $1,113,169 |
|---|
6/20 | $2,069,776 | $1,163,473 |
|---|
7/20 | $2,185,147 | $1,215,346 |
|---|
8/20 | $2,321,225 | $1,267,371 |
|---|
9/20 | $2,364,613 | $1,236,216 |
|---|
10/20 | $2,325,170 | $1,209,639 |
|---|
11/20 | $2,506,608 | $1,372,354 |
|---|
12/20 | $2,668,473 | $1,446,530 |
|---|
1/21 | $2,627,040 | $1,449,674 |
|---|
2/21 | $2,727,663 | $1,478,372 |
|---|
3/21 | $2,694,122 | $1,497,064 |
|---|
4/21 | $2,857,880 | $1,541,133 |
|---|
5/21 | $2,944,692 | $1,589,339 |
|---|
6/21 | $2,928,908 | $1,579,042 |
|---|
7/21 | $2,996,976 | $1,553,019 |
|---|
8/21 | $3,057,153 | $1,582,539 |
|---|
9/21 | $2,889,448 | $1,531,866 |
|---|
10/21 | $3,049,261 | $1,568,432 |
|---|
11/21 | $3,017,693 | $1,497,808 |
|---|
12/21 | $3,019,648 | $1,559,707 |
|---|
1/22 | $2,671,840 | $1,502,232 |
|---|
2/22 | $2,473,520 | $1,472,496 |
|---|
3/22 | $2,439,636 | $1,474,843 |
|---|
4/22 | $2,184,511 | $1,382,234 |
|---|
5/22 | $2,131,692 | $1,392,155 |
|---|
6/22 | $1,934,368 | $1,272,392 |
|---|
7/22 | $2,123,719 | $1,315,951 |
|---|
8/22 | $1,948,321 | $1,273,626 |
|---|
9/22 | $1,697,182 | $1,146,353 |
|---|
10/22 | $1,762,956 | $1,180,607 |
|---|
11/22 | $2,060,935 | $1,319,975 |
|---|
12/22 | $1,979,194 | $1,310,105 |
|---|
1/23 | $2,246,906 | $1,416,365 |
|---|
2/23 | $2,171,905 | $1,366,648 |
|---|
3/23 | $2,331,282 | $1,400,057 |
|---|
4/23 | $2,337,532 | $1,424,380 |
|---|
5/23 | $2,292,740 | $1,372,592 |
|---|
6/23 | $2,404,200 | $1,434,179 |
|---|
7/23 | $2,404,200 | $1,492,488 |
|---|
8/23 | $2,243,781 | $1,425,079 |
|---|
9/23 | $2,057,320 | $1,380,069 |
|---|
10/23 | $1,950,027 | $1,323,129 |
|---|
11/23 | $2,181,280 | $1,442,230 |
|---|
12/23 | $2,342,912 | $1,514,690 |
|---|
1/24 | $2,357,503 | $1,499,645 |
|---|
2/24 | $2,479,443 | $1,537,611 |
|---|
3/24 | $2,495,076 | $1,585,677 |
|---|
4/24 | $2,325,194 | $1,557,203 |
|---|
5/24 | $2,421,078 | $1,602,406 |
|---|
6/24 | $2,403,361 | $1,600,882 |
|---|
7/24 | $2,428,374 | $1,637,950 |
|---|
8/24 | $2,546,145 | $1,684,598 |
|---|
9/24 | $2,637,860 | $1,729,960 |
|---|
10/24 | $2,508,625 | $1,645,080 |
|---|
11/24 | $2,541,976 | $1,630,189 |
|---|
12/24 | $2,505,650 | $1,598,514 |
|---|
|
|
| Average Annual Return [Table Text Block] |
AATR | 1 Year | 5 Years | 10 Years |
|---|
Class I | 6.95% | 4.44% | 9.62% |
|---|
MSCI All Country World ex USA Net Index | 5.53% | 4.10% | 4.80% |
|---|
|
|
| AssetsNet |
$ 2,744,697,984
|
|
| Holdings Count | Holding |
34
|
|
| Advisory Fees Paid, Amount |
$ 23,306,085
|
|
| InvestmentCompanyPortfolioTurnover |
26.00%
|
|
| Additional Fund Statistics [Text Block] |
Total Net Assets | $2,744,697,984 |
|---|
# of Portfolio Holdings | 34 |
|---|
Portfolio Turnover Rate | 26% |
|---|
Total Advisory Fees Paid | $23,306,085 |
|---|
|
|
| Holdings [Text Block] |
Country Weightings (% of total investments)Value | Value |
|---|
Other | 15.6% | Netherlands | 5.4% | Italy | 5.4% | Taiwan | 5.5% | Switzerland | 5.7% | Sweden | 6.1% | United States | 7.8% | India | 8.2% | Denmark | 8.3% | Canada | 10.6% | France | 21.4% |
Top Ten Holdings (% of total investments)Footnote ReferenceaHermes International SCA | 8.8% | DSV AS | 8.3% | Spotify Technology SA | 6.1% | Taiwan Semiconductor Manufacturing Co. Ltd. | 5.5% | Moncler SpA | 5.4% | Schneider Electric SE | 5.2% | MercadoLibre, Inc. | 4.4% | Keyence Corp. | 4.1% | L'Oreal SA | 3.8% | ASML Holding NV | 3.8% | Total | 55.4% |
| Footnote | Description | Footnotea | Excluding cash equivalents. |
|
|
| Material Fund Change [Text Block] |
|
|
| Updated Prospectus Web Address |
<span style="box-sizing: border-box; color: rgb(0, 0, 0); display: inline; flex-wrap: nowrap; font-size: 10.6667px; font-weight: 400; grid-area: auto; line-height: 16px; margin: 0px; overflow: visible; text-align: left;">www.morganstanley.com/im/shareholderreports</span>
|
|
| C000094899 |
|
|
| Shareholder Report [Line Items] |
|
|
| Fund Name |
Morgan Stanley Institutional Fund, Inc. - International Advantage Portfolio
|
|
| Class Name |
Class L
|
|
| Trading Symbol |
MSALX
|
|
| Annual or Semi-Annual Statement [Text Block] |
This annual shareholder report contains important information about Morgan Stanley Institutional Fund, Inc. - International Advantage Portfolio for the period of January 1, 2024 to December 31, 2024.
|
|
| Shareholder Report Annual or Semi-Annual |
Annual Shareholder Report
|
|
| Additional Information [Text Block] |
You can find additional information about the Fund at www.morganstanley.com/im/shareholderreports. You can also request this information by contacting us at 1-800-869-6397.
|
|
| Additional Information Phone Number |
1-800-869-6397
|
|
| Additional Information Website |
<span style="box-sizing: border-box; color: rgb(0, 0, 0); display: inline; flex-wrap: nowrap; font-size: 10.6667px; font-weight: 400; grid-area: auto; line-height: 16px; margin: 0px; overflow: visible; text-align: left;">www.morganstanley.com/im/shareholderreports</span>
|
|
| Expenses [Text Block] |
What were the Fund costs for the last year?(based on a hypothetical $10,000 investment) Class Name | Costs of a $10,000 investment | Costs paid as a percentage of a $10,000 investment |
|---|
Class L | $191 | 1.85% |
|---|
|
|
| Expenses Paid, Amount |
$ 191
|
|
| Expense Ratio, Percent |
1.85%
|
|
| Factors Affecting Performance [Text Block] |
How did the Fund perform last year and what affected its performance?Key contributors to (↑) and detractors from (↓) performance, relative to the MSCI All Country World ex USA Net Index: ↑ Stock selection in communication services, led by a Swedish audio streaming platform, which was the largest positive contributor in the portfolio ↑ Stock selection in information technology, led by a holding in a Taiwanese semiconductor foundry service provider ↑ No exposure to materials ↓ Stock selection in consumer discretionary, where exposure to an Italian luxury brand was the main detractor ↓ Stock selection in financials, where a position in a Pan-Asian life insurance group was the main detractor ↓ Stock selection in health care, where a provider of products and solutions in the aesthetic dentistry market was the largest detractor across the portfolio |
|
| Line Graph [Table Text Block] |
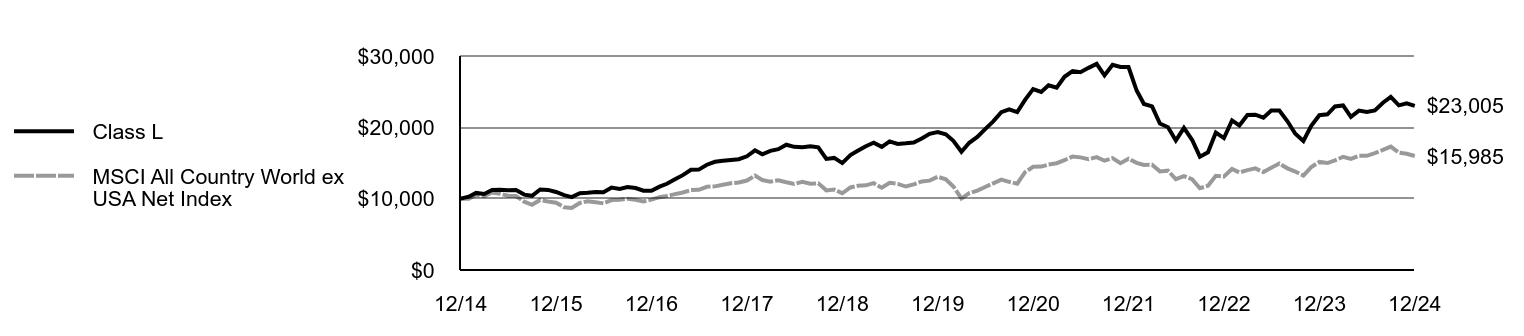 | Class L | MSCI All Country World ex USA Net Index |
|---|
12/14 | $10,000 | $10,000 |
|---|
1/15 | $10,276 | $9,985 |
|---|
2/15 | $10,804 | $10,519 |
|---|
3/15 | $10,658 | $10,349 |
|---|
4/15 | $11,210 | $10,872 |
|---|
5/15 | $11,243 | $10,702 |
|---|
6/15 | $11,194 | $10,403 |
|---|
7/15 | $11,223 | $10,375 |
|---|
8/15 | $10,569 | $9,582 |
|---|
9/15 | $10,403 | $9,137 |
|---|
10/15 | $11,281 | $9,818 |
|---|
11/15 | $11,232 | $9,615 |
|---|
12/15 | $10,934 | $9,434 |
|---|
1/16 | $10,504 | $8,792 |
|---|
2/16 | $10,224 | $8,692 |
|---|
3/16 | $10,766 | $9,398 |
|---|
4/16 | $10,831 | $9,646 |
|---|
5/16 | $10,924 | $9,483 |
|---|
6/16 | $10,896 | $9,338 |
|---|
7/16 | $11,559 | $9,800 |
|---|
8/16 | $11,373 | $9,862 |
|---|
9/16 | $11,625 | $9,983 |
|---|
10/16 | $11,494 | $9,840 |
|---|
11/16 | $11,120 | $9,612 |
|---|
12/16 | $11,113 | $9,858 |
|---|
1/17 | $11,692 | $10,207 |
|---|
2/17 | $12,091 | $10,370 |
|---|
3/17 | $12,718 | $10,633 |
|---|
4/17 | $13,297 | $10,860 |
|---|
5/17 | $14,057 | $11,213 |
|---|
6/17 | $14,076 | $11,248 |
|---|
7/17 | $14,758 | $11,662 |
|---|
8/17 | $15,167 | $11,723 |
|---|
9/17 | $15,300 | $11,941 |
|---|
10/17 | $15,414 | $12,165 |
|---|
11/17 | $15,528 | $12,264 |
|---|
12/17 | $15,937 | $12,538 |
|---|
1/18 | $16,781 | $13,237 |
|---|
2/18 | $16,228 | $12,613 |
|---|
3/18 | $16,703 | $12,390 |
|---|
4/18 | $16,936 | $12,588 |
|---|
5/18 | $17,557 | $12,297 |
|---|
6/18 | $17,266 | $12,066 |
|---|
7/18 | $17,217 | $12,355 |
|---|
8/18 | $17,333 | $12,096 |
|---|
9/18 | $17,198 | $12,151 |
|---|
10/18 | $15,567 | $11,163 |
|---|
11/18 | $15,713 | $11,269 |
|---|
12/18 | $14,989 | $10,758 |
|---|
1/19 | $16,114 | $11,571 |
|---|
2/19 | $16,707 | $11,797 |
|---|
3/19 | $17,349 | $11,868 |
|---|
4/19 | $17,842 | $12,181 |
|---|
5/19 | $17,260 | $11,527 |
|---|
6/19 | $18,030 | $12,222 |
|---|
7/19 | $17,675 | $12,074 |
|---|
8/19 | $17,763 | $11,701 |
|---|
9/19 | $17,882 | $12,002 |
|---|
10/19 | $18,425 | $12,421 |
|---|
11/19 | $19,096 | $12,530 |
|---|
12/19 | $19,337 | $13,073 |
|---|
1/20 | $19,031 | $12,722 |
|---|
2/20 | $18,111 | $11,716 |
|---|
3/20 | $16,579 | $10,020 |
|---|
4/20 | $17,835 | $10,779 |
|---|
5/20 | $18,655 | $11,132 |
|---|
6/20 | $19,753 | $11,635 |
|---|
7/20 | $20,840 | $12,153 |
|---|
8/20 | $22,125 | $12,674 |
|---|
9/20 | $22,531 | $12,362 |
|---|
10/20 | $22,135 | $12,096 |
|---|
11/20 | $23,845 | $13,724 |
|---|
12/20 | $25,360 | $14,465 |
|---|
1/21 | $24,954 | $14,497 |
|---|
2/21 | $25,884 | $14,784 |
|---|
3/21 | $25,547 | $14,971 |
|---|
4/21 | $27,090 | $15,411 |
|---|
5/21 | $27,891 | $15,893 |
|---|
6/21 | $27,723 | $15,790 |
|---|
7/21 | $28,337 | $15,530 |
|---|
8/21 | $28,890 | $15,825 |
|---|
9/21 | $27,288 | $15,319 |
|---|
10/21 | $28,772 | $15,684 |
|---|
11/21 | $28,455 | $14,978 |
|---|
12/21 | $28,455 | $15,597 |
|---|
1/22 | $25,156 | $15,022 |
|---|
2/22 | $23,276 | $14,725 |
|---|
3/22 | $22,936 | $14,748 |
|---|
4/22 | $20,526 | $13,822 |
|---|
5/22 | $20,017 | $13,922 |
|---|
6/22 | $18,147 | $12,724 |
|---|
7/22 | $19,917 | $13,160 |
|---|
8/22 | $18,257 | $12,736 |
|---|
9/22 | $15,887 | $11,464 |
|---|
10/22 | $16,497 | $11,806 |
|---|
11/22 | $19,277 | $13,200 |
|---|
12/22 | $18,497 | $13,101 |
|---|
1/23 | $20,971 | $14,164 |
|---|
2/23 | $20,269 | $13,666 |
|---|
3/23 | $21,737 | $14,001 |
|---|
4/23 | $21,779 | $14,244 |
|---|
5/23 | $21,349 | $13,726 |
|---|
6/23 | $22,366 | $14,342 |
|---|
7/23 | $22,345 | $14,925 |
|---|
8/23 | $20,845 | $14,251 |
|---|
9/23 | $19,094 | $13,801 |
|---|
10/23 | $18,088 | $13,231 |
|---|
11/23 | $20,216 | $14,422 |
|---|
12/23 | $21,705 | $15,147 |
|---|
1/24 | $21,821 | $14,996 |
|---|
2/24 | $22,932 | $15,376 |
|---|
3/24 | $23,068 | $15,857 |
|---|
4/24 | $21,475 | $15,572 |
|---|
5/24 | $22,345 | $16,024 |
|---|
6/24 | $22,167 | $16,009 |
|---|
7/24 | $22,376 | $16,379 |
|---|
8/24 | $23,446 | $16,846 |
|---|
9/24 | $24,274 | $17,300 |
|---|
10/24 | $23,079 | $16,451 |
|---|
11/24 | $23,362 | $16,302 |
|---|
12/24 | $23,005 | $15,985 |
|---|
|
|
| Average Annual Return [Table Text Block] |
AATR | 1 Year | 5 Years | 10 Years |
|---|
Class L | 5.99% | 3.53% | 8.69% |
|---|
MSCI All Country World ex USA Net Index | 5.53% | 4.10% | 4.80% |
|---|
|
|
| AssetsNet |
$ 2,744,697,984
|
|
| Holdings Count | Holding |
34
|
|
| Advisory Fees Paid, Amount |
$ 23,306,085
|
|
| InvestmentCompanyPortfolioTurnover |
26.00%
|
|
| Additional Fund Statistics [Text Block] |
Total Net Assets | $2,744,697,984 |
|---|
# of Portfolio Holdings | 34 |
|---|
Portfolio Turnover Rate | 26% |
|---|
Total Advisory Fees Paid | $23,306,085 |
|---|
|
|
| Holdings [Text Block] |
Country Weightings (% of total investments)Value | Value |
|---|
Other | 15.6% | Netherlands | 5.4% | Italy | 5.4% | Taiwan | 5.5% | Switzerland | 5.7% | Sweden | 6.1% | United States | 7.8% | India | 8.2% | Denmark | 8.3% | Canada | 10.6% | France | 21.4% |
Top Ten Holdings (% of total investments)Footnote ReferenceaHermes International SCA | 8.8% | DSV AS | 8.3% | Spotify Technology SA | 6.1% | Taiwan Semiconductor Manufacturing Co. Ltd. | 5.5% | Moncler SpA | 5.4% | Schneider Electric SE | 5.2% | MercadoLibre, Inc. | 4.4% | Keyence Corp. | 4.1% | L'Oreal SA | 3.8% | ASML Holding NV | 3.8% | Total | 55.4% |
| Footnote | Description | Footnotea | Excluding cash equivalents. |
|
|
| Material Fund Change [Text Block] |
|
|
| Updated Prospectus Web Address |
<span style="box-sizing: border-box; color: rgb(0, 0, 0); display: inline; flex-wrap: nowrap; font-size: 10.6667px; font-weight: 400; grid-area: auto; line-height: 16px; margin: 0px; overflow: visible; text-align: left;">www.morganstanley.com/im/shareholderreports</span>
|
|
| C000198826 |
|
|
| Shareholder Report [Line Items] |
|
|
| Fund Name |
Morgan Stanley Institutional Fund, Inc. - International Advantage Portfolio
|
|
| Class Name |
Class R6
|
|
| Trading Symbol |
IDVSX
|
|
| Annual or Semi-Annual Statement [Text Block] |
This annual shareholder report contains important information about Morgan Stanley Institutional Fund, Inc. - International Advantage Portfolio for the period of January 1, 2024 to December 31, 2024.
|
|
| Shareholder Report Annual or Semi-Annual |
Annual Shareholder Report
|
|
| Additional Information [Text Block] |
You can find additional information about the Fund at www.morganstanley.com/im/shareholderreports. You can also request this information by contacting us at 1-800-869-6397.
|
|
| Additional Information Phone Number |
1-800-869-6397
|
|
| Additional Information Website |
<span style="box-sizing: border-box; color: rgb(0, 0, 0); display: inline; flex-wrap: nowrap; font-size: 10.6667px; font-weight: 400; grid-area: auto; line-height: 16px; margin: 0px; overflow: visible; text-align: left;">www.morganstanley.com/im/shareholderreports</span>
|
|
| Expenses [Text Block] |
What were the Fund costs for the last year?(based on a hypothetical $10,000 investment) Class Name | Costs of a $10,000 investment | Costs paid as a percentage of a $10,000 investment |
|---|
Class R6 | $92 | 0.89% |
|---|
|
|
| Expenses Paid, Amount |
$ 92
|
|
| Expense Ratio, Percent |
0.89%
|
|
| Factors Affecting Performance [Text Block] |
How did the Fund perform last year and what affected its performance?Key contributors to (↑) and detractors from (↓) performance, relative to the MSCI All Country World ex USA Net Index: ↑ Stock selection in communication services, led by a Swedish audio streaming platform, which was the largest positive contributor in the portfolio ↑ Stock selection in information technology, led by a holding in a Taiwanese semiconductor foundry service provider ↑ No exposure to materials ↓ Stock selection in consumer discretionary, where exposure to an Italian luxury brand was the main detractor ↓ Stock selection in financials, where a position in a Pan-Asian life insurance group was the main detractor ↓ Stock selection in health care, where a provider of products and solutions in the aesthetic dentistry market was the largest detractor across the portfolio |
|
| Line Graph [Table Text Block] |
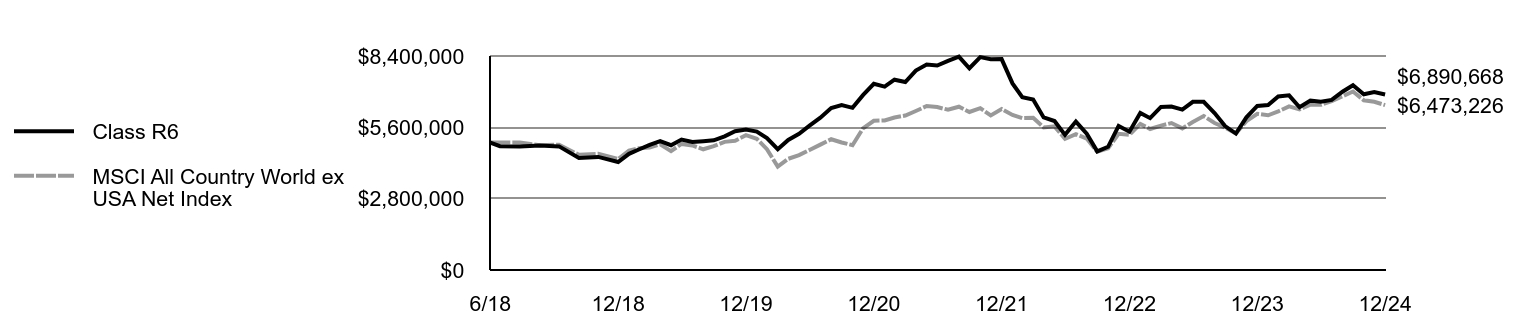 | Class R6 | MSCI All Country World ex USA Net Index |
|---|
6/18 | $5,000,000 | $5,000,000 |
|---|
6/18 | $4,859,788 | $5,000,000 |
|---|
7/18 | $4,849,092 | $5,003,075 |
|---|
8/18 | $4,886,148 | $4,898,360 |
|---|
9/18 | $4,851,739 | $4,920,675 |
|---|
10/18 | $4,396,475 | $4,520,439 |
|---|
11/18 | $4,438,825 | $4,563,225 |
|---|
12/18 | $4,238,831 | $4,356,683 |
|---|
1/19 | $4,559,098 | $4,685,865 |
|---|
2/19 | $4,731,342 | $4,777,423 |
|---|
3/19 | $4,914,352 | $4,805,878 |
|---|
4/19 | $5,059,684 | $4,932,838 |
|---|
5/19 | $4,898,204 | $4,668,088 |
|---|
6/19 | $5,121,584 | $4,949,176 |
|---|
7/19 | $5,022,005 | $4,889,271 |
|---|
8/19 | $5,051,610 | $4,738,270 |
|---|
9/19 | $5,089,288 | $4,860,204 |
|---|
10/19 | $5,248,076 | $5,029,789 |
|---|
11/19 | $5,444,542 | $5,074,127 |
|---|
12/19 | $5,516,587 | $5,293,864 |
|---|
1/20 | $5,435,699 | $5,151,653 |
|---|
2/20 | $5,176,856 | $4,744,440 |
|---|
3/20 | $4,742,755 | $4,057,478 |
|---|
4/20 | $5,106,753 | $4,364,957 |
|---|
5/20 | $5,344,025 | $4,507,810 |
|---|
6/20 | $5,664,882 | $4,711,518 |
|---|
7/20 | $5,980,347 | $4,921,577 |
|---|
8/20 | $6,355,130 | $5,132,254 |
|---|
9/20 | $6,473,766 | $5,006,091 |
|---|
10/20 | $6,365,915 | $4,898,467 |
|---|
11/20 | $6,864,727 | $5,557,384 |
|---|
12/20 | $7,307,323 | $5,857,764 |
|---|
1/21 | $7,196,728 | $5,870,495 |
|---|
2/21 | $7,469,168 | $5,986,709 |
|---|
3/21 | $7,380,153 | $6,062,403 |
|---|
4/21 | $7,827,925 | $6,240,860 |
|---|
5/21 | $8,067,996 | $6,436,073 |
|---|
6/21 | $8,024,837 | $6,394,373 |
|---|
7/21 | $8,210,960 | $6,288,993 |
|---|
8/21 | $8,378,200 | $6,408,536 |
|---|
9/21 | $7,919,638 | $6,203,332 |
|---|
10/21 | $8,356,621 | $6,351,407 |
|---|
11/21 | $8,270,303 | $6,065,416 |
|---|
12/21 | $8,278,366 | $6,316,078 |
|---|
1/22 | $7,324,637 | $6,083,330 |
|---|
2/22 | $6,782,374 | $5,962,915 |
|---|
3/22 | $6,689,727 | $5,972,419 |
|---|
4/22 | $5,989,417 | $5,597,393 |
|---|
5/22 | $5,847,720 | $5,637,572 |
|---|
6/22 | $5,305,457 | $5,152,587 |
|---|
7/22 | $5,825,921 | $5,328,978 |
|---|
8/22 | $5,346,331 | $5,157,585 |
|---|
9/22 | $4,656,922 | $4,642,187 |
|---|
10/22 | $4,836,768 | $4,780,901 |
|---|
11/22 | $5,656,974 | $5,345,275 |
|---|
12/22 | $5,430,753 | $5,305,306 |
|---|
1/23 | $6,165,485 | $5,735,610 |
|---|
2/23 | $5,960,443 | $5,534,280 |
|---|
3/23 | $6,399,004 | $5,669,569 |
|---|
4/23 | $6,416,091 | $5,768,066 |
|---|
5/23 | $6,296,483 | $5,558,350 |
|---|
6/23 | $6,601,198 | $5,807,749 |
|---|
7/23 | $6,601,198 | $6,043,871 |
|---|
8/23 | $6,162,637 | $5,770,896 |
|---|
9/23 | $5,650,033 | $5,588,627 |
|---|
10/23 | $5,356,710 | $5,358,046 |
|---|
11/23 | $5,991,769 | $5,840,350 |
|---|
12/23 | $6,437,751 | $6,133,780 |
|---|
1/24 | $6,477,684 | $6,072,853 |
|---|
2/24 | $6,814,261 | $6,226,600 |
|---|
3/24 | $6,857,046 | $6,421,243 |
|---|
4/24 | $6,389,261 | $6,305,935 |
|---|
5/24 | $6,651,677 | $6,488,988 |
|---|
6/24 | $6,606,039 | $6,482,817 |
|---|
7/24 | $6,674,496 | $6,632,924 |
|---|
8/24 | $6,999,663 | $6,821,825 |
|---|
9/24 | $7,250,670 | $7,005,520 |
|---|
10/24 | $6,896,979 | $6,661,795 |
|---|
11/24 | $6,988,254 | $6,601,494 |
|---|
12/24 | $6,890,668 | $6,473,226 |
|---|
|
|
| Average Annual Return [Table Text Block] |
AATR | 1 Year | 5 Years | Since 6/15/18
(Inception) |
|---|
Class R6 | 7.04% | 4.55% | 5.02% |
|---|
MSCI All Country World ex USA Net Index | 5.53% | 4.10% | 4.02% |
|---|
|
|
| Performance Inception Date |
Jun. 15, 2018
|
|
| AssetsNet |
$ 2,744,697,984
|
|
| Holdings Count | Holding |
34
|
|
| Advisory Fees Paid, Amount |
$ 23,306,085
|
|
| InvestmentCompanyPortfolioTurnover |
26.00%
|
|
| Additional Fund Statistics [Text Block] |
Total Net Assets | $2,744,697,984 |
|---|
# of Portfolio Holdings | 34 |
|---|
Portfolio Turnover Rate | 26% |
|---|
Total Advisory Fees Paid | $23,306,085 |
|---|
|
|
| Holdings [Text Block] |
Country Weightings (% of total investments)Value | Value |
|---|
Other | 15.6% | Netherlands | 5.4% | Italy | 5.4% | Taiwan | 5.5% | Switzerland | 5.7% | Sweden | 6.1% | United States | 7.8% | India | 8.2% | Denmark | 8.3% | Canada | 10.6% | France | 21.4% |
Top Ten Holdings (% of total investments)Footnote ReferenceaHermes International SCA | 8.8% | DSV AS | 8.3% | Spotify Technology SA | 6.1% | Taiwan Semiconductor Manufacturing Co. Ltd. | 5.5% | Moncler SpA | 5.4% | Schneider Electric SE | 5.2% | MercadoLibre, Inc. | 4.4% | Keyence Corp. | 4.1% | L'Oreal SA | 3.8% | ASML Holding NV | 3.8% | Total | 55.4% |
| Footnote | Description | Footnotea | Excluding cash equivalents. |
|
|
| Material Fund Change [Text Block] |
|
|
| Updated Prospectus Web Address |
<span style="box-sizing: border-box; color: rgb(0, 0, 0); display: inline; flex-wrap: nowrap; font-size: 10.6667px; font-weight: 400; grid-area: auto; line-height: 16px; margin: 0px; overflow: visible; text-align: left;">www.morganstanley.com/im/shareholderreports</span>
|
|
| C000007759 |
|
|
| Shareholder Report [Line Items] |
|
|
| Fund Name |
Morgan Stanley Institutional Fund, Inc. - International Equity Portfolio
|
|
| Class Name |
Class A
|
|
| Trading Symbol |
MIQBX
|
|
| Annual or Semi-Annual Statement [Text Block] |
This annual shareholder report contains important information about Morgan Stanley Institutional Fund, Inc. - International Equity Portfolio for the period of January 1, 2024 to December 31, 2024.
|
|
| Shareholder Report Annual or Semi-Annual |
Annual Shareholder Report
|
|
| Additional Information [Text Block] |
You can find additional information about the Fund at www.morganstanley.com/im/shareholderreports. You can also request this information by contacting us at 1-800-869-6397.
|
|
| Additional Information Phone Number |
1-800-869-6397
|
|
| Additional Information Website |
<span style="box-sizing: border-box; color: rgb(0, 0, 0); display: inline; flex-wrap: nowrap; font-size: 10.6667px; font-weight: 400; grid-area: auto; line-height: 16px; margin: 0px; overflow: visible; text-align: left;">www.morganstanley.com/im/shareholderreports</span>
|
|
| Expenses [Text Block] |
What were the Fund costs for the last year?(based on a hypothetical $10,000 investment) Class Name | Costs of a $10,000 investment | Costs paid as a percentage of a $10,000 investment |
|---|
Class A | $132 | 1.30% |
|---|
|
|
| Expenses Paid, Amount |
$ 132
|
|
| Expense Ratio, Percent |
1.30%
|
|
| Factors Affecting Performance [Text Block] |
How did the Fund perform last year and what affected its performance?Key contributors to (↑) and detractors from (↓) performance, relative to the MSCI EAFE Index: ↓ Sector allocation overall was marginally negative, driven by the overweight in consumer staples and underweight in financials ↓ Stock selection in industrials, consumer staples and financials ↑ Stock selection overall was marginally positive, helped by strength in materials and information technology ↑ Underweights in materials and health care and overweight in information technology |
|
| Line Graph [Table Text Block] |
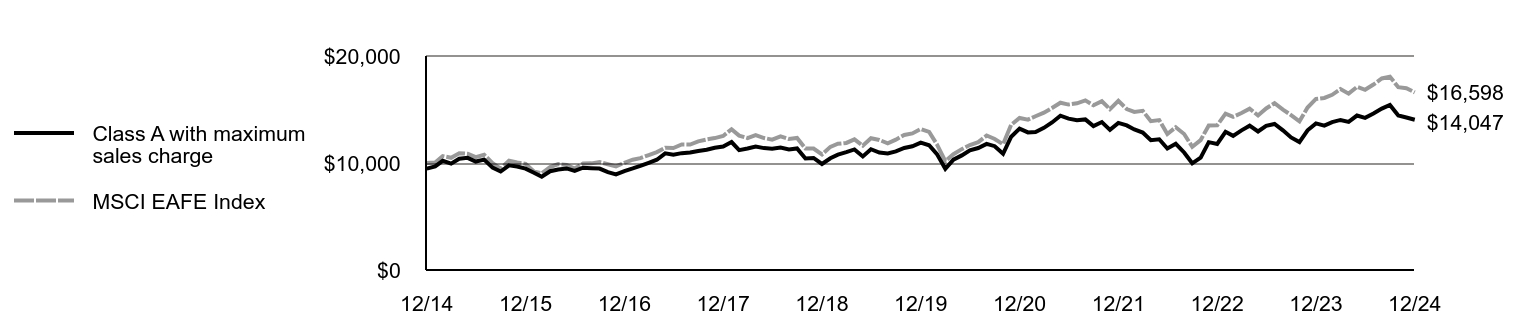 | Class A with maximum sales charge | MSCI EAFE Index |
|---|
12/14 | $9,473 | $10,000 |
|---|
1/15 | $9,684 | $10,049 |
|---|
2/15 | $10,205 | $10,650 |
|---|
3/15 | $9,938 | $10,488 |
|---|
4/15 | $10,403 | $10,916 |
|---|
5/15 | $10,484 | $10,860 |
|---|
6/15 | $10,136 | $10,552 |
|---|
7/15 | $10,311 | $10,772 |
|---|
8/15 | $9,567 | $9,979 |
|---|
9/15 | $9,205 | $9,472 |
|---|
10/15 | $9,786 | $10,213 |
|---|
11/15 | $9,667 | $10,054 |
|---|
12/15 | $9,471 | $9,919 |
|---|
1/16 | $9,096 | $9,201 |
|---|
2/16 | $8,715 | $9,033 |
|---|
3/16 | $9,230 | $9,620 |
|---|
4/16 | $9,395 | $9,899 |
|---|
5/16 | $9,490 | $9,809 |
|---|
6/16 | $9,261 | $9,480 |
|---|
7/16 | $9,557 | $9,960 |
|---|
8/16 | $9,513 | $9,967 |
|---|
9/16 | $9,481 | $10,090 |
|---|
10/16 | $9,151 | $9,883 |
|---|
11/16 | $8,934 | $9,687 |
|---|
12/16 | $9,250 | $10,018 |
|---|
1/17 | $9,493 | $10,308 |
|---|
2/17 | $9,730 | $10,456 |
|---|
3/17 | $10,018 | $10,744 |
|---|
4/17 | $10,306 | $11,017 |
|---|
5/17 | $10,901 | $11,421 |
|---|
6/17 | $10,773 | $11,401 |
|---|
7/17 | $10,922 | $11,730 |
|---|
8/17 | $10,986 | $11,726 |
|---|
9/17 | $11,128 | $12,017 |
|---|
10/17 | $11,244 | $12,200 |
|---|
11/17 | $11,430 | $12,328 |
|---|
12/17 | $11,542 | $12,526 |
|---|
1/18 | $11,958 | $13,154 |
|---|
2/18 | $11,197 | $12,560 |
|---|
3/18 | $11,353 | $12,334 |
|---|
4/18 | $11,535 | $12,615 |
|---|
5/18 | $11,392 | $12,332 |
|---|
6/18 | $11,327 | $12,181 |
|---|
7/18 | $11,442 | $12,481 |
|---|
8/18 | $11,266 | $12,240 |
|---|
9/18 | $11,357 | $12,346 |
|---|
10/18 | $10,420 | $11,364 |
|---|
11/18 | $10,472 | $11,349 |
|---|
12/18 | $9,911 | $10,798 |
|---|
1/19 | $10,443 | $11,508 |
|---|
2/19 | $10,782 | $11,801 |
|---|
3/19 | $11,011 | $11,876 |
|---|
4/19 | $11,270 | $12,210 |
|---|
5/19 | $10,613 | $11,623 |
|---|
6/19 | $11,285 | $12,313 |
|---|
7/19 | $10,982 | $12,157 |
|---|
8/19 | $10,893 | $11,842 |
|---|
9/19 | $11,085 | $12,181 |
|---|
10/19 | $11,403 | $12,619 |
|---|
11/19 | $11,558 | $12,761 |
|---|
12/19 | $11,904 | $13,176 |
|---|
1/20 | $11,661 | $12,900 |
|---|
2/20 | $10,833 | $11,734 |
|---|
3/20 | $9,462 | $10,168 |
|---|
4/20 | $10,314 | $10,825 |
|---|
5/20 | $10,711 | $11,296 |
|---|
6/20 | $11,190 | $11,681 |
|---|
7/20 | $11,401 | $11,953 |
|---|
8/20 | $11,783 | $12,568 |
|---|
9/20 | $11,572 | $12,241 |
|---|
10/20 | $10,858 | $11,752 |
|---|
11/20 | $12,456 | $13,574 |
|---|
12/20 | $13,214 | $14,205 |
|---|
1/21 | $12,862 | $14,054 |
|---|
2/21 | $12,903 | $14,369 |
|---|
3/21 | $13,288 | $14,700 |
|---|
4/21 | $13,787 | $15,142 |
|---|
5/21 | $14,417 | $15,636 |
|---|
6/21 | $14,147 | $15,460 |
|---|
7/21 | $13,991 | $15,576 |
|---|
8/21 | $14,073 | $15,851 |
|---|
9/21 | $13,443 | $15,391 |
|---|
10/21 | $13,828 | $15,769 |
|---|
11/21 | $13,099 | $15,035 |
|---|
12/21 | $13,752 | $15,805 |
|---|
1/22 | $13,516 | $15,042 |
|---|
2/22 | $13,136 | $14,776 |
|---|
3/22 | $12,846 | $14,871 |
|---|
4/22 | $12,129 | $13,909 |
|---|
5/22 | $12,220 | $14,013 |
|---|
6/22 | $11,350 | $12,713 |
|---|
7/22 | $11,794 | $13,346 |
|---|
8/22 | $10,987 | $12,712 |
|---|
9/22 | $9,972 | $11,523 |
|---|
10/22 | $10,507 | $12,143 |
|---|
11/22 | $11,948 | $13,510 |
|---|
12/22 | $11,776 | $13,521 |
|---|
1/23 | $12,916 | $14,616 |
|---|
2/23 | $12,536 | $14,311 |
|---|
3/23 | $13,053 | $14,666 |
|---|
4/23 | $13,491 | $15,080 |
|---|
5/23 | $12,945 | $14,442 |
|---|
6/23 | $13,472 | $15,099 |
|---|
7/23 | $13,647 | $15,587 |
|---|
8/23 | $13,053 | $14,990 |
|---|
9/23 | $12,390 | $14,478 |
|---|
10/23 | $11,961 | $13,891 |
|---|
11/23 | $13,053 | $15,181 |
|---|
12/23 | $13,704 | $15,987 |
|---|
1/24 | $13,495 | $16,079 |
|---|
2/24 | $13,814 | $16,373 |
|---|
3/24 | $14,024 | $16,912 |
|---|
4/24 | $13,844 | $16,479 |
|---|
5/24 | $14,434 | $17,117 |
|---|
6/24 | $14,224 | $16,841 |
|---|
7/24 | $14,623 | $17,335 |
|---|
8/24 | $15,083 | $17,899 |
|---|
9/24 | $15,423 | $18,064 |
|---|
10/24 | $14,434 | $17,082 |
|---|
11/24 | $14,254 | $16,985 |
|---|
12/24 | $14,047 | $16,598 |
|---|
|
|
| Average Annual Return [Table Text Block] |
AATR | 1 Year | 5 Years | 10 Years |
|---|
Class A | 2.50% | 3.37% | 4.02% |
|---|
Class A, with 5.25% maximum front end sales charge | (2.88)% | 2.26% | 3.46% |
|---|
MSCI EAFE Index | 3.82% | 4.73% | 5.20% |
|---|
|
|
| AssetsNet |
$ 641,571,525
|
|
| Holdings Count | Holding |
58
|
|
| Advisory Fees Paid, Amount |
$ 8,526,859
|
|
| InvestmentCompanyPortfolioTurnover |
49.00%
|
|
| Additional Fund Statistics [Text Block] |
Total Net Assets | $641,571,525 |
|---|
# of Portfolio Holdings | 58 |
|---|
Portfolio Turnover Rate | 49% |
|---|
Total Advisory Fees Paid | $8,526,859 |
|---|
|
|
| Holdings [Text Block] |
Country Weightings (% of total investments)Value | Value |
|---|
Other | 13.9% | Denmark | 3.5% | Netherlands | 4.1% | Finland | 4.4% | Sweden | 4.6% | Canada | 4.8% | China | 5.1% | Japan | 5.3% | Germany | 12.8% | France | 17.6% | United Kingdom | 23.9% |
Top Ten Holdings (% of total investments)Footnote ReferenceaSAP SE | 4.1% | L'Oreal SA | 3.4% | Halma PLC | 2.8% | Qiagen NV | 2.6% | Capgemini SE | 2.6% | Infineon Technologies AG | 2.3% | AIA Group Ltd. | 2.3% | Tencent Holdings Ltd. | 2.3% | Kone OYJ | 2.2% | AstraZeneca PLC | 2.2% | Total | 26.8% |
| Footnote | Description | Footnotea | Excluding cash equivalents. |
|
|
| Material Fund Change [Text Block] |
|
|
| Updated Prospectus Web Address |
<span style="box-sizing: border-box; color: rgb(0, 0, 0); display: inline; flex-wrap: nowrap; font-size: 10.6667px; font-weight: 400; grid-area: auto; line-height: 16px; margin: 0px; overflow: visible; text-align: left;">www.morganstanley.com/im/shareholderreports</span>
|
|
| C000155894 |
|
|
| Shareholder Report [Line Items] |
|
|
| Fund Name |
Morgan Stanley Institutional Fund, Inc. - International Equity Portfolio
|
|
| Class Name |
Class C
|
|
| Trading Symbol |
MSECX
|
|
| Annual or Semi-Annual Statement [Text Block] |
This annual shareholder report contains important information about Morgan Stanley Institutional Fund, Inc. - International Equity Portfolio for the period of January 1, 2024 to December 31, 2024.
|
|
| Shareholder Report Annual or Semi-Annual |
Annual Shareholder Report
|
|
| Additional Information [Text Block] |
You can find additional information about the Fund at www.morganstanley.com/im/shareholderreports. You can also request this information by contacting us at 1-800-869-6397.
|
|
| Additional Information Phone Number |
1-800-869-6397
|
|
| Additional Information Website |
<span style="box-sizing: border-box; color: rgb(0, 0, 0); display: inline; flex-wrap: nowrap; font-size: 10.6667px; font-weight: 400; grid-area: auto; line-height: 16px; margin: 0px; overflow: visible; text-align: left;">www.morganstanley.com/im/shareholderreports</span>
|
|
| Expenses [Text Block] |
What were the Fund costs for the last year?(based on a hypothetical $10,000 investment) Class Name | Costs of a $10,000 investment | Costs paid as a percentage of a $10,000 investment |
|---|
Class C | $207 | 2.05% |
|---|
|
|
| Expenses Paid, Amount |
$ 207
|
|
| Expense Ratio, Percent |
2.05%
|
|
| Factors Affecting Performance [Text Block] |
How did the Fund perform last year and what affected its performance?Key contributors to (↑) and detractors from (↓) performance, relative to the MSCI EAFE Index: ↓ Sector allocation overall was marginally negative, driven by the overweight in consumer staples and underweight in financials ↓ Stock selection in industrials, consumer staples and financials ↑ Stock selection overall was marginally positive, helped by strength in materials and information technology ↑ Underweights in materials and health care and overweight in information technology |
|
| Line Graph [Table Text Block] |
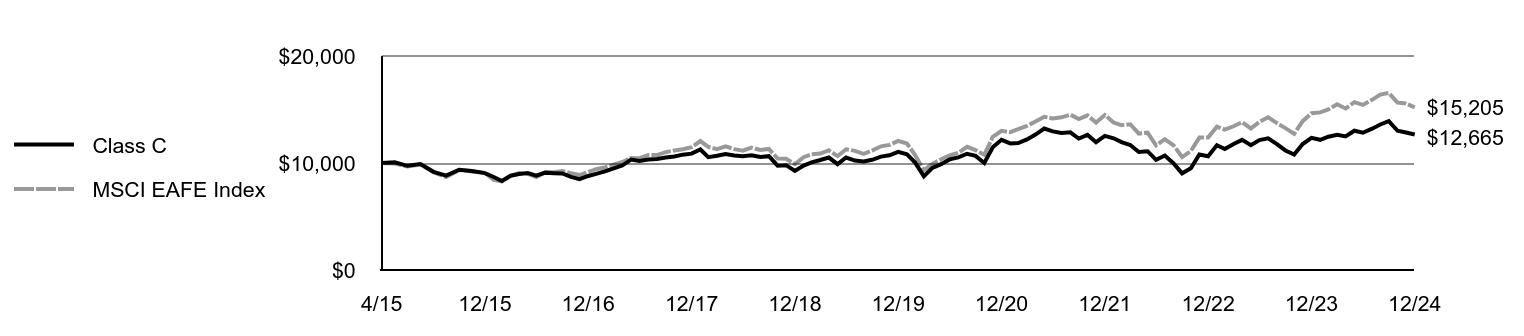 | Class C | MSCI EAFE Index |
|---|
4/15 | $10,000 | $10,000 |
|---|
5/15 | $10,066 | $9,949 |
|---|
6/15 | $9,737 | $9,667 |
|---|
7/15 | $9,900 | $9,868 |
|---|
8/15 | $9,175 | $9,142 |
|---|
9/15 | $8,818 | $8,678 |
|---|
10/15 | $9,374 | $9,356 |
|---|
11/15 | $9,259 | $9,210 |
|---|
12/15 | $9,059 | $9,086 |
|---|
1/16 | $8,691 | $8,429 |
|---|
2/16 | $8,323 | $8,275 |
|---|
3/16 | $8,814 | $8,813 |
|---|
4/16 | $8,967 | $9,068 |
|---|
5/16 | $9,053 | $8,986 |
|---|
6/16 | $8,826 | $8,684 |
|---|
7/16 | $9,099 | $9,124 |
|---|
8/16 | $9,050 | $9,131 |
|---|
9/16 | $9,020 | $9,243 |
|---|
10/16 | $8,700 | $9,054 |
|---|
11/16 | $8,485 | $8,874 |
|---|
12/16 | $8,786 | $9,177 |
|---|
1/17 | $9,007 | $9,443 |
|---|
2/17 | $9,222 | $9,578 |
|---|
3/17 | $9,499 | $9,842 |
|---|
4/17 | $9,763 | $10,092 |
|---|
5/17 | $10,315 | $10,463 |
|---|
6/17 | $10,192 | $10,444 |
|---|
7/17 | $10,323 | $10,746 |
|---|
8/17 | $10,379 | $10,742 |
|---|
9/17 | $10,508 | $11,009 |
|---|
10/17 | $10,607 | $11,176 |
|---|
11/17 | $10,780 | $11,293 |
|---|
12/17 | $10,876 | $11,475 |
|---|
1/18 | $11,261 | $12,050 |
|---|
2/18 | $10,540 | $11,506 |
|---|
3/18 | $10,683 | $11,299 |
|---|
4/18 | $10,845 | $11,557 |
|---|
5/18 | $10,702 | $11,297 |
|---|
6/18 | $10,633 | $11,159 |
|---|
7/18 | $10,731 | $11,434 |
|---|
8/18 | $10,563 | $11,213 |
|---|
9/18 | $10,637 | $11,310 |
|---|
10/18 | $9,754 | $10,410 |
|---|
11/18 | $9,797 | $10,397 |
|---|
12/18 | $9,264 | $9,892 |
|---|
1/19 | $9,753 | $10,542 |
|---|
2/19 | $10,065 | $10,811 |
|---|
3/19 | $10,277 | $10,879 |
|---|
4/19 | $10,511 | $11,185 |
|---|
5/19 | $9,895 | $10,648 |
|---|
6/19 | $10,511 | $11,280 |
|---|
7/19 | $10,228 | $11,136 |
|---|
8/19 | $10,135 | $10,848 |
|---|
9/19 | $10,298 | $11,159 |
|---|
10/19 | $10,596 | $11,560 |
|---|
11/19 | $10,723 | $11,690 |
|---|
12/19 | $11,041 | $12,070 |
|---|
1/20 | $10,809 | $11,818 |
|---|
2/20 | $10,035 | $10,749 |
|---|
3/20 | $8,757 | $9,315 |
|---|
4/20 | $9,539 | $9,917 |
|---|
5/20 | $9,895 | $10,348 |
|---|
6/20 | $10,337 | $10,701 |
|---|
7/20 | $10,523 | $10,950 |
|---|
8/20 | $10,863 | $11,513 |
|---|
9/20 | $10,670 | $11,214 |
|---|
10/20 | $10,004 | $10,766 |
|---|
11/20 | $11,475 | $12,435 |
|---|
12/20 | $12,164 | $13,013 |
|---|
1/21 | $11,830 | $12,875 |
|---|
2/21 | $11,861 | $13,163 |
|---|
3/21 | $12,203 | $13,466 |
|---|
4/21 | $12,654 | $13,871 |
|---|
5/21 | $13,222 | $14,324 |
|---|
6/21 | $12,957 | $14,162 |
|---|
7/21 | $12,802 | $14,269 |
|---|
8/21 | $12,864 | $14,521 |
|---|
9/21 | $12,281 | $14,099 |
|---|
10/21 | $12,623 | $14,446 |
|---|
11/21 | $11,946 | $13,774 |
|---|
12/21 | $12,531 | $14,479 |
|---|
1/22 | $12,308 | $13,779 |
|---|
2/22 | $11,949 | $13,536 |
|---|
3/22 | $11,683 | $13,623 |
|---|
4/22 | $11,024 | $12,741 |
|---|
5/22 | $11,101 | $12,837 |
|---|
6/22 | $10,296 | $11,646 |
|---|
7/22 | $10,698 | $12,226 |
|---|
8/22 | $9,962 | $11,645 |
|---|
9/22 | $9,036 | $10,556 |
|---|
10/22 | $9,508 | $11,124 |
|---|
11/22 | $10,801 | $12,377 |
|---|
12/22 | $10,637 | $12,387 |
|---|
1/23 | $11,670 | $13,390 |
|---|
2/23 | $11,313 | $13,110 |
|---|
3/23 | $11,780 | $13,435 |
|---|
4/23 | $12,164 | $13,814 |
|---|
5/23 | $11,672 | $13,230 |
|---|
6/23 | $12,146 | $13,832 |
|---|
7/23 | $12,305 | $14,279 |
|---|
8/23 | $11,769 | $13,732 |
|---|
9/23 | $11,171 | $13,263 |
|---|
10/23 | $10,784 | $12,726 |
|---|
11/23 | $11,769 | $13,907 |
|---|
12/23 | $12,356 | $14,646 |
|---|
1/24 | $12,167 | $14,730 |
|---|
2/24 | $12,455 | $14,999 |
|---|
3/24 | $12,645 | $15,493 |
|---|
4/24 | $12,482 | $15,096 |
|---|
5/24 | $13,014 | $15,681 |
|---|
6/24 | $12,825 | $15,428 |
|---|
7/24 | $13,185 | $15,880 |
|---|
8/24 | $13,599 | $16,397 |
|---|
9/24 | $13,905 | $16,548 |
|---|
10/24 | $13,014 | $15,648 |
|---|
11/24 | $12,852 | $15,559 |
|---|
12/24 | $12,665 | $15,205 |
|---|
|
|
| Average Annual Return [Table Text Block] |
AATR | 1 Year | 5 Years | Since 4/30/15
(Inception) |
|---|
Class C, with conversion to Class A after 8 years | 1.69% | 2.51% | 2.47% |
|---|
Class C, with 1% maximum contingent deferred sales charge and conversion to Class A after 8 years | 0.96% | 2.51% | 2.47% |
|---|
MSCI EAFE Index | 3.82% | 4.73% | 4.43% |
|---|
|
|
| Performance Inception Date |
Apr. 30, 2015
|
|
| AssetsNet |
$ 641,571,525
|
|
| Holdings Count | Holding |
58
|
|
| Advisory Fees Paid, Amount |
$ 8,526,859
|
|
| InvestmentCompanyPortfolioTurnover |
49.00%
|
|
| Additional Fund Statistics [Text Block] |
Total Net Assets | $641,571,525 |
|---|
# of Portfolio Holdings | 58 |
|---|
Portfolio Turnover Rate | 49% |
|---|
Total Advisory Fees Paid | $8,526,859 |
|---|
|
|
| Holdings [Text Block] |
Country Weightings (% of total investments)Value | Value |
|---|
Other | 13.9% | Denmark | 3.5% | Netherlands | 4.1% | Finland | 4.4% | Sweden | 4.6% | Canada | 4.8% | China | 5.1% | Japan | 5.3% | Germany | 12.8% | France | 17.6% | United Kingdom | 23.9% |
Top Ten Holdings (% of total investments)Footnote ReferenceaSAP SE | 4.1% | L'Oreal SA | 3.4% | Halma PLC | 2.8% | Qiagen NV | 2.6% | Capgemini SE | 2.6% | Infineon Technologies AG | 2.3% | AIA Group Ltd. | 2.3% | Tencent Holdings Ltd. | 2.3% | Kone OYJ | 2.2% | AstraZeneca PLC | 2.2% | Total | 26.8% |
| Footnote | Description | Footnotea | Excluding cash equivalents. |
|
|
| Material Fund Change [Text Block] |
|
|
| Updated Prospectus Web Address |
<span style="box-sizing: border-box; color: rgb(0, 0, 0); display: inline; flex-wrap: nowrap; font-size: 10.6667px; font-weight: 400; grid-area: auto; line-height: 16px; margin: 0px; overflow: visible; text-align: left;">www.morganstanley.com/im/shareholderreports</span>
|
|
| C000007758 |
|
|
| Shareholder Report [Line Items] |
|
|
| Fund Name |
Morgan Stanley Institutional Fund, Inc. - International Equity Portfolio
|
|
| Class Name |
Class I
|
|
| Trading Symbol |
MSIQX
|
|
| Annual or Semi-Annual Statement [Text Block] |
This annual shareholder report contains important information about Morgan Stanley Institutional Fund, Inc. - International Equity Portfolio for the period of January 1, 2024 to December 31, 2024.
|
|
| Shareholder Report Annual or Semi-Annual |
Annual Shareholder Report
|
|
| Additional Information [Text Block] |
You can find additional information about the Fund at www.morganstanley.com/im/shareholderreports. You can also request this information by contacting us at 1-800-869-6397.
|
|
| Additional Information Phone Number |
1-800-869-6397
|
|
| Additional Information Website |
<span style="box-sizing: border-box; color: rgb(0, 0, 0); display: inline; flex-wrap: nowrap; font-size: 10.6667px; font-weight: 400; grid-area: auto; line-height: 16px; margin: 0px; overflow: visible; text-align: left;">www.morganstanley.com/im/shareholderreports</span>
|
|
| Expenses [Text Block] |
What were the Fund costs for the last year?(based on a hypothetical $10,000 investment) Class Name | Costs of a $10,000 investment | Costs paid as a percentage of a $10,000 investment |
|---|
Class I | $96 | 0.95% |
|---|
|
|
| Expenses Paid, Amount |
$ 96
|
|
| Expense Ratio, Percent |
0.95%
|
|
| Factors Affecting Performance [Text Block] |
How did the Fund perform last year and what affected its performance?Key contributors to (↑) and detractors from (↓) performance, relative to the MSCI EAFE Index: ↓ Sector allocation overall was marginally negative, driven by the overweight in consumer staples and underweight in financials ↓ Stock selection in industrials, consumer staples and financials ↑ Stock selection overall was marginally positive, helped by strength in materials and information technology ↑ Underweights in materials and health care and overweight in information technology |
|
| Line Graph [Table Text Block] |
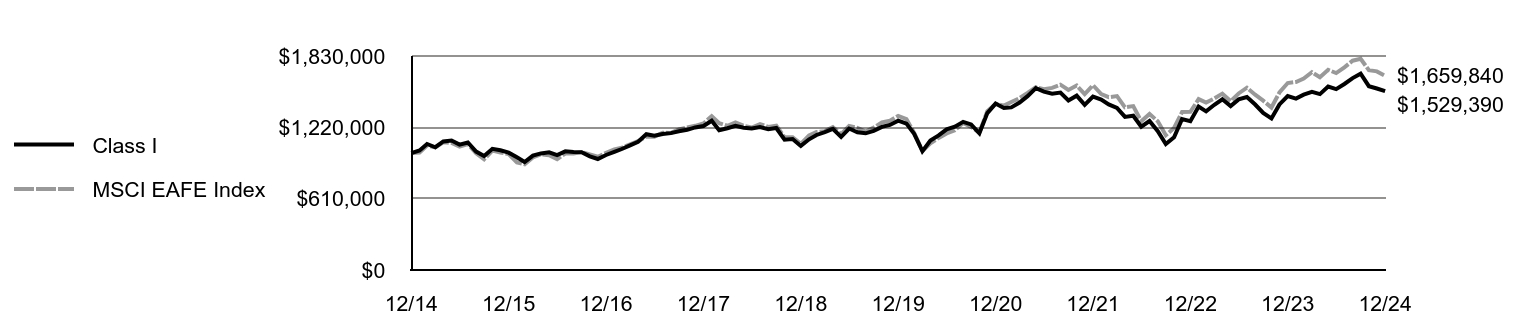 | Class I | MSCI EAFE Index |
|---|
12/14 | $1,000,000 | $1,000,000 |
|---|
1/15 | $1,022,624 | $1,004,888 |
|---|
2/15 | $1,077,569 | $1,064,962 |
|---|
3/15 | $1,049,774 | $1,048,784 |
|---|
4/15 | $1,099,548 | $1,091,604 |
|---|
5/15 | $1,107,951 | $1,086,017 |
|---|
6/15 | $1,072,398 | $1,055,246 |
|---|
7/15 | $1,090,648 | $1,077,156 |
|---|
8/15 | $1,012,419 | $997,918 |
|---|
9/15 | $973,956 | $947,248 |
|---|
10/15 | $1,035,888 | $1,021,293 |
|---|
11/15 | $1,024,153 | $1,005,405 |
|---|
12/15 | $1,003,558 | $991,858 |
|---|
1/16 | $963,681 | $920,133 |
|---|
2/16 | $923,805 | $903,276 |
|---|
3/16 | $978,303 | $962,050 |
|---|
4/16 | $996,912 | $989,902 |
|---|
5/16 | $1,006,881 | $980,909 |
|---|
6/16 | $982,955 | $947,983 |
|---|
7/16 | $1,014,601 | $996,027 |
|---|
8/16 | $1,009,944 | $996,734 |
|---|
9/16 | $1,007,283 | $1,008,979 |
|---|
10/16 | $972,021 | $988,340 |
|---|
11/16 | $949,400 | $968,656 |
|---|
12/16 | $983,513 | $1,001,779 |
|---|
1/17 | $1,009,713 | $1,030,838 |
|---|
2/17 | $1,034,570 | $1,045,579 |
|---|
3/17 | $1,066,144 | $1,074,362 |
|---|
4/17 | $1,097,047 | $1,101,699 |
|---|
5/17 | $1,160,868 | $1,142,136 |
|---|
6/17 | $1,147,432 | $1,140,116 |
|---|
7/17 | $1,163,058 | $1,173,004 |
|---|
8/17 | $1,170,496 | $1,172,562 |
|---|
9/17 | $1,186,049 | $1,201,736 |
|---|
10/17 | $1,198,896 | $1,219,984 |
|---|
11/17 | $1,219,182 | $1,232,780 |
|---|
12/17 | $1,231,017 | $1,252,568 |
|---|
1/18 | $1,276,229 | $1,315,396 |
|---|
2/18 | $1,195,395 | $1,256,024 |
|---|
3/18 | $1,212,521 | $1,233,386 |
|---|
4/18 | $1,232,387 | $1,261,548 |
|---|
5/18 | $1,217,316 | $1,233,191 |
|---|
6/18 | $1,210,465 | $1,218,124 |
|---|
7/18 | $1,223,241 | $1,248,109 |
|---|
8/18 | $1,204,718 | $1,224,005 |
|---|
9/18 | $1,214,323 | $1,234,628 |
|---|
10/18 | $1,114,844 | $1,136,361 |
|---|
11/18 | $1,120,333 | $1,134,929 |
|---|
12/18 | $1,061,112 | $1,079,835 |
|---|
1/19 | $1,117,747 | $1,150,802 |
|---|
2/19 | $1,154,716 | $1,180,138 |
|---|
3/19 | $1,179,887 | $1,187,580 |
|---|
4/19 | $1,207,418 | $1,220,969 |
|---|
5/19 | $1,137,411 | $1,162,331 |
|---|
6/19 | $1,209,778 | $1,231,286 |
|---|
7/19 | $1,178,314 | $1,215,653 |
|---|
8/19 | $1,168,875 | $1,184,160 |
|---|
9/19 | $1,189,326 | $1,218,094 |
|---|
10/19 | $1,223,936 | $1,261,859 |
|---|
11/19 | $1,240,455 | $1,276,084 |
|---|
12/19 | $1,277,288 | $1,317,556 |
|---|
1/20 | $1,252,158 | $1,290,035 |
|---|
2/20 | $1,163,770 | $1,173,419 |
|---|
3/20 | $1,016,458 | $1,016,805 |
|---|
4/20 | $1,107,445 | $1,082,493 |
|---|
5/20 | $1,150,772 | $1,129,630 |
|---|
6/20 | $1,202,765 | $1,168,094 |
|---|
7/20 | $1,226,162 | $1,195,321 |
|---|
8/20 | $1,266,889 | $1,256,773 |
|---|
9/20 | $1,245,226 | $1,224,118 |
|---|
10/20 | $1,168,970 | $1,175,240 |
|---|
11/20 | $1,341,412 | $1,357,418 |
|---|
12/20 | $1,423,146 | $1,420,533 |
|---|
1/21 | $1,385,371 | $1,405,399 |
|---|
2/21 | $1,390,642 | $1,436,921 |
|---|
3/21 | $1,431,931 | $1,469,960 |
|---|
4/21 | $1,486,397 | $1,514,190 |
|---|
5/21 | $1,554,918 | $1,563,570 |
|---|
6/21 | $1,525,050 | $1,545,974 |
|---|
7/21 | $1,508,359 | $1,557,614 |
|---|
8/21 | $1,517,144 | $1,585,089 |
|---|
9/21 | $1,449,500 | $1,539,088 |
|---|
10/21 | $1,490,789 | $1,576,943 |
|---|
11/21 | $1,412,604 | $1,503,546 |
|---|
12/21 | $1,482,728 | $1,580,533 |
|---|
1/22 | $1,457,399 | $1,504,156 |
|---|
2/22 | $1,416,483 | $1,477,560 |
|---|
3/22 | $1,386,282 | $1,487,057 |
|---|
4/22 | $1,309,321 | $1,390,852 |
|---|
5/22 | $1,319,063 | $1,401,279 |
|---|
6/22 | $1,225,540 | $1,271,258 |
|---|
7/22 | $1,274,250 | $1,334,605 |
|---|
8/22 | $1,187,546 | $1,271,218 |
|---|
9/22 | $1,077,462 | $1,152,300 |
|---|
10/22 | $1,134,940 | $1,214,264 |
|---|
11/22 | $1,290,811 | $1,351,034 |
|---|
12/22 | $1,272,472 | $1,352,119 |
|---|
1/23 | $1,397,203 | $1,461,610 |
|---|
2/23 | $1,356,325 | $1,431,111 |
|---|
3/23 | $1,412,926 | $1,466,580 |
|---|
4/23 | $1,460,093 | $1,507,986 |
|---|
5/23 | $1,401,396 | $1,444,171 |
|---|
6/23 | $1,459,045 | $1,509,894 |
|---|
7/23 | $1,478,960 | $1,558,749 |
|---|
8/23 | $1,415,022 | $1,499,030 |
|---|
9/23 | $1,342,699 | $1,447,826 |
|---|
10/23 | $1,296,580 | $1,389,129 |
|---|
11/23 | $1,416,070 | $1,518,065 |
|---|
12/23 | $1,487,584 | $1,598,718 |
|---|
1/24 | $1,465,675 | $1,607,919 |
|---|
2/24 | $1,499,633 | $1,637,351 |
|---|
3/24 | $1,523,733 | $1,691,202 |
|---|
4/24 | $1,504,015 | $1,647,893 |
|---|
5/24 | $1,568,645 | $1,711,724 |
|---|
6/24 | $1,546,737 | $1,684,090 |
|---|
7/24 | $1,590,553 | $1,733,495 |
|---|
8/24 | $1,640,943 | $1,789,862 |
|---|
9/24 | $1,678,187 | $1,806,390 |
|---|
10/24 | $1,571,931 | $1,708,157 |
|---|
11/24 | $1,552,214 | $1,698,466 |
|---|
12/24 | $1,529,390 | $1,659,840 |
|---|
|
|
| Average Annual Return [Table Text Block] |
AATR | 1 Year | 5 Years | 10 Years |
|---|
Class I | 2.81% | 3.67% | 4.34% |
|---|
MSCI EAFE Index | 3.82% | 4.73% | 5.20% |
|---|
|
|
| AssetsNet |
$ 641,571,525
|
|
| Holdings Count | Holding |
58
|
|
| Advisory Fees Paid, Amount |
$ 8,526,859
|
|
| InvestmentCompanyPortfolioTurnover |
49.00%
|
|
| Additional Fund Statistics [Text Block] |
Total Net Assets | $641,571,525 |
|---|
# of Portfolio Holdings | 58 |
|---|
Portfolio Turnover Rate | 49% |
|---|
Total Advisory Fees Paid | $8,526,859 |
|---|
|
|
| Holdings [Text Block] |
Country Weightings (% of total investments)Value | Value |
|---|
Other | 13.9% | Denmark | 3.5% | Netherlands | 4.1% | Finland | 4.4% | Sweden | 4.6% | Canada | 4.8% | China | 5.1% | Japan | 5.3% | Germany | 12.8% | France | 17.6% | United Kingdom | 23.9% |
Top Ten Holdings (% of total investments)Footnote ReferenceaSAP SE | 4.1% | L'Oreal SA | 3.4% | Halma PLC | 2.8% | Qiagen NV | 2.6% | Capgemini SE | 2.6% | Infineon Technologies AG | 2.3% | AIA Group Ltd. | 2.3% | Tencent Holdings Ltd. | 2.3% | Kone OYJ | 2.2% | AstraZeneca PLC | 2.2% | Total | 26.8% |
| Footnote | Description | Footnotea | Excluding cash equivalents. |
|
|
| Material Fund Change [Text Block] |
|
|
| Updated Prospectus Web Address |
<span style="box-sizing: border-box; color: rgb(0, 0, 0); display: inline; flex-wrap: nowrap; font-size: 10.6667px; font-weight: 400; grid-area: auto; line-height: 16px; margin: 0px; overflow: visible; text-align: left;">www.morganstanley.com/im/shareholderreports</span>
|
|
| C000113811 |
|
|
| Shareholder Report [Line Items] |
|
|
| Fund Name |
Morgan Stanley Institutional Fund, Inc. - International Equity Portfolio
|
|
| Class Name |
Class L
|
|
| Trading Symbol |
MSQLX
|
|
| Annual or Semi-Annual Statement [Text Block] |
This annual shareholder report contains important information about Morgan Stanley Institutional Fund, Inc. - International Equity Portfolio for the period of January 1, 2024 to December 31, 2024.
|
|
| Shareholder Report Annual or Semi-Annual |
Annual Shareholder Report
|
|
| Additional Information [Text Block] |
You can find additional information about the Fund at www.morganstanley.com/im/shareholderreports. You can also request this information by contacting us at 1-800-869-6397.
|
|
| Additional Information Phone Number |
1-800-869-6397
|
|
| Additional Information Website |
<span style="box-sizing: border-box; color: rgb(0, 0, 0); display: inline; flex-wrap: nowrap; font-size: 10.6667px; font-weight: 400; grid-area: auto; line-height: 16px; margin: 0px; overflow: visible; text-align: left;">www.morganstanley.com/im/shareholderreports</span>
|
|
| Expenses [Text Block] |
What were the Fund costs for the last year?(based on a hypothetical $10,000 investment) Class Name | Costs of a $10,000 investment | Costs paid as a percentage of a $10,000 investment |
|---|
Class L | $182 | 1.80% |
|---|
|
|
| Expenses Paid, Amount |
$ 182
|
|
| Expense Ratio, Percent |
1.80%
|
|
| Factors Affecting Performance [Text Block] |
How did the Fund perform last year and what affected its performance?Key contributors to (↑) and detractors from (↓) performance, relative to the MSCI EAFE Index: ↓ Sector allocation overall was marginally negative, driven by the overweight in consumer staples and underweight in financials ↓ Stock selection in industrials, consumer staples and financials ↑ Stock selection overall was marginally positive, helped by strength in materials and information technology ↑ Underweights in materials and health care and overweight in information technology |
|
| Line Graph [Table Text Block] |
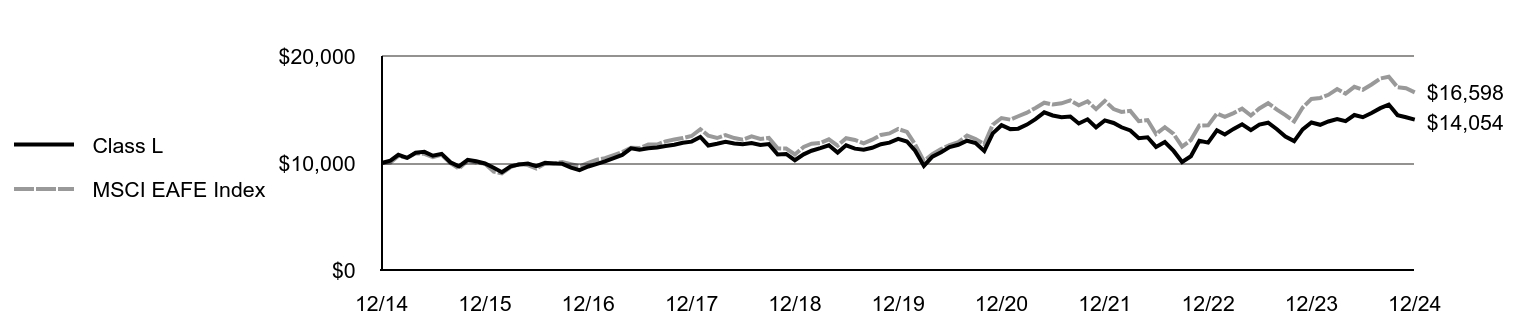 | Class L | MSCI EAFE Index |
|---|
12/14 | $10,000 | $10,000 |
|---|
1/15 | $10,217 | $10,049 |
|---|
2/15 | $10,762 | $10,650 |
|---|
3/15 | $10,479 | $10,488 |
|---|
4/15 | $10,965 | $10,916 |
|---|
5/15 | $11,044 | $10,860 |
|---|
6/15 | $10,676 | $10,552 |
|---|
7/15 | $10,855 | $10,772 |
|---|
8/15 | $10,067 | $9,979 |
|---|
9/15 | $9,683 | $9,472 |
|---|
10/15 | $10,292 | $10,213 |
|---|
11/15 | $10,160 | $10,054 |
|---|
12/15 | $9,953 | $9,919 |
|---|
1/16 | $9,551 | $9,201 |
|---|
2/16 | $9,143 | $9,033 |
|---|
3/16 | $9,685 | $9,620 |
|---|
4/16 | $9,859 | $9,899 |
|---|
5/16 | $9,946 | $9,809 |
|---|
6/16 | $9,705 | $9,480 |
|---|
7/16 | $10,010 | $9,960 |
|---|
8/16 | $9,957 | $9,967 |
|---|
9/16 | $9,923 | $10,090 |
|---|
10/16 | $9,575 | $9,883 |
|---|
11/16 | $9,340 | $9,687 |
|---|
12/16 | $9,672 | $10,018 |
|---|
1/17 | $9,920 | $10,308 |
|---|
2/17 | $10,161 | $10,456 |
|---|
3/17 | $10,463 | $10,744 |
|---|
4/17 | $10,758 | $11,017 |
|---|
5/17 | $11,368 | $11,421 |
|---|
6/17 | $11,234 | $11,401 |
|---|
7/17 | $11,376 | $11,730 |
|---|
8/17 | $11,443 | $11,726 |
|---|
9/17 | $11,585 | $12,017 |
|---|
10/17 | $11,707 | $12,200 |
|---|
11/17 | $11,896 | $12,328 |
|---|
12/17 | $11,999 | $12,526 |
|---|
1/18 | $12,432 | $13,154 |
|---|
2/18 | $11,639 | $12,560 |
|---|
3/18 | $11,795 | $12,334 |
|---|
4/18 | $11,978 | $12,615 |
|---|
5/18 | $11,822 | $12,332 |
|---|
6/18 | $11,748 | $12,181 |
|---|
7/18 | $11,861 | $12,481 |
|---|
8/18 | $11,677 | $12,240 |
|---|
9/18 | $11,766 | $12,346 |
|---|
10/18 | $10,795 | $11,364 |
|---|
11/18 | $10,842 | $11,349 |
|---|
12/18 | $10,260 | $10,798 |
|---|
1/19 | $10,809 | $11,508 |
|---|
2/19 | $11,149 | $11,801 |
|---|
3/19 | $11,388 | $11,876 |
|---|
4/19 | $11,651 | $12,210 |
|---|
5/19 | $10,971 | $11,623 |
|---|
6/19 | $11,651 | $12,313 |
|---|
7/19 | $11,342 | $12,157 |
|---|
8/19 | $11,241 | $11,842 |
|---|
9/19 | $11,427 | $12,181 |
|---|
10/19 | $11,759 | $12,619 |
|---|
11/19 | $11,906 | $12,761 |
|---|
12/19 | $12,259 | $13,176 |
|---|
1/20 | $12,005 | $12,900 |
|---|
2/20 | $11,143 | $11,734 |
|---|
3/20 | $9,731 | $10,168 |
|---|
4/20 | $10,593 | $10,825 |
|---|
5/20 | $10,999 | $11,296 |
|---|
6/20 | $11,489 | $11,681 |
|---|
7/20 | $11,701 | $11,953 |
|---|
8/20 | $12,081 | $12,568 |
|---|
9/20 | $11,870 | $12,241 |
|---|
10/20 | $11,134 | $11,752 |
|---|
11/20 | $12,766 | $13,574 |
|---|
12/20 | $13,533 | $14,205 |
|---|
1/21 | $13,167 | $14,054 |
|---|
2/21 | $13,210 | $14,369 |
|---|
3/21 | $13,592 | $14,700 |
|---|
4/21 | $14,094 | $15,142 |
|---|
5/21 | $14,732 | $15,636 |
|---|
6/21 | $14,443 | $15,460 |
|---|
7/21 | $14,273 | $15,576 |
|---|
8/21 | $14,350 | $15,851 |
|---|
9/21 | $13,695 | $15,391 |
|---|
10/21 | $14,086 | $15,769 |
|---|
11/21 | $13,329 | $15,035 |
|---|
12/21 | $13,985 | $15,805 |
|---|
1/22 | $13,742 | $15,042 |
|---|
2/22 | $13,339 | $14,776 |
|---|
3/22 | $13,039 | $14,871 |
|---|
4/22 | $12,318 | $13,909 |
|---|
5/22 | $12,402 | $14,013 |
|---|
6/22 | $11,503 | $12,713 |
|---|
7/22 | $11,962 | $13,346 |
|---|
8/22 | $11,128 | $12,712 |
|---|
9/22 | $10,098 | $11,523 |
|---|
10/22 | $10,632 | $12,143 |
|---|
11/22 | $12,084 | $13,510 |
|---|
12/22 | $11,907 | $13,521 |
|---|
1/23 | $13,057 | $14,616 |
|---|
2/23 | $12,667 | $14,311 |
|---|
3/23 | $13,187 | $14,666 |
|---|
4/23 | $13,617 | $15,080 |
|---|
5/23 | $13,067 | $14,442 |
|---|
6/23 | $13,587 | $15,099 |
|---|
7/23 | $13,767 | $15,587 |
|---|
8/23 | $13,157 | $14,990 |
|---|
9/23 | $12,477 | $14,478 |
|---|
10/23 | $12,047 | $13,891 |
|---|
11/23 | $13,137 | $15,181 |
|---|
12/23 | $13,789 | $15,987 |
|---|
1/24 | $13,572 | $16,079 |
|---|
2/24 | $13,883 | $16,373 |
|---|
3/24 | $14,100 | $16,912 |
|---|
4/24 | $13,914 | $16,479 |
|---|
5/24 | $14,484 | $17,117 |
|---|
6/24 | $14,277 | $16,841 |
|---|
7/24 | $14,671 | $17,335 |
|---|
8/24 | $15,127 | $17,899 |
|---|
9/24 | $15,459 | $18,064 |
|---|
10/24 | $14,474 | $17,082 |
|---|
11/24 | $14,277 | $16,985 |
|---|
12/24 | $14,054 | $16,598 |
|---|
|
|
| Average Annual Return [Table Text Block] |
AATR | 1 Year | 5 Years | 10 Years |
|---|
Class L | 1.92% | 2.77% | 3.46% |
|---|
MSCI EAFE Index | 3.82% | 4.73% | 5.20% |
|---|
|
|
| AssetsNet |
$ 641,571,525
|
|
| Holdings Count | Holding |
58
|
|
| Advisory Fees Paid, Amount |
$ 8,526,859
|
|
| InvestmentCompanyPortfolioTurnover |
49.00%
|
|
| Additional Fund Statistics [Text Block] |
Total Net Assets | $641,571,525 |
|---|
# of Portfolio Holdings | 58 |
|---|
Portfolio Turnover Rate | 49% |
|---|
Total Advisory Fees Paid | $8,526,859 |
|---|
|
|
| Holdings [Text Block] |
Country Weightings (% of total investments)Value | Value |
|---|
Other | 13.9% | Denmark | 3.5% | Netherlands | 4.1% | Finland | 4.4% | Sweden | 4.6% | Canada | 4.8% | China | 5.1% | Japan | 5.3% | Germany | 12.8% | France | 17.6% | United Kingdom | 23.9% |
Top Ten Holdings (% of total investments)Footnote ReferenceaSAP SE | 4.1% | L'Oreal SA | 3.4% | Halma PLC | 2.8% | Qiagen NV | 2.6% | Capgemini SE | 2.6% | Infineon Technologies AG | 2.3% | AIA Group Ltd. | 2.3% | Tencent Holdings Ltd. | 2.3% | Kone OYJ | 2.2% | AstraZeneca PLC | 2.2% | Total | 26.8% |
| Footnote | Description | Footnotea | Excluding cash equivalents. |
|
|
| Material Fund Change [Text Block] |
|
|
| Updated Prospectus Web Address |
<span style="box-sizing: border-box; color: rgb(0, 0, 0); display: inline; flex-wrap: nowrap; font-size: 10.6667px; font-weight: 400; grid-area: auto; line-height: 16px; margin: 0px; overflow: visible; text-align: left;">www.morganstanley.com/im/shareholderreports</span>
|
|
| C000126915 |
|
|
| Shareholder Report [Line Items] |
|
|
| Fund Name |
Morgan Stanley Institutional Fund, Inc. - International Equity Portfolio
|
|
| Class Name |
Class R6
|
|
| Trading Symbol |
MIQPX
|
|
| Annual or Semi-Annual Statement [Text Block] |
This annual shareholder report contains important information about Morgan Stanley Institutional Fund, Inc. - International Equity Portfolio for the period of January 1, 2024 to December 31, 2024.
|
|
| Shareholder Report Annual or Semi-Annual |
Annual Shareholder Report
|
|
| Additional Information [Text Block] |
You can find additional information about the Fund at www.morganstanley.com/im/shareholderreports. You can also request this information by contacting us at 1-800-869-6397.
|
|
| Additional Information Phone Number |
1-800-869-6397
|
|
| Additional Information Website |
<span style="box-sizing: border-box; color: rgb(0, 0, 0); display: inline; flex-wrap: nowrap; font-size: 10.6667px; font-weight: 400; grid-area: auto; line-height: 16px; margin: 0px; overflow: visible; text-align: left;">www.morganstanley.com/im/shareholderreports</span>
|
|
| Expenses [Text Block] |
What were the Fund costs for the last year?(based on a hypothetical $10,000 investment) Class Name | Costs of a $10,000 investment | Costs paid as a percentage of a $10,000 investment |
|---|
Class R6 | $92 | 0.91% |
|---|
|
|
| Expenses Paid, Amount |
$ 92
|
|
| Expense Ratio, Percent |
0.91%
|
|
| Factors Affecting Performance [Text Block] |
How did the Fund perform last year and what affected its performance?Key contributors to (↑) and detractors from (↓) performance, relative to the MSCI EAFE Index: ↓ Sector allocation overall was marginally negative, driven by the overweight in consumer staples and underweight in financials ↓ Stock selection in industrials, consumer staples and financials ↑ Stock selection overall was marginally positive, helped by strength in materials and information technology ↑ Underweights in materials and health care and overweight in information technology |
|
| Line Graph [Table Text Block] |
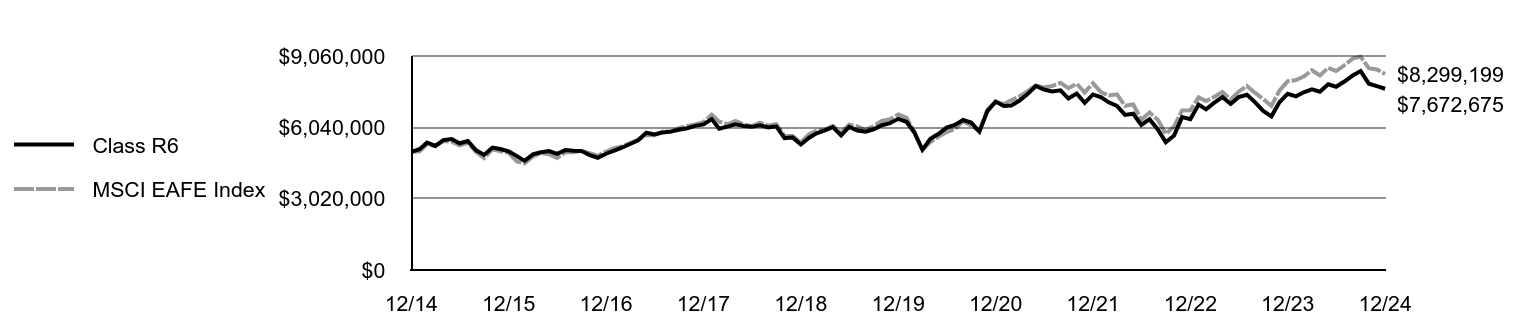 | Class R6 | MSCI EAFE Index |
|---|
12/14 | $5,000,000 | $5,000,000 |
|---|
1/15 | $5,113,122 | $5,024,442 |
|---|
2/15 | $5,391,080 | $5,324,808 |
|---|
3/15 | $5,252,101 | $5,243,918 |
|---|
4/15 | $5,500,970 | $5,458,022 |
|---|
5/15 | $5,542,986 | $5,430,084 |
|---|
6/15 | $5,365,223 | $5,276,231 |
|---|
7/15 | $5,456,474 | $5,385,782 |
|---|
8/15 | $5,065,329 | $4,989,588 |
|---|
9/15 | $4,873,016 | $4,736,239 |
|---|
10/15 | $5,182,672 | $5,106,467 |
|---|
11/15 | $5,124,000 | $5,027,027 |
|---|
12/15 | $5,020,086 | $4,959,292 |
|---|
1/16 | $4,820,613 | $4,600,666 |
|---|
2/16 | $4,621,139 | $4,516,379 |
|---|
3/16 | $4,893,753 | $4,810,248 |
|---|
4/16 | $4,986,841 | $4,949,510 |
|---|
5/16 | $5,036,709 | $4,904,547 |
|---|
6/16 | $4,917,025 | $4,739,914 |
|---|
7/16 | $5,075,328 | $4,980,136 |
|---|
8/16 | $5,052,032 | $4,983,672 |
|---|
9/16 | $5,038,719 | $5,044,893 |
|---|
10/16 | $4,865,659 | $4,941,701 |
|---|
11/16 | $4,752,504 | $4,843,282 |
|---|
12/16 | $4,922,012 | $5,008,895 |
|---|
1/17 | $5,053,131 | $5,154,191 |
|---|
2/17 | $5,177,526 | $5,227,894 |
|---|
3/17 | $5,335,542 | $5,371,811 |
|---|
4/17 | $5,490,195 | $5,508,496 |
|---|
5/17 | $5,809,588 | $5,710,680 |
|---|
6/17 | $5,742,347 | $5,700,581 |
|---|
7/17 | $5,820,548 | $5,865,018 |
|---|
8/17 | $5,857,772 | $5,862,808 |
|---|
9/17 | $5,938,989 | $6,008,678 |
|---|
10/17 | $6,003,286 | $6,099,918 |
|---|
11/17 | $6,101,423 | $6,163,902 |
|---|
12/17 | $6,163,201 | $6,262,839 |
|---|
1/18 | $6,389,563 | $6,576,980 |
|---|
2/18 | $5,984,856 | $6,280,122 |
|---|
3/18 | $6,070,599 | $6,166,931 |
|---|
4/18 | $6,170,061 | $6,307,738 |
|---|
5/18 | $6,094,607 | $6,165,953 |
|---|
6/18 | $6,060,310 | $6,090,622 |
|---|
7/18 | $6,124,274 | $6,240,544 |
|---|
8/18 | $6,031,534 | $6,120,024 |
|---|
9/18 | $6,083,056 | $6,173,138 |
|---|
10/18 | $5,581,573 | $5,681,806 |
|---|
11/18 | $5,612,486 | $5,674,646 |
|---|
12/18 | $5,314,992 | $5,399,177 |
|---|
1/19 | $5,598,669 | $5,754,012 |
|---|
2/19 | $5,783,846 | $5,900,689 |
|---|
3/19 | $5,909,925 | $5,937,898 |
|---|
4/19 | $6,047,823 | $6,104,844 |
|---|
5/19 | $5,701,107 | $5,811,653 |
|---|
6/19 | $6,059,643 | $6,156,432 |
|---|
7/19 | $5,902,045 | $6,078,265 |
|---|
8/19 | $5,854,765 | $5,920,802 |
|---|
9/19 | $5,957,204 | $6,090,468 |
|---|
10/19 | $6,130,562 | $6,309,293 |
|---|
11/19 | $6,213,301 | $6,380,419 |
|---|
12/19 | $6,400,447 | $6,587,781 |
|---|
1/20 | $6,274,522 | $6,450,177 |
|---|
2/20 | $5,831,615 | $5,867,096 |
|---|
3/20 | $5,093,436 | $5,084,024 |
|---|
4/20 | $5,553,712 | $5,412,466 |
|---|
5/20 | $5,766,481 | $5,648,151 |
|---|
6/20 | $6,027,015 | $5,840,468 |
|---|
7/20 | $6,144,255 | $5,976,603 |
|---|
8/20 | $6,348,340 | $6,283,866 |
|---|
9/20 | $6,239,784 | $6,120,590 |
|---|
10/20 | $5,857,668 | $5,876,202 |
|---|
11/20 | $6,721,772 | $6,787,092 |
|---|
12/20 | $7,129,556 | $7,102,664 |
|---|
1/21 | $6,944,602 | $7,026,993 |
|---|
2/21 | $6,966,620 | $7,184,604 |
|---|
3/21 | $7,173,593 | $7,349,801 |
|---|
4/21 | $7,446,621 | $7,570,952 |
|---|
5/21 | $7,790,108 | $7,817,849 |
|---|
6/21 | $7,640,383 | $7,729,868 |
|---|
7/21 | $7,556,713 | $7,788,070 |
|---|
8/21 | $7,605,154 | $7,925,446 |
|---|
9/21 | $7,261,667 | $7,695,442 |
|---|
10/21 | $7,473,043 | $7,884,715 |
|---|
11/21 | $7,076,712 | $7,517,731 |
|---|
12/21 | $7,431,543 | $7,902,667 |
|---|
1/22 | $7,309,394 | $7,520,779 |
|---|
2/22 | $7,099,297 | $7,387,801 |
|---|
3/22 | $6,947,833 | $7,435,286 |
|---|
4/22 | $6,566,728 | $6,954,262 |
|---|
5/22 | $6,615,587 | $7,006,397 |
|---|
6/22 | $6,141,650 | $6,356,290 |
|---|
7/22 | $6,385,947 | $6,673,024 |
|---|
8/22 | $5,951,097 | $6,356,091 |
|---|
9/22 | $5,403,870 | $5,761,498 |
|---|
10/22 | $5,692,141 | $6,071,320 |
|---|
11/22 | $6,473,895 | $6,755,169 |
|---|
12/22 | $6,380,787 | $6,760,597 |
|---|
1/23 | $7,006,767 | $7,308,050 |
|---|
2/23 | $6,801,614 | $7,155,556 |
|---|
3/23 | $7,085,672 | $7,332,900 |
|---|
4/23 | $7,322,387 | $7,539,929 |
|---|
5/23 | $7,027,808 | $7,220,854 |
|---|
6/23 | $7,317,127 | $7,549,472 |
|---|
7/23 | $7,417,073 | $7,793,747 |
|---|
8/23 | $7,096,193 | $7,495,149 |
|---|
9/23 | $6,738,490 | $7,239,132 |
|---|
10/23 | $6,507,035 | $6,945,645 |
|---|
11/23 | $7,101,453 | $7,590,324 |
|---|
12/23 | $7,463,081 | $7,993,591 |
|---|
1/24 | $7,353,088 | $8,039,593 |
|---|
2/24 | $7,523,578 | $8,186,753 |
|---|
3/24 | $7,644,571 | $8,456,012 |
|---|
4/24 | $7,545,577 | $8,239,464 |
|---|
5/24 | $7,864,559 | $8,558,619 |
|---|
6/24 | $7,760,065 | $8,420,451 |
|---|
7/24 | $7,980,052 | $8,667,477 |
|---|
8/24 | $8,233,038 | $8,949,311 |
|---|
9/24 | $8,420,028 | $9,031,952 |
|---|
10/24 | $7,886,558 | $8,540,786 |
|---|
11/24 | $7,782,064 | $8,492,330 |
|---|
12/24 | $7,672,675 | $8,299,199 |
|---|
|
|
| Average Annual Return [Table Text Block] |
AATR | 1 Year | 5 Years | 10 Years |
|---|
Class R6 | 2.81% | 3.69% | 4.38% |
|---|
MSCI EAFE Index | 3.82% | 4.73% | 5.20% |
|---|
|
|
| AssetsNet |
$ 641,571,525
|
|
| Holdings Count | Holding |
58
|
|
| Advisory Fees Paid, Amount |
$ 8,526,859
|
|
| InvestmentCompanyPortfolioTurnover |
49.00%
|
|
| Additional Fund Statistics [Text Block] |
Total Net Assets | $641,571,525 |
|---|
# of Portfolio Holdings | 58 |
|---|
Portfolio Turnover Rate | 49% |
|---|
Total Advisory Fees Paid | $8,526,859 |
|---|
|
|
| Holdings [Text Block] |
Country Weightings (% of total investments)Value | Value |
|---|
Other | 13.9% | Denmark | 3.5% | Netherlands | 4.1% | Finland | 4.4% | Sweden | 4.6% | Canada | 4.8% | China | 5.1% | Japan | 5.3% | Germany | 12.8% | France | 17.6% | United Kingdom | 23.9% |
Top Ten Holdings (% of total investments)Footnote ReferenceaSAP SE | 4.1% | L'Oreal SA | 3.4% | Halma PLC | 2.8% | Qiagen NV | 2.6% | Capgemini SE | 2.6% | Infineon Technologies AG | 2.3% | AIA Group Ltd. | 2.3% | Tencent Holdings Ltd. | 2.3% | Kone OYJ | 2.2% | AstraZeneca PLC | 2.2% | Total | 26.8% |
| Footnote | Description | Footnotea | Excluding cash equivalents. |
|
|
| Material Fund Change [Text Block] |
|
|
| Updated Prospectus Web Address |
<span style="box-sizing: border-box; color: rgb(0, 0, 0); display: inline; flex-wrap: nowrap; font-size: 10.6667px; font-weight: 400; grid-area: auto; line-height: 16px; margin: 0px; overflow: visible; text-align: left;">www.morganstanley.com/im/shareholderreports</span>
|
|
| C000085089 |
|
|
| Shareholder Report [Line Items] |
|
|
| Fund Name |
Morgan Stanley Institutional Fund, Inc. - International Opportunity Portfolio
|
|
| Class Name |
Class A
|
|
| Trading Symbol |
MIOPX
|
|
| Annual or Semi-Annual Statement [Text Block] |
This annual shareholder report contains important information about Morgan Stanley Institutional Fund, Inc. - International Opportunity Portfolio for the period of January 1, 2024 to December 31, 2024.
|
|
| Shareholder Report Annual or Semi-Annual |
Annual Shareholder Report
|
|
| Additional Information [Text Block] |
You can find additional information about the Fund at www.morganstanley.com/im/shareholderreports. You can also request this information by contacting us at 1-800-869-6397.
|
|
| Additional Information Phone Number |
1-800-869-6397
|
|
| Additional Information Website |
<span style="box-sizing: border-box; color: rgb(0, 0, 0); display: inline; flex-wrap: nowrap; font-size: 10.6667px; font-weight: 400; grid-area: auto; line-height: 16px; margin: 0px; overflow: visible; text-align: left;">www.morganstanley.com/im/shareholderreports</span>
|
|
| Expenses [Text Block] |
What were the Fund costs for the last year?(based on a hypothetical $10,000 investment) Class Name | Costs of a $10,000 investment | Costs paid as a percentage of a $10,000 investment |
|---|
Class A | $144 | 1.32% |
|---|
|
|
| Expenses Paid, Amount |
$ 144
|
|
| Expense Ratio, Percent |
1.32%
|
|
| Factors Affecting Performance [Text Block] |
How did the Fund perform last year and what affected its performance?Key contributors to (↑) and detractors from (↓) performance, relative to the MSCI All Country World ex USA Net Index: ↑ Stock selection in consumer discretionary, led by a position in a Chinese online travel agency ↑ Stock selection in communication services, led by a Swedish audio streaming platform, which was the largest positive contributor in the portfolio ↑ No exposure to materials ↓ Stock selection in financials, where a South Korean digital bank was the largest detractor across the portfolio ↓ An average overweight in consumer discretionary, where exposure to an online casino solutions company was the main detractor ↓ Stock selection in consumer staples, where a holding in a leading beauty company was the main detractor |
|
| Line Graph [Table Text Block] |
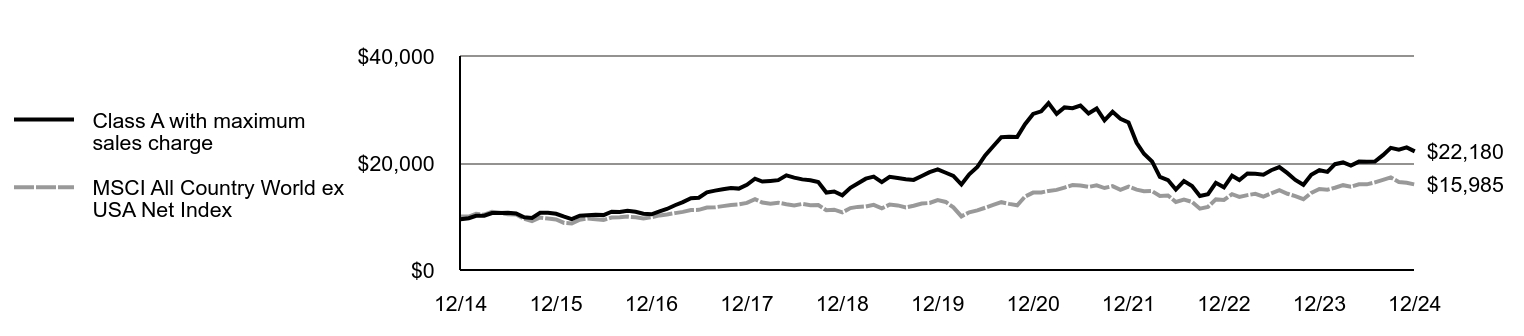 | Class A with maximum sales charge | MSCI All Country World ex USA Net Index |
|---|
12/14 | $9,474 | $10,000 |
|---|
1/15 | $9,686 | $9,985 |
|---|
2/15 | $10,123 | $10,519 |
|---|
3/15 | $10,150 | $10,349 |
|---|
4/15 | $10,656 | $10,872 |
|---|
5/15 | $10,670 | $10,702 |
|---|
6/15 | $10,704 | $10,403 |
|---|
7/15 | $10,574 | $10,375 |
|---|
8/15 | $9,857 | $9,582 |
|---|
9/15 | $9,732 | $9,137 |
|---|
10/15 | $10,679 | $9,818 |
|---|
11/15 | $10,693 | $9,615 |
|---|
12/15 | $10,515 | $9,434 |
|---|
1/16 | $9,973 | $8,792 |
|---|
2/16 | $9,515 | $8,692 |
|---|
3/16 | $10,142 | $9,398 |
|---|
4/16 | $10,247 | $9,646 |
|---|
5/16 | $10,346 | $9,483 |
|---|
6/16 | $10,261 | $9,338 |
|---|
7/16 | $10,888 | $9,800 |
|---|
8/16 | $10,825 | $9,862 |
|---|
9/16 | $11,064 | $9,983 |
|---|
10/16 | $10,874 | $9,840 |
|---|
11/16 | $10,522 | $9,612 |
|---|
12/16 | $10,409 | $9,858 |
|---|
1/17 | $10,965 | $10,207 |
|---|
2/17 | $11,402 | $10,370 |
|---|
3/17 | $12,105 | $10,633 |
|---|
4/17 | $12,690 | $10,860 |
|---|
5/17 | $13,429 | $11,213 |
|---|
6/17 | $13,520 | $11,248 |
|---|
7/17 | $14,522 | $11,662 |
|---|
8/17 | $14,832 | $11,723 |
|---|
9/17 | $15,093 | $11,941 |
|---|
10/17 | $15,326 | $12,165 |
|---|
11/17 | $15,213 | $12,264 |
|---|
12/17 | $15,927 | $12,538 |
|---|
1/18 | $17,058 | $13,237 |
|---|
2/18 | $16,529 | $12,613 |
|---|
3/18 | $16,650 | $12,390 |
|---|
4/18 | $16,793 | $12,588 |
|---|
5/18 | $17,688 | $12,297 |
|---|
6/18 | $17,266 | $12,066 |
|---|
7/18 | $16,940 | $12,355 |
|---|
8/18 | $16,768 | $12,096 |
|---|
9/18 | $16,446 | $12,151 |
|---|
10/18 | $14,473 | $11,163 |
|---|
11/18 | $14,667 | $11,269 |
|---|
12/18 | $13,958 | $10,758 |
|---|
1/19 | $15,357 | $11,571 |
|---|
2/19 | $16,160 | $11,797 |
|---|
3/19 | $17,071 | $11,868 |
|---|
4/19 | $17,466 | $12,181 |
|---|
5/19 | $16,440 | $11,527 |
|---|
6/19 | $17,430 | $12,222 |
|---|
7/19 | $17,193 | $12,074 |
|---|
8/19 | $16,971 | $11,701 |
|---|
9/19 | $16,842 | $12,002 |
|---|
10/19 | $17,559 | $12,421 |
|---|
11/19 | $18,283 | $12,530 |
|---|
12/19 | $18,814 | $13,073 |
|---|
1/20 | $18,176 | $12,722 |
|---|
2/20 | $17,602 | $11,716 |
|---|
3/20 | $15,981 | $10,020 |
|---|
4/20 | $17,882 | $10,779 |
|---|
5/20 | $19,280 | $11,132 |
|---|
6/20 | $21,404 | $11,635 |
|---|
7/20 | $23,125 | $12,153 |
|---|
8/20 | $24,818 | $12,674 |
|---|
9/20 | $24,890 | $12,362 |
|---|
10/20 | $24,882 | $12,096 |
|---|
11/20 | $27,242 | $13,724 |
|---|
12/20 | $29,173 | $14,465 |
|---|
1/21 | $29,662 | $14,497 |
|---|
2/21 | $31,186 | $14,784 |
|---|
3/21 | $29,187 | $14,971 |
|---|
4/21 | $30,388 | $15,411 |
|---|
5/21 | $30,244 | $15,893 |
|---|
6/21 | $30,726 | $15,790 |
|---|
7/21 | $29,245 | $15,530 |
|---|
8/21 | $30,187 | $15,825 |
|---|
9/21 | $27,979 | $15,319 |
|---|
10/21 | $29,568 | $15,684 |
|---|
11/21 | $28,274 | $14,978 |
|---|
12/21 | $27,567 | $15,597 |
|---|
1/22 | $23,766 | $15,022 |
|---|
2/22 | $21,721 | $14,725 |
|---|
3/22 | $20,288 | $14,748 |
|---|
4/22 | $17,412 | $13,822 |
|---|
5/22 | $16,809 | $13,922 |
|---|
6/22 | $15,030 | $12,724 |
|---|
7/22 | $16,611 | $13,160 |
|---|
8/22 | $15,706 | $12,736 |
|---|
9/22 | $13,846 | $11,464 |
|---|
10/22 | $14,170 | $11,806 |
|---|
11/22 | $16,287 | $13,200 |
|---|
12/22 | $15,449 | $13,101 |
|---|
1/23 | $17,623 | $14,164 |
|---|
2/23 | $16,826 | $13,666 |
|---|
3/23 | $18,042 | $14,001 |
|---|
4/23 | $17,977 | $14,244 |
|---|
5/23 | $17,816 | $13,726 |
|---|
6/23 | $18,653 | $14,342 |
|---|
7/23 | $19,241 | $14,925 |
|---|
8/23 | $18,098 | $14,251 |
|---|
9/23 | $16,842 | $13,801 |
|---|
10/23 | $15,932 | $13,231 |
|---|
11/23 | $17,816 | $14,422 |
|---|
12/23 | $18,653 | $15,147 |
|---|
1/24 | $18,331 | $14,996 |
|---|
2/24 | $19,780 | $15,376 |
|---|
3/24 | $20,102 | $15,857 |
|---|
4/24 | $19,531 | $15,572 |
|---|
5/24 | $20,263 | $16,024 |
|---|
6/24 | $20,223 | $16,009 |
|---|
7/24 | $20,263 | $16,379 |
|---|
8/24 | $21,471 | $16,846 |
|---|
9/24 | $22,824 | $17,300 |
|---|
10/24 | $22,477 | $16,451 |
|---|
11/24 | $22,912 | $16,302 |
|---|
12/24 | $22,180 | $15,985 |
|---|
|
|
| Average Annual Return [Table Text Block] |
AATR | 1 Year | 5 Years | 10 Years |
|---|
Class A | 18.90% | 3.35% | 8.88% |
|---|
Class A, with 5.25% maximum front end sales charge | 12.68% | 2.24% | 8.29% |
|---|
MSCI All Country World ex USA Net Index | 5.53% | 4.10% | 4.80% |
|---|
|
|
| AssetsNet |
$ 723,453,302
|
|
| Holdings Count | Holding |
34
|
|
| Advisory Fees Paid, Amount |
$ 6,950,818
|
|
| InvestmentCompanyPortfolioTurnover |
28.00%
|
|
| Additional Fund Statistics [Text Block] |
Total Net Assets | $723,453,302 |
|---|
# of Portfolio Holdings | 34 |
|---|
Portfolio Turnover Rate | 28% |
|---|
Total Advisory Fees Paid | $6,950,818 |
|---|
|
|
| Holdings [Text Block] |
Country Weightings (% of total investments)Value | Value |
|---|
Other | 18.8% | Canada | 4.4% | Sweden | 4.8% | Brazil | 5.1% | Japan | 5.8% | Denmark | 6.5% | Korea, Republic of | 6.5% | United States | 9.8% | France | 12.0% | China | 13.1% | India | 13.2% |
Top Ten Holdings (% of total investments)Footnote ReferenceaDSV AS | 6.5% | MercadoLibre, Inc. | 5.6% | Spotify Technology SA | 4.8% | Hermes International SCA | 4.3% | Trip.com Group Ltd. | 4.3% | Coupang, Inc. | 4.3% | ICICI Bank Ltd. | 4.2% | Taiwan Semiconductor Manufacturing Co. Ltd. | 4.1% | Schneider Electric SE | 4.0% | Meituan | 4.0% | Total | 46.1% |
| Footnote | Description | Footnotea | Excluding cash equivalents. |
|
|
| Material Fund Change [Text Block] |
|
|
| Updated Prospectus Web Address |
<span style="box-sizing: border-box; color: rgb(0, 0, 0); display: inline; flex-wrap: nowrap; font-size: 10.6667px; font-weight: 400; grid-area: auto; line-height: 16px; margin: 0px; overflow: visible; text-align: left;">www.morganstanley.com/im/shareholderreports</span>
|
|
| C000155897 |
|
|
| Shareholder Report [Line Items] |
|
|
| Fund Name |
Morgan Stanley Institutional Fund, Inc. - International Opportunity Portfolio
|
|
| Class Name |
Class C
|
|
| Trading Symbol |
MSOCX
|
|
| Annual or Semi-Annual Statement [Text Block] |
This annual shareholder report contains important information about Morgan Stanley Institutional Fund, Inc. - International Opportunity Portfolio for the period of January 1, 2024 to December 31, 2024.
|
|
| Shareholder Report Annual or Semi-Annual |
Annual Shareholder Report
|
|
| Additional Information [Text Block] |
You can find additional information about the Fund at www.morganstanley.com/im/shareholderreports. You can also request this information by contacting us at 1-800-869-6397.
|
|
| Additional Information Phone Number |
1-800-869-6397
|
|
| Additional Information Website |
<span style="box-sizing: border-box; color: rgb(0, 0, 0); display: inline; flex-wrap: nowrap; font-size: 10.6667px; font-weight: 400; grid-area: auto; line-height: 16px; margin: 0px; overflow: visible; text-align: left;">www.morganstanley.com/im/shareholderreports</span>
|
|
| Expenses [Text Block] |
What were the Fund costs for the last year?(based on a hypothetical $10,000 investment) Class Name | Costs of a $10,000 investment | Costs paid as a percentage of a $10,000 investment |
|---|
Class C | $225 | 2.06% |
|---|
|
|
| Expenses Paid, Amount |
$ 225
|
|
| Expense Ratio, Percent |
2.06%
|
|
| Factors Affecting Performance [Text Block] |
How did the Fund perform last year and what affected its performance?Key contributors to (↑) and detractors from (↓) performance, relative to the MSCI All Country World ex USA Net Index: ↑ Stock selection in consumer discretionary, led by a position in a Chinese online travel agency ↑ Stock selection in communication services, led by a Swedish audio streaming platform, which was the largest positive contributor in the portfolio ↑ No exposure to materials ↓ Stock selection in financials, where a South Korean digital bank was the largest detractor across the portfolio ↓ An average overweight in consumer discretionary, where exposure to an online casino solutions company was the main detractor ↓ Stock selection in consumer staples, where a holding in a leading beauty company was the main detractor |
|
| Line Graph [Table Text Block] |
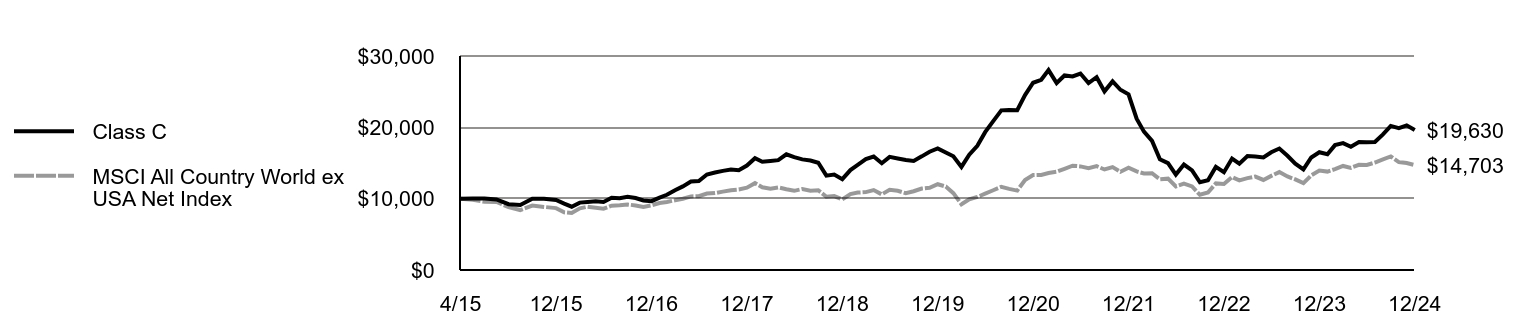 | Class C | MSCI All Country World ex USA Net Index |
|---|
4/15 | $10,000 | $10,000 |
|---|
5/15 | $10,006 | $9,844 |
|---|
6/15 | $10,032 | $9,569 |
|---|
7/15 | $9,898 | $9,543 |
|---|
8/15 | $9,222 | $8,813 |
|---|
9/15 | $9,103 | $8,405 |
|---|
10/15 | $9,984 | $9,030 |
|---|
11/15 | $9,991 | $8,844 |
|---|
12/15 | $9,815 | $8,677 |
|---|
1/16 | $9,299 | $8,087 |
|---|
2/16 | $8,870 | $7,995 |
|---|
3/16 | $9,446 | $8,645 |
|---|
4/16 | $9,540 | $8,872 |
|---|
5/16 | $9,620 | $8,722 |
|---|
6/16 | $9,533 | $8,589 |
|---|
7/16 | $10,117 | $9,014 |
|---|
8/16 | $10,050 | $9,071 |
|---|
9/16 | $10,271 | $9,183 |
|---|
10/16 | $10,083 | $9,051 |
|---|
11/16 | $9,755 | $8,841 |
|---|
12/16 | $9,647 | $9,067 |
|---|
1/17 | $10,150 | $9,389 |
|---|
2/17 | $10,546 | $9,538 |
|---|
3/17 | $11,189 | $9,780 |
|---|
4/17 | $11,719 | $9,989 |
|---|
5/17 | $12,396 | $10,314 |
|---|
6/17 | $12,476 | $10,346 |
|---|
7/17 | $13,391 | $10,727 |
|---|
8/17 | $13,666 | $10,783 |
|---|
9/17 | $13,901 | $10,983 |
|---|
10/17 | $14,102 | $11,190 |
|---|
11/17 | $13,995 | $11,281 |
|---|
12/17 | $14,642 | $11,533 |
|---|
1/18 | $15,672 | $12,175 |
|---|
2/18 | $15,181 | $11,601 |
|---|
3/18 | $15,283 | $11,397 |
|---|
4/18 | $15,399 | $11,578 |
|---|
5/18 | $16,211 | $11,311 |
|---|
6/18 | $15,815 | $11,099 |
|---|
7/18 | $15,505 | $11,364 |
|---|
8/18 | $15,341 | $11,126 |
|---|
9/18 | $15,040 | $11,177 |
|---|
10/18 | $13,222 | $10,268 |
|---|
11/18 | $13,393 | $10,365 |
|---|
12/18 | $12,738 | $9,896 |
|---|
1/19 | $14,009 | $10,643 |
|---|
2/19 | $14,734 | $10,851 |
|---|
3/19 | $15,555 | $10,916 |
|---|
4/19 | $15,910 | $11,204 |
|---|
5/19 | $14,967 | $10,603 |
|---|
6/19 | $15,856 | $11,242 |
|---|
7/19 | $15,630 | $11,105 |
|---|
8/19 | $15,411 | $10,763 |
|---|
9/19 | $15,295 | $11,039 |
|---|
10/19 | $15,931 | $11,425 |
|---|
11/19 | $16,580 | $11,525 |
|---|
12/19 | $17,052 | $12,024 |
|---|
1/20 | $16,464 | $11,701 |
|---|
2/20 | $15,938 | $10,777 |
|---|
3/20 | $14,454 | $9,216 |
|---|
4/20 | $16,170 | $9,915 |
|---|
5/20 | $17,421 | $10,239 |
|---|
6/20 | $19,322 | $10,702 |
|---|
7/20 | $20,867 | $11,179 |
|---|
8/20 | $22,378 | $11,657 |
|---|
9/20 | $22,433 | $11,371 |
|---|
10/20 | $22,412 | $11,126 |
|---|
11/20 | $24,525 | $12,623 |
|---|
12/20 | $26,249 | $13,305 |
|---|
1/21 | $26,667 | $13,334 |
|---|
2/21 | $28,025 | $13,598 |
|---|
3/21 | $26,215 | $13,770 |
|---|
4/21 | $27,271 | $14,176 |
|---|
5/21 | $27,127 | $14,619 |
|---|
6/21 | $27,545 | $14,524 |
|---|
7/21 | $26,201 | $14,285 |
|---|
8/21 | $27,031 | $14,556 |
|---|
9/21 | $25,043 | $14,090 |
|---|
10/21 | $26,441 | $14,427 |
|---|
11/21 | $25,269 | $13,777 |
|---|
12/21 | $24,629 | $14,346 |
|---|
1/22 | $21,217 | $13,818 |
|---|
2/22 | $19,392 | $13,544 |
|---|
3/22 | $18,100 | $13,566 |
|---|
4/22 | $15,523 | $12,714 |
|---|
5/22 | $14,983 | $12,805 |
|---|
6/22 | $13,382 | $11,704 |
|---|
7/22 | $14,779 | $12,104 |
|---|
8/22 | $13,965 | $11,715 |
|---|
9/22 | $12,301 | $10,544 |
|---|
10/22 | $12,581 | $10,859 |
|---|
11/22 | $14,456 | $12,141 |
|---|
12/22 | $13,704 | $12,050 |
|---|
1/23 | $15,624 | $13,028 |
|---|
2/23 | $14,904 | $12,571 |
|---|
3/23 | $15,973 | $12,878 |
|---|
4/23 | $15,911 | $13,102 |
|---|
5/23 | $15,768 | $12,625 |
|---|
6/23 | $16,509 | $13,192 |
|---|
7/23 | $17,030 | $13,728 |
|---|
8/23 | $16,018 | $13,108 |
|---|
9/23 | $14,906 | $12,694 |
|---|
10/23 | $14,101 | $12,170 |
|---|
11/23 | $15,768 | $13,266 |
|---|
12/23 | $16,509 | $13,932 |
|---|
1/24 | $16,224 | $13,794 |
|---|
2/24 | $17,507 | $14,143 |
|---|
3/24 | $17,792 | $14,585 |
|---|
4/24 | $17,286 | $14,323 |
|---|
5/24 | $17,934 | $14,739 |
|---|
6/24 | $17,899 | $14,725 |
|---|
7/24 | $17,934 | $15,066 |
|---|
8/24 | $19,003 | $15,495 |
|---|
9/24 | $20,200 | $15,912 |
|---|
10/24 | $19,894 | $15,132 |
|---|
11/24 | $20,279 | $14,995 |
|---|
12/24 | $19,630 | $14,703 |
|---|
|
|
| Average Annual Return [Table Text Block] |
AATR | 1 Year | 5 Years | Since 4/30/15
(Inception) |
|---|
Class C, with conversion to Class A after 8 years | 18.06% | 2.60% | 7.22% |
|---|
Class C, with 1% maximum contingent deferred sales charge and conversion to Class A after 8 years | 17.06% | 2.60% | 7.22% |
|---|
MSCI All Country World ex USA Net Index | 5.53% | 4.10% | 4.07% |
|---|
|
|
| Performance Inception Date |
Apr. 30, 2015
|
|
| AssetsNet |
$ 723,453,302
|
|
| Holdings Count | Holding |
34
|
|
| Advisory Fees Paid, Amount |
$ 6,950,818
|
|
| InvestmentCompanyPortfolioTurnover |
28.00%
|
|
| Additional Fund Statistics [Text Block] |
Total Net Assets | $723,453,302 |
|---|
# of Portfolio Holdings | 34 |
|---|
Portfolio Turnover Rate | 28% |
|---|
Total Advisory Fees Paid | $6,950,818 |
|---|
|
|
| Holdings [Text Block] |
Country Weightings (% of total investments)Value | Value |
|---|
Other | 18.8% | Canada | 4.4% | Sweden | 4.8% | Brazil | 5.1% | Japan | 5.8% | Denmark | 6.5% | Korea, Republic of | 6.5% | United States | 9.8% | France | 12.0% | China | 13.1% | India | 13.2% |
Top Ten Holdings (% of total investments)Footnote ReferenceaDSV AS | 6.5% | MercadoLibre, Inc. | 5.6% | Spotify Technology SA | 4.8% | Hermes International SCA | 4.3% | Trip.com Group Ltd. | 4.3% | Coupang, Inc. | 4.3% | ICICI Bank Ltd. | 4.2% | Taiwan Semiconductor Manufacturing Co. Ltd. | 4.1% | Schneider Electric SE | 4.0% | Meituan | 4.0% | Total | 46.1% |
| Footnote | Description | Footnotea | Excluding cash equivalents. |
|
|
| Material Fund Change [Text Block] |
|
|
| Updated Prospectus Web Address |
<span style="box-sizing: border-box; color: rgb(0, 0, 0); display: inline; flex-wrap: nowrap; font-size: 10.6667px; font-weight: 400; grid-area: auto; line-height: 16px; margin: 0px; overflow: visible; text-align: left;">www.morganstanley.com/im/shareholderreports</span>
|
|
| C000085087 |
|
|
| Shareholder Report [Line Items] |
|
|
| Fund Name |
Morgan Stanley Institutional Fund, Inc. - International Opportunity Portfolio
|
|
| Class Name |
Class I
|
|
| Trading Symbol |
MIOIX
|
|
| Annual or Semi-Annual Statement [Text Block] |
This annual shareholder report contains important information about Morgan Stanley Institutional Fund, Inc. - International Opportunity Portfolio for the period of January 1, 2024 to December 31, 2024.
|
|
| Shareholder Report Annual or Semi-Annual |
Annual Shareholder Report
|
|
| Additional Information [Text Block] |
You can find additional information about the Fund at www.morganstanley.com/im/shareholderreports. You can also request this information by contacting us at 1-800-869-6397.
|
|
| Additional Information Phone Number |
1-800-869-6397
|
|
| Additional Information Website |
<span style="box-sizing: border-box; color: rgb(0, 0, 0); display: inline; flex-wrap: nowrap; font-size: 10.6667px; font-weight: 400; grid-area: auto; line-height: 16px; margin: 0px; overflow: visible; text-align: left;">www.morganstanley.com/im/shareholderreports</span>
|
|
| Expenses [Text Block] |
What were the Fund costs for the last year?(based on a hypothetical $10,000 investment) Class Name | Costs of a $10,000 investment | Costs paid as a percentage of a $10,000 investment |
|---|
Class I | $110 | 1.00% |
|---|
|
|
| Expenses Paid, Amount |
$ 110
|
|
| Expense Ratio, Percent |
1.00%
|
|
| Factors Affecting Performance [Text Block] |
How did the Fund perform last year and what affected its performance?Key contributors to (↑) and detractors from (↓) performance, relative to the MSCI All Country World ex USA Net Index: ↑ Stock selection in consumer discretionary, led by a position in a Chinese online travel agency ↑ Stock selection in communication services, led by a Swedish audio streaming platform, which was the largest positive contributor in the portfolio ↑ No exposure to materials ↓ Stock selection in financials, where a South Korean digital bank was the largest detractor across the portfolio ↓ An average overweight in consumer discretionary, where exposure to an online casino solutions company was the main detractor ↓ Stock selection in consumer staples, where a holding in a leading beauty company was the main detractor |
|
| Line Graph [Table Text Block] |
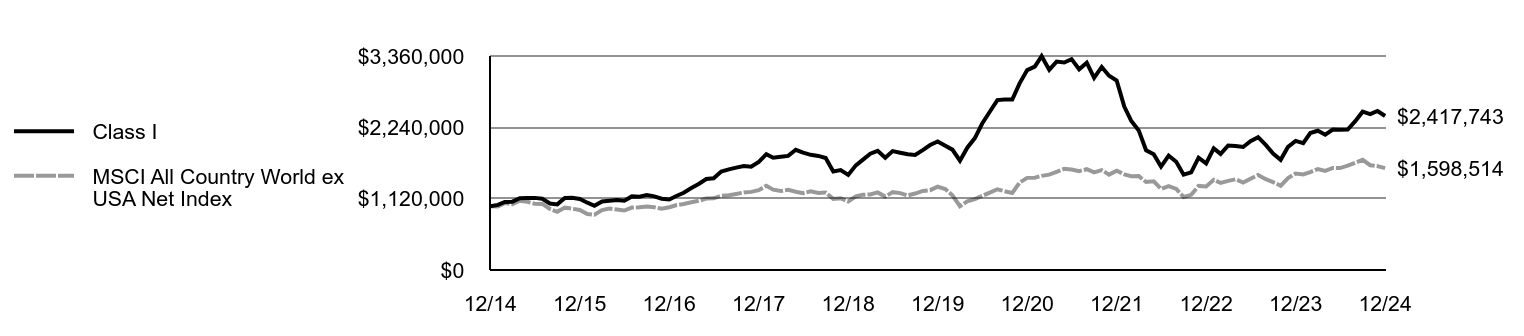 | Class I | MSCI All Country World ex USA Net Index |
|---|
12/14 | $1,000,000 | $1,000,000 |
|---|
1/15 | $1,023,005 | $998,518 |
|---|
2/15 | $1,069,015 | $1,051,901 |
|---|
3/15 | $1,072,610 | $1,034,899 |
|---|
4/15 | $1,126,528 | $1,087,181 |
|---|
5/15 | $1,128,684 | $1,070,204 |
|---|
6/15 | $1,132,279 | $1,040,349 |
|---|
7/15 | $1,118,779 | $1,037,456 |
|---|
8/15 | $1,043,265 | $958,158 |
|---|
9/15 | $1,030,068 | $913,734 |
|---|
10/15 | $1,131,242 | $981,755 |
|---|
11/15 | $1,132,709 | $961,488 |
|---|
12/15 | $1,113,965 | $943,379 |
|---|
1/16 | $1,056,895 | $879,207 |
|---|
2/16 | $1,008,720 | $869,158 |
|---|
3/16 | $1,075,424 | $939,829 |
|---|
4/16 | $1,087,283 | $964,565 |
|---|
5/16 | $1,097,659 | $948,283 |
|---|
6/16 | $1,088,765 | $933,775 |
|---|
7/16 | $1,155,667 | $979,953 |
|---|
8/16 | $1,149,737 | $986,151 |
|---|
9/16 | $1,175,682 | $998,311 |
|---|
10/16 | $1,155,667 | $983,958 |
|---|
11/16 | $1,118,603 | $961,199 |
|---|
12/16 | $1,106,742 | $985,785 |
|---|
1/17 | $1,166,045 | $1,020,706 |
|---|
2/17 | $1,212,747 | $1,036,982 |
|---|
3/17 | $1,288,358 | $1,063,271 |
|---|
4/17 | $1,349,885 | $1,086,034 |
|---|
5/17 | $1,429,203 | $1,121,275 |
|---|
6/17 | $1,439,581 | $1,124,757 |
|---|
7/17 | $1,545,856 | $1,166,213 |
|---|
8/17 | $1,579,267 | $1,172,315 |
|---|
9/17 | $1,607,482 | $1,194,078 |
|---|
10/17 | $1,632,726 | $1,216,542 |
|---|
11/17 | $1,621,589 | $1,226,424 |
|---|
12/17 | $1,697,561 | $1,253,836 |
|---|
1/18 | $1,818,923 | $1,323,670 |
|---|
2/18 | $1,763,142 | $1,261,255 |
|---|
3/18 | $1,776,710 | $1,239,011 |
|---|
4/18 | $1,791,786 | $1,258,792 |
|---|
5/18 | $1,887,519 | $1,229,727 |
|---|
6/18 | $1,843,045 | $1,206,613 |
|---|
7/18 | $1,808,780 | $1,235,471 |
|---|
8/18 | $1,790,654 | $1,209,613 |
|---|
9/18 | $1,757,424 | $1,215,123 |
|---|
10/18 | $1,546,714 | $1,116,288 |
|---|
11/18 | $1,567,861 | $1,126,854 |
|---|
12/18 | $1,493,236 | $1,075,850 |
|---|
1/19 | $1,642,786 | $1,157,139 |
|---|
2/19 | $1,728,890 | $1,179,748 |
|---|
3/19 | $1,827,080 | $1,186,775 |
|---|
4/19 | $1,870,132 | $1,218,127 |
|---|
5/19 | $1,761,368 | $1,152,749 |
|---|
6/19 | $1,867,111 | $1,222,162 |
|---|
7/19 | $1,842,186 | $1,207,368 |
|---|
8/19 | $1,818,771 | $1,170,080 |
|---|
9/19 | $1,805,931 | $1,200,191 |
|---|
10/19 | $1,882,972 | $1,242,068 |
|---|
11/19 | $1,961,524 | $1,253,017 |
|---|
12/19 | $2,018,927 | $1,307,279 |
|---|
1/20 | $1,950,950 | $1,272,162 |
|---|
2/20 | $1,889,770 | $1,171,604 |
|---|
3/20 | $1,716,050 | $1,001,963 |
|---|
4/20 | $1,920,737 | $1,077,893 |
|---|
5/20 | $2,071,043 | $1,113,169 |
|---|
6/20 | $2,299,900 | $1,163,474 |
|---|
7/20 | $2,484,949 | $1,215,346 |
|---|
8/20 | $2,667,733 | $1,267,371 |
|---|
9/20 | $2,676,041 | $1,236,216 |
|---|
10/20 | $2,676,041 | $1,209,639 |
|---|
11/20 | $2,930,579 | $1,372,354 |
|---|
12/20 | $3,139,172 | $1,446,530 |
|---|
1/21 | $3,192,173 | $1,449,674 |
|---|
2/21 | $3,356,476 | $1,478,372 |
|---|
3/21 | $3,142,201 | $1,497,064 |
|---|
4/21 | $3,272,431 | $1,541,133 |
|---|
5/21 | $3,258,045 | $1,589,339 |
|---|
6/21 | $3,310,289 | $1,579,042 |
|---|
7/21 | $3,151,286 | $1,553,019 |
|---|
8/21 | $3,254,260 | $1,582,539 |
|---|
9/21 | $3,016,512 | $1,531,866 |
|---|
10/21 | $3,188,387 | $1,568,432 |
|---|
11/21 | $3,049,827 | $1,497,808 |
|---|
12/21 | $2,974,665 | $1,559,708 |
|---|
1/22 | $2,565,301 | $1,502,232 |
|---|
2/22 | $2,345,528 | $1,472,497 |
|---|
3/22 | $2,191,533 | $1,474,844 |
|---|
4/22 | $1,880,447 | $1,382,234 |
|---|
5/22 | $1,816,991 | $1,392,156 |
|---|
6/22 | $1,624,303 | $1,272,392 |
|---|
7/22 | $1,795,324 | $1,315,951 |
|---|
8/22 | $1,698,593 | $1,273,626 |
|---|
9/22 | $1,497,393 | $1,146,353 |
|---|
10/22 | $1,532,990 | $1,180,607 |
|---|
11/22 | $1,762,822 | $1,319,975 |
|---|
12/22 | $1,673,087 | $1,310,105 |
|---|
1/23 | $1,908,840 | $1,416,365 |
|---|
2/23 | $1,822,651 | $1,366,648 |
|---|
3/23 | $1,954,470 | $1,400,057 |
|---|
4/23 | $1,948,555 | $1,424,380 |
|---|
5/23 | $1,931,655 | $1,372,592 |
|---|
6/23 | $2,022,070 | $1,434,180 |
|---|
7/23 | $2,086,289 | $1,492,488 |
|---|
8/23 | $1,963,765 | $1,425,079 |
|---|
9/23 | $1,826,876 | $1,380,069 |
|---|
10/23 | $1,729,702 | $1,323,129 |
|---|
11/23 | $1,934,190 | $1,442,230 |
|---|
12/23 | $2,026,295 | $1,514,691 |
|---|
1/24 | $1,991,650 | $1,499,645 |
|---|
2/24 | $2,150,509 | $1,537,612 |
|---|
3/24 | $2,185,998 | $1,585,677 |
|---|
4/24 | $2,124,314 | $1,557,203 |
|---|
5/24 | $2,203,743 | $1,602,407 |
|---|
6/24 | $2,200,363 | $1,600,883 |
|---|
7/24 | $2,205,433 | $1,637,950 |
|---|
8/24 | $2,337,252 | $1,684,598 |
|---|
9/24 | $2,485,971 | $1,729,960 |
|---|
10/24 | $2,447,946 | $1,645,080 |
|---|
11/24 | $2,496,111 | $1,630,189 |
|---|
12/24 | $2,417,743 | $1,598,514 |
|---|
|
|
| Average Annual Return [Table Text Block] |
AATR | 1 Year | 5 Years | 10 Years |
|---|
Class I | 19.32% | 3.67% | 9.23% |
|---|
MSCI All Country World ex USA Net Index | 5.53% | 4.10% | 4.80% |
|---|
|
|
| AssetsNet |
$ 723,453,302
|
|
| Holdings Count | Holding |
34
|
|
| Advisory Fees Paid, Amount |
$ 6,950,818
|
|
| InvestmentCompanyPortfolioTurnover |
28.00%
|
|
| Additional Fund Statistics [Text Block] |
Total Net Assets | $723,453,302 |
|---|
# of Portfolio Holdings | 34 |
|---|
Portfolio Turnover Rate | 28% |
|---|
Total Advisory Fees Paid | $6,950,818 |
|---|
|
|
| Holdings [Text Block] |
Country Weightings (% of total investments)Value | Value |
|---|
Other | 18.8% | Canada | 4.4% | Sweden | 4.8% | Brazil | 5.1% | Japan | 5.8% | Denmark | 6.5% | Korea, Republic of | 6.5% | United States | 9.8% | France | 12.0% | China | 13.1% | India | 13.2% |
Top Ten Holdings (% of total investments)Footnote ReferenceaDSV AS | 6.5% | MercadoLibre, Inc. | 5.6% | Spotify Technology SA | 4.8% | Hermes International SCA | 4.3% | Trip.com Group Ltd. | 4.3% | Coupang, Inc. | 4.3% | ICICI Bank Ltd. | 4.2% | Taiwan Semiconductor Manufacturing Co. Ltd. | 4.1% | Schneider Electric SE | 4.0% | Meituan | 4.0% | Total | 46.1% |
| Footnote | Description | Footnotea | Excluding cash equivalents. |
|
|
| Material Fund Change [Text Block] |
|
|
| Updated Prospectus Web Address |
<span style="box-sizing: border-box; color: rgb(0, 0, 0); display: inline; flex-wrap: nowrap; font-size: 10.6667px; font-weight: 400; grid-area: auto; line-height: 16px; margin: 0px; overflow: visible; text-align: left;">www.morganstanley.com/im/shareholderreports</span>
|
|
| C000198820 |
|
|
| Shareholder Report [Line Items] |
|
|
| Fund Name |
Morgan Stanley Institutional Fund, Inc. - International Opportunity Portfolio
|
|
| Class Name |
Class IR
|
|
| Trading Symbol |
MRNPX
|
|
| Annual or Semi-Annual Statement [Text Block] |
This annual shareholder report contains important information about Morgan Stanley Institutional Fund, Inc. - International Opportunity Portfolio for the period of January 1, 2024 to December 31, 2024.
|
|
| Shareholder Report Annual or Semi-Annual |
Annual Shareholder Report
|
|
| Additional Information [Text Block] |
You can find additional information about the Fund at www.morganstanley.com/im/shareholderreports. You can also request this information by contacting us at 1-800-869-6397.
|
|
| Additional Information Phone Number |
1-800-869-6397
|
|
| Additional Information Website |
<span style="box-sizing: border-box; color: rgb(0, 0, 0); display: inline; flex-wrap: nowrap; font-size: 10.6667px; font-weight: 400; grid-area: auto; line-height: 16px; margin: 0px; overflow: visible; text-align: left;">www.morganstanley.com/im/shareholderreports</span>
|
|
| Expenses [Text Block] |
What were the Fund costs for the last year?(based on a hypothetical $10,000 investment) Class Name | Costs of a $10,000 investment | Costs paid as a percentage of a $10,000 investment |
|---|
Class IR | $103 | 0.94% |
|---|
|
|
| Expenses Paid, Amount |
$ 103
|
|
| Expense Ratio, Percent |
0.94%
|
|
| Factors Affecting Performance [Text Block] |
How did the Fund perform last year and what affected its performance?Key contributors to (↑) and detractors from (↓) performance, relative to the MSCI All Country World ex USA Net Index: ↑ Stock selection in consumer discretionary, led by a position in a Chinese online travel agency ↑ Stock selection in communication services, led by a Swedish audio streaming platform, which was the largest positive contributor in the portfolio ↑ No exposure to materials ↓ Stock selection in financials, where a South Korean digital bank was the largest detractor across the portfolio ↓ An average overweight in consumer discretionary, where exposure to an online casino solutions company was the main detractor ↓ Stock selection in consumer staples, where a holding in a leading beauty company was the main detractor |
|
| Line Graph [Table Text Block] |
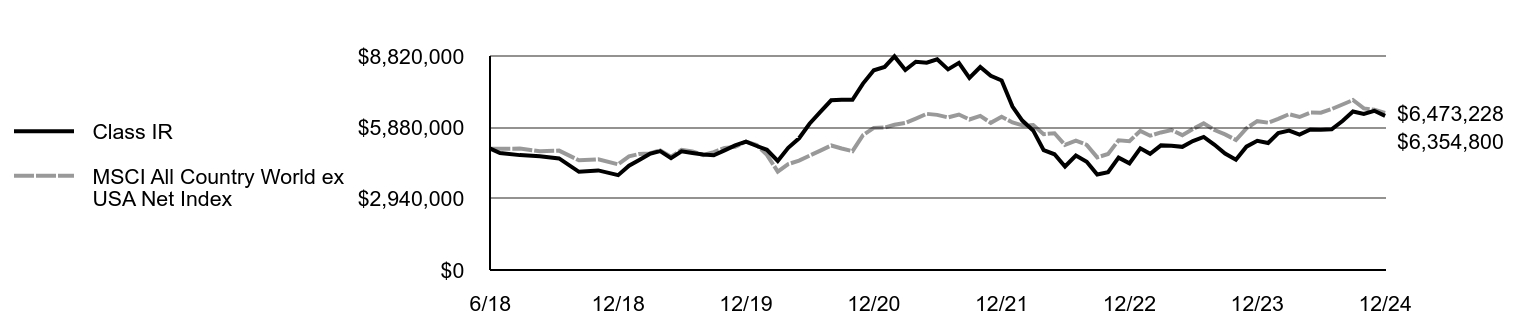 | Class IR | MSCI All Country World ex USA Net Index |
|---|
6/18 | $5,000,000 | $5,000,000 |
|---|
6/18 | $4,822,625 | $5,000,000 |
|---|
7/18 | $4,735,013 | $5,003,075 |
|---|
8/18 | $4,687,623 | $4,898,360 |
|---|
9/18 | $4,598,768 | $4,920,675 |
|---|
10/18 | $4,047,863 | $4,520,439 |
|---|
11/18 | $4,105,126 | $4,563,225 |
|---|
12/18 | $3,908,042 | $4,356,684 |
|---|
1/19 | $4,301,018 | $4,685,865 |
|---|
2/19 | $4,528,115 | $4,777,423 |
|---|
3/19 | $4,784,834 | $4,805,878 |
|---|
4/19 | $4,897,395 | $4,932,839 |
|---|
5/19 | $4,611,055 | $4,668,089 |
|---|
6/19 | $4,889,496 | $4,949,177 |
|---|
7/19 | $4,824,329 | $4,889,272 |
|---|
8/19 | $4,763,111 | $4,738,271 |
|---|
9/19 | $4,729,540 | $4,860,205 |
|---|
10/19 | $4,932,940 | $5,029,790 |
|---|
11/19 | $5,138,315 | $5,074,128 |
|---|
12/19 | $5,288,396 | $5,293,864 |
|---|
1/20 | $5,110,668 | $5,151,654 |
|---|
2/20 | $4,952,688 | $4,744,441 |
|---|
3/20 | $4,496,519 | $4,057,478 |
|---|
4/20 | $5,033,653 | $4,364,957 |
|---|
5/20 | $5,428,604 | $4,507,810 |
|---|
6/20 | $6,026,955 | $4,711,518 |
|---|
7/20 | $6,514,720 | $4,921,578 |
|---|
8/20 | $6,994,585 | $5,132,254 |
|---|
9/20 | $7,016,308 | $5,006,091 |
|---|
10/20 | $7,016,308 | $4,898,467 |
|---|
11/20 | $7,683,775 | $5,557,384 |
|---|
12/20 | $8,231,120 | $5,857,765 |
|---|
1/21 | $8,371,671 | $5,870,495 |
|---|
2/21 | $8,803,220 | $5,986,709 |
|---|
3/21 | $8,241,018 | $6,062,403 |
|---|
4/21 | $8,583,486 | $6,240,861 |
|---|
5/21 | $8,545,874 | $6,436,074 |
|---|
6/21 | $8,684,445 | $6,394,374 |
|---|
7/21 | $8,268,732 | $6,288,994 |
|---|
8/21 | $8,537,956 | $6,408,537 |
|---|
9/21 | $7,916,366 | $6,203,332 |
|---|
10/21 | $8,367,711 | $6,351,408 |
|---|
11/21 | $8,005,447 | $6,065,416 |
|---|
12/21 | $7,808,958 | $6,316,079 |
|---|
1/22 | $6,734,720 | $6,083,331 |
|---|
2/22 | $6,158,152 | $5,962,915 |
|---|
3/22 | $5,753,543 | $5,972,420 |
|---|
4/22 | $4,938,255 | $5,597,394 |
|---|
5/22 | $4,770,343 | $5,637,572 |
|---|
6/22 | $4,266,604 | $5,152,587 |
|---|
7/22 | $4,715,720 | $5,328,979 |
|---|
8/22 | $4,460,817 | $5,157,585 |
|---|
9/22 | $3,932,802 | $4,642,187 |
|---|
10/22 | $4,027,885 | $4,780,902 |
|---|
11/22 | $4,630,752 | $5,345,276 |
|---|
12/22 | $4,396,173 | $5,305,307 |
|---|
1/23 | $5,016,627 | $5,735,610 |
|---|
2/23 | $4,789,201 | $5,534,280 |
|---|
3/23 | $5,135,860 | $5,669,569 |
|---|
4/23 | $5,120,404 | $5,768,067 |
|---|
5/23 | $5,076,244 | $5,558,351 |
|---|
6/23 | $5,314,710 | $5,807,750 |
|---|
7/23 | $5,482,520 | $6,043,872 |
|---|
8/23 | $5,160,148 | $5,770,897 |
|---|
9/23 | $4,802,449 | $5,588,629 |
|---|
10/23 | $4,544,110 | $5,358,048 |
|---|
11/23 | $5,082,868 | $5,840,351 |
|---|
12/23 | $5,323,542 | $6,133,781 |
|---|
1/24 | $5,233,013 | $6,072,854 |
|---|
2/24 | $5,648,121 | $6,226,602 |
|---|
3/24 | $5,743,066 | $6,421,244 |
|---|
4/24 | $5,581,881 | $6,305,937 |
|---|
5/24 | $5,791,643 | $6,488,990 |
|---|
6/24 | $5,782,811 | $6,482,819 |
|---|
7/24 | $5,796,059 | $6,632,925 |
|---|
8/24 | $6,142,718 | $6,821,826 |
|---|
9/24 | $6,533,538 | $7,005,522 |
|---|
10/24 | $6,436,385 | $6,661,797 |
|---|
11/24 | $6,562,243 | $6,601,496 |
|---|
12/24 | $6,354,800 | $6,473,228 |
|---|
|
|
| Average Annual Return [Table Text Block] |
AATR | 1 Year | 5 Years | Since 6/15/18
(Inception) |
|---|
Class IR | 19.37% | 3.74% | 3.73% |
|---|
MSCI All Country World ex USA Net Index | 5.53% | 4.10% | 4.02% |
|---|
|
|
| Performance Inception Date |
Jun. 15, 2018
|
|
| AssetsNet |
$ 723,453,302
|
|
| Holdings Count | Holding |
34
|
|
| Advisory Fees Paid, Amount |
$ 6,950,818
|
|
| InvestmentCompanyPortfolioTurnover |
28.00%
|
|
| Additional Fund Statistics [Text Block] |
Total Net Assets | $723,453,302 |
|---|
# of Portfolio Holdings | 34 |
|---|
Portfolio Turnover Rate | 28% |
|---|
Total Advisory Fees Paid | $6,950,818 |
|---|
|
|
| Holdings [Text Block] |
Country Weightings (% of total investments)Value | Value |
|---|
Other | 18.8% | Canada | 4.4% | Sweden | 4.8% | Brazil | 5.1% | Japan | 5.8% | Denmark | 6.5% | Korea, Republic of | 6.5% | United States | 9.8% | France | 12.0% | China | 13.1% | India | 13.2% |
Top Ten Holdings (% of total investments)Footnote ReferenceaDSV AS | 6.5% | MercadoLibre, Inc. | 5.6% | Spotify Technology SA | 4.8% | Hermes International SCA | 4.3% | Trip.com Group Ltd. | 4.3% | Coupang, Inc. | 4.3% | ICICI Bank Ltd. | 4.2% | Taiwan Semiconductor Manufacturing Co. Ltd. | 4.1% | Schneider Electric SE | 4.0% | Meituan | 4.0% | Total | 46.1% |
| Footnote | Description | Footnotea | Excluding cash equivalents. |
|
|
| Material Fund Change [Text Block] |
|
|
| Updated Prospectus Web Address |
<span style="box-sizing: border-box; color: rgb(0, 0, 0); display: inline; flex-wrap: nowrap; font-size: 10.6667px; font-weight: 400; grid-area: auto; line-height: 16px; margin: 0px; overflow: visible; text-align: left;">www.morganstanley.com/im/shareholderreports</span>
|
|
| C000085088 |
|
|
| Shareholder Report [Line Items] |
|
|
| Fund Name |
Morgan Stanley Institutional Fund, Inc. - International Opportunity Portfolio
|
|
| Class Name |
Class L
|
|
| Trading Symbol |
MIOLX
|
|
| Annual or Semi-Annual Statement [Text Block] |
This annual shareholder report contains important information about Morgan Stanley Institutional Fund, Inc. - International Opportunity Portfolio for the period of January 1, 2024 to December 31, 2024.
|
|
| Shareholder Report Annual or Semi-Annual |
Annual Shareholder Report
|
|
| Additional Information [Text Block] |
You can find additional information about the Fund at www.morganstanley.com/im/shareholderreports. You can also request this information by contacting us at 1-800-869-6397.
|
|
| Additional Information Phone Number |
1-800-869-6397
|
|
| Additional Information Website |
<span style="box-sizing: border-box; color: rgb(0, 0, 0); display: inline; flex-wrap: nowrap; font-size: 10.6667px; font-weight: 400; grid-area: auto; line-height: 16px; margin: 0px; overflow: visible; text-align: left;">www.morganstanley.com/im/shareholderreports</span>
|
|
| Expenses [Text Block] |
What were the Fund costs for the last year?(based on a hypothetical $10,000 investment) Class Name | Costs of a $10,000 investment | Costs paid as a percentage of a $10,000 investment |
|---|
Class L | $202 | 1.85% |
|---|
|
|
| Expenses Paid, Amount |
$ 202
|
|
| Expense Ratio, Percent |
1.85%
|
|
| Factors Affecting Performance [Text Block] |
How did the Fund perform last year and what affected its performance?Key contributors to (↑) and detractors from (↓) performance, relative to the MSCI All Country World ex USA Net Index: ↑ Stock selection in consumer discretionary, led by a position in a Chinese online travel agency ↑ Stock selection in communication services, led by a Swedish audio streaming platform, which was the largest positive contributor in the portfolio ↑ No exposure to materials ↓ Stock selection in financials, where a South Korean digital bank was the largest detractor across the portfolio ↓ An average overweight in consumer discretionary, where exposure to an online casino solutions company was the main detractor ↓ Stock selection in consumer staples, where a holding in a leading beauty company was the main detractor |
|
| Line Graph [Table Text Block] |
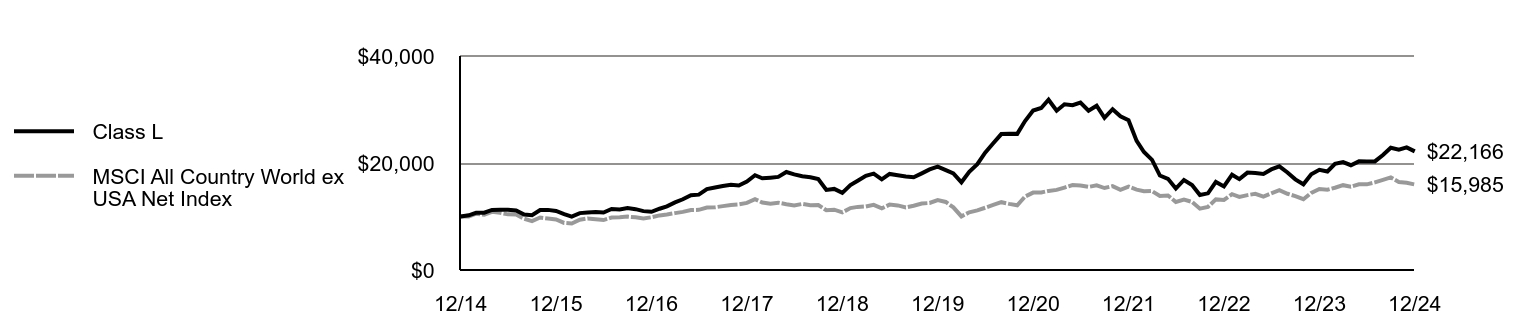 | Class L | MSCI All Country World ex USA Net Index |
|---|
12/14 | $10,000 | $10,000 |
|---|
1/15 | $10,219 | $9,985 |
|---|
2/15 | $10,679 | $10,519 |
|---|
3/15 | $10,701 | $10,349 |
|---|
4/15 | $11,234 | $10,872 |
|---|
5/15 | $11,241 | $10,702 |
|---|
6/15 | $11,270 | $10,403 |
|---|
7/15 | $11,132 | $10,375 |
|---|
8/15 | $10,366 | $9,582 |
|---|
9/15 | $10,233 | $9,137 |
|---|
10/15 | $11,221 | $9,818 |
|---|
11/15 | $11,236 | $9,615 |
|---|
12/15 | $11,038 | $9,434 |
|---|
1/16 | $10,460 | $8,792 |
|---|
2/16 | $9,979 | $8,692 |
|---|
3/16 | $10,633 | $9,398 |
|---|
4/16 | $10,745 | $9,646 |
|---|
5/16 | $10,836 | $9,483 |
|---|
6/16 | $10,738 | $9,338 |
|---|
7/16 | $11,399 | $9,800 |
|---|
8/16 | $11,324 | $9,862 |
|---|
9/16 | $11,572 | $9,983 |
|---|
10/16 | $11,369 | $9,840 |
|---|
11/16 | $11,001 | $9,612 |
|---|
12/16 | $10,873 | $9,858 |
|---|
1/17 | $11,452 | $10,207 |
|---|
2/17 | $11,895 | $10,370 |
|---|
3/17 | $12,631 | $10,633 |
|---|
4/17 | $13,225 | $10,860 |
|---|
5/17 | $13,992 | $11,213 |
|---|
6/17 | $14,082 | $11,248 |
|---|
7/17 | $15,114 | $11,662 |
|---|
8/17 | $15,430 | $11,723 |
|---|
9/17 | $15,693 | $11,941 |
|---|
10/17 | $15,927 | $12,165 |
|---|
11/17 | $15,806 | $12,264 |
|---|
12/17 | $16,539 | $12,538 |
|---|
1/18 | $17,709 | $13,237 |
|---|
2/18 | $17,151 | $12,613 |
|---|
3/18 | $17,265 | $12,390 |
|---|
4/18 | $17,403 | $12,588 |
|---|
5/18 | $18,320 | $12,297 |
|---|
6/18 | $17,877 | $12,066 |
|---|
7/18 | $17,537 | $12,355 |
|---|
8/18 | $17,346 | $12,096 |
|---|
9/18 | $17,008 | $12,151 |
|---|
10/18 | $14,963 | $11,163 |
|---|
11/18 | $15,154 | $11,269 |
|---|
12/18 | $14,420 | $10,758 |
|---|
1/19 | $15,861 | $11,571 |
|---|
2/19 | $16,681 | $11,797 |
|---|
3/19 | $17,615 | $11,868 |
|---|
4/19 | $18,014 | $12,181 |
|---|
5/19 | $16,949 | $11,527 |
|---|
6/19 | $17,960 | $12,222 |
|---|
7/19 | $17,707 | $12,074 |
|---|
8/19 | $17,470 | $11,701 |
|---|
9/19 | $17,332 | $12,002 |
|---|
10/19 | $18,060 | $12,421 |
|---|
11/19 | $18,795 | $12,530 |
|---|
12/19 | $19,332 | $13,073 |
|---|
1/20 | $18,665 | $12,722 |
|---|
2/20 | $18,075 | $11,716 |
|---|
3/20 | $16,397 | $10,020 |
|---|
4/20 | $18,343 | $10,779 |
|---|
5/20 | $19,769 | $11,132 |
|---|
6/20 | $21,929 | $11,635 |
|---|
7/20 | $23,684 | $12,153 |
|---|
8/20 | $25,408 | $12,674 |
|---|
9/20 | $25,462 | $12,362 |
|---|
10/20 | $25,446 | $12,096 |
|---|
11/20 | $27,844 | $13,724 |
|---|
12/20 | $29,800 | $14,465 |
|---|
1/21 | $30,284 | $14,497 |
|---|
2/21 | $31,820 | $14,784 |
|---|
3/21 | $29,769 | $14,971 |
|---|
4/21 | $30,975 | $15,411 |
|---|
5/21 | $30,814 | $15,893 |
|---|
6/21 | $31,290 | $15,790 |
|---|
7/21 | $29,769 | $15,530 |
|---|
8/21 | $30,714 | $15,825 |
|---|
9/21 | $28,455 | $15,319 |
|---|
10/21 | $30,053 | $15,684 |
|---|
11/21 | $28,732 | $14,978 |
|---|
12/21 | $28,000 | $15,597 |
|---|
1/22 | $24,130 | $15,022 |
|---|
2/22 | $22,046 | $14,725 |
|---|
3/22 | $20,583 | $14,748 |
|---|
4/22 | $17,657 | $13,822 |
|---|
5/22 | $17,044 | $13,922 |
|---|
6/22 | $15,227 | $12,724 |
|---|
7/22 | $16,823 | $13,160 |
|---|
8/22 | $15,895 | $12,736 |
|---|
9/22 | $14,008 | $11,464 |
|---|
10/22 | $14,330 | $11,806 |
|---|
11/22 | $16,470 | $13,200 |
|---|
12/22 | $15,612 | $13,101 |
|---|
1/23 | $17,811 | $14,164 |
|---|
2/23 | $16,988 | $13,666 |
|---|
3/23 | $18,209 | $14,001 |
|---|
4/23 | $18,140 | $14,244 |
|---|
5/23 | $17,967 | $13,726 |
|---|
6/23 | $18,798 | $14,342 |
|---|
7/23 | $19,378 | $14,925 |
|---|
8/23 | $18,218 | $14,251 |
|---|
9/23 | $16,945 | $13,801 |
|---|
10/23 | $16,027 | $13,231 |
|---|
11/23 | $17,906 | $14,422 |
|---|
12/23 | $18,738 | $15,147 |
|---|
1/24 | $18,409 | $14,996 |
|---|
2/24 | $19,855 | $15,376 |
|---|
3/24 | $20,175 | $15,857 |
|---|
4/24 | $19,586 | $15,572 |
|---|
5/24 | $20,313 | $16,024 |
|---|
6/24 | $20,270 | $16,009 |
|---|
7/24 | $20,296 | $16,379 |
|---|
8/24 | $21,500 | $16,846 |
|---|
9/24 | $22,842 | $17,300 |
|---|
10/24 | $22,478 | $16,451 |
|---|
11/24 | $22,911 | $16,302 |
|---|
12/24 | $22,166 | $15,985 |
|---|
|
|
| Average Annual Return [Table Text Block] |
AATR | 1 Year | 5 Years | 10 Years |
|---|
Class L | 18.30% | 2.77% | 8.29% |
|---|
MSCI All Country World ex USA Net Index | 5.53% | 4.10% | 4.80% |
|---|
|
|
| AssetsNet |
$ 723,453,302
|
|
| Holdings Count | Holding |
34
|
|
| Advisory Fees Paid, Amount |
$ 6,950,818
|
|
| InvestmentCompanyPortfolioTurnover |
28.00%
|
|
| Additional Fund Statistics [Text Block] |
Total Net Assets | $723,453,302 |
|---|
# of Portfolio Holdings | 34 |
|---|
Portfolio Turnover Rate | 28% |
|---|
Total Advisory Fees Paid | $6,950,818 |
|---|
|
|
| Holdings [Text Block] |
Country Weightings (% of total investments)Value | Value |
|---|
Other | 18.8% | Canada | 4.4% | Sweden | 4.8% | Brazil | 5.1% | Japan | 5.8% | Denmark | 6.5% | Korea, Republic of | 6.5% | United States | 9.8% | France | 12.0% | China | 13.1% | India | 13.2% |
Top Ten Holdings (% of total investments)Footnote ReferenceaDSV AS | 6.5% | MercadoLibre, Inc. | 5.6% | Spotify Technology SA | 4.8% | Hermes International SCA | 4.3% | Trip.com Group Ltd. | 4.3% | Coupang, Inc. | 4.3% | ICICI Bank Ltd. | 4.2% | Taiwan Semiconductor Manufacturing Co. Ltd. | 4.1% | Schneider Electric SE | 4.0% | Meituan | 4.0% | Total | 46.1% |
| Footnote | Description | Footnotea | Excluding cash equivalents. |
|
|
| Material Fund Change [Text Block] |
|
|
| Updated Prospectus Web Address |
<span style="box-sizing: border-box; color: rgb(0, 0, 0); display: inline; flex-wrap: nowrap; font-size: 10.6667px; font-weight: 400; grid-area: auto; line-height: 16px; margin: 0px; overflow: visible; text-align: left;">www.morganstanley.com/im/shareholderreports</span>
|
|
| C000126918 |
|
|
| Shareholder Report [Line Items] |
|
|
| Fund Name |
Morgan Stanley Institutional Fund, Inc. - International Opportunity Portfolio
|
|
| Class Name |
Class R6
|
|
| Trading Symbol |
MNOPX
|
|
| Annual or Semi-Annual Statement [Text Block] |
This annual shareholder report contains important information about Morgan Stanley Institutional Fund, Inc. - International Opportunity Portfolio for the period of January 1, 2024 to December 31, 2024.
|
|
| Shareholder Report Annual or Semi-Annual |
Annual Shareholder Report
|
|
| Additional Information [Text Block] |
You can find additional information about the Fund at www.morganstanley.com/im/shareholderreports. You can also request this information by contacting us at 1-800-869-6397.
|
|
| Additional Information Phone Number |
1-800-869-6397
|
|
| Additional Information Website |
<span style="box-sizing: border-box; color: rgb(0, 0, 0); display: inline; flex-wrap: nowrap; font-size: 10.6667px; font-weight: 400; grid-area: auto; line-height: 16px; margin: 0px; overflow: visible; text-align: left;">www.morganstanley.com/im/shareholderreports</span>
|
|
| Expenses [Text Block] |
What were the Fund costs for the last year?(based on a hypothetical $10,000 investment) Class Name | Costs of a $10,000 investment | Costs paid as a percentage of a $10,000 investment |
|---|
Class R6 | $103 | 0.94% |
|---|
|
|
| Expenses Paid, Amount |
$ 103
|
|
| Expense Ratio, Percent |
0.94%
|
|
| Factors Affecting Performance [Text Block] |
How did the Fund perform last year and what affected its performance?Key contributors to (↑) and detractors from (↓) performance, relative to the MSCI All Country World ex USA Net Index: ↑ Stock selection in consumer discretionary, led by a position in a Chinese online travel agency ↑ Stock selection in communication services, led by a Swedish audio streaming platform, which was the largest positive contributor in the portfolio ↑ No exposure to materials ↓ Stock selection in financials, where a South Korean digital bank was the largest detractor across the portfolio ↓ An average overweight in consumer discretionary, where exposure to an online casino solutions company was the main detractor ↓ Stock selection in consumer staples, where a holding in a leading beauty company was the main detractor |
|
| Line Graph [Table Text Block] |
 | Class R6 | MSCI All Country World ex USA Net Index |
|---|
12/14 | $5,000,000 | $5,000,000 |
|---|
1/15 | $5,111,351 | $4,992,591 |
|---|
2/15 | $5,344,828 | $5,259,507 |
|---|
3/15 | $5,362,787 | $5,174,493 |
|---|
4/15 | $5,632,184 | $5,435,903 |
|---|
5/15 | $5,639,368 | $5,351,019 |
|---|
6/15 | $5,657,328 | $5,201,743 |
|---|
7/15 | $5,590,412 | $5,187,278 |
|---|
8/15 | $5,213,078 | $4,790,788 |
|---|
9/15 | $5,150,799 | $4,568,669 |
|---|
10/15 | $5,652,691 | $4,908,774 |
|---|
11/15 | $5,663,681 | $4,807,442 |
|---|
12/15 | $5,570,019 | $4,716,894 |
|---|
1/16 | $5,281,148 | $4,396,035 |
|---|
2/16 | $5,040,423 | $4,345,789 |
|---|
3/16 | $5,377,439 | $4,699,144 |
|---|
4/16 | $5,432,991 | $4,822,823 |
|---|
5/16 | $5,484,839 | $4,741,415 |
|---|
6/16 | $5,444,101 | $4,668,876 |
|---|
7/16 | $5,779,127 | $4,899,767 |
|---|
8/16 | $5,749,491 | $4,930,753 |
|---|
9/16 | $5,875,446 | $4,991,556 |
|---|
10/16 | $5,779,127 | $4,919,790 |
|---|
11/16 | $5,593,899 | $4,805,993 |
|---|
12/16 | $5,534,626 | $4,928,924 |
|---|
1/17 | $5,830,991 | $5,103,529 |
|---|
2/17 | $6,064,379 | $5,184,911 |
|---|
3/17 | $6,442,245 | $5,316,357 |
|---|
4/17 | $6,749,725 | $5,430,168 |
|---|
5/17 | $7,146,113 | $5,606,375 |
|---|
6/17 | $7,197,977 | $5,623,784 |
|---|
7/17 | $7,732,788 | $5,831,063 |
|---|
8/17 | $7,899,763 | $5,861,577 |
|---|
9/17 | $8,040,764 | $5,970,389 |
|---|
10/17 | $8,166,922 | $6,082,711 |
|---|
11/17 | $8,107,554 | $6,132,122 |
|---|
12/17 | $8,490,929 | $6,269,181 |
|---|
1/18 | $9,097,424 | $6,618,348 |
|---|
2/18 | $8,818,662 | $6,306,274 |
|---|
3/18 | $8,886,469 | $6,195,055 |
|---|
4/18 | $8,961,810 | $6,293,960 |
|---|
5/18 | $9,440,226 | $6,148,634 |
|---|
6/18 | $9,217,970 | $6,033,066 |
|---|
7/18 | $9,046,726 | $6,177,357 |
|---|
8/18 | $8,956,146 | $6,048,063 |
|---|
9/18 | $8,790,081 | $6,075,616 |
|---|
10/18 | $7,737,083 | $5,581,440 |
|---|
11/18 | $7,842,761 | $5,634,269 |
|---|
12/18 | $7,469,829 | $5,379,249 |
|---|
1/19 | $8,217,190 | $5,785,694 |
|---|
2/19 | $8,651,262 | $5,898,741 |
|---|
3/19 | $9,141,954 | $5,933,875 |
|---|
4/19 | $9,357,103 | $6,090,635 |
|---|
5/19 | $8,813,568 | $5,763,745 |
|---|
6/19 | $9,342,005 | $6,110,808 |
|---|
7/19 | $9,217,445 | $6,036,842 |
|---|
8/19 | $9,100,434 | $5,850,399 |
|---|
9/19 | $9,036,266 | $6,000,953 |
|---|
10/19 | $9,425,045 | $6,210,341 |
|---|
11/19 | $9,817,598 | $6,265,086 |
|---|
12/19 | $10,104,463 | $6,536,397 |
|---|
1/20 | $9,764,754 | $6,360,808 |
|---|
2/20 | $9,462,790 | $5,858,018 |
|---|
3/20 | $8,590,870 | $5,009,817 |
|---|
4/20 | $9,617,547 | $5,389,465 |
|---|
5/20 | $10,372,456 | $5,565,847 |
|---|
6/20 | $11,516,144 | $5,817,368 |
|---|
7/20 | $12,444,682 | $6,076,731 |
|---|
8/20 | $13,361,897 | $6,336,856 |
|---|
9/20 | $13,403,418 | $6,181,081 |
|---|
10/20 | $13,403,418 | $6,048,196 |
|---|
11/20 | $14,682,989 | $6,861,769 |
|---|
12/20 | $15,725,409 | $7,232,652 |
|---|
1/21 | $15,994,058 | $7,248,371 |
|---|
2/21 | $16,818,923 | $7,391,862 |
|---|
3/21 | $15,748,112 | $7,485,321 |
|---|
4/21 | $16,398,923 | $7,705,665 |
|---|
5/21 | $16,327,031 | $7,946,697 |
|---|
6/21 | $16,591,896 | $7,895,209 |
|---|
7/21 | $15,797,301 | $7,765,096 |
|---|
8/21 | $16,311,896 | $7,912,697 |
|---|
9/21 | $15,127,571 | $7,659,328 |
|---|
10/21 | $15,990,274 | $7,842,160 |
|---|
11/21 | $15,294,058 | $7,489,042 |
|---|
12/21 | $14,918,408 | $7,798,538 |
|---|
1/22 | $12,868,963 | $7,511,161 |
|---|
2/22 | $11,766,904 | $7,362,483 |
|---|
3/22 | $10,993,528 | $7,374,218 |
|---|
4/22 | $9,435,177 | $6,911,169 |
|---|
5/22 | $9,118,094 | $6,960,778 |
|---|
6/22 | $8,151,375 | $6,361,961 |
|---|
7/22 | $9,013,688 | $6,579,754 |
|---|
8/22 | $8,526,462 | $6,368,132 |
|---|
9/22 | $7,517,207 | $5,731,764 |
|---|
10/22 | $7,695,083 | $5,903,037 |
|---|
11/22 | $8,851,279 | $6,599,876 |
|---|
12/22 | $8,399,031 | $6,550,526 |
|---|
1/23 | $9,585,025 | $7,081,826 |
|---|
2/23 | $9,150,302 | $6,833,242 |
|---|
3/23 | $9,812,939 | $7,000,285 |
|---|
4/23 | $9,787,615 | $7,121,901 |
|---|
5/23 | $9,703,203 | $6,862,962 |
|---|
6/23 | $10,154,809 | $7,170,898 |
|---|
7/23 | $10,479,796 | $7,462,441 |
|---|
8/23 | $9,863,586 | $7,125,396 |
|---|
9/23 | $9,175,625 | $6,900,346 |
|---|
10/23 | $8,686,034 | $6,615,646 |
|---|
11/23 | $9,711,644 | $7,211,151 |
|---|
12/23 | $10,171,691 | $7,573,453 |
|---|
1/24 | $9,998,646 | $7,498,226 |
|---|
2/24 | $10,796,343 | $7,688,059 |
|---|
3/24 | $10,977,830 | $7,928,387 |
|---|
4/24 | $10,665,504 | $7,786,016 |
|---|
5/24 | $11,070,683 | $8,012,033 |
|---|
6/24 | $11,053,801 | $8,004,414 |
|---|
7/24 | $11,079,124 | $8,189,752 |
|---|
8/24 | $11,741,762 | $8,422,991 |
|---|
9/24 | $12,488,811 | $8,649,802 |
|---|
10/24 | $12,298,883 | $8,225,401 |
|---|
11/24 | $12,543,679 | $8,150,946 |
|---|
12/24 | $12,147,163 | $7,992,572 |
|---|
|
|
| Average Annual Return [Table Text Block] |
AATR | 1 Year | 5 Years | 10 Years |
|---|
Class R6 | 19.42% | 3.75% | 9.28% |
|---|
MSCI All Country World ex USA Net Index | 5.53% | 4.10% | 4.80% |
|---|
|
|
| AssetsNet |
$ 723,453,302
|
|
| Holdings Count | Holding |
34
|
|
| Advisory Fees Paid, Amount |
$ 6,950,818
|
|
| InvestmentCompanyPortfolioTurnover |
28.00%
|
|
| Additional Fund Statistics [Text Block] |
Total Net Assets | $723,453,302 |
|---|
# of Portfolio Holdings | 34 |
|---|
Portfolio Turnover Rate | 28% |
|---|
Total Advisory Fees Paid | $6,950,818 |
|---|
|
|
| Holdings [Text Block] |
Country Weightings (% of total investments)Value | Value |
|---|
Other | 18.8% | Canada | 4.4% | Sweden | 4.8% | Brazil | 5.1% | Japan | 5.8% | Denmark | 6.5% | Korea, Republic of | 6.5% | United States | 9.8% | France | 12.0% | China | 13.1% | India | 13.2% |
Top Ten Holdings (% of total investments)Footnote ReferenceaDSV AS | 6.5% | MercadoLibre, Inc. | 5.6% | Spotify Technology SA | 4.8% | Hermes International SCA | 4.3% | Trip.com Group Ltd. | 4.3% | Coupang, Inc. | 4.3% | ICICI Bank Ltd. | 4.2% | Taiwan Semiconductor Manufacturing Co. Ltd. | 4.1% | Schneider Electric SE | 4.0% | Meituan | 4.0% | Total | 46.1% |
| Footnote | Description | Footnotea | Excluding cash equivalents. |
|
|
| Material Fund Change [Text Block] |
|
|
| Updated Prospectus Web Address |
<span style="box-sizing: border-box; color: rgb(0, 0, 0); display: inline; flex-wrap: nowrap; font-size: 10.6667px; font-weight: 400; grid-area: auto; line-height: 16px; margin: 0px; overflow: visible; text-align: left;">www.morganstanley.com/im/shareholderreports</span>
|
|
| C000236930 |
|
|
| Shareholder Report [Line Items] |
|
|
| Fund Name |
Morgan Stanley Institutional Fund, Inc - International Resilience Portfolio
|
|
| Class Name |
Class A
|
|
| Trading Symbol |
MSDFX
|
|
| Annual or Semi-Annual Statement [Text Block] |
This annual shareholder report contains important information about Morgan Stanley Institutional Fund, Inc - International Resilience Portfolio for the period of January 1, 2024 to December 31, 2024.
|
|
| Shareholder Report Annual or Semi-Annual |
Annual Shareholder Report
|
|
| Additional Information [Text Block] |
You can find additional information about the Fund at www.morganstanley.com/im/shareholderreports. You can also request this information by contacting us at 1-800-869-6397.
|
|
| Additional Information Phone Number |
1-800-869-6397
|
|
| Additional Information Website |
<span style="box-sizing: border-box; color: rgb(0, 0, 0); display: inline; flex-wrap: nowrap; font-size: 10.6667px; font-weight: 400; grid-area: auto; line-height: 16px; margin: 0px; overflow: visible; text-align: left;">www.morganstanley.com/im/shareholderreports</span>
|
|
| Expenses [Text Block] |
What were the Fund costs for the last year?(based on a hypothetical $10,000 investment) Class Name | Costs of a $10,000 investment | Costs paid as a percentage of a $10,000 investment |
|---|
Class A | $122 | 1.20% |
|---|
|
|
| Expenses Paid, Amount |
$ 122
|
|
| Expense Ratio, Percent |
1.20%
|
|
| Factors Affecting Performance [Text Block] |
How did the Fund perform last year and what affected its performance?Key contributors to (↑) and detractors from (↓) performance, relative to the MSCI All Country World ex U.S. Net Index: ↓ Stock selection, largely driven by weakness in consumer staples, and to a lesser extent in communication services and industrials ↓The overweight to consumer staples and underweight to financials ↑ Sector allocation overall was positive, driven by the overweight in information technology and zero weights in materials and energy ↑ Stock selection in information technology |
|
| Line Graph [Table Text Block] |
| Class A with maximum sales charge | MSCI All Country World ex USA Net Index |
|---|
7/22 | $9,479 | $10,000 |
|---|
8/22 | $8,739 | $9,678 |
|---|
9/22 | $8,000 | $8,711 |
|---|
10/22 | $8,284 | $8,972 |
|---|
11/22 | $9,479 | $10,031 |
|---|
12/22 | $9,242 | $9,956 |
|---|
1/23 | $10,123 | $10,763 |
|---|
2/23 | $9,744 | $10,385 |
|---|
3/23 | $10,417 | $10,639 |
|---|
4/23 | $10,701 | $10,824 |
|---|
5/23 | $10,351 | $10,430 |
|---|
6/23 | $10,720 | $10,898 |
|---|
7/23 | $10,777 | $11,342 |
|---|
8/23 | $10,294 | $10,829 |
|---|
9/23 | $9,659 | $10,487 |
|---|
10/23 | $9,232 | $10,055 |
|---|
11/23 | $10,171 | $10,960 |
|---|
12/23 | $10,726 | $11,510 |
|---|
1/24 | $10,755 | $11,396 |
|---|
2/24 | $11,074 | $11,684 |
|---|
3/24 | $11,025 | $12,050 |
|---|
4/24 | $10,717 | $11,833 |
|---|
5/24 | $11,257 | $12,177 |
|---|
6/24 | $11,122 | $12,165 |
|---|
7/24 | $11,286 | $12,447 |
|---|
8/24 | $11,787 | $12,801 |
|---|
9/24 | $12,077 | $13,146 |
|---|
10/24 | $11,324 | $12,501 |
|---|
11/24 | $11,199 | $12,388 |
|---|
12/24 | $11,080 | $12,147 |
|---|
|
|
| Average Annual Return [Table Text Block] |
AATR | 1 Year | Since 7/29/22
(Inception) |
|---|
Class A | 3.30% | 6.65% |
|---|
Class A, with 5.25% maximum front end sales charge | (2.16)% | 4.32% |
|---|
MSCI All Country World ex USA Net Index | 5.53% | 8.36% |
|---|
|
|
| Performance Inception Date |
Jul. 29, 2022
|
|
| AssetsNet |
$ 1,891,678
|
|
| Holdings Count | Holding |
40
|
|
| Advisory Fees Paid, Amount |
$ 0
|
|
| InvestmentCompanyPortfolioTurnover |
48.00%
|
|
| Additional Fund Statistics [Text Block] |
Total Net Assets | $1,891,678 |
|---|
# of Portfolio Holdings | 40 |
|---|
Portfolio Turnover Rate | 48% |
|---|
Total Advisory Fees Paid (Net of Waivers) | $0 |
|---|
|
|
| Holdings [Text Block] |
Country Weightings (% of total investments)Value | Value |
|---|
Other | 9.1% | Hong Kong | 2.6% | Canada | 2.6% | Finland | 2.6% | Italy | 3.5% | Sweden | 4.6% | Netherlands | 5.8% | United States | 12.2% | Germany | 16.3% | United Kingdom | 19.9% | France | 20.8% |
Top Ten Holdings (% of total investments)Footnote ReferenceaSAP SE | 6.4% | L'Oreal SA | 4.1% | Visa, Inc. | 3.8% | Halma PLC | 3.7% | Haleon PLC | 3.4% | QIAGEN NV | 3.2% | Deutsche Boerse AG | 3.2% | Hexagon AB | 3.1% | ASML Holding NV | 3.1% | Capgemini SE | 3.0% | Total | 37.0% |
| Footnote | Description | Footnotea | Excluding cash equivalents. |
|
|
| Material Fund Change [Text Block] |
|
|
| Updated Prospectus Web Address |
<span style="box-sizing: border-box; color: rgb(0, 0, 0); display: inline; flex-wrap: nowrap; font-size: 10.6667px; font-weight: 400; grid-area: auto; line-height: 16px; margin: 0px; overflow: visible; text-align: left;">www.morganstanley.com/im/shareholderreports</span>
|
|
| C000236928 |
|
|
| Shareholder Report [Line Items] |
|
|
| Fund Name |
Morgan Stanley Institutional Fund, Inc - International Resilience Portfolio
|
|
| Class Name |
Class C
|
|
| Trading Symbol |
MSDEX
|
|
| Annual or Semi-Annual Statement [Text Block] |
This annual shareholder report contains important information about Morgan Stanley Institutional Fund, Inc - International Resilience Portfolio for the period of January 1, 2024 to December 31, 2024.
|
|
| Shareholder Report Annual or Semi-Annual |
Annual Shareholder Report
|
|
| Additional Information [Text Block] |
You can find additional information about the Fund at www.morganstanley.com/im/shareholderreports. You can also request this information by contacting us at 1-800-869-6397.
|
|
| Additional Information Phone Number |
1-800-869-6397
|
|
| Additional Information Website |
<span style="box-sizing: border-box; color: rgb(0, 0, 0); display: inline; flex-wrap: nowrap; font-size: 10.6667px; font-weight: 400; grid-area: auto; line-height: 16px; margin: 0px; overflow: visible; text-align: left;">www.morganstanley.com/im/shareholderreports</span>
|
|
| Expenses [Text Block] |
What were the Fund costs for the last year?(based on a hypothetical $10,000 investment) Class Name | Costs of a $10,000 investment | Costs paid as a percentage of a $10,000 investment |
|---|
Class C | $197 | 1.95% |
|---|
|
|
| Expenses Paid, Amount |
$ 197
|
|
| Expense Ratio, Percent |
1.95%
|
|
| Factors Affecting Performance [Text Block] |
How did the Fund perform last year and what affected its performance?Key contributors to (↑) and detractors from (↓) performance, relative to the MSCI All Country World ex U.S. Net Index: ↓ Stock selection, largely driven by weakness in consumer staples, and to a lesser extent in communication services and industrials ↓The overweight to consumer staples and underweight to financials ↑ Sector allocation overall was positive, driven by the overweight in information technology and zero weights in materials and energy ↑ Stock selection in information technology |
|
| Line Graph [Table Text Block] |
| Class C | MSCI All Country World ex USA Net Index |
|---|
7/22 | $10,000 | $10,000 |
|---|
8/22 | $9,220 | $9,678 |
|---|
9/22 | $8,430 | $8,711 |
|---|
10/22 | $8,720 | $8,972 |
|---|
11/22 | $9,970 | $10,031 |
|---|
12/22 | $9,710 | $9,956 |
|---|
1/23 | $10,640 | $10,763 |
|---|
2/23 | $10,230 | $10,385 |
|---|
3/23 | $10,930 | $10,639 |
|---|
4/23 | $11,230 | $10,824 |
|---|
5/23 | $10,850 | $10,430 |
|---|
6/23 | $11,230 | $10,898 |
|---|
7/23 | $11,280 | $11,342 |
|---|
8/23 | $10,770 | $10,829 |
|---|
9/23 | $10,100 | $10,487 |
|---|
10/23 | $9,640 | $10,055 |
|---|
11/23 | $10,630 | $10,960 |
|---|
12/23 | $11,199 | $11,510 |
|---|
1/24 | $11,219 | $11,396 |
|---|
2/24 | $11,543 | $11,684 |
|---|
3/24 | $11,483 | $12,050 |
|---|
4/24 | $11,158 | $11,833 |
|---|
5/24 | $11,716 | $12,177 |
|---|
6/24 | $11,564 | $12,165 |
|---|
7/24 | $11,726 | $12,447 |
|---|
8/24 | $12,243 | $12,801 |
|---|
9/24 | $12,537 | $13,146 |
|---|
10/24 | $11,746 | $12,501 |
|---|
11/24 | $11,614 | $12,388 |
|---|
12/24 | $11,481 | $12,147 |
|---|
|
|
| Average Annual Return [Table Text Block] |
AATR | 1 Year | Since 7/29/22
(Inception) |
|---|
Class C | 2.52% | 5.86% |
|---|
Class C, with 1% maximum contingent deferred sales charge | 1.52% | 5.86% |
|---|
MSCI All Country World ex USA Net Index | 5.53% | 8.36% |
|---|
|
|
| Performance Inception Date |
Jul. 29, 2022
|
|
| AssetsNet |
$ 1,891,678
|
|
| Holdings Count | Holding |
40
|
|
| Advisory Fees Paid, Amount |
$ 0
|
|
| InvestmentCompanyPortfolioTurnover |
48.00%
|
|
| Additional Fund Statistics [Text Block] |
Total Net Assets | $1,891,678 |
|---|
# of Portfolio Holdings | 40 |
|---|
Portfolio Turnover Rate | 48% |
|---|
Total Advisory Fees Paid (Net of Waivers) | $0 |
|---|
|
|
| Holdings [Text Block] |
Country Weightings (% of total investments)Value | Value |
|---|
Other | 9.1% | Hong Kong | 2.6% | Canada | 2.6% | Finland | 2.6% | Italy | 3.5% | Sweden | 4.6% | Netherlands | 5.8% | United States | 12.2% | Germany | 16.3% | United Kingdom | 19.9% | France | 20.8% |
Top Ten Holdings (% of total investments)Footnote ReferenceaSAP SE | 6.4% | L'Oreal SA | 4.1% | Visa, Inc. | 3.8% | Halma PLC | 3.7% | Haleon PLC | 3.4% | QIAGEN NV | 3.2% | Deutsche Boerse AG | 3.2% | Hexagon AB | 3.1% | ASML Holding NV | 3.1% | Capgemini SE | 3.0% | Total | 37.0% |
| Footnote | Description | Footnotea | Excluding cash equivalents. |
|
|
| Material Fund Change [Text Block] |
|
|
| Updated Prospectus Web Address |
<span style="box-sizing: border-box; color: rgb(0, 0, 0); display: inline; flex-wrap: nowrap; font-size: 10.6667px; font-weight: 400; grid-area: auto; line-height: 16px; margin: 0px; overflow: visible; text-align: left;">www.morganstanley.com/im/shareholderreports</span>
|
|
| C000236927 |
|
|
| Shareholder Report [Line Items] |
|
|
| Fund Name |
Morgan Stanley Institutional Fund, Inc - International Resilience Portfolio
|
|
| Class Name |
Class I
|
|
| Trading Symbol |
MSDKX
|
|
| Annual or Semi-Annual Statement [Text Block] |
This annual shareholder report contains important information about Morgan Stanley Institutional Fund, Inc - International Resilience Portfolio for the period of January 1, 2024 to December 31, 2024.
|
|
| Shareholder Report Annual or Semi-Annual |
Annual Shareholder Report
|
|
| Additional Information [Text Block] |
You can find additional information about the Fund at www.morganstanley.com/im/shareholderreports. You can also request this information by contacting us at 1-800-869-6397.
|
|
| Additional Information Phone Number |
1-800-869-6397
|
|
| Additional Information Website |
<span style="box-sizing: border-box; color: rgb(0, 0, 0); display: inline; flex-wrap: nowrap; font-size: 10.6667px; font-weight: 400; grid-area: auto; line-height: 16px; margin: 0px; overflow: visible; text-align: left;">www.morganstanley.com/im/shareholderreports</span>
|
|
| Expenses [Text Block] |
What were the Fund costs for the last year?(based on a hypothetical $10,000 investment) Class Name | Costs of a $10,000 investment | Costs paid as a percentage of a $10,000 investment |
|---|
Class I | $87 | 0.85% |
|---|
|
|
| Expenses Paid, Amount |
$ 87
|
|
| Expense Ratio, Percent |
0.85%
|
|
| Factors Affecting Performance [Text Block] |
How did the Fund perform last year and what affected its performance?Key contributors to (↑) and detractors from (↓) performance, relative to the MSCI All Country World ex U.S. Net Index: ↓ Stock selection, largely driven by weakness in consumer staples, and to a lesser extent in communication services and industrials ↓The overweight to consumer staples and underweight to financials ↑ Sector allocation overall was positive, driven by the overweight in information technology and zero weights in materials and energy ↑ Stock selection in information technology |
|
| Line Graph [Table Text Block] |
| Class I | MSCI All Country World ex USA Net Index |
|---|
7/22 | $1,000,000 | $1,000,000 |
|---|
8/22 | $923,000 | $1,000,000 |
|---|
9/22 | $845,000 | $871,121 |
|---|
10/22 | $875,000 | $897,152 |
|---|
11/22 | $1,001,000 | $1,003,058 |
|---|
12/22 | $976,000 | $995,558 |
|---|
1/23 | $1,070,000 | $1,076,306 |
|---|
2/23 | $1,030,000 | $1,038,526 |
|---|
3/23 | $1,102,000 | $1,063,913 |
|---|
4/23 | $1,132,000 | $1,082,396 |
|---|
5/23 | $1,095,000 | $1,043,042 |
|---|
6/23 | $1,134,000 | $1,089,843 |
|---|
7/23 | $1,141,000 | $1,134,152 |
|---|
8/23 | $1,090,000 | $1,082,927 |
|---|
9/23 | $1,024,000 | $1,048,724 |
|---|
10/23 | $978,000 | $1,005,455 |
|---|
11/23 | $1,078,000 | $1,095,961 |
|---|
12/23 | $1,137,475 | $1,151,024 |
|---|
1/24 | $1,140,538 | $1,139,591 |
|---|
2/24 | $1,175,255 | $1,168,442 |
|---|
3/24 | $1,170,149 | $1,204,967 |
|---|
4/24 | $1,137,475 | $1,183,329 |
|---|
5/24 | $1,195,676 | $1,217,680 |
|---|
6/24 | $1,181,381 | $1,216,522 |
|---|
7/24 | $1,198,739 | $1,244,690 |
|---|
8/24 | $1,252,856 | $1,280,138 |
|---|
9/24 | $1,284,509 | $1,314,609 |
|---|
10/24 | $1,204,866 | $1,250,108 |
|---|
11/24 | $1,191,592 | $1,238,792 |
|---|
12/24 | $1,179,010 | $1,214,722 |
|---|
|
|
| Average Annual Return [Table Text Block] |
AATR | 1 Year | Since 7/29/22
(Inception) |
|---|
Class I | 3.65% | 7.03% |
|---|
MSCI All Country World ex USA Net Index | 5.53% | 8.36% |
|---|
|
|
| Performance Inception Date |
Jul. 29, 2022
|
|
| AssetsNet |
$ 1,891,678
|
|
| Holdings Count | Holding |
40
|
|
| Advisory Fees Paid, Amount |
$ 0
|
|
| InvestmentCompanyPortfolioTurnover |
48.00%
|
|
| Additional Fund Statistics [Text Block] |
Total Net Assets | $1,891,678 |
|---|
# of Portfolio Holdings | 40 |
|---|
Portfolio Turnover Rate | 48% |
|---|
Total Advisory Fees Paid (Net of Waivers) | $0 |
|---|
|
|
| Holdings [Text Block] |
Country Weightings (% of total investments)Value | Value |
|---|
Other | 9.1% | Hong Kong | 2.6% | Canada | 2.6% | Finland | 2.6% | Italy | 3.5% | Sweden | 4.6% | Netherlands | 5.8% | United States | 12.2% | Germany | 16.3% | United Kingdom | 19.9% | France | 20.8% |
Top Ten Holdings (% of total investments)Footnote ReferenceaSAP SE | 6.4% | L'Oreal SA | 4.1% | Visa, Inc. | 3.8% | Halma PLC | 3.7% | Haleon PLC | 3.4% | QIAGEN NV | 3.2% | Deutsche Boerse AG | 3.2% | Hexagon AB | 3.1% | ASML Holding NV | 3.1% | Capgemini SE | 3.0% | Total | 37.0% |
| Footnote | Description | Footnotea | Excluding cash equivalents. |
|
|
| Material Fund Change [Text Block] |
|
|
| Updated Prospectus Web Address |
<span style="box-sizing: border-box; color: rgb(0, 0, 0); display: inline; flex-wrap: nowrap; font-size: 10.6667px; font-weight: 400; grid-area: auto; line-height: 16px; margin: 0px; overflow: visible; text-align: left;">www.morganstanley.com/im/shareholderreports</span>
|
|
| C000236929 |
|
|
| Shareholder Report [Line Items] |
|
|
| Fund Name |
Morgan Stanley Institutional Fund, Inc - International Resilience Portfolio
|
|
| Class Name |
Class R6
|
|
| Trading Symbol |
MSCZX
|
|
| Annual or Semi-Annual Statement [Text Block] |
This annual shareholder report contains important information about Morgan Stanley Institutional Fund, Inc - International Resilience Portfolio for the period of January 1, 2024 to December 31, 2024.
|
|
| Shareholder Report Annual or Semi-Annual |
Annual Shareholder Report
|
|
| Additional Information [Text Block] |
You can find additional information about the Fund at www.morganstanley.com/im/shareholderreports. You can also request this information by contacting us at 1-800-869-6397.
|
|
| Additional Information Phone Number |
1-800-869-6397
|
|
| Additional Information Website |
<span style="box-sizing: border-box; color: rgb(0, 0, 0); display: inline; flex-wrap: nowrap; font-size: 10.6667px; font-weight: 400; grid-area: auto; line-height: 16px; margin: 0px; overflow: visible; text-align: left;">www.morganstanley.com/im/shareholderreports</span>
|
|
| Expenses [Text Block] |
What were the Fund costs for the last year?(based on a hypothetical $10,000 investment) Class Name | Costs of a $10,000 investment | Costs paid as a percentage of a $10,000 investment |
|---|
Class R6 | $82 | 0.80% |
|---|
|
|
| Expenses Paid, Amount |
$ 82
|
|
| Expense Ratio, Percent |
0.80%
|
|
| Factors Affecting Performance [Text Block] |
How did the Fund perform last year and what affected its performance?Key contributors to (↑) and detractors from (↓) performance, relative to the MSCI All Country World ex U.S. Net Index: ↓ Stock selection, largely driven by weakness in consumer staples, and to a lesser extent in communication services and industrials ↓The overweight to consumer staples and underweight to financials ↑ Sector allocation overall was positive, driven by the overweight in information technology and zero weights in materials and energy ↑ Stock selection in information technology |
|
| Line Graph [Table Text Block] |
| Class R6 | MSCI All Country World ex USA Net Index |
|---|
7/22 | $5,000,000 | $5,000,000 |
|---|
8/22 | $4,615,000 | $5,000,000 |
|---|
9/22 | $4,225,000 | $4,355,607 |
|---|
10/22 | $4,375,000 | $4,485,758 |
|---|
11/22 | $5,005,000 | $5,015,291 |
|---|
12/22 | $4,880,000 | $4,977,789 |
|---|
1/23 | $5,350,000 | $5,381,528 |
|---|
2/23 | $5,150,000 | $5,192,628 |
|---|
3/23 | $5,510,000 | $5,319,565 |
|---|
4/23 | $5,660,000 | $5,411,981 |
|---|
5/23 | $5,475,000 | $5,215,212 |
|---|
6/23 | $5,675,000 | $5,449,215 |
|---|
7/23 | $5,705,000 | $5,670,760 |
|---|
8/23 | $5,455,000 | $5,414,637 |
|---|
9/23 | $5,120,000 | $5,243,621 |
|---|
10/23 | $4,895,000 | $5,027,275 |
|---|
11/23 | $5,395,000 | $5,479,803 |
|---|
12/23 | $5,690,028 | $5,755,119 |
|---|
1/24 | $5,705,351 | $5,697,953 |
|---|
2/24 | $5,879,014 | $5,842,209 |
|---|
3/24 | $5,853,476 | $6,024,836 |
|---|
4/24 | $5,690,028 | $5,916,647 |
|---|
5/24 | $5,981,169 | $6,088,399 |
|---|
6/24 | $5,914,769 | $6,082,609 |
|---|
7/24 | $6,001,600 | $6,223,449 |
|---|
8/24 | $6,267,203 | $6,400,688 |
|---|
9/24 | $6,430,651 | $6,573,044 |
|---|
10/24 | $6,032,247 | $6,250,539 |
|---|
11/24 | $5,965,846 | $6,193,960 |
|---|
12/24 | $5,905,943 | $6,073,610 |
|---|
|
|
| Average Annual Return [Table Text Block] |
AATR | 1 Year | Since 7/29/22
(Inception) |
|---|
Class R6 | 3.79% | 7.11% |
|---|
MSCI All Country World ex USA Net Index | 5.53% | 8.36% |
|---|
|
|
| Performance Inception Date |
Jul. 29, 2022
|
|
| AssetsNet |
$ 1,891,678
|
|
| Holdings Count | Holding |
40
|
|
| Advisory Fees Paid, Amount |
$ 0
|
|
| InvestmentCompanyPortfolioTurnover |
48.00%
|
|
| Additional Fund Statistics [Text Block] |
Total Net Assets | $1,891,678 |
|---|
# of Portfolio Holdings | 40 |
|---|
Portfolio Turnover Rate | 48% |
|---|
Total Advisory Fees Paid (Net of Waivers) | $0 |
|---|
|
|
| Holdings [Text Block] |
Country Weightings (% of total investments)Value | Value |
|---|
Other | 9.1% | Hong Kong | 2.6% | Canada | 2.6% | Finland | 2.6% | Italy | 3.5% | Sweden | 4.6% | Netherlands | 5.8% | United States | 12.2% | Germany | 16.3% | United Kingdom | 19.9% | France | 20.8% |
Top Ten Holdings (% of total investments)Footnote ReferenceaSAP SE | 6.4% | L'Oreal SA | 4.1% | Visa, Inc. | 3.8% | Halma PLC | 3.7% | Haleon PLC | 3.4% | QIAGEN NV | 3.2% | Deutsche Boerse AG | 3.2% | Hexagon AB | 3.1% | ASML Holding NV | 3.1% | Capgemini SE | 3.0% | Total | 37.0% |
| Footnote | Description | Footnotea | Excluding cash equivalents. |
|
|
| Material Fund Change [Text Block] |
|
|
| Updated Prospectus Web Address |
<span style="box-sizing: border-box; color: rgb(0, 0, 0); display: inline; flex-wrap: nowrap; font-size: 10.6667px; font-weight: 400; grid-area: auto; line-height: 16px; margin: 0px; overflow: visible; text-align: left;">www.morganstanley.com/im/shareholderreports</span>
|
|
| C000200800 |
|
|
| Shareholder Report [Line Items] |
|
|
| Fund Name |
Morgan Stanley Institutional Fund, Inc. - Multi-Asset Real Return Portfolio
|
|
| Class Name |
Class A
|
|
| Trading Symbol |
MRJAX
|
|
| Annual or Semi-Annual Statement [Text Block] |
This annual shareholder report contains important information about Morgan Stanley Institutional Fund, Inc. - Multi-Asset Real Return Portfolio for the period of January 1, 2024 to December 31, 2024.
|
|
| Shareholder Report Annual or Semi-Annual |
Annual Shareholder Report
|
|
| Additional Information [Text Block] |
You can find additional information about the Fund at www.morganstanley.com/im/shareholderreports. You can also request this information by contacting us at 1-800-869-6397.
|
|
| Additional Information Phone Number |
1-800-869-6397
|
|
| Additional Information Website |
<span style="box-sizing: border-box; color: rgb(0, 0, 0); display: inline; flex-wrap: nowrap; font-size: 10.6667px; font-weight: 400; grid-area: auto; line-height: 16px; margin: 0px; overflow: visible; text-align: left;">www.morganstanley.com/im/shareholderreports</span>
|
|
| Expenses [Text Block] |
What were the Fund costs for the last year?(based on a hypothetical $10,000 investment) Class Name | Costs of a $10,000 investment | Costs paid as a percentage of a $10,000 investment |
|---|
Class A | $111 | 1.11% |
|---|
|
|
| Expenses Paid, Amount |
$ 111
|
|
| Expense Ratio, Percent |
1.11%
|
|
| Factors Affecting Performance [Text Block] |
How did the Fund perform last year and what affected its performance?Key contributors to (↑) and detractors from (↓) performance, relative to the Bloomberg U.S. Treasury Bills 1-3 Month Index: ↓ A long position in GSCI commodities detracted due to weakness in energy prices in the second half of the year ↓ A long position in world energy stocks was negatively impacted by falling energy prices following the peak in April 2024 ↓ A long position in world materials stocks was weighed down by weaker industrial production and demand for input goods ↑ A long position in U.S. 10-year Treasury inflation-protected securities (TIPS) contributed as the Federal Reserve cut interests rates in 2024 ↑A long position in gold benefited from falling interest rates and heightened geopolitical uncertainty ↑ A long position in Brent oil, held early in the year, contributed as rising geopolitical tensions caused oil prices to peak in April |
|
| Line Graph [Table Text Block] |
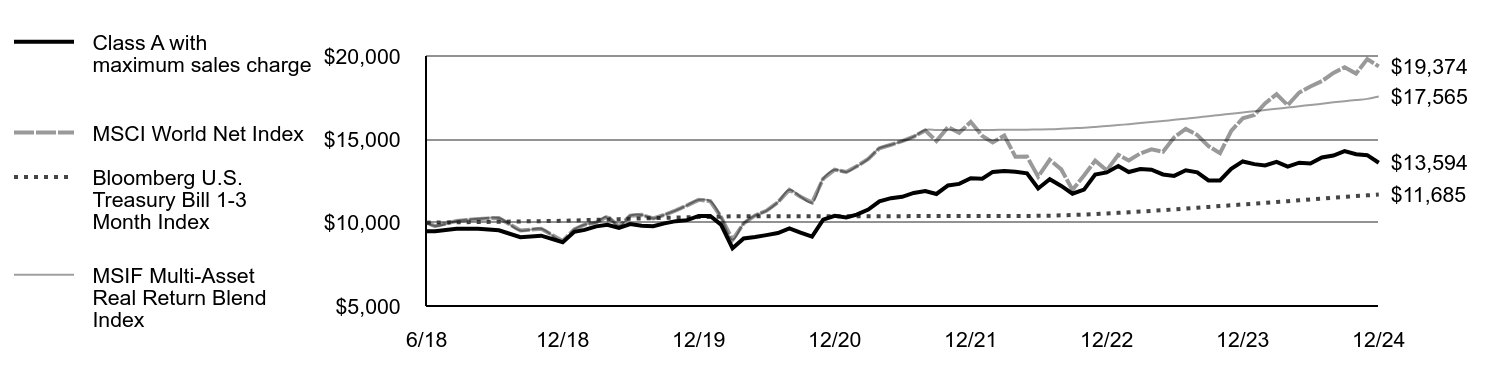 | Class A with maximum sales charge | MSCI World Net Index | Bloomberg U.S. Treasury Bill 1-3 Month Index | MSIF Multi-Asset Real Return Blend Index |
|---|
6/18 | $9,479 | $10,000 | $10,000 | $10,000 |
|---|
6/18 | $9,479 | $9,795 | $10,007 | $9,795 |
|---|
7/18 | $9,630 | $10,101 | $10,022 | $10,101 |
|---|
8/18 | $9,630 | $10,226 | $10,039 | $10,226 |
|---|
9/18 | $9,545 | $10,283 | $10,055 | $10,283 |
|---|
10/18 | $9,124 | $9,528 | $10,073 | $9,528 |
|---|
11/18 | $9,219 | $9,636 | $10,092 | $9,636 |
|---|
12/18 | $8,824 | $8,903 | $10,111 | $8,903 |
|---|
1/19 | $9,448 | $9,596 | $10,131 | $9,596 |
|---|
2/19 | $9,565 | $9,885 | $10,150 | $9,885 |
|---|
3/19 | $9,779 | $10,014 | $10,171 | $10,014 |
|---|
4/19 | $9,877 | $10,370 | $10,191 | $10,370 |
|---|
5/19 | $9,681 | $9,771 | $10,212 | $9,771 |
|---|
6/19 | $9,916 | $10,415 | $10,234 | $10,415 |
|---|
7/19 | $9,819 | $10,467 | $10,253 | $10,467 |
|---|
8/19 | $9,790 | $10,253 | $10,271 | $10,253 |
|---|
9/19 | $9,957 | $10,471 | $10,289 | $10,471 |
|---|
10/19 | $10,092 | $10,737 | $10,307 | $10,737 |
|---|
11/19 | $10,151 | $11,036 | $10,320 | $11,036 |
|---|
12/19 | $10,406 | $11,367 | $10,334 | $11,367 |
|---|
1/20 | $10,406 | $11,298 | $10,347 | $11,298 |
|---|
2/20 | $9,883 | $10,343 | $10,361 | $10,343 |
|---|
3/20 | $8,469 | $8,974 | $10,383 | $8,974 |
|---|
4/20 | $9,054 | $9,954 | $10,383 | $9,954 |
|---|
5/20 | $9,144 | $10,435 | $10,384 | $10,435 |
|---|
6/20 | $9,253 | $10,711 | $10,385 | $10,711 |
|---|
7/20 | $9,375 | $11,224 | $10,386 | $11,224 |
|---|
8/20 | $9,663 | $11,974 | $10,387 | $11,974 |
|---|
9/20 | $9,405 | $11,560 | $10,388 | $11,560 |
|---|
10/20 | $9,166 | $11,206 | $10,389 | $11,206 |
|---|
11/20 | $10,183 | $12,639 | $10,389 | $12,639 |
|---|
12/20 | $10,413 | $13,175 | $10,390 | $13,175 |
|---|
1/21 | $10,313 | $13,044 | $10,391 | $13,044 |
|---|
2/21 | $10,483 | $13,378 | $10,392 | $13,378 |
|---|
3/21 | $10,784 | $13,823 | $10,392 | $13,823 |
|---|
4/21 | $11,278 | $14,466 | $10,392 | $14,466 |
|---|
5/21 | $11,469 | $14,675 | $10,392 | $14,675 |
|---|
6/21 | $11,549 | $14,893 | $10,392 | $14,893 |
|---|
7/21 | $11,782 | $15,160 | $10,393 | $15,160 |
|---|
8/21 | $11,903 | $15,537 | $10,393 | $15,563 |
|---|
9/21 | $11,722 | $14,892 | $10,393 | $15,563 |
|---|
10/21 | $12,236 | $15,736 | $10,393 | $15,563 |
|---|
11/21 | $12,327 | $15,391 | $10,394 | $15,564 |
|---|
12/21 | $12,665 | $16,049 | $10,395 | $15,565 |
|---|
1/22 | $12,641 | $15,200 | $10,395 | $15,565 |
|---|
2/22 | $13,046 | $14,815 | $10,396 | $15,567 |
|---|
3/22 | $13,093 | $15,222 | $10,398 | $15,570 |
|---|
4/22 | $13,058 | $13,957 | $10,400 | $15,573 |
|---|
5/22 | $12,965 | $13,968 | $10,405 | $15,581 |
|---|
6/22 | $12,052 | $12,758 | $10,411 | $15,589 |
|---|
7/22 | $12,607 | $13,771 | $10,419 | $15,602 |
|---|
8/22 | $12,202 | $13,195 | $10,439 | $15,631 |
|---|
9/22 | $11,739 | $11,969 | $10,460 | $15,663 |
|---|
10/22 | $11,982 | $12,828 | $10,483 | $15,697 |
|---|
11/22 | $12,884 | $13,720 | $10,516 | $15,746 |
|---|
12/22 | $13,012 | $13,137 | $10,553 | $15,802 |
|---|
1/23 | $13,398 | $14,067 | $10,588 | $15,855 |
|---|
2/23 | $13,037 | $13,729 | $10,625 | $15,911 |
|---|
3/23 | $13,217 | $14,153 | $10,668 | $15,974 |
|---|
4/23 | $13,181 | $14,401 | $10,709 | $16,036 |
|---|
5/23 | $12,892 | $14,257 | $10,752 | $16,101 |
|---|
6/23 | $12,808 | $15,119 | $10,798 | $16,170 |
|---|
7/23 | $13,145 | $15,627 | $10,846 | $16,241 |
|---|
8/23 | $13,024 | $15,254 | $10,895 | $16,315 |
|---|
9/23 | $12,531 | $14,596 | $10,944 | $16,387 |
|---|
10/23 | $12,531 | $14,173 | $10,994 | $16,463 |
|---|
11/23 | $13,229 | $15,501 | $11,043 | $16,536 |
|---|
12/23 | $13,674 | $16,262 | $11,095 | $16,613 |
|---|
1/24 | $13,511 | $16,457 | $11,143 | $16,686 |
|---|
2/24 | $13,435 | $17,155 | $11,190 | $16,756 |
|---|
3/24 | $13,649 | $17,706 | $11,241 | $16,833 |
|---|
4/24 | $13,360 | $17,049 | $11,290 | $16,906 |
|---|
5/24 | $13,599 | $17,810 | $11,345 | $16,988 |
|---|
6/24 | $13,549 | $18,172 | $11,392 | $17,059 |
|---|
7/24 | $13,913 | $18,493 | $11,443 | $17,136 |
|---|
8/24 | $14,027 | $18,981 | $11,499 | $17,218 |
|---|
9/24 | $14,291 | $19,329 | $11,547 | $17,291 |
|---|
10/24 | $14,102 | $18,946 | $11,593 | $17,360 |
|---|
11/24 | $14,052 | $19,815 | $11,639 | $17,428 |
|---|
12/24 | $13,594 | $19,374 | $11,685 | $17,565 |
|---|
|
|
| Average Annual Return [Table Text Block] |
AATR | 1 Year | 5 Years | Since 6/18/18
(Inception) |
|---|
Class A | (0.59)% | 5.49% | 5.67% |
|---|
Class A, with 5.25% maximum front end sales charge | (5.79)% | 4.36% | 4.81% |
|---|
MSCI World Net Index | 18.67% | 11.17% | 10.65% |
|---|
Bloomberg U.S. Treasury Bill 1-3 Month Index | 5.32% | 2.49% | 2.41% |
|---|
MSIF Multi-Asset Real Return Blend Index | 5.32% | 9.01% | 9.00% |
|---|
|
|
| Performance Inception Date |
Jun. 18, 2018
|
|
| AssetsNet |
$ 7,415,322
|
|
| Holdings Count | Holding |
216
|
|
| Advisory Fees Paid, Amount |
$ 0
|
|
| InvestmentCompanyPortfolioTurnover |
310.00%
|
|
| Additional Fund Statistics [Text Block] |
Total Net Assets | $7,415,322 |
|---|
# of Portfolio Holdings | 216 |
|---|
Portfolio Turnover Rate | 310% |
|---|
Total Advisory Fees Paid (Net of Waivers) | $0 |
|---|
|
|
| Holdings [Text Block] |
Country Weightings (% of total investments)Value | Value |
|---|
Other | 1.0% | China | 0.3% | South Africa | 0.3% | Germany | 0.4% | Switzerland | 0.6% | Japan | 0.7% | France | 0.8% | Australia | 1.7% | United Kingdom | 1.9% | Canada | 4.6% | United States | 87.7% |
|
|
| Material Fund Change [Text Block] |
|
|
| Updated Prospectus Web Address |
<span style="box-sizing: border-box; color: rgb(0, 0, 0); display: inline; flex-wrap: nowrap; font-size: 10.6667px; font-weight: 400; grid-area: auto; line-height: 16px; margin: 0px; overflow: visible; text-align: left;">www.morganstanley.com/im/shareholderreports</span>
|
|
| C000200801 |
|
|
| Shareholder Report [Line Items] |
|
|
| Fund Name |
Morgan Stanley Institutional Fund, Inc. - Multi-Asset Real Return Portfolio
|
|
| Class Name |
Class C
|
|
| Trading Symbol |
MRJCX
|
|
| Annual or Semi-Annual Statement [Text Block] |
This annual shareholder report contains important information about Morgan Stanley Institutional Fund, Inc. - Multi-Asset Real Return Portfolio for the period of January 1, 2024 to December 31, 2024.
|
|
| Shareholder Report Annual or Semi-Annual |
Annual Shareholder Report
|
|
| Additional Information [Text Block] |
You can find additional information about the Fund at www.morganstanley.com/im/shareholderreports. You can also request this information by contacting us at 1-800-869-6397.
|
|
| Additional Information Phone Number |
1-800-869-6397
|
|
| Additional Information Website |
<span style="box-sizing: border-box; color: rgb(0, 0, 0); display: inline; flex-wrap: nowrap; font-size: 10.6667px; font-weight: 400; grid-area: auto; line-height: 16px; margin: 0px; overflow: visible; text-align: left;">www.morganstanley.com/im/shareholderreports</span>
|
|
| Expenses [Text Block] |
What were the Fund costs for the last year?(based on a hypothetical $10,000 investment) Class Name | Costs of a $10,000 investment | Costs paid as a percentage of a $10,000 investment |
|---|
Class C | $184 | 1.85% |
|---|
|
|
| Expenses Paid, Amount |
$ 184
|
|
| Expense Ratio, Percent |
1.85%
|
|
| Factors Affecting Performance [Text Block] |
How did the Fund perform last year and what affected its performance?Key contributors to (↑) and detractors from (↓) performance, relative to the Bloomberg U.S. Treasury Bills 1-3 Month Index: ↓ A long position in GSCI commodities detracted due to weakness in energy prices in the second half of the year ↓ A long position in world energy stocks was negatively impacted by falling energy prices following the peak in April 2024 ↓ A long position in world materials stocks was weighed down by weaker industrial production and demand for input goods ↑ A long position in U.S. 10-year Treasury inflation-protected securities (TIPS) contributed as the Federal Reserve cut interests rates in 2024 ↑A long position in gold benefited from falling interest rates and heightened geopolitical uncertainty ↑ A long position in Brent oil, held early in the year, contributed as rising geopolitical tensions caused oil prices to peak in April |
|
| Line Graph [Table Text Block] |
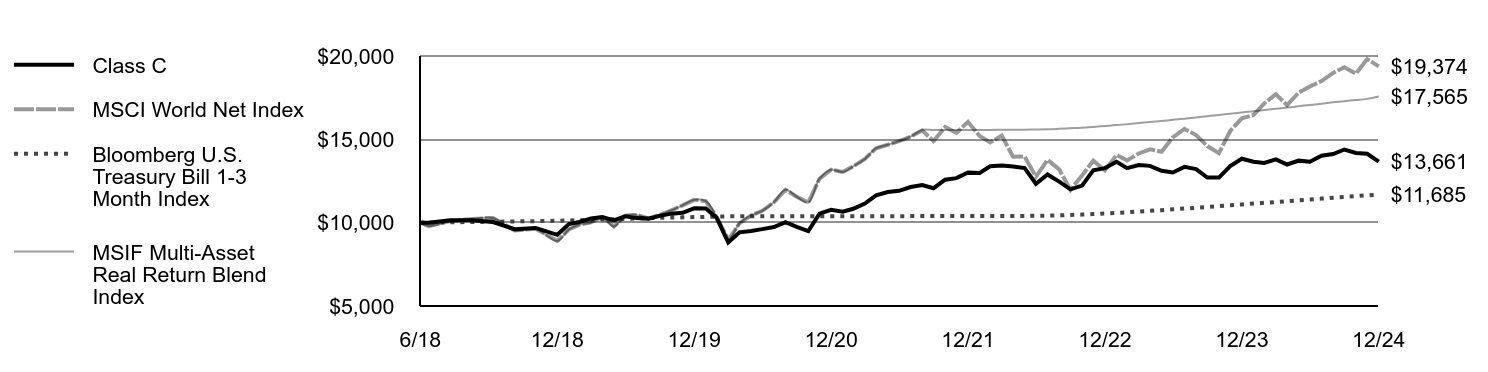 | Class C | MSCI World Net Index | Bloomberg U.S. Treasury Bill 1-3 Month Index | MSIF Multi-Asset Real Return Blend Index |
|---|
6/18 | $10,000 | $10,000 | $10,000 | $10,000 |
|---|
6/18 | $9,990 | $9,795 | $10,007 | $9,795 |
|---|
7/18 | $10,150 | $10,101 | $10,022 | $10,101 |
|---|
8/18 | $10,140 | $10,226 | $10,039 | $10,226 |
|---|
9/18 | $10,040 | $10,283 | $10,055 | $10,283 |
|---|
10/18 | $9,605 | $9,528 | $10,073 | $9,528 |
|---|
11/18 | $9,685 | $9,636 | $10,092 | $9,636 |
|---|
12/18 | $9,273 | $8,903 | $10,111 | $8,903 |
|---|
1/19 | $9,917 | $9,596 | $10,131 | $9,596 |
|---|
2/19 | $10,040 | $9,885 | $10,150 | $9,885 |
|---|
3/19 | $10,255 | $10,014 | $10,171 | $10,014 |
|---|
4/19 | $10,345 | $10,370 | $10,191 | $10,370 |
|---|
5/19 | $10,140 | $9,771 | $10,212 | $9,771 |
|---|
6/19 | $10,386 | $10,415 | $10,234 | $10,415 |
|---|
7/19 | $10,273 | $10,467 | $10,253 | $10,467 |
|---|
8/19 | $10,243 | $10,253 | $10,271 | $10,253 |
|---|
9/19 | $10,407 | $10,471 | $10,289 | $10,471 |
|---|
10/19 | $10,542 | $10,737 | $10,307 | $10,737 |
|---|
11/19 | $10,594 | $11,036 | $10,320 | $11,036 |
|---|
12/19 | $10,860 | $11,367 | $10,334 | $11,367 |
|---|
1/20 | $10,849 | $11,298 | $10,347 | $11,298 |
|---|
2/20 | $10,291 | $10,343 | $10,361 | $10,343 |
|---|
3/20 | $8,812 | $8,974 | $10,383 | $8,974 |
|---|
4/20 | $9,417 | $9,954 | $10,383 | $9,954 |
|---|
5/20 | $9,500 | $10,435 | $10,384 | $10,435 |
|---|
6/20 | $9,614 | $10,711 | $10,385 | $10,711 |
|---|
7/20 | $9,740 | $11,224 | $10,386 | $11,224 |
|---|
8/20 | $10,030 | $11,974 | $10,387 | $11,974 |
|---|
9/20 | $9,750 | $11,560 | $10,388 | $11,560 |
|---|
10/20 | $9,493 | $11,206 | $10,389 | $11,206 |
|---|
11/20 | $10,542 | $12,639 | $10,389 | $12,639 |
|---|
12/20 | $10,772 | $13,175 | $10,390 | $13,175 |
|---|
1/21 | $10,657 | $13,044 | $10,391 | $13,044 |
|---|
2/21 | $10,834 | $13,378 | $10,392 | $13,378 |
|---|
3/21 | $11,146 | $13,823 | $10,392 | $13,823 |
|---|
4/21 | $11,641 | $14,466 | $10,392 | $14,466 |
|---|
5/21 | $11,839 | $14,675 | $10,392 | $14,675 |
|---|
6/21 | $11,912 | $14,893 | $10,392 | $14,893 |
|---|
7/21 | $12,140 | $15,160 | $10,393 | $15,160 |
|---|
8/21 | $12,255 | $15,537 | $10,393 | $15,563 |
|---|
9/21 | $12,067 | $14,892 | $10,393 | $15,563 |
|---|
10/21 | $12,579 | $15,736 | $10,393 | $15,563 |
|---|
11/21 | $12,673 | $15,391 | $10,394 | $15,564 |
|---|
12/21 | $13,013 | $16,049 | $10,395 | $15,565 |
|---|
1/22 | $12,977 | $15,200 | $10,395 | $15,565 |
|---|
2/22 | $13,383 | $14,815 | $10,396 | $15,567 |
|---|
3/22 | $13,430 | $15,222 | $10,398 | $15,570 |
|---|
4/22 | $13,371 | $13,957 | $10,400 | $15,573 |
|---|
5/22 | $13,275 | $13,968 | $10,405 | $15,581 |
|---|
6/22 | $12,332 | $12,758 | $10,411 | $15,589 |
|---|
7/22 | $12,893 | $13,771 | $10,419 | $15,602 |
|---|
8/22 | $12,463 | $13,195 | $10,439 | $15,631 |
|---|
9/22 | $11,998 | $11,969 | $10,460 | $15,663 |
|---|
10/22 | $12,225 | $12,828 | $10,483 | $15,697 |
|---|
11/22 | $13,144 | $13,720 | $10,516 | $15,746 |
|---|
12/22 | $13,273 | $13,137 | $10,553 | $15,802 |
|---|
1/23 | $13,657 | $14,067 | $10,588 | $15,855 |
|---|
2/23 | $13,273 | $13,729 | $10,625 | $15,911 |
|---|
3/23 | $13,459 | $14,153 | $10,668 | $15,974 |
|---|
4/23 | $13,409 | $14,401 | $10,709 | $16,036 |
|---|
5/23 | $13,112 | $14,257 | $10,752 | $16,101 |
|---|
6/23 | $13,013 | $15,119 | $10,798 | $16,170 |
|---|
7/23 | $13,347 | $15,627 | $10,846 | $16,241 |
|---|
8/23 | $13,211 | $15,254 | $10,895 | $16,315 |
|---|
9/23 | $12,704 | $14,596 | $10,944 | $16,387 |
|---|
10/23 | $12,704 | $14,173 | $10,994 | $16,463 |
|---|
11/23 | $13,397 | $15,501 | $11,043 | $16,536 |
|---|
12/23 | $13,837 | $16,262 | $11,095 | $16,613 |
|---|
1/24 | $13,657 | $16,457 | $11,143 | $16,686 |
|---|
2/24 | $13,580 | $17,155 | $11,190 | $16,756 |
|---|
3/24 | $13,798 | $17,706 | $11,241 | $16,833 |
|---|
4/24 | $13,490 | $17,049 | $11,290 | $16,906 |
|---|
5/24 | $13,721 | $17,810 | $11,345 | $16,988 |
|---|
6/24 | $13,657 | $18,172 | $11,392 | $17,059 |
|---|
7/24 | $14,016 | $18,493 | $11,443 | $17,136 |
|---|
8/24 | $14,119 | $18,981 | $11,499 | $17,218 |
|---|
9/24 | $14,389 | $19,329 | $11,547 | $17,291 |
|---|
10/24 | $14,183 | $18,946 | $11,593 | $17,360 |
|---|
11/24 | $14,132 | $19,815 | $11,639 | $17,428 |
|---|
12/24 | $13,661 | $19,374 | $11,685 | $17,565 |
|---|
|
|
| Average Annual Return [Table Text Block] |
AATR | 1 Year | 5 Years | Since 6/18/18
(Inception) |
|---|
Class C | (1.27)% | 4.70% | 4.89% |
|---|
Class C, with 1% maximum contingent deferred sales charge | (2.17)% | 4.70% | 4.89% |
|---|
MSCI World Net Index | 18.67% | 11.17% | 10.65% |
|---|
Bloomberg U.S. Treasury Bill 1-3 Month Index | 5.32% | 2.49% | 2.41% |
|---|
MSIF Multi-Asset Real Return Blend Index | 5.32% | 9.01% | 9.00% |
|---|
|
|
| Performance Inception Date |
Jun. 18, 2018
|
|
| AssetsNet |
$ 7,415,322
|
|
| Holdings Count | Holding |
216
|
|
| Advisory Fees Paid, Amount |
$ 0
|
|
| InvestmentCompanyPortfolioTurnover |
310.00%
|
|
| Additional Fund Statistics [Text Block] |
Total Net Assets | $7,415,322 |
|---|
# of Portfolio Holdings | 216 |
|---|
Portfolio Turnover Rate | 310% |
|---|
Total Advisory Fees Paid (Net of Waivers) | $0 |
|---|
|
|
| Holdings [Text Block] |
Country Weightings (% of total investments)Value | Value |
|---|
Other | 1.0% | China | 0.3% | South Africa | 0.3% | Germany | 0.4% | Switzerland | 0.6% | Japan | 0.7% | France | 0.8% | Australia | 1.7% | United Kingdom | 1.9% | Canada | 4.6% | United States | 87.7% |
|
|
| Material Fund Change [Text Block] |
|
|
| Updated Prospectus Web Address |
<span style="box-sizing: border-box; color: rgb(0, 0, 0); display: inline; flex-wrap: nowrap; font-size: 10.6667px; font-weight: 400; grid-area: auto; line-height: 16px; margin: 0px; overflow: visible; text-align: left;">www.morganstanley.com/im/shareholderreports</span>
|
|
| C000200799 |
|
|
| Shareholder Report [Line Items] |
|
|
| Fund Name |
Morgan Stanley Institutional Fund, Inc. - Multi-Asset Real Return Portfolio
|
|
| Class Name |
Class I
|
|
| Trading Symbol |
MRJIX
|
|
| Annual or Semi-Annual Statement [Text Block] |
This annual shareholder report contains important information about Morgan Stanley Institutional Fund, Inc. - Multi-Asset Real Return Portfolio for the period of January 1, 2024 to December 31, 2024.
|
|
| Shareholder Report Annual or Semi-Annual |
Annual Shareholder Report
|
|
| Additional Information [Text Block] |
You can find additional information about the Fund at www.morganstanley.com/im/shareholderreports. You can also request this information by contacting us at 1-800-869-6397.
|
|
| Additional Information Phone Number |
1-800-869-6397
|
|
| Additional Information Website |
<span style="box-sizing: border-box; color: rgb(0, 0, 0); display: inline; flex-wrap: nowrap; font-size: 10.6667px; font-weight: 400; grid-area: auto; line-height: 16px; margin: 0px; overflow: visible; text-align: left;">www.morganstanley.com/im/shareholderreports</span>
|
|
| Expenses [Text Block] |
What were the Fund costs for the last year?(based on a hypothetical $10,000 investment) Class Name | Costs of a $10,000 investment | Costs paid as a percentage of a $10,000 investment |
|---|
Class I | $75 | 0.75% |
|---|
|
|
| Expenses Paid, Amount |
$ 75
|
|
| Expense Ratio, Percent |
0.75%
|
|
| Factors Affecting Performance [Text Block] |
How did the Fund perform last year and what affected its performance?Key contributors to (↑) and detractors from (↓) performance, relative to the Bloomberg U.S. Treasury Bills 1-3 Month Index: ↓ A long position in GSCI commodities detracted due to weakness in energy prices in the second half of the year ↓ A long position in world energy stocks was negatively impacted by falling energy prices following the peak in April 2024 ↓ A long position in world materials stocks was weighed down by weaker industrial production and demand for input goods ↑ A long position in U.S. 10-year Treasury inflation-protected securities (TIPS) contributed as the Federal Reserve cut interests rates in 2024 ↑A long position in gold benefited from falling interest rates and heightened geopolitical uncertainty ↑ A long position in Brent oil, held early in the year, contributed as rising geopolitical tensions caused oil prices to peak in April |
|
| Line Graph [Table Text Block] |
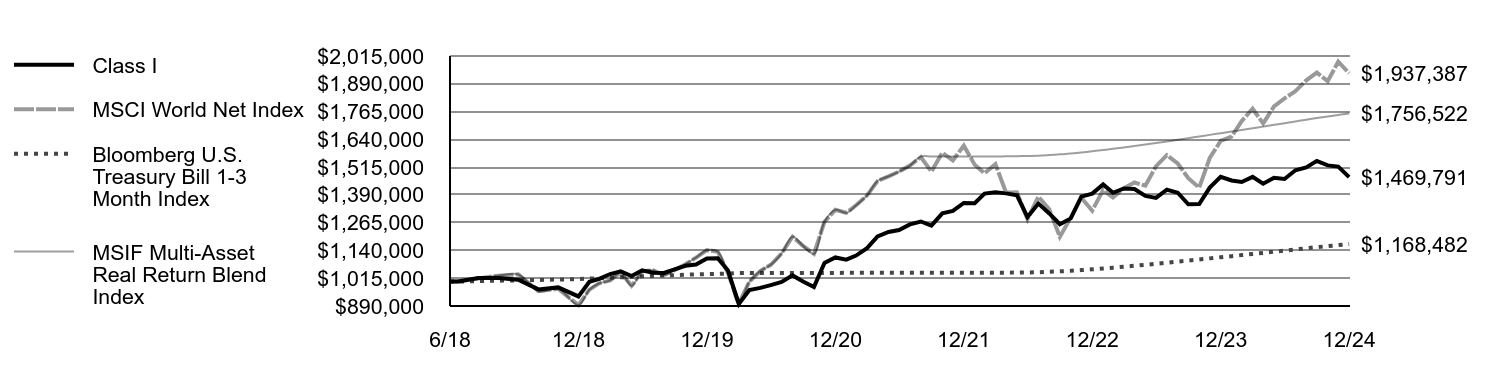 | Class I | MSCI World Net Index | Bloomberg U.S. Treasury Bill 1-3 Month Index | MSIF Multi-Asset Real Return Blend Index |
|---|
6/18 | $1,000,000 | $1,000,000 | $1,000,000 | $1,000,000 |
|---|
6/18 | $1,000,000 | $1,000,000 | $1,000,000 | $1,000,000 |
|---|
7/18 | $1,016,000 | $1,014,032 | $1,002,241 | $1,014,032 |
|---|
8/18 | $1,016,000 | $1,026,578 | $1,003,859 | $1,026,578 |
|---|
9/18 | $1,008,000 | $1,032,294 | $1,005,498 | $1,032,294 |
|---|
10/18 | $964,634 | $956,495 | $1,007,307 | $956,495 |
|---|
11/18 | $973,705 | $967,361 | $1,009,151 | $967,361 |
|---|
12/18 | $932,969 | $893,805 | $1,011,087 | $893,805 |
|---|
1/19 | $998,875 | $963,348 | $1,013,134 | $963,348 |
|---|
2/19 | $1,012,262 | $992,315 | $1,014,972 | $992,315 |
|---|
3/19 | $1,033,887 | $1,005,349 | $1,017,094 | $1,005,349 |
|---|
4/19 | $1,045,722 | $1,040,998 | $1,019,071 | $1,040,998 |
|---|
5/19 | $1,025,056 | $980,931 | $1,021,232 | $980,931 |
|---|
6/19 | $1,050,889 | $1,045,570 | $1,023,382 | $1,045,570 |
|---|
7/19 | $1,039,614 | $1,050,749 | $1,025,265 | $1,050,749 |
|---|
8/19 | $1,038,575 | $1,029,256 | $1,027,086 | $1,029,256 |
|---|
9/19 | $1,055,209 | $1,051,160 | $1,028,907 | $1,051,160 |
|---|
10/19 | $1,071,170 | $1,077,909 | $1,030,700 | $1,077,909 |
|---|
11/19 | $1,076,395 | $1,107,929 | $1,031,954 | $1,107,929 |
|---|
12/19 | $1,104,143 | $1,141,121 | $1,033,412 | $1,141,121 |
|---|
1/20 | $1,105,193 | $1,134,175 | $1,034,732 | $1,134,175 |
|---|
2/20 | $1,049,514 | $1,038,309 | $1,036,115 | $1,038,309 |
|---|
3/20 | $899,283 | $900,896 | $1,038,260 | $900,896 |
|---|
4/20 | $961,906 | $999,314 | $1,038,290 | $999,314 |
|---|
5/20 | $971,409 | $1,047,589 | $1,038,350 | $1,047,589 |
|---|
6/20 | $984,079 | $1,075,299 | $1,038,467 | $1,075,299 |
|---|
7/20 | $998,043 | $1,126,743 | $1,038,614 | $1,126,743 |
|---|
8/20 | $1,027,678 | $1,202,025 | $1,038,693 | $1,202,025 |
|---|
9/20 | $1,000,160 | $1,160,557 | $1,038,782 | $1,160,557 |
|---|
10/20 | $975,607 | $1,124,956 | $1,038,865 | $1,124,956 |
|---|
11/20 | $1,084,126 | $1,268,795 | $1,038,948 | $1,268,795 |
|---|
12/20 | $1,108,454 | $1,322,588 | $1,039,030 | $1,322,588 |
|---|
1/21 | $1,098,843 | $1,309,443 | $1,039,106 | $1,309,443 |
|---|
2/21 | $1,116,997 | $1,342,997 | $1,039,162 | $1,342,997 |
|---|
3/21 | $1,150,101 | $1,387,681 | $1,039,211 | $1,387,681 |
|---|
4/21 | $1,202,736 | $1,452,264 | $1,039,224 | $1,452,264 |
|---|
5/21 | $1,223,085 | $1,473,184 | $1,039,233 | $1,473,184 |
|---|
6/21 | $1,231,653 | $1,495,142 | $1,039,212 | $1,495,142 |
|---|
7/21 | $1,257,362 | $1,521,924 | $1,039,256 | $1,521,924 |
|---|
8/21 | $1,270,292 | $1,559,802 | $1,039,299 | $1,562,328 |
|---|
9/21 | $1,251,975 | $1,495,038 | $1,039,334 | $1,562,380 |
|---|
10/21 | $1,306,924 | $1,579,718 | $1,039,348 | $1,562,401 |
|---|
11/21 | $1,317,699 | $1,545,102 | $1,039,408 | $1,562,491 |
|---|
12/21 | $1,353,543 | $1,611,140 | $1,039,457 | $1,562,565 |
|---|
1/22 | $1,352,305 | $1,525,893 | $1,039,487 | $1,562,610 |
|---|
2/22 | $1,395,648 | $1,487,301 | $1,039,569 | $1,562,733 |
|---|
3/22 | $1,401,840 | $1,528,118 | $1,039,789 | $1,563,064 |
|---|
4/22 | $1,396,886 | $1,401,172 | $1,040,006 | $1,563,391 |
|---|
5/22 | $1,388,217 | $1,402,233 | $1,040,519 | $1,564,162 |
|---|
6/22 | $1,290,386 | $1,280,769 | $1,041,070 | $1,564,989 |
|---|
7/22 | $1,351,066 | $1,382,457 | $1,041,926 | $1,566,277 |
|---|
8/22 | $1,306,485 | $1,324,660 | $1,043,850 | $1,569,169 |
|---|
9/22 | $1,258,188 | $1,201,520 | $1,045,982 | $1,572,374 |
|---|
10/22 | $1,284,194 | $1,287,804 | $1,048,258 | $1,575,795 |
|---|
11/22 | $1,382,026 | $1,377,346 | $1,051,550 | $1,580,745 |
|---|
12/22 | $1,395,673 | $1,318,854 | $1,055,262 | $1,586,325 |
|---|
1/23 | $1,437,026 | $1,412,171 | $1,058,846 | $1,591,712 |
|---|
2/23 | $1,399,550 | $1,378,224 | $1,062,546 | $1,597,273 |
|---|
3/23 | $1,418,934 | $1,420,811 | $1,066,785 | $1,603,646 |
|---|
4/23 | $1,416,349 | $1,445,717 | $1,070,913 | $1,609,852 |
|---|
5/23 | $1,385,334 | $1,431,284 | $1,075,239 | $1,616,354 |
|---|
6/23 | $1,376,288 | $1,517,845 | $1,079,849 | $1,623,284 |
|---|
7/23 | $1,413,765 | $1,568,833 | $1,084,580 | $1,630,396 |
|---|
8/23 | $1,399,550 | $1,531,361 | $1,089,521 | $1,637,823 |
|---|
9/23 | $1,347,858 | $1,465,300 | $1,094,363 | $1,645,102 |
|---|
10/23 | $1,349,150 | $1,422,783 | $1,099,407 | $1,652,686 |
|---|
11/23 | $1,422,811 | $1,556,172 | $1,104,329 | $1,660,084 |
|---|
12/23 | $1,471,210 | $1,632,571 | $1,109,478 | $1,667,824 |
|---|
1/24 | $1,454,939 | $1,652,163 | $1,114,319 | $1,675,102 |
|---|
2/24 | $1,448,159 | $1,722,211 | $1,119,009 | $1,682,152 |
|---|
3/24 | $1,471,210 | $1,777,554 | $1,124,124 | $1,689,841 |
|---|
4/24 | $1,440,023 | $1,711,527 | $1,129,022 | $1,697,203 |
|---|
5/24 | $1,467,142 | $1,787,950 | $1,134,509 | $1,705,451 |
|---|
6/24 | $1,461,718 | $1,824,331 | $1,139,202 | $1,712,507 |
|---|
7/24 | $1,501,041 | $1,856,480 | $1,144,345 | $1,720,238 |
|---|
8/24 | $1,513,245 | $1,905,548 | $1,149,857 | $1,728,523 |
|---|
9/24 | $1,543,076 | $1,940,446 | $1,154,744 | $1,735,871 |
|---|
10/24 | $1,522,736 | $1,901,954 | $1,159,314 | $1,742,740 |
|---|
11/24 | $1,517,312 | $1,989,228 | $1,163,872 | $1,749,592 |
|---|
12/24 | $1,469,791 | $1,937,387 | $1,168,482 | $1,756,522 |
|---|
|
|
| Average Annual Return [Table Text Block] |
AATR | 1 Year | 5 Years | Since 6/18/18
(Inception) |
|---|
Class I | (0.10)% | 5.89% | 6.07% |
|---|
MSCI World Net Index | 18.67% | 11.17% | 10.65% |
|---|
Bloomberg U.S. Treasury Bill 1-3 Month Index | 5.32% | 2.49% | 2.41% |
|---|
MSIF Multi-Asset Real Return Blend Index | 5.32% | 9.01% | 9.00% |
|---|
|
|
| Performance Inception Date |
Jun. 18, 2018
|
|
| AssetsNet |
$ 7,415,322
|
|
| Holdings Count | Holding |
216
|
|
| Advisory Fees Paid, Amount |
$ 0
|
|
| InvestmentCompanyPortfolioTurnover |
310.00%
|
|
| Additional Fund Statistics [Text Block] |
Total Net Assets | $7,415,322 |
|---|
# of Portfolio Holdings | 216 |
|---|
Portfolio Turnover Rate | 310% |
|---|
Total Advisory Fees Paid (Net of Waivers) | $0 |
|---|
|
|
| Holdings [Text Block] |
Country Weightings (% of total investments)Value | Value |
|---|
Other | 1.0% | China | 0.3% | South Africa | 0.3% | Germany | 0.4% | Switzerland | 0.6% | Japan | 0.7% | France | 0.8% | Australia | 1.7% | United Kingdom | 1.9% | Canada | 4.6% | United States | 87.7% |
|
|
| Material Fund Change [Text Block] |
|
|
| Updated Prospectus Web Address |
<span style="box-sizing: border-box; color: rgb(0, 0, 0); display: inline; flex-wrap: nowrap; font-size: 10.6667px; font-weight: 400; grid-area: auto; line-height: 16px; margin: 0px; overflow: visible; text-align: left;">www.morganstanley.com/im/shareholderreports</span>
|
|
| C000200802 |
|
|
| Shareholder Report [Line Items] |
|
|
| Fund Name |
Morgan Stanley Institutional Fund, Inc. - Multi-Asset Real Return Portfolio
|
|
| Class Name |
Class R6
|
|
| Trading Symbol |
MRJSX
|
|
| Annual or Semi-Annual Statement [Text Block] |
This annual shareholder report contains important information about Morgan Stanley Institutional Fund, Inc. - Multi-Asset Real Return Portfolio for the period of January 1, 2024 to December 31, 2024.
|
|
| Shareholder Report Annual or Semi-Annual |
Annual Shareholder Report
|
|
| Additional Information [Text Block] |
You can find additional information about the Fund at www.morganstanley.com/im/shareholderreports. You can also request this information by contacting us at 1-800-869-6397.
|
|
| Additional Information Phone Number |
1-800-869-6397
|
|
| Additional Information Website |
<span style="box-sizing: border-box; color: rgb(0, 0, 0); display: inline; flex-wrap: nowrap; font-size: 10.6667px; font-weight: 400; grid-area: auto; line-height: 16px; margin: 0px; overflow: visible; text-align: left;">www.morganstanley.com/im/shareholderreports</span>
|
|
| Expenses [Text Block] |
What were the Fund costs for the last year?(based on a hypothetical $10,000 investment) Class Name | Costs of a $10,000 investment | Costs paid as a percentage of a $10,000 investment |
|---|
Class R6 | $71 | 0.71% |
|---|
|
|
| Expenses Paid, Amount |
$ 71
|
|
| Expense Ratio, Percent |
0.71%
|
|
| Factors Affecting Performance [Text Block] |
How did the Fund perform last year and what affected its performance?Key contributors to (↑) and detractors from (↓) performance, relative to the Bloomberg U.S. Treasury Bills 1-3 Month Index: ↓ A long position in GSCI commodities detracted due to weakness in energy prices in the second half of the year ↓ A long position in world energy stocks was negatively impacted by falling energy prices following the peak in April 2024 ↓ A long position in world materials stocks was weighed down by weaker industrial production and demand for input goods ↑ A long position in U.S. 10-year Treasury inflation-protected securities (TIPS) contributed as the Federal Reserve cut interests rates in 2024 ↑A long position in gold benefited from falling interest rates and heightened geopolitical uncertainty ↑ A long position in Brent oil, held early in the year, contributed as rising geopolitical tensions caused oil prices to peak in April |
|
| Line Graph [Table Text Block] |
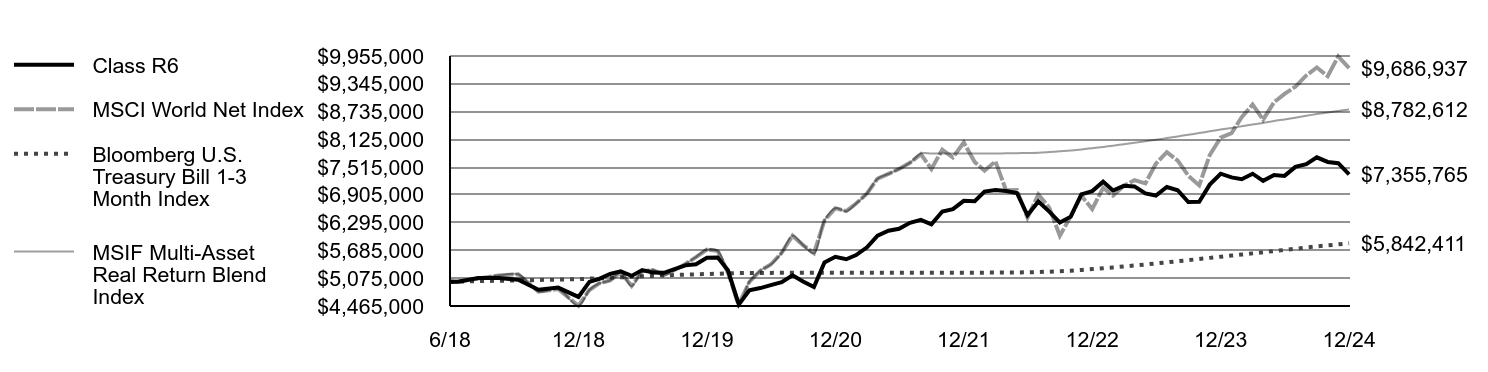 | Class R6 | MSCI World Net Index | Bloomberg U.S. Treasury Bill 1-3 Month Index | MSIF Multi-Asset Real Return Blend Index |
|---|
6/18 | $5,000,000 | $5,000,000 | $5,000,000 | $5,000,000 |
|---|
6/18 | $5,000,000 | $5,000,000 | $5,000,000 | $5,000,000 |
|---|
7/18 | $5,080,000 | $5,070,159 | $5,011,203 | $5,070,159 |
|---|
8/18 | $5,080,000 | $5,132,891 | $5,019,295 | $5,132,891 |
|---|
9/18 | $5,040,000 | $5,161,471 | $5,027,491 | $5,161,471 |
|---|
10/18 | $4,823,357 | $4,782,475 | $5,036,534 | $4,782,475 |
|---|
11/18 | $4,868,717 | $4,836,803 | $5,045,754 | $4,836,803 |
|---|
12/18 | $4,665,315 | $4,469,023 | $5,055,437 | $4,469,023 |
|---|
1/19 | $4,994,873 | $4,816,738 | $5,065,672 | $4,816,738 |
|---|
2/19 | $5,061,815 | $4,961,577 | $5,074,858 | $4,961,577 |
|---|
3/19 | $5,169,951 | $5,026,745 | $5,085,469 | $5,026,745 |
|---|
4/19 | $5,224,055 | $5,204,990 | $5,095,356 | $5,204,990 |
|---|
5/19 | $5,125,878 | $4,904,657 | $5,106,161 | $4,904,657 |
|---|
6/19 | $5,255,058 | $5,227,849 | $5,116,909 | $5,227,849 |
|---|
7/19 | $5,199,002 | $5,253,744 | $5,126,324 | $5,253,744 |
|---|
8/19 | $5,193,803 | $5,146,281 | $5,135,432 | $5,146,281 |
|---|
9/19 | $5,276,987 | $5,255,799 | $5,144,535 | $5,255,799 |
|---|
10/19 | $5,357,095 | $5,389,546 | $5,153,499 | $5,389,546 |
|---|
11/19 | $5,383,227 | $5,539,646 | $5,159,769 | $5,539,646 |
|---|
12/19 | $5,522,285 | $5,705,604 | $5,167,061 | $5,705,604 |
|---|
1/20 | $5,527,540 | $5,670,876 | $5,173,660 | $5,670,876 |
|---|
2/20 | $5,249,061 | $5,191,544 | $5,180,574 | $5,191,544 |
|---|
3/20 | $4,497,694 | $4,504,481 | $5,191,302 | $4,504,481 |
|---|
4/20 | $4,811,074 | $4,996,570 | $5,191,448 | $4,996,570 |
|---|
5/20 | $4,858,604 | $5,237,945 | $5,191,750 | $5,237,945 |
|---|
6/20 | $4,921,977 | $5,376,494 | $5,192,335 | $5,376,494 |
|---|
7/20 | $4,986,708 | $5,633,713 | $5,193,069 | $5,633,713 |
|---|
8/20 | $5,140,227 | $6,010,127 | $5,193,465 | $6,010,127 |
|---|
9/20 | $5,002,589 | $5,802,783 | $5,193,909 | $5,802,783 |
|---|
10/20 | $4,879,968 | $5,624,782 | $5,194,323 | $5,624,782 |
|---|
11/20 | $5,422,778 | $6,343,975 | $5,194,742 | $6,343,975 |
|---|
12/20 | $5,545,383 | $6,612,939 | $5,195,148 | $6,612,939 |
|---|
1/21 | $5,491,959 | $6,547,215 | $5,195,531 | $6,547,215 |
|---|
2/21 | $5,582,780 | $6,714,983 | $5,195,808 | $6,714,983 |
|---|
3/21 | $5,753,735 | $6,938,405 | $5,196,054 | $6,938,405 |
|---|
4/21 | $6,012,031 | $7,261,319 | $5,196,118 | $7,261,319 |
|---|
5/21 | $6,119,197 | $7,365,921 | $5,196,167 | $7,365,921 |
|---|
6/21 | $6,162,064 | $7,475,709 | $5,196,062 | $7,475,709 |
|---|
7/21 | $6,291,119 | $7,609,620 | $5,196,279 | $7,609,620 |
|---|
8/21 | $6,355,809 | $7,799,011 | $5,196,495 | $7,811,638 |
|---|
9/21 | $6,258,774 | $7,475,192 | $5,196,670 | $7,811,901 |
|---|
10/21 | $6,539,098 | $7,898,591 | $5,196,740 | $7,812,007 |
|---|
11/21 | $6,593,006 | $7,725,509 | $5,197,038 | $7,812,454 |
|---|
12/21 | $6,774,123 | $8,055,699 | $5,197,286 | $7,812,827 |
|---|
1/22 | $6,767,926 | $7,629,465 | $5,197,435 | $7,813,052 |
|---|
2/22 | $6,978,648 | $7,436,506 | $5,197,843 | $7,813,664 |
|---|
3/22 | $7,009,637 | $7,640,589 | $5,198,945 | $7,815,321 |
|---|
4/22 | $6,991,044 | $7,005,860 | $5,200,031 | $7,816,954 |
|---|
5/22 | $6,947,660 | $7,011,166 | $5,202,595 | $7,820,809 |
|---|
6/22 | $6,458,039 | $6,403,845 | $5,205,348 | $7,824,947 |
|---|
7/22 | $6,761,728 | $6,912,287 | $5,209,630 | $7,831,383 |
|---|
8/22 | $6,538,609 | $6,623,299 | $5,219,250 | $7,845,844 |
|---|
9/22 | $6,296,898 | $6,007,598 | $5,229,912 | $7,861,872 |
|---|
10/22 | $6,427,050 | $6,439,021 | $5,241,288 | $7,878,973 |
|---|
11/22 | $6,916,671 | $6,886,729 | $5,257,752 | $7,903,723 |
|---|
12/22 | $6,988,092 | $6,594,268 | $5,276,312 | $7,931,624 |
|---|
1/23 | $7,195,147 | $7,060,853 | $5,294,231 | $7,958,560 |
|---|
2/23 | $7,001,033 | $6,891,120 | $5,312,728 | $7,986,365 |
|---|
3/23 | $7,104,560 | $7,104,054 | $5,333,927 | $8,018,232 |
|---|
4/23 | $7,091,620 | $7,228,585 | $5,354,567 | $8,049,261 |
|---|
5/23 | $6,936,329 | $7,156,419 | $5,376,193 | $8,081,769 |
|---|
6/23 | $6,891,035 | $7,589,224 | $5,399,244 | $8,116,421 |
|---|
7/23 | $7,078,679 | $7,844,167 | $5,422,900 | $8,151,982 |
|---|
8/23 | $7,007,504 | $7,656,804 | $5,447,604 | $8,189,117 |
|---|
9/23 | $6,748,685 | $7,326,501 | $5,471,813 | $8,225,511 |
|---|
10/23 | $6,755,156 | $7,113,917 | $5,497,037 | $8,263,428 |
|---|
11/23 | $7,130,442 | $7,780,862 | $5,521,644 | $8,300,418 |
|---|
12/23 | $7,369,937 | $8,162,857 | $5,547,390 | $8,339,121 |
|---|
1/24 | $7,288,426 | $8,260,815 | $5,571,597 | $8,375,511 |
|---|
2/24 | $7,247,671 | $8,611,055 | $5,595,046 | $8,410,760 |
|---|
3/24 | $7,369,937 | $8,887,769 | $5,620,621 | $8,449,206 |
|---|
4/24 | $7,213,708 | $8,557,636 | $5,645,108 | $8,486,016 |
|---|
5/24 | $7,342,767 | $8,939,752 | $5,672,543 | $8,527,257 |
|---|
6/24 | $7,322,389 | $9,121,657 | $5,696,010 | $8,562,535 |
|---|
7/24 | $7,519,374 | $9,282,402 | $5,721,723 | $8,601,188 |
|---|
8/24 | $7,580,507 | $9,527,741 | $5,749,283 | $8,642,617 |
|---|
9/24 | $7,729,943 | $9,702,231 | $5,773,722 | $8,679,356 |
|---|
10/24 | $7,628,055 | $9,509,769 | $5,796,569 | $8,713,701 |
|---|
11/24 | $7,600,885 | $9,946,140 | $5,819,360 | $8,747,961 |
|---|
12/24 | $7,355,765 | $9,686,937 | $5,842,411 | $8,782,612 |
|---|
|
|
| Average Annual Return [Table Text Block] |
AATR | 1 Year | 5 Years | Since 6/18/18
(Inception) |
|---|
Class R6 | (0.19)% | 5.90% | 6.08% |
|---|
MSCI World Net Index | 18.67% | 11.17% | 10.65% |
|---|
Bloomberg U.S. Treasury Bill 1-3 Month Index | 5.32% | 2.49% | 2.41% |
|---|
MSIF Multi-Asset Real Return Blend Index | 5.32% | 9.01% | 9.00% |
|---|
|
|
| Performance Inception Date |
Jun. 18, 2018
|
|
| AssetsNet |
$ 7,415,322
|
|
| Holdings Count | Holding |
216
|
|
| Advisory Fees Paid, Amount |
$ 0
|
|
| InvestmentCompanyPortfolioTurnover |
310.00%
|
|
| Additional Fund Statistics [Text Block] |
Total Net Assets | $7,415,322 |
|---|
# of Portfolio Holdings | 216 |
|---|
Portfolio Turnover Rate | 310% |
|---|
Total Advisory Fees Paid (Net of Waivers) | $0 |
|---|
|
|
| Holdings [Text Block] |
Country Weightings (% of total investments)Value | Value |
|---|
Other | 1.0% | China | 0.3% | South Africa | 0.3% | Germany | 0.4% | Switzerland | 0.6% | Japan | 0.7% | France | 0.8% | Australia | 1.7% | United Kingdom | 1.9% | Canada | 4.6% | United States | 87.7% |
|
|
| Material Fund Change [Text Block] |
|
|
| Updated Prospectus Web Address |
<span style="box-sizing: border-box; color: rgb(0, 0, 0); display: inline; flex-wrap: nowrap; font-size: 10.6667px; font-weight: 400; grid-area: auto; line-height: 16px; margin: 0px; overflow: visible; text-align: left;">www.morganstanley.com/im/shareholderreports</span>
|
|
| C000115786 |
|
|
| Shareholder Report [Line Items] |
|
|
| Fund Name |
Morgan Stanley Institutional Fund, Inc. - Next Gen Emerging Markets Portfolio
|
|
| Class Name |
Class A
|
|
| Trading Symbol |
MFMPX
|
|
| Annual or Semi-Annual Statement [Text Block] |
This annual shareholder report contains important information about Morgan Stanley Institutional Fund, Inc. - Next Gen Emerging Markets Portfolio for the period of January 1, 2024 to December 31, 2024.
|
|
| Shareholder Report Annual or Semi-Annual |
Annual Shareholder Report
|
|
| Additional Information [Text Block] |
You can find additional information about the Fund at www.morganstanley.com/im/shareholderreports. You can also request this information by contacting us at 1-800-869-6397.
|
|
| Additional Information Phone Number |
1-800-869-6397
|
|
| Additional Information Website |
<span style="box-sizing: border-box; color: rgb(0, 0, 0); display: inline; flex-wrap: nowrap; font-size: 10.6667px; font-weight: 400; grid-area: auto; line-height: 16px; margin: 0px; overflow: visible; text-align: left;">www.morganstanley.com/im/shareholderreports</span>
|
|
| Expenses [Text Block] |
What were the Fund costs for the last year?(based on a hypothetical $10,000 investment) Class Name | Costs of a $10,000 investment | Costs paid as a percentage of a $10,000 investment |
|---|
Class A | $170 | 1.60% |
|---|
|
|
| Expenses Paid, Amount |
$ 170
|
|
| Expense Ratio, Percent |
1.60%
|
|
| Factors Affecting Performance [Text Block] |
How did the Fund perform last year and what affected its performance?Key contributors to (↑) and detractors from (↓) performance, relative to the MSCI Frontier Emerging Markets Net Index: ↑ Positioning in Vietnam, through allocations to an IT outsourcing company and an electronics and grocery retailer ↑The underweight allocation to and stock selection in the Philippines ↑ The allocation to a fast-growing online travel agency in Argentina ↑ The overweight allocation to and stock selection in Egypt, led by a position in a leading bank ↑ Positioning in the U.A.E, through the allocation to a local real estate developer ↓The allocations to select positions in Poland, which were exited during the year ↓ The allocations to select IT services companies hurt by an extended slowdown in IT spending globally ↓ The underweight allocation to Peru |
|
| Line Graph [Table Text Block] |
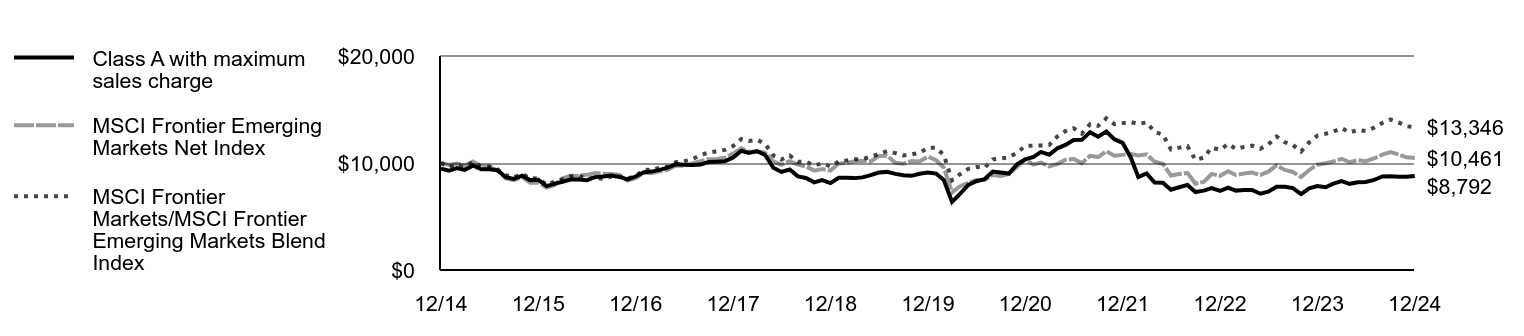 | Class A with maximum sales charge | MSCI Frontier Emerging Markets Net Index | MSCI Frontier Markets/MSCI Frontier Emerging Markets Blend Index |
|---|
12/14 | $9,473 | $10,000 | $10,000 |
|---|
1/15 | $9,275 | $9,819 | $9,592 |
|---|
2/15 | $9,528 | $9,946 | $9,873 |
|---|
3/15 | $9,359 | $9,758 | $9,689 |
|---|
4/15 | $9,771 | $10,129 | $10,053 |
|---|
5/15 | $9,409 | $9,691 | $9,694 |
|---|
6/15 | $9,409 | $9,643 | $9,685 |
|---|
7/15 | $9,329 | $9,277 | $9,401 |
|---|
8/15 | $8,674 | $8,570 | $8,862 |
|---|
9/15 | $8,515 | $8,392 | $8,661 |
|---|
10/15 | $8,813 | $8,699 | $8,978 |
|---|
11/15 | $8,400 | $8,157 | $8,580 |
|---|
12/15 | $8,441 | $8,170 | $8,554 |
|---|
1/16 | $7,842 | $7,702 | $7,969 |
|---|
2/16 | $8,047 | $7,926 | $8,248 |
|---|
3/16 | $8,251 | $8,581 | $8,474 |
|---|
4/16 | $8,456 | $8,813 | $8,733 |
|---|
5/16 | $8,461 | $8,796 | $8,821 |
|---|
6/16 | $8,381 | $8,894 | $8,514 |
|---|
7/16 | $8,681 | $9,054 | $8,619 |
|---|
8/16 | $8,736 | $9,007 | $8,521 |
|---|
9/16 | $8,821 | $8,962 | $8,739 |
|---|
10/16 | $8,701 | $8,885 | $8,705 |
|---|
11/16 | $8,461 | $8,361 | $8,550 |
|---|
12/16 | $8,736 | $8,579 | $8,782 |
|---|
1/17 | $9,130 | $9,100 | $9,367 |
|---|
2/17 | $9,195 | $9,045 | $9,333 |
|---|
3/17 | $9,357 | $9,214 | $9,563 |
|---|
4/17 | $9,559 | $9,370 | $9,675 |
|---|
5/17 | $9,892 | $9,762 | $10,088 |
|---|
6/17 | $9,831 | $9,747 | $10,150 |
|---|
7/17 | $9,821 | $9,969 | $10,364 |
|---|
8/17 | $9,852 | $10,160 | $10,746 |
|---|
9/17 | $10,089 | $10,355 | $10,965 |
|---|
10/17 | $10,124 | $10,368 | $11,100 |
|---|
11/17 | $10,159 | $10,487 | $11,229 |
|---|
12/17 | $10,518 | $10,877 | $11,580 |
|---|
1/18 | $11,144 | $11,385 | $12,244 |
|---|
2/18 | $10,937 | $11,059 | $12,061 |
|---|
3/18 | $11,113 | $11,050 | $12,171 |
|---|
4/18 | $10,755 | $10,967 | $11,787 |
|---|
5/18 | $9,554 | $10,157 | $10,701 |
|---|
6/18 | $9,165 | $9,832 | $10,322 |
|---|
7/18 | $9,390 | $10,176 | $10,700 |
|---|
8/18 | $8,750 | $9,847 | $10,123 |
|---|
9/18 | $8,602 | $9,675 | $10,118 |
|---|
10/18 | $8,191 | $9,287 | $9,760 |
|---|
11/18 | $8,394 | $9,433 | $9,972 |
|---|
12/18 | $8,119 | $9,289 | $9,680 |
|---|
1/19 | $8,618 | $9,946 | $10,140 |
|---|
2/19 | $8,613 | $10,000 | $10,221 |
|---|
3/19 | $8,587 | $10,166 | $10,345 |
|---|
4/19 | $8,655 | $10,207 | $10,363 |
|---|
5/19 | $8,868 | $10,154 | $10,587 |
|---|
6/19 | $9,112 | $10,646 | $10,830 |
|---|
7/19 | $9,169 | $10,684 | $11,102 |
|---|
8/19 | $8,982 | $10,023 | $10,925 |
|---|
9/19 | $8,847 | $9,929 | $10,711 |
|---|
10/19 | $8,800 | $10,188 | $10,798 |
|---|
11/19 | $8,998 | $10,135 | $10,946 |
|---|
12/19 | $9,104 | $10,598 | $11,421 |
|---|
1/20 | $9,014 | $10,258 | $11,415 |
|---|
2/20 | $8,409 | $9,578 | $10,743 |
|---|
3/20 | $6,365 | $7,253 | $8,384 |
|---|
4/20 | $7,119 | $7,836 | $8,949 |
|---|
5/20 | $7,947 | $8,146 | $9,461 |
|---|
6/20 | $8,297 | $8,419 | $9,620 |
|---|
7/20 | $8,478 | $8,417 | $9,554 |
|---|
8/20 | $9,205 | $8,886 | $10,341 |
|---|
9/20 | $9,110 | $8,785 | $10,418 |
|---|
10/20 | $9,014 | $8,977 | $10,527 |
|---|
11/20 | $9,879 | $9,633 | $10,958 |
|---|
12/20 | $10,340 | $10,316 | $11,584 |
|---|
1/21 | $10,568 | $9,842 | $11,628 |
|---|
2/21 | $11,041 | $10,034 | $11,643 |
|---|
3/21 | $10,770 | $9,689 | $11,677 |
|---|
4/21 | $11,370 | $9,894 | $12,476 |
|---|
5/21 | $11,694 | $10,298 | $12,977 |
|---|
6/21 | $12,145 | $10,385 | $13,249 |
|---|
7/21 | $12,161 | $9,988 | $12,743 |
|---|
8/21 | $12,883 | $10,676 | $13,621 |
|---|
9/21 | $12,453 | $10,553 | $13,464 |
|---|
10/21 | $12,936 | $11,106 | $14,169 |
|---|
11/21 | $12,225 | $10,683 | $13,630 |
|---|
12/21 | $11,880 | $10,759 | $13,726 |
|---|
1/22 | $10,499 | $10,840 | $13,830 |
|---|
2/22 | $8,677 | $10,702 | $13,654 |
|---|
3/22 | $9,023 | $10,811 | $13,793 |
|---|
4/22 | $8,168 | $10,112 | $12,902 |
|---|
5/22 | $8,157 | $9,920 | $12,656 |
|---|
6/22 | $7,509 | $8,831 | $11,267 |
|---|
7/22 | $7,732 | $8,965 | $11,438 |
|---|
8/22 | $7,950 | $9,072 | $11,574 |
|---|
9/22 | $7,286 | $8,065 | $10,289 |
|---|
10/22 | $7,419 | $8,239 | $10,512 |
|---|
11/22 | $7,663 | $8,970 | $11,444 |
|---|
12/22 | $7,387 | $8,803 | $11,231 |
|---|
1/23 | $7,695 | $9,234 | $11,781 |
|---|
2/23 | $7,419 | $8,876 | $11,324 |
|---|
3/23 | $7,483 | $9,013 | $11,499 |
|---|
4/23 | $7,483 | $9,107 | $11,619 |
|---|
5/23 | $7,127 | $8,881 | $11,331 |
|---|
6/23 | $7,323 | $9,193 | $11,729 |
|---|
7/23 | $7,785 | $9,781 | $12,479 |
|---|
8/23 | $7,769 | $9,356 | $11,937 |
|---|
9/23 | $7,652 | $9,161 | $11,688 |
|---|
10/23 | $7,100 | $8,682 | $11,077 |
|---|
11/23 | $7,637 | $9,341 | $11,918 |
|---|
12/23 | $7,851 | $9,845 | $12,560 |
|---|
1/24 | $7,733 | $9,983 | $12,737 |
|---|
2/24 | $8,076 | $10,134 | $12,929 |
|---|
3/24 | $8,307 | $10,394 | $13,261 |
|---|
4/24 | $8,055 | $10,071 | $12,849 |
|---|
5/24 | $8,205 | $10,267 | $13,098 |
|---|
6/24 | $8,226 | $10,176 | $12,983 |
|---|
7/24 | $8,414 | $10,422 | $13,297 |
|---|
8/24 | $8,746 | $10,773 | $13,745 |
|---|
9/24 | $8,757 | $11,024 | $14,065 |
|---|
10/24 | $8,704 | $10,808 | $13,789 |
|---|
11/24 | $8,725 | $10,528 | $13,432 |
|---|
12/24 | $8,792 | $10,461 | $13,346 |
|---|
|
|
| Average Annual Return [Table Text Block] |
AATR | 1 Year | 5 Years | 10 Years |
|---|
Class A | 11.99% | (0.70)% | (0.74)% |
|---|
Class A, with 5.25% maximum front end sales charge | 6.11% | (1.76)% | (1.28)% |
|---|
MSCI Frontier Emerging Markets Net Index | 6.26% | (0.26)% | 0.45% |
|---|
MSCI Frontier Markets/MSCI Frontier Emerging Markets Blend Index | 6.26% | 3.16% | 2.93% |
|---|
|
|
| AssetsNet |
$ 21,546,460
|
|
| Holdings Count | Holding |
42
|
|
| Advisory Fees Paid, Amount |
$ 0
|
|
| InvestmentCompanyPortfolioTurnover |
40.00%
|
|
| Additional Fund Statistics [Text Block] |
Total Net Assets | $21,546,460 |
|---|
# of Portfolio Holdings | 42 |
|---|
Portfolio Turnover Rate | 40% |
|---|
Total Advisory Fees Paid (Net of Waivers) | $0 |
|---|
|
|
| Holdings [Text Block] |
Country Weightings (% of total investments)Value | Value |
|---|
Other | 14.4% | Slovenia | 3.0% | Argentina | 3.9% | Bangladesh | 4.1% | Egypt | 4.8% | Pakistan | 6.1% | Kazakhstan | 8.4% | Philippines | 8.6% | United States | 8.9% | Indonesia | 14.2% | Vietnam | 23.6% |
Top Ten Holdings (% of total investments)Footnote ReferenceaFPT Corp. | 8.4% | Century Pacific Food, Inc. | 4.2% | Medikaloka Hermina Tbk. PT | 4.2% | Systems Ltd. | 4.0% | MercadoLibre, Inc. | 3.9% | Phu Nhuan Jewelry JSC | 3.9% | NAC Kazatomprom JSC | 3.6% | Map Aktif Adiperkasa PT | 3.6% | Bank for Foreign Trade of Vietnam JSC | 3.0% | Nova Ljubljanska Banka DD | 3.0% | Total | 41.8% |
| Footnote | Description | Footnotea | Excluding cash equivalents. |
|
|
| Material Fund Change [Text Block] |
|
|
| Updated Prospectus Web Address |
<span style="box-sizing: border-box; color: rgb(0, 0, 0); display: inline; flex-wrap: nowrap; font-size: 10.6667px; font-weight: 400; grid-area: auto; line-height: 16px; margin: 0px; overflow: visible; text-align: left;">www.morganstanley.com/im/shareholderreports</span>
|
|
| C000155910 |
|
|
| Shareholder Report [Line Items] |
|
|
| Fund Name |
Morgan Stanley Institutional Fund, Inc. - Next Gen Emerging Markets Portfolio
|
|
| Class Name |
Class C
|
|
| Trading Symbol |
MSFEX
|
|
| Annual or Semi-Annual Statement [Text Block] |
This annual shareholder report contains important information about Morgan Stanley Institutional Fund, Inc. - Next Gen Emerging Markets Portfolio for the period of January 1, 2024 to December 31, 2024.
|
|
| Shareholder Report Annual or Semi-Annual |
Annual Shareholder Report
|
|
| Additional Information [Text Block] |
You can find additional information about the Fund at www.morganstanley.com/im/shareholderreports. You can also request this information by contacting us at 1-800-869-6397.
|
|
| Additional Information Phone Number |
1-800-869-6397
|
|
| Additional Information Website |
<span style="box-sizing: border-box; color: rgb(0, 0, 0); display: inline; flex-wrap: nowrap; font-size: 10.6667px; font-weight: 400; grid-area: auto; line-height: 16px; margin: 0px; overflow: visible; text-align: left;">www.morganstanley.com/im/shareholderreports</span>
|
|
| Expenses [Text Block] |
What were the Fund costs for the last year?(based on a hypothetical $10,000 investment) Class Name | Costs of a $10,000 investment | Costs paid as a percentage of a $10,000 investment |
|---|
Class C | $248 | 2.35% |
|---|
|
|
| Expenses Paid, Amount |
$ 248
|
|
| Expense Ratio, Percent |
2.35%
|
|
| Factors Affecting Performance [Text Block] |
How did the Fund perform last year and what affected its performance?Key contributors to (↑) and detractors from (↓) performance, relative to the MSCI Frontier Emerging Markets Net Index: ↑ Positioning in Vietnam, through allocations to an IT outsourcing company and an electronics and grocery retailer ↑The underweight allocation to and stock selection in the Philippines ↑ The allocation to a fast-growing online travel agency in Argentina ↑ The overweight allocation to and stock selection in Egypt, led by a position in a leading bank ↑ Positioning in the U.A.E, through the allocation to a local real estate developer ↓The allocations to select positions in Poland, which were exited during the year ↓ The allocations to select IT services companies hurt by an extended slowdown in IT spending globally ↓ The underweight allocation to Peru |
|
| Line Graph [Table Text Block] |
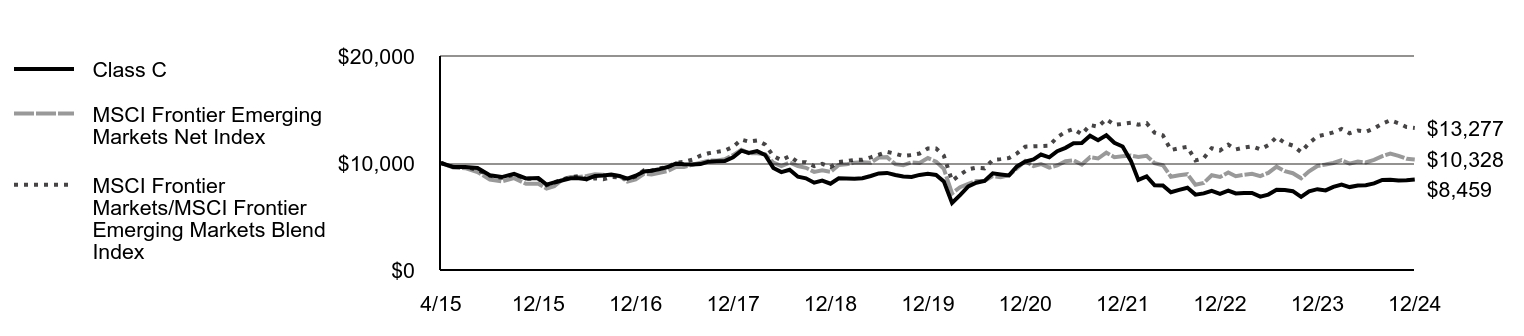 | Class C | MSCI Frontier Emerging Markets Net Index | MSCI Frontier Markets/MSCI Frontier Emerging Markets Blend Index |
|---|
4/15 | $10,000 | $10,000 | $10,000 |
|---|
5/15 | $9,621 | $9,568 | $9,643 |
|---|
6/15 | $9,616 | $9,519 | $9,634 |
|---|
7/15 | $9,529 | $9,159 | $9,352 |
|---|
8/15 | $8,853 | $8,460 | $8,816 |
|---|
9/15 | $8,684 | $8,285 | $8,615 |
|---|
10/15 | $8,981 | $8,588 | $8,931 |
|---|
11/15 | $8,556 | $8,053 | $8,535 |
|---|
12/15 | $8,590 | $8,066 | $8,510 |
|---|
1/16 | $7,977 | $7,604 | $7,927 |
|---|
2/16 | $8,183 | $7,825 | $8,205 |
|---|
3/16 | $8,384 | $8,471 | $8,429 |
|---|
4/16 | $8,579 | $8,701 | $8,687 |
|---|
5/16 | $8,585 | $8,684 | $8,774 |
|---|
6/16 | $8,497 | $8,780 | $8,469 |
|---|
7/16 | $8,790 | $8,939 | $8,574 |
|---|
8/16 | $8,842 | $8,892 | $8,477 |
|---|
9/16 | $8,919 | $8,848 | $8,694 |
|---|
10/16 | $8,790 | $8,772 | $8,659 |
|---|
11/16 | $8,543 | $8,254 | $8,505 |
|---|
12/16 | $8,815 | $8,469 | $8,736 |
|---|
1/17 | $9,208 | $8,983 | $9,318 |
|---|
2/17 | $9,270 | $8,930 | $9,284 |
|---|
3/17 | $9,425 | $9,096 | $9,513 |
|---|
4/17 | $9,621 | $9,250 | $9,624 |
|---|
5/17 | $9,951 | $9,638 | $10,035 |
|---|
6/17 | $9,884 | $9,623 | $10,097 |
|---|
7/17 | $9,869 | $9,842 | $10,309 |
|---|
8/17 | $9,895 | $10,031 | $10,689 |
|---|
9/17 | $10,122 | $10,222 | $10,908 |
|---|
10/17 | $10,153 | $10,236 | $11,041 |
|---|
11/17 | $10,179 | $10,353 | $11,170 |
|---|
12/17 | $10,535 | $10,738 | $11,519 |
|---|
1/18 | $11,150 | $11,239 | $12,180 |
|---|
2/18 | $10,938 | $10,918 | $11,998 |
|---|
3/18 | $11,108 | $10,909 | $12,107 |
|---|
4/18 | $10,747 | $10,827 | $11,726 |
|---|
5/18 | $9,538 | $10,028 | $10,645 |
|---|
6/18 | $9,146 | $9,706 | $10,268 |
|---|
7/18 | $9,363 | $10,046 | $10,644 |
|---|
8/18 | $8,722 | $9,722 | $10,070 |
|---|
9/18 | $8,567 | $9,551 | $10,065 |
|---|
10/18 | $8,159 | $9,168 | $9,709 |
|---|
11/18 | $8,356 | $9,313 | $9,919 |
|---|
12/18 | $8,068 | $9,170 | $9,629 |
|---|
1/19 | $8,566 | $9,819 | $10,087 |
|---|
2/19 | $8,550 | $9,873 | $10,168 |
|---|
3/19 | $8,524 | $10,036 | $10,291 |
|---|
4/19 | $8,581 | $10,077 | $10,308 |
|---|
5/19 | $8,786 | $10,024 | $10,531 |
|---|
6/19 | $9,022 | $10,510 | $10,773 |
|---|
7/19 | $9,074 | $10,547 | $11,044 |
|---|
8/19 | $8,885 | $9,895 | $10,868 |
|---|
9/19 | $8,744 | $9,802 | $10,655 |
|---|
10/19 | $8,697 | $10,058 | $10,742 |
|---|
11/19 | $8,885 | $10,006 | $10,888 |
|---|
12/19 | $8,983 | $10,463 | $11,361 |
|---|
1/20 | $8,887 | $10,127 | $11,355 |
|---|
2/20 | $8,284 | $9,456 | $10,687 |
|---|
3/20 | $6,264 | $7,161 | $8,340 |
|---|
4/20 | $7,005 | $7,736 | $8,902 |
|---|
5/20 | $7,815 | $8,042 | $9,412 |
|---|
6/20 | $8,156 | $8,312 | $9,570 |
|---|
7/20 | $8,327 | $8,309 | $9,504 |
|---|
8/20 | $9,036 | $8,772 | $10,287 |
|---|
9/20 | $8,935 | $8,673 | $10,363 |
|---|
10/20 | $8,839 | $8,862 | $10,472 |
|---|
11/20 | $9,681 | $9,510 | $10,900 |
|---|
12/20 | $10,127 | $10,184 | $11,523 |
|---|
1/21 | $10,341 | $9,716 | $11,567 |
|---|
2/21 | $10,794 | $9,906 | $11,582 |
|---|
3/21 | $10,527 | $9,565 | $11,616 |
|---|
4/21 | $11,103 | $9,768 | $12,411 |
|---|
5/21 | $11,418 | $10,167 | $12,909 |
|---|
6/21 | $11,844 | $10,252 | $13,180 |
|---|
7/21 | $11,860 | $9,860 | $12,676 |
|---|
8/21 | $12,548 | $10,540 | $13,549 |
|---|
9/21 | $12,127 | $10,419 | $13,394 |
|---|
10/21 | $12,591 | $10,964 | $14,095 |
|---|
11/21 | $11,892 | $10,547 | $13,559 |
|---|
12/21 | $11,546 | $10,621 | $13,654 |
|---|
1/22 | $10,197 | $10,701 | $13,757 |
|---|
2/22 | $8,421 | $10,565 | $13,582 |
|---|
3/22 | $8,751 | $10,673 | $13,721 |
|---|
4/22 | $7,919 | $9,983 | $12,834 |
|---|
5/22 | $7,903 | $9,793 | $12,589 |
|---|
6/22 | $7,269 | $8,719 | $11,208 |
|---|
7/22 | $7,482 | $8,851 | $11,378 |
|---|
8/22 | $7,685 | $8,956 | $11,514 |
|---|
9/22 | $7,045 | $7,962 | $10,235 |
|---|
10/22 | $7,162 | $8,134 | $10,457 |
|---|
11/22 | $7,397 | $8,855 | $11,384 |
|---|
12/22 | $7,125 | $8,691 | $11,172 |
|---|
1/23 | $7,418 | $9,116 | $11,719 |
|---|
2/23 | $7,151 | $8,763 | $11,265 |
|---|
3/23 | $7,205 | $8,898 | $11,439 |
|---|
4/23 | $7,199 | $8,991 | $11,558 |
|---|
5/23 | $6,857 | $8,768 | $11,271 |
|---|
6/23 | $7,046 | $9,076 | $11,668 |
|---|
7/23 | $7,491 | $9,656 | $12,414 |
|---|
8/23 | $7,475 | $9,237 | $11,874 |
|---|
9/23 | $7,363 | $9,044 | $11,627 |
|---|
10/23 | $6,832 | $8,571 | $11,019 |
|---|
11/23 | $7,348 | $9,222 | $11,855 |
|---|
12/23 | $7,554 | $9,719 | $12,494 |
|---|
1/24 | $7,440 | $9,856 | $12,670 |
|---|
2/24 | $7,771 | $10,005 | $12,862 |
|---|
3/24 | $7,993 | $10,261 | $13,191 |
|---|
4/24 | $7,750 | $9,942 | $12,781 |
|---|
5/24 | $7,894 | $10,136 | $13,030 |
|---|
6/24 | $7,915 | $10,046 | $12,915 |
|---|
7/24 | $8,096 | $10,289 | $13,227 |
|---|
8/24 | $8,416 | $10,636 | $13,673 |
|---|
9/24 | $8,426 | $10,883 | $13,991 |
|---|
10/24 | $8,374 | $10,670 | $13,717 |
|---|
11/24 | $8,395 | $10,394 | $13,361 |
|---|
12/24 | $8,459 | $10,328 | $13,277 |
|---|
|
|
| Average Annual Return [Table Text Block] |
AATR | 1 Year | 5 Years | Since 4/30/15
(Inception) |
|---|
Class C, with conversion to Class A after 8 years | 11.12% | (1.44)% | (1.72)% |
|---|
Class C, with 1% maximum contingent deferred sales charge and conversion to Class A after 8 years | 10.12% | (1.44)% | (1.72)% |
|---|
MSCI Frontier Emerging Markets Net Index | 6.26% | (0.26)% | 0.33% |
|---|
MSCI Frontier Markets/MSCI Frontier Emerging Markets Blend Index | 6.26% | 3.16% | 2.97% |
|---|
|
|
| Performance Inception Date |
Apr. 30, 2015
|
|
| AssetsNet |
$ 21,546,460
|
|
| Holdings Count | Holding |
42
|
|
| Advisory Fees Paid, Amount |
$ 0
|
|
| InvestmentCompanyPortfolioTurnover |
40.00%
|
|
| Additional Fund Statistics [Text Block] |
Total Net Assets | $21,546,460 |
|---|
# of Portfolio Holdings | 42 |
|---|
Portfolio Turnover Rate | 40% |
|---|
Total Advisory Fees Paid (Net of Waivers) | $0 |
|---|
|
|
| Holdings [Text Block] |
Country Weightings (% of total investments)Value | Value |
|---|
Other | 14.4% | Slovenia | 3.0% | Argentina | 3.9% | Bangladesh | 4.1% | Egypt | 4.8% | Pakistan | 6.1% | Kazakhstan | 8.4% | Philippines | 8.6% | United States | 8.9% | Indonesia | 14.2% | Vietnam | 23.6% |
Top Ten Holdings (% of total investments)Footnote ReferenceaFPT Corp. | 8.4% | Century Pacific Food, Inc. | 4.2% | Medikaloka Hermina Tbk. PT | 4.2% | Systems Ltd. | 4.0% | MercadoLibre, Inc. | 3.9% | Phu Nhuan Jewelry JSC | 3.9% | NAC Kazatomprom JSC | 3.6% | Map Aktif Adiperkasa PT | 3.6% | Bank for Foreign Trade of Vietnam JSC | 3.0% | Nova Ljubljanska Banka DD | 3.0% | Total | 41.8% |
| Footnote | Description | Footnotea | Excluding cash equivalents. |
|
|
| Material Fund Change [Text Block] |
|
|
| Updated Prospectus Web Address |
<span style="box-sizing: border-box; color: rgb(0, 0, 0); display: inline; flex-wrap: nowrap; font-size: 10.6667px; font-weight: 400; grid-area: auto; line-height: 16px; margin: 0px; overflow: visible; text-align: left;">www.morganstanley.com/im/shareholderreports</span>
|
|
| C000115785 |
|
|
| Shareholder Report [Line Items] |
|
|
| Fund Name |
Morgan Stanley Institutional Fund, Inc. - Next Gen Emerging Markets Portfolio
|
|
| Class Name |
Class I
|
|
| Trading Symbol |
MFMIX
|
|
| Annual or Semi-Annual Statement [Text Block] |
This annual shareholder report contains important information about Morgan Stanley Institutional Fund, Inc. - Next Gen Emerging Markets Portfolio for the period of January 1, 2024 to December 31, 2024.
|
|
| Shareholder Report Annual or Semi-Annual |
Annual Shareholder Report
|
|
| Additional Information [Text Block] |
You can find additional information about the Fund at www.morganstanley.com/im/shareholderreports. You can also request this information by contacting us at 1-800-869-6397.
|
|
| Additional Information Phone Number |
1-800-869-6397
|
|
| Additional Information Website |
<span style="box-sizing: border-box; color: rgb(0, 0, 0); display: inline; flex-wrap: nowrap; font-size: 10.6667px; font-weight: 400; grid-area: auto; line-height: 16px; margin: 0px; overflow: visible; text-align: left;">www.morganstanley.com/im/shareholderreports</span>
|
|
| Expenses [Text Block] |
What were the Fund costs for the last year?(based on a hypothetical $10,000 investment) Class Name | Costs of a $10,000 investment | Costs paid as a percentage of a $10,000 investment |
|---|
Class I | $133 | 1.25% |
|---|
|
|
| Expenses Paid, Amount |
$ 133
|
|
| Expense Ratio, Percent |
1.25%
|
|
| Factors Affecting Performance [Text Block] |
How did the Fund perform last year and what affected its performance?Key contributors to (↑) and detractors from (↓) performance, relative to the MSCI Frontier Emerging Markets Net Index: ↑ Positioning in Vietnam, through allocations to an IT outsourcing company and an electronics and grocery retailer ↑The underweight allocation to and stock selection in the Philippines ↑ The allocation to a fast-growing online travel agency in Argentina ↑ The overweight allocation to and stock selection in Egypt, led by a position in a leading bank ↑ Positioning in the U.A.E, through the allocation to a local real estate developer ↓The allocations to select positions in Poland, which were exited during the year ↓ The allocations to select IT services companies hurt by an extended slowdown in IT spending globally ↓ The underweight allocation to Peru |
|
| Line Graph [Table Text Block] |
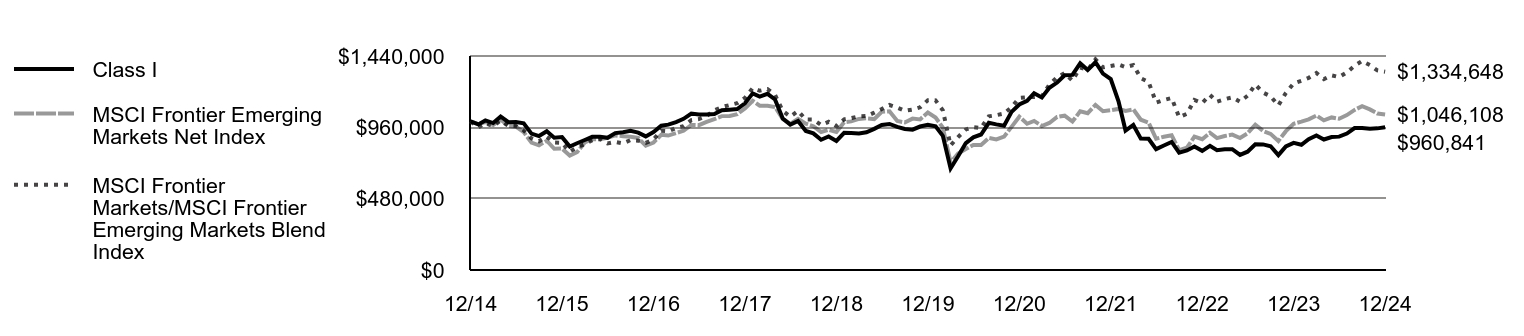 | Class I | MSCI Frontier Emerging Markets Net Index | MSCI Frontier Markets/MSCI Frontier Emerging Markets Blend Index |
|---|
12/14 | $1,000,000 | $1,000,000 | $1,000,000 |
|---|
1/15 | $979,645 | $981,918 | $959,213 |
|---|
2/15 | $1,006,263 | $994,603 | $987,324 |
|---|
3/15 | $988,518 | $975,797 | $968,920 |
|---|
4/15 | $1,032,881 | $1,012,928 | $1,005,267 |
|---|
5/15 | $994,781 | $969,127 | $969,389 |
|---|
6/15 | $995,303 | $964,255 | $968,483 |
|---|
7/15 | $986,952 | $927,702 | $940,105 |
|---|
8/15 | $917,537 | $856,983 | $886,194 |
|---|
9/15 | $901,357 | $839,168 | $866,076 |
|---|
10/15 | $933,194 | $869,890 | $897,816 |
|---|
11/15 | $889,875 | $815,747 | $858,000 |
|---|
12/15 | $894,231 | $817,000 | $855,437 |
|---|
1/16 | $831,034 | $770,210 | $796,912 |
|---|
2/16 | $853,153 | $792,638 | $824,778 |
|---|
3/16 | $874,745 | $858,060 | $847,374 |
|---|
4/16 | $896,337 | $881,314 | $873,278 |
|---|
5/16 | $897,390 | $879,587 | $882,056 |
|---|
6/16 | $889,491 | $889,388 | $851,385 |
|---|
7/16 | $921,089 | $905,425 | $861,899 |
|---|
8/16 | $927,409 | $900,682 | $852,124 |
|---|
9/16 | $936,362 | $896,233 | $873,936 |
|---|
10/16 | $924,249 | $888,513 | $870,462 |
|---|
11/16 | $898,970 | $836,099 | $854,967 |
|---|
12/16 | $928,442 | $857,857 | $878,228 |
|---|
1/17 | $970,620 | $909,956 | $936,726 |
|---|
2/17 | $978,094 | $904,535 | $933,307 |
|---|
3/17 | $995,179 | $921,404 | $956,334 |
|---|
4/17 | $1,017,069 | $936,967 | $967,457 |
|---|
5/17 | $1,052,840 | $976,234 | $1,008,780 |
|---|
6/17 | $1,046,967 | $974,728 | $1,014,981 |
|---|
7/17 | $1,045,899 | $996,924 | $1,036,371 |
|---|
8/17 | $1,049,636 | $1,016,021 | $1,074,554 |
|---|
9/17 | $1,074,729 | $1,035,459 | $1,096,513 |
|---|
10/17 | $1,079,000 | $1,036,827 | $1,109,953 |
|---|
11/17 | $1,083,272 | $1,048,687 | $1,122,882 |
|---|
12/17 | $1,121,712 | $1,087,658 | $1,157,995 |
|---|
1/18 | $1,188,449 | $1,138,468 | $1,224,373 |
|---|
2/18 | $1,166,559 | $1,105,902 | $1,206,139 |
|---|
3/18 | $1,185,779 | $1,105,032 | $1,217,058 |
|---|
4/18 | $1,147,873 | $1,096,658 | $1,178,747 |
|---|
5/18 | $1,019,738 | $1,015,719 | $1,070,071 |
|---|
6/18 | $978,628 | $983,162 | $1,032,181 |
|---|
7/18 | $1,003,056 | $1,017,616 | $1,070,013 |
|---|
8/18 | $935,610 | $984,724 | $1,012,325 |
|---|
9/18 | $919,423 | $967,463 | $1,011,769 |
|---|
10/18 | $876,258 | $928,674 | $976,015 |
|---|
11/18 | $898,380 | $943,296 | $997,155 |
|---|
12/18 | $868,203 | $928,874 | $967,972 |
|---|
1/19 | $922,604 | $994,617 | $1,014,005 |
|---|
2/19 | $921,494 | $1,000,014 | $1,022,120 |
|---|
3/19 | $919,274 | $1,016,579 | $1,034,490 |
|---|
4/19 | $926,490 | $1,020,689 | $1,036,268 |
|---|
5/19 | $949,805 | $1,015,393 | $1,058,664 |
|---|
6/19 | $976,451 | $1,064,635 | $1,082,994 |
|---|
7/19 | $982,557 | $1,068,360 | $1,110,172 |
|---|
8/19 | $963,128 | $1,002,328 | $1,092,493 |
|---|
9/19 | $948,695 | $992,861 | $1,071,136 |
|---|
10/19 | $944,254 | $1,018,758 | $1,079,827 |
|---|
11/19 | $965,348 | $1,013,523 | $1,094,582 |
|---|
12/19 | $976,959 | $1,059,804 | $1,142,126 |
|---|
1/20 | $967,247 | $1,025,839 | $1,141,453 |
|---|
2/20 | $903,259 | $957,816 | $1,074,328 |
|---|
3/20 | $683,300 | $725,318 | $838,385 |
|---|
4/20 | $764,999 | $783,551 | $894,886 |
|---|
5/20 | $854,125 | $814,559 | $946,143 |
|---|
6/20 | $892,403 | $841,906 | $962,012 |
|---|
7/20 | $911,828 | $841,691 | $955,362 |
|---|
8/20 | $990,671 | $888,582 | $1,034,097 |
|---|
9/20 | $979,816 | $878,521 | $1,041,767 |
|---|
10/20 | $970,674 | $897,657 | $1,052,704 |
|---|
11/20 | $1,063,800 | $963,259 | $1,095,764 |
|---|
12/20 | $1,113,901 | $1,031,590 | $1,158,411 |
|---|
1/21 | $1,138,476 | $984,174 | $1,162,770 |
|---|
2/21 | $1,189,342 | $1,003,384 | $1,164,305 |
|---|
3/21 | $1,161,337 | $968,866 | $1,167,733 |
|---|
4/21 | $1,225,920 | $989,406 | $1,247,649 |
|---|
5/21 | $1,261,354 | $1,029,825 | $1,297,693 |
|---|
6/21 | $1,310,505 | $1,038,467 | $1,324,899 |
|---|
7/21 | $1,312,791 | $998,778 | $1,274,263 |
|---|
8/21 | $1,391,090 | $1,067,595 | $1,362,062 |
|---|
9/21 | $1,345,368 | $1,055,345 | $1,346,432 |
|---|
10/21 | $1,397,948 | $1,110,579 | $1,416,902 |
|---|
11/21 | $1,321,364 | $1,068,343 | $1,363,016 |
|---|
12/21 | $1,284,787 | $1,075,871 | $1,372,621 |
|---|
1/22 | $1,135,619 | $1,083,968 | $1,382,950 |
|---|
2/22 | $938,443 | $1,070,197 | $1,365,381 |
|---|
3/22 | $976,163 | $1,081,092 | $1,379,281 |
|---|
4/22 | $884,148 | $1,011,241 | $1,290,164 |
|---|
5/22 | $883,005 | $991,963 | $1,265,568 |
|---|
6/22 | $813,279 | $883,148 | $1,126,740 |
|---|
7/22 | $837,855 | $896,547 | $1,143,835 |
|---|
8/22 | $861,859 | $907,218 | $1,157,449 |
|---|
9/22 | $789,847 | $806,455 | $1,028,894 |
|---|
10/22 | $804,135 | $823,918 | $1,051,173 |
|---|
11/22 | $830,996 | $896,968 | $1,144,372 |
|---|
12/22 | $801,849 | $880,307 | $1,123,115 |
|---|
1/23 | $834,997 | $923,399 | $1,178,093 |
|---|
2/23 | $805,849 | $887,616 | $1,132,441 |
|---|
3/23 | $812,708 | $901,322 | $1,149,927 |
|---|
4/23 | $812,708 | $910,726 | $1,161,925 |
|---|
5/23 | $774,415 | $888,116 | $1,133,078 |
|---|
6/23 | $796,133 | $919,330 | $1,172,901 |
|---|
7/23 | $846,427 | $978,108 | $1,247,891 |
|---|
8/23 | $845,284 | $935,598 | $1,193,657 |
|---|
9/23 | $832,711 | $916,098 | $1,168,778 |
|---|
10/23 | $772,701 | $868,216 | $1,107,690 |
|---|
11/23 | $831,568 | $934,119 | $1,191,770 |
|---|
12/23 | $855,144 | $984,464 | $1,256,002 |
|---|
1/24 | $842,398 | $998,307 | $1,273,663 |
|---|
2/24 | $880,057 | $1,013,423 | $1,292,947 |
|---|
3/24 | $905,549 | $1,039,370 | $1,326,052 |
|---|
4/24 | $878,319 | $1,007,092 | $1,284,870 |
|---|
5/24 | $895,120 | $1,026,662 | $1,309,838 |
|---|
6/24 | $897,438 | $1,017,637 | $1,298,324 |
|---|
7/24 | $918,295 | $1,042,240 | $1,329,713 |
|---|
8/24 | $954,795 | $1,077,321 | $1,374,470 |
|---|
9/24 | $955,954 | $1,102,393 | $1,406,458 |
|---|
10/24 | $950,739 | $1,080,775 | $1,378,877 |
|---|
11/24 | $953,057 | $1,052,796 | $1,343,180 |
|---|
12/24 | $960,841 | $1,046,108 | $1,334,648 |
|---|
|
|
| Average Annual Return [Table Text Block] |
AATR | 1 Year | 5 Years | 10 Years |
|---|
Class I | 12.36% | (0.33)% | (0.40)% |
|---|
MSCI Frontier Emerging Markets Net Index | 6.26% | (0.26)% | 0.45% |
|---|
MSCI Frontier Markets/MSCI Frontier Emerging Markets Blend Index | 6.26% | 3.16% | 2.93% |
|---|
|
|
| AssetsNet |
$ 21,546,460
|
|
| Holdings Count | Holding |
42
|
|
| Advisory Fees Paid, Amount |
$ 0
|
|
| InvestmentCompanyPortfolioTurnover |
40.00%
|
|
| Additional Fund Statistics [Text Block] |
Total Net Assets | $21,546,460 |
|---|
# of Portfolio Holdings | 42 |
|---|
Portfolio Turnover Rate | 40% |
|---|
Total Advisory Fees Paid (Net of Waivers) | $0 |
|---|
|
|
| Holdings [Text Block] |
Country Weightings (% of total investments)Value | Value |
|---|
Other | 14.4% | Slovenia | 3.0% | Argentina | 3.9% | Bangladesh | 4.1% | Egypt | 4.8% | Pakistan | 6.1% | Kazakhstan | 8.4% | Philippines | 8.6% | United States | 8.9% | Indonesia | 14.2% | Vietnam | 23.6% |
Top Ten Holdings (% of total investments)Footnote ReferenceaFPT Corp. | 8.4% | Century Pacific Food, Inc. | 4.2% | Medikaloka Hermina Tbk. PT | 4.2% | Systems Ltd. | 4.0% | MercadoLibre, Inc. | 3.9% | Phu Nhuan Jewelry JSC | 3.9% | NAC Kazatomprom JSC | 3.6% | Map Aktif Adiperkasa PT | 3.6% | Bank for Foreign Trade of Vietnam JSC | 3.0% | Nova Ljubljanska Banka DD | 3.0% | Total | 41.8% |
| Footnote | Description | Footnotea | Excluding cash equivalents. |
|
|
| Material Fund Change [Text Block] |
|
|
| Updated Prospectus Web Address |
<span style="box-sizing: border-box; color: rgb(0, 0, 0); display: inline; flex-wrap: nowrap; font-size: 10.6667px; font-weight: 400; grid-area: auto; line-height: 16px; margin: 0px; overflow: visible; text-align: left;">www.morganstanley.com/im/shareholderreports</span>
|
|
| C000115788 |
|
|
| Shareholder Report [Line Items] |
|
|
| Fund Name |
Morgan Stanley Institutional Fund, Inc. - Next Gen Emerging Markets Portfolio
|
|
| Class Name |
Class L
|
|
| Trading Symbol |
MFMLX
|
|
| Annual or Semi-Annual Statement [Text Block] |
This annual shareholder report contains important information about Morgan Stanley Institutional Fund, Inc. - Next Gen Emerging Markets Portfolio for the period of January 1, 2024 to December 31, 2024.
|
|
| Shareholder Report Annual or Semi-Annual |
Annual Shareholder Report
|
|
| Additional Information [Text Block] |
You can find additional information about the Fund at www.morganstanley.com/im/shareholderreports. You can also request this information by contacting us at 1-800-869-6397.
|
|
| Additional Information Phone Number |
1-800-869-6397
|
|
| Additional Information Website |
<span style="box-sizing: border-box; color: rgb(0, 0, 0); display: inline; flex-wrap: nowrap; font-size: 10.6667px; font-weight: 400; grid-area: auto; line-height: 16px; margin: 0px; overflow: visible; text-align: left;">www.morganstanley.com/im/shareholderreports</span>
|
|
| Expenses [Text Block] |
What were the Fund costs for the last year?(based on a hypothetical $10,000 investment) Class Name | Costs of a $10,000 investment | Costs paid as a percentage of a $10,000 investment |
|---|
Class L | $222 | 2.10% |
|---|
|
|
| Expenses Paid, Amount |
$ 222
|
|
| Expense Ratio, Percent |
2.10%
|
|
| Factors Affecting Performance [Text Block] |
How did the Fund perform last year and what affected its performance?Key contributors to (↑) and detractors from (↓) performance, relative to the MSCI Frontier Emerging Markets Net Index: ↑ Positioning in Vietnam, through allocations to an IT outsourcing company and an electronics and grocery retailer ↑The underweight allocation to and stock selection in the Philippines ↑ The allocation to a fast-growing online travel agency in Argentina ↑ The overweight allocation to and stock selection in Egypt, led by a position in a leading bank ↑ Positioning in the U.A.E, through the allocation to a local real estate developer ↓The allocations to select positions in Poland, which were exited during the year ↓ The allocations to select IT services companies hurt by an extended slowdown in IT spending globally ↓ The underweight allocation to Peru |
|
| Line Graph [Table Text Block] |
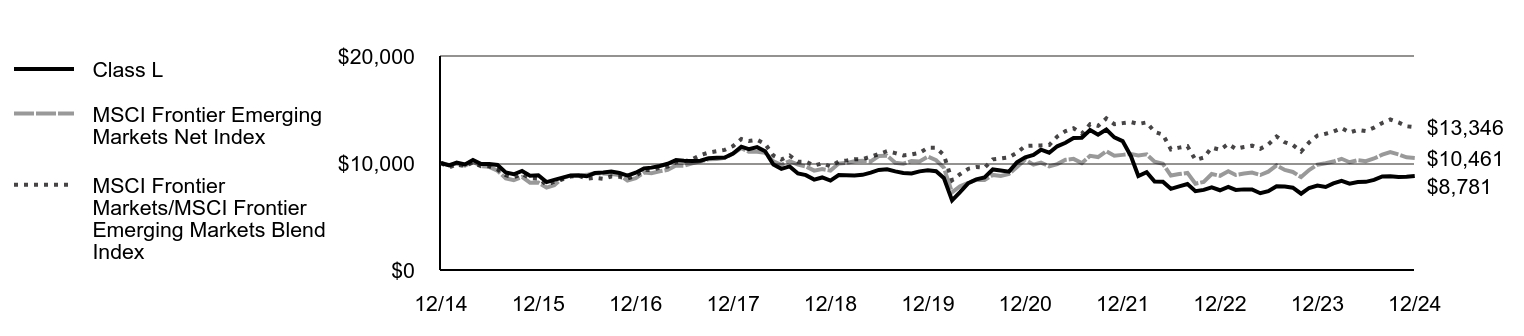 | Class L | MSCI Frontier Emerging Markets Net Index | MSCI Frontier Markets/MSCI Frontier Emerging Markets Blend Index |
|---|
12/14 | $10,000 | $10,000 | $10,000 |
|---|
1/15 | $9,784 | $9,819 | $9,592 |
|---|
2/15 | $10,042 | $9,946 | $9,873 |
|---|
3/15 | $9,863 | $9,758 | $9,689 |
|---|
4/15 | $10,290 | $10,129 | $10,053 |
|---|
5/15 | $9,905 | $9,691 | $9,694 |
|---|
6/15 | $9,900 | $9,643 | $9,685 |
|---|
7/15 | $9,810 | $9,277 | $9,401 |
|---|
8/15 | $9,115 | $8,570 | $8,862 |
|---|
9/15 | $8,946 | $8,392 | $8,661 |
|---|
10/15 | $9,257 | $8,699 | $8,978 |
|---|
11/15 | $8,820 | $8,157 | $8,580 |
|---|
12/15 | $8,851 | $8,170 | $8,554 |
|---|
1/16 | $8,214 | $7,702 | $7,969 |
|---|
2/16 | $8,425 | $7,926 | $8,248 |
|---|
3/16 | $8,635 | $8,581 | $8,474 |
|---|
4/16 | $8,841 | $8,813 | $8,733 |
|---|
5/16 | $8,846 | $8,796 | $8,821 |
|---|
6/16 | $8,757 | $8,894 | $8,514 |
|---|
7/16 | $9,062 | $9,054 | $8,619 |
|---|
8/16 | $9,115 | $9,007 | $8,521 |
|---|
9/16 | $9,194 | $8,962 | $8,739 |
|---|
10/16 | $9,067 | $8,885 | $8,705 |
|---|
11/16 | $8,809 | $8,361 | $8,550 |
|---|
12/16 | $9,096 | $8,579 | $8,782 |
|---|
1/17 | $9,497 | $9,100 | $9,367 |
|---|
2/17 | $9,566 | $9,045 | $9,333 |
|---|
3/17 | $9,724 | $9,214 | $9,563 |
|---|
4/17 | $9,929 | $9,370 | $9,675 |
|---|
5/17 | $10,267 | $9,762 | $10,088 |
|---|
6/17 | $10,204 | $9,747 | $10,150 |
|---|
7/17 | $10,182 | $9,969 | $10,364 |
|---|
8/17 | $10,209 | $10,160 | $10,746 |
|---|
9/17 | $10,446 | $10,355 | $10,965 |
|---|
10/17 | $10,483 | $10,368 | $11,100 |
|---|
11/17 | $10,515 | $10,487 | $11,229 |
|---|
12/17 | $10,879 | $10,877 | $11,580 |
|---|
1/18 | $11,522 | $11,385 | $12,244 |
|---|
2/18 | $11,300 | $11,059 | $12,061 |
|---|
3/18 | $11,480 | $11,050 | $12,171 |
|---|
4/18 | $11,105 | $10,967 | $11,787 |
|---|
5/18 | $9,861 | $10,157 | $10,701 |
|---|
6/18 | $9,455 | $9,832 | $10,322 |
|---|
7/18 | $9,682 | $10,176 | $10,700 |
|---|
8/18 | $9,022 | $9,847 | $10,123 |
|---|
9/18 | $8,864 | $9,675 | $10,118 |
|---|
10/18 | $8,448 | $9,287 | $9,760 |
|---|
11/18 | $8,648 | $9,433 | $9,972 |
|---|
12/18 | $8,356 | $9,289 | $9,680 |
|---|
1/19 | $8,871 | $9,946 | $10,140 |
|---|
2/19 | $8,860 | $10,000 | $10,221 |
|---|
3/19 | $8,828 | $10,166 | $10,345 |
|---|
4/19 | $8,892 | $10,207 | $10,363 |
|---|
5/19 | $9,106 | $10,154 | $10,587 |
|---|
6/19 | $9,353 | $10,646 | $10,830 |
|---|
7/19 | $9,412 | $10,684 | $11,102 |
|---|
8/19 | $9,219 | $10,023 | $10,925 |
|---|
9/19 | $9,069 | $9,929 | $10,711 |
|---|
10/19 | $9,021 | $10,188 | $10,798 |
|---|
11/19 | $9,219 | $10,135 | $10,946 |
|---|
12/19 | $9,324 | $10,598 | $11,421 |
|---|
1/20 | $9,226 | $10,258 | $11,415 |
|---|
2/20 | $8,605 | $9,578 | $10,743 |
|---|
3/20 | $6,508 | $7,253 | $8,384 |
|---|
4/20 | $7,276 | $7,836 | $8,949 |
|---|
5/20 | $8,120 | $8,146 | $9,461 |
|---|
6/20 | $8,474 | $8,419 | $9,620 |
|---|
7/20 | $8,660 | $8,417 | $9,554 |
|---|
8/20 | $9,395 | $8,886 | $10,341 |
|---|
9/20 | $9,291 | $8,785 | $10,418 |
|---|
10/20 | $9,193 | $8,977 | $10,527 |
|---|
11/20 | $10,070 | $9,633 | $10,958 |
|---|
12/20 | $10,537 | $10,316 | $11,584 |
|---|
1/21 | $10,760 | $9,842 | $11,628 |
|---|
2/21 | $11,240 | $10,034 | $11,643 |
|---|
3/21 | $10,962 | $9,689 | $11,677 |
|---|
4/21 | $11,561 | $9,894 | $12,476 |
|---|
5/21 | $11,893 | $10,298 | $12,977 |
|---|
6/21 | $12,340 | $10,385 | $13,249 |
|---|
7/21 | $12,357 | $9,988 | $12,743 |
|---|
8/21 | $13,081 | $10,676 | $13,621 |
|---|
9/21 | $12,640 | $10,553 | $13,464 |
|---|
10/21 | $13,125 | $11,106 | $14,169 |
|---|
11/21 | $12,400 | $10,683 | $13,630 |
|---|
12/21 | $12,046 | $10,759 | $13,726 |
|---|
1/22 | $10,640 | $10,840 | $13,830 |
|---|
2/22 | $8,788 | $10,702 | $13,654 |
|---|
3/22 | $9,137 | $10,811 | $13,793 |
|---|
4/22 | $8,270 | $10,112 | $12,902 |
|---|
5/22 | $8,254 | $9,920 | $12,656 |
|---|
6/22 | $7,589 | $8,831 | $11,267 |
|---|
7/22 | $7,818 | $8,965 | $11,438 |
|---|
8/22 | $8,031 | $9,072 | $11,574 |
|---|
9/22 | $7,361 | $8,065 | $10,289 |
|---|
10/22 | $7,486 | $8,239 | $10,512 |
|---|
11/22 | $7,731 | $8,970 | $11,444 |
|---|
12/22 | $7,453 | $8,803 | $11,231 |
|---|
1/23 | $7,758 | $9,234 | $11,781 |
|---|
2/23 | $7,480 | $8,876 | $11,324 |
|---|
3/23 | $7,535 | $9,013 | $11,499 |
|---|
4/23 | $7,535 | $9,107 | $11,619 |
|---|
5/23 | $7,175 | $8,881 | $11,331 |
|---|
6/23 | $7,366 | $9,193 | $11,729 |
|---|
7/23 | $7,829 | $9,781 | $12,479 |
|---|
8/23 | $7,813 | $9,356 | $11,937 |
|---|
9/23 | $7,693 | $9,161 | $11,688 |
|---|
10/23 | $7,132 | $8,682 | $11,077 |
|---|
11/23 | $7,666 | $9,341 | $11,918 |
|---|
12/23 | $7,884 | $9,845 | $12,560 |
|---|
1/24 | $7,758 | $9,983 | $12,737 |
|---|
2/24 | $8,097 | $10,134 | $12,929 |
|---|
3/24 | $8,327 | $10,394 | $13,261 |
|---|
4/24 | $8,070 | $10,071 | $12,849 |
|---|
5/24 | $8,218 | $10,267 | $13,098 |
|---|
6/24 | $8,240 | $10,176 | $12,983 |
|---|
7/24 | $8,421 | $10,422 | $13,297 |
|---|
8/24 | $8,749 | $10,773 | $13,745 |
|---|
9/24 | $8,755 | $11,024 | $14,065 |
|---|
10/24 | $8,700 | $10,808 | $13,789 |
|---|
11/24 | $8,716 | $10,528 | $13,432 |
|---|
12/24 | $8,781 | $10,461 | $13,346 |
|---|
|
|
| Average Annual Return [Table Text Block] |
AATR | 1 Year | 5 Years | 10 Years |
|---|
Class L | 11.38% | (1.19)% | (1.29)% |
|---|
MSCI Frontier Emerging Markets Net Index | 6.26% | (0.26)% | 0.45% |
|---|
MSCI Frontier Markets/MSCI Frontier Emerging Markets Blend Index | 6.26% | 3.16% | 2.93% |
|---|
|
|
| AssetsNet |
$ 21,546,460
|
|
| Holdings Count | Holding |
42
|
|
| Advisory Fees Paid, Amount |
$ 0
|
|
| InvestmentCompanyPortfolioTurnover |
40.00%
|
|
| Additional Fund Statistics [Text Block] |
Total Net Assets | $21,546,460 |
|---|
# of Portfolio Holdings | 42 |
|---|
Portfolio Turnover Rate | 40% |
|---|
Total Advisory Fees Paid (Net of Waivers) | $0 |
|---|
|
|
| Holdings [Text Block] |
Country Weightings (% of total investments)Value | Value |
|---|
Other | 14.4% | Slovenia | 3.0% | Argentina | 3.9% | Bangladesh | 4.1% | Egypt | 4.8% | Pakistan | 6.1% | Kazakhstan | 8.4% | Philippines | 8.6% | United States | 8.9% | Indonesia | 14.2% | Vietnam | 23.6% |
Top Ten Holdings (% of total investments)Footnote ReferenceaFPT Corp. | 8.4% | Century Pacific Food, Inc. | 4.2% | Medikaloka Hermina Tbk. PT | 4.2% | Systems Ltd. | 4.0% | MercadoLibre, Inc. | 3.9% | Phu Nhuan Jewelry JSC | 3.9% | NAC Kazatomprom JSC | 3.6% | Map Aktif Adiperkasa PT | 3.6% | Bank for Foreign Trade of Vietnam JSC | 3.0% | Nova Ljubljanska Banka DD | 3.0% | Total | 41.8% |
| Footnote | Description | Footnotea | Excluding cash equivalents. |
|
|
| Material Fund Change [Text Block] |
|
|
| Updated Prospectus Web Address |
<span style="box-sizing: border-box; color: rgb(0, 0, 0); display: inline; flex-wrap: nowrap; font-size: 10.6667px; font-weight: 400; grid-area: auto; line-height: 16px; margin: 0px; overflow: visible; text-align: left;">www.morganstanley.com/im/shareholderreports</span>
|
|
| C000152578 |
|
|
| Shareholder Report [Line Items] |
|
|
| Fund Name |
Morgan Stanley Institutional Fund, Inc. - Next Gen Emerging Markets Portfolio
|
|
| Class Name |
Class R6
|
|
| Trading Symbol |
MSRFX
|
|
| Annual or Semi-Annual Statement [Text Block] |
This annual shareholder report contains important information about Morgan Stanley Institutional Fund, Inc. - Next Gen Emerging Markets Portfolio for the period of January 1, 2024 to December 31, 2024.
|
|
| Shareholder Report Annual or Semi-Annual |
Annual Shareholder Report
|
|
| Additional Information [Text Block] |
You can find additional information about the Fund at www.morganstanley.com/im/shareholderreports. You can also request this information by contacting us at 1-800-869-6397.
|
|
| Additional Information Phone Number |
1-800-869-6397
|
|
| Additional Information Website |
<span style="box-sizing: border-box; color: rgb(0, 0, 0); display: inline; flex-wrap: nowrap; font-size: 10.6667px; font-weight: 400; grid-area: auto; line-height: 16px; margin: 0px; overflow: visible; text-align: left;">www.morganstanley.com/im/shareholderreports</span>
|
|
| Expenses [Text Block] |
What were the Fund costs for the last year?(based on a hypothetical $10,000 investment) Class Name | Costs of a $10,000 investment | Costs paid as a percentage of a $10,000 investment |
|---|
Class R6 | $127 | 1.20% |
|---|
|
|
| Expenses Paid, Amount |
$ 127
|
|
| Expense Ratio, Percent |
1.20%
|
|
| Factors Affecting Performance [Text Block] |
How did the Fund perform last year and what affected its performance?Key contributors to (↑) and detractors from (↓) performance, relative to the MSCI Frontier Emerging Markets Net Index: ↑ Positioning in Vietnam, through allocations to an IT outsourcing company and an electronics and grocery retailer ↑The underweight allocation to and stock selection in the Philippines ↑ The allocation to a fast-growing online travel agency in Argentina ↑ The overweight allocation to and stock selection in Egypt, led by a position in a leading bank ↑ Positioning in the U.A.E, through the allocation to a local real estate developer ↓The allocations to select positions in Poland, which were exited during the year ↓ The allocations to select IT services companies hurt by an extended slowdown in IT spending globally ↓ The underweight allocation to Peru |
|
| Line Graph [Table Text Block] |
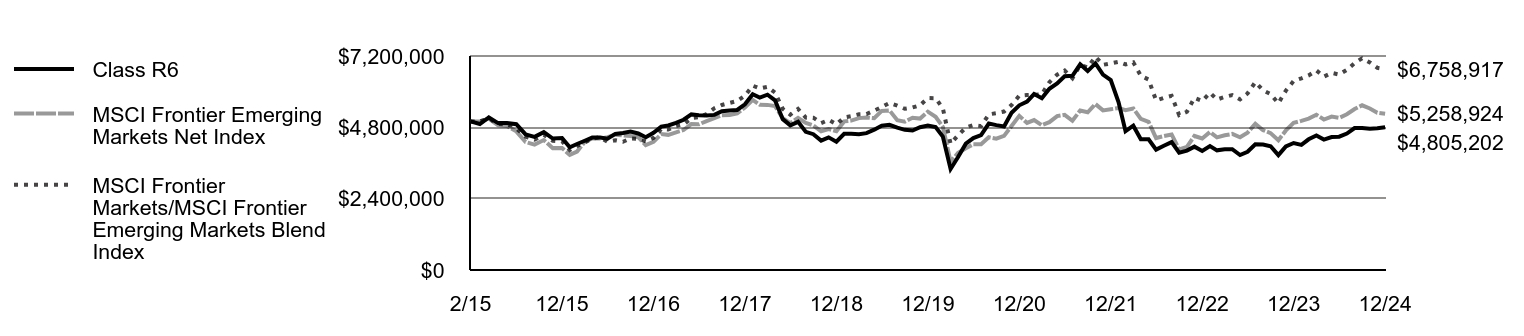 | Class R6 | MSCI Frontier Emerging Markets Net Index | MSCI Frontier Markets/MSCI Frontier Emerging Markets Blend Index |
|---|
2/15 | $5,000,000 | $5,000,000 | $5,000,000 |
|---|
3/15 | $4,911,826 | $5,000,000 | $5,000,000 |
|---|
4/15 | $5,132,261 | $5,092,125 | $5,090,867 |
|---|
5/15 | $4,942,946 | $4,871,931 | $4,909,173 |
|---|
6/15 | $4,945,539 | $4,847,436 | $4,904,586 |
|---|
7/15 | $4,904,046 | $4,663,681 | $4,760,876 |
|---|
8/15 | $4,561,722 | $4,308,165 | $4,487,858 |
|---|
9/15 | $4,478,734 | $4,218,607 | $4,385,980 |
|---|
10/15 | $4,639,523 | $4,373,054 | $4,546,717 |
|---|
11/15 | $4,421,680 | $4,100,869 | $4,345,081 |
|---|
12/15 | $4,442,841 | $4,107,169 | $4,332,099 |
|---|
1/16 | $4,131,292 | $3,871,950 | $4,035,717 |
|---|
2/16 | $4,238,632 | $3,984,698 | $4,176,837 |
|---|
3/16 | $4,348,591 | $4,313,583 | $4,291,266 |
|---|
4/16 | $4,455,931 | $4,430,481 | $4,422,452 |
|---|
5/16 | $4,461,167 | $4,421,799 | $4,466,903 |
|---|
6/16 | $4,419,278 | $4,471,072 | $4,311,580 |
|---|
7/16 | $4,578,980 | $4,551,691 | $4,364,825 |
|---|
8/16 | $4,610,396 | $4,527,851 | $4,315,324 |
|---|
9/16 | $4,654,903 | $4,505,482 | $4,425,782 |
|---|
10/16 | $4,594,688 | $4,466,675 | $4,408,189 |
|---|
11/16 | $4,469,021 | $4,203,181 | $4,329,720 |
|---|
12/16 | $4,615,375 | $4,312,559 | $4,447,516 |
|---|
1/17 | $4,825,165 | $4,574,468 | $4,743,762 |
|---|
2/17 | $4,862,343 | $4,547,218 | $4,726,446 |
|---|
3/17 | $4,947,321 | $4,632,018 | $4,843,064 |
|---|
4/17 | $5,056,199 | $4,710,259 | $4,899,392 |
|---|
5/17 | $5,234,122 | $4,907,657 | $5,108,659 |
|---|
6/17 | $5,204,911 | $4,900,087 | $5,140,059 |
|---|
7/17 | $5,199,600 | $5,011,668 | $5,248,386 |
|---|
8/17 | $5,218,189 | $5,107,671 | $5,441,750 |
|---|
9/17 | $5,343,000 | $5,205,392 | $5,552,953 |
|---|
10/17 | $5,366,901 | $5,212,268 | $5,621,016 |
|---|
11/17 | $5,385,490 | $5,271,889 | $5,686,494 |
|---|
12/17 | $5,576,690 | $5,467,801 | $5,864,312 |
|---|
1/18 | $5,911,292 | $5,723,231 | $6,200,465 |
|---|
2/18 | $5,802,414 | $5,559,517 | $6,108,124 |
|---|
3/18 | $5,898,014 | $5,555,142 | $6,163,420 |
|---|
4/18 | $5,709,469 | $5,513,043 | $5,969,405 |
|---|
5/18 | $5,074,788 | $5,106,156 | $5,419,048 |
|---|
6/18 | $4,867,654 | $4,942,484 | $5,227,167 |
|---|
7/18 | $4,985,453 | $5,115,693 | $5,418,757 |
|---|
8/18 | $4,647,365 | $4,950,338 | $5,126,611 |
|---|
9/18 | $4,569,551 | $4,863,566 | $5,123,793 |
|---|
10/18 | $4,352,209 | $4,668,569 | $4,942,730 |
|---|
11/18 | $4,462,222 | $4,742,073 | $5,049,789 |
|---|
12/18 | $4,315,995 | $4,669,571 | $4,901,997 |
|---|
1/19 | $4,583,675 | $5,000,074 | $5,135,121 |
|---|
2/19 | $4,580,916 | $5,027,204 | $5,176,214 |
|---|
3/19 | $4,569,877 | $5,110,480 | $5,238,858 |
|---|
4/19 | $4,605,752 | $5,131,138 | $5,247,865 |
|---|
5/19 | $4,721,655 | $5,104,515 | $5,361,281 |
|---|
6/19 | $4,854,115 | $5,352,064 | $5,484,492 |
|---|
7/19 | $4,884,470 | $5,370,790 | $5,622,126 |
|---|
8/19 | $4,787,885 | $5,038,835 | $5,532,596 |
|---|
9/19 | $4,716,136 | $4,991,243 | $5,424,443 |
|---|
10/19 | $4,694,059 | $5,121,434 | $5,468,456 |
|---|
11/19 | $4,801,683 | $5,095,114 | $5,543,178 |
|---|
12/19 | $4,859,744 | $5,327,778 | $5,783,948 |
|---|
1/20 | $4,811,431 | $5,157,027 | $5,780,540 |
|---|
2/20 | $4,490,290 | $4,815,069 | $5,440,605 |
|---|
3/20 | $3,398,979 | $3,646,270 | $4,245,747 |
|---|
4/20 | $3,802,537 | $3,939,014 | $4,531,875 |
|---|
5/20 | $4,248,724 | $4,094,896 | $4,791,451 |
|---|
6/20 | $4,439,135 | $4,232,375 | $4,871,815 |
|---|
7/20 | $4,535,761 | $4,231,290 | $4,838,142 |
|---|
8/20 | $4,927,951 | $4,467,018 | $5,236,868 |
|---|
9/20 | $4,873,954 | $4,416,439 | $5,275,712 |
|---|
10/20 | $4,828,483 | $4,512,639 | $5,331,097 |
|---|
11/20 | $5,291,721 | $4,842,433 | $5,549,164 |
|---|
12/20 | $5,540,942 | $5,185,940 | $5,866,420 |
|---|
1/21 | $5,663,189 | $4,947,574 | $5,888,492 |
|---|
2/21 | $5,919,056 | $5,044,145 | $5,896,268 |
|---|
3/21 | $5,776,908 | $4,870,617 | $5,913,630 |
|---|
4/21 | $6,098,163 | $4,973,878 | $6,318,337 |
|---|
5/21 | $6,277,270 | $5,177,066 | $6,571,768 |
|---|
6/21 | $6,518,922 | $5,220,512 | $6,709,549 |
|---|
7/21 | $6,533,137 | $5,020,987 | $6,453,115 |
|---|
8/21 | $6,919,781 | $5,366,943 | $6,897,746 |
|---|
9/21 | $6,692,343 | $5,305,358 | $6,818,595 |
|---|
10/21 | $6,953,896 | $5,583,030 | $7,175,468 |
|---|
11/21 | $6,575,782 | $5,370,704 | $6,902,580 |
|---|
12/21 | $6,390,989 | $5,408,549 | $6,951,219 |
|---|
1/22 | $5,648,975 | $5,449,250 | $7,003,529 |
|---|
2/22 | $4,670,994 | $5,380,022 | $6,914,556 |
|---|
3/22 | $4,855,787 | $5,434,792 | $6,984,948 |
|---|
4/22 | $4,398,069 | $5,083,642 | $6,533,640 |
|---|
5/22 | $4,398,069 | $4,986,728 | $6,409,083 |
|---|
6/22 | $4,051,227 | $4,439,701 | $5,706,029 |
|---|
7/22 | $4,182,004 | $4,507,061 | $5,792,602 |
|---|
8/22 | $4,304,251 | $4,560,706 | $5,861,548 |
|---|
9/22 | $3,948,881 | $4,054,159 | $5,210,519 |
|---|
10/22 | $4,017,112 | $4,141,944 | $5,323,343 |
|---|
11/22 | $4,150,731 | $4,509,179 | $5,795,324 |
|---|
12/22 | $4,005,740 | $4,425,421 | $5,687,675 |
|---|
1/23 | $4,170,632 | $4,642,049 | $5,966,093 |
|---|
2/23 | $4,025,641 | $4,462,166 | $5,734,901 |
|---|
3/23 | $4,059,756 | $4,531,067 | $5,823,455 |
|---|
4/23 | $4,062,599 | $4,578,342 | $5,884,214 |
|---|
5/23 | $3,869,277 | $4,464,676 | $5,738,127 |
|---|
6/23 | $3,977,310 | $4,621,593 | $5,939,802 |
|---|
7/23 | $4,230,334 | $4,917,076 | $6,319,565 |
|---|
8/23 | $4,224,648 | $4,703,375 | $6,044,911 |
|---|
9/23 | $4,162,103 | $4,605,347 | $5,918,921 |
|---|
10/23 | $3,863,592 | $4,364,639 | $5,609,558 |
|---|
11/23 | $4,156,417 | $4,695,941 | $6,035,356 |
|---|
12/23 | $4,273,218 | $4,949,034 | $6,360,638 |
|---|
1/24 | $4,209,783 | $5,018,623 | $6,450,076 |
|---|
2/24 | $4,397,205 | $5,094,610 | $6,547,736 |
|---|
3/24 | $4,526,958 | $5,225,052 | $6,715,383 |
|---|
4/24 | $4,388,554 | $5,062,783 | $6,506,832 |
|---|
5/24 | $4,475,057 | $5,161,167 | $6,633,277 |
|---|
6/24 | $4,486,590 | $5,115,796 | $6,574,965 |
|---|
7/24 | $4,590,393 | $5,239,478 | $6,733,925 |
|---|
8/24 | $4,774,932 | $5,415,837 | $6,960,586 |
|---|
9/24 | $4,780,699 | $5,541,876 | $7,122,576 |
|---|
10/24 | $4,754,748 | $5,433,199 | $6,982,901 |
|---|
11/24 | $4,769,165 | $5,292,544 | $6,802,127 |
|---|
12/24 | $4,805,202 | $5,258,924 | $6,758,917 |
|---|
|
|
| Average Annual Return [Table Text Block] |
AATR | 1 Year | 5 Years | Since 2/27/15
(Inception) |
|---|
Class R6 | 12.45% | (0.23)% | (0.40)% |
|---|
MSCI Frontier Emerging Markets Net Index | 6.26% | (0.26)% | 0.51% |
|---|
MSCI Frontier Markets/MSCI Frontier Emerging Markets Blend Index | 6.26% | 3.16% | 3.11% |
|---|
|
|
| Performance Inception Date |
Feb. 27, 2015
|
|
| AssetsNet |
$ 21,546,460
|
|
| Holdings Count | Holding |
42
|
|
| Advisory Fees Paid, Amount |
$ 0
|
|
| InvestmentCompanyPortfolioTurnover |
40.00%
|
|
| Additional Fund Statistics [Text Block] |
Total Net Assets | $21,546,460 |
|---|
# of Portfolio Holdings | 42 |
|---|
Portfolio Turnover Rate | 40% |
|---|
Total Advisory Fees Paid (Net of Waivers) | $0 |
|---|
|
|
| Holdings [Text Block] |
Country Weightings (% of total investments)Value | Value |
|---|
Other | 14.4% | Slovenia | 3.0% | Argentina | 3.9% | Bangladesh | 4.1% | Egypt | 4.8% | Pakistan | 6.1% | Kazakhstan | 8.4% | Philippines | 8.6% | United States | 8.9% | Indonesia | 14.2% | Vietnam | 23.6% |
Top Ten Holdings (% of total investments)Footnote ReferenceaFPT Corp. | 8.4% | Century Pacific Food, Inc. | 4.2% | Medikaloka Hermina Tbk. PT | 4.2% | Systems Ltd. | 4.0% | MercadoLibre, Inc. | 3.9% | Phu Nhuan Jewelry JSC | 3.9% | NAC Kazatomprom JSC | 3.6% | Map Aktif Adiperkasa PT | 3.6% | Bank for Foreign Trade of Vietnam JSC | 3.0% | Nova Ljubljanska Banka DD | 3.0% | Total | 41.8% |
| Footnote | Description | Footnotea | Excluding cash equivalents. |
|
|
| Material Fund Change [Text Block] |
|
|
| Updated Prospectus Web Address |
<span style="box-sizing: border-box; color: rgb(0, 0, 0); display: inline; flex-wrap: nowrap; font-size: 10.6667px; font-weight: 400; grid-area: auto; line-height: 16px; margin: 0px; overflow: visible; text-align: left;">www.morganstanley.com/im/shareholderreports</span>
|
|
| C000007737 |
|
|
| Shareholder Report [Line Items] |
|
|
| Fund Name |
Morgan Stanley Institutional Fund, Inc. - Passport Overseas Equity Portfolio
|
|
| Class Name |
Class A
|
|
| Trading Symbol |
MSIBX
|
|
| Annual or Semi-Annual Statement [Text Block] |
This annual shareholder report contains important information about Morgan Stanley Institutional Fund, Inc. - Passport Overseas Equity Portfolio for the period of January 1, 2024 to December 31, 2024.
|
|
| Shareholder Report Annual or Semi-Annual |
Annual Shareholder Report
|
|
| Additional Information [Text Block] |
You can find additional information about the Fund at www.morganstanley.com/im/shareholderreports. You can also request this information by contacting us at 1-800-869-6397.
|
|
| Additional Information Phone Number |
1-800-869-6397
|
|
| Additional Information Website |
<span style="box-sizing: border-box; color: rgb(0, 0, 0); display: inline; flex-wrap: nowrap; font-size: 10.6667px; font-weight: 400; grid-area: auto; line-height: 16px; margin: 0px; overflow: visible; text-align: left;">www.morganstanley.com/im/shareholderreports</span>
|
|
| Expenses [Text Block] |
What were the Fund costs for the last year?(based on a hypothetical $10,000 investment) Class Name | Costs of a $10,000 investment | Costs paid as a percentage of a $10,000 investment |
|---|
Class A | $123 | 1.19% |
|---|
|
|
| Expenses Paid, Amount |
$ 123
|
|
| Expense Ratio, Percent |
1.19%
|
|
| Factors Affecting Performance [Text Block] |
How did the Fund perform last year and what affected its performance?Key contributors to (↑) and detractors from (↓) performance, relative to the MSCI All Country World ex USA Index: ↑ Stock selection in consumer discretionary and communication services ↑ Overweight to and stock selection in semiconductors, led by the allocation to a Taiwan semiconductor foundry ↑ Overweight to aerospace and defense, zero allocation to Mexico and autos, and underweight utilities ↑ Top stock contributors included a Chinese internet company, a U.K.-based personal care products company and an Israel-based security software developer ↓ Underweight to and stock selection in financials and stock selection in technology ↓ Overweight to materials, and overweight to and stock selection within energy ↓ Overweight to and stock selection in France, and underweight to and stock selection in Japan ↓ Top stock detractors included an Ireland-based discount airline, a Canada-based rail transportation company and a France-based IT services provider |
|
| Line Graph [Table Text Block] |
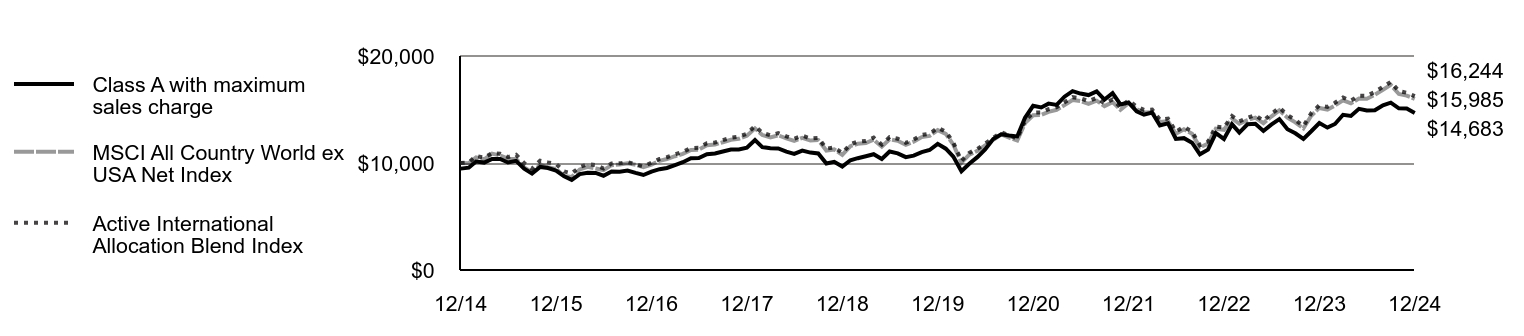 | Class A with maximum sales charge | MSCI All Country World ex USA Net Index | Active International Allocation Blend Index |
|---|
12/14 | $9,474 | $10,000 | $10,000 |
|---|
1/15 | $9,563 | $9,985 | $10,049 |
|---|
2/15 | $10,133 | $10,519 | $10,650 |
|---|
3/15 | $10,037 | $10,349 | $10,488 |
|---|
4/15 | $10,378 | $10,872 | $10,916 |
|---|
5/15 | $10,370 | $10,702 | $10,860 |
|---|
6/15 | $10,044 | $10,403 | $10,552 |
|---|
7/15 | $10,201 | $10,375 | $10,772 |
|---|
8/15 | $9,459 | $9,582 | $9,979 |
|---|
9/15 | $9,006 | $9,137 | $9,472 |
|---|
10/15 | $9,630 | $9,818 | $10,213 |
|---|
11/15 | $9,526 | $9,615 | $10,054 |
|---|
12/15 | $9,290 | $9,434 | $9,919 |
|---|
1/16 | $8,753 | $8,792 | $9,201 |
|---|
2/16 | $8,425 | $8,692 | $9,033 |
|---|
3/16 | $8,962 | $9,398 | $9,620 |
|---|
4/16 | $9,096 | $9,646 | $9,899 |
|---|
5/16 | $9,074 | $9,483 | $9,809 |
|---|
6/16 | $8,813 | $9,338 | $9,480 |
|---|
7/16 | $9,208 | $9,800 | $9,960 |
|---|
8/16 | $9,193 | $9,862 | $9,967 |
|---|
9/16 | $9,297 | $9,983 | $10,090 |
|---|
10/16 | $9,074 | $9,840 | $9,883 |
|---|
11/16 | $8,880 | $9,612 | $9,687 |
|---|
12/16 | $9,192 | $9,858 | $10,018 |
|---|
1/17 | $9,420 | $10,207 | $10,373 |
|---|
2/17 | $9,534 | $10,370 | $10,538 |
|---|
3/17 | $9,800 | $10,633 | $10,805 |
|---|
4/17 | $10,074 | $10,860 | $11,037 |
|---|
5/17 | $10,438 | $11,213 | $11,395 |
|---|
6/17 | $10,461 | $11,248 | $11,430 |
|---|
7/17 | $10,820 | $11,662 | $11,851 |
|---|
8/17 | $10,889 | $11,723 | $11,913 |
|---|
9/17 | $11,071 | $11,941 | $12,135 |
|---|
10/17 | $11,261 | $12,165 | $12,363 |
|---|
11/17 | $11,261 | $12,264 | $12,463 |
|---|
12/17 | $11,425 | $12,538 | $12,742 |
|---|
1/18 | $12,144 | $13,237 | $13,451 |
|---|
2/18 | $11,487 | $12,613 | $12,817 |
|---|
3/18 | $11,379 | $12,390 | $12,591 |
|---|
4/18 | $11,364 | $12,588 | $12,792 |
|---|
5/18 | $11,062 | $12,297 | $12,497 |
|---|
6/18 | $10,854 | $12,066 | $12,262 |
|---|
7/18 | $11,161 | $12,355 | $12,555 |
|---|
8/18 | $10,975 | $12,096 | $12,292 |
|---|
9/18 | $10,890 | $12,151 | $12,348 |
|---|
10/18 | $9,961 | $11,163 | $11,344 |
|---|
11/18 | $10,116 | $11,269 | $11,451 |
|---|
12/18 | $9,668 | $10,758 | $10,933 |
|---|
1/19 | $10,255 | $11,571 | $11,759 |
|---|
2/19 | $10,450 | $11,797 | $11,989 |
|---|
3/19 | $10,630 | $11,868 | $12,060 |
|---|
4/19 | $10,818 | $12,181 | $12,379 |
|---|
5/19 | $10,380 | $11,527 | $11,715 |
|---|
6/19 | $11,076 | $12,222 | $12,420 |
|---|
7/19 | $10,904 | $12,074 | $12,270 |
|---|
8/19 | $10,552 | $11,701 | $11,891 |
|---|
9/19 | $10,685 | $12,002 | $12,197 |
|---|
10/19 | $11,013 | $12,421 | $12,622 |
|---|
11/19 | $11,217 | $12,530 | $12,733 |
|---|
12/19 | $11,794 | $13,073 | $13,285 |
|---|
1/20 | $11,337 | $12,722 | $12,928 |
|---|
2/20 | $10,594 | $11,716 | $11,906 |
|---|
3/20 | $9,229 | $10,020 | $10,182 |
|---|
4/20 | $9,923 | $10,779 | $10,954 |
|---|
5/20 | $10,547 | $11,132 | $11,312 |
|---|
6/20 | $11,273 | $11,635 | $11,824 |
|---|
7/20 | $12,236 | $12,153 | $12,351 |
|---|
8/20 | $12,679 | $12,674 | $12,879 |
|---|
9/20 | $12,568 | $12,362 | $12,563 |
|---|
10/20 | $12,481 | $12,096 | $12,293 |
|---|
11/20 | $14,226 | $13,724 | $13,946 |
|---|
12/20 | $15,345 | $14,465 | $14,700 |
|---|
1/21 | $15,195 | $14,497 | $14,732 |
|---|
2/21 | $15,550 | $14,784 | $15,024 |
|---|
3/21 | $15,432 | $14,971 | $15,214 |
|---|
4/21 | $16,198 | $15,411 | $15,661 |
|---|
5/21 | $16,711 | $15,893 | $16,151 |
|---|
6/21 | $16,490 | $15,790 | $16,047 |
|---|
7/21 | $16,348 | $15,530 | $15,782 |
|---|
8/21 | $16,696 | $15,825 | $16,082 |
|---|
9/21 | $15,929 | $15,319 | $15,567 |
|---|
10/21 | $16,530 | $15,684 | $15,939 |
|---|
11/21 | $15,479 | $14,978 | $15,221 |
|---|
12/21 | $15,656 | $15,597 | $15,850 |
|---|
1/22 | $14,827 | $15,022 | $15,266 |
|---|
2/22 | $14,510 | $14,725 | $14,964 |
|---|
3/22 | $14,716 | $14,748 | $14,988 |
|---|
4/22 | $13,510 | $13,822 | $14,047 |
|---|
5/22 | $13,715 | $13,922 | $14,147 |
|---|
6/22 | $12,253 | $12,724 | $12,930 |
|---|
7/22 | $12,321 | $13,160 | $13,373 |
|---|
8/22 | $11,894 | $12,736 | $12,943 |
|---|
9/22 | $10,808 | $11,464 | $11,650 |
|---|
10/22 | $11,244 | $11,806 | $11,998 |
|---|
11/22 | $12,792 | $13,200 | $13,414 |
|---|
12/22 | $12,248 | $13,101 | $13,314 |
|---|
1/23 | $13,617 | $14,164 | $14,393 |
|---|
2/23 | $12,846 | $13,666 | $13,888 |
|---|
3/23 | $13,617 | $14,001 | $14,228 |
|---|
4/23 | $13,661 | $14,244 | $14,475 |
|---|
5/23 | $12,993 | $13,726 | $13,949 |
|---|
6/23 | $13,591 | $14,342 | $14,574 |
|---|
7/23 | $14,103 | $14,925 | $15,167 |
|---|
8/23 | $13,158 | $14,251 | $14,482 |
|---|
9/23 | $12,777 | $13,801 | $14,025 |
|---|
10/23 | $12,257 | $13,231 | $13,446 |
|---|
11/23 | $12,967 | $14,422 | $14,656 |
|---|
12/23 | $13,736 | $15,147 | $15,393 |
|---|
1/24 | $13,307 | $14,996 | $15,240 |
|---|
2/24 | $13,647 | $15,376 | $15,626 |
|---|
3/24 | $14,505 | $15,857 | $16,114 |
|---|
4/24 | $14,398 | $15,572 | $15,825 |
|---|
5/24 | $15,059 | $16,024 | $16,284 |
|---|
6/24 | $14,916 | $16,009 | $16,269 |
|---|
7/24 | $14,925 | $16,379 | $16,645 |
|---|
8/24 | $15,399 | $16,846 | $17,119 |
|---|
9/24 | $15,640 | $17,300 | $17,580 |
|---|
10/24 | $15,113 | $16,451 | $16,718 |
|---|
11/24 | $15,086 | $16,302 | $16,566 |
|---|
12/24 | $14,683 | $15,985 | $16,244 |
|---|
|
|
| Average Annual Return [Table Text Block] |
AATR | 1 Year | 5 Years | 10 Years |
|---|
Class A | 6.89% | 4.48% | 4.48% |
|---|
Class A, with 5.25% maximum front end sales charge | 1.29% | 3.35% | 3.92% |
|---|
MSCI All Country World ex USA Net Index | 5.53% | 4.10% | 4.80% |
|---|
Active International Allocation Blend Index | 5.53% | 4.10% | 4.97% |
|---|
|
|
| AssetsNet |
$ 137,481,862
|
|
| Holdings Count | Holding |
68
|
|
| Advisory Fees Paid, Amount |
$ 717,211
|
|
| InvestmentCompanyPortfolioTurnover |
30.00%
|
|
| Additional Fund Statistics [Text Block] |
Total Net Assets | $137,481,862 |
|---|
# of Portfolio Holdings | 68 |
|---|
Portfolio Turnover Rate | 30% |
|---|
Total Advisory Fees Paid | $717,211 |
|---|
|
|
| Holdings [Text Block] |
Country Weightings (% of total investments)Value | Value |
|---|
Other | 23.9% | China | 4.4% | Korea, Republic of | 5.2% | Taiwan | 5.6% | India | 6.7% | United States | 7.7% | Japan | 7.9% | Germany | 8.3% | Canada | 8.8% | France | 9.7% | United Kingdom | 11.8% |
Top Ten Holdings (% of total investments)Footnote ReferenceaTaiwan Semiconductor Manufacturing Co. Ltd. | 5.6% | Tencent Holdings Ltd. | 4.4% | Unilever PLC | 3.7% | Sony Group Corp. | 3.6% | Despegar.com Corp. | 3.1% | Samsung Electronics Co. Ltd. | 2.9% | SAP SE | 2.7% | HDFC Bank Ltd. | 2.4% | Sea Ltd. | 2.4% | Rheinmetall AG | 2.4% | Total | 33.2% |
| Footnote | Description | Footnotea | Excluding cash equivalents. |
|
|
| Material Fund Change [Text Block] |
|
|
| Updated Prospectus Web Address |
<span style="box-sizing: border-box; color: rgb(0, 0, 0); display: inline; flex-wrap: nowrap; font-size: 10.6667px; font-weight: 400; grid-area: auto; line-height: 16px; margin: 0px; overflow: visible; text-align: left;">www.morganstanley.com/im/shareholderreports</span>
|
|
| C000155887 |
|
|
| Shareholder Report [Line Items] |
|
|
| Fund Name |
Morgan Stanley Institutional Fund, Inc. - Passport Overseas Equity Portfolio
|
|
| Class Name |
Class C
|
|
| Trading Symbol |
MSAAX
|
|
| Annual or Semi-Annual Statement [Text Block] |
This annual shareholder report contains important information about Morgan Stanley Institutional Fund, Inc. - Passport Overseas Equity Portfolio for the period of January 1, 2024 to December 31, 2024.
|
|
| Shareholder Report Annual or Semi-Annual |
Annual Shareholder Report
|
|
| Additional Information [Text Block] |
You can find additional information about the Fund at www.morganstanley.com/im/shareholderreports. You can also request this information by contacting us at 1-800-869-6397.
|
|
| Additional Information Phone Number |
1-800-869-6397
|
|
| Additional Information Website |
<span style="box-sizing: border-box; color: rgb(0, 0, 0); display: inline; flex-wrap: nowrap; font-size: 10.6667px; font-weight: 400; grid-area: auto; line-height: 16px; margin: 0px; overflow: visible; text-align: left;">www.morganstanley.com/im/shareholderreports</span>
|
|
| Expenses [Text Block] |
What were the Fund costs for the last year?(based on a hypothetical $10,000 investment) Class Name | Costs of a $10,000 investment | Costs paid as a percentage of a $10,000 investment |
|---|
Class C | $206 | 2.00% |
|---|
|
|
| Expenses Paid, Amount |
$ 206
|
|
| Expense Ratio, Percent |
2.00%
|
|
| Factors Affecting Performance [Text Block] |
How did the Fund perform last year and what affected its performance?Key contributors to (↑) and detractors from (↓) performance, relative to the MSCI All Country World ex USA Index: ↑ Stock selection in consumer discretionary and communication services ↑ Overweight to and stock selection in semiconductors, led by the allocation to a Taiwan semiconductor foundry ↑ Overweight to aerospace and defense, zero allocation to Mexico and autos, and underweight utilities ↑ Top stock contributors included a Chinese internet company, a U.K.-based personal care products company and an Israel-based security software developer ↓ Underweight to and stock selection in financials and stock selection in technology ↓ Overweight to materials, and overweight to and stock selection within energy ↓ Overweight to and stock selection in France, and underweight to and stock selection in Japan ↓ Top stock detractors included an Ireland-based discount airline, a Canada-based rail transportation company and a France-based IT services provider |
|
| Line Graph [Table Text Block] |
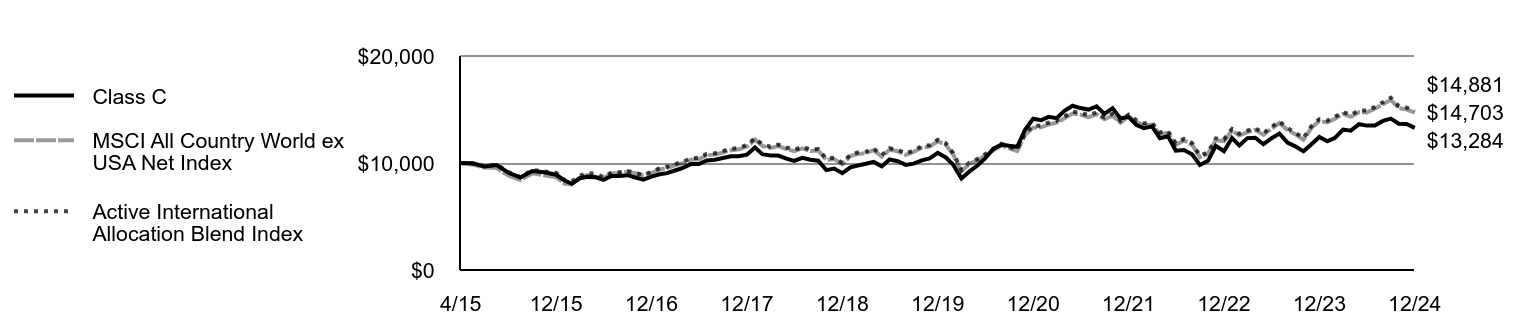 | Class C | MSCI All Country World ex USA Net Index | Active International Allocation Blend Index |
|---|
4/15 | $10,000 | $10,000 | $10,000 |
|---|
5/15 | $9,986 | $9,844 | $9,949 |
|---|
6/15 | $9,670 | $9,569 | $9,667 |
|---|
7/15 | $9,807 | $9,543 | $9,868 |
|---|
8/15 | $9,089 | $8,813 | $9,142 |
|---|
9/15 | $8,650 | $8,405 | $8,678 |
|---|
10/15 | $9,247 | $9,030 | $9,356 |
|---|
11/15 | $9,139 | $8,844 | $9,210 |
|---|
12/15 | $8,904 | $8,677 | $9,086 |
|---|
1/16 | $8,386 | $8,087 | $8,429 |
|---|
2/16 | $8,063 | $7,995 | $8,275 |
|---|
3/16 | $8,573 | $8,645 | $8,813 |
|---|
4/16 | $8,703 | $8,872 | $9,068 |
|---|
5/16 | $8,667 | $8,722 | $8,986 |
|---|
6/16 | $8,422 | $8,589 | $8,684 |
|---|
7/16 | $8,789 | $9,014 | $9,124 |
|---|
8/16 | $8,775 | $9,071 | $9,131 |
|---|
9/16 | $8,861 | $9,183 | $9,243 |
|---|
10/16 | $8,645 | $9,051 | $9,054 |
|---|
11/16 | $8,451 | $8,841 | $8,874 |
|---|
12/16 | $8,732 | $9,067 | $9,177 |
|---|
1/17 | $8,947 | $9,389 | $9,502 |
|---|
2/17 | $9,055 | $9,538 | $9,654 |
|---|
3/17 | $9,300 | $9,780 | $9,898 |
|---|
4/17 | $9,552 | $9,989 | $10,110 |
|---|
5/17 | $9,897 | $10,314 | $10,438 |
|---|
6/17 | $9,904 | $10,346 | $10,471 |
|---|
7/17 | $10,244 | $10,727 | $10,857 |
|---|
8/17 | $10,302 | $10,783 | $10,914 |
|---|
9/17 | $10,460 | $10,983 | $11,116 |
|---|
10/17 | $10,633 | $11,190 | $11,325 |
|---|
11/17 | $10,626 | $11,281 | $11,417 |
|---|
12/17 | $10,777 | $11,533 | $11,673 |
|---|
1/18 | $11,448 | $12,175 | $12,323 |
|---|
2/18 | $10,828 | $11,601 | $11,742 |
|---|
3/18 | $10,711 | $11,397 | $11,535 |
|---|
4/18 | $10,696 | $11,578 | $11,719 |
|---|
5/18 | $10,404 | $11,311 | $11,448 |
|---|
6/18 | $10,200 | $11,099 | $11,233 |
|---|
7/18 | $10,476 | $11,364 | $11,502 |
|---|
8/18 | $10,300 | $11,126 | $11,261 |
|---|
9/18 | $10,213 | $11,177 | $11,312 |
|---|
10/18 | $9,335 | $10,268 | $10,392 |
|---|
11/18 | $9,474 | $10,365 | $10,490 |
|---|
12/18 | $9,048 | $9,896 | $10,016 |
|---|
1/19 | $9,591 | $10,643 | $10,772 |
|---|
2/19 | $9,767 | $10,851 | $10,983 |
|---|
3/19 | $9,928 | $10,916 | $11,048 |
|---|
4/19 | $10,104 | $11,204 | $11,340 |
|---|
5/19 | $9,686 | $10,603 | $10,731 |
|---|
6/19 | $10,331 | $11,242 | $11,378 |
|---|
7/19 | $10,163 | $11,105 | $11,240 |
|---|
8/19 | $9,825 | $10,763 | $10,893 |
|---|
9/19 | $9,943 | $11,039 | $11,173 |
|---|
10/19 | $10,243 | $11,425 | $11,563 |
|---|
11/19 | $10,427 | $11,525 | $11,665 |
|---|
12/19 | $10,951 | $12,024 | $12,170 |
|---|
1/20 | $10,517 | $11,701 | $11,843 |
|---|
2/20 | $9,825 | $10,777 | $10,907 |
|---|
3/20 | $8,553 | $9,216 | $9,328 |
|---|
4/20 | $9,193 | $9,915 | $10,035 |
|---|
5/20 | $9,759 | $10,239 | $10,363 |
|---|
6/20 | $10,429 | $10,702 | $10,831 |
|---|
7/20 | $11,318 | $11,179 | $11,314 |
|---|
8/20 | $11,716 | $11,657 | $11,799 |
|---|
9/20 | $11,605 | $11,371 | $11,509 |
|---|
10/20 | $11,517 | $11,126 | $11,261 |
|---|
11/20 | $13,113 | $12,623 | $12,776 |
|---|
12/20 | $14,141 | $13,305 | $13,466 |
|---|
1/21 | $13,994 | $13,334 | $13,496 |
|---|
2/21 | $14,310 | $13,598 | $13,763 |
|---|
3/21 | $14,192 | $13,770 | $13,937 |
|---|
4/21 | $14,884 | $14,176 | $14,347 |
|---|
5/21 | $15,347 | $14,619 | $14,796 |
|---|
6/21 | $15,134 | $14,524 | $14,700 |
|---|
7/21 | $14,994 | $14,285 | $14,458 |
|---|
8/21 | $15,303 | $14,556 | $14,733 |
|---|
9/21 | $14,582 | $14,090 | $14,261 |
|---|
10/21 | $15,127 | $14,427 | $14,601 |
|---|
11/21 | $14,155 | $13,777 | $13,944 |
|---|
12/21 | $14,314 | $14,346 | $14,520 |
|---|
1/22 | $13,538 | $13,818 | $13,985 |
|---|
2/22 | $13,245 | $13,544 | $13,708 |
|---|
3/22 | $13,420 | $13,566 | $13,730 |
|---|
4/22 | $12,319 | $12,714 | $12,868 |
|---|
5/22 | $12,493 | $12,805 | $12,960 |
|---|
6/22 | $11,155 | $11,704 | $11,845 |
|---|
7/22 | $11,211 | $12,104 | $12,251 |
|---|
8/22 | $10,815 | $11,715 | $11,857 |
|---|
9/22 | $9,817 | $10,544 | $10,672 |
|---|
10/22 | $10,205 | $10,859 | $10,991 |
|---|
11/22 | $11,607 | $12,141 | $12,288 |
|---|
12/22 | $11,104 | $12,050 | $12,196 |
|---|
1/23 | $12,335 | $13,028 | $13,186 |
|---|
2/23 | $11,631 | $12,571 | $12,723 |
|---|
3/23 | $12,327 | $12,878 | $13,034 |
|---|
4/23 | $12,359 | $13,102 | $13,260 |
|---|
5/23 | $11,755 | $12,625 | $12,778 |
|---|
6/23 | $12,296 | $13,192 | $13,351 |
|---|
7/23 | $12,759 | $13,728 | $13,894 |
|---|
8/23 | $11,904 | $13,108 | $13,267 |
|---|
9/23 | $11,559 | $12,694 | $12,848 |
|---|
10/23 | $11,088 | $12,170 | $12,318 |
|---|
11/23 | $11,731 | $13,266 | $13,426 |
|---|
12/23 | $12,427 | $13,932 | $14,101 |
|---|
1/24 | $12,039 | $13,794 | $13,961 |
|---|
2/24 | $12,346 | $14,143 | $14,314 |
|---|
3/24 | $13,123 | $14,585 | $14,762 |
|---|
4/24 | $13,026 | $14,323 | $14,497 |
|---|
5/24 | $13,624 | $14,739 | $14,918 |
|---|
6/24 | $13,495 | $14,725 | $14,903 |
|---|
7/24 | $13,503 | $15,066 | $15,248 |
|---|
8/24 | $13,931 | $15,495 | $15,683 |
|---|
9/24 | $14,149 | $15,912 | $16,105 |
|---|
10/24 | $13,672 | $15,132 | $15,315 |
|---|
11/24 | $13,648 | $14,995 | $15,176 |
|---|
12/24 | $13,284 | $14,703 | $14,881 |
|---|
|
|
| Average Annual Return [Table Text Block] |
AATR | 1 Year | 5 Years | Since 4/30/15
(Inception) |
|---|
Class C, with conversion to Class A after 8 years | 5.98% | 3.64% | 2.98% |
|---|
Class C, with 1% maximum contingent deferred sales charge and conversion to Class A after 8 years | 4.98% | 3.64% | 2.98% |
|---|
MSCI All Country World ex USA Net Index | 5.53% | 4.10% | 4.07% |
|---|
Active International Allocation Blend Index | 5.53% | 4.10% | 4.20% |
|---|
|
|
| Performance Inception Date |
Apr. 30, 2015
|
|
| AssetsNet |
$ 137,481,862
|
|
| Holdings Count | Holding |
68
|
|
| Advisory Fees Paid, Amount |
$ 717,211
|
|
| InvestmentCompanyPortfolioTurnover |
30.00%
|
|
| Additional Fund Statistics [Text Block] |
Total Net Assets | $137,481,862 |
|---|
# of Portfolio Holdings | 68 |
|---|
Portfolio Turnover Rate | 30% |
|---|
Total Advisory Fees Paid | $717,211 |
|---|
|
|
| Holdings [Text Block] |
Country Weightings (% of total investments)Value | Value |
|---|
Other | 23.9% | China | 4.4% | Korea, Republic of | 5.2% | Taiwan | 5.6% | India | 6.7% | United States | 7.7% | Japan | 7.9% | Germany | 8.3% | Canada | 8.8% | France | 9.7% | United Kingdom | 11.8% |
Top Ten Holdings (% of total investments)Footnote ReferenceaTaiwan Semiconductor Manufacturing Co. Ltd. | 5.6% | Tencent Holdings Ltd. | 4.4% | Unilever PLC | 3.7% | Sony Group Corp. | 3.6% | Despegar.com Corp. | 3.1% | Samsung Electronics Co. Ltd. | 2.9% | SAP SE | 2.7% | HDFC Bank Ltd. | 2.4% | Sea Ltd. | 2.4% | Rheinmetall AG | 2.4% | Total | 33.2% |
| Footnote | Description | Footnotea | Excluding cash equivalents. |
|
|
| Material Fund Change [Text Block] |
|
|
| Updated Prospectus Web Address |
<span style="box-sizing: border-box; color: rgb(0, 0, 0); display: inline; flex-wrap: nowrap; font-size: 10.6667px; font-weight: 400; grid-area: auto; line-height: 16px; margin: 0px; overflow: visible; text-align: left;">www.morganstanley.com/im/shareholderreports</span>
|
|
| C000007736 |
|
|
| Shareholder Report [Line Items] |
|
|
| Fund Name |
Morgan Stanley Institutional Fund, Inc. - Passport Overseas Equity Portfolio
|
|
| Class Name |
Class I
|
|
| Trading Symbol |
MSACX
|
|
| Annual or Semi-Annual Statement [Text Block] |
This annual shareholder report contains important information about Morgan Stanley Institutional Fund, Inc. - Passport Overseas Equity Portfolio for the period of January 1, 2024 to December 31, 2024.
|
|
| Shareholder Report Annual or Semi-Annual |
Annual Shareholder Report
|
|
| Additional Information [Text Block] |
You can find additional information about the Fund at www.morganstanley.com/im/shareholderreports. You can also request this information by contacting us at 1-800-869-6397.
|
|
| Additional Information Phone Number |
1-800-869-6397
|
|
| Additional Information Website |
<span style="box-sizing: border-box; color: rgb(0, 0, 0); display: inline; flex-wrap: nowrap; font-size: 10.6667px; font-weight: 400; grid-area: auto; line-height: 16px; margin: 0px; overflow: visible; text-align: left;">www.morganstanley.com/im/shareholderreports</span>
|
|
| Expenses [Text Block] |
What were the Fund costs for the last year?(based on a hypothetical $10,000 investment) Class Name | Costs of a $10,000 investment | Costs paid as a percentage of a $10,000 investment |
|---|
Class I | $93 | 0.90% |
|---|
|
|
| Expenses Paid, Amount |
$ 93
|
|
| Expense Ratio, Percent |
0.90%
|
|
| Factors Affecting Performance [Text Block] |
How did the Fund perform last year and what affected its performance?Key contributors to (↑) and detractors from (↓) performance, relative to the MSCI All Country World ex USA Index: ↑ Stock selection in consumer discretionary and communication services ↑ Overweight to and stock selection in semiconductors, led by the allocation to a Taiwan semiconductor foundry ↑ Overweight to aerospace and defense, zero allocation to Mexico and autos, and underweight utilities ↑ Top stock contributors included a Chinese internet company, a U.K.-based personal care products company and an Israel-based security software developer ↓ Underweight to and stock selection in financials and stock selection in technology ↓ Overweight to materials, and overweight to and stock selection within energy ↓ Overweight to and stock selection in France, and underweight to and stock selection in Japan ↓ Top stock detractors included an Ireland-based discount airline, a Canada-based rail transportation company and a France-based IT services provider |
|
| Line Graph [Table Text Block] |
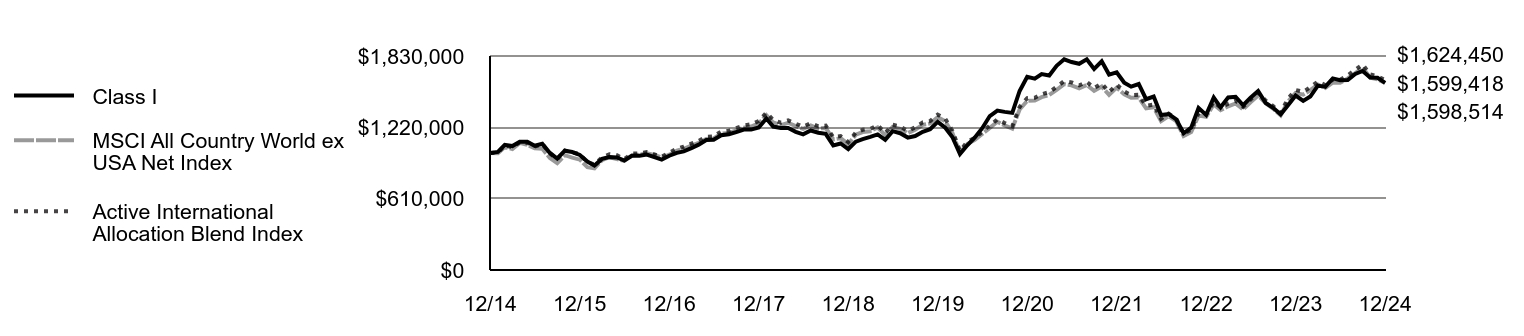 | Class I | MSCI All Country World ex USA Net Index | Active International Allocation Blend Index |
|---|
12/14 | $1,000,000 | $1,000,000 | $1,000,000 |
|---|
1/15 | $1,009,585 | $998,518 | $1,004,888 |
|---|
2/15 | $1,070,288 | $1,051,901 | $1,064,962 |
|---|
3/15 | $1,059,904 | $1,034,899 | $1,048,784 |
|---|
4/15 | $1,096,645 | $1,087,181 | $1,091,604 |
|---|
5/15 | $1,095,847 | $1,070,204 | $1,086,017 |
|---|
6/15 | $1,062,300 | $1,040,349 | $1,055,246 |
|---|
7/15 | $1,079,170 | $1,037,456 | $1,077,156 |
|---|
8/15 | $1,000,772 | $958,158 | $997,918 |
|---|
9/15 | $953,573 | $913,734 | $947,248 |
|---|
10/15 | $1,019,972 | $981,755 | $1,021,293 |
|---|
11/15 | $1,008,772 | $961,488 | $1,005,405 |
|---|
12/15 | $983,742 | $943,379 | $991,858 |
|---|
1/16 | $927,298 | $879,207 | $920,133 |
|---|
2/16 | $892,625 | $869,158 | $903,276 |
|---|
3/16 | $949,875 | $939,829 | $962,050 |
|---|
4/16 | $965,196 | $964,565 | $989,902 |
|---|
5/16 | $961,970 | $948,283 | $980,909 |
|---|
6/16 | $935,361 | $933,775 | $947,983 |
|---|
7/16 | $976,485 | $979,953 | $996,027 |
|---|
8/16 | $976,485 | $986,151 | $996,734 |
|---|
9/16 | $986,967 | $998,311 | $1,008,979 |
|---|
10/16 | $964,389 | $983,958 | $988,340 |
|---|
11/16 | $944,231 | $961,199 | $968,656 |
|---|
12/16 | $977,117 | $985,785 | $1,001,779 |
|---|
1/17 | $1,001,896 | $1,020,706 | $1,037,267 |
|---|
2/17 | $1,014,285 | $1,036,982 | $1,053,807 |
|---|
3/17 | $1,042,368 | $1,063,271 | $1,080,523 |
|---|
4/17 | $1,072,103 | $1,086,034 | $1,103,654 |
|---|
5/17 | $1,111,749 | $1,121,275 | $1,139,468 |
|---|
6/17 | $1,113,401 | $1,124,757 | $1,143,006 |
|---|
7/17 | $1,152,439 | $1,166,213 | $1,185,134 |
|---|
8/17 | $1,160,712 | $1,172,315 | $1,191,336 |
|---|
9/17 | $1,179,740 | $1,194,078 | $1,213,452 |
|---|
10/17 | $1,200,423 | $1,216,542 | $1,236,281 |
|---|
11/17 | $1,200,423 | $1,226,424 | $1,246,323 |
|---|
12/17 | $1,219,095 | $1,253,836 | $1,274,180 |
|---|
1/18 | $1,295,815 | $1,323,670 | $1,345,146 |
|---|
2/18 | $1,226,683 | $1,261,255 | $1,281,719 |
|---|
3/18 | $1,214,880 | $1,239,011 | $1,259,114 |
|---|
4/18 | $1,214,036 | $1,258,792 | $1,279,216 |
|---|
5/18 | $1,181,999 | $1,229,727 | $1,249,679 |
|---|
6/18 | $1,160,079 | $1,206,613 | $1,226,190 |
|---|
7/18 | $1,192,802 | $1,235,471 | $1,255,517 |
|---|
8/18 | $1,173,359 | $1,209,613 | $1,229,238 |
|---|
9/18 | $1,164,060 | $1,215,123 | $1,234,839 |
|---|
10/18 | $1,065,153 | $1,116,288 | $1,134,400 |
|---|
11/18 | $1,082,060 | $1,126,854 | $1,145,137 |
|---|
12/18 | $1,034,481 | $1,075,850 | $1,093,305 |
|---|
1/19 | $1,097,904 | $1,157,139 | $1,175,913 |
|---|
2/19 | $1,119,331 | $1,179,748 | $1,198,890 |
|---|
3/19 | $1,138,187 | $1,186,775 | $1,206,030 |
|---|
4/19 | $1,159,613 | $1,218,127 | $1,237,891 |
|---|
5/19 | $1,112,474 | $1,152,749 | $1,171,452 |
|---|
6/19 | $1,187,039 | $1,222,162 | $1,241,991 |
|---|
7/19 | $1,169,898 | $1,207,368 | $1,226,958 |
|---|
8/19 | $1,132,187 | $1,170,080 | $1,189,064 |
|---|
9/19 | $1,145,900 | $1,200,191 | $1,219,664 |
|---|
10/19 | $1,181,897 | $1,242,068 | $1,262,221 |
|---|
11/19 | $1,204,181 | $1,253,017 | $1,273,347 |
|---|
12/19 | $1,266,261 | $1,307,279 | $1,328,490 |
|---|
1/20 | $1,216,791 | $1,272,162 | $1,292,802 |
|---|
2/20 | $1,137,812 | $1,171,604 | $1,190,613 |
|---|
3/20 | $992,005 | $1,001,963 | $1,018,220 |
|---|
4/20 | $1,066,645 | $1,077,893 | $1,095,382 |
|---|
5/20 | $1,133,473 | $1,113,169 | $1,131,230 |
|---|
6/20 | $1,212,451 | $1,163,474 | $1,182,351 |
|---|
7/20 | $1,316,599 | $1,215,346 | $1,235,065 |
|---|
8/20 | $1,363,465 | $1,267,371 | $1,287,934 |
|---|
9/20 | $1,352,182 | $1,236,216 | $1,256,274 |
|---|
10/20 | $1,343,503 | $1,209,639 | $1,229,265 |
|---|
11/20 | $1,530,969 | $1,372,354 | $1,394,620 |
|---|
12/20 | $1,652,265 | $1,446,530 | $1,470,000 |
|---|
1/21 | $1,636,637 | $1,449,674 | $1,473,195 |
|---|
2/21 | $1,675,708 | $1,478,372 | $1,502,359 |
|---|
3/21 | $1,663,553 | $1,497,064 | $1,521,354 |
|---|
4/21 | $1,746,036 | $1,541,133 | $1,566,138 |
|---|
5/21 | $1,801,603 | $1,589,339 | $1,615,126 |
|---|
6/21 | $1,778,161 | $1,579,042 | $1,604,662 |
|---|
7/21 | $1,763,400 | $1,553,019 | $1,578,217 |
|---|
8/21 | $1,801,603 | $1,582,539 | $1,608,216 |
|---|
9/21 | $1,719,120 | $1,531,866 | $1,556,720 |
|---|
10/21 | $1,784,238 | $1,568,432 | $1,593,880 |
|---|
11/21 | $1,671,367 | $1,497,808 | $1,522,110 |
|---|
12/21 | $1,690,779 | $1,559,708 | $1,585,014 |
|---|
1/22 | $1,601,989 | $1,502,232 | $1,526,606 |
|---|
2/22 | $1,567,985 | $1,472,497 | $1,496,388 |
|---|
3/22 | $1,590,655 | $1,474,844 | $1,498,773 |
|---|
4/22 | $1,460,304 | $1,382,234 | $1,404,660 |
|---|
5/22 | $1,482,974 | $1,392,156 | $1,414,743 |
|---|
6/22 | $1,325,231 | $1,272,392 | $1,293,037 |
|---|
7/22 | $1,332,787 | $1,315,951 | $1,337,302 |
|---|
8/22 | $1,287,448 | $1,273,626 | $1,294,291 |
|---|
9/22 | $1,169,377 | $1,146,353 | $1,164,952 |
|---|
10/22 | $1,217,550 | $1,180,607 | $1,199,763 |
|---|
11/22 | $1,385,683 | $1,319,975 | $1,341,392 |
|---|
12/22 | $1,326,142 | $1,310,105 | $1,331,361 |
|---|
1/23 | $1,475,092 | $1,416,365 | $1,439,346 |
|---|
2/23 | $1,391,488 | $1,366,648 | $1,388,822 |
|---|
3/23 | $1,476,053 | $1,400,057 | $1,422,773 |
|---|
4/23 | $1,481,819 | $1,424,380 | $1,447,491 |
|---|
5/23 | $1,408,785 | $1,372,592 | $1,394,863 |
|---|
6/23 | $1,474,131 | $1,434,180 | $1,457,449 |
|---|
7/23 | $1,529,868 | $1,492,488 | $1,516,704 |
|---|
8/23 | $1,428,005 | $1,425,079 | $1,448,201 |
|---|
9/23 | $1,386,683 | $1,380,069 | $1,402,461 |
|---|
10/23 | $1,330,946 | $1,323,129 | $1,344,597 |
|---|
11/23 | $1,408,785 | $1,442,230 | $1,465,630 |
|---|
12/23 | $1,492,202 | $1,514,691 | $1,539,266 |
|---|
1/24 | $1,446,441 | $1,499,645 | $1,523,977 |
|---|
2/24 | $1,483,248 | $1,537,612 | $1,562,559 |
|---|
3/24 | $1,576,760 | $1,585,677 | $1,611,405 |
|---|
4/24 | $1,565,817 | $1,557,203 | $1,582,469 |
|---|
5/24 | $1,638,437 | $1,602,407 | $1,628,406 |
|---|
6/24 | $1,623,515 | $1,600,883 | $1,626,857 |
|---|
7/24 | $1,624,510 | $1,637,950 | $1,664,526 |
|---|
8/24 | $1,676,240 | $1,684,598 | $1,711,931 |
|---|
9/24 | $1,702,105 | $1,729,960 | $1,758,029 |
|---|
10/24 | $1,645,401 | $1,645,080 | $1,671,771 |
|---|
11/24 | $1,643,411 | $1,630,189 | $1,656,639 |
|---|
12/24 | $1,599,418 | $1,598,514 | $1,624,450 |
|---|
|
|
| Average Annual Return [Table Text Block] |
AATR | 1 Year | 5 Years | 10 Years |
|---|
Class I | 7.19% | 4.78% | 4.81% |
|---|
MSCI All Country World ex USA Net Index | 5.53% | 4.10% | 4.80% |
|---|
Active International Allocation Blend Index | 5.53% | 4.10% | 4.97% |
|---|
|
|
| AssetsNet |
$ 137,481,862
|
|
| Holdings Count | Holding |
68
|
|
| Advisory Fees Paid, Amount |
$ 717,211
|
|
| InvestmentCompanyPortfolioTurnover |
30.00%
|
|
| Additional Fund Statistics [Text Block] |
Total Net Assets | $137,481,862 |
|---|
# of Portfolio Holdings | 68 |
|---|
Portfolio Turnover Rate | 30% |
|---|
Total Advisory Fees Paid | $717,211 |
|---|
|
|
| Holdings [Text Block] |
Country Weightings (% of total investments)Value | Value |
|---|
Other | 23.9% | China | 4.4% | Korea, Republic of | 5.2% | Taiwan | 5.6% | India | 6.7% | United States | 7.7% | Japan | 7.9% | Germany | 8.3% | Canada | 8.8% | France | 9.7% | United Kingdom | 11.8% |
Top Ten Holdings (% of total investments)Footnote ReferenceaTaiwan Semiconductor Manufacturing Co. Ltd. | 5.6% | Tencent Holdings Ltd. | 4.4% | Unilever PLC | 3.7% | Sony Group Corp. | 3.6% | Despegar.com Corp. | 3.1% | Samsung Electronics Co. Ltd. | 2.9% | SAP SE | 2.7% | HDFC Bank Ltd. | 2.4% | Sea Ltd. | 2.4% | Rheinmetall AG | 2.4% | Total | 33.2% |
| Footnote | Description | Footnotea | Excluding cash equivalents. |
|
|
| Material Fund Change [Text Block] |
|
|
| Updated Prospectus Web Address |
<span style="box-sizing: border-box; color: rgb(0, 0, 0); display: inline; flex-wrap: nowrap; font-size: 10.6667px; font-weight: 400; grid-area: auto; line-height: 16px; margin: 0px; overflow: visible; text-align: left;">www.morganstanley.com/im/shareholderreports</span>
|
|
| C000215549 |
|
|
| Shareholder Report [Line Items] |
|
|
| Fund Name |
Morgan Stanley Institutional Fund, Inc. - Passport Overseas Equity Portfolio
|
|
| Class Name |
Class IR
|
|
| Trading Symbol |
MAIHX
|
|
| Annual or Semi-Annual Statement [Text Block] |
This annual shareholder report contains important information about Morgan Stanley Institutional Fund, Inc. - Passport Overseas Equity Portfolio for the period of January 1, 2024 to December 31, 2024.
|
|
| Shareholder Report Annual or Semi-Annual |
Annual Shareholder Report
|
|
| Additional Information [Text Block] |
You can find additional information about the Fund at www.morganstanley.com/im/shareholderreports. You can also request this information by contacting us at 1-800-869-6397.
|
|
| Additional Information Phone Number |
1-800-869-6397
|
|
| Additional Information Website |
<span style="box-sizing: border-box; color: rgb(0, 0, 0); display: inline; flex-wrap: nowrap; font-size: 10.6667px; font-weight: 400; grid-area: auto; line-height: 16px; margin: 0px; overflow: visible; text-align: left;">www.morganstanley.com/im/shareholderreports</span>
|
|
| Expenses [Text Block] |
What were the Fund costs for the last year?(based on a hypothetical $10,000 investment) Class Name | Costs of a $10,000 investment | Costs paid as a percentage of a $10,000 investment |
|---|
Class IR | $88 | 0.85% |
|---|
|
|
| Expenses Paid, Amount |
$ 88
|
|
| Expense Ratio, Percent |
0.85%
|
|
| Factors Affecting Performance [Text Block] |
How did the Fund perform last year and what affected its performance?Key contributors to (↑) and detractors from (↓) performance, relative to the MSCI All Country World ex USA Index: ↑ Stock selection in consumer discretionary and communication services ↑ Overweight to and stock selection in semiconductors, led by the allocation to a Taiwan semiconductor foundry ↑ Overweight to aerospace and defense, zero allocation to Mexico and autos, and underweight utilities ↑ Top stock contributors included a Chinese internet company, a U.K.-based personal care products company and an Israel-based security software developer ↓ Underweight to and stock selection in financials and stock selection in technology ↓ Overweight to materials, and overweight to and stock selection within energy ↓ Overweight to and stock selection in France, and underweight to and stock selection in Japan ↓ Top stock detractors included an Ireland-based discount airline, a Canada-based rail transportation company and a France-based IT services provider |
|
| Line Graph [Table Text Block] |
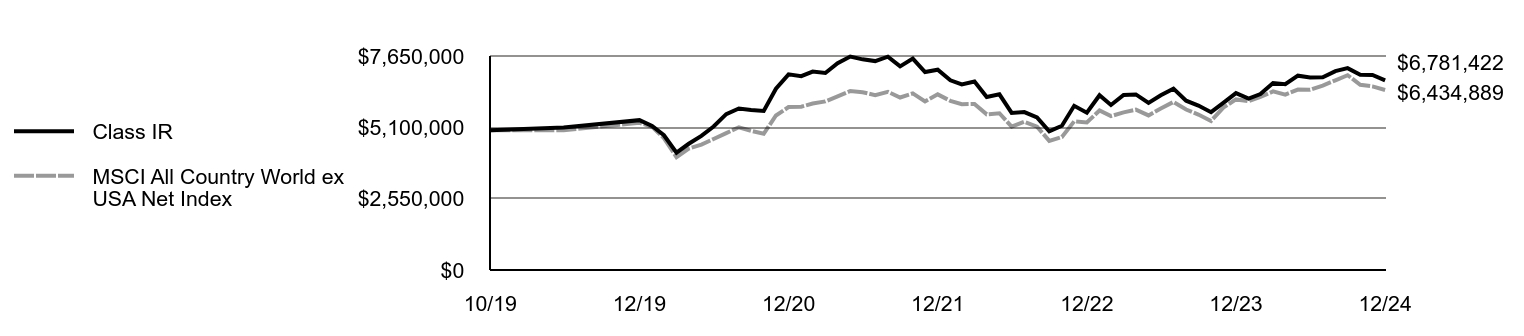 | Class IR | MSCI All Country World ex USA Net Index |
|---|
10/19 | $5,000,000 | $5,000,000 |
|---|
11/19 | $5,094,271 | $5,000,000 |
|---|
12/19 | $5,357,332 | $5,262,511 |
|---|
1/20 | $5,148,032 | $5,121,142 |
|---|
2/20 | $4,817,560 | $4,716,341 |
|---|
3/20 | $4,197,005 | $4,033,447 |
|---|
4/20 | $4,512,790 | $4,339,105 |
|---|
5/20 | $4,795,528 | $4,481,112 |
|---|
6/20 | $5,129,673 | $4,683,614 |
|---|
7/20 | $5,570,303 | $4,892,429 |
|---|
8/20 | $5,772,259 | $5,101,858 |
|---|
9/20 | $5,720,852 | $4,976,442 |
|---|
10/20 | $5,684,133 | $4,869,455 |
|---|
11/20 | $6,480,940 | $5,524,470 |
|---|
12/20 | $6,994,123 | $5,823,071 |
|---|
1/21 | $6,928,002 | $5,835,727 |
|---|
2/21 | $7,093,305 | $5,951,252 |
|---|
3/21 | $7,041,877 | $6,026,498 |
|---|
4/21 | $7,390,849 | $6,203,898 |
|---|
5/21 | $7,629,619 | $6,397,955 |
|---|
6/21 | $7,530,437 | $6,356,502 |
|---|
7/21 | $7,467,990 | $6,251,746 |
|---|
8/21 | $7,625,945 | $6,370,581 |
|---|
9/21 | $7,276,974 | $6,166,592 |
|---|
10/21 | $7,556,151 | $6,313,791 |
|---|
11/21 | $7,078,611 | $6,029,493 |
|---|
12/21 | $7,161,032 | $6,278,671 |
|---|
1/22 | $6,781,190 | $6,047,301 |
|---|
2/22 | $6,637,250 | $5,927,599 |
|---|
3/22 | $6,737,208 | $5,937,047 |
|---|
4/22 | $6,185,437 | $5,564,243 |
|---|
5/22 | $6,281,397 | $5,604,183 |
|---|
6/22 | $5,613,674 | $5,122,070 |
|---|
7/22 | $5,645,660 | $5,297,417 |
|---|
8/22 | $5,453,740 | $5,127,039 |
|---|
9/22 | $4,953,947 | $4,614,693 |
|---|
10/22 | $5,157,863 | $4,752,587 |
|---|
11/22 | $5,869,568 | $5,313,617 |
|---|
12/22 | $5,621,002 | $5,273,885 |
|---|
1/23 | $6,247,819 | $5,701,640 |
|---|
2/23 | $5,897,778 | $5,501,503 |
|---|
3/23 | $6,255,959 | $5,635,991 |
|---|
4/23 | $6,276,311 | $5,733,905 |
|---|
5/23 | $5,971,043 | $5,525,431 |
|---|
6/23 | $6,247,819 | $5,773,353 |
|---|
7/23 | $6,483,893 | $6,008,077 |
|---|
8/23 | $6,052,447 | $5,736,718 |
|---|
9/23 | $5,877,427 | $5,555,529 |
|---|
10/23 | $5,641,353 | $5,326,314 |
|---|
11/23 | $5,971,043 | $5,805,761 |
|---|
12/23 | $6,323,274 | $6,097,453 |
|---|
1/24 | $6,129,360 | $6,036,887 |
|---|
2/24 | $6,289,550 | $6,189,724 |
|---|
3/24 | $6,685,808 | $6,383,214 |
|---|
4/24 | $6,639,437 | $6,268,589 |
|---|
5/24 | $6,947,170 | $6,450,558 |
|---|
6/24 | $6,883,937 | $6,444,424 |
|---|
7/24 | $6,888,153 | $6,593,641 |
|---|
8/24 | $7,107,360 | $6,781,423 |
|---|
9/24 | $7,216,963 | $6,964,031 |
|---|
10/24 | $6,976,679 | $6,622,342 |
|---|
11/24 | $6,972,463 | $6,562,398 |
|---|
12/24 | $6,781,422 | $6,434,889 |
|---|
|
|
| Average Annual Return [Table Text Block] |
AATR | 1 Year | 5 Years | Since 10/31/19
(Inception) |
|---|
Class IR | 7.25% | 4.83% | 6.08% |
|---|
MSCI All Country World ex USA Net Index | 5.53% | 4.10% | 5.00% |
|---|
|
|
| Performance Inception Date |
Oct. 31, 2019
|
|
| AssetsNet |
$ 137,481,862
|
|
| Holdings Count | Holding |
68
|
|
| Advisory Fees Paid, Amount |
$ 717,211
|
|
| InvestmentCompanyPortfolioTurnover |
30.00%
|
|
| Additional Fund Statistics [Text Block] |
Total Net Assets | $137,481,862 |
|---|
# of Portfolio Holdings | 68 |
|---|
Portfolio Turnover Rate | 30% |
|---|
Total Advisory Fees Paid | $717,211 |
|---|
|
|
| Holdings [Text Block] |
Country Weightings (% of total investments)Value | Value |
|---|
Other | 23.9% | China | 4.4% | Korea, Republic of | 5.2% | Taiwan | 5.6% | India | 6.7% | United States | 7.7% | Japan | 7.9% | Germany | 8.3% | Canada | 8.8% | France | 9.7% | United Kingdom | 11.8% |
Top Ten Holdings (% of total investments)Footnote ReferenceaTaiwan Semiconductor Manufacturing Co. Ltd. | 5.6% | Tencent Holdings Ltd. | 4.4% | Unilever PLC | 3.7% | Sony Group Corp. | 3.6% | Despegar.com Corp. | 3.1% | Samsung Electronics Co. Ltd. | 2.9% | SAP SE | 2.7% | HDFC Bank Ltd. | 2.4% | Sea Ltd. | 2.4% | Rheinmetall AG | 2.4% | Total | 33.2% |
| Footnote | Description | Footnotea | Excluding cash equivalents. |
|
|
| Material Fund Change [Text Block] |
|
|
| Updated Prospectus Web Address |
<span style="box-sizing: border-box; color: rgb(0, 0, 0); display: inline; flex-wrap: nowrap; font-size: 10.6667px; font-weight: 400; grid-area: auto; line-height: 16px; margin: 0px; overflow: visible; text-align: left;">www.morganstanley.com/im/shareholderreports</span>
|
|
| C000113799 |
|
|
| Shareholder Report [Line Items] |
|
|
| Fund Name |
Morgan Stanley Institutional Fund, Inc. - Passport Overseas Equity Portfolio
|
|
| Class Name |
Class L
|
|
| Trading Symbol |
MSLLX
|
|
| Annual or Semi-Annual Statement [Text Block] |
This annual shareholder report contains important information about Morgan Stanley Institutional Fund, Inc. - Passport Overseas Equity Portfolio for the period of January 1, 2024 to December 31, 2024.
|
|
| Shareholder Report Annual or Semi-Annual |
Annual Shareholder Report
|
|
| Additional Information [Text Block] |
You can find additional information about the Fund at www.morganstanley.com/im/shareholderreports. You can also request this information by contacting us at 1-800-869-6397.
|
|
| Additional Information Phone Number |
1-800-869-6397
|
|
| Additional Information Website |
<span style="box-sizing: border-box; color: rgb(0, 0, 0); display: inline; flex-wrap: nowrap; font-size: 10.6667px; font-weight: 400; grid-area: auto; line-height: 16px; margin: 0px; overflow: visible; text-align: left;">www.morganstanley.com/im/shareholderreports</span>
|
|
| Expenses [Text Block] |
What were the Fund costs for the last year?(based on a hypothetical $10,000 investment) Class Name | Costs of a $10,000 investment | Costs paid as a percentage of a $10,000 investment |
|---|
Class L | $180 | 1.75% |
|---|
|
|
| Expenses Paid, Amount |
$ 180
|
|
| Expense Ratio, Percent |
1.75%
|
|
| Factors Affecting Performance [Text Block] |
How did the Fund perform last year and what affected its performance?Key contributors to (↑) and detractors from (↓) performance, relative to the MSCI All Country World ex USA Index: ↑ Stock selection in consumer discretionary and communication services ↑ Overweight to and stock selection in semiconductors, led by the allocation to a Taiwan semiconductor foundry ↑ Overweight to aerospace and defense, zero allocation to Mexico and autos, and underweight utilities ↑ Top stock contributors included a Chinese internet company, a U.K.-based personal care products company and an Israel-based security software developer ↓ Underweight to and stock selection in financials and stock selection in technology ↓ Overweight to materials, and overweight to and stock selection within energy ↓ Overweight to and stock selection in France, and underweight to and stock selection in Japan ↓ Top stock detractors included an Ireland-based discount airline, a Canada-based rail transportation company and a France-based IT services provider |
|
| Line Graph [Table Text Block] |
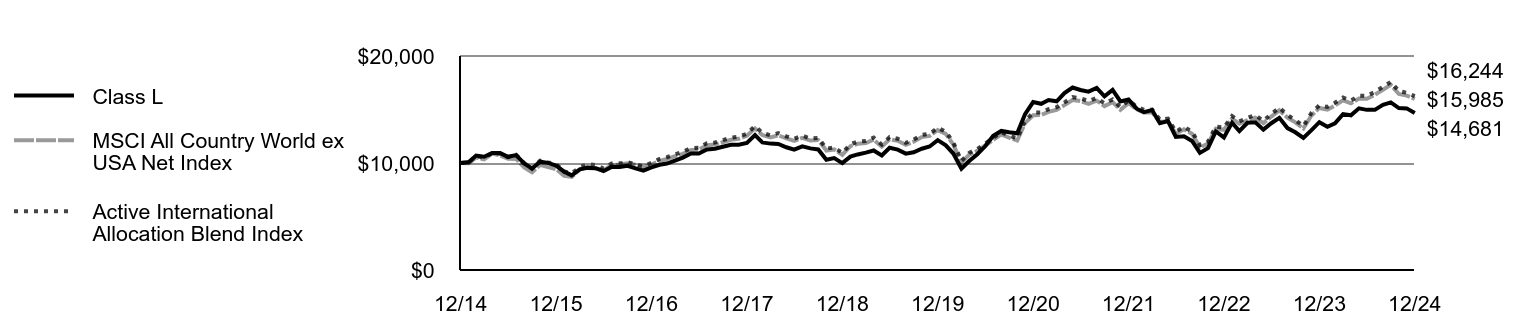 | Class L | MSCI All Country World ex USA Net Index | Active International Allocation Blend Index |
|---|
12/14 | $10,000 | $10,000 | $10,000 |
|---|
1/15 | $10,094 | $9,985 | $10,049 |
|---|
2/15 | $10,691 | $10,519 | $10,650 |
|---|
3/15 | $10,581 | $10,349 | $10,488 |
|---|
4/15 | $10,942 | $10,872 | $10,916 |
|---|
5/15 | $10,926 | $10,702 | $10,860 |
|---|
6/15 | $10,581 | $10,403 | $10,552 |
|---|
7/15 | $10,739 | $10,375 | $10,772 |
|---|
8/15 | $9,953 | $9,582 | $9,979 |
|---|
9/15 | $9,481 | $9,137 | $9,472 |
|---|
10/15 | $10,126 | $9,818 | $10,213 |
|---|
11/15 | $10,016 | $9,615 | $10,054 |
|---|
12/15 | $9,756 | $9,434 | $9,919 |
|---|
1/16 | $9,190 | $8,792 | $9,201 |
|---|
2/16 | $8,844 | $8,692 | $9,033 |
|---|
3/16 | $9,402 | $9,398 | $9,620 |
|---|
4/16 | $9,544 | $9,646 | $9,899 |
|---|
5/16 | $9,512 | $9,483 | $9,809 |
|---|
6/16 | $9,237 | $9,338 | $9,480 |
|---|
7/16 | $9,638 | $9,800 | $9,960 |
|---|
8/16 | $9,630 | $9,862 | $9,967 |
|---|
9/16 | $9,732 | $9,983 | $10,090 |
|---|
10/16 | $9,497 | $9,840 | $9,883 |
|---|
11/16 | $9,284 | $9,612 | $9,687 |
|---|
12/16 | $9,593 | $9,858 | $10,018 |
|---|
1/17 | $9,832 | $10,207 | $10,373 |
|---|
2/17 | $9,951 | $10,370 | $10,538 |
|---|
3/17 | $10,222 | $10,633 | $10,805 |
|---|
4/17 | $10,501 | $10,860 | $11,037 |
|---|
5/17 | $10,883 | $11,213 | $11,395 |
|---|
6/17 | $10,891 | $11,248 | $11,430 |
|---|
7/17 | $11,268 | $11,662 | $11,851 |
|---|
8/17 | $11,332 | $11,723 | $11,913 |
|---|
9/17 | $11,515 | $11,941 | $12,135 |
|---|
10/17 | $11,707 | $12,165 | $12,363 |
|---|
11/17 | $11,699 | $12,264 | $12,463 |
|---|
12/17 | $11,875 | $12,538 | $12,742 |
|---|
1/18 | $12,609 | $13,237 | $13,451 |
|---|
2/18 | $11,924 | $12,613 | $12,817 |
|---|
3/18 | $11,811 | $12,390 | $12,591 |
|---|
4/18 | $11,786 | $12,588 | $12,792 |
|---|
5/18 | $11,472 | $12,297 | $12,497 |
|---|
6/18 | $11,246 | $12,066 | $12,262 |
|---|
7/18 | $11,559 | $12,355 | $12,555 |
|---|
8/18 | $11,365 | $12,096 | $12,292 |
|---|
9/18 | $11,268 | $12,151 | $12,348 |
|---|
10/18 | $10,306 | $11,163 | $11,344 |
|---|
11/18 | $10,460 | $11,269 | $11,451 |
|---|
12/18 | $9,990 | $10,758 | $10,933 |
|---|
1/19 | $10,598 | $11,571 | $11,759 |
|---|
2/19 | $10,801 | $11,797 | $11,989 |
|---|
3/19 | $10,971 | $11,868 | $12,060 |
|---|
4/19 | $11,166 | $12,181 | $12,379 |
|---|
5/19 | $10,712 | $11,527 | $11,715 |
|---|
6/19 | $11,426 | $12,222 | $12,420 |
|---|
7/19 | $11,247 | $12,074 | $12,270 |
|---|
8/19 | $10,874 | $11,701 | $11,891 |
|---|
9/19 | $11,004 | $12,002 | $12,197 |
|---|
10/19 | $11,336 | $12,421 | $12,622 |
|---|
11/19 | $11,539 | $12,530 | $12,733 |
|---|
12/19 | $12,132 | $13,073 | $13,285 |
|---|
1/20 | $11,651 | $12,722 | $12,928 |
|---|
2/20 | $10,886 | $11,716 | $11,906 |
|---|
3/20 | $9,477 | $10,020 | $10,182 |
|---|
4/20 | $10,186 | $10,779 | $10,954 |
|---|
5/20 | $10,821 | $11,132 | $11,312 |
|---|
6/20 | $11,562 | $11,635 | $11,824 |
|---|
7/20 | $12,547 | $12,153 | $12,351 |
|---|
8/20 | $12,995 | $12,674 | $12,879 |
|---|
9/20 | $12,873 | $12,362 | $12,563 |
|---|
10/20 | $12,775 | $12,096 | $12,293 |
|---|
11/20 | $14,558 | $13,724 | $13,946 |
|---|
12/20 | $15,696 | $14,465 | $14,700 |
|---|
1/21 | $15,533 | $14,497 | $14,732 |
|---|
2/21 | $15,891 | $14,784 | $15,024 |
|---|
3/21 | $15,769 | $14,971 | $15,214 |
|---|
4/21 | $16,535 | $15,411 | $15,661 |
|---|
5/21 | $17,056 | $15,893 | $16,151 |
|---|
6/21 | $16,820 | $15,790 | $16,047 |
|---|
7/21 | $16,673 | $15,530 | $15,782 |
|---|
8/21 | $17,015 | $15,825 | $16,082 |
|---|
9/21 | $16,225 | $15,319 | $15,567 |
|---|
10/21 | $16,828 | $15,684 | $15,939 |
|---|
11/21 | $15,753 | $14,978 | $15,221 |
|---|
12/21 | $15,928 | $15,597 | $15,850 |
|---|
1/22 | $15,077 | $15,022 | $15,266 |
|---|
2/22 | $14,744 | $14,725 | $14,964 |
|---|
3/22 | $14,954 | $14,748 | $14,988 |
|---|
4/22 | $13,717 | $13,822 | $14,047 |
|---|
5/22 | $13,919 | $13,922 | $14,147 |
|---|
6/22 | $12,437 | $12,724 | $12,930 |
|---|
7/22 | $12,490 | $13,160 | $13,373 |
|---|
8/22 | $12,060 | $12,736 | $12,943 |
|---|
9/22 | $10,946 | $11,464 | $11,650 |
|---|
10/22 | $11,384 | $11,806 | $11,998 |
|---|
11/22 | $12,946 | $13,200 | $13,414 |
|---|
12/22 | $12,389 | $13,101 | $13,314 |
|---|
1/23 | $13,770 | $14,164 | $14,393 |
|---|
2/23 | $12,982 | $13,666 | $13,888 |
|---|
3/23 | $13,761 | $14,001 | $14,228 |
|---|
4/23 | $13,797 | $14,244 | $14,475 |
|---|
5/23 | $13,115 | $13,726 | $13,949 |
|---|
6/23 | $13,717 | $14,342 | $14,574 |
|---|
7/23 | $14,222 | $14,925 | $15,167 |
|---|
8/23 | $13,265 | $14,251 | $14,482 |
|---|
9/23 | $12,867 | $13,801 | $14,025 |
|---|
10/23 | $12,344 | $13,231 | $13,446 |
|---|
11/23 | $13,053 | $14,422 | $14,656 |
|---|
12/23 | $13,815 | $15,147 | $15,393 |
|---|
1/24 | $13,379 | $14,996 | $15,240 |
|---|
2/24 | $13,715 | $15,376 | $15,626 |
|---|
3/24 | $14,569 | $15,857 | $16,114 |
|---|
4/24 | $14,460 | $15,572 | $15,825 |
|---|
5/24 | $15,114 | $16,024 | $16,284 |
|---|
6/24 | $14,968 | $16,009 | $16,269 |
|---|
7/24 | $14,968 | $16,379 | $16,645 |
|---|
8/24 | $15,432 | $16,846 | $17,119 |
|---|
9/24 | $15,668 | $17,300 | $17,580 |
|---|
10/24 | $15,132 | $16,451 | $16,718 |
|---|
11/24 | $15,105 | $16,302 | $16,566 |
|---|
12/24 | $14,681 | $15,985 | $16,244 |
|---|
|
|
| Average Annual Return [Table Text Block] |
AATR | 1 Year | 5 Years | 10 Years |
|---|
Class L | 6.27% | 3.89% | 3.91% |
|---|
MSCI All Country World ex USA Net Index | 5.53% | 4.10% | 4.80% |
|---|
Active International Allocation Blend Index | 5.53% | 4.10% | 4.97% |
|---|
|
|
| AssetsNet |
$ 137,481,862
|
|
| Holdings Count | Holding |
68
|
|
| Advisory Fees Paid, Amount |
$ 717,211
|
|
| InvestmentCompanyPortfolioTurnover |
30.00%
|
|
| Additional Fund Statistics [Text Block] |
Total Net Assets | $137,481,862 |
|---|
# of Portfolio Holdings | 68 |
|---|
Portfolio Turnover Rate | 30% |
|---|
Total Advisory Fees Paid | $717,211 |
|---|
|
|
| Holdings [Text Block] |
Country Weightings (% of total investments)Value | Value |
|---|
Other | 23.9% | China | 4.4% | Korea, Republic of | 5.2% | Taiwan | 5.6% | India | 6.7% | United States | 7.7% | Japan | 7.9% | Germany | 8.3% | Canada | 8.8% | France | 9.7% | United Kingdom | 11.8% |
Top Ten Holdings (% of total investments)Footnote ReferenceaTaiwan Semiconductor Manufacturing Co. Ltd. | 5.6% | Tencent Holdings Ltd. | 4.4% | Unilever PLC | 3.7% | Sony Group Corp. | 3.6% | Despegar.com Corp. | 3.1% | Samsung Electronics Co. Ltd. | 2.9% | SAP SE | 2.7% | HDFC Bank Ltd. | 2.4% | Sea Ltd. | 2.4% | Rheinmetall AG | 2.4% | Total | 33.2% |
| Footnote | Description | Footnotea | Excluding cash equivalents. |
|
|
| Material Fund Change [Text Block] |
|
|
| Updated Prospectus Web Address |
<span style="box-sizing: border-box; color: rgb(0, 0, 0); display: inline; flex-wrap: nowrap; font-size: 10.6667px; font-weight: 400; grid-area: auto; line-height: 16px; margin: 0px; overflow: visible; text-align: left;">www.morganstanley.com/im/shareholderreports</span>
|
|
| C000215548 |
|
|
| Shareholder Report [Line Items] |
|
|
| Fund Name |
Morgan Stanley Institutional Fund, Inc. - Passport Overseas Equity Portfolio
|
|
| Class Name |
Class R6
|
|
| Trading Symbol |
MAIJX
|
|
| Annual or Semi-Annual Statement [Text Block] |
This annual shareholder report contains important information about Morgan Stanley Institutional Fund, Inc. - Passport Overseas Equity Portfolio for the period of January 1, 2024 to December 31, 2024.
|
|
| Shareholder Report Annual or Semi-Annual |
Annual Shareholder Report
|
|
| Additional Information [Text Block] |
You can find additional information about the Fund at www.morganstanley.com/im/shareholderreports. You can also request this information by contacting us at 1-800-869-6397.
|
|
| Additional Information Phone Number |
1-800-869-6397
|
|
| Additional Information Website |
<span style="box-sizing: border-box; color: rgb(0, 0, 0); display: inline; flex-wrap: nowrap; font-size: 10.6667px; font-weight: 400; grid-area: auto; line-height: 16px; margin: 0px; overflow: visible; text-align: left;">www.morganstanley.com/im/shareholderreports</span>
|
|
| Expenses [Text Block] |
What were the Fund costs for the last year?(based on a hypothetical $10,000 investment) Class Name | Costs of a $10,000 investment | Costs paid as a percentage of a $10,000 investment |
|---|
Class R6 | $88 | 0.85% |
|---|
|
|
| Expenses Paid, Amount |
$ 88
|
|
| Expense Ratio, Percent |
0.85%
|
|
| Factors Affecting Performance [Text Block] |
How did the Fund perform last year and what affected its performance?Key contributors to (↑) and detractors from (↓) performance, relative to the MSCI All Country World ex USA Index: ↑ Stock selection in consumer discretionary and communication services ↑ Overweight to and stock selection in semiconductors, led by the allocation to a Taiwan semiconductor foundry ↑ Overweight to aerospace and defense, zero allocation to Mexico and autos, and underweight utilities ↑ Top stock contributors included a Chinese internet company, a U.K.-based personal care products company and an Israel-based security software developer ↓ Underweight to and stock selection in financials and stock selection in technology ↓ Overweight to materials, and overweight to and stock selection within energy ↓ Overweight to and stock selection in France, and underweight to and stock selection in Japan ↓ Top stock detractors included an Ireland-based discount airline, a Canada-based rail transportation company and a France-based IT services provider |
|
| Line Graph [Table Text Block] |
 | Class R6 | MSCI All Country World ex USA Net Index |
|---|
10/19 | $5,000,000 | $5,000,000 |
|---|
11/19 | $5,094,271 | $5,000,000 |
|---|
12/19 | $5,357,332 | $5,262,511 |
|---|
1/20 | $5,148,032 | $5,121,142 |
|---|
2/20 | $4,817,560 | $4,716,341 |
|---|
3/20 | $4,197,005 | $4,033,447 |
|---|
4/20 | $4,512,790 | $4,339,105 |
|---|
5/20 | $4,795,528 | $4,481,112 |
|---|
6/20 | $5,129,673 | $4,683,614 |
|---|
7/20 | $5,570,303 | $4,892,429 |
|---|
8/20 | $5,772,259 | $5,101,858 |
|---|
9/20 | $5,724,524 | $4,976,442 |
|---|
10/20 | $5,684,133 | $4,869,455 |
|---|
11/20 | $6,480,940 | $5,524,470 |
|---|
12/20 | $6,994,123 | $5,823,071 |
|---|
1/21 | $6,928,002 | $5,835,727 |
|---|
2/21 | $7,093,305 | $5,951,252 |
|---|
3/21 | $7,041,877 | $6,026,498 |
|---|
4/21 | $7,390,849 | $6,203,898 |
|---|
5/21 | $7,629,619 | $6,397,955 |
|---|
6/21 | $7,530,437 | $6,356,502 |
|---|
7/21 | $7,467,990 | $6,251,746 |
|---|
8/21 | $7,629,619 | $6,370,581 |
|---|
9/21 | $7,276,974 | $6,166,592 |
|---|
10/21 | $7,556,151 | $6,313,791 |
|---|
11/21 | $7,078,611 | $6,029,493 |
|---|
12/21 | $7,161,032 | $6,278,671 |
|---|
1/22 | $6,785,188 | $6,047,301 |
|---|
2/22 | $6,641,248 | $5,927,599 |
|---|
3/22 | $6,737,208 | $5,937,047 |
|---|
4/22 | $6,185,437 | $5,564,243 |
|---|
5/22 | $6,281,397 | $5,604,183 |
|---|
6/22 | $5,613,674 | $5,122,070 |
|---|
7/22 | $5,649,659 | $5,297,417 |
|---|
8/22 | $5,457,738 | $5,127,039 |
|---|
9/22 | $4,957,945 | $4,614,693 |
|---|
10/22 | $5,161,861 | $4,752,587 |
|---|
11/22 | $5,873,566 | $5,313,617 |
|---|
12/22 | $5,625,000 | $5,273,885 |
|---|
1/23 | $6,255,879 | $5,701,640 |
|---|
2/23 | $5,901,773 | $5,501,503 |
|---|
3/23 | $6,259,949 | $5,635,991 |
|---|
4/23 | $6,280,300 | $5,733,905 |
|---|
5/23 | $5,975,036 | $5,525,431 |
|---|
6/23 | $6,251,809 | $5,773,353 |
|---|
7/23 | $6,487,880 | $6,008,077 |
|---|
8/23 | $6,056,440 | $5,736,718 |
|---|
9/23 | $5,881,422 | $5,555,529 |
|---|
10/23 | $5,645,351 | $5,326,314 |
|---|
11/23 | $5,975,036 | $5,805,761 |
|---|
12/23 | $6,331,474 | $6,097,453 |
|---|
1/24 | $6,133,352 | $6,036,887 |
|---|
2/24 | $6,293,535 | $6,189,724 |
|---|
3/24 | $6,689,779 | $6,383,214 |
|---|
4/24 | $6,643,410 | $6,268,589 |
|---|
5/24 | $6,951,132 | $6,450,558 |
|---|
6/24 | $6,887,901 | $6,444,424 |
|---|
7/24 | $6,892,117 | $6,593,641 |
|---|
8/24 | $7,111,316 | $6,781,423 |
|---|
9/24 | $7,225,130 | $6,964,031 |
|---|
10/24 | $6,984,855 | $6,622,342 |
|---|
11/24 | $6,976,424 | $6,562,398 |
|---|
12/24 | $6,789,613 | $6,434,889 |
|---|
|
|
| Average Annual Return [Table Text Block] |
AATR | 1 Year | 5 Years | Since 10/31/19
(Inception) |
|---|
Class R6 | 7.24% | 4.85% | 6.10% |
|---|
MSCI All Country World ex USA Net Index | 5.53% | 4.10% | 5.00% |
|---|
|
|
| Performance Inception Date |
Oct. 31, 2019
|
|
| AssetsNet |
$ 137,481,862
|
|
| Holdings Count | Holding |
68
|
|
| Advisory Fees Paid, Amount |
$ 717,211
|
|
| InvestmentCompanyPortfolioTurnover |
30.00%
|
|
| Additional Fund Statistics [Text Block] |
Total Net Assets | $137,481,862 |
|---|
# of Portfolio Holdings | 68 |
|---|
Portfolio Turnover Rate | 30% |
|---|
Total Advisory Fees Paid | $717,211 |
|---|
|
|
| Holdings [Text Block] |
Country Weightings (% of total investments)Value | Value |
|---|
Other | 23.9% | China | 4.4% | Korea, Republic of | 5.2% | Taiwan | 5.6% | India | 6.7% | United States | 7.7% | Japan | 7.9% | Germany | 8.3% | Canada | 8.8% | France | 9.7% | United Kingdom | 11.8% |
Top Ten Holdings (% of total investments)Footnote ReferenceaTaiwan Semiconductor Manufacturing Co. Ltd. | 5.6% | Tencent Holdings Ltd. | 4.4% | Unilever PLC | 3.7% | Sony Group Corp. | 3.6% | Despegar.com Corp. | 3.1% | Samsung Electronics Co. Ltd. | 2.9% | SAP SE | 2.7% | HDFC Bank Ltd. | 2.4% | Sea Ltd. | 2.4% | Rheinmetall AG | 2.4% | Total | 33.2% |
| Footnote | Description | Footnotea | Excluding cash equivalents. |
|
|
| Material Fund Change [Text Block] |
|
|
| Updated Prospectus Web Address |
<span style="box-sizing: border-box; color: rgb(0, 0, 0); display: inline; flex-wrap: nowrap; font-size: 10.6667px; font-weight: 400; grid-area: auto; line-height: 16px; margin: 0px; overflow: visible; text-align: left;">www.morganstanley.com/im/shareholderreports</span>
|
|
| C000218315 |
|
|
| Shareholder Report [Line Items] |
|
|
| Fund Name |
Morgan Stanley Institutional Fund, Inc. - Permanence Portfolio
|
|
| Class Name |
Class A
|
|
| Trading Symbol |
MSHNX
|
|
| Annual or Semi-Annual Statement [Text Block] |
This annual shareholder report contains important information about Morgan Stanley Institutional Fund, Inc. - Permanence Portfolio for the period of January 1, 2024 to December 31, 2024.
|
|
| Shareholder Report Annual or Semi-Annual |
Annual Shareholder Report
|
|
| Additional Information [Text Block] |
You can find additional information about the Fund at www.morganstanley.com/im/shareholderreports. You can also request this information by contacting us at 1-800-869-6397.
|
|
| Additional Information Phone Number |
1-800-869-6397
|
|
| Additional Information Website |
<span style="box-sizing: border-box; color: rgb(0, 0, 0); display: inline; flex-wrap: nowrap; font-size: 10.6667px; font-weight: 400; grid-area: auto; line-height: 16px; margin: 0px; overflow: visible; text-align: left;">www.morganstanley.com/im/shareholderreports</span>
|
|
| Expenses [Text Block] |
What were the Fund costs for the last year?(based on a hypothetical $10,000 investment) Class Name | Costs of a $10,000 investment | Costs paid as a percentage of a $10,000 investment |
|---|
Class A | $128 | 1.20% |
|---|
|
|
| Expenses Paid, Amount |
$ 128
|
|
| Expense Ratio, Percent |
1.20%
|
|
| Factors Affecting Performance [Text Block] |
How did the Fund perform last year and what affected its performance?Key contributors to (↑) and detractors from (↓) performance, relative to the S&P 500® Index: ↓ Stock selection in consumer discretionary, where the largest detractor was a holding in a contemporary carpets and floor coverings company ↓ Stock selection and average overweight in industrials, dampened by a leading North American Class 1 freight railway ↓ Stock selection and average underweight in information technology, which lagged primarily because of underweight exposures to some of the “Magnificent 7” companies that drove significant performance gains within the Index in 2024 ↑ Stock selection and average underweight in energy, where a holding in a Texas landowner was the largest contributor ↑ Average overweight consumer discretionary ↑ Stock selection in materials, driven by a precious metals streaming and royalty company |
|
| Line Graph [Table Text Block] |
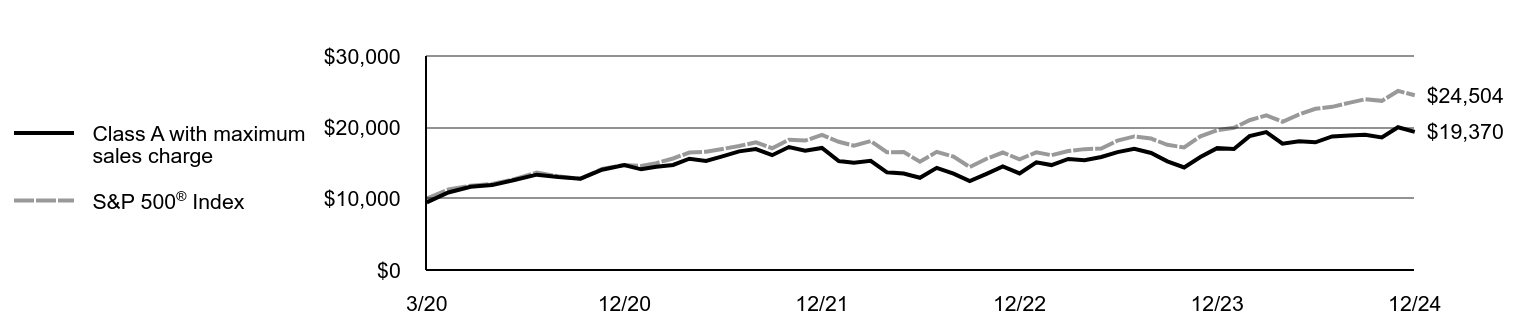 | Class A with maximum sales charge | S&P 500® Index |
|---|
3/20 | $9,479 | $10,000 |
|---|
4/20 | $10,863 | $11,282 |
|---|
5/20 | $11,659 | $11,819 |
|---|
6/20 | $11,905 | $12,054 |
|---|
7/20 | $12,607 | $12,734 |
|---|
8/20 | $13,365 | $13,649 |
|---|
9/20 | $13,052 | $13,131 |
|---|
10/20 | $12,806 | $12,782 |
|---|
11/20 | $14,057 | $14,181 |
|---|
12/20 | $14,697 | $14,726 |
|---|
1/21 | $14,114 | $14,577 |
|---|
2/21 | $14,476 | $14,979 |
|---|
3/21 | $14,727 | $15,635 |
|---|
4/21 | $15,602 | $16,470 |
|---|
5/21 | $15,290 | $16,585 |
|---|
6/21 | $15,924 | $16,972 |
|---|
7/21 | $16,628 | $17,375 |
|---|
8/21 | $16,950 | $17,903 |
|---|
9/21 | $16,095 | $17,071 |
|---|
10/21 | $17,242 | $18,267 |
|---|
11/21 | $16,709 | $18,140 |
|---|
12/21 | $17,108 | $18,953 |
|---|
1/22 | $15,267 | $17,972 |
|---|
2/22 | $15,040 | $17,434 |
|---|
3/22 | $15,303 | $18,081 |
|---|
4/22 | $13,689 | $16,505 |
|---|
5/22 | $13,522 | $16,535 |
|---|
6/22 | $12,924 | $15,170 |
|---|
7/22 | $14,323 | $16,569 |
|---|
8/22 | $13,498 | $15,893 |
|---|
9/22 | $12,458 | $14,429 |
|---|
10/22 | $13,474 | $15,598 |
|---|
11/22 | $14,514 | $16,469 |
|---|
12/22 | $13,545 | $15,520 |
|---|
1/23 | $15,087 | $16,496 |
|---|
2/23 | $14,708 | $16,093 |
|---|
3/23 | $15,564 | $16,684 |
|---|
4/23 | $15,381 | $16,944 |
|---|
5/23 | $15,845 | $17,018 |
|---|
6/23 | $16,531 | $18,143 |
|---|
7/23 | $16,983 | $18,725 |
|---|
8/23 | $16,408 | $18,427 |
|---|
9/23 | $15,234 | $17,549 |
|---|
10/23 | $14,377 | $17,180 |
|---|
11/23 | $15,845 | $18,749 |
|---|
12/23 | $17,082 | $19,600 |
|---|
1/24 | $16,960 | $19,930 |
|---|
2/24 | $18,764 | $20,994 |
|---|
3/24 | $19,333 | $21,669 |
|---|
4/24 | $17,706 | $20,784 |
|---|
5/24 | $18,045 | $21,815 |
|---|
6/24 | $17,896 | $22,598 |
|---|
7/24 | $18,723 | $22,873 |
|---|
8/24 | $18,845 | $23,428 |
|---|
9/24 | $18,953 | $23,928 |
|---|
10/24 | $18,574 | $23,711 |
|---|
11/24 | $20,011 | $25,103 |
|---|
12/24 | $19,370 | $24,504 |
|---|
|
|
| Average Annual Return [Table Text Block] |
AATR | 1 Year | Since 3/31/20
(Inception) |
|---|
Class A | 13.39% | 16.22% |
|---|
Class A, with 5.25% maximum front end sales charge | 7.42% | 14.92% |
|---|
S&P 500® Index | 25.02% | 20.75% |
|---|
|
|
| Performance Inception Date |
Mar. 31, 2020
|
|
| AssetsNet |
$ 4,625,370
|
|
| Holdings Count | Holding |
62
|
|
| Advisory Fees Paid, Amount |
$ 0
|
|
| InvestmentCompanyPortfolioTurnover |
74.00%
|
|
| Additional Fund Statistics [Text Block] |
Total Net Assets | $4,625,370 |
|---|
# of Portfolio Holdings | 62 |
|---|
Portfolio Turnover Rate | 74% |
|---|
Total Advisory Fees Paid (Net of Waivers) | $0 |
|---|
|
|
| Holdings [Text Block] |
Sector Allocation (% of total investments)Value | Value |
|---|
Communication Services | 0.3% | Energy | 1.1% | Materials | 2.8% | Domestic Alternative | 3.4% | Consumer Staples | 5.1% | Short-Term Investments | 5.2% | Financials | 5.5% | Real Estate | 6.3% | Industrials | 10.9% | Health Care | 11.5% | Information Technology | 23.1% | Consumer Discretionary | 24.8% |
Top Ten Holdings (% of total investments)Footnote ReferenceaCloudflare, Inc. | 11.1% | Floor & Decor Holdings, Inc. | 6.3% | Amazon.com, Inc. | 5.4% | LVMH Moet Hennessy Louis Vuitton SE | 5.4% | ASML Holding NV | 5.1% | Royalty Pharma PLC | 5.0% | Union Pacific Corp. | 5.0% | American Tower Corp. | 4.9% | Danaher Corp. | 4.9% | Intercontinental Exchange, Inc. | 4.9% | Total | 58.0% |
| Footnote | Description | Footnotea | Excluding cash equivalents. |
|
|
| Material Fund Change [Text Block] |
|
|
| Updated Prospectus Web Address |
<span style="box-sizing: border-box; color: rgb(0, 0, 0); display: inline; flex-wrap: nowrap; font-size: 10.6667px; font-weight: 400; grid-area: auto; line-height: 16px; margin: 0px; overflow: visible; text-align: left;">www.morganstanley.com/im/shareholderreports</span>
|
|
| C000218316 |
|
|
| Shareholder Report [Line Items] |
|
|
| Fund Name |
Morgan Stanley Institutional Fund, Inc. - Permanence Portfolio
|
|
| Class Name |
Class C
|
|
| Trading Symbol |
MSHOX
|
|
| Annual or Semi-Annual Statement [Text Block] |
This annual shareholder report contains important information about Morgan Stanley Institutional Fund, Inc. - Permanence Portfolio for the period of January 1, 2024 to December 31, 2024.
|
|
| Shareholder Report Annual or Semi-Annual |
Annual Shareholder Report
|
|
| Additional Information [Text Block] |
You can find additional information about the Fund at www.morganstanley.com/im/shareholderreports. You can also request this information by contacting us at 1-800-869-6397.
|
|
| Additional Information Phone Number |
1-800-869-6397
|
|
| Additional Information Website |
<span style="box-sizing: border-box; color: rgb(0, 0, 0); display: inline; flex-wrap: nowrap; font-size: 10.6667px; font-weight: 400; grid-area: auto; line-height: 16px; margin: 0px; overflow: visible; text-align: left;">www.morganstanley.com/im/shareholderreports</span>
|
|
| Expenses [Text Block] |
What were the Fund costs for the last year?(based on a hypothetical $10,000 investment) Class Name | Costs of a $10,000 investment | Costs paid as a percentage of a $10,000 investment |
|---|
Class C | $207 | 1.95% |
|---|
|
|
| Expenses Paid, Amount |
$ 207
|
|
| Expense Ratio, Percent |
1.95%
|
|
| Factors Affecting Performance [Text Block] |
How did the Fund perform last year and what affected its performance?Key contributors to (↑) and detractors from (↓) performance, relative to the S&P 500® Index: ↓ Stock selection in consumer discretionary, where the largest detractor was a holding in a contemporary carpets and floor coverings company ↓ Stock selection and average overweight in industrials, dampened by a leading North American Class 1 freight railway ↓ Stock selection and average underweight in information technology, which lagged primarily because of underweight exposures to some of the “Magnificent 7” companies that drove significant performance gains within the Index in 2024 ↑ Stock selection and average underweight in energy, where a holding in a Texas landowner was the largest contributor ↑ Average overweight consumer discretionary ↑ Stock selection in materials, driven by a precious metals streaming and royalty company |
|
| Line Graph [Table Text Block] |
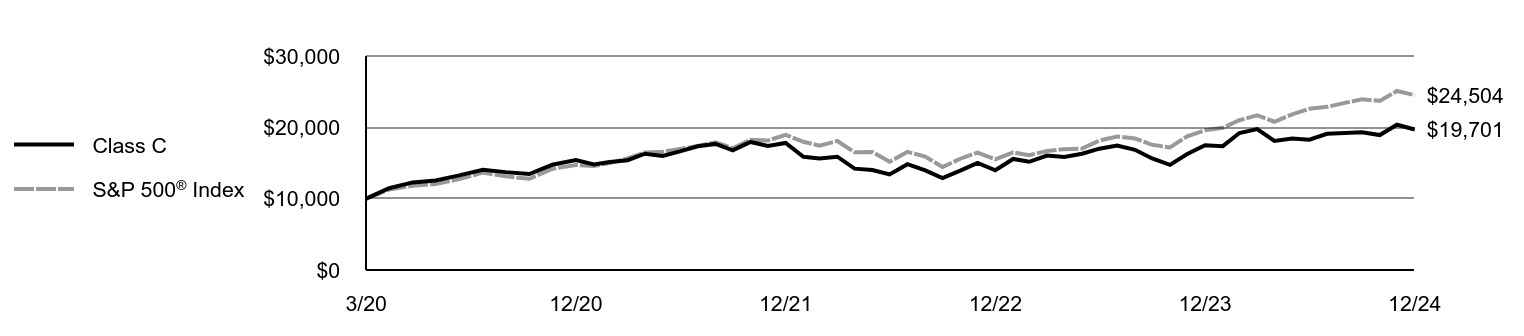 | Class C | S&P 500® Index |
|---|
3/20 | $10,000 | $10,000 |
|---|
4/20 | $11,460 | $11,282 |
|---|
5/20 | $12,280 | $11,819 |
|---|
6/20 | $12,540 | $12,054 |
|---|
7/20 | $13,260 | $12,734 |
|---|
8/20 | $14,060 | $13,649 |
|---|
9/20 | $13,720 | $13,131 |
|---|
10/20 | $13,450 | $12,782 |
|---|
11/20 | $14,750 | $14,181 |
|---|
12/20 | $15,415 | $14,726 |
|---|
1/21 | $14,789 | $14,577 |
|---|
2/21 | $15,149 | $14,979 |
|---|
3/21 | $15,394 | $15,635 |
|---|
4/21 | $16,307 | $16,470 |
|---|
5/21 | $15,978 | $16,585 |
|---|
6/21 | $16,625 | $16,972 |
|---|
7/21 | $17,347 | $17,375 |
|---|
8/21 | $17,676 | $17,903 |
|---|
9/21 | $16,774 | $17,071 |
|---|
10/21 | $17,952 | $18,267 |
|---|
11/21 | $17,389 | $18,140 |
|---|
12/21 | $17,807 | $18,953 |
|---|
1/22 | $15,871 | $17,972 |
|---|
2/22 | $15,632 | $17,434 |
|---|
3/22 | $15,883 | $18,081 |
|---|
4/22 | $14,211 | $16,505 |
|---|
5/22 | $14,022 | $16,535 |
|---|
6/22 | $13,393 | $15,170 |
|---|
7/22 | $14,839 | $16,569 |
|---|
8/22 | $13,959 | $15,893 |
|---|
9/22 | $12,890 | $14,429 |
|---|
10/22 | $13,921 | $15,598 |
|---|
11/22 | $15,003 | $16,469 |
|---|
12/22 | $13,984 | $15,520 |
|---|
1/23 | $15,567 | $16,496 |
|---|
2/23 | $15,168 | $16,093 |
|---|
3/23 | $16,044 | $16,684 |
|---|
4/23 | $15,838 | $16,944 |
|---|
5/23 | $16,301 | $17,018 |
|---|
6/23 | $17,010 | $18,143 |
|---|
7/23 | $17,460 | $18,725 |
|---|
8/23 | $16,855 | $18,427 |
|---|
9/23 | $15,632 | $17,549 |
|---|
10/23 | $14,743 | $17,180 |
|---|
11/23 | $16,250 | $18,749 |
|---|
12/23 | $17,500 | $19,600 |
|---|
1/24 | $17,357 | $19,930 |
|---|
2/24 | $19,203 | $20,994 |
|---|
3/24 | $19,761 | $21,669 |
|---|
4/24 | $18,087 | $20,784 |
|---|
5/24 | $18,430 | $21,815 |
|---|
6/24 | $18,273 | $22,598 |
|---|
7/24 | $19,088 | $22,873 |
|---|
8/24 | $19,203 | $23,428 |
|---|
9/24 | $19,317 | $23,928 |
|---|
10/24 | $18,917 | $23,711 |
|---|
11/24 | $20,362 | $25,103 |
|---|
12/24 | $19,701 | $24,504 |
|---|
|
|
| Average Annual Return [Table Text Block] |
AATR | 1 Year | Since 3/31/20
(Inception) |
|---|
Class C | 12.58% | 15.33% |
|---|
Class C, with 1% maximum contingent deferred sales charge | 11.58% | 15.33% |
|---|
S&P 500® Index | 25.02% | 20.75% |
|---|
|
|
| Performance Inception Date |
Mar. 31, 2020
|
|
| AssetsNet |
$ 4,625,370
|
|
| Holdings Count | Holding |
62
|
|
| Advisory Fees Paid, Amount |
$ 0
|
|
| InvestmentCompanyPortfolioTurnover |
74.00%
|
|
| Additional Fund Statistics [Text Block] |
Total Net Assets | $4,625,370 |
|---|
# of Portfolio Holdings | 62 |
|---|
Portfolio Turnover Rate | 74% |
|---|
Total Advisory Fees Paid (Net of Waivers) | $0 |
|---|
|
|
| Holdings [Text Block] |
Sector Allocation (% of total investments)Value | Value |
|---|
Communication Services | 0.3% | Energy | 1.1% | Materials | 2.8% | Domestic Alternative | 3.4% | Consumer Staples | 5.1% | Short-Term Investments | 5.2% | Financials | 5.5% | Real Estate | 6.3% | Industrials | 10.9% | Health Care | 11.5% | Information Technology | 23.1% | Consumer Discretionary | 24.8% |
Top Ten Holdings (% of total investments)Footnote ReferenceaCloudflare, Inc. | 11.1% | Floor & Decor Holdings, Inc. | 6.3% | Amazon.com, Inc. | 5.4% | LVMH Moet Hennessy Louis Vuitton SE | 5.4% | ASML Holding NV | 5.1% | Royalty Pharma PLC | 5.0% | Union Pacific Corp. | 5.0% | American Tower Corp. | 4.9% | Danaher Corp. | 4.9% | Intercontinental Exchange, Inc. | 4.9% | Total | 58.0% |
| Footnote | Description | Footnotea | Excluding cash equivalents. |
|
|
| Material Fund Change [Text Block] |
|
|
| Updated Prospectus Web Address |
<span style="box-sizing: border-box; color: rgb(0, 0, 0); display: inline; flex-wrap: nowrap; font-size: 10.6667px; font-weight: 400; grid-area: auto; line-height: 16px; margin: 0px; overflow: visible; text-align: left;">www.morganstanley.com/im/shareholderreports</span>
|
|
| C000218317 |
|
|
| Shareholder Report [Line Items] |
|
|
| Fund Name |
Morgan Stanley Institutional Fund, Inc. - Permanence Portfolio
|
|
| Class Name |
Class I
|
|
| Trading Symbol |
MSHMX
|
|
| Annual or Semi-Annual Statement [Text Block] |
This annual shareholder report contains important information about Morgan Stanley Institutional Fund, Inc. - Permanence Portfolio for the period of January 1, 2024 to December 31, 2024.
|
|
| Shareholder Report Annual or Semi-Annual |
Annual Shareholder Report
|
|
| Additional Information [Text Block] |
You can find additional information about the Fund at www.morganstanley.com/im/shareholderreports. You can also request this information by contacting us at 1-800-869-6397.
|
|
| Additional Information Phone Number |
1-800-869-6397
|
|
| Additional Information Website |
<span style="box-sizing: border-box; color: rgb(0, 0, 0); display: inline; flex-wrap: nowrap; font-size: 10.6667px; font-weight: 400; grid-area: auto; line-height: 16px; margin: 0px; overflow: visible; text-align: left;">www.morganstanley.com/im/shareholderreports</span>
|
|
| Expenses [Text Block] |
What were the Fund costs for the last year?(based on a hypothetical $10,000 investment) Class Name | Costs of a $10,000 investment | Costs paid as a percentage of a $10,000 investment |
|---|
Class I | $91 | 0.85% |
|---|
|
|
| Expenses Paid, Amount |
$ 91
|
|
| Expense Ratio, Percent |
0.85%
|
|
| Factors Affecting Performance [Text Block] |
How did the Fund perform last year and what affected its performance?Key contributors to (↑) and detractors from (↓) performance, relative to the S&P 500® Index: ↓ Stock selection in consumer discretionary, where the largest detractor was a holding in a contemporary carpets and floor coverings company ↓ Stock selection and average overweight in industrials, dampened by a leading North American Class 1 freight railway ↓ Stock selection and average underweight in information technology, which lagged primarily because of underweight exposures to some of the “Magnificent 7” companies that drove significant performance gains within the Index in 2024 ↑ Stock selection and average underweight in energy, where a holding in a Texas landowner was the largest contributor ↑ Average overweight consumer discretionary ↑ Stock selection in materials, driven by a precious metals streaming and royalty company |
|
| Line Graph [Table Text Block] |
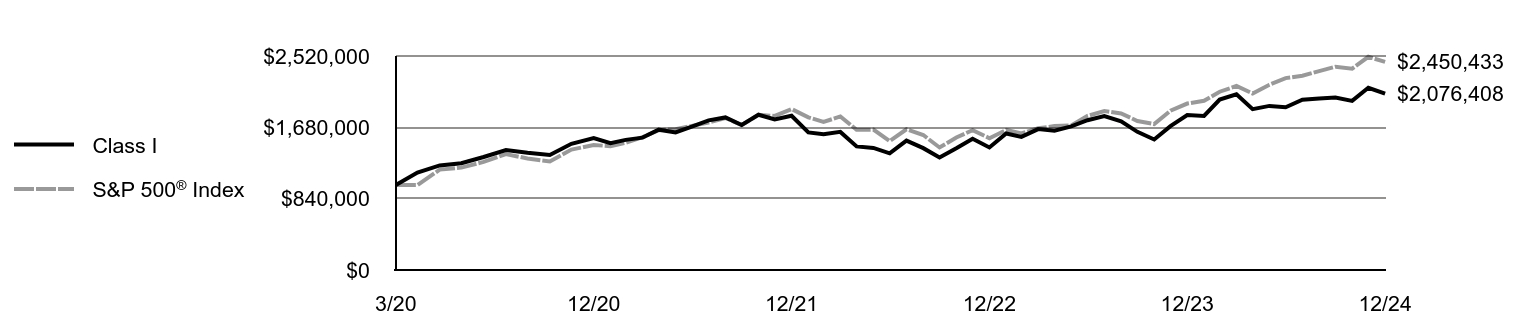 | Class I | S&P 500® Index |
|---|
3/20 | $1,000,000 | $1,000,000 |
|---|
4/20 | $1,147,000 | $1,000,000 |
|---|
5/20 | $1,231,000 | $1,181,928 |
|---|
6/20 | $1,257,000 | $1,205,433 |
|---|
7/20 | $1,331,000 | $1,273,401 |
|---|
8/20 | $1,412,000 | $1,364,934 |
|---|
9/20 | $1,380,000 | $1,313,071 |
|---|
10/20 | $1,354,000 | $1,278,151 |
|---|
11/20 | $1,486,000 | $1,418,063 |
|---|
12/20 | $1,554,582 | $1,472,585 |
|---|
1/21 | $1,494,097 | $1,457,718 |
|---|
2/21 | $1,532,298 | $1,497,914 |
|---|
3/21 | $1,558,827 | $1,563,517 |
|---|
4/21 | $1,652,208 | $1,646,960 |
|---|
5/21 | $1,620,374 | $1,658,463 |
|---|
6/21 | $1,687,226 | $1,697,179 |
|---|
7/21 | $1,762,568 | $1,737,495 |
|---|
8/21 | $1,796,524 | $1,790,325 |
|---|
9/21 | $1,707,388 | $1,707,058 |
|---|
10/21 | $1,828,359 | $1,826,657 |
|---|
11/21 | $1,773,179 | $1,814,000 |
|---|
12/21 | $1,816,566 | $1,895,297 |
|---|
1/22 | $1,620,044 | $1,797,221 |
|---|
2/22 | $1,597,369 | $1,743,409 |
|---|
3/22 | $1,626,343 | $1,808,141 |
|---|
4/22 | $1,455,017 | $1,650,468 |
|---|
5/22 | $1,437,380 | $1,653,496 |
|---|
6/22 | $1,374,392 | $1,517,010 |
|---|
7/22 | $1,523,043 | $1,656,885 |
|---|
8/22 | $1,434,861 | $1,589,314 |
|---|
9/22 | $1,325,262 | $1,442,941 |
|---|
10/22 | $1,433,601 | $1,559,763 |
|---|
11/22 | $1,545,719 | $1,646,929 |
|---|
12/22 | $1,443,269 | $1,552,042 |
|---|
1/23 | $1,607,512 | $1,649,563 |
|---|
2/23 | $1,567,421 | $1,609,315 |
|---|
3/23 | $1,659,242 | $1,668,400 |
|---|
4/23 | $1,639,843 | $1,694,441 |
|---|
5/23 | $1,690,280 | $1,701,806 |
|---|
6/23 | $1,763,995 | $1,814,254 |
|---|
7/23 | $1,813,139 | $1,872,537 |
|---|
8/23 | $1,751,063 | $1,842,723 |
|---|
9/23 | $1,626,910 | $1,754,866 |
|---|
10/23 | $1,536,383 | $1,717,967 |
|---|
11/23 | $1,694,159 | $1,874,861 |
|---|
12/23 | $1,824,928 | $1,960,037 |
|---|
1/24 | $1,813,477 | $1,992,975 |
|---|
2/24 | $2,006,705 | $2,099,391 |
|---|
3/24 | $2,068,251 | $2,166,938 |
|---|
4/24 | $1,893,631 | $2,078,430 |
|---|
5/24 | $1,932,276 | $2,181,488 |
|---|
6/24 | $1,916,532 | $2,259,765 |
|---|
7/24 | $2,005,273 | $2,287,271 |
|---|
8/24 | $2,018,155 | $2,342,753 |
|---|
9/24 | $2,031,037 | $2,392,787 |
|---|
10/24 | $1,990,960 | $2,371,088 |
|---|
11/24 | $2,145,542 | $2,510,274 |
|---|
12/24 | $2,076,408 | $2,450,433 |
|---|
|
|
| Average Annual Return [Table Text Block] |
AATR | 1 Year | Since 3/31/20
(Inception) |
|---|
Class I | 13.78% | 16.62% |
|---|
S&P 500® Index | 25.02% | 20.75% |
|---|
|
|
| Performance Inception Date |
Mar. 31, 2020
|
|
| AssetsNet |
$ 4,625,370
|
|
| Holdings Count | Holding |
62
|
|
| Advisory Fees Paid, Amount |
$ 0
|
|
| InvestmentCompanyPortfolioTurnover |
74.00%
|
|
| Additional Fund Statistics [Text Block] |
Total Net Assets | $4,625,370 |
|---|
# of Portfolio Holdings | 62 |
|---|
Portfolio Turnover Rate | 74% |
|---|
Total Advisory Fees Paid (Net of Waivers) | $0 |
|---|
|
|
| Holdings [Text Block] |
Sector Allocation (% of total investments)Value | Value |
|---|
Communication Services | 0.3% | Energy | 1.1% | Materials | 2.8% | Domestic Alternative | 3.4% | Consumer Staples | 5.1% | Short-Term Investments | 5.2% | Financials | 5.5% | Real Estate | 6.3% | Industrials | 10.9% | Health Care | 11.5% | Information Technology | 23.1% | Consumer Discretionary | 24.8% |
Top Ten Holdings (% of total investments)Footnote ReferenceaCloudflare, Inc. | 11.1% | Floor & Decor Holdings, Inc. | 6.3% | Amazon.com, Inc. | 5.4% | LVMH Moet Hennessy Louis Vuitton SE | 5.4% | ASML Holding NV | 5.1% | Royalty Pharma PLC | 5.0% | Union Pacific Corp. | 5.0% | American Tower Corp. | 4.9% | Danaher Corp. | 4.9% | Intercontinental Exchange, Inc. | 4.9% | Total | 58.0% |
| Footnote | Description | Footnotea | Excluding cash equivalents. |
|
|
| Material Fund Change [Text Block] |
|
|
| Updated Prospectus Web Address |
<span style="box-sizing: border-box; color: rgb(0, 0, 0); display: inline; flex-wrap: nowrap; font-size: 10.6667px; font-weight: 400; grid-area: auto; line-height: 16px; margin: 0px; overflow: visible; text-align: left;">www.morganstanley.com/im/shareholderreports</span>
|
|
| C000218314 |
|
|
| Shareholder Report [Line Items] |
|
|
| Fund Name |
Morgan Stanley Institutional Fund, Inc. - Permanence Portfolio
|
|
| Class Name |
Class R6
|
|
| Trading Symbol |
MSHPX
|
|
| Annual or Semi-Annual Statement [Text Block] |
This annual shareholder report contains important information about Morgan Stanley Institutional Fund, Inc. - Permanence Portfolio for the period of January 1, 2024 to December 31, 2024.
|
|
| Shareholder Report Annual or Semi-Annual |
Annual Shareholder Report
|
|
| Additional Information [Text Block] |
You can find additional information about the Fund at www.morganstanley.com/im/shareholderreports. You can also request this information by contacting us at 1-800-869-6397.
|
|
| Additional Information Phone Number |
1-800-869-6397
|
|
| Additional Information Website |
<span style="box-sizing: border-box; color: rgb(0, 0, 0); display: inline; flex-wrap: nowrap; font-size: 10.6667px; font-weight: 400; grid-area: auto; line-height: 16px; margin: 0px; overflow: visible; text-align: left;">www.morganstanley.com/im/shareholderreports</span>
|
|
| Expenses [Text Block] |
What were the Fund costs for the last year?(based on a hypothetical $10,000 investment) Class Name | Costs of a $10,000 investment | Costs paid as a percentage of a $10,000 investment |
|---|
Class R6 | $86 | 0.80% |
|---|
|
|
| Expenses Paid, Amount |
$ 86
|
|
| Expense Ratio, Percent |
0.80%
|
|
| Factors Affecting Performance [Text Block] |
How did the Fund perform last year and what affected its performance?Key contributors to (↑) and detractors from (↓) performance, relative to the S&P 500® Index: ↓ Stock selection in consumer discretionary, where the largest detractor was a holding in a contemporary carpets and floor coverings company ↓ Stock selection and average overweight in industrials, dampened by a leading North American Class 1 freight railway ↓ Stock selection and average underweight in information technology, which lagged primarily because of underweight exposures to some of the “Magnificent 7” companies that drove significant performance gains within the Index in 2024 ↑ Stock selection and average underweight in energy, where a holding in a Texas landowner was the largest contributor ↑ Average overweight consumer discretionary ↑ Stock selection in materials, driven by a precious metals streaming and royalty company |
|
| Line Graph [Table Text Block] |
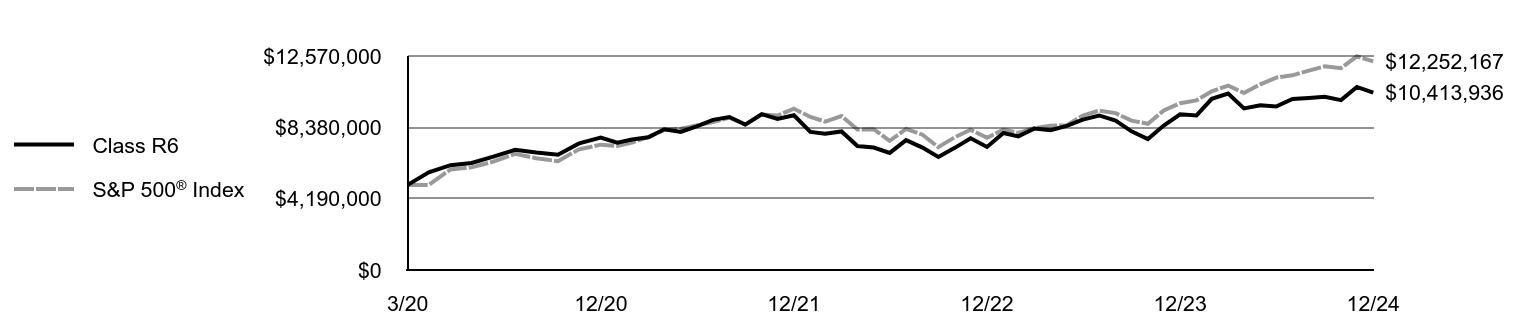 | Class R6 | S&P 500® Index |
|---|
3/20 | $5,000,000 | $5,000,000 |
|---|
4/20 | $5,735,000 | $5,000,000 |
|---|
5/20 | $6,155,000 | $5,909,638 |
|---|
6/20 | $6,290,000 | $6,027,164 |
|---|
7/20 | $6,655,000 | $6,367,006 |
|---|
8/20 | $7,060,000 | $6,824,670 |
|---|
9/20 | $6,900,000 | $6,565,355 |
|---|
10/20 | $6,775,000 | $6,390,757 |
|---|
11/20 | $7,435,000 | $7,090,315 |
|---|
12/20 | $7,772,594 | $7,362,925 |
|---|
1/21 | $7,475,485 | $7,288,590 |
|---|
2/21 | $7,661,178 | $7,489,572 |
|---|
3/21 | $7,799,122 | $7,817,583 |
|---|
4/21 | $8,266,008 | $8,234,798 |
|---|
5/21 | $8,106,842 | $8,292,313 |
|---|
6/21 | $8,441,091 | $8,485,896 |
|---|
7/21 | $8,817,783 | $8,687,477 |
|---|
8/21 | $8,987,560 | $8,951,626 |
|---|
9/21 | $8,541,896 | $8,535,288 |
|---|
10/21 | $9,152,031 | $9,133,285 |
|---|
11/21 | $8,870,838 | $9,070,001 |
|---|
12/21 | $9,090,206 | $9,476,483 |
|---|
1/22 | $8,107,481 | $8,986,103 |
|---|
2/22 | $8,000,389 | $8,717,047 |
|---|
3/22 | $8,138,978 | $9,040,706 |
|---|
4/22 | $7,282,244 | $8,252,341 |
|---|
5/22 | $7,194,051 | $8,267,480 |
|---|
6/22 | $6,879,075 | $7,585,051 |
|---|
7/22 | $7,628,717 | $8,284,427 |
|---|
8/22 | $7,187,751 | $7,946,572 |
|---|
9/22 | $6,639,693 | $7,214,704 |
|---|
10/22 | $7,175,152 | $7,798,817 |
|---|
11/22 | $7,742,109 | $8,234,646 |
|---|
12/22 | $7,227,095 | $7,760,211 |
|---|
1/23 | $8,048,797 | $8,247,815 |
|---|
2/23 | $7,848,224 | $8,046,577 |
|---|
3/23 | $8,307,600 | $8,342,000 |
|---|
4/23 | $8,210,549 | $8,472,206 |
|---|
5/23 | $8,462,883 | $8,509,032 |
|---|
6/23 | $8,838,148 | $9,071,269 |
|---|
7/23 | $9,077,542 | $9,362,684 |
|---|
8/23 | $8,773,447 | $9,213,616 |
|---|
9/23 | $8,145,848 | $8,774,330 |
|---|
10/23 | $7,692,941 | $8,589,837 |
|---|
11/23 | $8,482,293 | $9,374,307 |
|---|
12/23 | $9,142,915 | $9,800,187 |
|---|
1/24 | $9,078,478 | $9,964,873 |
|---|
2/24 | $10,052,195 | $10,496,953 |
|---|
3/24 | $10,360,061 | $10,834,688 |
|---|
4/24 | $9,493,739 | $10,392,150 |
|---|
5/24 | $9,679,891 | $10,907,441 |
|---|
6/24 | $9,601,135 | $11,298,823 |
|---|
7/24 | $10,045,035 | $11,436,357 |
|---|
8/24 | $10,109,472 | $11,713,765 |
|---|
9/24 | $10,181,069 | $11,963,937 |
|---|
10/24 | $9,980,598 | $11,855,441 |
|---|
11/24 | $10,753,843 | $12,551,369 |
|---|
12/24 | $10,413,936 | $12,252,167 |
|---|
|
|
| Average Annual Return [Table Text Block] |
AATR | 1 Year | Since 3/31/20
(Inception) |
|---|
Class R6 | 13.90% | 16.69% |
|---|
S&P 500® Index | 25.02% | 20.75% |
|---|
|
|
| Performance Inception Date |
Mar. 31, 2020
|
|
| AssetsNet |
$ 4,625,370
|
|
| Holdings Count | Holding |
62
|
|
| Advisory Fees Paid, Amount |
$ 0
|
|
| InvestmentCompanyPortfolioTurnover |
74.00%
|
|
| Additional Fund Statistics [Text Block] |
Total Net Assets | $4,625,370 |
|---|
# of Portfolio Holdings | 62 |
|---|
Portfolio Turnover Rate | 74% |
|---|
Total Advisory Fees Paid (Net of Waivers) | $0 |
|---|
|
|
| Holdings [Text Block] |
Sector Allocation (% of total investments)Value | Value |
|---|
Communication Services | 0.3% | Energy | 1.1% | Materials | 2.8% | Domestic Alternative | 3.4% | Consumer Staples | 5.1% | Short-Term Investments | 5.2% | Financials | 5.5% | Real Estate | 6.3% | Industrials | 10.9% | Health Care | 11.5% | Information Technology | 23.1% | Consumer Discretionary | 24.8% |
Top Ten Holdings (% of total investments)Footnote ReferenceaCloudflare, Inc. | 11.1% | Floor & Decor Holdings, Inc. | 6.3% | Amazon.com, Inc. | 5.4% | LVMH Moet Hennessy Louis Vuitton SE | 5.4% | ASML Holding NV | 5.1% | Royalty Pharma PLC | 5.0% | Union Pacific Corp. | 5.0% | American Tower Corp. | 4.9% | Danaher Corp. | 4.9% | Intercontinental Exchange, Inc. | 4.9% | Total | 58.0% |
| Footnote | Description | Footnotea | Excluding cash equivalents. |
|
|
| Material Fund Change [Text Block] |
|
|
| Updated Prospectus Web Address |
<span style="box-sizing: border-box; color: rgb(0, 0, 0); display: inline; flex-wrap: nowrap; font-size: 10.6667px; font-weight: 400; grid-area: auto; line-height: 16px; margin: 0px; overflow: visible; text-align: left;">www.morganstanley.com/im/shareholderreports</span>
|
|
| C000169221 |
|
|
| Shareholder Report [Line Items] |
|
|
| Fund Name |
Morgan Stanley Institutional Fund, Inc. - US Core Portfolio
|
|
| Class Name |
Class A
|
|
| Trading Symbol |
MUOAX
|
|
| Annual or Semi-Annual Statement [Text Block] |
This annual shareholder report contains important information about Morgan Stanley Institutional Fund, Inc. - US Core Portfolio for the period of January 1, 2024 to December 31, 2024.
|
|
| Shareholder Report Annual or Semi-Annual |
Annual Shareholder Report
|
|
| Additional Information [Text Block] |
You can find additional information about the Fund at www.morganstanley.com/im/shareholderreports. You can also request this information by contacting us at 1-800-869-6397.
|
|
| Additional Information Phone Number |
1-800-869-6397
|
|
| Additional Information Website |
<span style="box-sizing: border-box; color: rgb(0, 0, 0); display: inline; flex-wrap: nowrap; font-size: 10.6667px; font-weight: 400; grid-area: auto; line-height: 16px; margin: 0px; overflow: visible; text-align: left;">www.morganstanley.com/im/shareholderreports</span>
|
|
| Expenses [Text Block] |
What were the Fund costs for the last year?(based on a hypothetical $10,000 investment) Class Name | Costs of a $10,000 investment | Costs paid as a percentage of a $10,000 investment |
|---|
Class A | $122 | 1.07% |
|---|
|
|
| Expenses Paid, Amount |
$ 122
|
|
| Expense Ratio, Percent |
1.07%
|
|
| Factors Affecting Performance [Text Block] |
How did the Fund perform last year and what affected its performance?Key contributors to (↑) and detractors from (↓) performance, relative to the S&P 500® Index: ↑Stock selection in an artificial intelligence chip designer and a global provider of entertainment services ↑Underweight to the health care sector ↑Underweight to the lowest quality stocks ↓Not owning the full suite of uber-growth, mega-cap technology stocks |
|
| Line Graph [Table Text Block] |
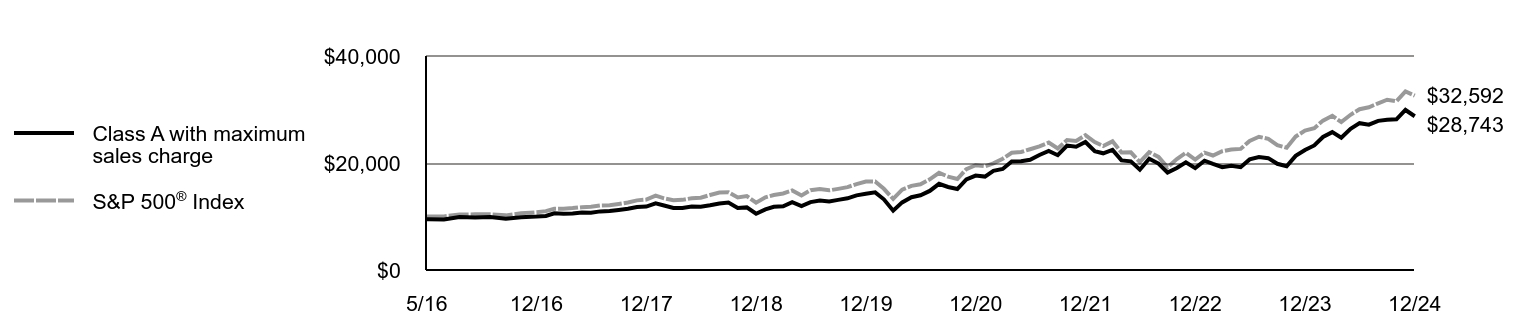 | Class A with maximum sales charge | S&P 500® Index |
|---|
5/16 | $9,479 | $10,000 |
|---|
5/16 | $9,479 | $9,991 |
|---|
6/16 | $9,431 | $10,017 |
|---|
7/16 | $9,886 | $10,386 |
|---|
8/16 | $9,810 | $10,400 |
|---|
9/16 | $9,886 | $10,402 |
|---|
10/16 | $9,564 | $10,213 |
|---|
11/16 | $9,877 | $10,591 |
|---|
12/16 | $9,981 | $10,800 |
|---|
1/17 | $10,105 | $11,005 |
|---|
2/17 | $10,602 | $11,442 |
|---|
3/17 | $10,506 | $11,455 |
|---|
4/17 | $10,564 | $11,573 |
|---|
5/17 | $10,726 | $11,736 |
|---|
6/17 | $10,698 | $11,809 |
|---|
7/17 | $10,956 | $12,052 |
|---|
8/17 | $11,023 | $12,089 |
|---|
9/17 | $11,223 | $12,338 |
|---|
10/17 | $11,443 | $12,626 |
|---|
11/17 | $11,778 | $13,013 |
|---|
12/17 | $11,857 | $13,158 |
|---|
1/18 | $12,470 | $13,911 |
|---|
2/18 | $12,067 | $13,399 |
|---|
3/18 | $11,588 | $13,058 |
|---|
4/18 | $11,588 | $13,108 |
|---|
5/18 | $11,857 | $13,424 |
|---|
6/18 | $11,809 | $13,507 |
|---|
7/18 | $12,087 | $14,009 |
|---|
8/18 | $12,431 | $14,466 |
|---|
9/18 | $12,604 | $14,548 |
|---|
10/18 | $11,608 | $13,554 |
|---|
11/18 | $11,703 | $13,830 |
|---|
12/18 | $10,510 | $12,581 |
|---|
1/19 | $11,333 | $13,589 |
|---|
2/19 | $11,807 | $14,026 |
|---|
3/19 | $11,923 | $14,298 |
|---|
4/19 | $12,698 | $14,877 |
|---|
5/19 | $11,952 | $13,932 |
|---|
6/19 | $12,688 | $14,914 |
|---|
7/19 | $12,998 | $15,128 |
|---|
8/19 | $12,814 | $14,888 |
|---|
9/19 | $13,104 | $15,167 |
|---|
10/19 | $13,395 | $15,495 |
|---|
11/19 | $13,956 | $16,058 |
|---|
12/19 | $14,261 | $16,542 |
|---|
1/20 | $14,515 | $16,536 |
|---|
2/20 | $13,214 | $15,175 |
|---|
3/20 | $11,082 | $13,300 |
|---|
4/20 | $12,637 | $15,006 |
|---|
5/20 | $13,605 | $15,720 |
|---|
6/20 | $13,967 | $16,033 |
|---|
7/20 | $14,779 | $16,937 |
|---|
8/20 | $16,109 | $18,154 |
|---|
9/20 | $15,513 | $17,464 |
|---|
10/20 | $15,131 | $17,000 |
|---|
11/20 | $16,921 | $18,861 |
|---|
12/20 | $17,651 | $19,586 |
|---|
1/21 | $17,465 | $19,388 |
|---|
2/21 | $18,534 | $19,923 |
|---|
3/21 | $18,877 | $20,796 |
|---|
4/21 | $20,271 | $21,905 |
|---|
5/21 | $20,330 | $22,058 |
|---|
6/21 | $20,614 | $22,573 |
|---|
7/21 | $21,497 | $23,110 |
|---|
8/21 | $22,262 | $23,812 |
|---|
9/21 | $21,458 | $22,705 |
|---|
10/21 | $23,263 | $24,295 |
|---|
11/21 | $23,028 | $24,127 |
|---|
12/21 | $23,930 | $25,208 |
|---|
1/22 | $22,194 | $23,904 |
|---|
2/22 | $21,811 | $23,188 |
|---|
3/22 | $22,439 | $24,049 |
|---|
4/22 | $20,487 | $21,952 |
|---|
5/22 | $20,310 | $21,992 |
|---|
6/22 | $18,750 | $20,177 |
|---|
7/22 | $20,801 | $22,037 |
|---|
8/22 | $19,898 | $21,139 |
|---|
9/22 | $18,200 | $19,192 |
|---|
10/22 | $19,054 | $20,746 |
|---|
11/22 | $20,124 | $21,905 |
|---|
12/22 | $19,044 | $20,643 |
|---|
1/23 | $20,428 | $21,940 |
|---|
2/23 | $19,820 | $21,405 |
|---|
3/23 | $19,221 | $22,191 |
|---|
4/23 | $19,476 | $22,537 |
|---|
5/23 | $19,221 | $22,635 |
|---|
6/23 | $20,674 | $24,130 |
|---|
7/23 | $21,096 | $24,906 |
|---|
8/23 | $20,909 | $24,509 |
|---|
9/23 | $19,849 | $23,341 |
|---|
10/23 | $19,388 | $22,850 |
|---|
11/23 | $21,331 | $24,937 |
|---|
12/23 | $22,417 | $26,069 |
|---|
1/24 | $23,281 | $26,507 |
|---|
2/24 | $24,863 | $27,923 |
|---|
3/24 | $25,767 | $28,821 |
|---|
4/24 | $24,735 | $27,644 |
|---|
5/24 | $26,395 | $29,015 |
|---|
6/24 | $27,446 | $30,056 |
|---|
7/24 | $27,162 | $30,422 |
|---|
8/24 | $27,879 | $31,160 |
|---|
9/24 | $28,085 | $31,825 |
|---|
10/24 | $28,163 | $31,537 |
|---|
11/24 | $29,912 | $33,388 |
|---|
12/24 | $28,743 | $32,592 |
|---|
|
|
| Average Annual Return [Table Text Block] |
AATR | 1 Year | 5 Years | Since 5/27/16
(Inception) |
|---|
Class A | 28.22% | 15.05% | 13.77% |
|---|
Class A, with 5.25% maximum front end sales charge | 21.51% | 13.81% | 13.07% |
|---|
S&P 500® Index | 25.02% | 14.53% | 14.73% |
|---|
|
|
| Performance Inception Date |
May 27, 2016
|
|
| AssetsNet |
$ 384,870,184
|
|
| Holdings Count | Holding |
32
|
|
| Advisory Fees Paid, Amount |
$ 1,727,795
|
|
| InvestmentCompanyPortfolioTurnover |
32.00%
|
|
| Additional Fund Statistics [Text Block] |
Total Net Assets | $384,870,184 |
|---|
# of Portfolio Holdings | 32 |
|---|
Portfolio Turnover Rate | 32% |
|---|
Total Advisory Fees Paid | $1,727,795 |
|---|
|
|
| Holdings [Text Block] |
Sector Allocation (% of total investments)Value | Value |
|---|
Utilities | 0.9% | Short-Term Investments | 1.3% | Materials | 1.7% | Health Care | 2.2% | Energy | 2.4% | Real Estate | 3.7% | Consumer Staples | 4.6% | Industrials | 6.4% | Communication Services | 10.1% | Consumer Discretionary | 13.6% | Financials | 24.8% | Information Technology | 28.3% |
Top Ten Holdings (% of total investments)Footnote ReferenceaNVIDIA Corp. | 9.6% | Apple, Inc. | 7.4% | Microsoft Corp. | 7.0% | Alphabet, Inc. | 6.7% | Amazon.com, Inc. | 5.9% | JPMorgan Chase & Co. | 5.0% | Ameriprise Financial, Inc. | 4.6% | Costco Wholesale Corp. | 4.6% | Progressive Corp. | 4.3% | Brown & Brown, Inc. | 4.1% | Total | 59.2% |
| Footnote | Description | Footnotea | Excluding cash equivalents. |
|
|
| Material Fund Change [Text Block] |
|
|
| Updated Prospectus Web Address |
<span style="box-sizing: border-box; color: rgb(0, 0, 0); display: inline; flex-wrap: nowrap; font-size: 10.6667px; font-weight: 400; grid-area: auto; line-height: 16px; margin: 0px; overflow: visible; text-align: left;">www.morganstanley.com/im/shareholderreports</span>
|
|
| C000169222 |
|
|
| Shareholder Report [Line Items] |
|
|
| Fund Name |
Morgan Stanley Institutional Fund, Inc. - US Core Portfolio
|
|
| Class Name |
Class C
|
|
| Trading Symbol |
MUOCX
|
|
| Annual or Semi-Annual Statement [Text Block] |
This annual shareholder report contains important information about Morgan Stanley Institutional Fund, Inc. - US Core Portfolio for the period of January 1, 2024 to December 31, 2024.
|
|
| Shareholder Report Annual or Semi-Annual |
Annual Shareholder Report
|
|
| Additional Information [Text Block] |
You can find additional information about the Fund at www.morganstanley.com/im/shareholderreports. You can also request this information by contacting us at 1-800-869-6397.
|
|
| Additional Information Phone Number |
1-800-869-6397
|
|
| Additional Information Website |
<span style="box-sizing: border-box; color: rgb(0, 0, 0); display: inline; flex-wrap: nowrap; font-size: 10.6667px; font-weight: 400; grid-area: auto; line-height: 16px; margin: 0px; overflow: visible; text-align: left;">www.morganstanley.com/im/shareholderreports</span>
|
|
| Expenses [Text Block] |
What were the Fund costs for the last year?(based on a hypothetical $10,000 investment) Class Name | Costs of a $10,000 investment | Costs paid as a percentage of a $10,000 investment |
|---|
Class C | $208 | 1.83% |
|---|
|
|
| Expenses Paid, Amount |
$ 208
|
|
| Expense Ratio, Percent |
1.83%
|
|
| Factors Affecting Performance [Text Block] |
How did the Fund perform last year and what affected its performance?Key contributors to (↑) and detractors from (↓) performance, relative to the S&P 500® Index: ↑Stock selection in an artificial intelligence chip designer and a global provider of entertainment services ↑Underweight to the health care sector ↑Underweight to the lowest quality stocks ↓Not owning the full suite of uber-growth, mega-cap technology stocks |
|
| Line Graph [Table Text Block] |
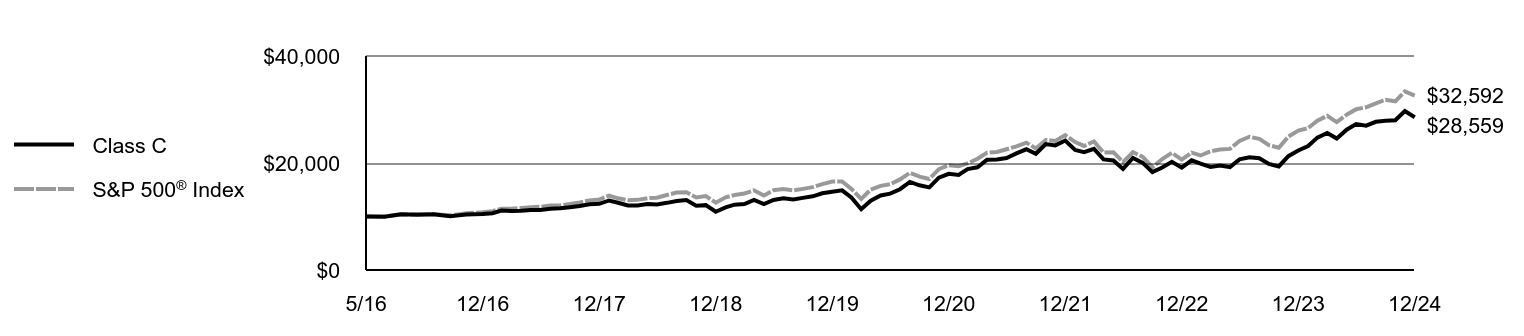 | Class C | S&P 500® Index |
|---|
5/16 | $10,000 | $10,000 |
|---|
5/16 | $10,000 | $9,991 |
|---|
6/16 | $9,950 | $10,017 |
|---|
7/16 | $10,420 | $10,386 |
|---|
8/16 | $10,330 | $10,400 |
|---|
9/16 | $10,400 | $10,402 |
|---|
10/16 | $10,060 | $10,213 |
|---|
11/16 | $10,380 | $10,591 |
|---|
12/16 | $10,479 | $10,800 |
|---|
1/17 | $10,610 | $11,005 |
|---|
2/17 | $11,123 | $11,442 |
|---|
3/17 | $11,022 | $11,455 |
|---|
4/17 | $11,063 | $11,573 |
|---|
5/17 | $11,234 | $11,736 |
|---|
6/17 | $11,204 | $11,809 |
|---|
7/17 | $11,465 | $12,052 |
|---|
8/17 | $11,526 | $12,089 |
|---|
9/17 | $11,727 | $12,338 |
|---|
10/17 | $11,948 | $12,626 |
|---|
11/17 | $12,291 | $13,013 |
|---|
12/17 | $12,361 | $13,158 |
|---|
1/18 | $12,995 | $13,911 |
|---|
2/18 | $12,562 | $13,399 |
|---|
3/18 | $12,059 | $13,058 |
|---|
4/18 | $12,059 | $13,108 |
|---|
5/18 | $12,321 | $13,424 |
|---|
6/18 | $12,261 | $13,507 |
|---|
7/18 | $12,552 | $14,009 |
|---|
8/18 | $12,895 | $14,466 |
|---|
9/18 | $13,066 | $14,548 |
|---|
10/18 | $12,019 | $13,554 |
|---|
11/18 | $12,120 | $13,830 |
|---|
12/18 | $10,885 | $12,581 |
|---|
1/19 | $11,719 | $13,589 |
|---|
2/19 | $12,207 | $14,026 |
|---|
3/19 | $12,318 | $14,298 |
|---|
4/19 | $13,111 | $14,877 |
|---|
5/19 | $12,329 | $13,932 |
|---|
6/19 | $13,081 | $14,914 |
|---|
7/19 | $13,386 | $15,128 |
|---|
8/19 | $13,192 | $14,888 |
|---|
9/19 | $13,477 | $15,167 |
|---|
10/19 | $13,772 | $15,495 |
|---|
11/19 | $14,341 | $16,058 |
|---|
12/19 | $14,640 | $16,542 |
|---|
1/20 | $14,896 | $16,536 |
|---|
2/20 | $13,555 | $15,175 |
|---|
3/20 | $11,354 | $13,300 |
|---|
4/20 | $12,951 | $15,006 |
|---|
5/20 | $13,924 | $15,720 |
|---|
6/20 | $14,282 | $16,033 |
|---|
7/20 | $15,101 | $16,937 |
|---|
8/20 | $16,463 | $18,154 |
|---|
9/20 | $15,838 | $17,464 |
|---|
10/20 | $15,439 | $17,000 |
|---|
11/20 | $17,251 | $18,861 |
|---|
12/20 | $17,984 | $19,586 |
|---|
1/21 | $17,779 | $19,388 |
|---|
2/21 | $18,857 | $19,923 |
|---|
3/21 | $19,196 | $20,796 |
|---|
4/21 | $20,603 | $21,905 |
|---|
5/21 | $20,654 | $22,058 |
|---|
6/21 | $20,921 | $22,573 |
|---|
7/21 | $21,805 | $23,110 |
|---|
8/21 | $22,565 | $23,812 |
|---|
9/21 | $21,733 | $22,705 |
|---|
10/21 | $23,551 | $24,295 |
|---|
11/21 | $23,294 | $24,127 |
|---|
12/21 | $24,198 | $25,208 |
|---|
1/22 | $22,431 | $23,904 |
|---|
2/22 | $22,031 | $23,188 |
|---|
3/22 | $22,647 | $24,049 |
|---|
4/22 | $20,675 | $21,952 |
|---|
5/22 | $20,480 | $21,992 |
|---|
6/22 | $18,898 | $20,177 |
|---|
7/22 | $20,942 | $22,037 |
|---|
8/22 | $20,018 | $21,139 |
|---|
9/22 | $18,302 | $19,192 |
|---|
10/22 | $19,155 | $20,746 |
|---|
11/22 | $20,213 | $21,905 |
|---|
12/22 | $19,124 | $20,643 |
|---|
1/23 | $20,501 | $21,940 |
|---|
2/23 | $19,874 | $21,405 |
|---|
3/23 | $19,268 | $22,191 |
|---|
4/23 | $19,515 | $22,537 |
|---|
5/23 | $19,237 | $22,635 |
|---|
6/23 | $20,686 | $24,130 |
|---|
7/23 | $21,087 | $24,906 |
|---|
8/23 | $20,892 | $24,509 |
|---|
9/23 | $19,813 | $23,341 |
|---|
10/23 | $19,350 | $22,850 |
|---|
11/23 | $21,272 | $24,937 |
|---|
12/23 | $22,330 | $26,069 |
|---|
1/24 | $23,183 | $26,507 |
|---|
2/24 | $24,745 | $27,923 |
|---|
3/24 | $25,619 | $28,821 |
|---|
4/24 | $24,581 | $27,644 |
|---|
5/24 | $26,226 | $29,015 |
|---|
6/24 | $27,271 | $30,056 |
|---|
7/24 | $26,988 | $30,422 |
|---|
8/24 | $27,700 | $31,160 |
|---|
9/24 | $27,905 | $31,825 |
|---|
10/24 | $27,983 | $31,537 |
|---|
11/24 | $29,721 | $33,388 |
|---|
12/24 | $28,559 | $32,592 |
|---|
|
|
| Average Annual Return [Table Text Block] |
AATR | 1 Year | 5 Years | Since 5/27/16
(Inception) |
|---|
Class C, with conversion to Class A after 8 years | 27.29% | 14.19% | 12.98% |
|---|
Class C, with 1% maximum contingent deferred sales charge and conversion to Class A after 8 years | 26.29% | 14.19% | 12.98% |
|---|
S&P 500® Index | 25.02% | 14.53% | 14.73% |
|---|
|
|
| Performance Inception Date |
May 27, 2016
|
|
| AssetsNet |
$ 384,870,184
|
|
| Holdings Count | Holding |
32
|
|
| Advisory Fees Paid, Amount |
$ 1,727,795
|
|
| InvestmentCompanyPortfolioTurnover |
32.00%
|
|
| Additional Fund Statistics [Text Block] |
Total Net Assets | $384,870,184 |
|---|
# of Portfolio Holdings | 32 |
|---|
Portfolio Turnover Rate | 32% |
|---|
Total Advisory Fees Paid | $1,727,795 |
|---|
|
|
| Holdings [Text Block] |
Sector Allocation (% of total investments)Value | Value |
|---|
Utilities | 0.9% | Short-Term Investments | 1.3% | Materials | 1.7% | Health Care | 2.2% | Energy | 2.4% | Real Estate | 3.7% | Consumer Staples | 4.6% | Industrials | 6.4% | Communication Services | 10.1% | Consumer Discretionary | 13.6% | Financials | 24.8% | Information Technology | 28.3% |
Top Ten Holdings (% of total investments)Footnote ReferenceaNVIDIA Corp. | 9.6% | Apple, Inc. | 7.4% | Microsoft Corp. | 7.0% | Alphabet, Inc. | 6.7% | Amazon.com, Inc. | 5.9% | JPMorgan Chase & Co. | 5.0% | Ameriprise Financial, Inc. | 4.6% | Costco Wholesale Corp. | 4.6% | Progressive Corp. | 4.3% | Brown & Brown, Inc. | 4.1% | Total | 59.2% |
| Footnote | Description | Footnotea | Excluding cash equivalents. |
|
|
| Material Fund Change [Text Block] |
|
|
| Updated Prospectus Web Address |
<span style="box-sizing: border-box; color: rgb(0, 0, 0); display: inline; flex-wrap: nowrap; font-size: 10.6667px; font-weight: 400; grid-area: auto; line-height: 16px; margin: 0px; overflow: visible; text-align: left;">www.morganstanley.com/im/shareholderreports</span>
|
|
| C000169220 |
|
|
| Shareholder Report [Line Items] |
|
|
| Fund Name |
Morgan Stanley Institutional Fund, Inc. - US Core Portfolio
|
|
| Class Name |
Class I
|
|
| Trading Symbol |
MUOIX
|
|
| Annual or Semi-Annual Statement [Text Block] |
This annual shareholder report contains important information about Morgan Stanley Institutional Fund, Inc. - US Core Portfolio for the period of January 1, 2024 to December 31, 2024.
|
|
| Shareholder Report Annual or Semi-Annual |
Annual Shareholder Report
|
|
| Additional Information [Text Block] |
You can find additional information about the Fund at www.morganstanley.com/im/shareholderreports. You can also request this information by contacting us at 1-800-869-6397.
|
|
| Additional Information Phone Number |
1-800-869-6397
|
|
| Additional Information Website |
<span style="box-sizing: border-box; color: rgb(0, 0, 0); display: inline; flex-wrap: nowrap; font-size: 10.6667px; font-weight: 400; grid-area: auto; line-height: 16px; margin: 0px; overflow: visible; text-align: left;">www.morganstanley.com/im/shareholderreports</span>
|
|
| Expenses [Text Block] |
What were the Fund costs for the last year?(based on a hypothetical $10,000 investment) Class Name | Costs of a $10,000 investment | Costs paid as a percentage of a $10,000 investment |
|---|
Class I | $91 | 0.80% |
|---|
|
|
| Expenses Paid, Amount |
$ 91
|
|
| Expense Ratio, Percent |
0.80%
|
|
| Factors Affecting Performance [Text Block] |
How did the Fund perform last year and what affected its performance?Key contributors to (↑) and detractors from (↓) performance, relative to the S&P 500® Index: ↑Stock selection in an artificial intelligence chip designer and a global provider of entertainment services ↑Underweight to the health care sector ↑Underweight to the lowest quality stocks ↓Not owning the full suite of uber-growth, mega-cap technology stocks |
|
| Line Graph [Table Text Block] |
 | Class I | S&P 500® Index |
|---|
5/16 | $1,000,000 | $1,000,000 |
|---|
5/16 | $1,000,000 | $1,000,000 |
|---|
6/16 | $996,000 | $1,001,651 |
|---|
7/16 | $1,044,000 | $1,038,580 |
|---|
8/16 | $1,036,000 | $1,040,039 |
|---|
9/16 | $1,044,000 | $1,040,235 |
|---|
10/16 | $1,011,000 | $1,021,260 |
|---|
11/16 | $1,044,000 | $1,059,082 |
|---|
12/16 | $1,055,044 | $1,080,016 |
|---|
1/17 | $1,069,178 | $1,100,500 |
|---|
2/17 | $1,121,678 | $1,144,197 |
|---|
3/17 | $1,112,592 | $1,145,531 |
|---|
4/17 | $1,118,649 | $1,157,296 |
|---|
5/17 | $1,135,813 | $1,173,582 |
|---|
6/17 | $1,133,793 | $1,180,907 |
|---|
7/17 | $1,161,053 | $1,205,190 |
|---|
8/17 | $1,169,130 | $1,208,879 |
|---|
9/17 | $1,190,332 | $1,233,816 |
|---|
10/17 | $1,214,562 | $1,262,608 |
|---|
11/17 | $1,249,899 | $1,301,332 |
|---|
12/17 | $1,259,035 | $1,315,801 |
|---|
1/18 | $1,323,965 | $1,391,136 |
|---|
2/18 | $1,281,354 | $1,339,862 |
|---|
3/18 | $1,231,642 | $1,305,812 |
|---|
4/18 | $1,231,642 | $1,310,823 |
|---|
5/18 | $1,260,049 | $1,342,390 |
|---|
6/18 | $1,254,976 | $1,350,652 |
|---|
7/18 | $1,286,427 | $1,400,915 |
|---|
8/18 | $1,322,950 | $1,446,564 |
|---|
9/18 | $1,342,226 | $1,454,798 |
|---|
10/18 | $1,235,700 | $1,355,362 |
|---|
11/18 | $1,245,846 | $1,382,982 |
|---|
12/18 | $1,120,552 | $1,258,111 |
|---|
1/19 | $1,208,014 | $1,358,931 |
|---|
2/19 | $1,258,434 | $1,402,564 |
|---|
3/19 | $1,271,811 | $1,429,818 |
|---|
4/19 | $1,354,128 | $1,487,711 |
|---|
5/19 | $1,275,926 | $1,393,170 |
|---|
6/19 | $1,354,128 | $1,491,355 |
|---|
7/19 | $1,387,056 | $1,512,789 |
|---|
8/19 | $1,367,505 | $1,488,826 |
|---|
9/19 | $1,399,403 | $1,516,682 |
|---|
10/19 | $1,431,301 | $1,549,533 |
|---|
11/19 | $1,492,011 | $1,605,780 |
|---|
12/19 | $1,524,006 | $1,654,245 |
|---|
1/20 | $1,552,171 | $1,653,597 |
|---|
2/20 | $1,414,478 | $1,517,474 |
|---|
3/20 | $1,184,991 | $1,330,046 |
|---|
4/20 | $1,352,934 | $1,500,550 |
|---|
5/20 | $1,456,203 | $1,572,018 |
|---|
6/20 | $1,495,842 | $1,603,281 |
|---|
7/20 | $1,582,421 | $1,693,683 |
|---|
8/20 | $1,726,373 | $1,815,425 |
|---|
9/20 | $1,662,742 | $1,746,445 |
|---|
10/20 | $1,622,060 | $1,700,001 |
|---|
11/20 | $1,813,995 | $1,886,089 |
|---|
12/20 | $1,892,867 | $1,958,606 |
|---|
1/21 | $1,872,986 | $1,938,833 |
|---|
2/21 | $1,988,086 | $1,992,296 |
|---|
3/21 | $2,025,755 | $2,079,550 |
|---|
4/21 | $2,176,431 | $2,190,533 |
|---|
5/21 | $2,183,756 | $2,205,832 |
|---|
6/21 | $2,214,100 | $2,257,327 |
|---|
7/21 | $2,309,319 | $2,310,950 |
|---|
8/21 | $2,391,982 | $2,381,216 |
|---|
9/21 | $2,306,180 | $2,270,466 |
|---|
10/21 | $2,500,803 | $2,429,539 |
|---|
11/21 | $2,475,690 | $2,412,704 |
|---|
12/21 | $2,574,114 | $2,520,832 |
|---|
1/22 | $2,387,781 | $2,390,387 |
|---|
2/22 | $2,346,955 | $2,318,815 |
|---|
3/22 | $2,414,998 | $2,404,912 |
|---|
4/22 | $2,205,635 | $2,195,199 |
|---|
5/22 | $2,186,793 | $2,199,226 |
|---|
6/22 | $2,019,303 | $2,017,694 |
|---|
7/22 | $2,240,180 | $2,203,734 |
|---|
8/22 | $2,143,873 | $2,113,862 |
|---|
9/22 | $1,961,728 | $1,919,178 |
|---|
10/22 | $2,054,894 | $2,074,558 |
|---|
11/22 | $2,170,044 | $2,190,492 |
|---|
12/22 | $2,053,865 | $2,064,288 |
|---|
1/23 | $2,203,866 | $2,193,995 |
|---|
2/23 | $2,138,831 | $2,140,464 |
|---|
3/23 | $2,074,844 | $2,219,049 |
|---|
4/23 | $2,103,166 | $2,253,685 |
|---|
5/23 | $2,075,893 | $2,263,482 |
|---|
6/23 | $2,233,237 | $2,413,042 |
|---|
7/23 | $2,279,391 | $2,490,561 |
|---|
8/23 | $2,259,461 | $2,450,907 |
|---|
9/23 | $2,146,173 | $2,334,053 |
|---|
10/23 | $2,096,872 | $2,284,976 |
|---|
11/23 | $2,306,664 | $2,493,653 |
|---|
12/23 | $2,424,895 | $2,606,941 |
|---|
1/24 | $2,519,617 | $2,650,748 |
|---|
2/24 | $2,691,170 | $2,792,287 |
|---|
3/24 | $2,789,050 | $2,882,128 |
|---|
4/24 | $2,678,540 | $2,764,408 |
|---|
5/24 | $2,858,513 | $2,901,481 |
|---|
6/24 | $2,973,232 | $3,005,592 |
|---|
7/24 | $2,942,711 | $3,042,177 |
|---|
8/24 | $3,020,594 | $3,115,970 |
|---|
9/24 | $3,044,801 | $3,182,518 |
|---|
10/24 | $3,054,273 | $3,153,657 |
|---|
11/24 | $3,243,718 | $3,338,780 |
|---|
12/24 | $3,118,664 | $3,259,190 |
|---|
|
|
| Average Annual Return [Table Text Block] |
AATR | 1 Year | 5 Years | Since 5/27/16
(Inception) |
|---|
Class I | 28.61% | 15.40% | 14.14% |
|---|
S&P 500® Index | 25.02% | 14.53% | 14.73% |
|---|
|
|
| Performance Inception Date |
May 27, 2016
|
|
| AssetsNet |
$ 384,870,184
|
|
| Holdings Count | Holding |
32
|
|
| Advisory Fees Paid, Amount |
$ 1,727,795
|
|
| InvestmentCompanyPortfolioTurnover |
32.00%
|
|
| Additional Fund Statistics [Text Block] |
Total Net Assets | $384,870,184 |
|---|
# of Portfolio Holdings | 32 |
|---|
Portfolio Turnover Rate | 32% |
|---|
Total Advisory Fees Paid | $1,727,795 |
|---|
|
|
| Holdings [Text Block] |
Sector Allocation (% of total investments)Value | Value |
|---|
Utilities | 0.9% | Short-Term Investments | 1.3% | Materials | 1.7% | Health Care | 2.2% | Energy | 2.4% | Real Estate | 3.7% | Consumer Staples | 4.6% | Industrials | 6.4% | Communication Services | 10.1% | Consumer Discretionary | 13.6% | Financials | 24.8% | Information Technology | 28.3% |
Top Ten Holdings (% of total investments)Footnote ReferenceaNVIDIA Corp. | 9.6% | Apple, Inc. | 7.4% | Microsoft Corp. | 7.0% | Alphabet, Inc. | 6.7% | Amazon.com, Inc. | 5.9% | JPMorgan Chase & Co. | 5.0% | Ameriprise Financial, Inc. | 4.6% | Costco Wholesale Corp. | 4.6% | Progressive Corp. | 4.3% | Brown & Brown, Inc. | 4.1% | Total | 59.2% |
| Footnote | Description | Footnotea | Excluding cash equivalents. |
|
|
| Material Fund Change [Text Block] |
|
|
| Updated Prospectus Web Address |
<span style="box-sizing: border-box; color: rgb(0, 0, 0); display: inline; flex-wrap: nowrap; font-size: 10.6667px; font-weight: 400; grid-area: auto; line-height: 16px; margin: 0px; overflow: visible; text-align: left;">www.morganstanley.com/im/shareholderreports</span>
|
|
| C000169223 |
|
|
| Shareholder Report [Line Items] |
|
|
| Fund Name |
Morgan Stanley Institutional Fund, Inc. - US Core Portfolio
|
|
| Class Name |
Class R6
|
|
| Trading Symbol |
MUOSX
|
|
| Annual or Semi-Annual Statement [Text Block] |
This annual shareholder report contains important information about Morgan Stanley Institutional Fund, Inc. - US Core Portfolio for the period of January 1, 2024 to December 31, 2024.
|
|
| Shareholder Report Annual or Semi-Annual |
Annual Shareholder Report
|
|
| Additional Information [Text Block] |
You can find additional information about the Fund at www.morganstanley.com/im/shareholderreports. You can also request this information by contacting us at 1-800-869-6397.
|
|
| Additional Information Phone Number |
1-800-869-6397
|
|
| Additional Information Website |
<span style="box-sizing: border-box; color: rgb(0, 0, 0); display: inline; flex-wrap: nowrap; font-size: 10.6667px; font-weight: 400; grid-area: auto; line-height: 16px; margin: 0px; overflow: visible; text-align: left;">www.morganstanley.com/im/shareholderreports</span>
|
|
| Expenses [Text Block] |
What were the Fund costs for the last year?(based on a hypothetical $10,000 investment) Class Name | Costs of a $10,000 investment | Costs paid as a percentage of a $10,000 investment |
|---|
Class R6 | $86 | 0.75% |
|---|
|
|
| Expenses Paid, Amount |
$ 86
|
|
| Expense Ratio, Percent |
0.75%
|
|
| Factors Affecting Performance [Text Block] |
How did the Fund perform last year and what affected its performance?Key contributors to (↑) and detractors from (↓) performance, relative to the S&P 500® Index: ↑Stock selection in an artificial intelligence chip designer and a global provider of entertainment services ↑Underweight to the health care sector ↑Underweight to the lowest quality stocks ↓Not owning the full suite of uber-growth, mega-cap technology stocks |
|
| Line Graph [Table Text Block] |
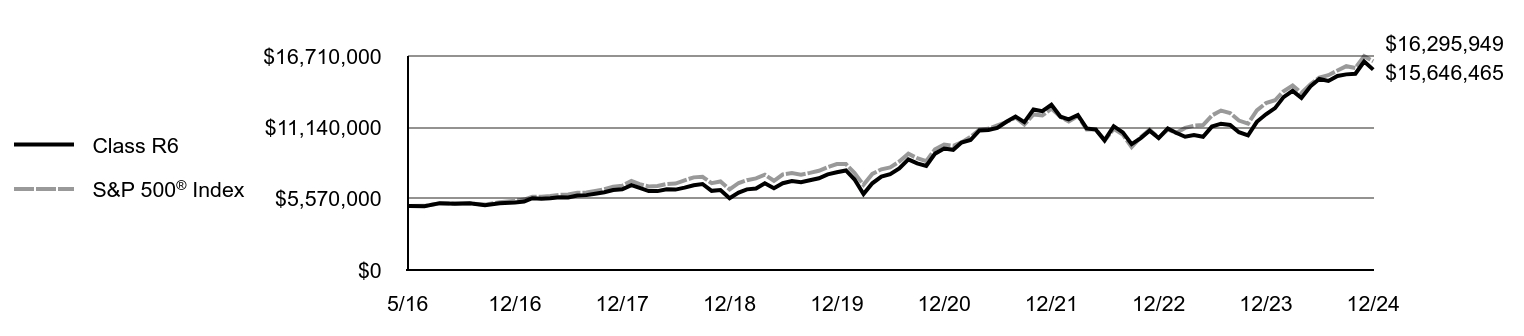 | Class R6 | S&P 500® Index |
|---|
5/16 | $5,000,000 | $5,000,000 |
|---|
5/16 | $5,000,000 | $5,000,000 |
|---|
6/16 | $4,980,000 | $5,008,254 |
|---|
7/16 | $5,220,000 | $5,192,902 |
|---|
8/16 | $5,180,000 | $5,200,193 |
|---|
9/16 | $5,220,000 | $5,201,176 |
|---|
10/16 | $5,055,000 | $5,106,301 |
|---|
11/16 | $5,220,000 | $5,295,412 |
|---|
12/16 | $5,276,054 | $5,400,082 |
|---|
1/17 | $5,346,738 | $5,502,502 |
|---|
2/17 | $5,609,278 | $5,720,984 |
|---|
3/17 | $5,563,838 | $5,727,657 |
|---|
4/17 | $5,594,132 | $5,786,480 |
|---|
5/17 | $5,679,962 | $5,867,912 |
|---|
6/17 | $5,669,864 | $5,904,536 |
|---|
7/17 | $5,811,232 | $6,025,949 |
|---|
8/17 | $5,846,574 | $6,044,396 |
|---|
9/17 | $5,952,600 | $6,169,081 |
|---|
10/17 | $6,073,773 | $6,313,039 |
|---|
11/17 | $6,250,483 | $6,506,659 |
|---|
12/17 | $6,298,101 | $6,579,004 |
|---|
1/18 | $6,622,902 | $6,955,678 |
|---|
2/18 | $6,409,751 | $6,699,312 |
|---|
3/18 | $6,161,075 | $6,529,061 |
|---|
4/18 | $6,161,075 | $6,554,113 |
|---|
5/18 | $6,303,176 | $6,711,949 |
|---|
6/18 | $6,277,801 | $6,753,261 |
|---|
7/18 | $6,435,127 | $7,004,574 |
|---|
8/18 | $6,617,827 | $7,232,820 |
|---|
9/18 | $6,714,253 | $7,273,989 |
|---|
10/18 | $6,181,375 | $6,776,810 |
|---|
11/18 | $6,237,201 | $6,914,911 |
|---|
12/18 | $5,603,059 | $6,290,557 |
|---|
1/19 | $6,040,798 | $6,794,656 |
|---|
2/19 | $6,298,292 | $7,012,820 |
|---|
3/19 | $6,365,240 | $7,149,091 |
|---|
4/19 | $6,777,230 | $7,438,555 |
|---|
5/19 | $6,385,840 | $6,965,848 |
|---|
6/19 | $6,777,230 | $7,456,775 |
|---|
7/19 | $6,942,026 | $7,563,945 |
|---|
8/19 | $6,849,328 | $7,444,130 |
|---|
9/19 | $7,003,824 | $7,583,412 |
|---|
10/19 | $7,163,470 | $7,747,667 |
|---|
11/19 | $7,467,312 | $8,028,899 |
|---|
12/19 | $7,629,533 | $8,271,227 |
|---|
1/20 | $7,775,753 | $8,267,984 |
|---|
2/20 | $7,081,209 | $7,587,370 |
|---|
3/20 | $5,932,341 | $6,650,232 |
|---|
4/20 | $6,773,104 | $7,502,750 |
|---|
5/20 | $7,290,095 | $7,860,092 |
|---|
6/20 | $7,488,536 | $8,016,407 |
|---|
7/20 | $7,927,194 | $8,468,413 |
|---|
8/20 | $8,642,626 | $9,077,127 |
|---|
9/20 | $8,324,076 | $8,732,226 |
|---|
10/20 | $8,125,635 | $8,500,003 |
|---|
11/20 | $9,086,508 | $9,430,447 |
|---|
12/20 | $9,481,376 | $9,793,031 |
|---|
1/21 | $9,381,848 | $9,694,163 |
|---|
2/21 | $9,958,064 | $9,961,478 |
|---|
3/21 | $10,146,644 | $10,397,748 |
|---|
4/21 | $10,900,963 | $10,952,663 |
|---|
5/21 | $10,937,632 | $11,029,161 |
|---|
6/21 | $11,089,543 | $11,286,635 |
|---|
7/21 | $11,571,469 | $11,554,748 |
|---|
8/21 | $11,985,297 | $11,906,078 |
|---|
9/21 | $11,550,516 | $11,352,329 |
|---|
10/21 | $12,530,084 | $12,147,693 |
|---|
11/21 | $12,404,364 | $12,063,522 |
|---|
12/21 | $12,900,086 | $12,604,162 |
|---|
1/22 | $11,967,045 | $11,951,934 |
|---|
2/22 | $11,762,614 | $11,594,077 |
|---|
3/22 | $12,103,332 | $12,024,559 |
|---|
4/22 | $11,054,970 | $10,975,996 |
|---|
5/22 | $10,960,618 | $10,996,132 |
|---|
6/22 | $10,121,929 | $10,088,470 |
|---|
7/22 | $11,227,950 | $11,018,672 |
|---|
8/22 | $10,745,704 | $10,569,310 |
|---|
9/22 | $9,828,388 | $9,595,891 |
|---|
10/22 | $10,300,150 | $10,372,788 |
|---|
11/22 | $10,876,749 | $10,952,461 |
|---|
12/22 | $10,299,214 | $10,321,440 |
|---|
1/23 | $11,050,636 | $10,969,976 |
|---|
2/23 | $10,719,590 | $10,702,320 |
|---|
3/23 | $10,404,308 | $11,095,247 |
|---|
4/23 | $10,546,185 | $11,268,427 |
|---|
5/23 | $10,404,308 | $11,317,408 |
|---|
6/23 | $11,197,768 | $12,065,209 |
|---|
7/23 | $11,423,720 | $12,452,804 |
|---|
8/23 | $11,329,136 | $12,254,536 |
|---|
9/23 | $10,756,373 | $11,670,266 |
|---|
10/23 | $10,514,657 | $11,424,881 |
|---|
11/23 | $11,570,852 | $12,468,263 |
|---|
12/23 | $12,158,159 | $13,034,703 |
|---|
1/24 | $12,638,156 | $13,253,742 |
|---|
2/24 | $13,497,930 | $13,961,434 |
|---|
3/24 | $13,988,476 | $14,410,638 |
|---|
4/24 | $13,429,359 | $13,822,041 |
|---|
5/24 | $14,341,881 | $14,507,403 |
|---|
6/24 | $14,916,822 | $15,027,959 |
|---|
7/24 | $14,763,856 | $15,210,885 |
|---|
8/24 | $15,154,183 | $15,579,851 |
|---|
9/24 | $15,275,501 | $15,912,591 |
|---|
10/24 | $15,322,973 | $15,768,286 |
|---|
11/24 | $16,277,692 | $16,693,902 |
|---|
12/24 | $15,646,465 | $16,295,949 |
|---|
|
|
| Average Annual Return [Table Text Block] |
AATR | 1 Year | 5 Years | Since 5/27/16
(Inception) |
|---|
Class R6 | 28.69% | 15.45% | 14.19% |
|---|
S&P 500® Index | 25.02% | 14.53% | 14.73% |
|---|
|
|
| Performance Inception Date |
May 27, 2016
|
|
| AssetsNet |
$ 384,870,184
|
|
| Holdings Count | Holding |
32
|
|
| Advisory Fees Paid, Amount |
$ 1,727,795
|
|
| InvestmentCompanyPortfolioTurnover |
32.00%
|
|
| Additional Fund Statistics [Text Block] |
Total Net Assets | $384,870,184 |
|---|
# of Portfolio Holdings | 32 |
|---|
Portfolio Turnover Rate | 32% |
|---|
Total Advisory Fees Paid | $1,727,795 |
|---|
|
|
| Holdings [Text Block] |
Sector Allocation (% of total investments)Value | Value |
|---|
Utilities | 0.9% | Short-Term Investments | 1.3% | Materials | 1.7% | Health Care | 2.2% | Energy | 2.4% | Real Estate | 3.7% | Consumer Staples | 4.6% | Industrials | 6.4% | Communication Services | 10.1% | Consumer Discretionary | 13.6% | Financials | 24.8% | Information Technology | 28.3% |
Top Ten Holdings (% of total investments)Footnote ReferenceaNVIDIA Corp. | 9.6% | Apple, Inc. | 7.4% | Microsoft Corp. | 7.0% | Alphabet, Inc. | 6.7% | Amazon.com, Inc. | 5.9% | JPMorgan Chase & Co. | 5.0% | Ameriprise Financial, Inc. | 4.6% | Costco Wholesale Corp. | 4.6% | Progressive Corp. | 4.3% | Brown & Brown, Inc. | 4.1% | Total | 59.2% |
| Footnote | Description | Footnotea | Excluding cash equivalents. |
|
|
| Material Fund Change [Text Block] |
|
|
| Updated Prospectus Web Address |
<span style="box-sizing: border-box; color: rgb(0, 0, 0); display: inline; flex-wrap: nowrap; font-size: 10.6667px; font-weight: 400; grid-area: auto; line-height: 16px; margin: 0px; overflow: visible; text-align: left;">www.morganstanley.com/im/shareholderreports</span>
|
|
| C000233003 |
|
|
| Shareholder Report [Line Items] |
|
|
| Fund Name |
Morgan Stanley Institutional Fund, Inc. - Vitality Portfolio
|
|
| Class Name |
Class A
|
|
| Trading Symbol |
MSVEX
|
|
| Annual or Semi-Annual Statement [Text Block] |
This annual shareholder report contains important information about Morgan Stanley Institutional Fund, Inc. - Vitality Portfolio for the period of January 1, 2024 to December 31, 2024.
|
|
| Shareholder Report Annual or Semi-Annual |
Annual Shareholder Report
|
|
| Additional Information [Text Block] |
You can find additional information about the Fund at www.morganstanley.com/im/shareholderreports. You can also request this information by contacting us at 1-800-869-6397.
|
|
| Additional Information Phone Number |
1-800-869-6397
|
|
| Additional Information Website |
<span style="box-sizing: border-box; color: rgb(0, 0, 0); display: inline; flex-wrap: nowrap; font-size: 10.6667px; font-weight: 400; grid-area: auto; line-height: 16px; margin: 0px; overflow: visible; text-align: left;">www.morganstanley.com/im/shareholderreports</span>
|
|
| Expenses [Text Block] |
What were the Fund costs for the last year?(based on a hypothetical $10,000 investment) Class Name | Costs of a $10,000 investment | Costs paid as a percentage of a $10,000 investment |
|---|
Class A | $123 | 1.29% |
|---|
|
|
| Expenses Paid, Amount |
$ 123
|
|
| Expense Ratio, Percent |
1.29%
|
|
| Factors Affecting Performance [Text Block] |
How did the Fund perform last year and what affected its performance?Key contributors to (↑) and detractors from (↓) performance, relative to the Russell 3000® Health Care Net Index: ↓ Stock selection and average overweight in life sciences tools and services, where a life sciences and technology platform was the largest detractor ↓ Stock selection in biotechnology, led lower by a clinical stage biotechnology company that is a leader in gene editing technology ↓ Stock selection in health care services, where the greatest detractor was a health care services platform offering physicians a value-based care model for their Medicare Advantage patients ↑ Average underweight and stock selection in managed health care, where a diversified health care company was the largest contributor ↑ Stock selection in pharmaceuticals, led by a developer of mental health illness therapies ↑ Stock selection and average overweight in health care technology, led by a digital platform for U.S. medical professionals |
|
| Line Graph [Table Text Block] |
| Class A with maximum sales charge | Russell 3000® Index | Russell 3000® Health Care Index |
|---|
12/21 | $9,479 | $10,000 | $10,000 |
|---|
1/22 | $7,469 | $9,412 | $9,161 |
|---|
2/22 | $7,469 | $9,175 | $9,074 |
|---|
3/22 | $7,517 | $9,472 | $9,534 |
|---|
4/22 | $6,114 | $8,622 | $8,948 |
|---|
5/22 | $5,706 | $8,611 | $9,009 |
|---|
6/22 | $5,706 | $7,890 | $8,816 |
|---|
7/22 | $6,275 | $8,630 | $9,157 |
|---|
8/22 | $5,877 | $8,308 | $8,654 |
|---|
9/22 | $5,526 | $7,538 | $8,391 |
|---|
10/22 | $5,801 | $8,156 | $9,131 |
|---|
11/22 | $6,076 | $8,582 | $9,536 |
|---|
12/22 | $5,682 | $8,079 | $9,350 |
|---|
1/23 | $6,042 | $8,636 | $9,276 |
|---|
2/23 | $5,740 | $8,434 | $8,858 |
|---|
3/23 | $5,944 | $8,659 | $9,034 |
|---|
4/23 | $6,032 | $8,752 | $9,319 |
|---|
5/23 | $5,974 | $8,786 | $8,956 |
|---|
6/23 | $6,402 | $9,386 | $9,334 |
|---|
7/23 | $6,616 | $9,722 | $9,415 |
|---|
8/23 | $6,217 | $9,534 | $9,323 |
|---|
9/23 | $5,721 | $9,080 | $8,962 |
|---|
10/23 | $5,254 | $8,840 | $8,593 |
|---|
11/23 | $5,614 | $9,664 | $9,088 |
|---|
12/23 | $6,188 | $10,176 | $9,574 |
|---|
1/24 | $6,022 | $10,289 | $9,801 |
|---|
2/24 | $6,285 | $10,846 | $10,169 |
|---|
3/24 | $6,314 | $11,196 | $10,379 |
|---|
4/24 | $5,799 | $10,703 | $9,817 |
|---|
5/24 | $5,721 | $11,209 | $10,062 |
|---|
6/24 | $5,750 | $11,556 | $10,262 |
|---|
7/24 | $6,042 | $11,771 | $10,570 |
|---|
8/24 | $6,246 | $12,027 | $11,130 |
|---|
9/24 | $6,227 | $12,276 | $10,942 |
|---|
10/24 | $5,867 | $12,186 | $10,469 |
|---|
11/24 | $6,013 | $12,996 | $10,516 |
|---|
12/24 | $5,623 | $12,599 | $9,864 |
|---|
|
|
| Average Annual Return [Table Text Block] |
AATR | 1 Year | Since 12/31/21
(Inception) |
|---|
Class A | (9.12)% | (15.97)% |
|---|
Class A, with 5.25% maximum front end sales charge | (13.86)% | (17.46)% |
|---|
Russell 3000® Index | 23.81% | 8.01% |
|---|
Russell 3000® Health Care Index | 3.03% | (0.45)% |
|---|
|
|
| Performance Inception Date |
Dec. 31, 2021
|
|
| AssetsNet |
$ 2,021,737
|
|
| Holdings Count | Holding |
36
|
|
| Advisory Fees Paid, Amount |
$ 0
|
|
| InvestmentCompanyPortfolioTurnover |
19.00%
|
|
| Additional Fund Statistics [Text Block] |
Total Net Assets | $2,021,737 |
|---|
# of Portfolio Holdings | 36 |
|---|
Portfolio Turnover Rate | 19% |
|---|
Total Advisory Fees Paid (Net of Waivers) | $0 |
|---|
|
|
| Holdings [Text Block] |
Industry Weightings (% of total investments)Value | Value |
|---|
OtherFootnote Reference1 | 4.7% | Health Care Providers & Services | 6.1% | Health Care Technology | 7.8% | Health Care Equipment & Supplies | 13.3% | Pharmaceuticals | 15.4% | Life Sciences Tools & Services | 20.0% | Biotechnology | 32.7% |
| Footnote | Description | Footnote1 | Industries and/or investment types representing less than 5% of total investments. |
Top Ten Holdings (% of total investments)Footnote ReferenceaEli Lilly & Co. | 8.1% | Argenx SE | 7.8% | Exact Sciences Corp. | 6.1% | UnitedHealth Group, Inc. | 5.4% | Thermo Fisher Scientific, Inc. | 4.7% | Intuitive Surgical, Inc. | 4.5% | Vertex Pharmaceuticals, Inc. | 4.0% | Alnylam Pharmaceuticals, Inc. | 3.9% | Align Technology, Inc. | 3.9% | Inspire Medical Systems, Inc. | 3.6% | Total | 52.0% |
| Footnote | Description | Footnotea | Excluding cash equivalents. |
|
|
| Material Fund Change [Text Block] |
|
|
| Updated Prospectus Web Address |
<span style="box-sizing: border-box; color: rgb(0, 0, 0); display: inline; flex-wrap: nowrap; font-size: 10.6667px; font-weight: 400; grid-area: auto; line-height: 16px; margin: 0px; overflow: visible; text-align: left;">www.morganstanley.com/im/shareholderreports</span>
|
|
| C000233004 |
|
|
| Shareholder Report [Line Items] |
|
|
| Fund Name |
Morgan Stanley Institutional Fund, Inc. - Vitality Portfolio
|
|
| Class Name |
Class C
|
|
| Trading Symbol |
MSVMX
|
|
| Annual or Semi-Annual Statement [Text Block] |
This annual shareholder report contains important information about Morgan Stanley Institutional Fund, Inc. - Vitality Portfolio for the period of January 1, 2024 to December 31, 2024.
|
|
| Shareholder Report Annual or Semi-Annual |
Annual Shareholder Report
|
|
| Additional Information [Text Block] |
You can find additional information about the Fund at www.morganstanley.com/im/shareholderreports. You can also request this information by contacting us at 1-800-869-6397.
|
|
| Additional Information Phone Number |
1-800-869-6397
|
|
| Additional Information Website |
<span style="box-sizing: border-box; color: rgb(0, 0, 0); display: inline; flex-wrap: nowrap; font-size: 10.6667px; font-weight: 400; grid-area: auto; line-height: 16px; margin: 0px; overflow: visible; text-align: left;">www.morganstanley.com/im/shareholderreports</span>
|
|
| Expenses [Text Block] |
What were the Fund costs for the last year?(based on a hypothetical $10,000 investment) Class Name | Costs of a $10,000 investment | Costs paid as a percentage of a $10,000 investment |
|---|
Class C | $194 | 2.04% |
|---|
|
|
| Expenses Paid, Amount |
$ 194
|
|
| Expense Ratio, Percent |
2.04%
|
|
| Factors Affecting Performance [Text Block] |
How did the Fund perform last year and what affected its performance?Key contributors to (↑) and detractors from (↓) performance, relative to the Russell 3000® Health Care Net Index: ↓ Stock selection and average overweight in life sciences tools and services, where a life sciences and technology platform was the largest detractor ↓ Stock selection in biotechnology, led lower by a clinical stage biotechnology company that is a leader in gene editing technology ↓ Stock selection in health care services, where the greatest detractor was a health care services platform offering physicians a value-based care model for their Medicare Advantage patients ↑ Average underweight and stock selection in managed health care, where a diversified health care company was the largest contributor ↑ Stock selection in pharmaceuticals, led by a developer of mental health illness therapies ↑ Stock selection and average overweight in health care technology, led by a digital platform for U.S. medical professionals |
|
| Line Graph [Table Text Block] |
| Class C | Russell 3000® Index | Russell 3000® Health Care Index |
|---|
12/21 | $10,000 | $10,000 | $10,000 |
|---|
1/22 | $7,870 | $9,412 | $9,161 |
|---|
2/22 | $7,870 | $9,175 | $9,074 |
|---|
3/22 | $7,920 | $9,472 | $9,534 |
|---|
4/22 | $6,430 | $8,622 | $8,948 |
|---|
5/22 | $6,000 | $8,611 | $9,009 |
|---|
6/22 | $6,000 | $7,890 | $8,816 |
|---|
7/22 | $6,590 | $8,630 | $9,157 |
|---|
8/22 | $6,160 | $8,308 | $8,654 |
|---|
9/22 | $5,800 | $7,538 | $8,391 |
|---|
10/22 | $6,080 | $8,156 | $9,131 |
|---|
11/22 | $6,370 | $8,582 | $9,536 |
|---|
12/22 | $5,955 | $8,079 | $9,350 |
|---|
1/23 | $6,321 | $8,636 | $9,276 |
|---|
2/23 | $6,006 | $8,434 | $8,858 |
|---|
3/23 | $6,209 | $8,659 | $9,034 |
|---|
4/23 | $6,301 | $8,752 | $9,319 |
|---|
5/23 | $6,240 | $8,786 | $8,956 |
|---|
6/23 | $6,678 | $9,386 | $9,334 |
|---|
7/23 | $6,902 | $9,722 | $9,415 |
|---|
8/23 | $6,484 | $9,534 | $9,323 |
|---|
9/23 | $5,955 | $9,080 | $8,962 |
|---|
10/23 | $5,466 | $8,840 | $8,593 |
|---|
11/23 | $5,843 | $9,664 | $9,088 |
|---|
12/23 | $6,433 | $10,176 | $9,574 |
|---|
1/24 | $6,250 | $10,289 | $9,801 |
|---|
2/24 | $6,515 | $10,846 | $10,169 |
|---|
3/24 | $6,545 | $11,196 | $10,379 |
|---|
4/24 | $6,016 | $10,703 | $9,817 |
|---|
5/24 | $5,924 | $11,209 | $10,062 |
|---|
6/24 | $5,955 | $11,556 | $10,262 |
|---|
7/24 | $6,250 | $11,771 | $10,570 |
|---|
8/24 | $6,464 | $12,027 | $11,130 |
|---|
9/24 | $6,433 | $12,276 | $10,942 |
|---|
10/24 | $6,057 | $12,186 | $10,469 |
|---|
11/24 | $6,199 | $12,996 | $10,516 |
|---|
12/24 | $5,802 | $12,599 | $9,864 |
|---|
|
|
| Average Annual Return [Table Text Block] |
AATR | 1 Year | Since 12/31/21
(Inception) |
|---|
Class C | (9.81)% | (16.59)% |
|---|
Class C, with 1% maximum contingent deferred sales charge | (10.71)% | (16.59)% |
|---|
Russell 3000® Index | 23.81% | 8.01% |
|---|
Russell 3000® Health Care Index | 3.03% | (0.45)% |
|---|
|
|
| Performance Inception Date |
Dec. 31, 2021
|
|
| AssetsNet |
$ 2,021,737
|
|
| Holdings Count | Holding |
36
|
|
| Advisory Fees Paid, Amount |
$ 0
|
|
| InvestmentCompanyPortfolioTurnover |
19.00%
|
|
| Additional Fund Statistics [Text Block] |
Total Net Assets | $2,021,737 |
|---|
# of Portfolio Holdings | 36 |
|---|
Portfolio Turnover Rate | 19% |
|---|
Total Advisory Fees Paid (Net of Waivers) | $0 |
|---|
|
|
| Holdings [Text Block] |
Industry Weightings (% of total investments)Value | Value |
|---|
OtherFootnote Reference1 | 4.7% | Health Care Providers & Services | 6.1% | Health Care Technology | 7.8% | Health Care Equipment & Supplies | 13.3% | Pharmaceuticals | 15.4% | Life Sciences Tools & Services | 20.0% | Biotechnology | 32.7% |
| Footnote | Description | Footnote1 | Industries and/or investment types representing less than 5% of total investments. |
Top Ten Holdings (% of total investments)Footnote ReferenceaEli Lilly & Co. | 8.1% | Argenx SE | 7.8% | Exact Sciences Corp. | 6.1% | UnitedHealth Group, Inc. | 5.4% | Thermo Fisher Scientific, Inc. | 4.7% | Intuitive Surgical, Inc. | 4.5% | Vertex Pharmaceuticals, Inc. | 4.0% | Alnylam Pharmaceuticals, Inc. | 3.9% | Align Technology, Inc. | 3.9% | Inspire Medical Systems, Inc. | 3.6% | Total | 52.0% |
| Footnote | Description | Footnotea | Excluding cash equivalents. |
|
|
| Material Fund Change [Text Block] |
|
|
| Updated Prospectus Web Address |
<span style="box-sizing: border-box; color: rgb(0, 0, 0); display: inline; flex-wrap: nowrap; font-size: 10.6667px; font-weight: 400; grid-area: auto; line-height: 16px; margin: 0px; overflow: visible; text-align: left;">www.morganstanley.com/im/shareholderreports</span>
|
|
| C000233002 |
|
|
| Shareholder Report [Line Items] |
|
|
| Fund Name |
Morgan Stanley Institutional Fund, Inc. - Vitality Portfolio
|
|
| Class Name |
Class I
|
|
| Trading Symbol |
MSVDX
|
|
| Annual or Semi-Annual Statement [Text Block] |
This annual shareholder report contains important information about Morgan Stanley Institutional Fund, Inc. - Vitality Portfolio for the period of January 1, 2024 to December 31, 2024.
|
|
| Shareholder Report Annual or Semi-Annual |
Annual Shareholder Report
|
|
| Additional Information [Text Block] |
You can find additional information about the Fund at www.morganstanley.com/im/shareholderreports. You can also request this information by contacting us at 1-800-869-6397.
|
|
| Additional Information Phone Number |
1-800-869-6397
|
|
| Additional Information Website |
<span style="box-sizing: border-box; color: rgb(0, 0, 0); display: inline; flex-wrap: nowrap; font-size: 10.6667px; font-weight: 400; grid-area: auto; line-height: 16px; margin: 0px; overflow: visible; text-align: left;">www.morganstanley.com/im/shareholderreports</span>
|
|
| Expenses [Text Block] |
What were the Fund costs for the last year?(based on a hypothetical $10,000 investment) Class Name | Costs of a $10,000 investment | Costs paid as a percentage of a $10,000 investment |
|---|
Class I | $90 | 0.94% |
|---|
|
|
| Expenses Paid, Amount |
$ 90
|
|
| Expense Ratio, Percent |
0.94%
|
|
| Factors Affecting Performance [Text Block] |
How did the Fund perform last year and what affected its performance?Key contributors to (↑) and detractors from (↓) performance, relative to the Russell 3000® Health Care Net Index: ↓ Stock selection and average overweight in life sciences tools and services, where a life sciences and technology platform was the largest detractor ↓ Stock selection in biotechnology, led lower by a clinical stage biotechnology company that is a leader in gene editing technology ↓ Stock selection in health care services, where the greatest detractor was a health care services platform offering physicians a value-based care model for their Medicare Advantage patients ↑ Average underweight and stock selection in managed health care, where a diversified health care company was the largest contributor ↑ Stock selection in pharmaceuticals, led by a developer of mental health illness therapies ↑ Stock selection and average overweight in health care technology, led by a digital platform for U.S. medical professionals |
|
| Line Graph [Table Text Block] |
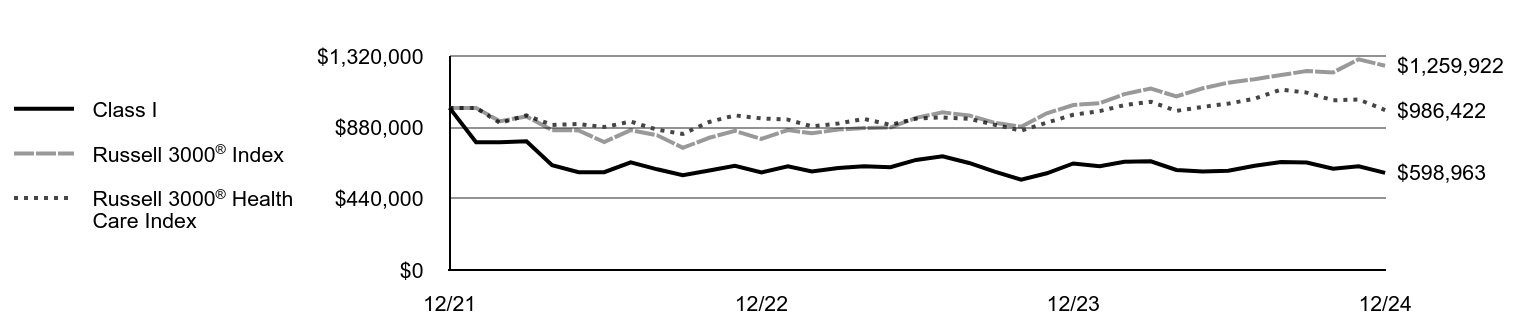 | Class I | Russell 3000® Index | Russell 3000® Health Care Index |
|---|
12/21 | $1,000,000 | $1,000,000 | $1,000,000 |
|---|
1/22 | $788,000 | $1,000,000 | $1,000,000 |
|---|
2/22 | $788,000 | $917,457 | $907,372 |
|---|
3/22 | $794,000 | $947,215 | $953,379 |
|---|
4/22 | $646,000 | $862,210 | $894,820 |
|---|
5/22 | $603,000 | $861,054 | $900,867 |
|---|
6/22 | $603,000 | $789,019 | $881,611 |
|---|
7/22 | $664,000 | $863,044 | $915,688 |
|---|
8/22 | $621,000 | $830,835 | $865,423 |
|---|
9/22 | $585,000 | $753,793 | $839,130 |
|---|
10/22 | $614,000 | $815,608 | $913,114 |
|---|
11/22 | $643,000 | $858,180 | $953,565 |
|---|
12/22 | $601,613 | $807,931 | $934,961 |
|---|
1/23 | $639,729 | $863,575 | $927,595 |
|---|
2/23 | $607,794 | $843,391 | $885,782 |
|---|
3/23 | $629,427 | $865,943 | $903,354 |
|---|
4/23 | $639,729 | $875,169 | $931,932 |
|---|
5/23 | $633,548 | $878,574 | $895,638 |
|---|
6/23 | $678,875 | $938,567 | $933,380 |
|---|
7/23 | $701,538 | $972,212 | $941,516 |
|---|
8/23 | $660,332 | $953,445 | $932,286 |
|---|
9/23 | $606,764 | $908,028 | $896,189 |
|---|
10/23 | $557,316 | $883,958 | $859,316 |
|---|
11/23 | $596,462 | $966,385 | $908,767 |
|---|
12/23 | $657,241 | $1,017,644 | $957,414 |
|---|
1/24 | $639,729 | $1,028,922 | $980,128 |
|---|
2/24 | $667,543 | $1,084,618 | $1,016,888 |
|---|
3/24 | $670,633 | $1,119,605 | $1,037,863 |
|---|
4/24 | $617,065 | $1,070,341 | $981,651 |
|---|
5/24 | $607,794 | $1,120,911 | $1,006,202 |
|---|
6/24 | $611,914 | $1,155,612 | $1,026,170 |
|---|
7/24 | $642,819 | $1,177,093 | $1,056,953 |
|---|
8/24 | $665,483 | $1,202,717 | $1,113,025 |
|---|
9/24 | $663,422 | $1,227,596 | $1,094,200 |
|---|
10/24 | $624,276 | $1,218,581 | $1,046,893 |
|---|
11/24 | $639,729 | $1,299,646 | $1,051,566 |
|---|
12/24 | $598,963 | $1,259,922 | $986,422 |
|---|
|
|
| Average Annual Return [Table Text Block] |
AATR | 1 Year | Since 12/31/21
(Inception) |
|---|
Class I | (8.87)% | (15.71)% |
|---|
Russell 3000® Index | 23.81% | 8.01% |
|---|
Russell 3000® Health Care Index | 3.03% | (0.45)% |
|---|
|
|
| Performance Inception Date |
Dec. 31, 2021
|
|
| AssetsNet |
$ 2,021,737
|
|
| Holdings Count | Holding |
36
|
|
| Advisory Fees Paid, Amount |
$ 0
|
|
| InvestmentCompanyPortfolioTurnover |
19.00%
|
|
| Additional Fund Statistics [Text Block] |
Total Net Assets | $2,021,737 |
|---|
# of Portfolio Holdings | 36 |
|---|
Portfolio Turnover Rate | 19% |
|---|
Total Advisory Fees Paid (Net of Waivers) | $0 |
|---|
|
|
| Holdings [Text Block] |
Industry Weightings (% of total investments)Value | Value |
|---|
OtherFootnote Reference1 | 4.7% | Health Care Providers & Services | 6.1% | Health Care Technology | 7.8% | Health Care Equipment & Supplies | 13.3% | Pharmaceuticals | 15.4% | Life Sciences Tools & Services | 20.0% | Biotechnology | 32.7% |
| Footnote | Description | Footnote1 | Industries and/or investment types representing less than 5% of total investments. |
Top Ten Holdings (% of total investments)Footnote ReferenceaEli Lilly & Co. | 8.1% | Argenx SE | 7.8% | Exact Sciences Corp. | 6.1% | UnitedHealth Group, Inc. | 5.4% | Thermo Fisher Scientific, Inc. | 4.7% | Intuitive Surgical, Inc. | 4.5% | Vertex Pharmaceuticals, Inc. | 4.0% | Alnylam Pharmaceuticals, Inc. | 3.9% | Align Technology, Inc. | 3.9% | Inspire Medical Systems, Inc. | 3.6% | Total | 52.0% |
| Footnote | Description | Footnotea | Excluding cash equivalents. |
|
|
| Material Fund Change [Text Block] |
|
|
| Updated Prospectus Web Address |
<span style="box-sizing: border-box; color: rgb(0, 0, 0); display: inline; flex-wrap: nowrap; font-size: 10.6667px; font-weight: 400; grid-area: auto; line-height: 16px; margin: 0px; overflow: visible; text-align: left;">www.morganstanley.com/im/shareholderreports</span>
|
|
| C000233005 |
|
|
| Shareholder Report [Line Items] |
|
|
| Fund Name |
Morgan Stanley Institutional Fund, Inc. - Vitality Portfolio
|
|
| Class Name |
Class R6
|
|
| Trading Symbol |
MSVOX
|
|
| Annual or Semi-Annual Statement [Text Block] |
This annual shareholder report contains important information about Morgan Stanley Institutional Fund, Inc. - Vitality Portfolio for the period of January 1, 2024 to December 31, 2024.
|
|
| Shareholder Report Annual or Semi-Annual |
Annual Shareholder Report
|
|
| Additional Information [Text Block] |
You can find additional information about the Fund at www.morganstanley.com/im/shareholderreports. You can also request this information by contacting us at 1-800-869-6397.
|
|
| Additional Information Phone Number |
1-800-869-6397
|
|
| Additional Information Website |
<span style="box-sizing: border-box; color: rgb(0, 0, 0); display: inline; flex-wrap: nowrap; font-size: 10.6667px; font-weight: 400; grid-area: auto; line-height: 16px; margin: 0px; overflow: visible; text-align: left;">www.morganstanley.com/im/shareholderreports</span>
|
|
| Expenses [Text Block] |
What were the Fund costs for the last year?(based on a hypothetical $10,000 investment) Class Name | Costs of a $10,000 investment | Costs paid as a percentage of a $10,000 investment |
|---|
Class R6 | $85 | 0.89% |
|---|
|
|
| Expenses Paid, Amount |
$ 85
|
|
| Expense Ratio, Percent |
0.89%
|
|
| Factors Affecting Performance [Text Block] |
How did the Fund perform last year and what affected its performance?Key contributors to (↑) and detractors from (↓) performance, relative to the Russell 3000® Health Care Net Index: ↓ Stock selection and average overweight in life sciences tools and services, where a life sciences and technology platform was the largest detractor ↓ Stock selection in biotechnology, led lower by a clinical stage biotechnology company that is a leader in gene editing technology ↓ Stock selection in health care services, where the greatest detractor was a health care services platform offering physicians a value-based care model for their Medicare Advantage patients ↑ Average underweight and stock selection in managed health care, where a diversified health care company was the largest contributor ↑ Stock selection in pharmaceuticals, led by a developer of mental health illness therapies ↑ Stock selection and average overweight in health care technology, led by a digital platform for U.S. medical professionals |
|
| Line Graph [Table Text Block] |
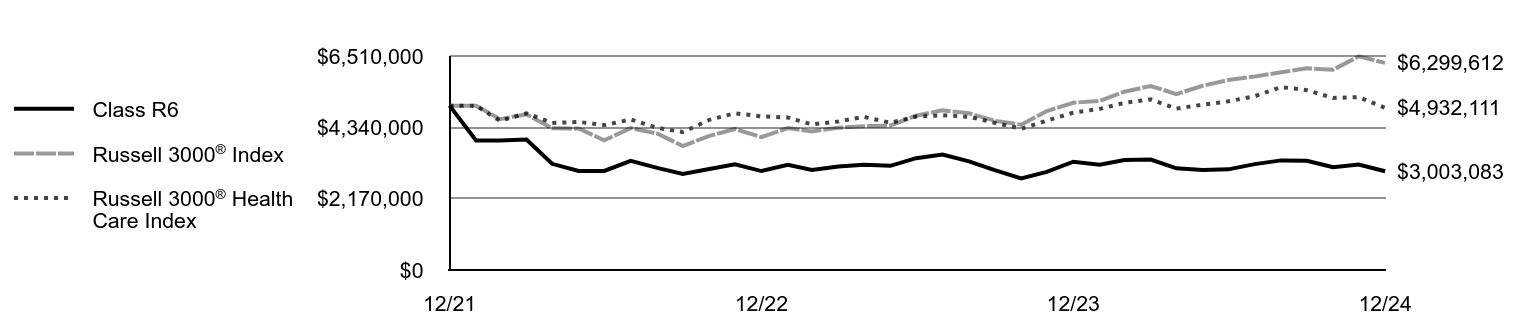 | Class R6 | Russell 3000® Index | Russell 3000® Health Care Index |
|---|
12/21 | $5,000,000 | $5,000,000 | $5,000,000 |
|---|
1/22 | $3,940,000 | $5,000,000 | $5,000,000 |
|---|
2/22 | $3,940,000 | $4,587,283 | $4,536,861 |
|---|
3/22 | $3,970,000 | $4,736,077 | $4,766,894 |
|---|
4/22 | $3,230,000 | $4,311,050 | $4,474,101 |
|---|
5/22 | $3,015,000 | $4,305,270 | $4,504,337 |
|---|
6/22 | $3,015,000 | $3,945,097 | $4,408,054 |
|---|
7/22 | $3,320,000 | $4,315,218 | $4,578,438 |
|---|
8/22 | $3,105,000 | $4,154,177 | $4,327,117 |
|---|
9/22 | $2,925,000 | $3,768,964 | $4,195,651 |
|---|
10/22 | $3,070,000 | $4,078,042 | $4,565,570 |
|---|
11/22 | $3,215,000 | $4,290,900 | $4,767,824 |
|---|
12/22 | $3,009,649 | $4,039,653 | $4,674,807 |
|---|
1/23 | $3,200,329 | $4,317,875 | $4,637,974 |
|---|
2/23 | $3,045,724 | $4,216,955 | $4,428,911 |
|---|
3/23 | $3,148,794 | $4,329,713 | $4,516,770 |
|---|
4/23 | $3,200,329 | $4,375,843 | $4,659,658 |
|---|
5/23 | $3,169,408 | $4,392,868 | $4,478,189 |
|---|
6/23 | $3,401,316 | $4,692,837 | $4,666,900 |
|---|
7/23 | $3,514,693 | $4,861,060 | $4,707,578 |
|---|
8/23 | $3,303,399 | $4,767,224 | $4,661,431 |
|---|
9/23 | $3,035,417 | $4,540,141 | $4,480,944 |
|---|
10/23 | $2,788,048 | $4,419,788 | $4,296,581 |
|---|
11/23 | $2,983,882 | $4,831,926 | $4,543,835 |
|---|
12/23 | $3,293,092 | $5,088,220 | $4,787,072 |
|---|
1/24 | $3,205,483 | $5,144,611 | $4,900,641 |
|---|
2/24 | $3,344,627 | $5,423,092 | $5,084,442 |
|---|
3/24 | $3,360,088 | $5,598,026 | $5,189,317 |
|---|
4/24 | $3,092,105 | $5,351,704 | $4,908,256 |
|---|
5/24 | $3,045,724 | $5,604,556 | $5,031,012 |
|---|
6/24 | $3,061,184 | $5,778,058 | $5,130,849 |
|---|
7/24 | $3,220,943 | $5,885,467 | $5,284,765 |
|---|
8/24 | $3,334,320 | $6,013,585 | $5,565,123 |
|---|
9/24 | $3,324,013 | $6,137,982 | $5,471,002 |
|---|
10/24 | $3,128,180 | $6,092,907 | $5,234,464 |
|---|
11/24 | $3,205,483 | $6,498,232 | $5,257,829 |
|---|
12/24 | $3,003,083 | $6,299,612 | $4,932,111 |
|---|
|
|
| Average Annual Return [Table Text Block] |
AATR | 1 Year | Since 12/31/21
(Inception) |
|---|
Class R6 | (8.81)% | (15.63)% |
|---|
Russell 3000® Index | 23.81% | 8.01% |
|---|
Russell 3000® Health Care Index | 3.03% | (0.45)% |
|---|
|
|
| Performance Inception Date |
Dec. 31, 2021
|
|
| AssetsNet |
$ 2,021,737
|
|
| Holdings Count | Holding |
36
|
|
| Advisory Fees Paid, Amount |
$ 0
|
|
| InvestmentCompanyPortfolioTurnover |
19.00%
|
|
| Additional Fund Statistics [Text Block] |
Total Net Assets | $2,021,737 |
|---|
# of Portfolio Holdings | 36 |
|---|
Portfolio Turnover Rate | 19% |
|---|
Total Advisory Fees Paid (Net of Waivers) | $0 |
|---|
|
|
| Holdings [Text Block] |
Industry Weightings (% of total investments)Value | Value |
|---|
OtherFootnote Reference1 | 4.7% | Health Care Providers & Services | 6.1% | Health Care Technology | 7.8% | Health Care Equipment & Supplies | 13.3% | Pharmaceuticals | 15.4% | Life Sciences Tools & Services | 20.0% | Biotechnology | 32.7% |
| Footnote | Description | Footnote1 | Industries and/or investment types representing less than 5% of total investments. |
Top Ten Holdings (% of total investments)Footnote ReferenceaEli Lilly & Co. | 8.1% | Argenx SE | 7.8% | Exact Sciences Corp. | 6.1% | UnitedHealth Group, Inc. | 5.4% | Thermo Fisher Scientific, Inc. | 4.7% | Intuitive Surgical, Inc. | 4.5% | Vertex Pharmaceuticals, Inc. | 4.0% | Alnylam Pharmaceuticals, Inc. | 3.9% | Align Technology, Inc. | 3.9% | Inspire Medical Systems, Inc. | 3.6% | Total | 52.0% |
| Footnote | Description | Footnotea | Excluding cash equivalents. |
|
|
| Material Fund Change [Text Block] |
|
|
| Updated Prospectus Web Address |
<span style="box-sizing: border-box; color: rgb(0, 0, 0); display: inline; flex-wrap: nowrap; font-size: 10.6667px; font-weight: 400; grid-area: auto; line-height: 16px; margin: 0px; overflow: visible; text-align: left;">www.morganstanley.com/im/shareholderreports</span>
|
|