Pay vs Performance Disclosure - USD ($)
|
12 Months Ended |
May 31, 2025 |
May 31, 2024 |
May 31, 2023 |
May 31, 2022 |
May 31, 2021 |
| Pay vs Performance Disclosure |
|
|
|
|
|
| Pay vs Performance Disclosure, Table |
| | | | | | | | | | | | | | | | | | | | | | | | | | | | | | | | | | YEAR | SUMMARY COMPENSATION TABLE FOR MR.HILL(1)(2) | COMPENSATION ACTUALLY PAID TO MR. HILL(1)(3)(4) | SUMMARY COMPENSATION TABLE TOTAL FOR MR. DONAHOE(1)(5) | COMPENSATION ACTUALLY PAID TO MR. DONAHOE(1)(4)(6) | AVERAGE SUMMARY COMPENSATION TABLE TOTAL FOR NON-CEO NEOs(1)(7) | AVERAGE COMPENSATION ACTUALLY PAID TO NON-CEO NEOs(1)(4)(8) | VALUE OF INITIAL FIXED $100
INVESTMENT BASED ON | NET INCOME(10) (IN MILLIONS) | ADJUSTED REVENUE(11) (IN MILLIONS) | TOTAL SHAREHOLDER RETURN(9) | PEER GROUP TOTAL SHAREHOLDER RETURN(9) | | 2025 | $26,018,068 | $17,010,238 | $28,442,712 | $(10,924,243) | $12,135,422 | $2,798,172 | $65.09 | $81.16 | $3,201 | $46,350 | | 2024 | — | — | $29,184,701 | $13,158,408 | $9,804,553 | $5,812,537 | $100.23 | $124.83 | $5,700 | $51,656 | | 2023 | — | — | $32,789,885 | $29,391,856 | $10,117,055 | $7,259,680 | $109.51 | $116.84 | $5,070 | $52,593 | | 2022 | — | — | $28,838,060 | $19,617,425 | $9,185,111 | $7,482,733 | $122.26 | $120.40 | $6,046 | $47,406 | | 2021 | — | — | $32,920,708 | $77,444,844 | $17,107,315 | $28,986,814 | $139.58 | $141.30 | $5,727 | $43,769 |
|
|
|
|
|
| Company Selected Measure Name |
Adjusted Revenue
|
|
|
|
|
| Named Executive Officers, Footnote |
The following NEOs are included in the table above: | | | | | | | | | | YEAR | CEO | Non-CEO NEOs | | 2025 | Elliott Hill, John Donahoe II | Matthew Friend, Robert Leinwand, Ann Miller, Craig Williams, Monique Matheson, and Heidi O'Neill | | 2024 | John Donahoe II | Matthew Friend, Heidi O'Neill, Mark Parker, and Craig Williams | | 2023 | John Donahoe II | Matthew Friend, Andrew Campion, Heidi O'Neill, and Mark Parker | | 2022 | John Donahoe II | Matthew Friend, Andrew Campion, Heidi O'Neill, and Mark Parker | | 2021 | John Donahoe II | Matthew Friend, Andrew Campion, Heidi O'Neill, and Mark Parker |
|
|
|
|
|
| Peer Group Issuers, Footnote |
Peer group total shareholder return ("TSR") uses the Dow Jones U.S. Footwear Index, which the Company also uses in the stock performance graph required by Item 201(e) of Regulation S-K included in the Company's Annual Report on Form 10-K for fiscal 2025. These comparisons assume $100 (including reinvested dividends) was invested for the period starting May 31, 2020 through the end of the listed fiscal year in (a) the Company and (b) the Dow Jones U.S. Footwear Index, respectively. Historical stock performance is not necessarily indicative of future stock performance.
|
|
|
|
|
| Adjustment To PEO Compensation, Footnote |
The dollar amounts reported in the "Compensation Actually Paid to Mr. Hill" column have been calculated in accordance with Item 402(v) of Regulation S-K and do not reflect compensation actually earned, realized, or received by Mr. Hill. These amounts reflect the amount set forth in the "Total" column of the "Summary Compensation Table" for each fiscal year presented, with certain adjustments as described in the table below, in accordance with the requirements of Item 402(v) of Regulation S-K: | | | | | | | | | | | 2025 | | Summary Compensation Table ("SCT") total for Mr. Hill | $26,018,068 | | Deduction for amounts reported under the "Stock Awards" column in the SCT | $14,887,893 | | Deduction for amounts reported under the "Option Awards" column in the SCT | $5,832,678 | | Total deductions from SCT | $20,720,571 | | Year end fair value of equity awards | $11,583,480 | | Value of dividends on stock awards | $129,261 | | Total adjustments | $11,712,740 | | Compensation actually paid | $17,010,238 |
| | | | | | | | | | | 2025 | | Summary Compensation Table ("SCT") total for Mr. Donahoe | $28,442,712 | | Deduction for amounts reported under the "Stock Awards" column in the SCT | $15,348,756 | | Deduction for amounts reported under the "Option Awards" column in the SCT | $7,239,086 | | Total deductions from SCT | $22,587,842 | | Year end fair value of equity awards | $772,498 | | Change in fair value of outstanding and unvested equity awards | $(5,677,419) | | Change in fair value of equity awards granted in prior years that vested in the year | $(2,771,387) | | Fair value as of the prior fiscal year of equity awards granted in prior years that failed to meet vesting conditions in the year | $(9,451,544) | | Value of dividends on stock awards | $348,739 | | Total adjustments | $(16,779,113) | | Compensation actually paid | $(10,924,243) |
|
|
|
|
|
| Non-PEO NEO Average Total Compensation Amount |
$ 12,135,422
|
$ 9,804,553
|
$ 10,117,055
|
$ 9,185,111
|
$ 17,107,315
|
| Non-PEO NEO Average Compensation Actually Paid Amount |
$ 2,798,172
|
5,812,537
|
7,259,680
|
7,482,733
|
28,986,814
|
| Adjustment to Non-PEO NEO Compensation Footnote |
The dollar amounts reported in the "Average Compensation Actually Paid to Non-CEO NEOs" column have been calculated in accordance with Item 402(v) of Regulation S-K and do not reflect compensation actually earned, realized, or received by the non-CEO NEOs. These amounts reflect the average of the amounts set forth in the "Total" column of the "Summary Compensation Table" for each fiscal year presented for the applicable non-CEO NEOs, with certain adjustments as described in the table below, in accordance with the requirements of Item 402(v) of Regulation S-K: | | | | | | | | | | | 2025 | | Average Summary Compensation Table total for non-CEO NEOs | $12,135,422 | | Deduction for amounts reported under the "Stock Awards" column in the SCT | $8,406,828 | | Deduction for amounts reported under the "Option Awards" column in the SCT | $2,582,963 | | Total deductions from SCT | $10,989,791 | | Year end fair value of equity awards | $5,825,996 | | Change in fair value of outstanding and unvested equity awards | $(3,505,896) | | Change in fair value of equity awards granted in prior years that vested in the year | $(805,227) | | Value of dividends on stock awards | $137,667 | | Total adjustments | $1,652,540 | | Average compensation actually paid | $2,798,172 |
|
|
|
|
|
| Compensation Actually Paid vs. Total Shareholder Return |
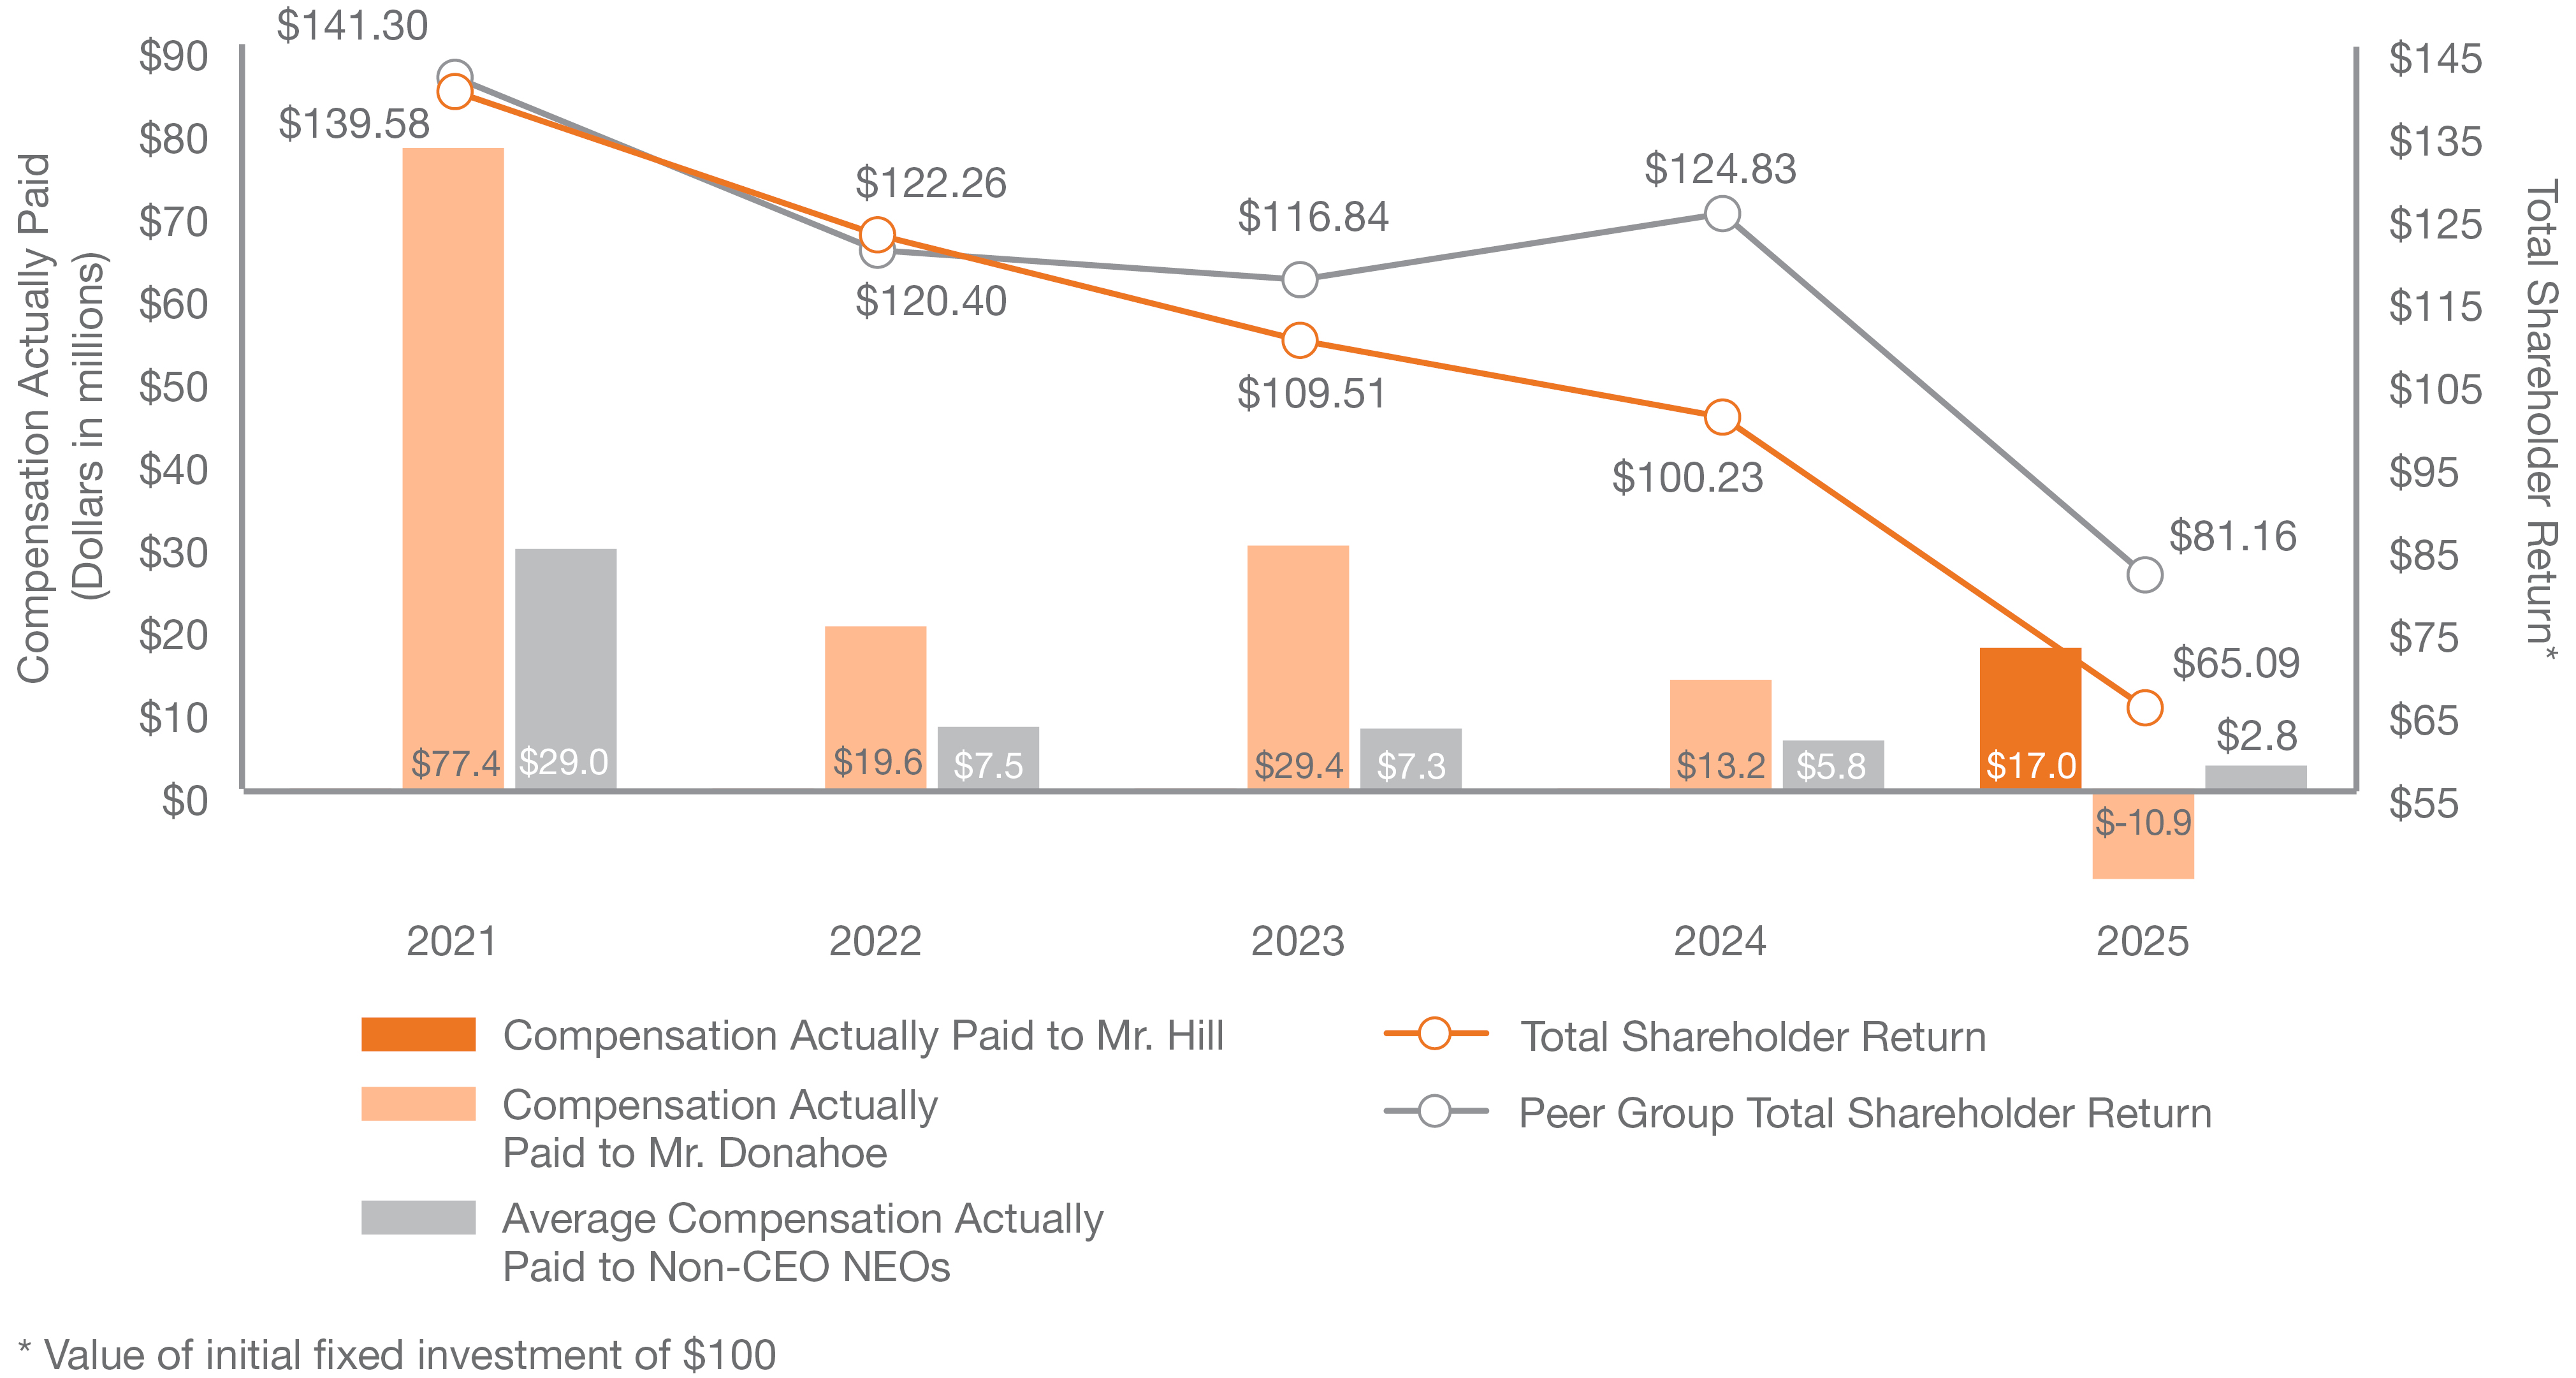
CAP VERSUS COMPANY TSR & PEER GROUP TSR
|
|
|
|
|
| Compensation Actually Paid vs. Net Income |
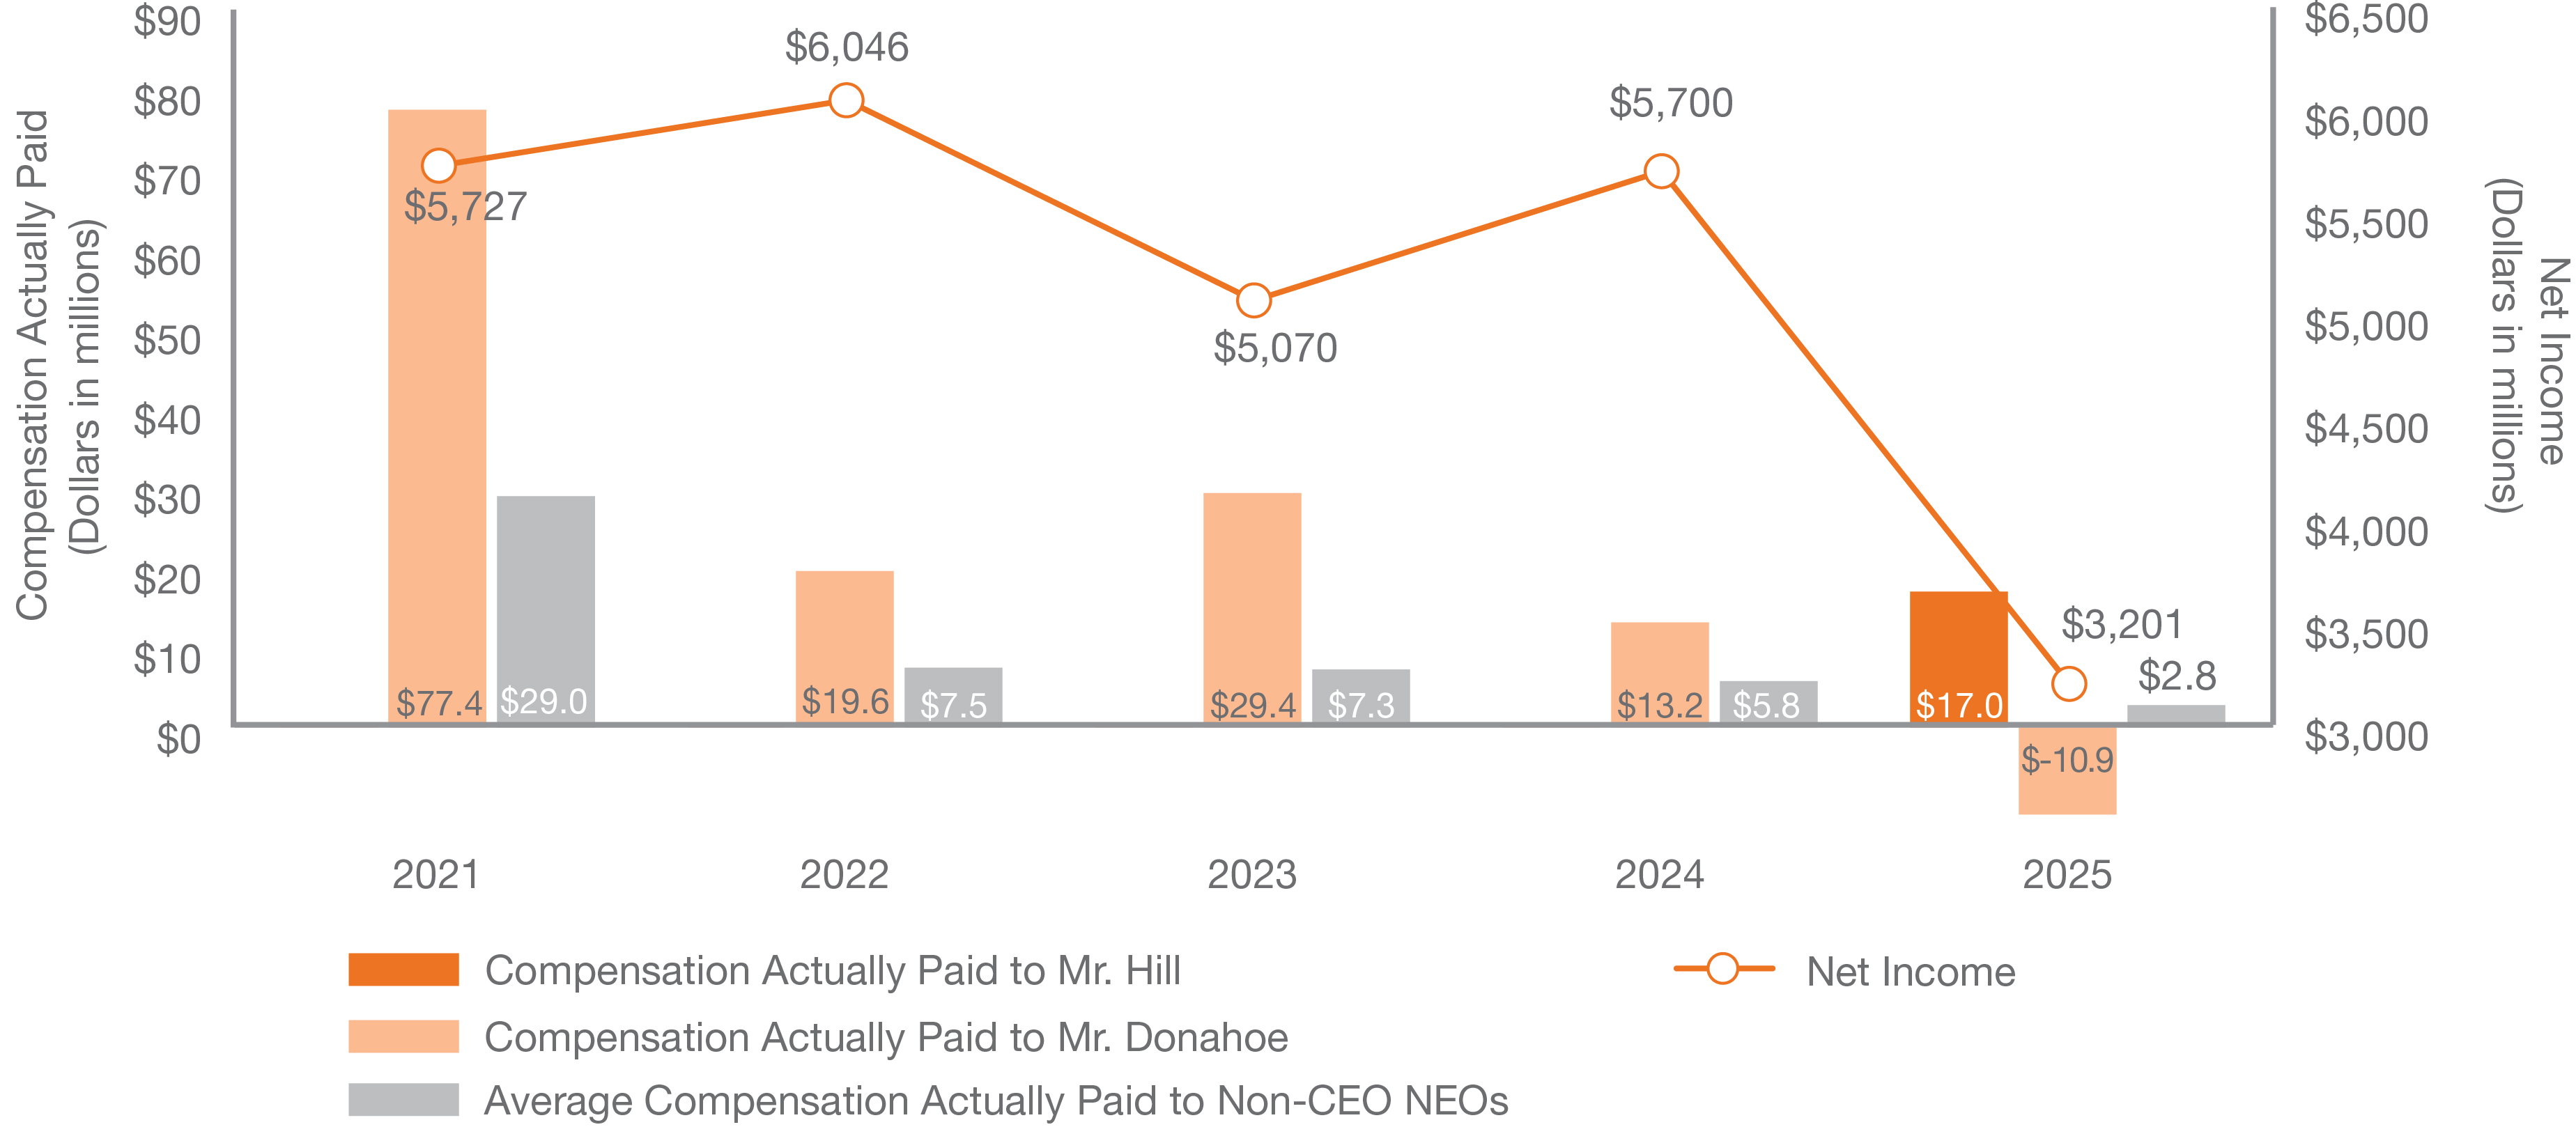
CAP VERSUS NET INCOME
|
|
|
|
|
| Compensation Actually Paid vs. Company Selected Measure |
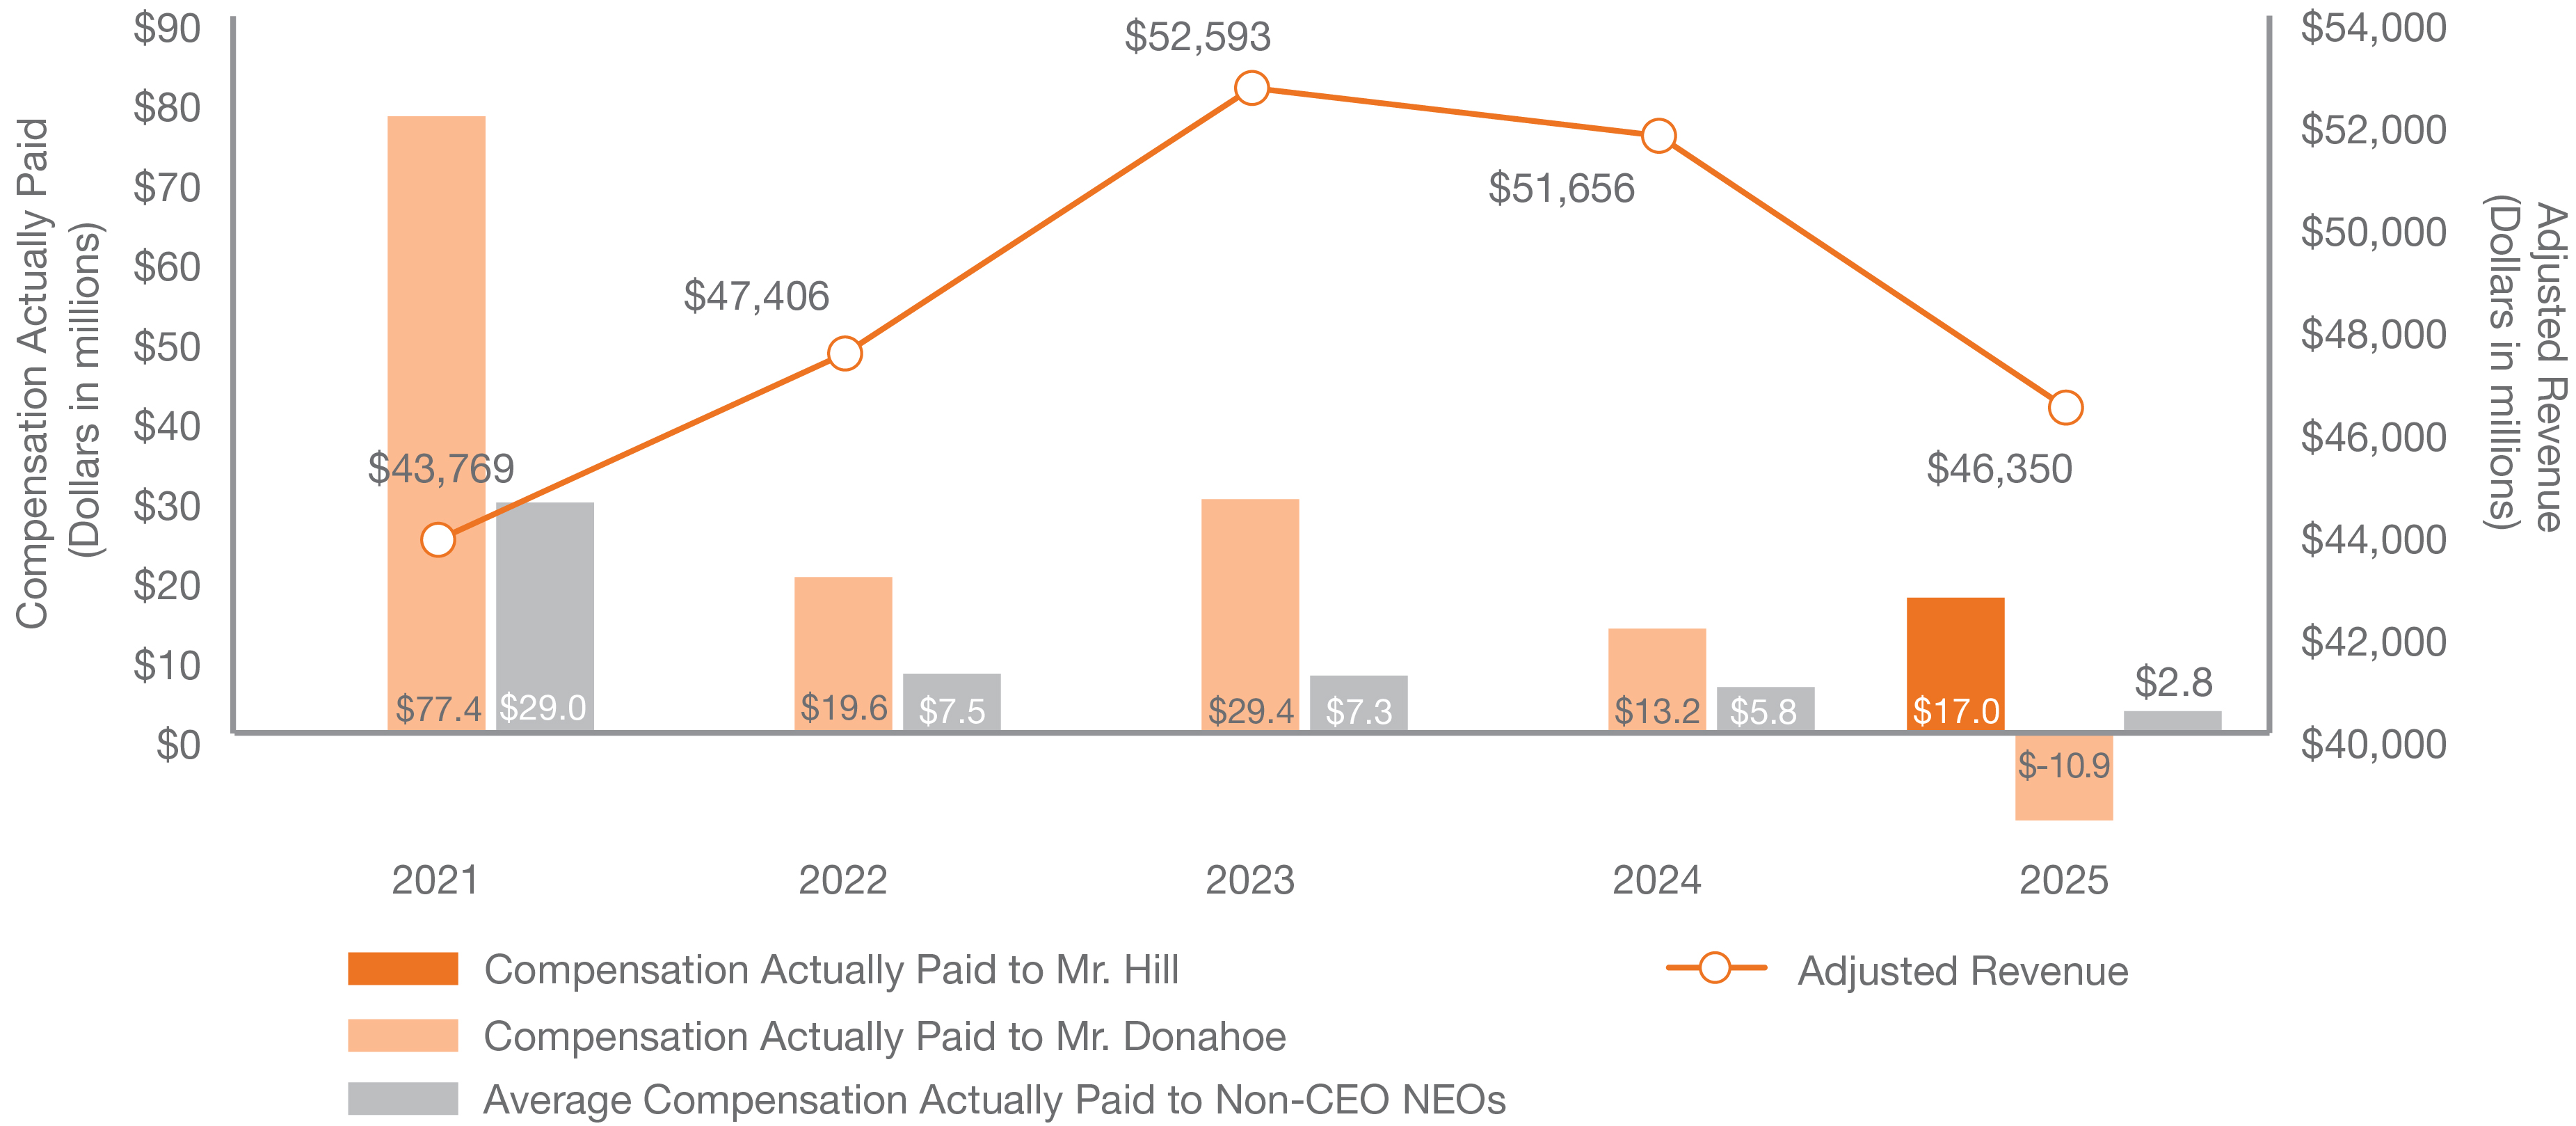
CAP VERSUS ADJUSTED REVENUE
|
|
|
|
|
| Total Shareholder Return Vs Peer Group |
CAP VERSUS COMPANY TSR & PEER GROUP TSR
|
|
|
|
|
| Tabular List, Table |
| | | | Adjusted Revenue | | Adjusted EBIT | | Stock price |
|
|
|
|
|
| Total Shareholder Return Amount |
$ 65.09
|
100.23
|
109.51
|
122.26
|
139.58
|
| Peer Group Total Shareholder Return Amount |
81.16
|
124.83
|
116.84
|
120.40
|
141.30
|
| Net Income (Loss) |
$ 3,201,000,000
|
$ 5,700,000,000
|
$ 5,070,000,000
|
$ 6,046,000,000
|
$ 5,727,000,000
|
| Company Selected Measure Amount |
46,350,000,000
|
51,656,000,000
|
52,593,000,000
|
47,406,000,000
|
43,769,000,000
|
| PEO Name |
|
John Donahoe II
|
John Donahoe II
|
John Donahoe II
|
John Donahoe II
|
| Additional 402(v) Disclosure |
This disclosure has been prepared in accordance with Item 402(v) of Regulation S-K under the Exchange Act and does not necessarily reflect how the Compensation Committee evaluates compensation decisions in light of Company or individual performance. The Compensation Committee did not consider the pay versus performance disclosure below in making its compensation decisions for any of the fiscal years shown. For discussion of how the Compensation Committee seeks to align pay with performance when making compensation decisions, please review the section above titled "Compensation Discussion and Analysis". The following table sets forth compensation information of our CEO and our non-CEO NEOs and Company performance for the fiscal years listed below, in accordance with Item 402(v) of Regulation S-K. Represents the amount of total compensation reported for our CEO, Mr. Hill, in the "Total" column of the "Summary Compensation Table" for each fiscal year presented.Equity awards included in these amounts are calculated using the following equity valuations: Stock option grant date fair values are calculated based on the Black-Scholes option pricing model as of the grant date; adjustments have been made using stock option fair values as of each measurement date using the stock price as of the measurement date and updated assumptions (i.e., term, volatility, dividend yield, risk free rates) as of the measurement date. PSU grant date fair values are calculated using a Monte Carlo simulation based on the probable outcome of the performance condition as of the grant date; adjustments have been made using a revised Monte Carlo valuation as of fiscal year end. RSU grant date fair values are calculated using the stock price as of the grant date; adjustments have been made using the stock price as of fiscal year end and as of each vesting date.Represents the amount of total compensation reported for our Former CEO, Mr. Donahoe, in the "Total" column of the "Summary Compensation Table" for each fiscal year presented.Represents the average of the amounts of total compensation reported for our non-CEO NEOs, as a group, in the "Total" column of the "Summary Compensation Table" for each fiscal year presented.Reflects net income calculated in accordance with generally accepted accounting principles ("GAAP") in the Company's Consolidated Statements of Income included in the Company's Annual Reports on Form 10-K for the applicable fiscal year.The following charts show graphically the relationships over the past five fiscal years of the CAP amounts for our CEO and non-CEO NEOs as compared to our cumulative TSR, peer group TSR, GAAP net income, and Adjusted Revenue as well as the relationship between TSR and peer group TSR. The following table lists the three financial performance measures that, in the Company's assessment, represent the most important performance measures used to link CAP for our NEOs to Company performance for fiscal 2025.
|
|
|
|
|
| Measure:: 1 |
|
|
|
|
|
| Pay vs Performance Disclosure |
|
|
|
|
|
| Name |
Adjusted Revenue
|
|
|
|
|
| Non-GAAP Measure Description |
Represents the most important financial performance measure used to link Company performance to compensation actually paid ("CAP") to our CEO and non-CEO NEOs in fiscal 2025, as required pursuant to Item 402(v) of Regulation S-K. Adjusted Revenue is a non-GAAP financial measure calculated based on GAAP revenue excluding the impact of acquisitions and divestitures; changes in accounting principles; unanticipated restructurings; unanticipated exchange rate fluctuations; other extraordinary, unusual, or infrequently occurring items; and for fiscal 2021, the unanticipated impact from Nike Virtual Studios and RTFKT. We may determine a different financial performance measure to be the most important financial performance measure in future years.
|
|
|
|
|
| Measure:: 2 |
|
|
|
|
|
| Pay vs Performance Disclosure |
|
|
|
|
|
| Name |
Adjusted EBIT
|
|
|
|
|
| Measure:: 3 |
|
|
|
|
|
| Pay vs Performance Disclosure |
|
|
|
|
|
| Name |
Stock price
|
|
|
|
|
| Elliott Hill [Member] |
|
|
|
|
|
| Pay vs Performance Disclosure |
|
|
|
|
|
| PEO Total Compensation Amount |
$ 26,018,068
|
|
|
|
|
| PEO Actually Paid Compensation Amount |
$ 17,010,238
|
|
|
|
|
| PEO Name |
Elliott Hill
|
|
|
|
|
| John Donahoe II [Member] |
|
|
|
|
|
| Pay vs Performance Disclosure |
|
|
|
|
|
| PEO Total Compensation Amount |
$ 28,442,712
|
$ 29,184,701
|
$ 32,789,885
|
$ 28,838,060
|
$ 32,920,708
|
| PEO Actually Paid Compensation Amount |
$ (10,924,243)
|
$ 13,158,408
|
$ 29,391,856
|
$ 19,617,425
|
$ 77,444,844
|
| PEO Name |
John Donahoe II
|
|
|
|
|
| PEO | Elliott Hill [Member] |
|
|
|
|
|
| Pay vs Performance Disclosure |
|
|
|
|
|
| Adjustment to Compensation, Amount |
$ 11,712,740
|
|
|
|
|
| PEO | Elliott Hill [Member] | Aggregate Grant Date Fair Value of Equity Award Amounts Reported in Summary Compensation Table |
|
|
|
|
|
| Pay vs Performance Disclosure |
|
|
|
|
|
| Adjustment To Compensation Amount, Equity Awards |
(20,720,571)
|
|
|
|
|
| PEO | Elliott Hill [Member] | Year-end Fair Value of Equity Awards Granted in Covered Year that are Outstanding and Unvested |
|
|
|
|
|
| Pay vs Performance Disclosure |
|
|
|
|
|
| Adjustment to Compensation, Amount |
11,583,480
|
|
|
|
|
| PEO | Elliott Hill [Member] | Dividends or Other Earnings Paid on Equity Awards not Otherwise Reflected in Total Compensation for Covered Year |
|
|
|
|
|
| Pay vs Performance Disclosure |
|
|
|
|
|
| Adjustment to Compensation, Amount |
129,261
|
|
|
|
|
| PEO | Elliott Hill [Member] | Aggregate Grant Date Fair Value of Equity Award Amounts Reported in Summary Compensation Table, Stock Awards [Member] |
|
|
|
|
|
| Pay vs Performance Disclosure |
|
|
|
|
|
| Adjustment to Compensation, Amount |
(14,887,893)
|
|
|
|
|
| PEO | Elliott Hill [Member] | Aggregate Grant Date Fair Value of Equity Award Amounts Reported in Summary Compensation Table, Option Awards [Member] |
|
|
|
|
|
| Pay vs Performance Disclosure |
|
|
|
|
|
| Adjustment to Compensation, Amount |
(5,832,678)
|
|
|
|
|
| PEO | John Donahoe II [Member] |
|
|
|
|
|
| Pay vs Performance Disclosure |
|
|
|
|
|
| Adjustment to Compensation, Amount |
(16,779,113)
|
|
|
|
|
| PEO | John Donahoe II [Member] | Aggregate Grant Date Fair Value of Equity Award Amounts Reported in Summary Compensation Table |
|
|
|
|
|
| Pay vs Performance Disclosure |
|
|
|
|
|
| Adjustment To Compensation Amount, Equity Awards |
(22,587,842)
|
|
|
|
|
| PEO | John Donahoe II [Member] | Year-end Fair Value of Equity Awards Granted in Covered Year that are Outstanding and Unvested |
|
|
|
|
|
| Pay vs Performance Disclosure |
|
|
|
|
|
| Adjustment to Compensation, Amount |
772,498
|
|
|
|
|
| PEO | John Donahoe II [Member] | Year-over-Year Change in Fair Value of Equity Awards Granted in Prior Years That are Outstanding and Unvested |
|
|
|
|
|
| Pay vs Performance Disclosure |
|
|
|
|
|
| Adjustment to Compensation, Amount |
(5,677,419)
|
|
|
|
|
| PEO | John Donahoe II [Member] | Change in Fair Value as of Vesting Date of Prior Year Equity Awards Vested in Covered Year |
|
|
|
|
|
| Pay vs Performance Disclosure |
|
|
|
|
|
| Adjustment to Compensation, Amount |
(2,771,387)
|
|
|
|
|
| PEO | John Donahoe II [Member] | Prior Year End Fair Value of Equity Awards Granted in Any Prior Year that Fail to Meet Applicable Vesting Conditions During Covered Year |
|
|
|
|
|
| Pay vs Performance Disclosure |
|
|
|
|
|
| Adjustment to Compensation, Amount |
(9,451,544)
|
|
|
|
|
| PEO | John Donahoe II [Member] | Dividends or Other Earnings Paid on Equity Awards not Otherwise Reflected in Total Compensation for Covered Year |
|
|
|
|
|
| Pay vs Performance Disclosure |
|
|
|
|
|
| Adjustment to Compensation, Amount |
348,739
|
|
|
|
|
| PEO | John Donahoe II [Member] | Aggregate Grant Date Fair Value of Equity Award Amounts Reported in Summary Compensation Table, Stock Awards [Member] |
|
|
|
|
|
| Pay vs Performance Disclosure |
|
|
|
|
|
| Adjustment to Compensation, Amount |
(15,348,756)
|
|
|
|
|
| PEO | John Donahoe II [Member] | Aggregate Grant Date Fair Value of Equity Award Amounts Reported in Summary Compensation Table, Option Awards [Member] |
|
|
|
|
|
| Pay vs Performance Disclosure |
|
|
|
|
|
| Adjustment to Compensation, Amount |
(7,239,086)
|
|
|
|
|
| Non-PEO NEO |
|
|
|
|
|
| Pay vs Performance Disclosure |
|
|
|
|
|
| Adjustment to Compensation, Amount |
1,652,540
|
|
|
|
|
| Non-PEO NEO | Aggregate Grant Date Fair Value of Equity Award Amounts Reported in Summary Compensation Table |
|
|
|
|
|
| Pay vs Performance Disclosure |
|
|
|
|
|
| Adjustment To Compensation Amount, Equity Awards |
(10,989,791)
|
|
|
|
|
| Non-PEO NEO | Year-end Fair Value of Equity Awards Granted in Covered Year that are Outstanding and Unvested |
|
|
|
|
|
| Pay vs Performance Disclosure |
|
|
|
|
|
| Adjustment to Compensation, Amount |
5,825,996
|
|
|
|
|
| Non-PEO NEO | Year-over-Year Change in Fair Value of Equity Awards Granted in Prior Years That are Outstanding and Unvested |
|
|
|
|
|
| Pay vs Performance Disclosure |
|
|
|
|
|
| Adjustment to Compensation, Amount |
(3,505,896)
|
|
|
|
|
| Non-PEO NEO | Change in Fair Value as of Vesting Date of Prior Year Equity Awards Vested in Covered Year |
|
|
|
|
|
| Pay vs Performance Disclosure |
|
|
|
|
|
| Adjustment to Compensation, Amount |
(805,227)
|
|
|
|
|
| Non-PEO NEO | Dividends or Other Earnings Paid on Equity Awards not Otherwise Reflected in Total Compensation for Covered Year |
|
|
|
|
|
| Pay vs Performance Disclosure |
|
|
|
|
|
| Adjustment to Compensation, Amount |
137,667
|
|
|
|
|
| Non-PEO NEO | Aggregate Grant Date Fair Value of Equity Award Amounts Reported in Summary Compensation Table, Stock Awards [Member] |
|
|
|
|
|
| Pay vs Performance Disclosure |
|
|
|
|
|
| Adjustment to Compensation, Amount |
(8,406,828)
|
|
|
|
|
| Non-PEO NEO | Aggregate Grant Date Fair Value of Equity Award Amounts Reported in Summary Compensation Table, Option Awards [Member] |
|
|
|
|
|
| Pay vs Performance Disclosure |
|
|
|
|
|
| Adjustment to Compensation, Amount |
$ (2,582,963)
|
|
|
|
|