Pay vs Performance Disclosure - USD ($)
Apr. 26, 2025
Apr. 27, 2024
Apr. 29, 2023
Apr. 30, 2022
Apr. 24, 2021
| Pay Versus Performance | ||||||||||||||||||||||||||||||||
Summary Compensation Table Total for Whittington ($)(2) | Summary Compensation Table Total for Darrow ($)(2) | Compensation Actually Paid to Whittington ($)(3) | Compensation Actually Paid to Darrow ($)(3) | Average Summary Compensation Table Total for Non-PEO NEOs ($)(2) | Average Compensation Actually Paid to Non-PEO NEOs ($)(3) | Value of Initial Fixed $100 Investment Based On:(4) | ||||||||||||||||||||||||||
Year(1) | Total Shareholder Return ($) | Peer Group Total Shareholder Return ($)(5) | Net Income ($000) | Sales ($000)(6) | ||||||||||||||||||||||||||||
| FY 2025 | 6,663,764 | N/A | 9,988,446 | N/A | 1,445,402 | 1,642,794 | 203.90 | 192.81 | 99,556 | 2,109,207 | ||||||||||||||||||||||
| FY 2024 | 5,872,110 | N/A | 7,158,165 | N/A | 1,509,549 | 1,754,668 | 169.85 | 184.06 | 122,626 | 2,047,027 | ||||||||||||||||||||||
| FY 2023 | 5,983,987 | N/A | 6,667,375 | N/A | 1,549,759 | 1,683,115 | 143.95 | 172.75 | 150,664 | 2,349,433 | ||||||||||||||||||||||
| FY 2022 | 5,798,794 | N/A | 3,020,052 | N/A | 1,662,812 | 720,942 | 128.27 | 174.70 | 150,017 | 2,356,811 | ||||||||||||||||||||||
| FY 2021 | N/A | 6,710,425 | N/A | 14,512,272 | 1,755,984 | 3,279,190 | 207.10 | 250.51 | 106,461 | 1,734,244 | ||||||||||||||||||||||
a.FY 2025: Melinda D. Whittington served as the company’s PEO for the entirety of FY 2025 and the company’s other NEOs were: Taylor E. Luebke, Michael A. Leggett, Robert Sundy II, Terrence J. Linz, and Robert G. Lucian.
b.FY 2024: Melinda D. Whittington served as the company's PEO for the entirety of FY 2024 and the company's other NEOs were: Robert G. Lucian, Rebecca M. Reeder, Robert Sundy II, and Michael A. Leggett.
c.FY 2023: Melinda D. Whittington served as the company's PEO for the entirety of FY 2023 and the company's other NEOs were: Robert G. Lucian, Otis S. Sawyer, Michael A. Leggett, and Robert Sundy II.
d.FY 2022: Melinda D. Whittington served as the company's PEO for the entirety of FY 2022 and the company's other NEOs were: Robert G. Lucian, Darrell D. Edwards, Otis S. Sawyer, and Raphael Z. Richmond.
e.FY 2021: Kurt L. Darrow served as the company's PEO for the entirety of FY 2021 and the company's other NEOs were: Melinda D. Whittington, Darrell D. Edwards, Otis S. Sawyer, and Stephen K. Krull.
| CAP Adjustments | ||||||||||||||||||||||||||||||||
| Year | Summary Compensation Table Total ($)(a) | Minus Grant Date Fair Value of Stock Option and Stock Awards Granted in Fiscal Year ($)(b) | Plus Fair Value at Fiscal Year-End of Outstanding and Unvested Stock Option and Stock Awards Granted in Fiscal Year ($)(c) | Plus/(Minus) Change in Fair Value of Outstanding and Unvested Stock Option and Stock Awards Granted in Prior Fiscal Years ($)(d) | Plus/(Minus) Fair Value at Vesting of Stock Option and Stock Awards Granted in Fiscal Year that Vested During Fiscal Year ($)(e) | Plus/(Minus) Change in Fair Value as of Vesting Date of Stock Option and Stock Awards Granted in Prior Years for which Applicable Vesting Conditions Were Satisfied During Fiscal Year ($)(f) | Minus Fair Value as of Prior Fiscal Year-End of Stock Option and Stock Awards Granted in Prior Fiscal Years that Failed to Meet Applicable Vesting Conditions During Fiscal Year ($)(g) | Plus Dollar Value of Dividends or Other Earnings Paid on Stock Awards in Fiscal Year and Prior to Vesting Date ($)(h) | Equals Compensation Actually Paid ($) | |||||||||||||||||||||||
Melinda D. Whittington | ||||||||||||||||||||||||||||||||
| FY 2025 | 6,663,764 | (4,107,199) | 4,609,892 | 1,593,566 | — | 1,139,356 | — | 89,067 | 9,988,446 | |||||||||||||||||||||||
| FY 2024 | 5,872,110 | (3,553,220) | 4,308,474 | 732,296 | — | (257,947) | — | 56,452 | 7,158,165 | |||||||||||||||||||||||
| FY 2023 | 5,983,987 | (3,535,586) | 4,172,324 | 111,389 | — | (84,103) | — | 19,364 | 6,667,375 | |||||||||||||||||||||||
| FY 2022 | 5,798,794 | (2,699,687) | 1,399,838 | (1,115,543) | — | (369,278) | — | 5,928 | 3,020,052 | |||||||||||||||||||||||
Kurt L. Darrow | ||||||||||||||||||||||||||||||||
| FY 2021 | 6,710,425 | (2,855,441) | 5,256,100 | 3,860,777 | — | 1,534,518 | — | 5,893 | 14,512,272 | |||||||||||||||||||||||
Non-PEOs (Average)(i) | ||||||||||||||||||||||||||||||||
| FY 2025 | 1,445,402 | (624,236) | 524,306 | 178,144 | 17,274 | 176,307 | (88,788) | 14,385 | 1,642,794 | |||||||||||||||||||||||
| FY 2024 | 1,509,549 | (698,139) | 845,458 | 100,581 | — | (15,249) | — | 12,468 | 1,754,668 | |||||||||||||||||||||||
| FY 2023 | 1,549,759 | (657,470) | 775,876 | 22,396 | — | (13,725) | — | 6,279 | 1,683,115 | |||||||||||||||||||||||
| FY 2022 | 1,662,812 | (535,139) | 277,482 | (484,233) | — | (201,653) | — | 1,673 | 720,942 | |||||||||||||||||||||||
| FY 2021 | 1,755,984 | (580,383) | 1,068,302 | 770,560 | — | 262,213 | — | 2,514 | 3,279,190 | |||||||||||||||||||||||
b.Represents the grant date fair value of the stock option and stock awards granted during the indicated fiscal year, computed in accordance with the methodology used for financial reporting purposes.
c.Represents the fair value as of the indicated fiscal year-end of the outstanding and unvested option awards and stock awards granted during such fiscal year, computed in accordance with the methodology used for financial reporting purposes and, in the case of performance-based share/unit awards, are valued based on the probable outcome of the underlying performance-based vesting conditions as of the applicable fiscal-year end.
d.Represents the change in fair value during the indicated fiscal year of the outstanding and unvested option awards and stock awards held by the applicable NEO, granted in previous fiscal years, as of the last day of the indicated fiscal year, computed in accordance with the methodology used for financial reporting purposes and, for performance-based share/unit awards, based on the probable outcome of the underlying performance-based vesting conditions as of the last day of the fiscal year.
e.Represents the fair value at vesting of the option awards and stock awards that were granted and vested during the indicated fiscal year, computed in accordance with the methodology used for financial reporting purposes.
f.Represents the change in fair value, measured from the prior fiscal year-end to the vesting date, of each option award and stock award that was granted in a prior fiscal year and which vested during the indicated fiscal year, computed in accordance with the methodology used for financial reporting purposes.
g.Represents the fair value as of the last day of the prior fiscal year of the option award and stock awards that were granted in a prior fiscal year and which failed to meet the applicable vesting conditions in the indicated fiscal year, computed in accordance with the methodology used for financial reporting purposes.
h.Represents the dollar value of any cash dividends or other earnings paid on stock awards in the indicated fiscal year and prior to the vesting date that are not otherwise included in the total compensation for the indicated fiscal year.
i.See footnote 1 above for the non-PEOs included in the average for each year. As discussed above, Ms. Whittington is included in the average for the non-PEOs for FY 2021.
We believe the “Compensation Actually Paid” in each of the years reported above and over the five-year cumulative period are reflective of the Compensation Committee’s philosophy to create and reinforce a pay for performance culture as the “Compensation Actually Paid” fluctuated year-over-year, primarily due to our stock performance and our varying levels of achievement against pre-established performance goals under our MIP and long-term equity incentive program, including sales, operating margin, operating cash flow, and relative TSR.
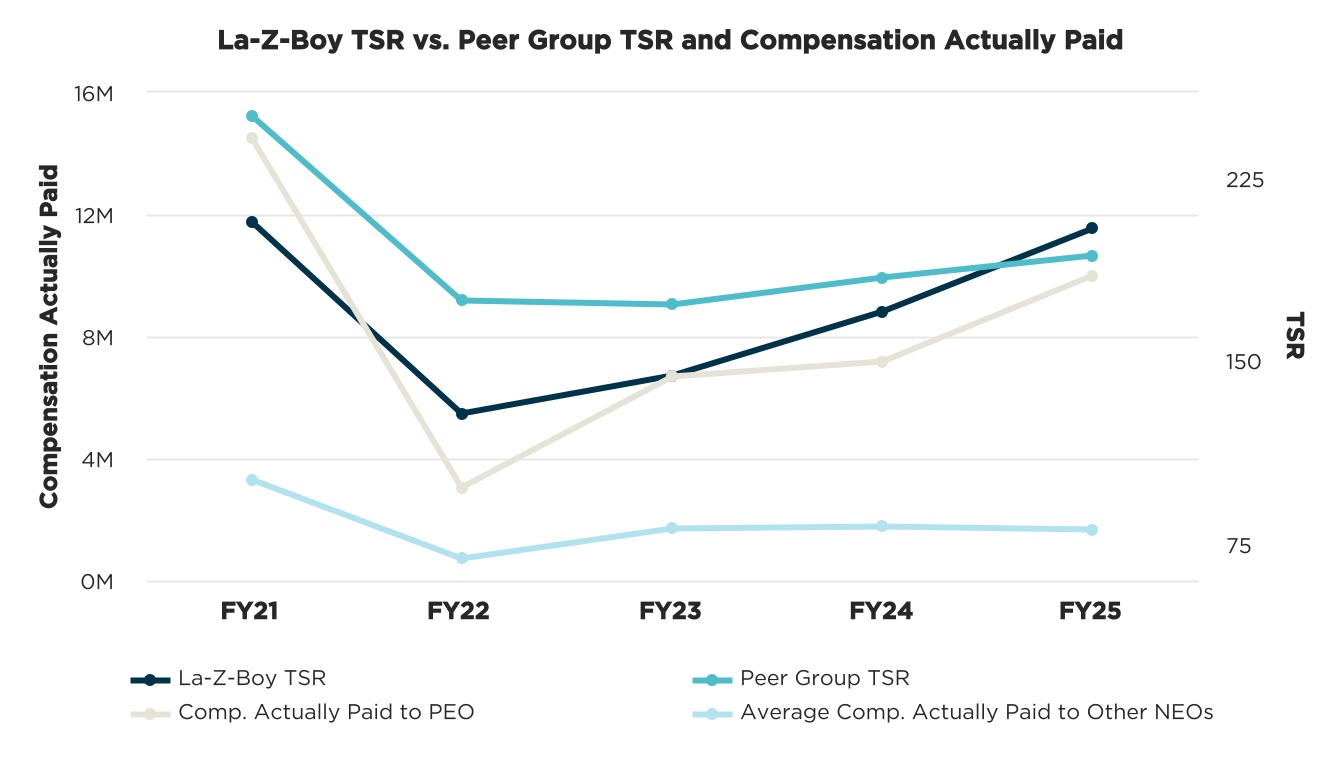
TSR: Company versus Peer Group and Compensation Actually Paid
As shown in the chart below, our five-year cumulative TSR for the period of FY 2021 through FY 2025 is slightly less than the TSR for companies included in our peer group TSR for FY 2021 through FY 2024 and slightly above our peer group TSR in FY 2025. As this chart demonstrates, Compensation Actually Paid for our PEOs and our other NEOs was generally aligned with our TSR during the applicable period.
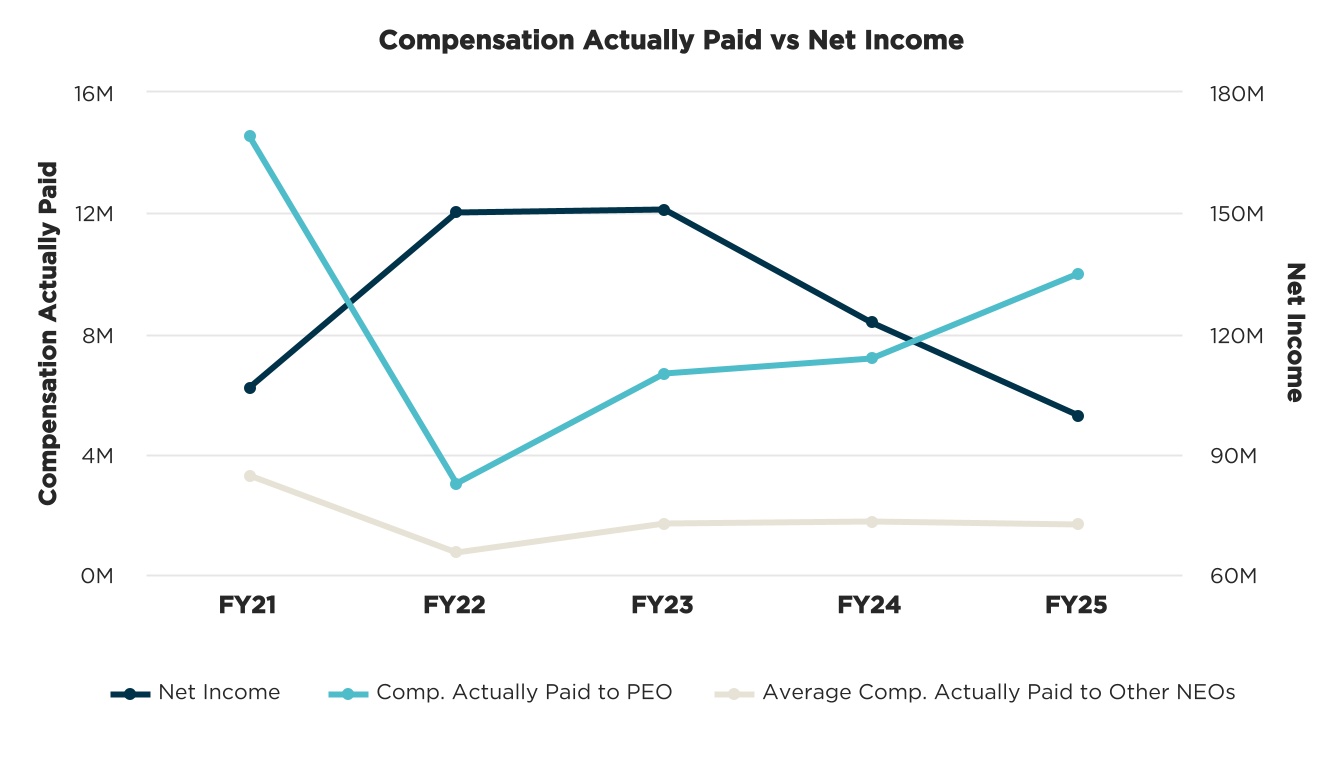
Compensation Actually Paid versus Net Income
The chart below demonstrates the relationship between Compensation Actually Paid amounts for our PEOs and our other NEOs and our net income. Net income is not a direct component of our executive compensation program, although it is correlated with other components of our executive compensation program, such as our operating margin metric. Variations in the Compensation Actually Paid amounts for our PEOs and other NEOs are due in large part to the significant emphasis the company places on long-term equity incentives, the value of which fluctuates based on the vesting level of our performance-based equity awards and changes in stock price over time.
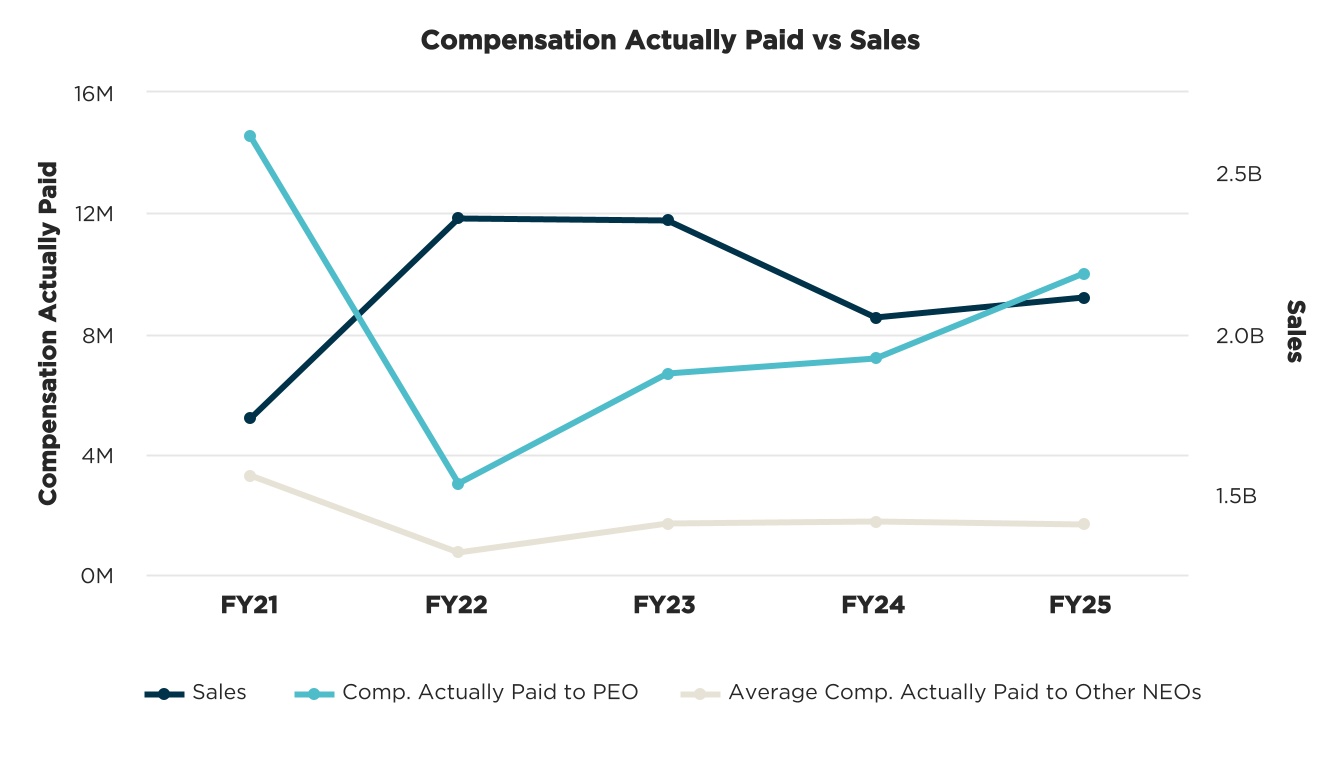
Compensation Actually Paid versus Sales (Company Selected Measure)
The chart below demonstrates the relationship between Compensation Actually Paid amounts for our PEOs and each of our other NEOs and our sales for the applicable fiscal year. Variations in the Compensation Actually Paid amounts for our PEOs and other NEOs are due in large part to the significant emphasis the company places on long-term equity incentives, the value of which fluctuates based on the vesting level of our performance-based equity awards and changes in stock price over time.
We believe the “Compensation Actually Paid” in each of the years reported above and over the five-year cumulative period are reflective of the Compensation Committee’s philosophy to create and reinforce a pay for performance culture as the “Compensation Actually Paid” fluctuated year-over-year, primarily due to our stock performance and our varying levels of achievement against pre-established performance goals under our MIP and long-term equity incentive program, including sales, operating margin, operating cash flow, and relative TSR.
TSR: Company versus Peer Group and Compensation Actually Paid
As shown in the chart below, our five-year cumulative TSR for the period of FY 2021 through FY 2025 is slightly less than the TSR for companies included in our peer group TSR for FY 2021 through FY 2024 and slightly above our peer group TSR in FY 2025. As this chart demonstrates, Compensation Actually Paid for our PEOs and our other NEOs was generally aligned with our TSR during the applicable period.
•Operating Margin
•Operating Cash Flow
•Relative TSR
•Stock Price (through the use of equity-based awards)
(3)To calculate compensation actually paid, adjustments were made to the amounts reported in the Summary Compensation Table for the applicable years. A reconciliation of the adjustments for Ms. Whittington and Mr. Darrow (in the applicable
year(s) in which such individuals served as PEO) and for the average of the other NEOs is set forth following the footnotes to this table.
(4)Pursuant to the rules of the SEC, the comparison assumes $100 was invested on April 25, 2020 in our common stock. Historic stock price performance is not necessarily indicative of future stock price performance.For FY 2025, the Compensation Committee determined that sales continues to be viewed as a core driver of the company’s performance and stockholder value creation and is used as a component in the company’s FY 2025 MIP and FY 2025 - 2027 long-term equity incentive program. Sales is measured on a GAAP basis and does not reflect any adjustments. Please see the Compensation Discussion and Analysis for further information regarding the use of sales in the company's executive compensation program.