
Second Quarter 2025 Earnings Conference Call 7/15/2025 HANCOCK WHITNEY Exhibit 99.2
This presentation contains forward-looking statements within the meaning of section 27A of the Securities Act of 1933, as amended, and section 21E of the Securities Exchange Act of 1934, as amended. Forward-looking statements that we may make include statements regarding our expectations of our performance and financial condition, balance sheet and revenue growth, the provision for credit losses, capital levels, deposits (including growth, pricing, and betas), investment portfolio, other sources of liquidity, loan growth expectations, management’s predictions about charge-offs for loans, the impact of current and future economic conditions, including the effects of declines in the real estate market, tariffs or trade wars (including reduced consumer spending, lower economic growth or recession, reduced demand for U.S. exports, disruptions to supply chains, and decreased demand for other banking products and services), high unemployment, inflationary pressures, increasing insurance costs, elevated interest rates, including the impact of changes in interest rates on our financial projections, models and guidance and slowdowns in economic growth, as well as the financial stress on borrowers as a result of the foregoing, general economic business conditions in our local markets, Federal Reserve action with respect to interest rates, the effects of war or other conflicts, acts of terrorism, climate change, the impact of natural or man-made disasters, the adequacy of our enterprise risk management framework, potential claims, damages, penalties, fines and reputational damage resulting from pending or future litigation, regulatory proceedings, assessments, and enforcement actions, as well as the impact of negative developments affecting the banking industry and the resulting media coverage; the potential impact of current (including Sabal Trust Company) or future business combinations on our performance and financial condition, including our ability to successfully integrate the businesses, success of revenue-generating and cost reduction initiatives, the effectiveness of derivative financial instruments and hedging activities to manage risks, projected tax rates, increased cybersecurity risks, including potential business disruptions or financial losses, the adequacy of our internal controls over financial and non-financial reporting, the financial impact of regulatory requirements and tax reform legislation, deposit trends, credit quality trends, net interest margin trends, future expense levels, future profitability, improvements in expense to revenue (efficiency) ratio, purchase accounting impacts and expected returns. Also, any statement that does not describe historical or current facts is a forward-looking statement. These statements often include the words “believes,” “expects,” “anticipates,” “estimates,” “intends,” “plans,” “forecast,” “goals,” “targets,” “initiatives,” “focus,” “potentially,” “probably,” “projects,” “outlook," or similar expressions or future conditional verbs such as “may,” “will,” “should,” “would,” and “could.” Forward-looking statements are based upon the current beliefs and expectations of management and on information currently available to management. Our statements speak as of the date hereof, and we do not assume any obligation to update these statements or to update the reasons why actual results could differ from those contained in such statements in light of new information or future events. Forward-looking statements are subject to significant risks and uncertainties. Any forward-looking statement made in this presentation is subject to the safe harbor protections set forth in the Private Securities Litigation Reform Act of 1995. Investors are cautioned against placing undue reliance on such statements. Actual results may differ materially from those set forth in the forward-looking statements. Additional factors that could cause actual results to differ materially from those described in the forward-looking statements can be found in Part I, “Item 1A. Risk Factors” in our Annual Report on Form 10-K for the year ended December 31, 2024, and in other periodic reports that we file with the SEC. Important cautionary statement about forward-looking statements
Non-GAAP Reconciliations & Glossary of Terms Throughout this presentation we may use non-GAAP numbers to supplement the evaluation of our performance. The items noted below with an asterisk, "*", are considered non-GAAP. These non-GAAP financial measures should not be considered alternatives to GAAP-basis financial statements, and other bank holding companies may define or calculate these non-GAAP measures or similar measures differently. Reconciliations of those non-GAAP measures to the comparable GAAP measure are included in the appendix to this presentation. The earnings release, financial tables and supporting slide presentation can be found on the company’s Investor Relations website at investors.hancockwhitney.com. ABL – Asset Based Lending ACL – Allowance for credit losses AEA – Average Earning Assets AFS – Available for sale securities Annualized – Calculated to reflect a rate based on a full year AOCI – Accumulated other comprehensive income ARM – Adjustable Rate Mortgage B – Dollars in billions Beta – repricing based on a change in market rates BOLI – Bank-owned life insurance bps – basis points Brokered Deposits – deposits obtained directly or indirectly through a deposit broker typically offering higher interest rates C&D – Construction and land development loans CD – Certificate of deposit CET1 – Common Equity Tier 1 Ratio CF – Cash flow CMBS – Commercial mortgage-backed securities CMO – Collateralized mortgage obligations CRE – Commercial real estate CSO – Corporate strategic objective DDA – Noninterest-bearing demand deposit accounts *Efficiency ratio – noninterest expense to total net interest (TE) and noninterest income, excluding amortization of purchased intangibles and other supplemental disclosure items EOP – End of period EPS – Earnings per share Fed – Federal Reserve Bank FF – Federal Funds FHLB – Federal Home Loan Bank FRB-DW – Federal Reserve Bank Discount Window Free Securities – market value of unencumbered investment securities owned by the bank FTE – Full time equivalent FV – Fair Value HFS – Held for sale HTM – Held to maturity securities IB – Interest-bearing ICRE – Income-producing commercial real estate ICS – Insured Cash Sweep IRR – Interest rate risk Line Utilization - represents the used portion of a revolving line resulting in a funded balance for a given portfolio; credit cards, construction loans (commercial and residential), and consumer lines of credit are excluded from the calculation Linked-quarter (LQ) – current quarter compared to previous quarter LOC – Line of credit LQA – Linked-quarter annualized M&A – Mergers and acquisitions MM – Dollars in millions MMDA – Money market demand account MMDDYY – Month Day Year MSA – Metropolitan Statistical Area Munis – Municipal obligations NII – Net interest income *NIM – Net interest margin (TE) OCI – Other comprehensive income OFA – Other foreclosed assets O/N – Overnight Funds ORE – Other real estate PF – Public Funds *PPNR and *Adjusted PPNR – Pre-provision net revenue, defined as net income excluding provision expense and income tax expense, plus the taxable equivalent adjustment; adjusted PPNR is PPNR excluding supplemental disclosure items; also known as adjusted leverage Repo – Customer repurchase agreements RMBS – Residential mortgage-backed securities ROA – Return on average assets ROTCE – Return on tangible common equity RWA – Risk Weighted Assets SBA – Small Business Administration SBIC – Small business investment company SNC – Shared national credit SOFR – Secured Overnight Financing Rate S2 – Slower growth, downside scenario *Supplemental disclosure items – certain items that are outside of our principal business and/or are not indicative of forward-looking trends; these items are presented below GAAP financial data and excluded from certain adjusted ratios and metrics TCE – Tangible common equity ratio (common shareholders’ equity less intangible assets divided by total assets less intangible assets) *TE – Taxable equivalent (calculated using the current statutory federal tax rate) XHYY – Half Year XQYY – Quarter Year Y-o-Y – Year over year
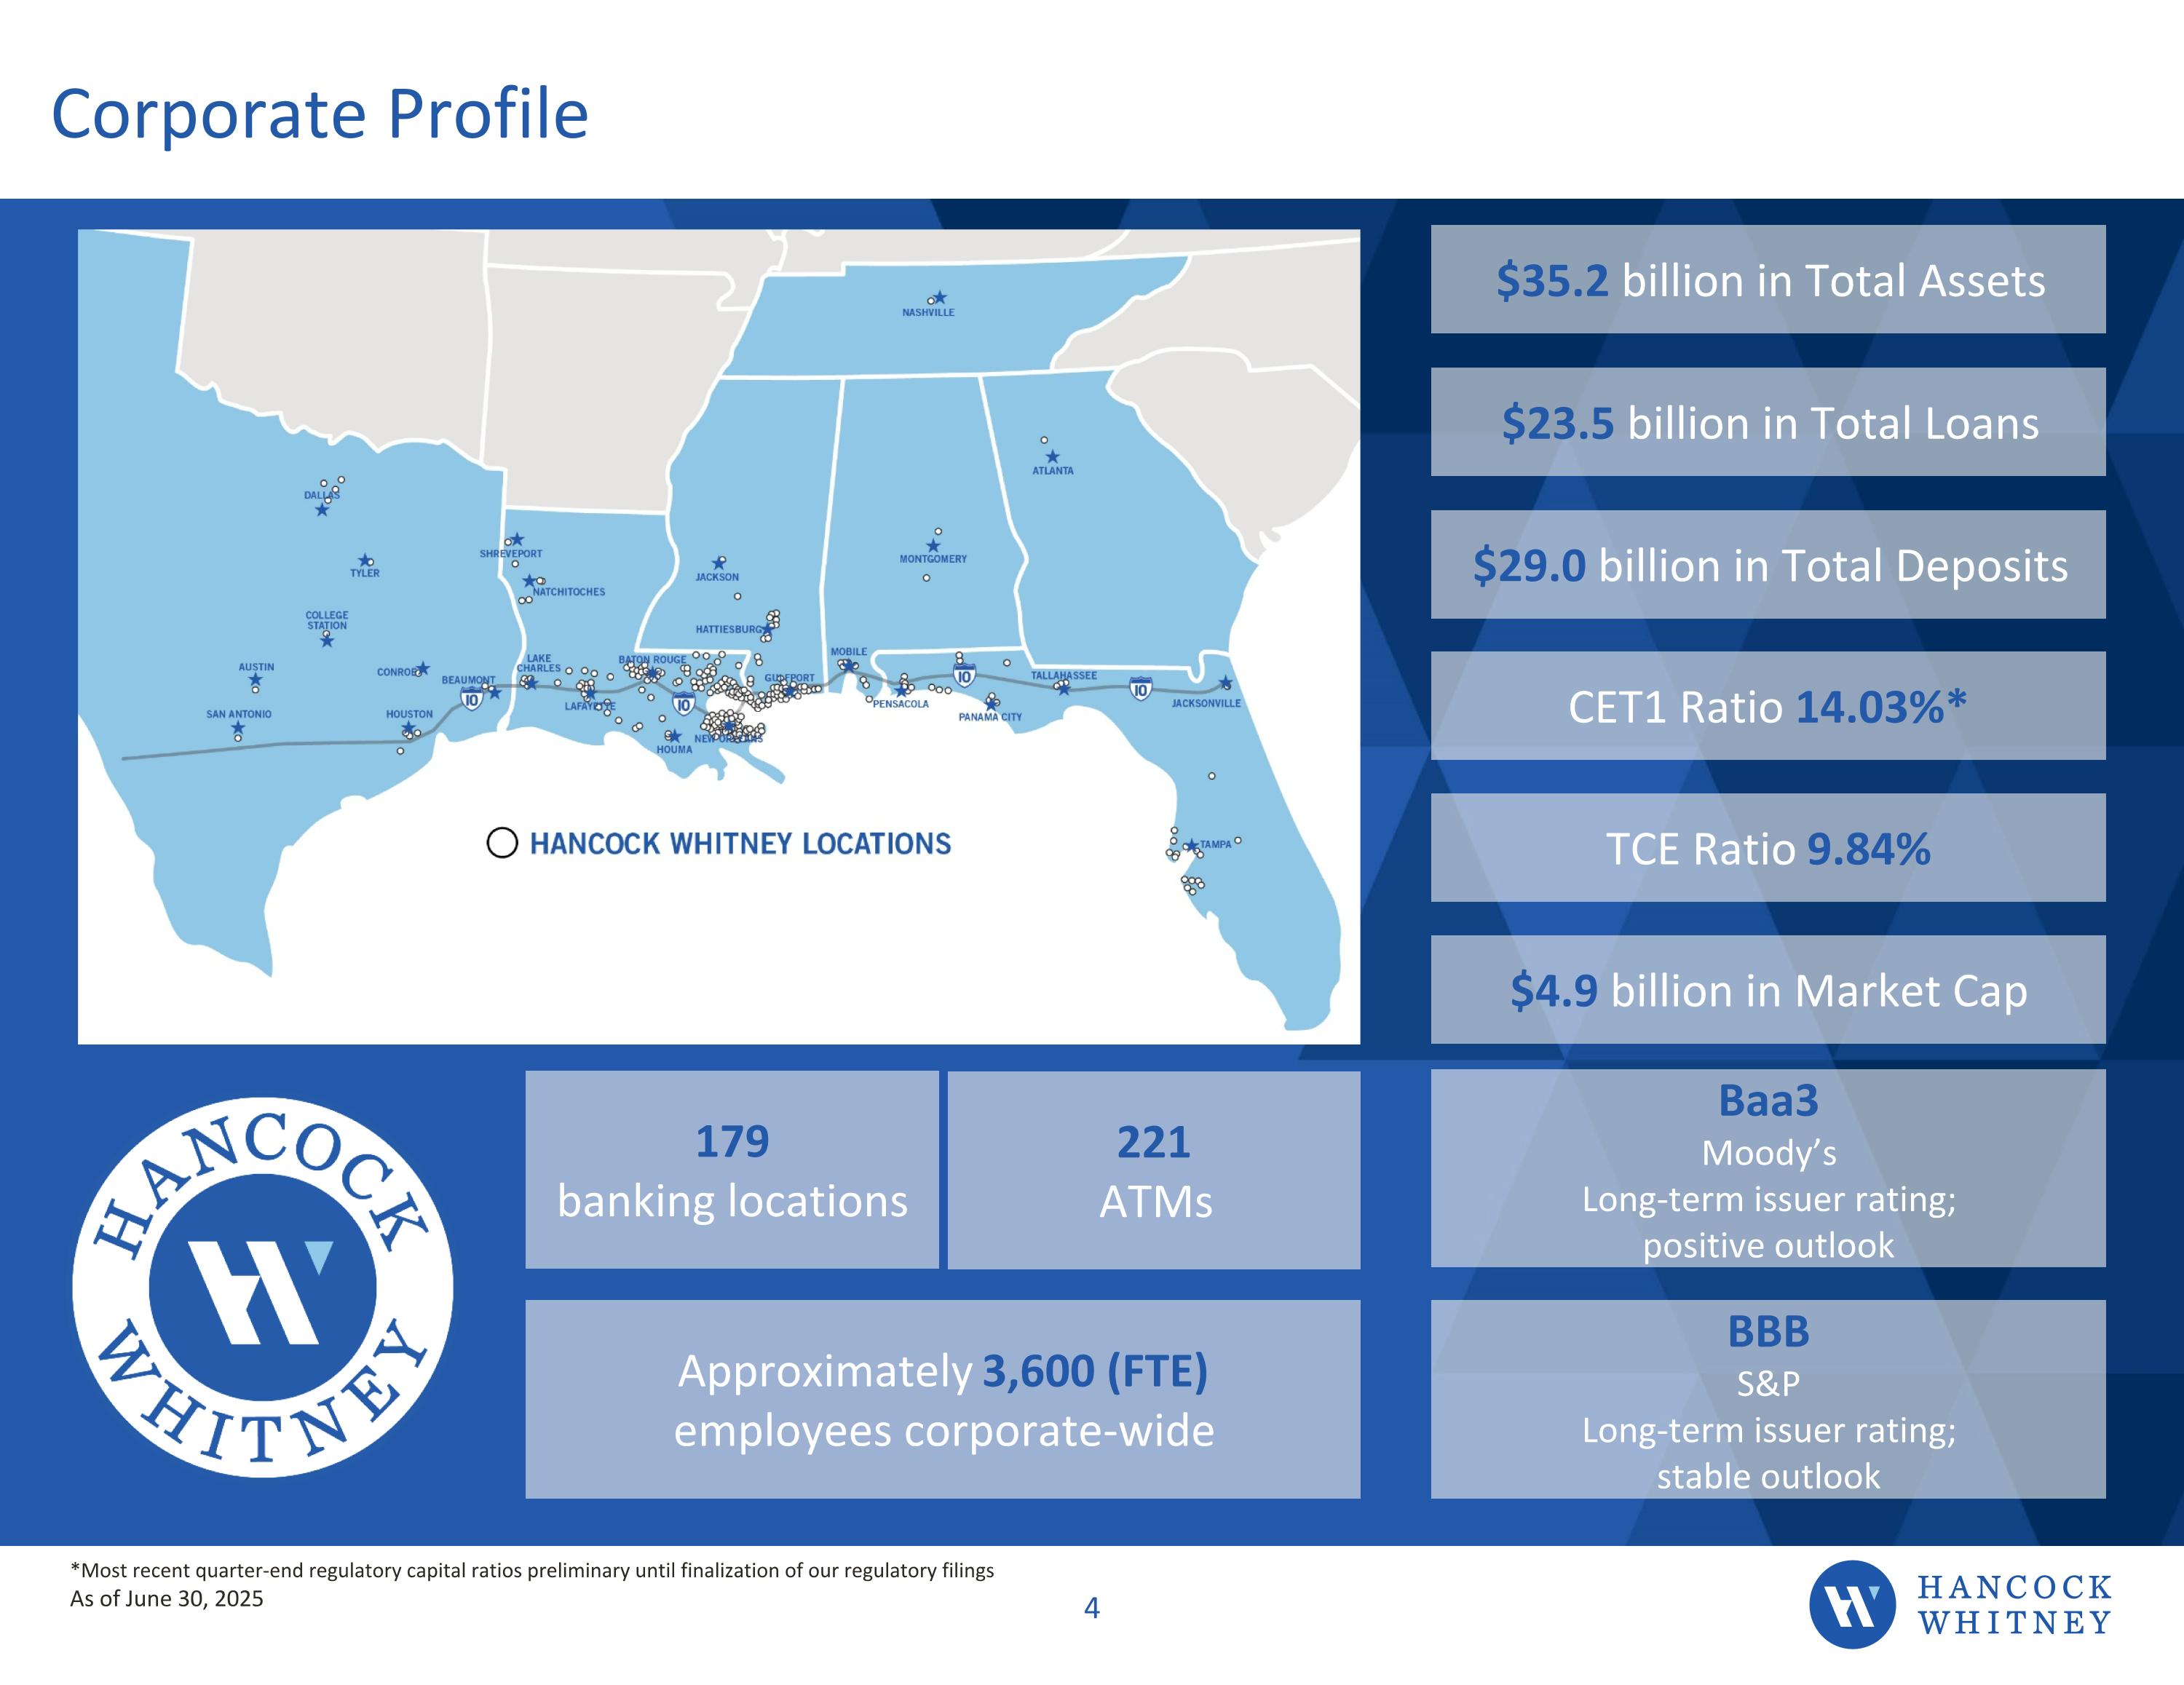
HWC Nasdaq Listed HNCOCK WHITNEY 4 *Most recent quarter-end regulatory capital ratios preliminary until finalization of our regulatory filings As of June 30, 2025 (Healthcare) (ABL) (Operations) (Trust) $35.2 billion in Total Assets $23.5 billion in Total Loans $29.0 billion in Total Deposits CET1 Ratio 14.03%* TCE Ratio 9.84% $4.9 billion in Market Cap Baa3 Moody’s Long-term issuer rating; positive outlook BBB S&P Long-term issuer rating; stable outlook 179 banking locations Approximately 3,600 (FTE) employees corporate-wide 221 ATMs Corporate Profile
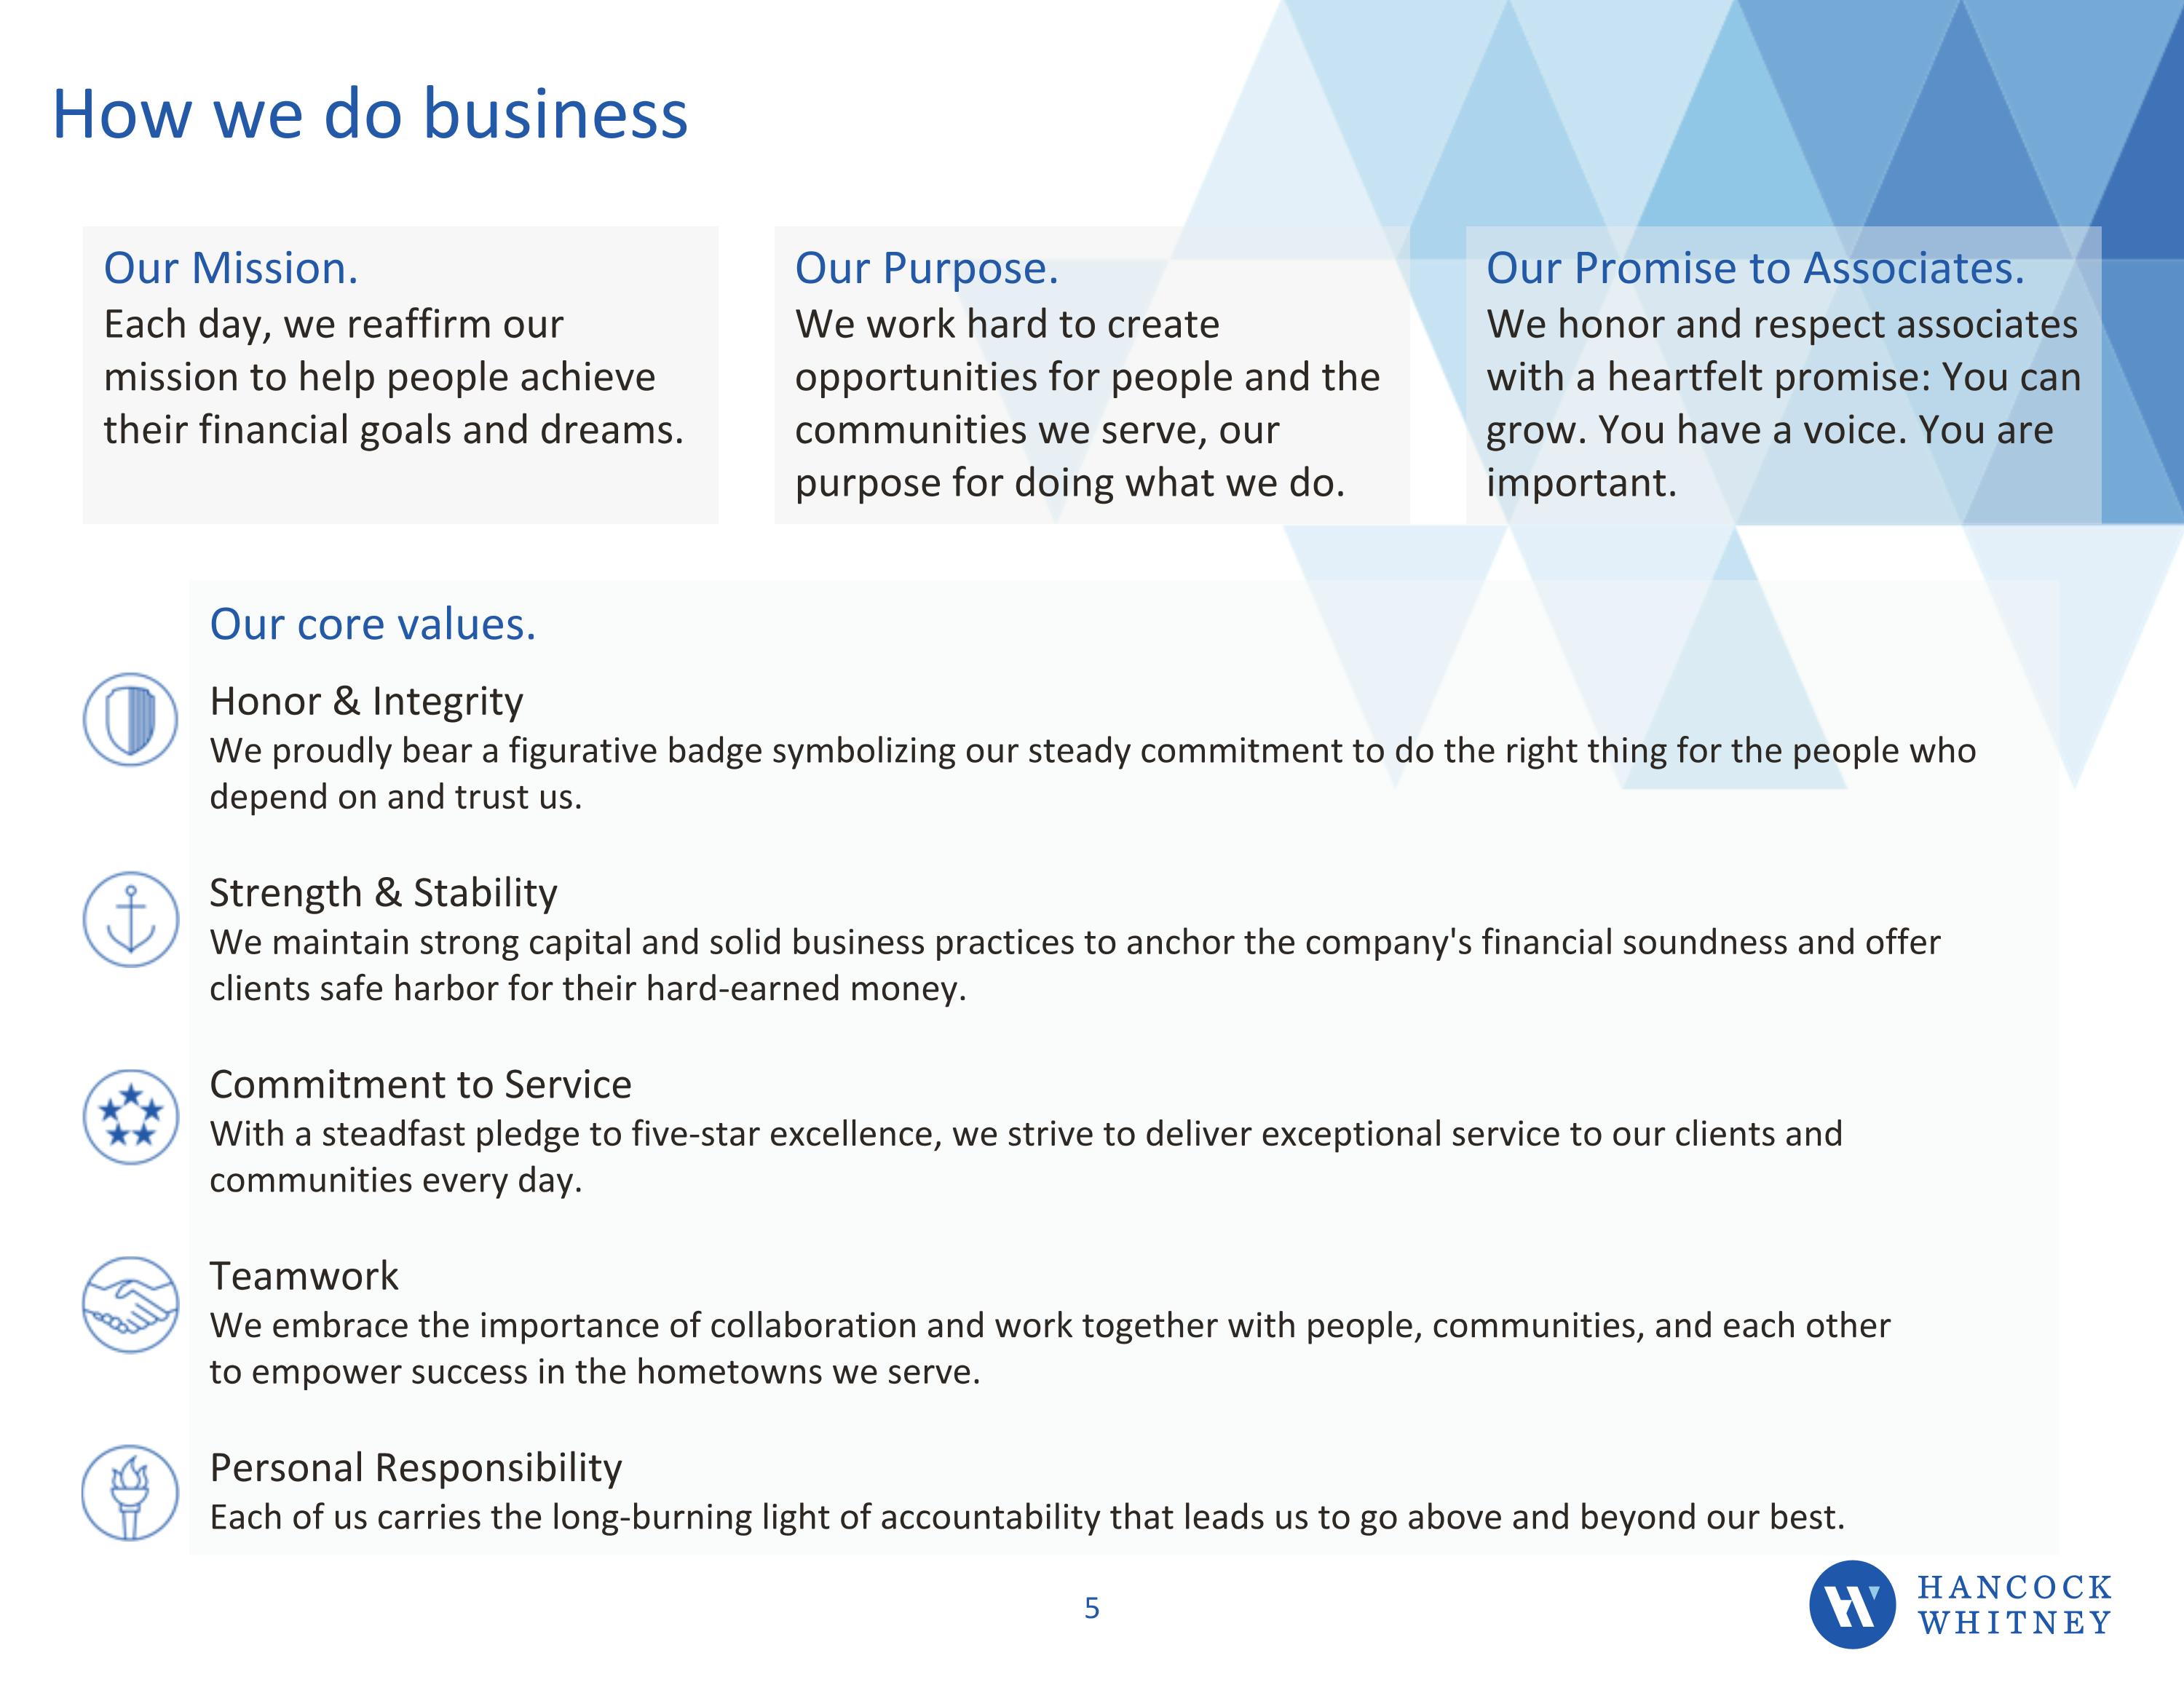
How we do business Our Mission. Each day, we reaffirm our mission to help people achieve their financial goals and dreams. Our Purpose. We work hard to create opportunities for people and the communities we serve, our purpose for doing what we do. Our Promise to Associates. We honor and respect associates with a heartfelt promise: You can grow. You have a voice. You are important. Honor & Integrity We proudly bear a figurative badge symbolizing our steady commitment to do the right thing for the people who depend on and trust us. Strength & Stability We maintain strong capital and solid business practices to anchor the company's financial soundness and offer clients safe harbor for their hard-earned money. Commitment to Service With a steadfast pledge to five-star excellence, we strive to deliver exceptional service to our clients and communities every day. Teamwork We embrace the importance of collaboration and work together with people, communities, and each other to empower success in the hometowns we serve. Personal Responsibility Each of us carries the long-burning light of accountability that leads us to go above and beyond our best. Our core values.
HWC Strong and Stable for 125 Years Strength to manage through challenging economic environments Density in resilient deposit markets Stable, seasoned, diversified deposits; ability to organically grow deposits Top quartile capital levels including all unrealized losses Ability to return capital through dividend increases and share repurchase program Commitment to maintaining a de-risked balance sheet Robust ACL at 1.45% of loans Proven ability to proactively manage expenses Technology investments improve client experience and enhance efficiencies Exceptional, dedicated, committed team of associates
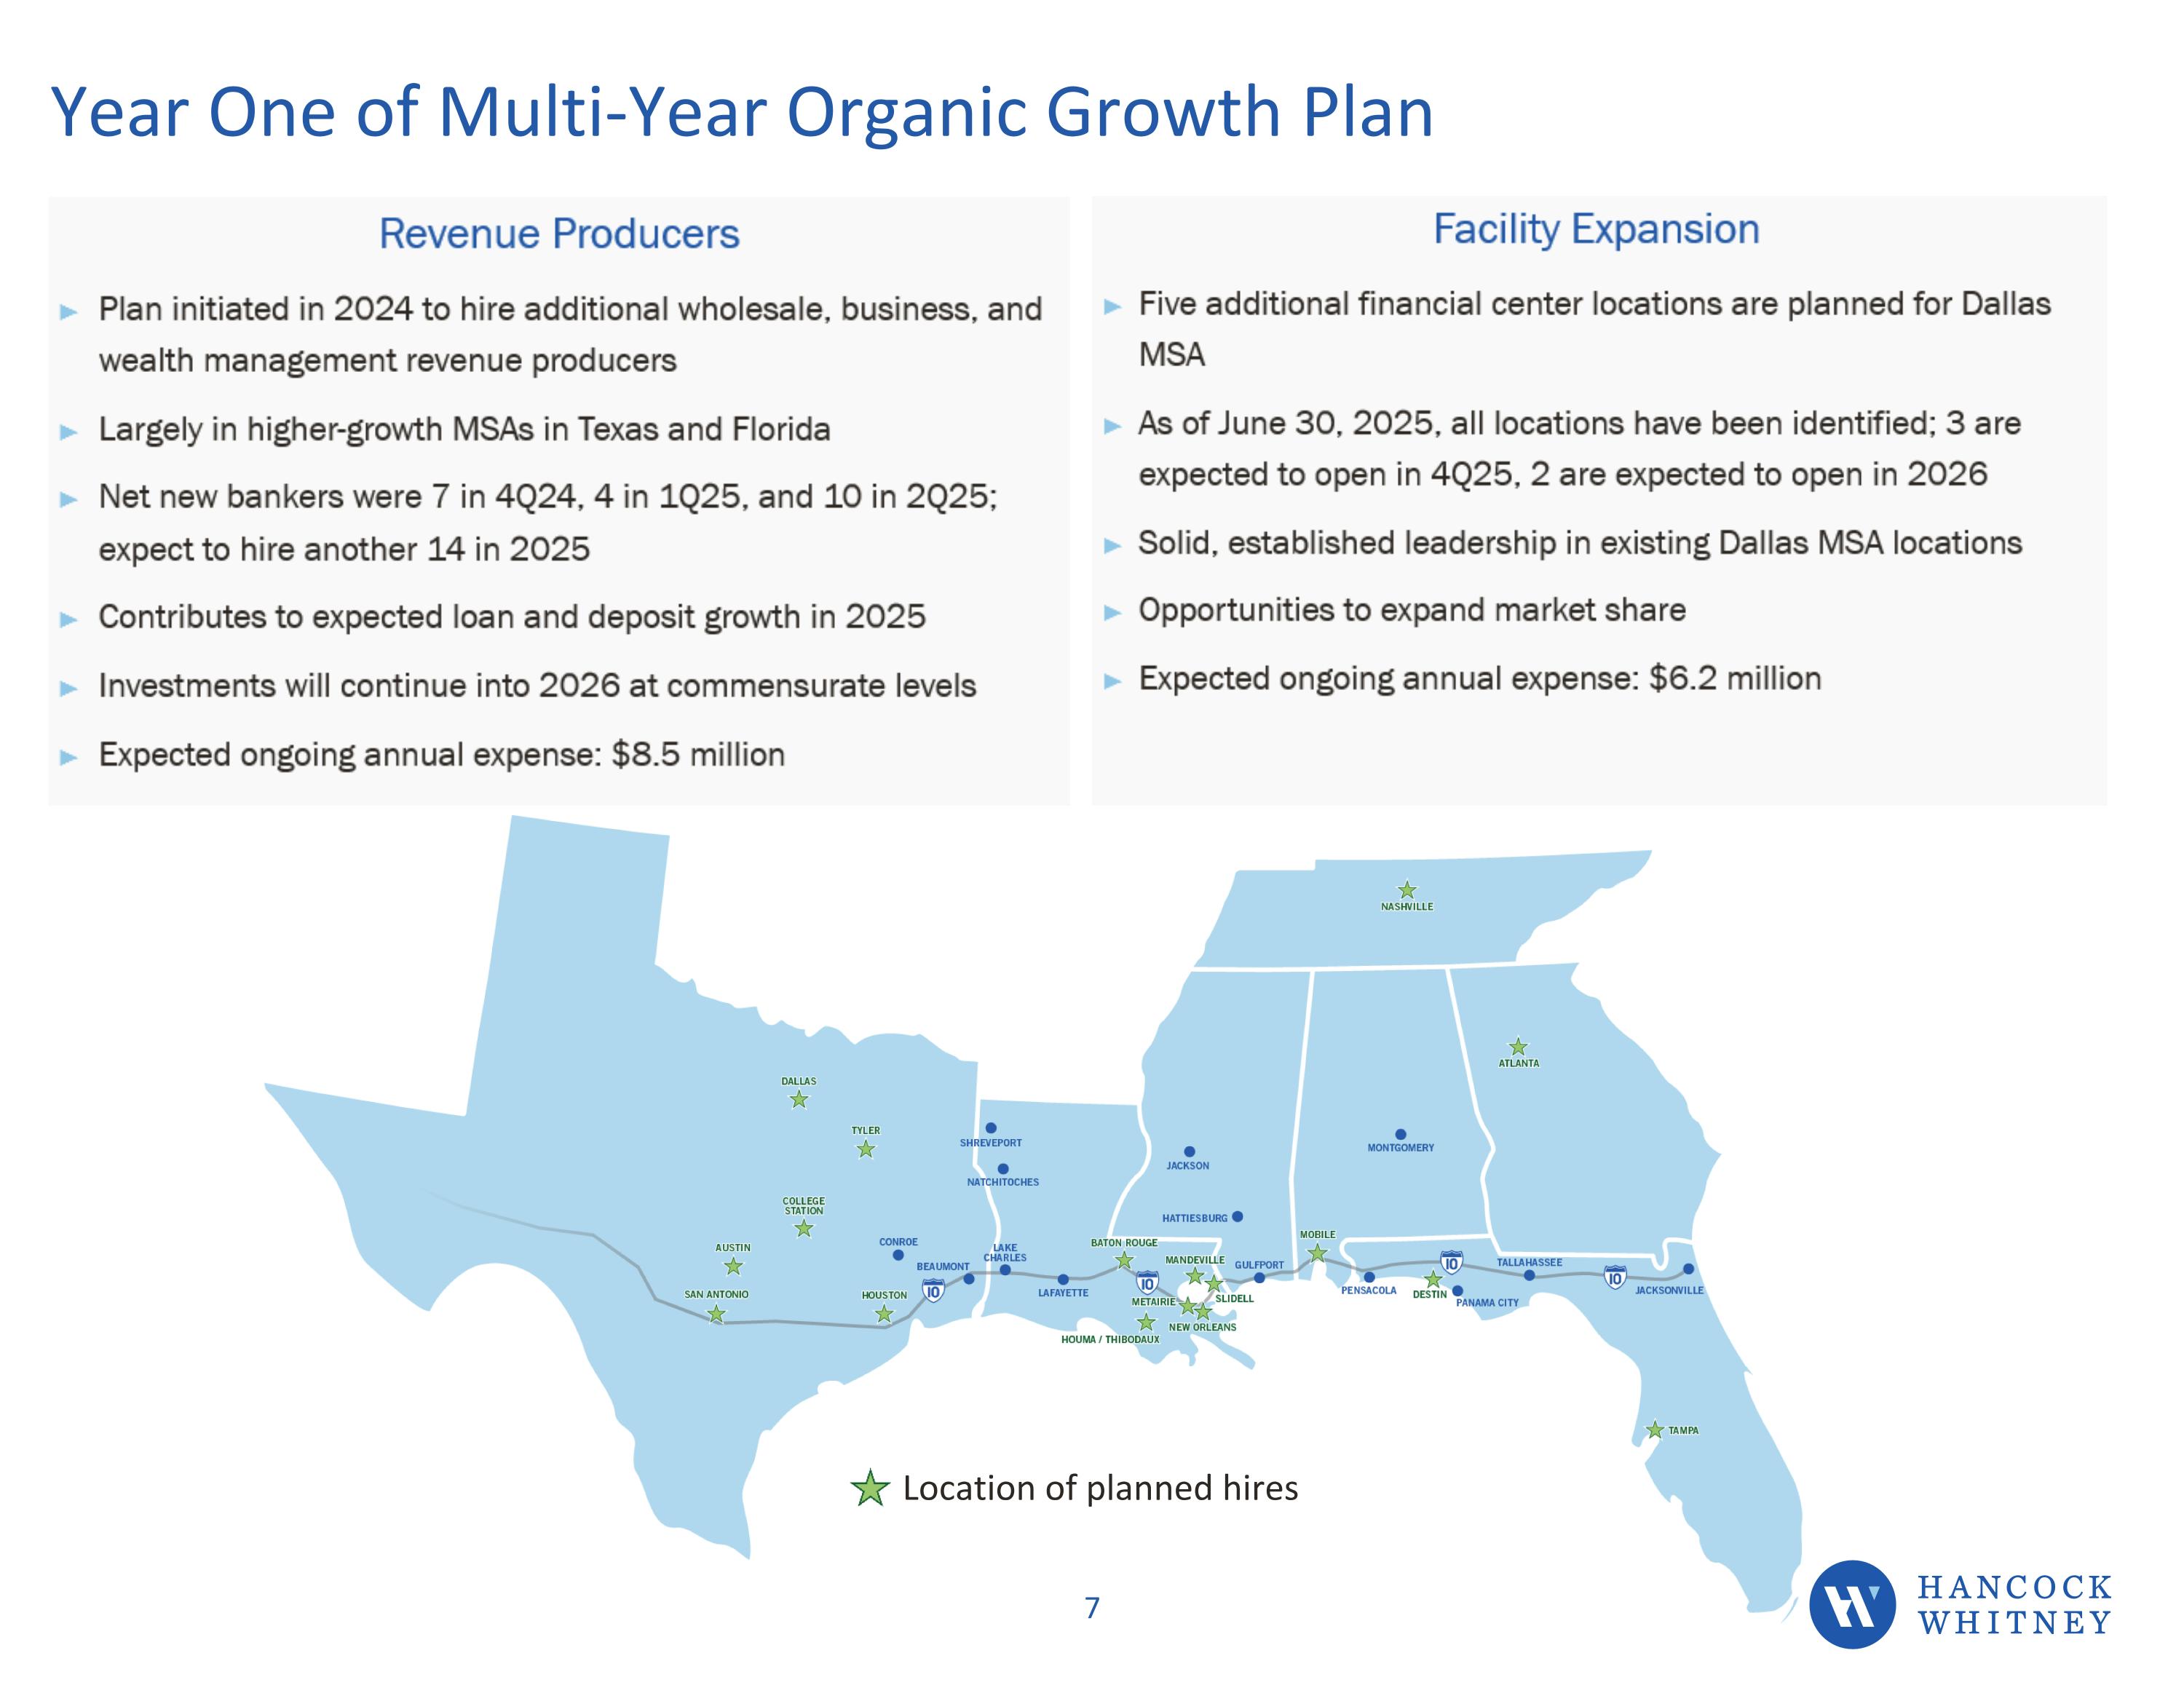
Year One of Multi-Year Organic Growth Plan Location of planned hires
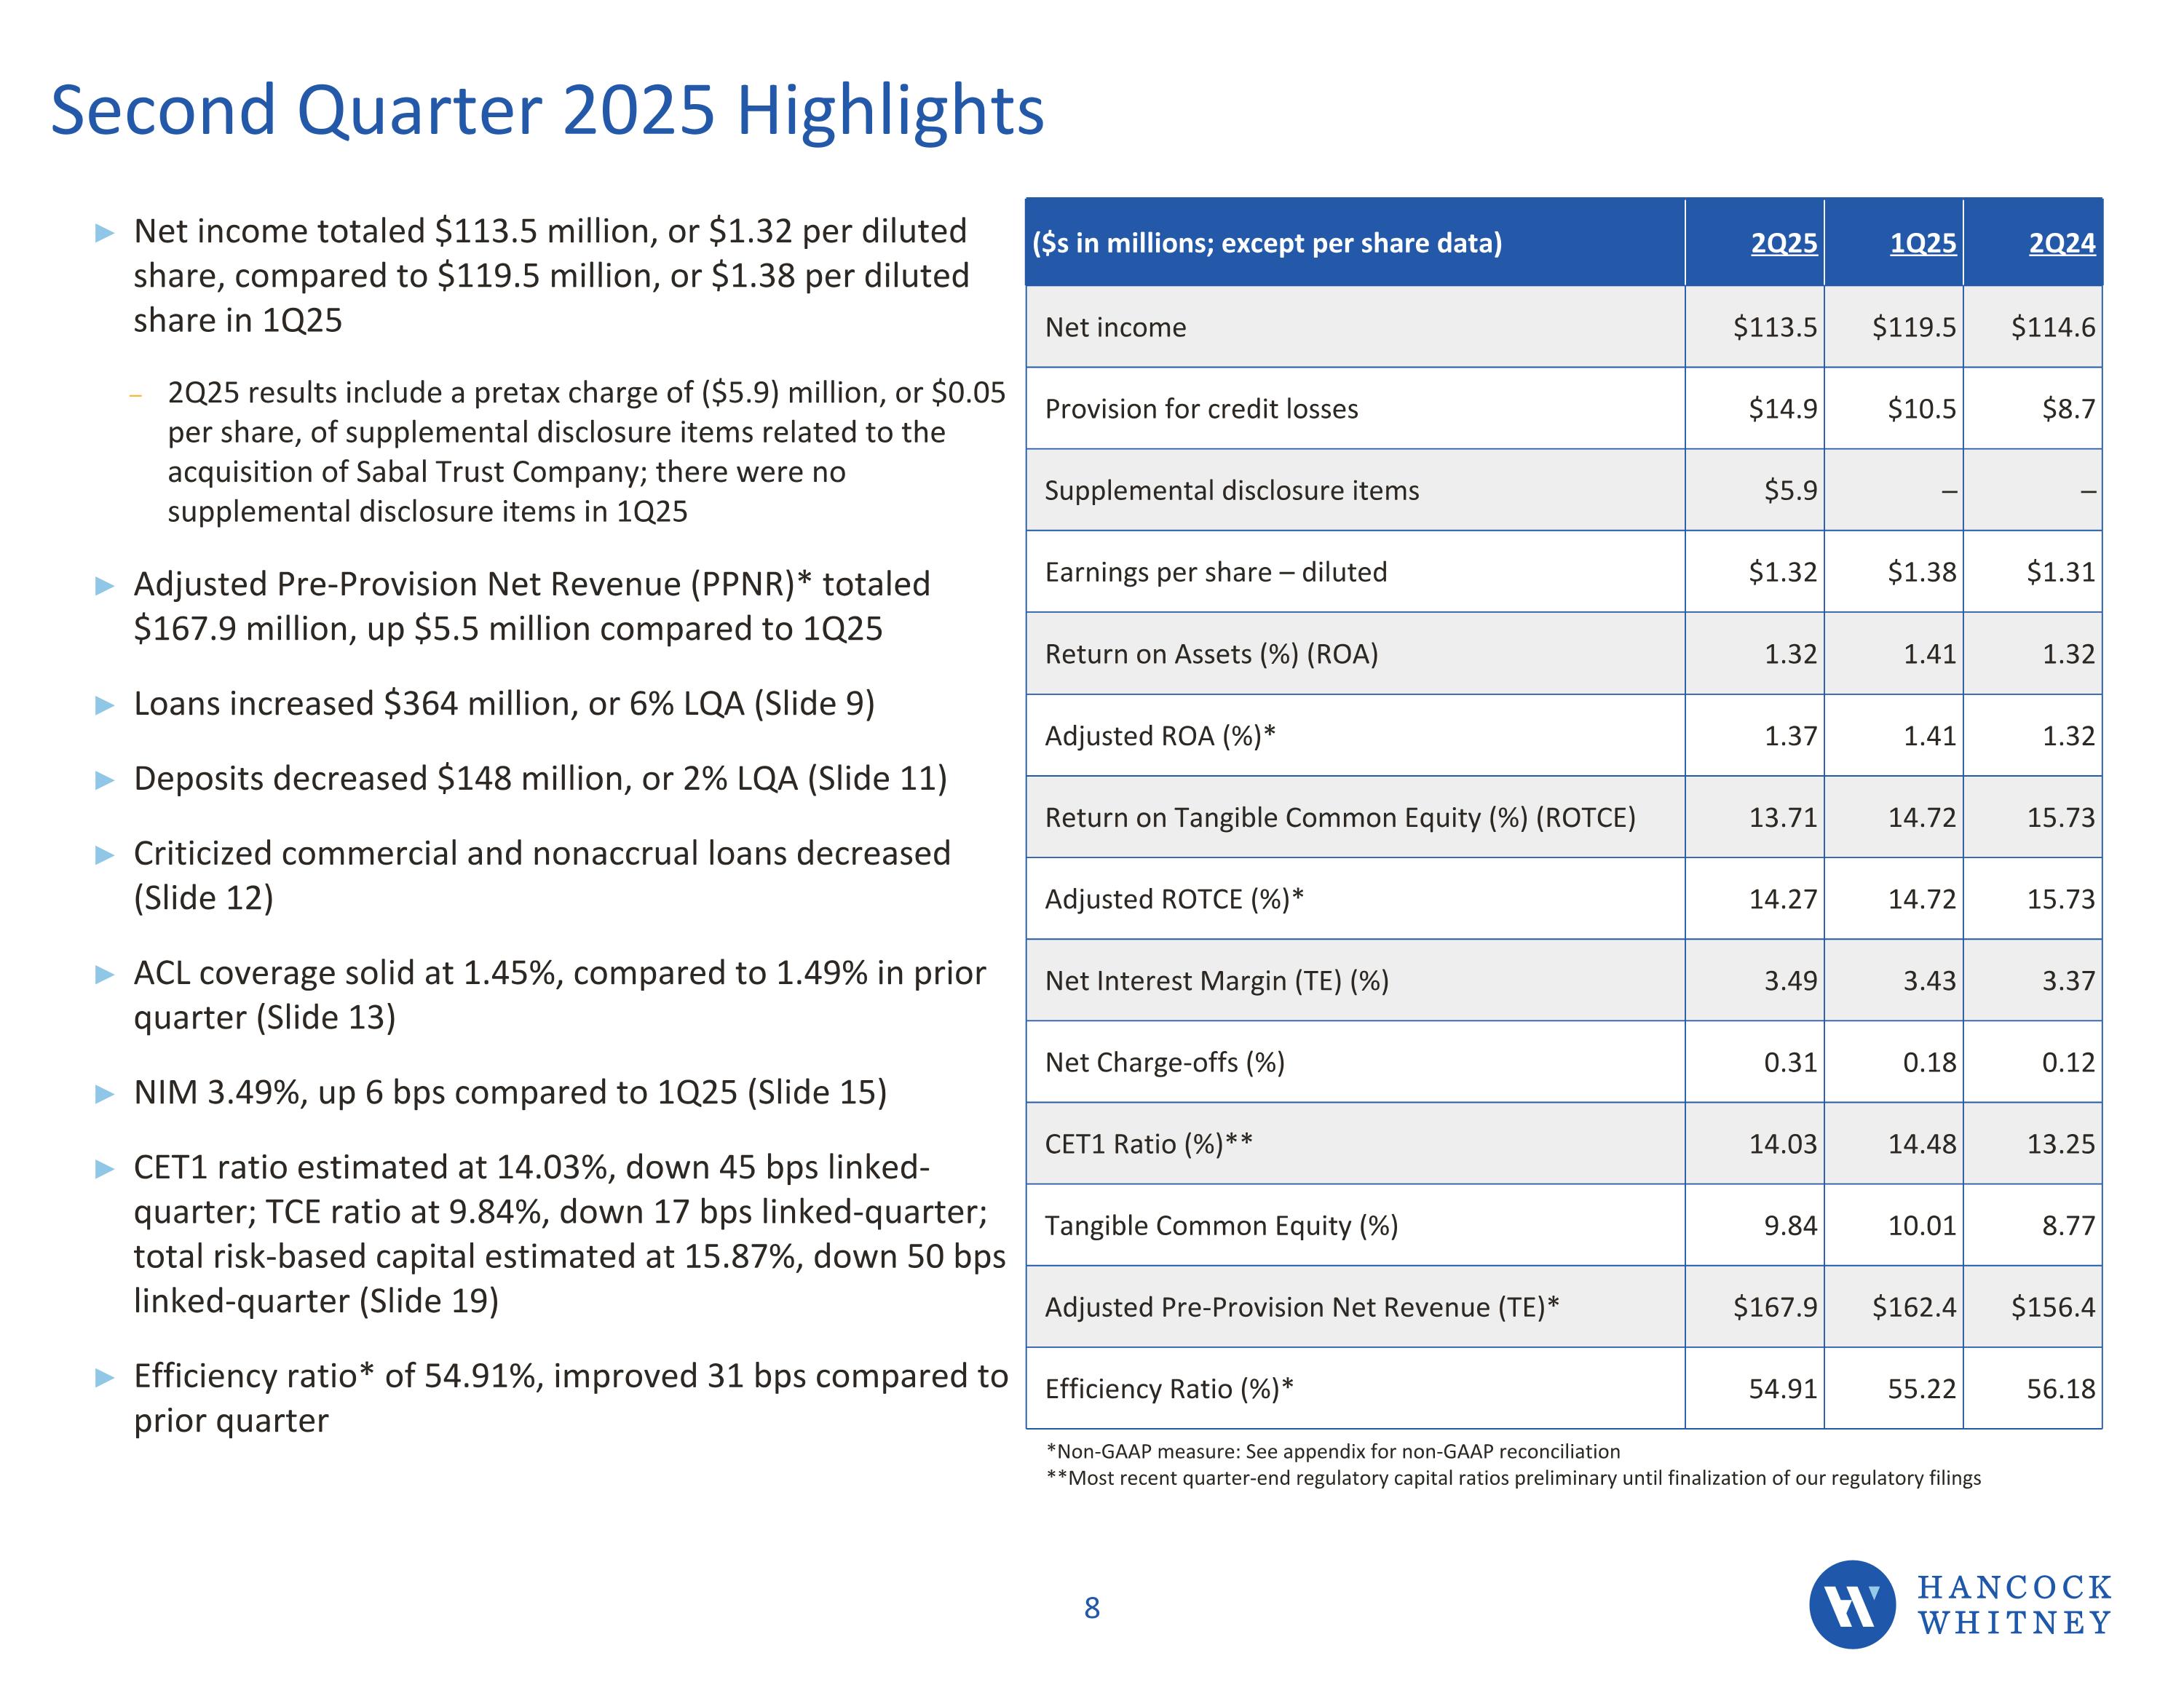
Second Quarter 2025 Highlights Net income totaled $113.5 million, or $1.32 per diluted share, compared to $119.5 million, or $1.38 per diluted share in 1Q25 2Q25 results include a pretax charge of ($5.9) million, or $0.05 per share, of supplemental disclosure items related to the acquisition of Sabal Trust Company; there were no supplemental disclosure items in 1Q25 Adjusted Pre-Provision Net Revenue (PPNR)* totaled $167.9 million, up $5.5 million compared to 1Q25 Loans increased $364 million, or 6% LQA (Slide 9) Deposits decreased $148 million, or 2% LQA (Slide 11) Criticized commercial and nonaccrual loans decreased (Slide 12) ACL coverage solid at 1.45%, compared to 1.49% in prior quarter (Slide 13) NIM 3.49%, up 6 bps compared to 1Q25 (Slide 15) CET1 ratio estimated at 14.03%, down 45 bps linked-quarter; TCE ratio at 9.84%, down 17 bps linked-quarter; total risk-based capital estimated at 15.87%, down 50 bps linked-quarter (Slide 19) Efficiency ratio* of 54.91%, improved 31 bps compared to prior quarter *Non-GAAP measure: See appendix for non-GAAP reconciliation **Most recent quarter-end regulatory capital ratios preliminary until finalization of our regulatory filings ($s in millions; except per share data) 2Q25 1Q25 2Q24 Net income $113.5 $119.5 $114.6 Provision for credit losses $14.9 $10.5 $8.7 Supplemental disclosure items $5.9 ─ ─ Earnings per share – diluted $1.32 $1.38 $1.31 Return on Assets (%) (ROA) 1.32 1.41 1.32 Adjusted ROA (%)* 1.37 1.41 1.32 Return on Tangible Common Equity (%) (ROTCE) 13.71 14.72 15.73 Adjusted ROTCE (%)* 14.27 14.72 15.73 Net Interest Margin (TE) (%) 3.49 3.43 3.37 Net Charge-offs (%) 0.31 0.18 0.12 CET1 Ratio (%)** 14.03 14.48 13.25 Tangible Common Equity (%) 9.84 10.01 8.77 Adjusted Pre-Provision Net Revenue (TE)* $167.9 $162.4 $156.4 Efficiency Ratio (%)* 54.91 55.22 56.18
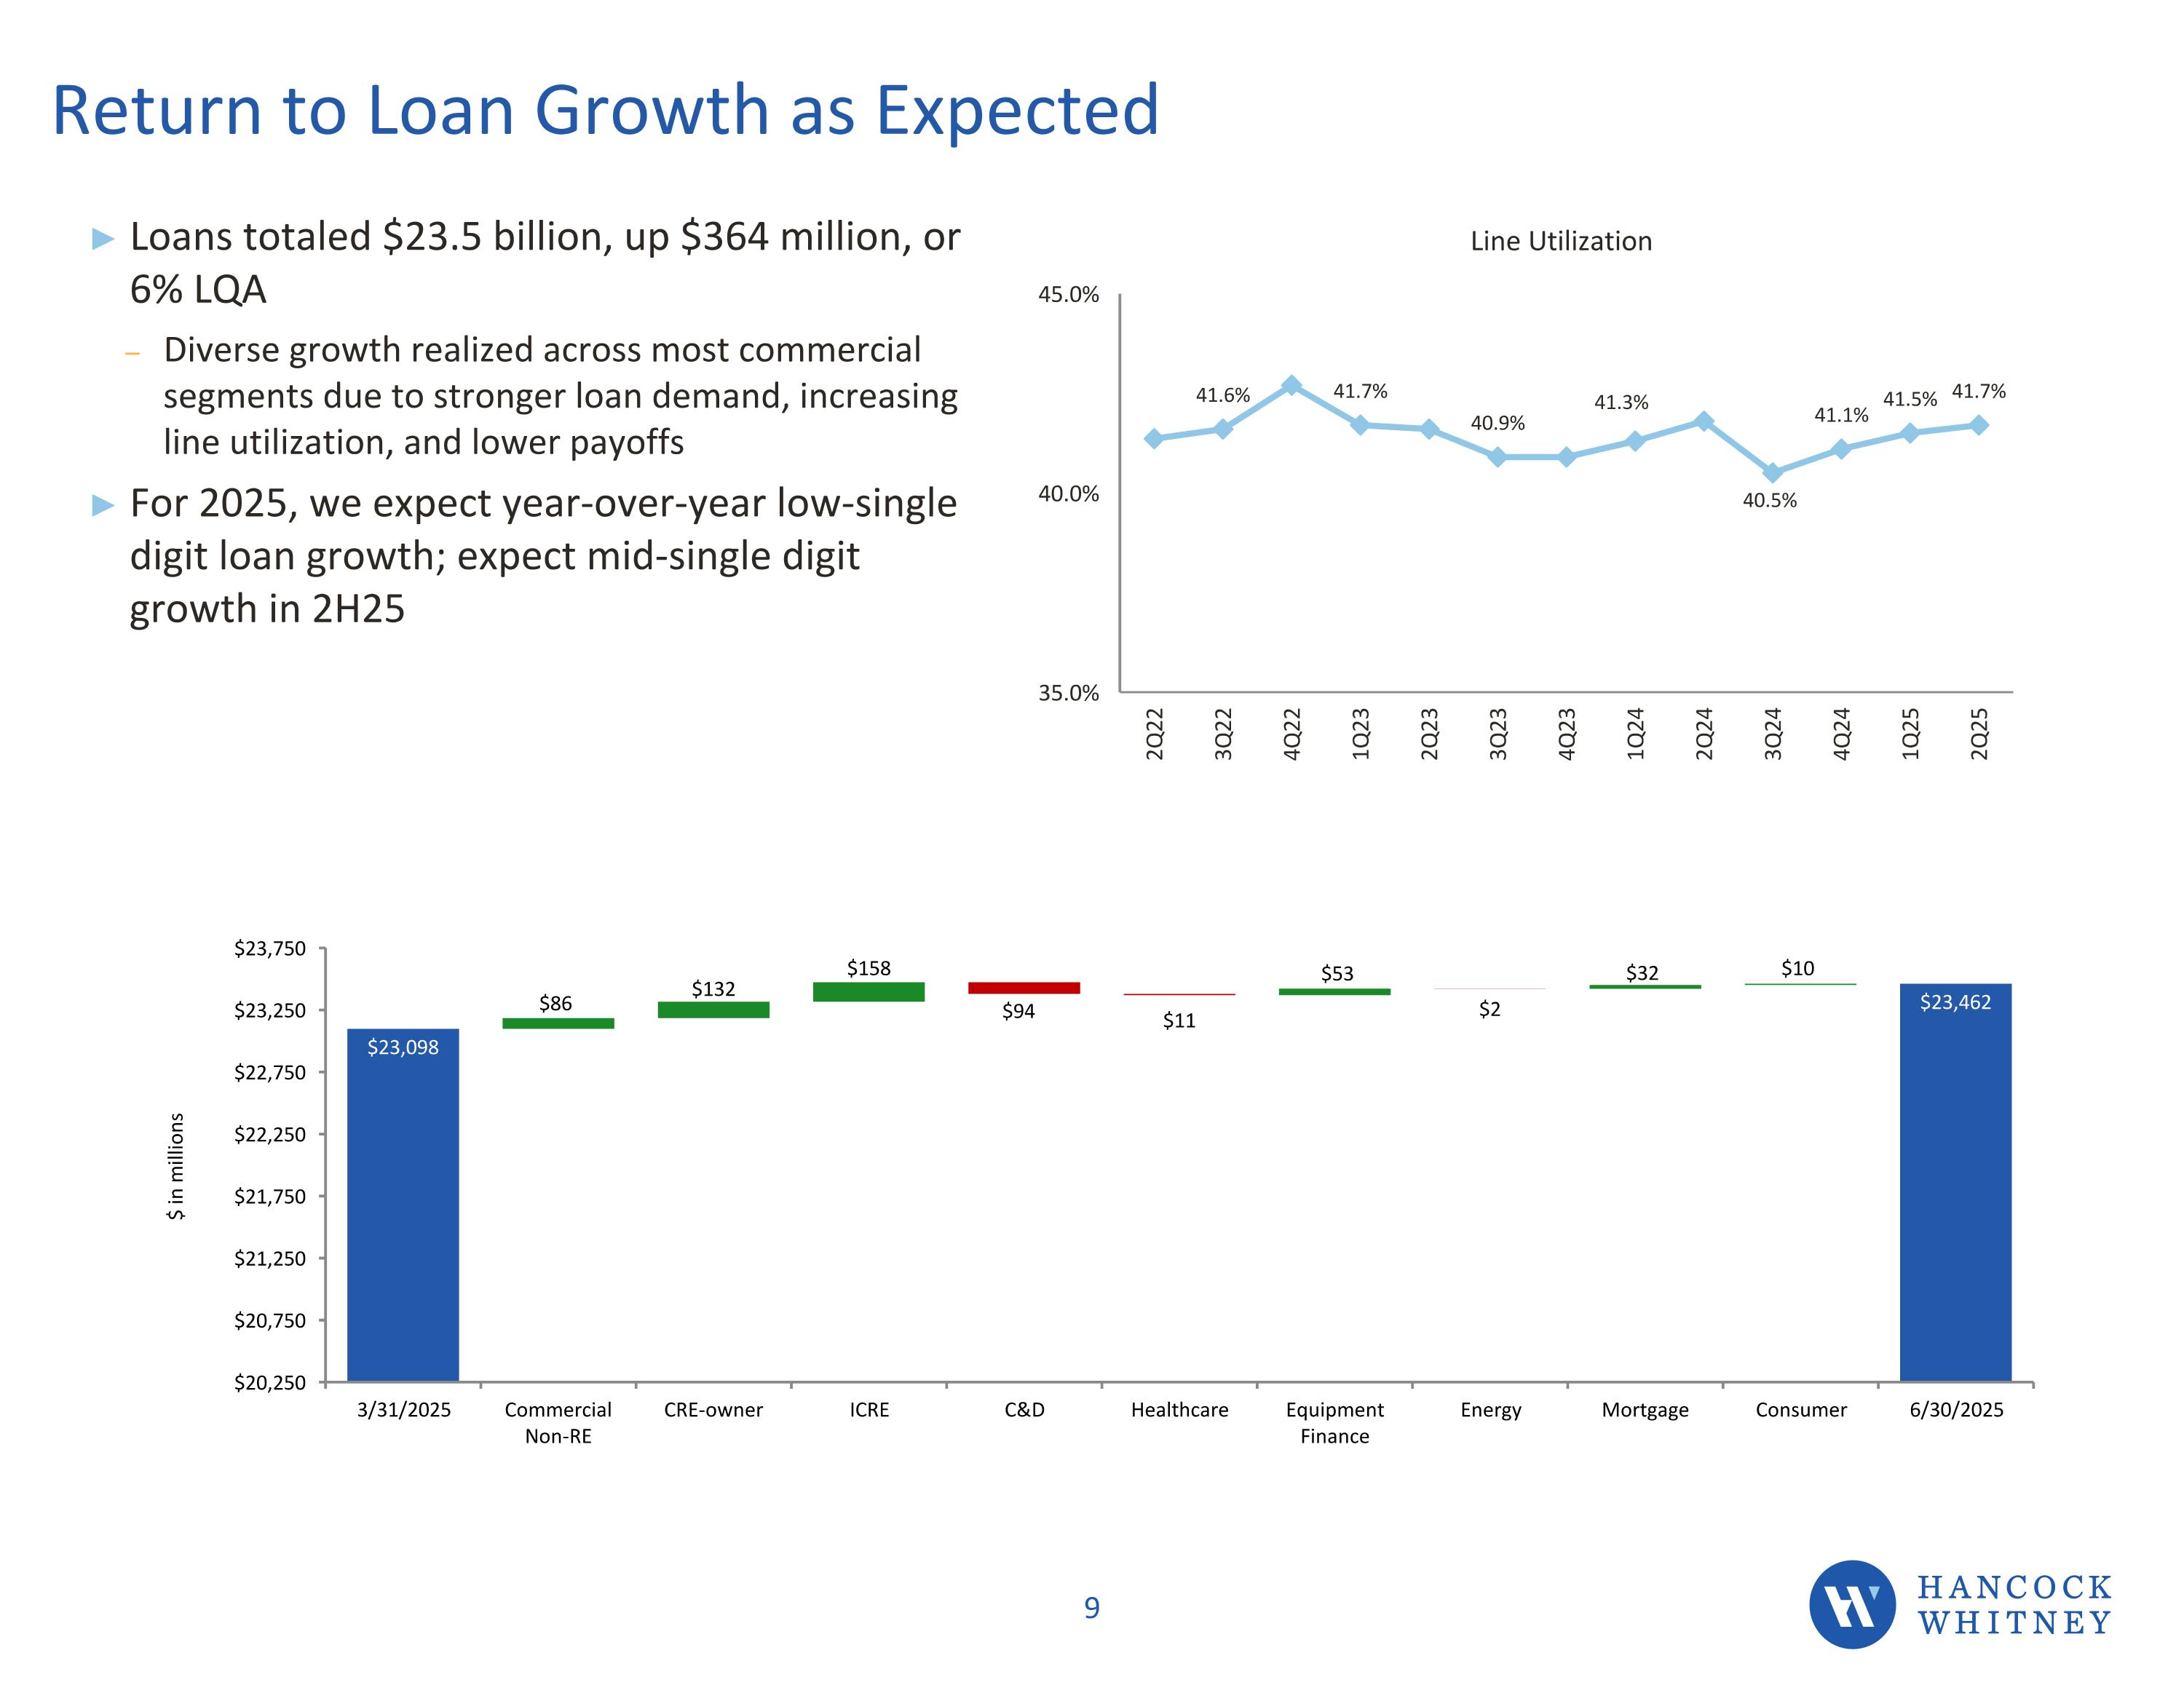
Return to Loan Growth as Expected Bar Chart Loans totaled $23.5 billion, up $364 million, or 6% LQA Diverse growth realized across most commercial segments due to stronger loan demand, increasing line utilization, and lower payoffs For 2025, we expect year-over-year low-single digit loan growth; expect mid-single digit growth in 2H25
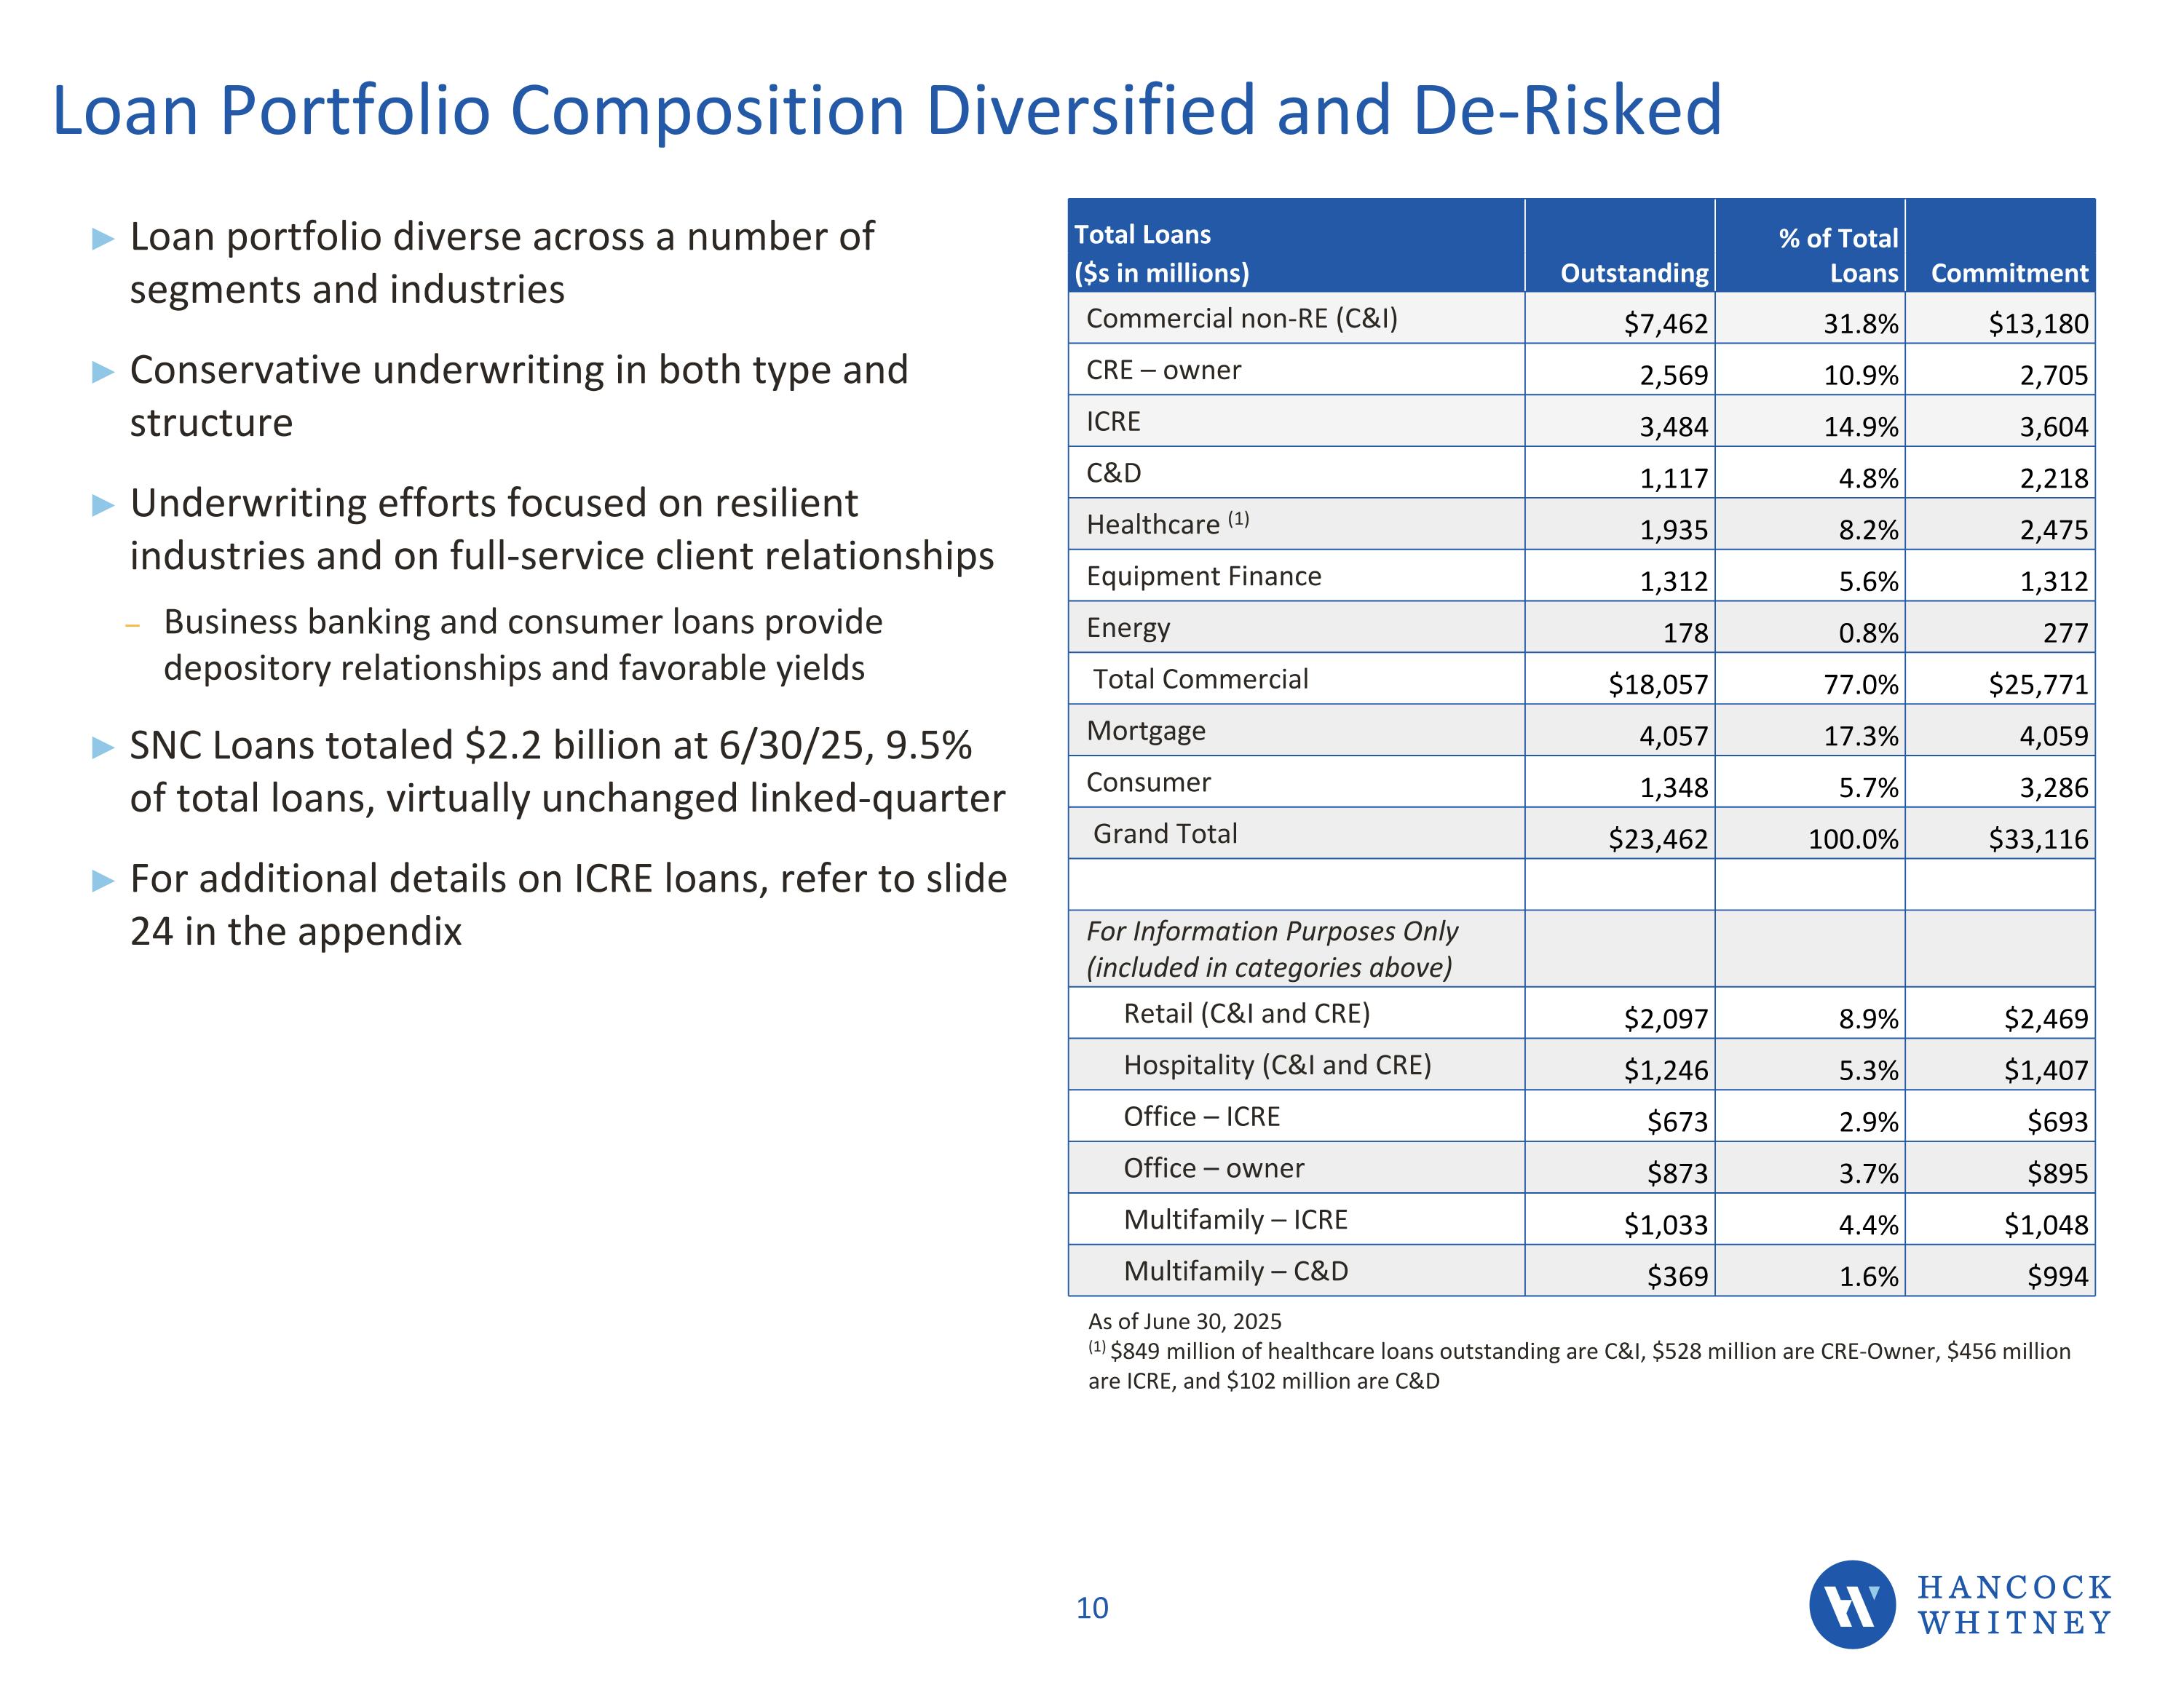
Loan Portfolio Composition Diversified and De-Risked Total Loans Outstanding % of Total Loans Commitment ($s in millions) Commercial non-RE (C&I) $7,462 31.8% $13,180 CRE – owner 2,569 10.9% 2,705 ICRE 3,484 14.9% 3,604 C&D 1,117 4.8% 2,218 Healthcare (1) 1,935 8.2% 2,475 Equipment Finance 1,312 5.6% 1,312 Energy 178 0.8% 277 Total Commercial $18,057 77.0% $25,771 Mortgage 4,057 17.3% 4,059 Consumer 1,348 5.7% 3,286 Grand Total $23,462 100.0% $33,116 For Information Purposes Only (included in categories above) Retail (C&I and CRE) $2,097 8.9% $2,469 Hospitality (C&I and CRE) $1,246 5.3% $1,407 Office – ICRE $673 2.9% $693 Office – owner $873 3.7% $895 Multifamily – ICRE $1,033 4.4% $1,048 Multifamily – C&D $369 1.6% $994 Loan portfolio diverse across a number of segments and industries Conservative underwriting in both type and structure Underwriting efforts focused on resilient industries and on full-service client relationships Business banking and consumer loans provide depository relationships and favorable yields SNC Loans totaled $2.2 billion at 6/30/25, 9.5% of total loans, virtually unchanged linked-quarter For additional details on ICRE loans, refer to slide 24 in the appendix As of June 30, 2025 (1) $849 million of healthcare loans outstanding are C&I, $528 million are CRE-Owner, $456 million are ICRE, and $102 million are C&D
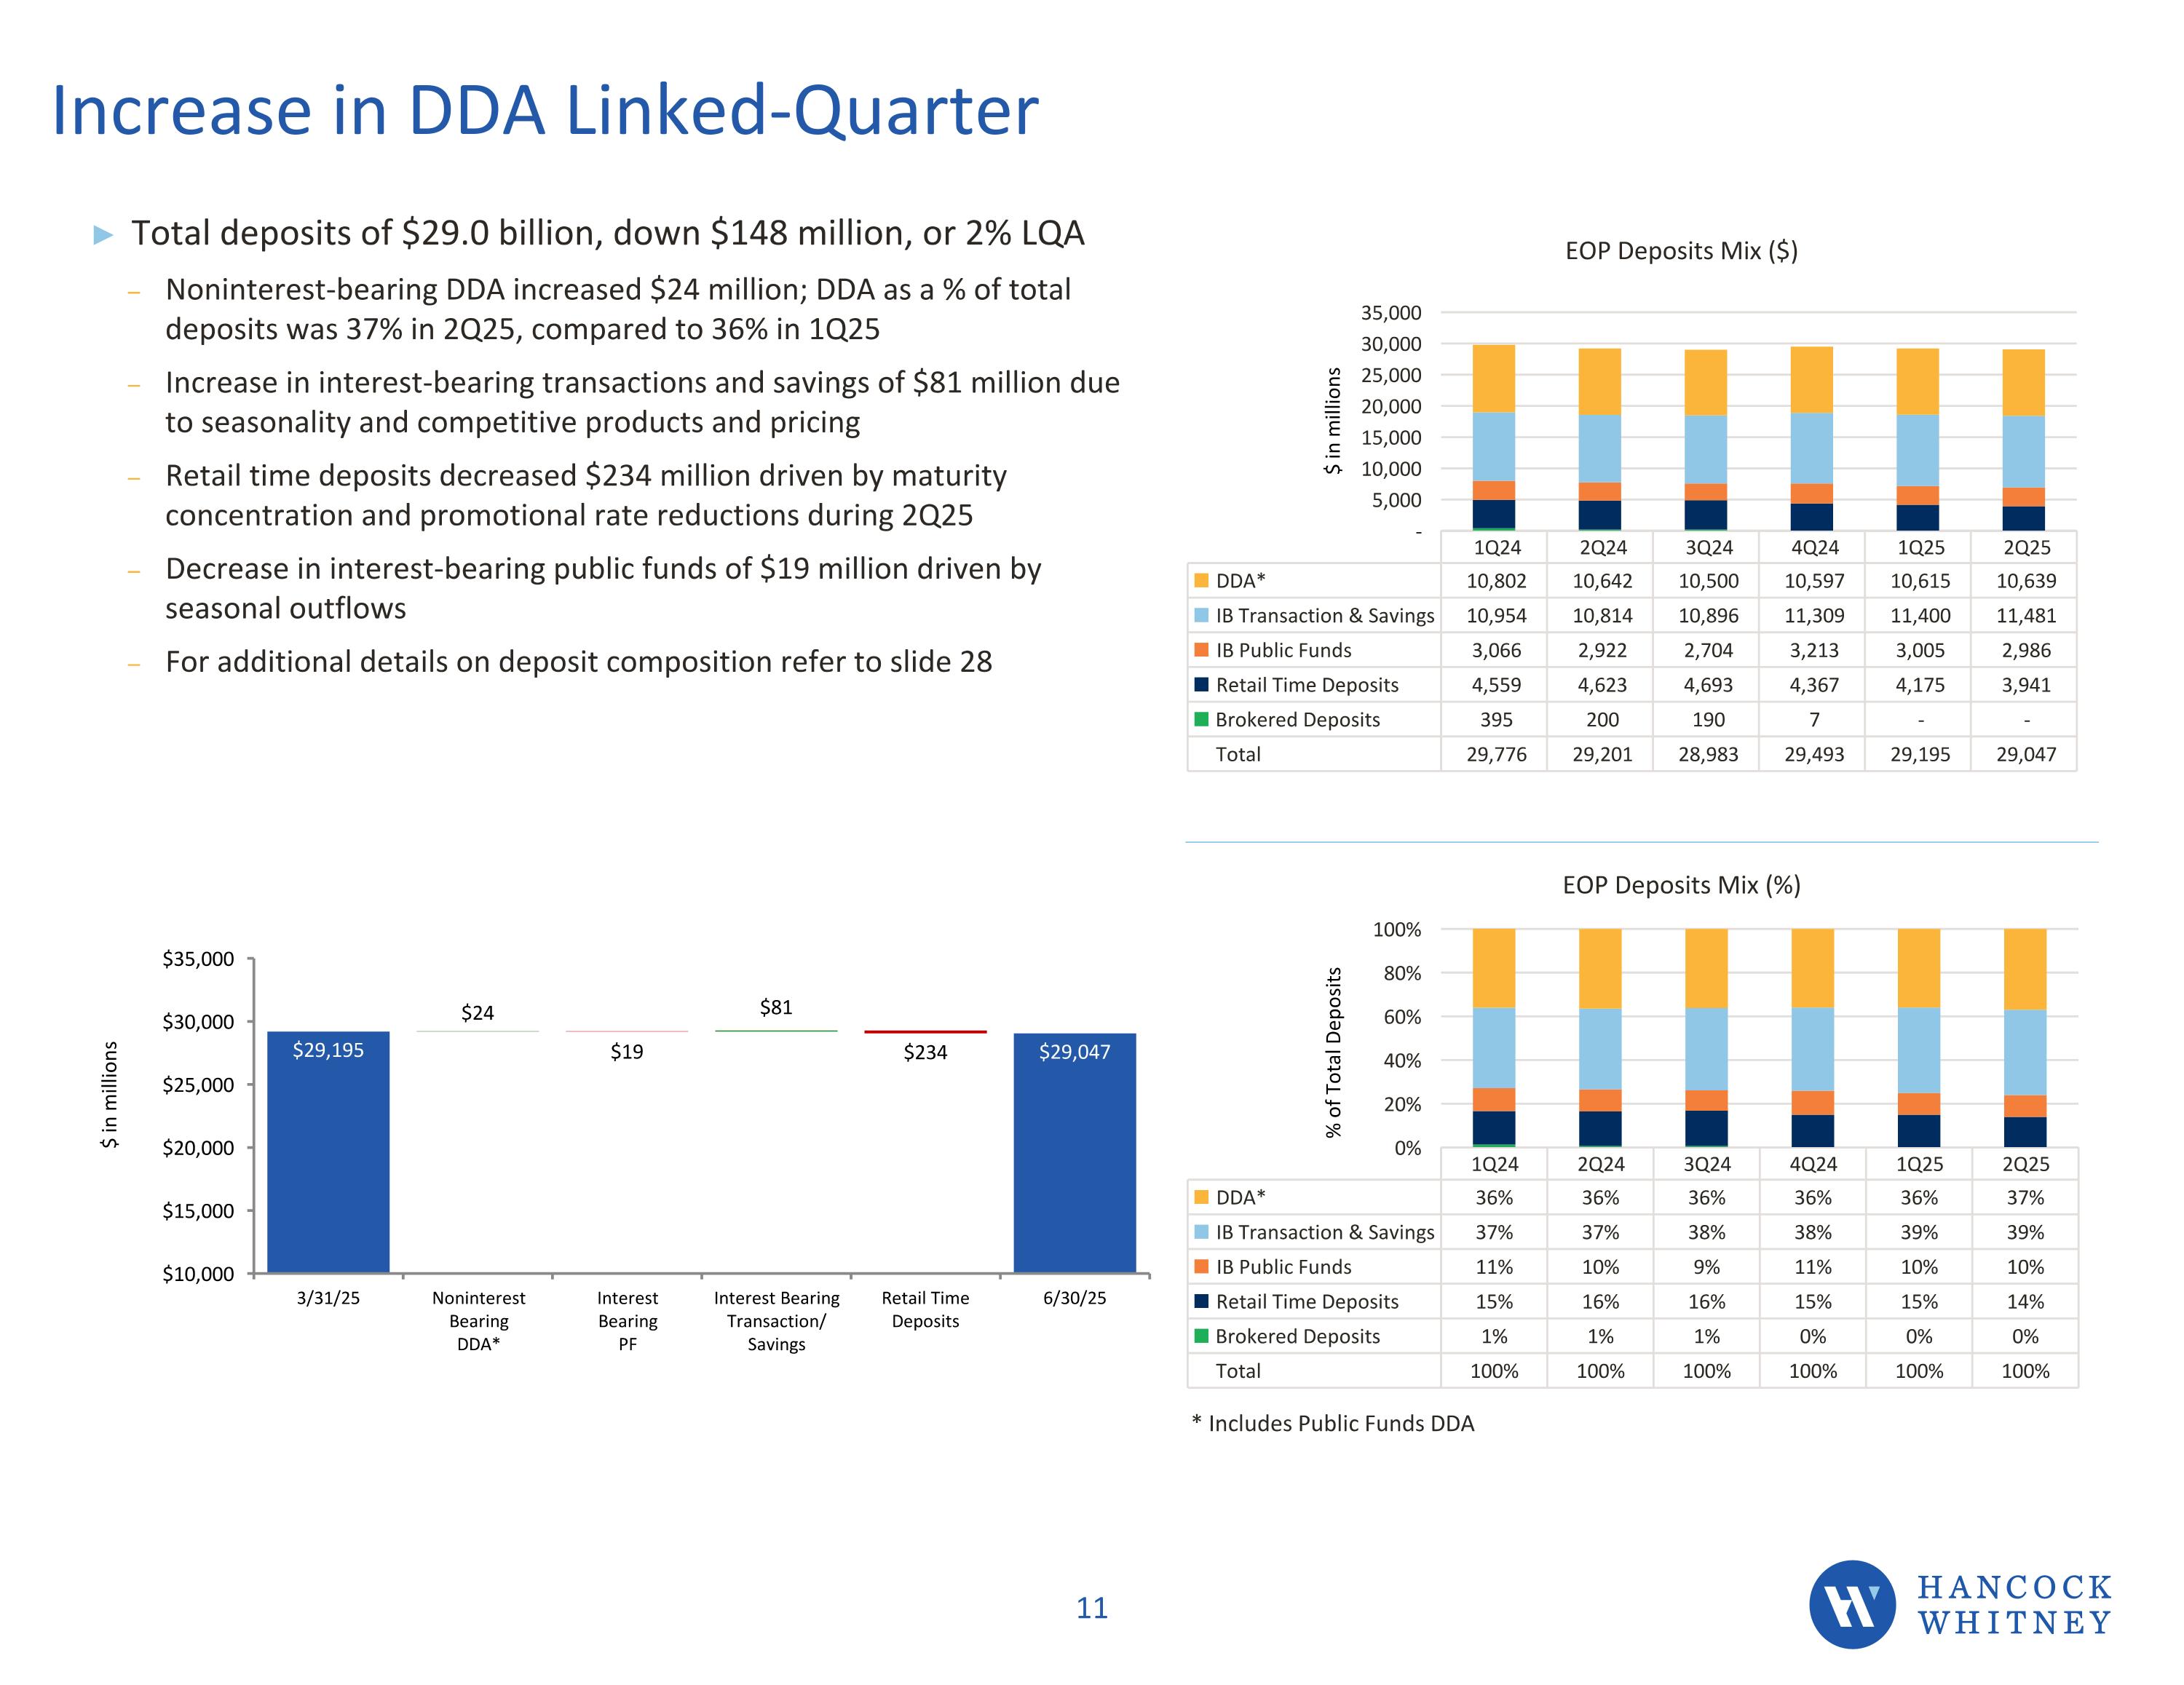
Increase in DDA Linked-Quarter Total deposits of $29.0 billion, down $148 million, or 2% LQA Noninterest-bearing DDA increased $24 million; DDA as a % of total deposits was 37% in 2Q25, compared to 36% in 1Q25 Increase in interest-bearing transactions and savings of $81 million due to seasonality and competitive products and pricing Retail time deposits decreased $234 million driven by maturity concentration and promotional rate reductions during 2Q25 Decrease in interest-bearing public funds of $19 million driven by seasonal outflows For additional details on deposit composition refer to slide 28 EOP Deposits Mix ($) EOP Deposits Mix (%) * Includes Public Funds DDA $ in millions % of Total Deposits
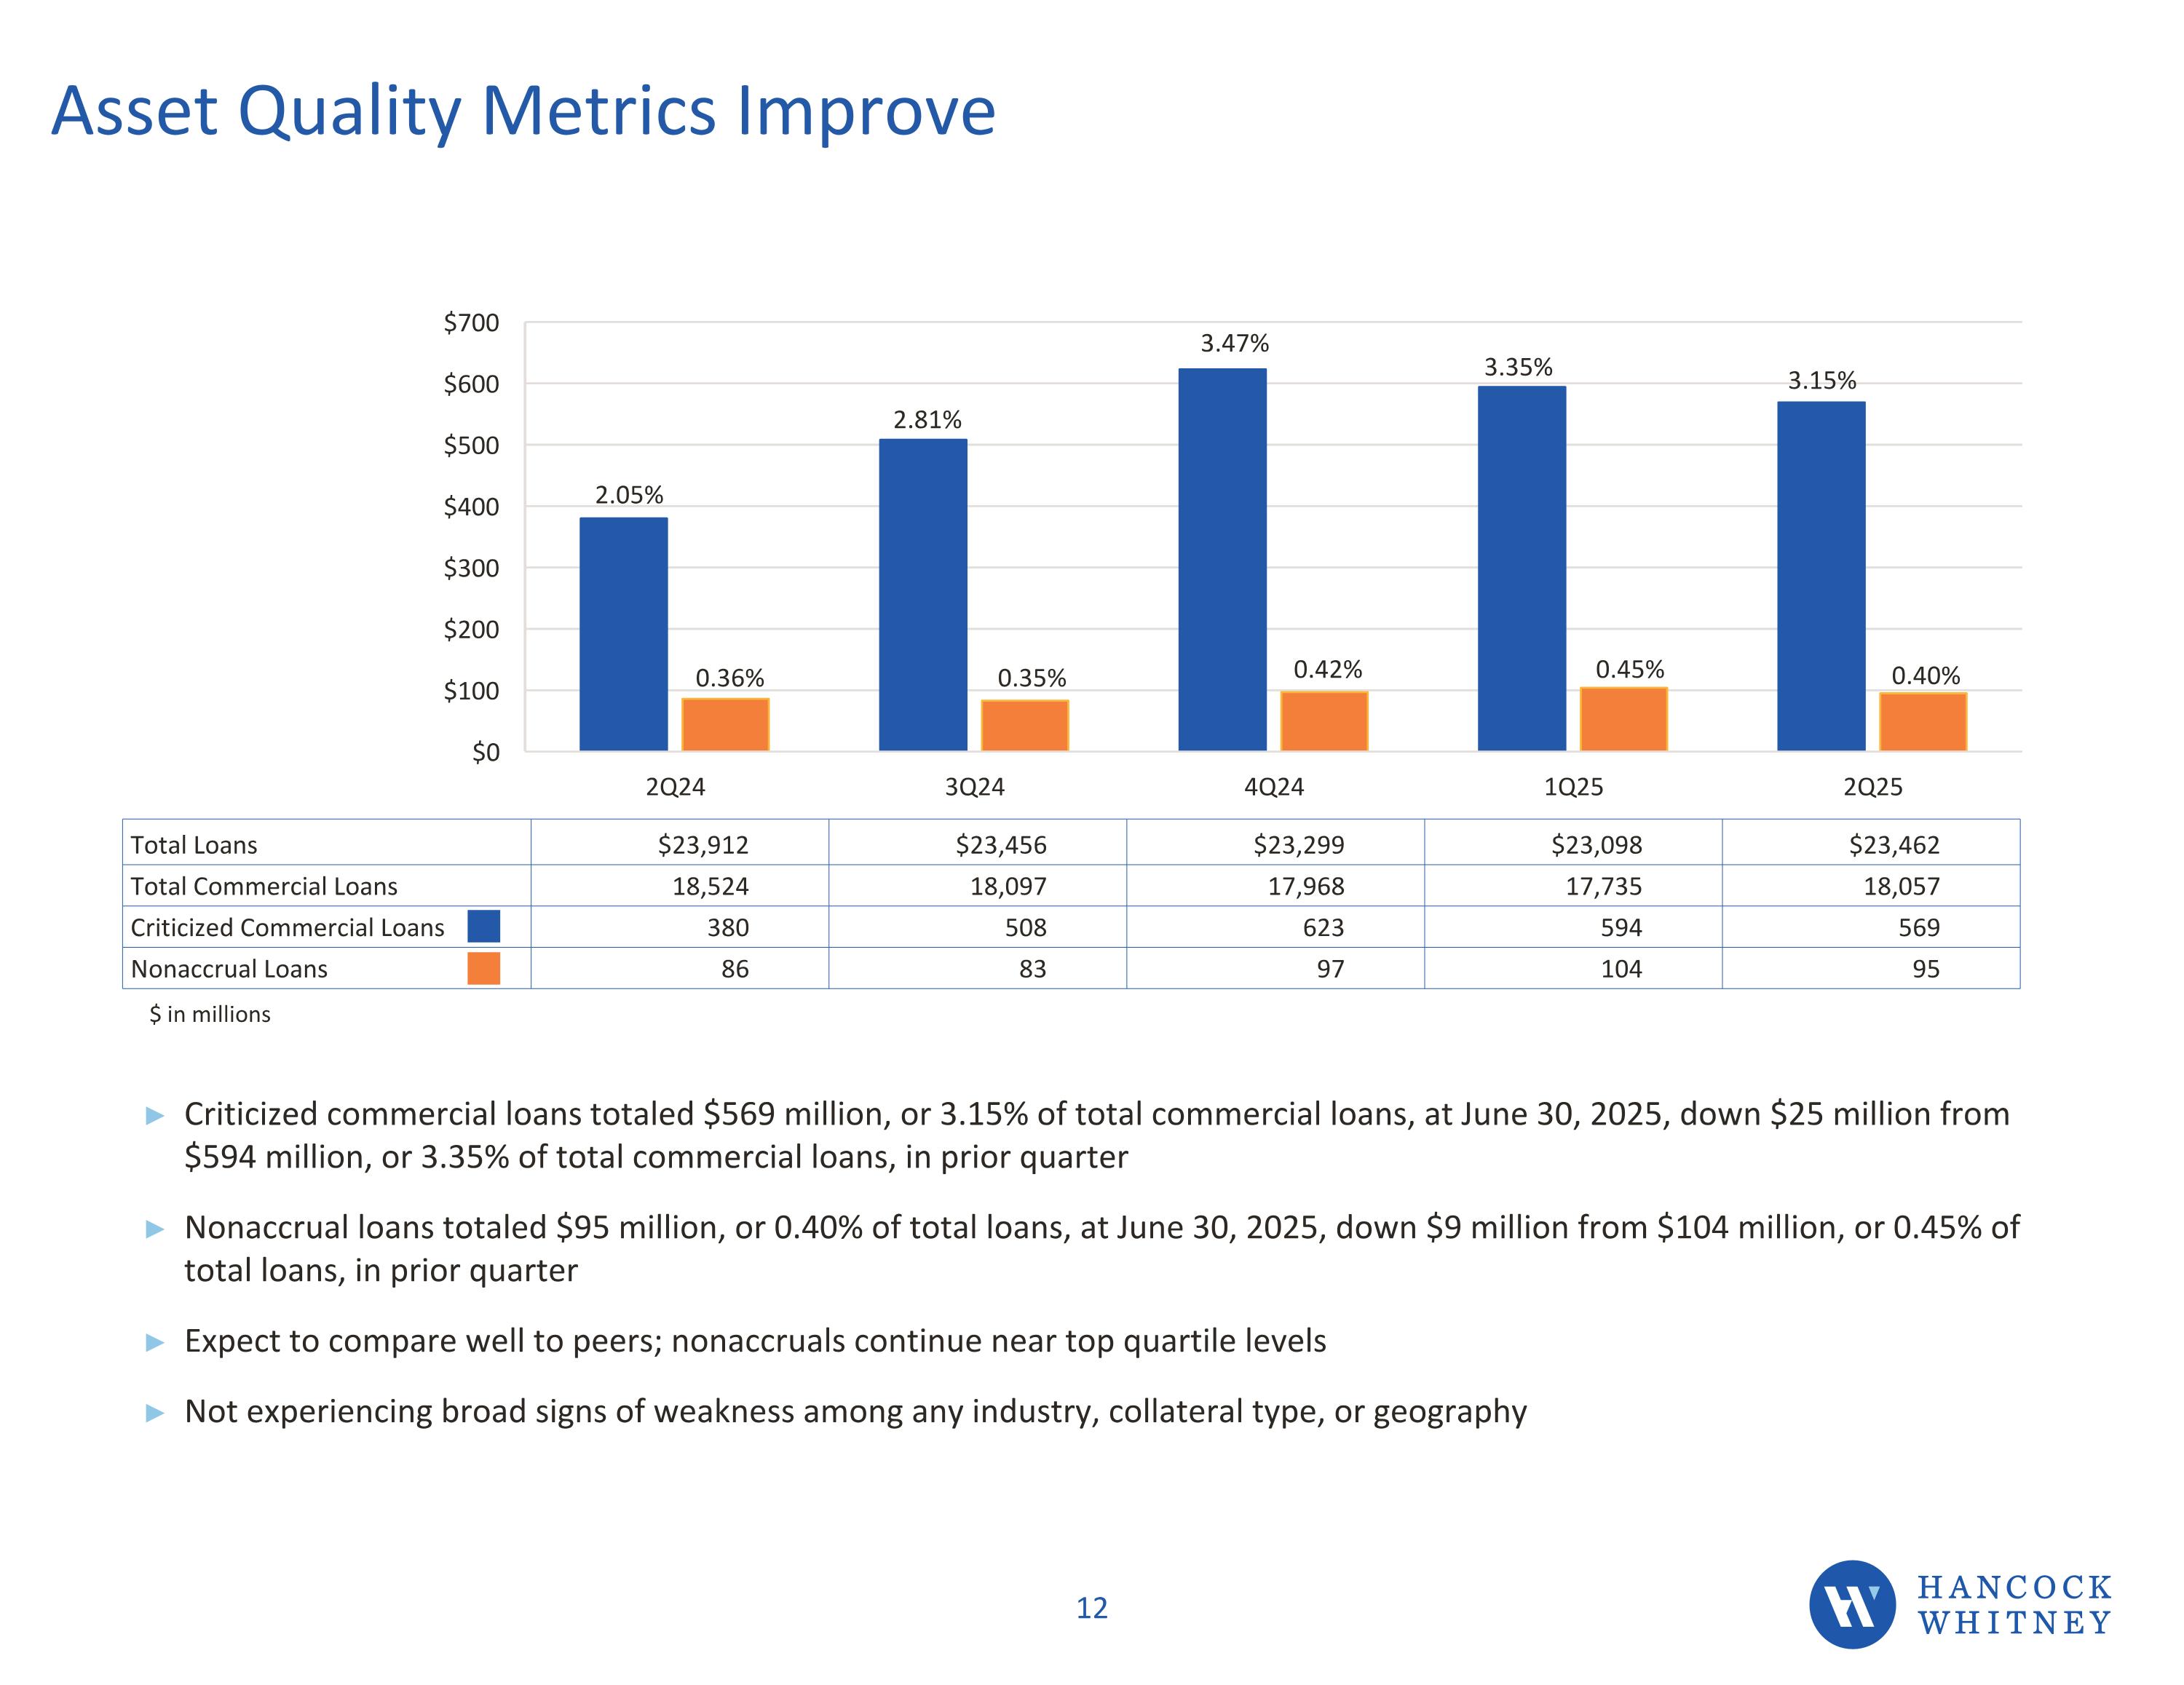
Asset Quality Metrics Improve Criticized commercial loans totaled $569 million, or 3.15% of total commercial loans, at June 30, 2025, down $25 million from $594 million, or 3.35% of total commercial loans, in prior quarter Nonaccrual loans totaled $95 million, or 0.40% of total loans, at June 30, 2025, down $9 million from $104 million, or 0.45% of total loans, in prior quarter Expect to compare well to peers; nonaccruals continue near top quartile levels Not experiencing broad signs of weakness among any industry, collateral type, or geography Total Loans $23,912 $23,456 $23,299 $23,098 $23,462 Total Commercial Loans 18,524 18,097 17,968 17,735 18,057 Criticized Commercial Loans 380 508 623 594 569 Nonaccrual Loans 86 83 97 104 95 2.05% 0.36% 2.81% 0.35% $ in millions 3.47% 0.42% 3.35% 0.45% 3.15% 0.40%
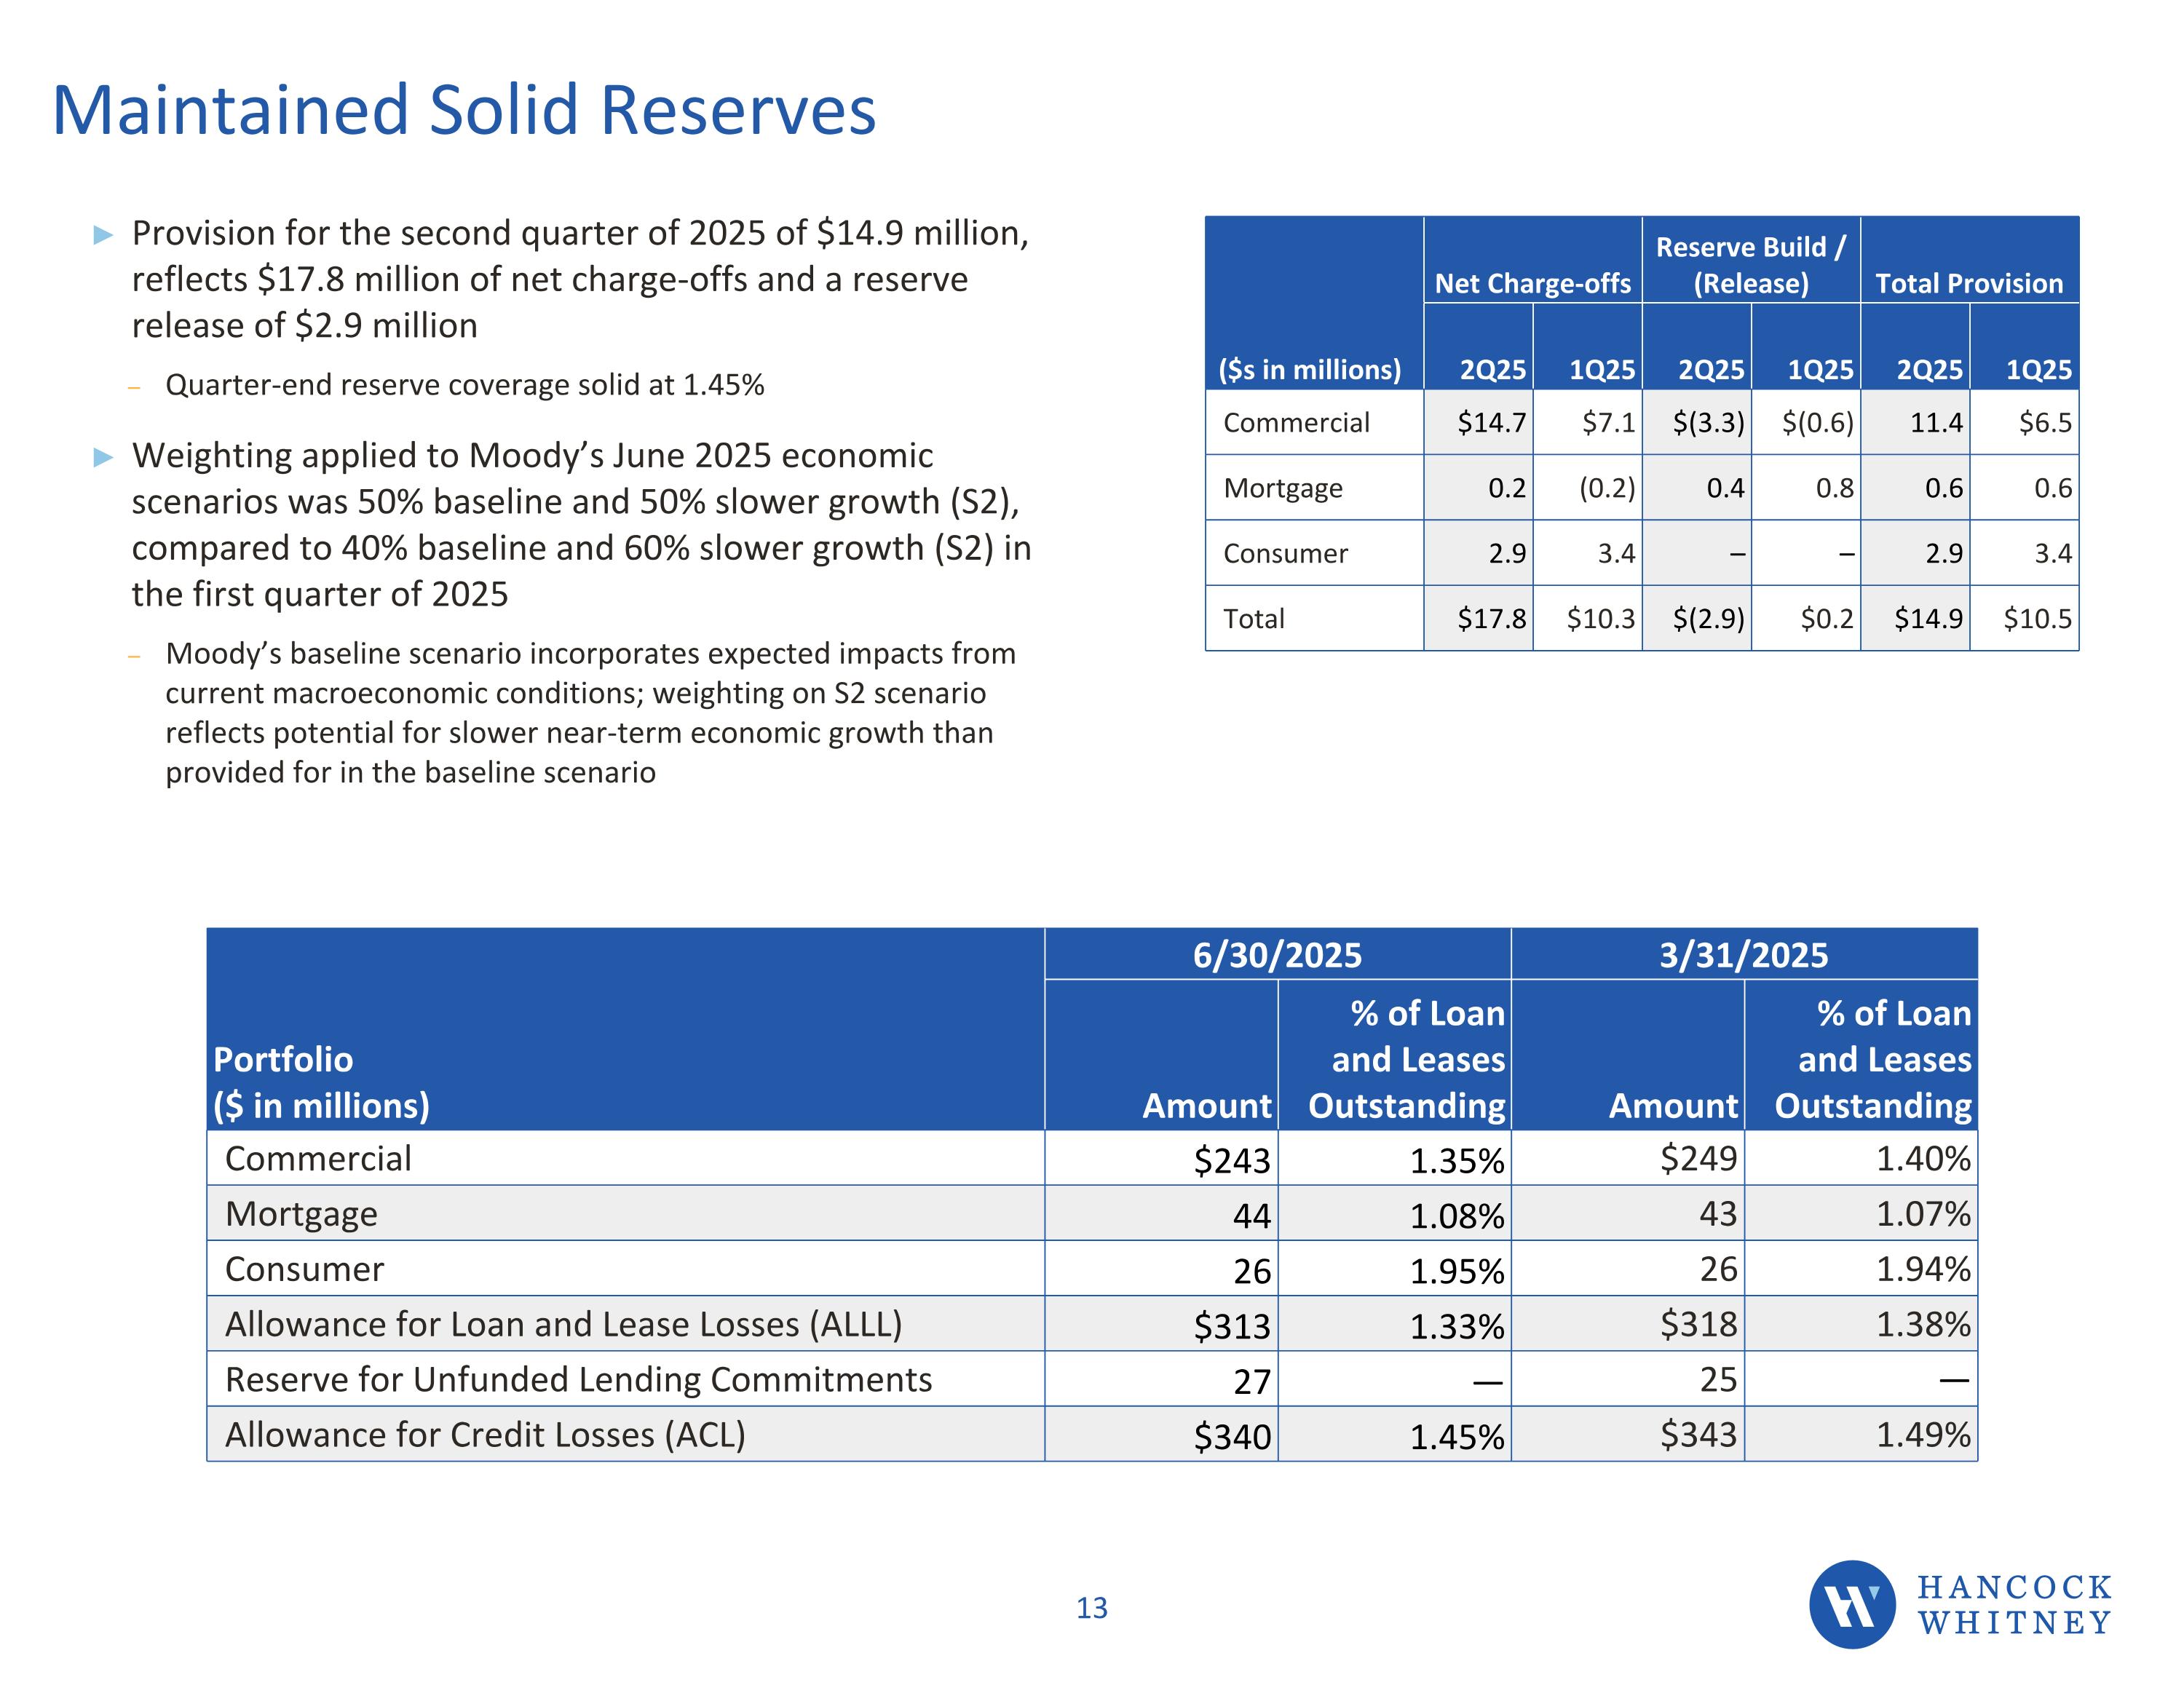
Maintained Solid Reserves Provision for the second quarter of 2025 of $14.9 million, reflects $17.8 million of net charge-offs and a reserve release of $2.9 million Quarter-end reserve coverage solid at 1.45% Weighting applied to Moody’s June 2025 economic scenarios was 50% baseline and 50% slower growth (S2), compared to 40% baseline and 60% slower growth (S2) in the first quarter of 2025 Moody’s baseline scenario incorporates expected impacts from current macroeconomic conditions; weighting on S2 scenario reflects potential for slower near-term economic growth than provided for in the baseline scenario Net Charge-offs Reserve Build / (Release) Total Provision ($s in millions) 2Q25 1Q25 2Q25 1Q25 2Q25 1Q25 Commercial $14.7 $7.1 $(3.3) $(0.6) 11.4 $6.5 Mortgage 0.2 (0.2) 0.4 0.8 0.6 0.6 Consumer 2.9 3.4 – – 2.9 3.4 Total $17.8 $10.3 $(2.9) $0.2 $14.9 $10.5 Portfolio ($ in millions) 6/30/2025 3/31/2025 Amount % of Loan and Leases Outstanding Amount % of Loan and Leases Outstanding Commercial $243 1.35% $249 1.40% Mortgage 44 1.08% 43 1.07% Consumer 26 1.95% 26 1.94% Allowance for Loan and Lease Losses (ALLL) $313 1.33% $318 1.38% Reserve for Unfunded Lending Commitments 27 — 25 — Allowance for Credit Losses (ACL) $340 1.45% $343 1.49%
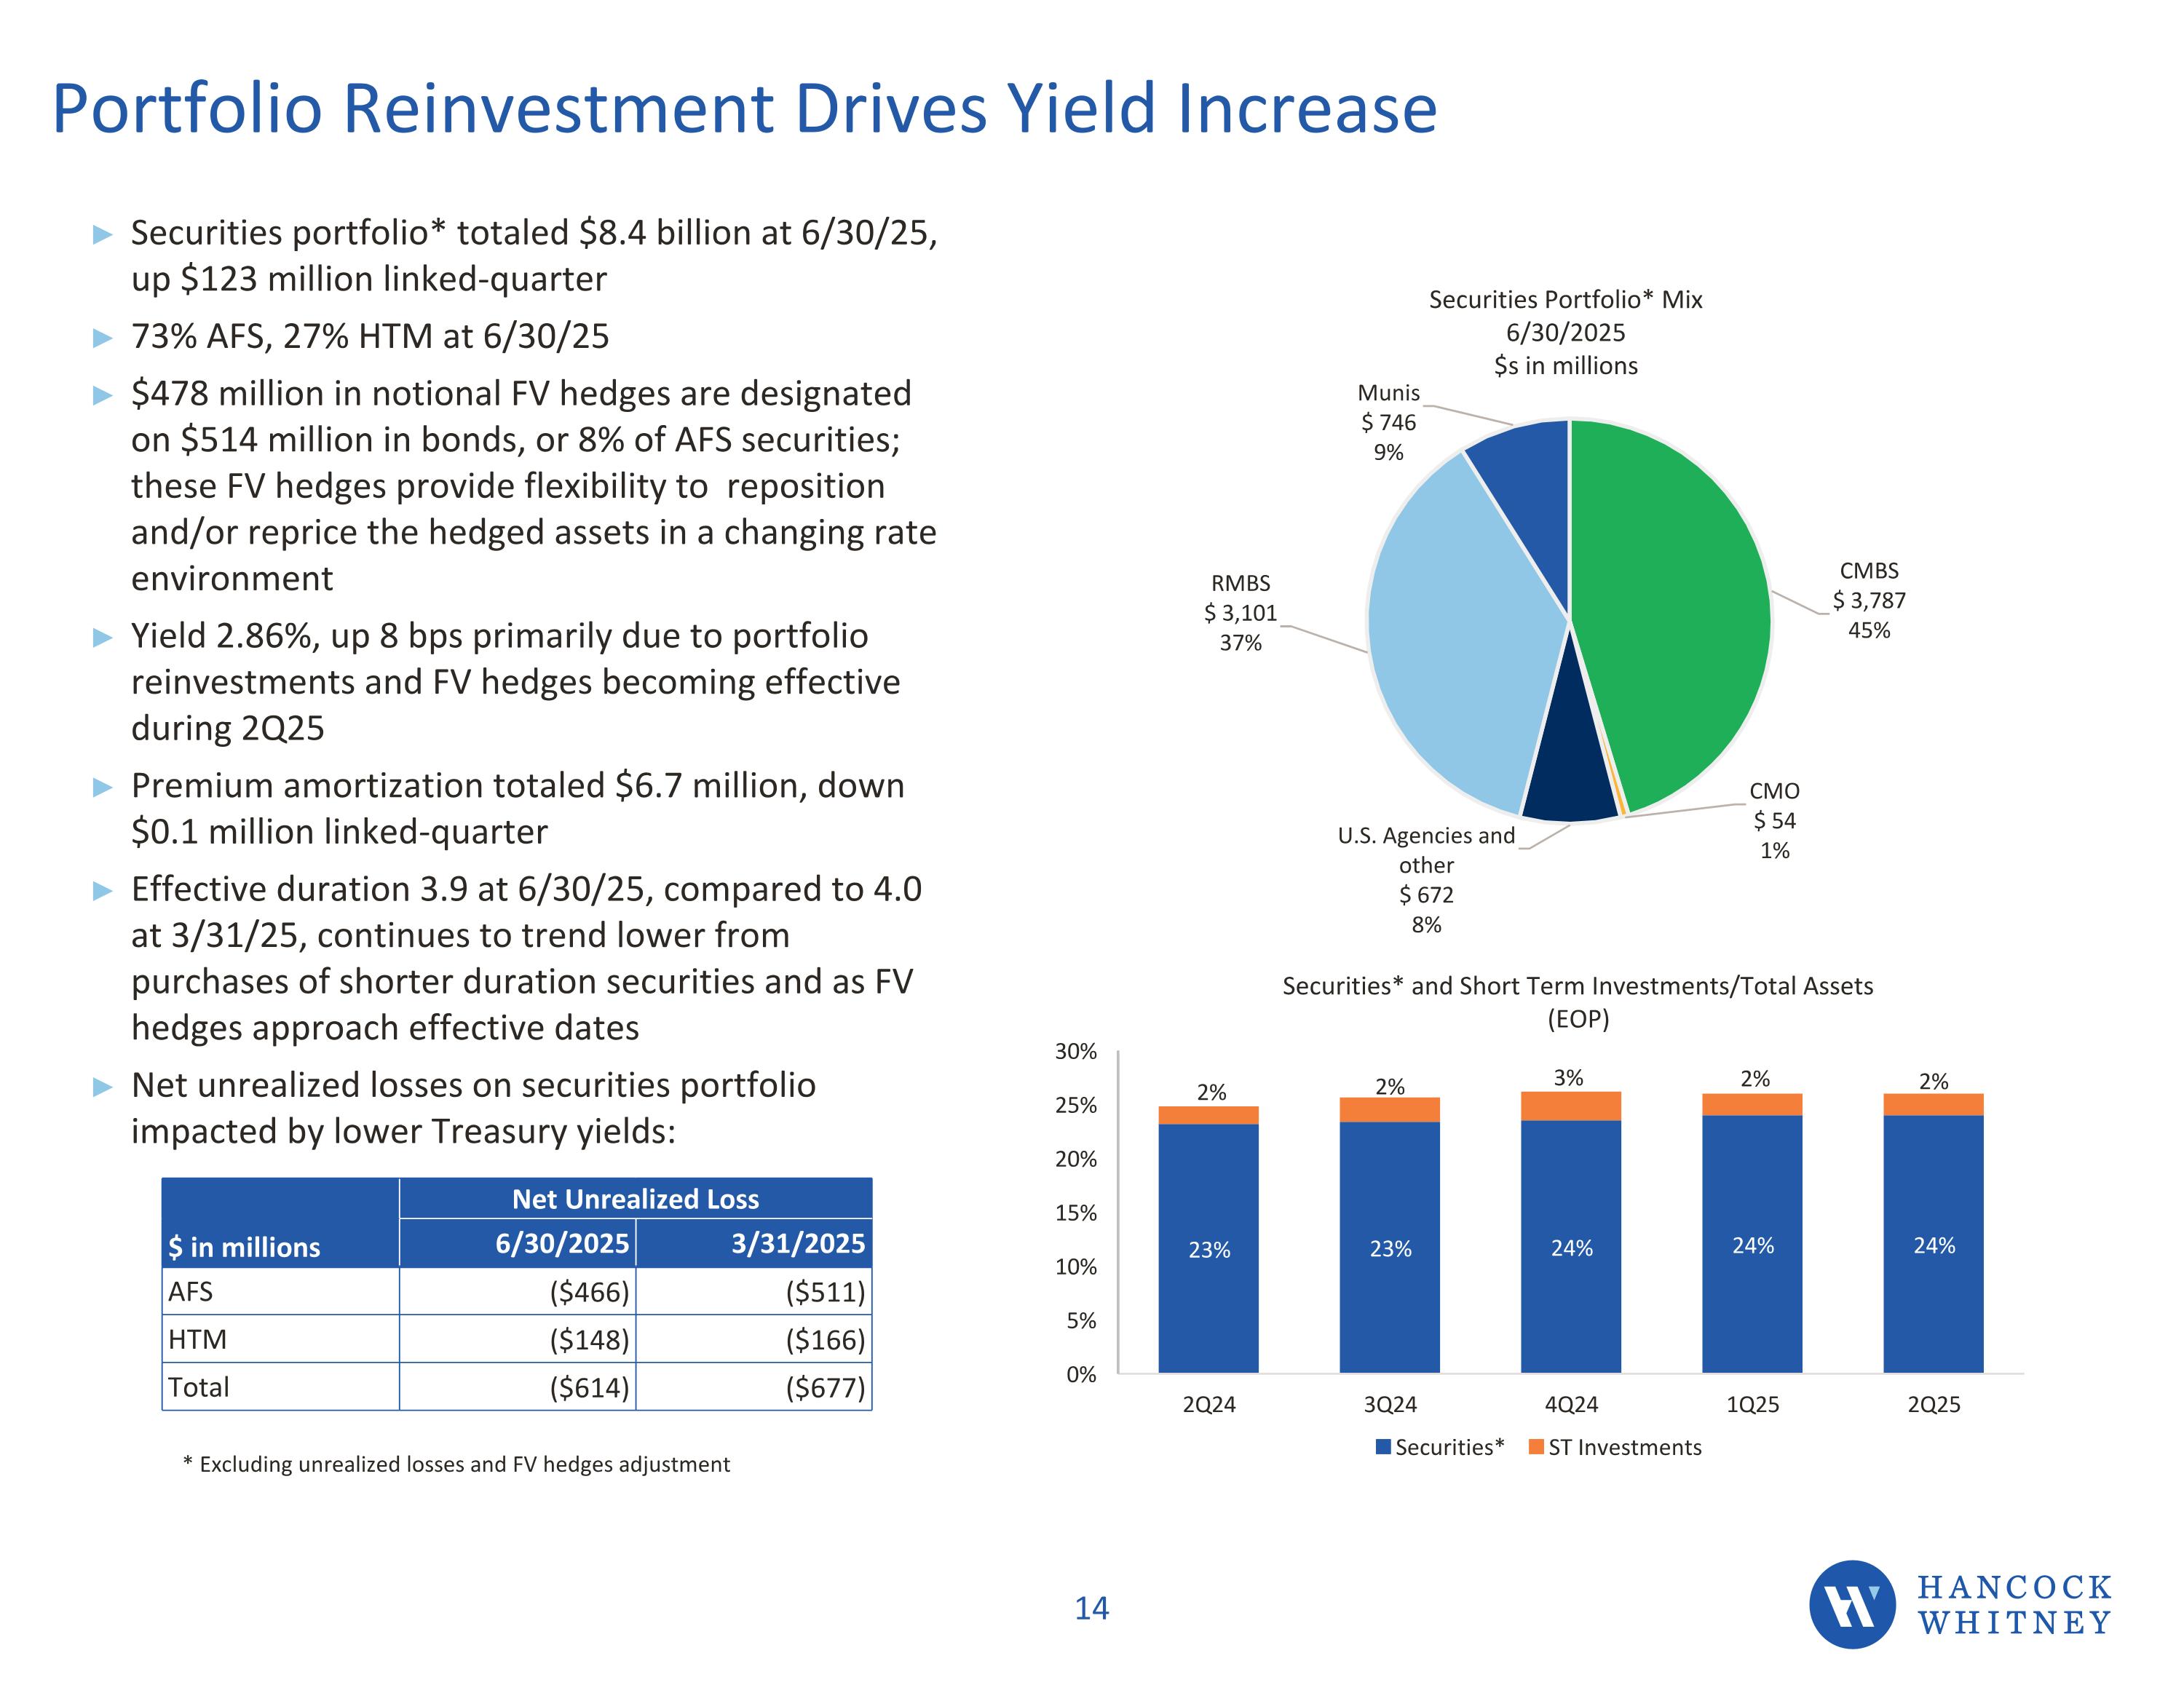
Portfolio Reinvestment Drives Yield Increase Securities portfolio* totaled $8.4 billion at 6/30/25, up $123 million linked-quarter 73% AFS, 27% HTM at 6/30/25 $478 million in notional FV hedges are designated on $514 million in bonds, or 8% of AFS securities; these FV hedges provide flexibility to reposition and/or reprice the hedged assets in a changing rate environment Yield 2.86%, up 8 bps primarily due to portfolio reinvestments and FV hedges becoming effective during 2Q25 Premium amortization totaled $6.7 million, down $0.1 million linked-quarter Effective duration 3.9 at 6/30/25, compared to 4.0 at 3/31/25, continues to trend lower from purchases of shorter duration securities and as FV hedges approach effective dates Net unrealized losses on securities portfolio impacted by lower Treasury yields: Bar chart,pie chart Net Unrealized Loss $ in millions 6/30/2025 3/31/2025 AFS ($466) ($511) HTM ($148) ($166) Total ($614) ($677) * Excluding unrealized losses and FV hedges adjustment
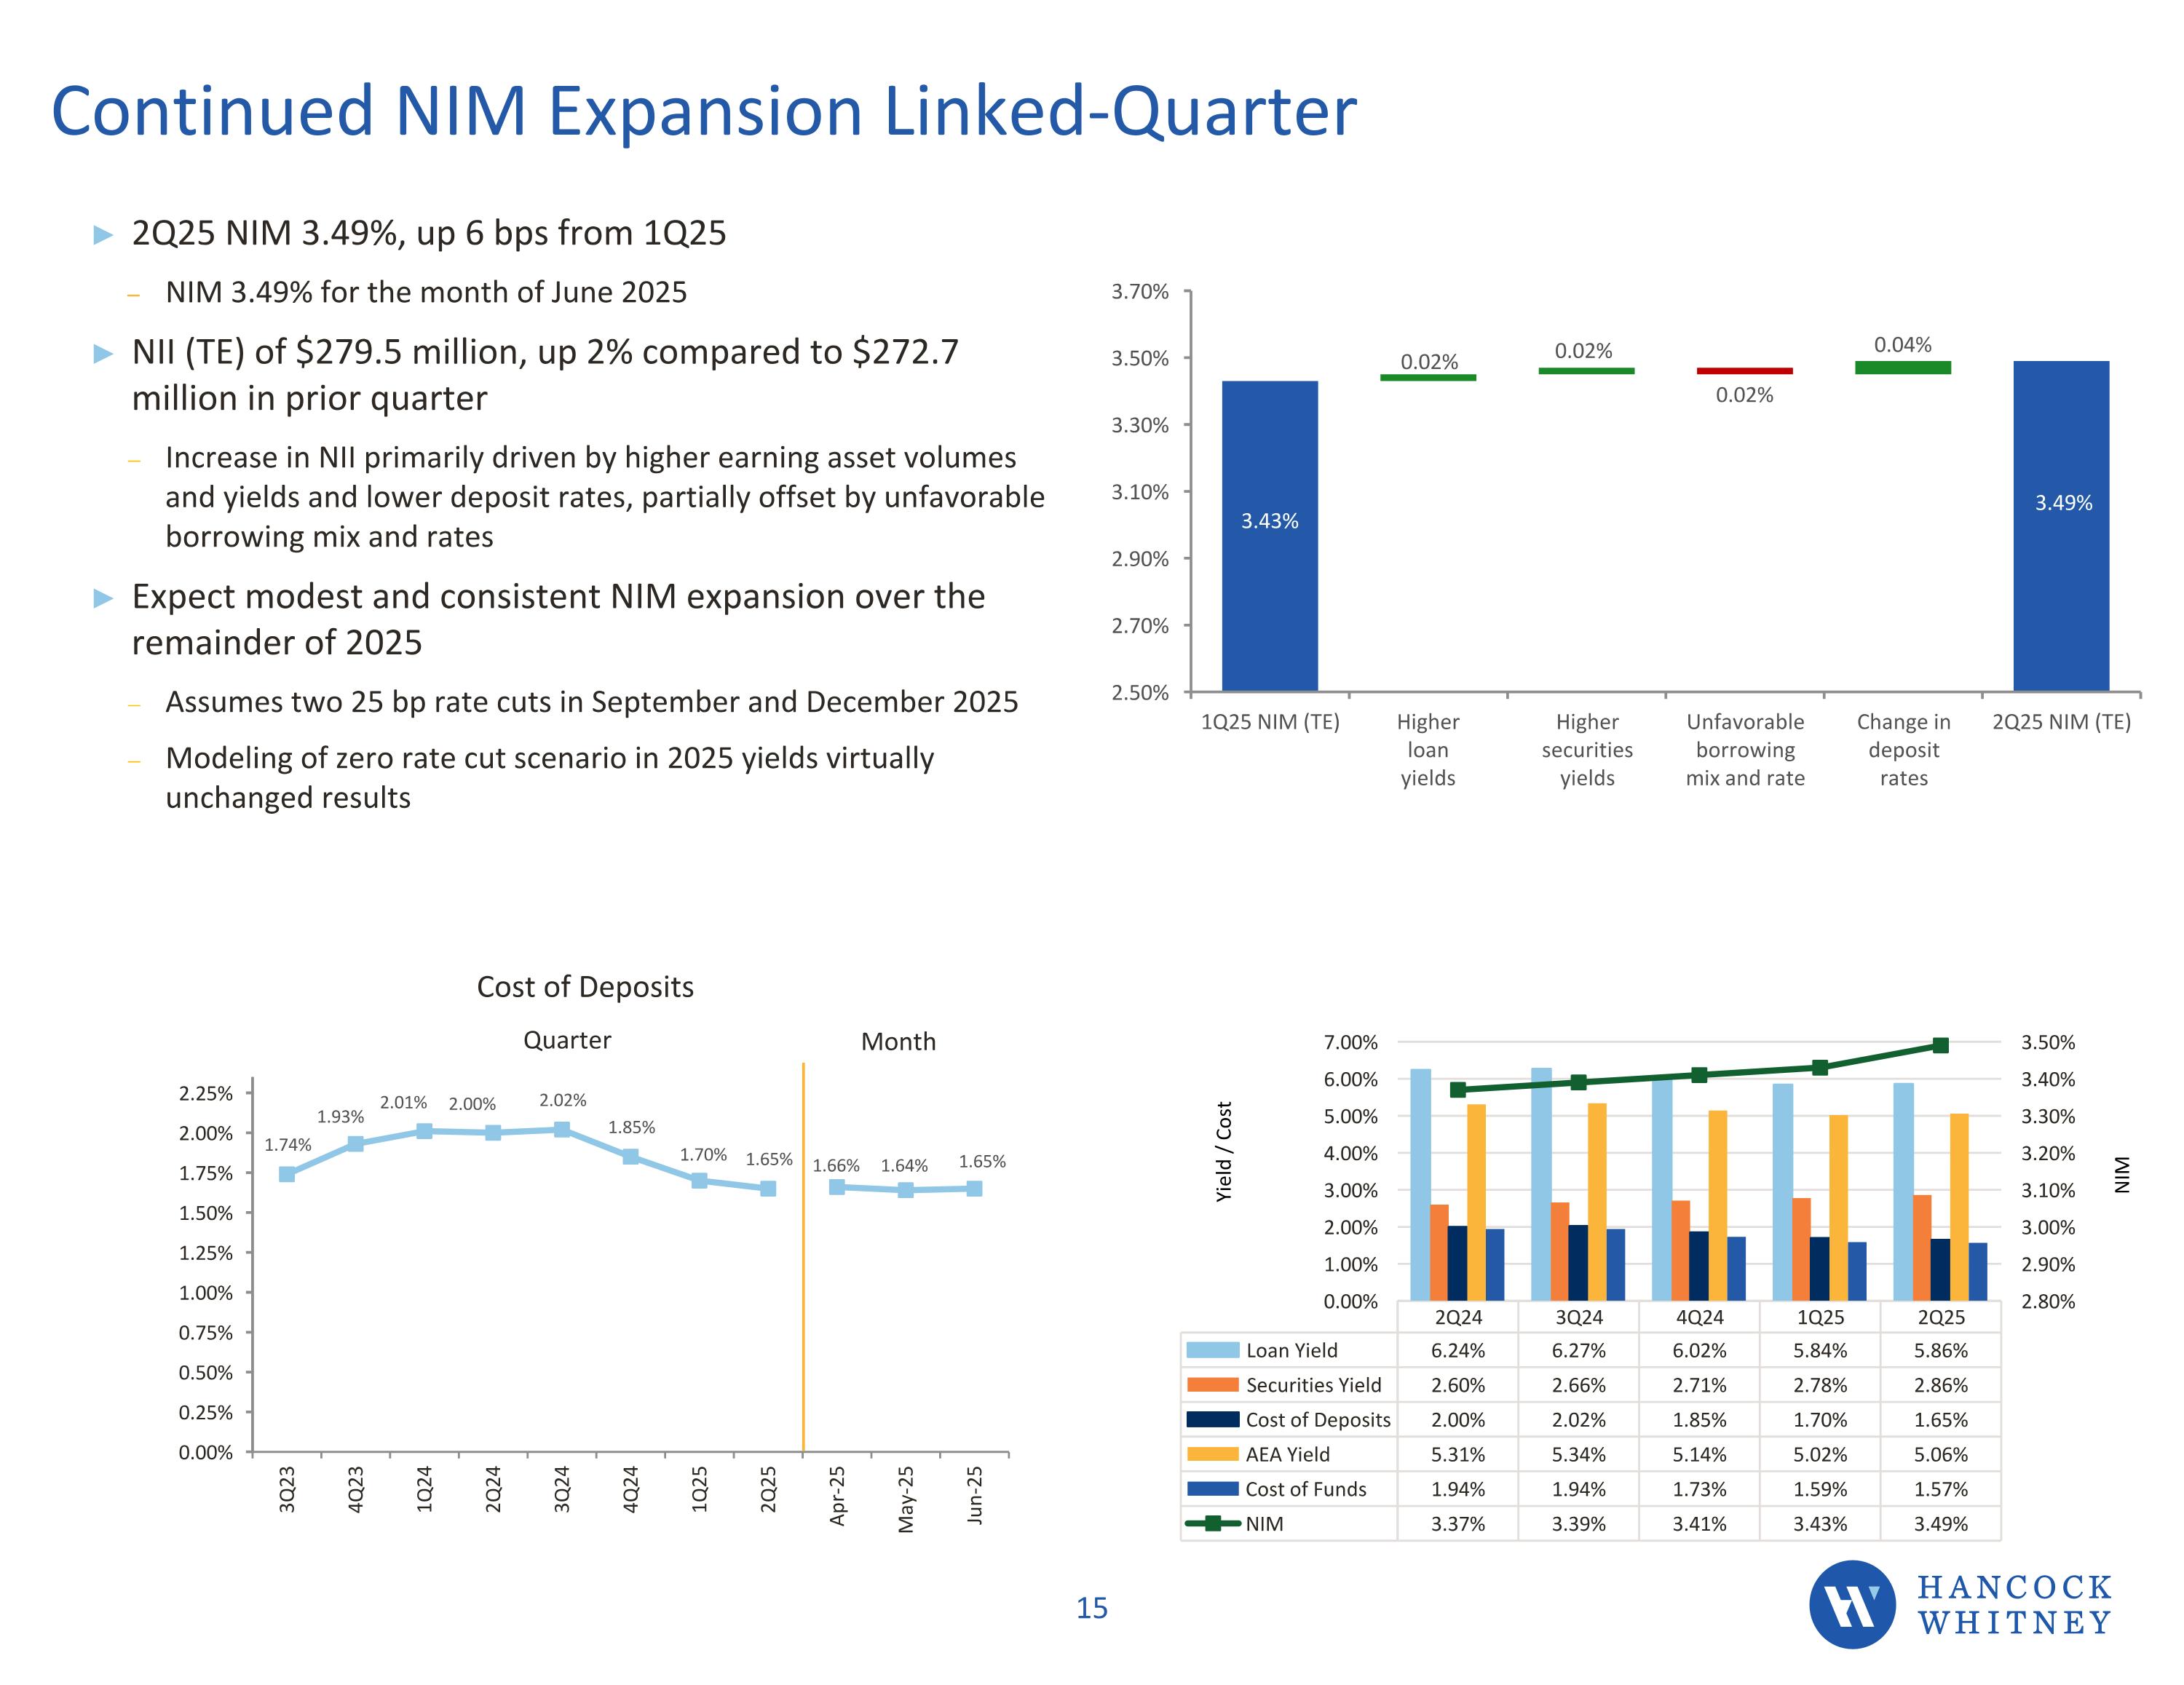
2Q25 NIM 3.49%, up 6 bps from 1Q25 NIM 3.49% for the month of June 2025 NII (TE) of $279.5 million, up 2% compared to $272.7 million in prior quarter Increase in NII primarily driven by higher earning asset volumes and yields and lower deposit rates, partially offset by unfavorable borrowing mix and rates Expect modest and consistent NIM expansion over the remainder of 2025 Assumes two 25 bp rate cuts in September and December 2025 Modeling of zero rate cut scenario in 2025 yields virtually unchanged results Continued NIM Expansion Linked-Quarter Cost of Deposits 0.60% 0.50% 0.40% 0.30% 0.20% 0.10% Mar-20 Apr-20 May-20 Jun 20 Jul-20 Aug-20 Sep-20 Oct-20 Nov-20 Dec-20 Mar-21e .59% .41% .33% .29% .25% .21% .20% .19% .17% .17% .13% 3.40% 3.30% 3.20% 3.10% 3.00% 2.90% 2.80% 3Q20 NIM (TE) Impact of Securities Portfolio Purchase/Premium amortization Impact of change in earnings asset mix Lower cost of deposits Net impact of interest reversals and recoveries/loan fees accretion 4Q20 NIM (TE) 0.02% 0.06% 0.05% 0.02% 5.00% 4.00% 3.00% 2.00% 1.00% 0.00% 4Q19 1Q20 2Q20 3Q20 4Q20 4.69% 3.43% 2.56% 0.76% 4.56% 3.41% 2.53% 0.67% 4.04% 3.23% 2.47% 0.38% 3.95% 3.23% 2.31% 0.30% 3.99% 3.22% 2.23% 0.25% Loan Yield Securities Yield Cost of Fund NIM HNCOCK WHITNEY 18 Line chart Yield / Cost Quarter Month NIM
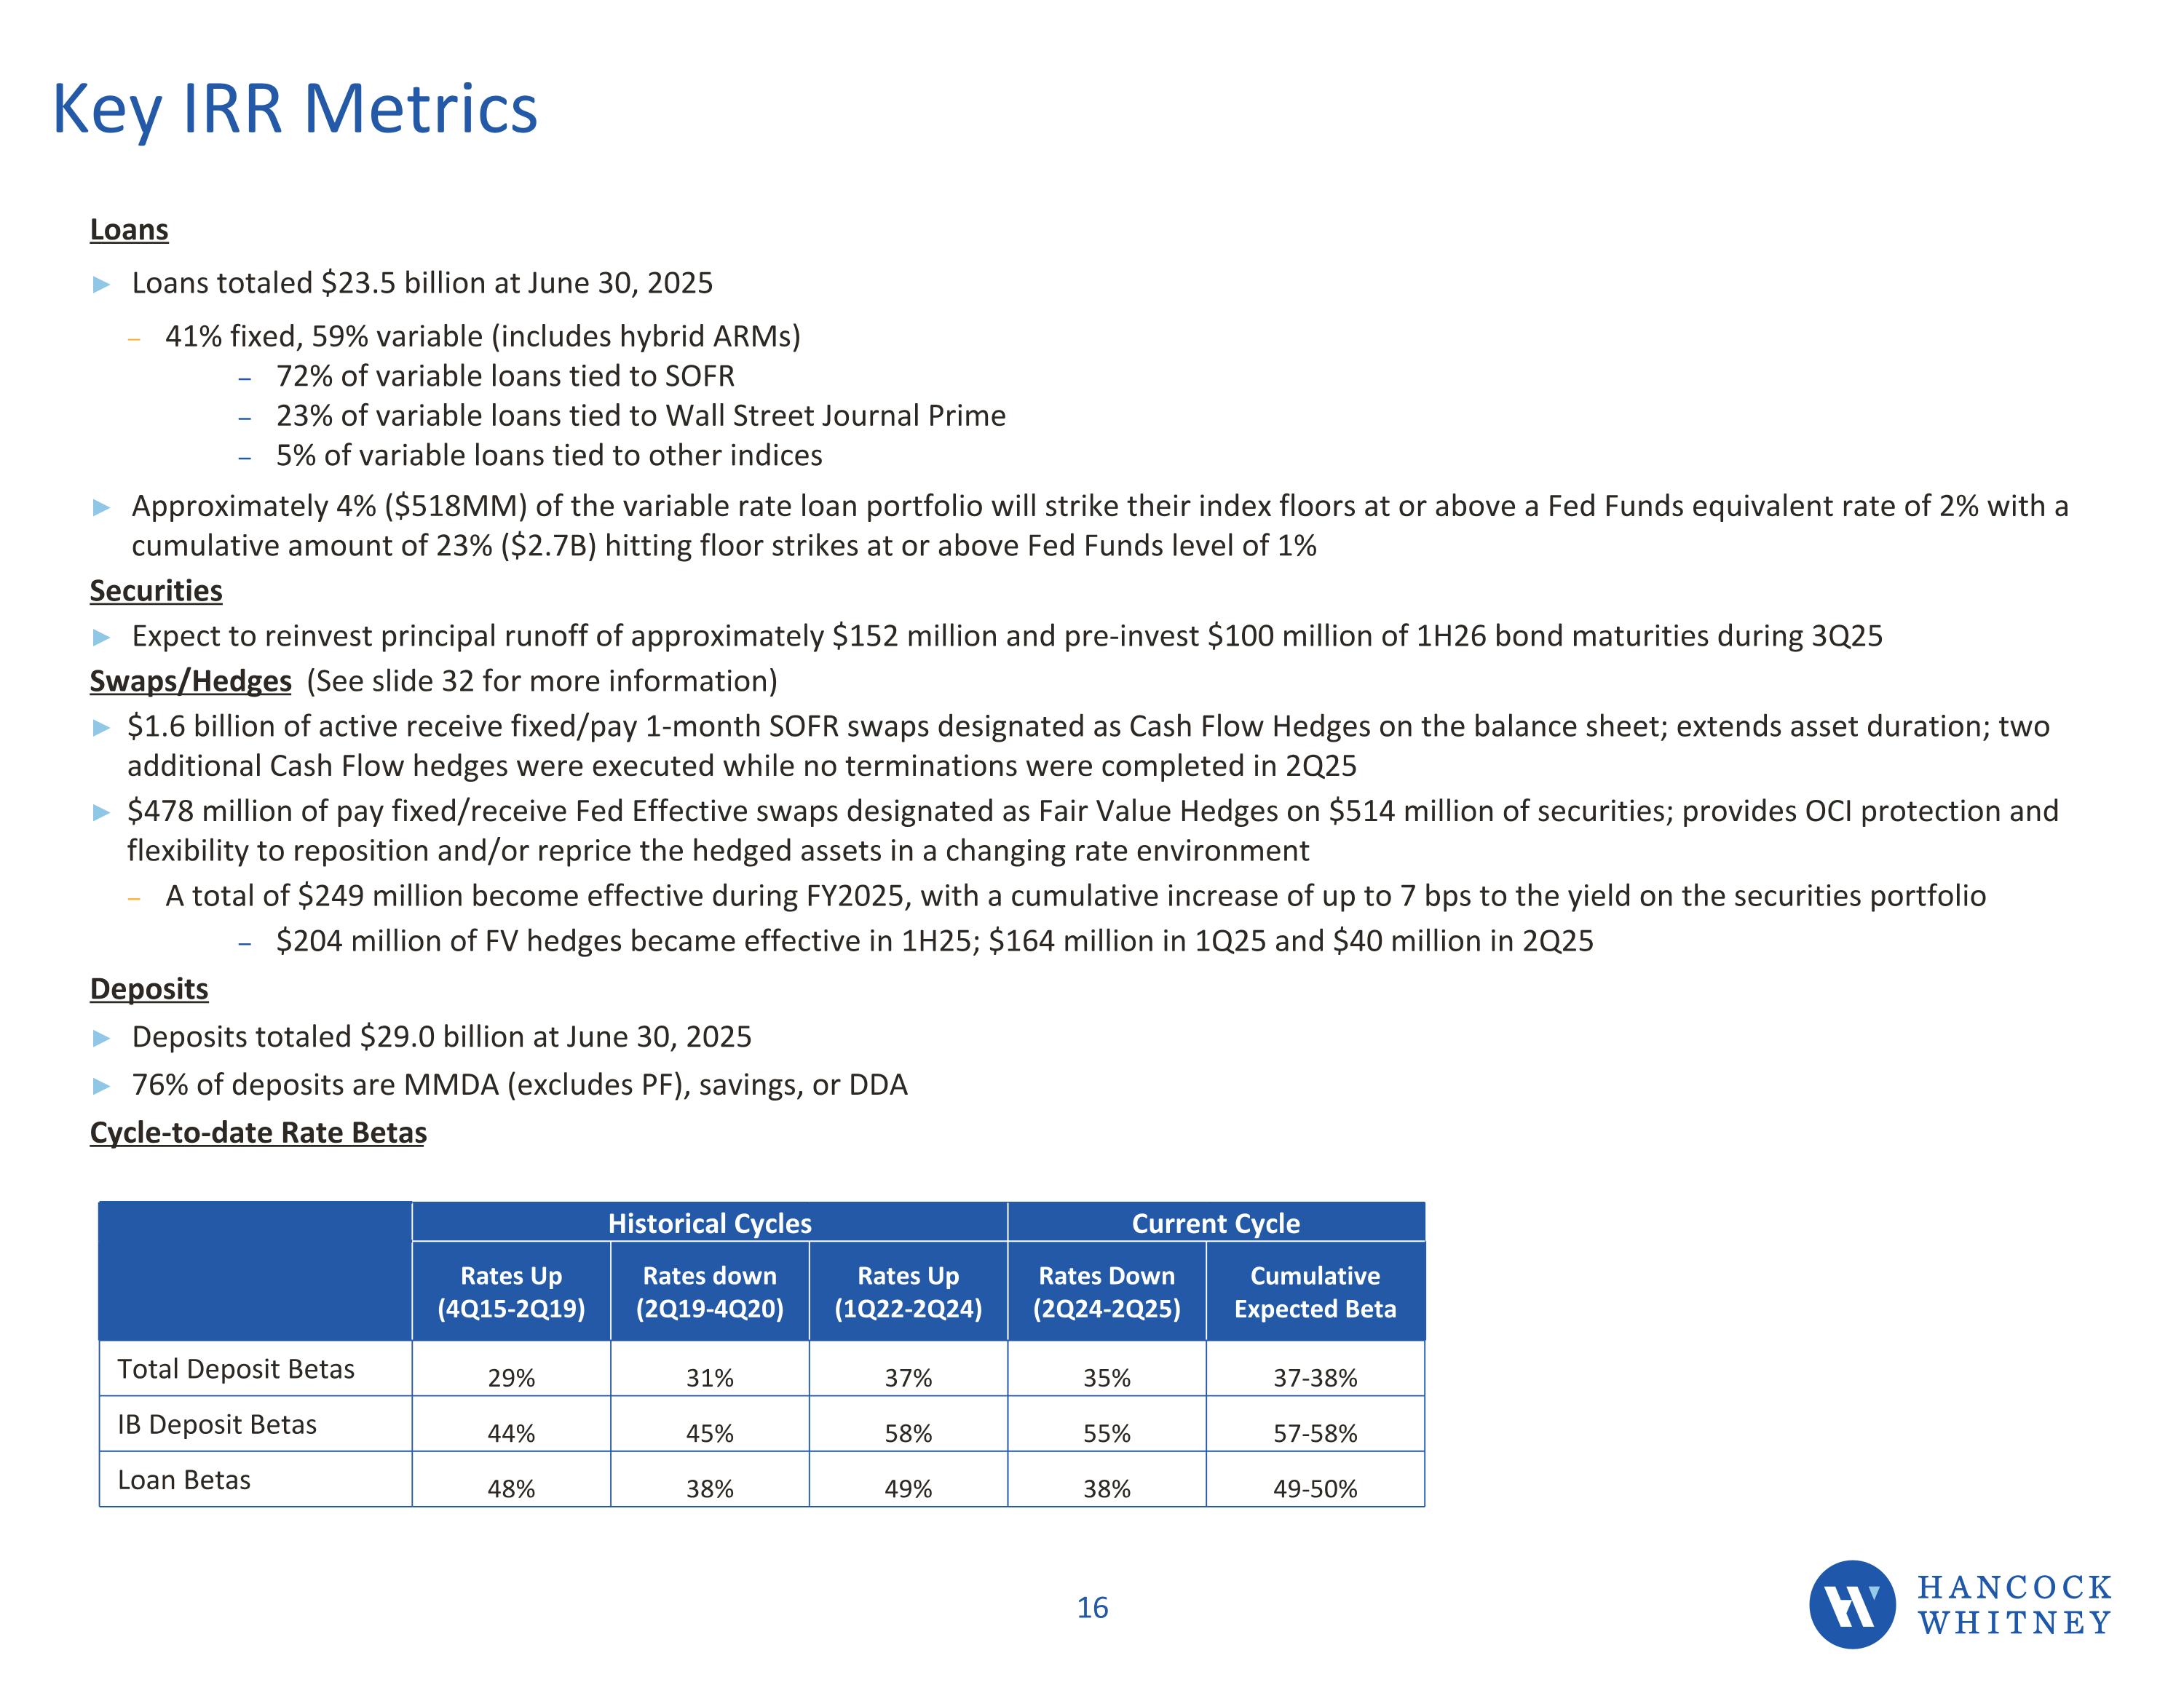
Loans Loans totaled $23.5 billion at June 30, 2025 41% fixed, 59% variable (includes hybrid ARMs) 72% of variable loans tied to SOFR 23% of variable loans tied to Wall Street Journal Prime 5% of variable loans tied to other indices Approximately 4% ($518MM) of the variable rate loan portfolio will strike their index floors at or above a Fed Funds equivalent rate of 2% with a cumulative amount of 23% ($2.7B) hitting floor strikes at or above Fed Funds level of 1% Securities Expect to reinvest principal runoff of approximately $152 million and pre-invest $100 million of 1H26 bond maturities during 3Q25 Swaps/Hedges (See slide 32 for more information) $1.6 billion of active receive fixed/pay 1-month SOFR swaps designated as Cash Flow Hedges on the balance sheet; extends asset duration; two additional Cash Flow hedges were executed while no terminations were completed in 2Q25 $478 million of pay fixed/receive Fed Effective swaps designated as Fair Value Hedges on $514 million of securities; provides OCI protection and flexibility to reposition and/or reprice the hedged assets in a changing rate environment A total of $249 million become effective during FY2025, with a cumulative increase of up to 7 bps to the yield on the securities portfolio $204 million of FV hedges became effective in 1H25; $164 million in 1Q25 and $40 million in 2Q25 Deposits Deposits totaled $29.0 billion at June 30, 2025 76% of deposits are MMDA (excludes PF), savings, or DDA Cycle-to-date Rate Betas Key IRR Metrics Historical Cycles Current Cycle Rates Up (4Q15-2Q19) Rates down (2Q19-4Q20) Rates Up (1Q22-2Q24) Rates Down (2Q24-2Q25) Cumulative Expected Beta Total Deposit Betas 29% 31% 37% 35% 37-38% IB Deposit Betas 44% 45% 58% 55% 57-58% Loan Betas 48% 38% 49% 38% 49-50%
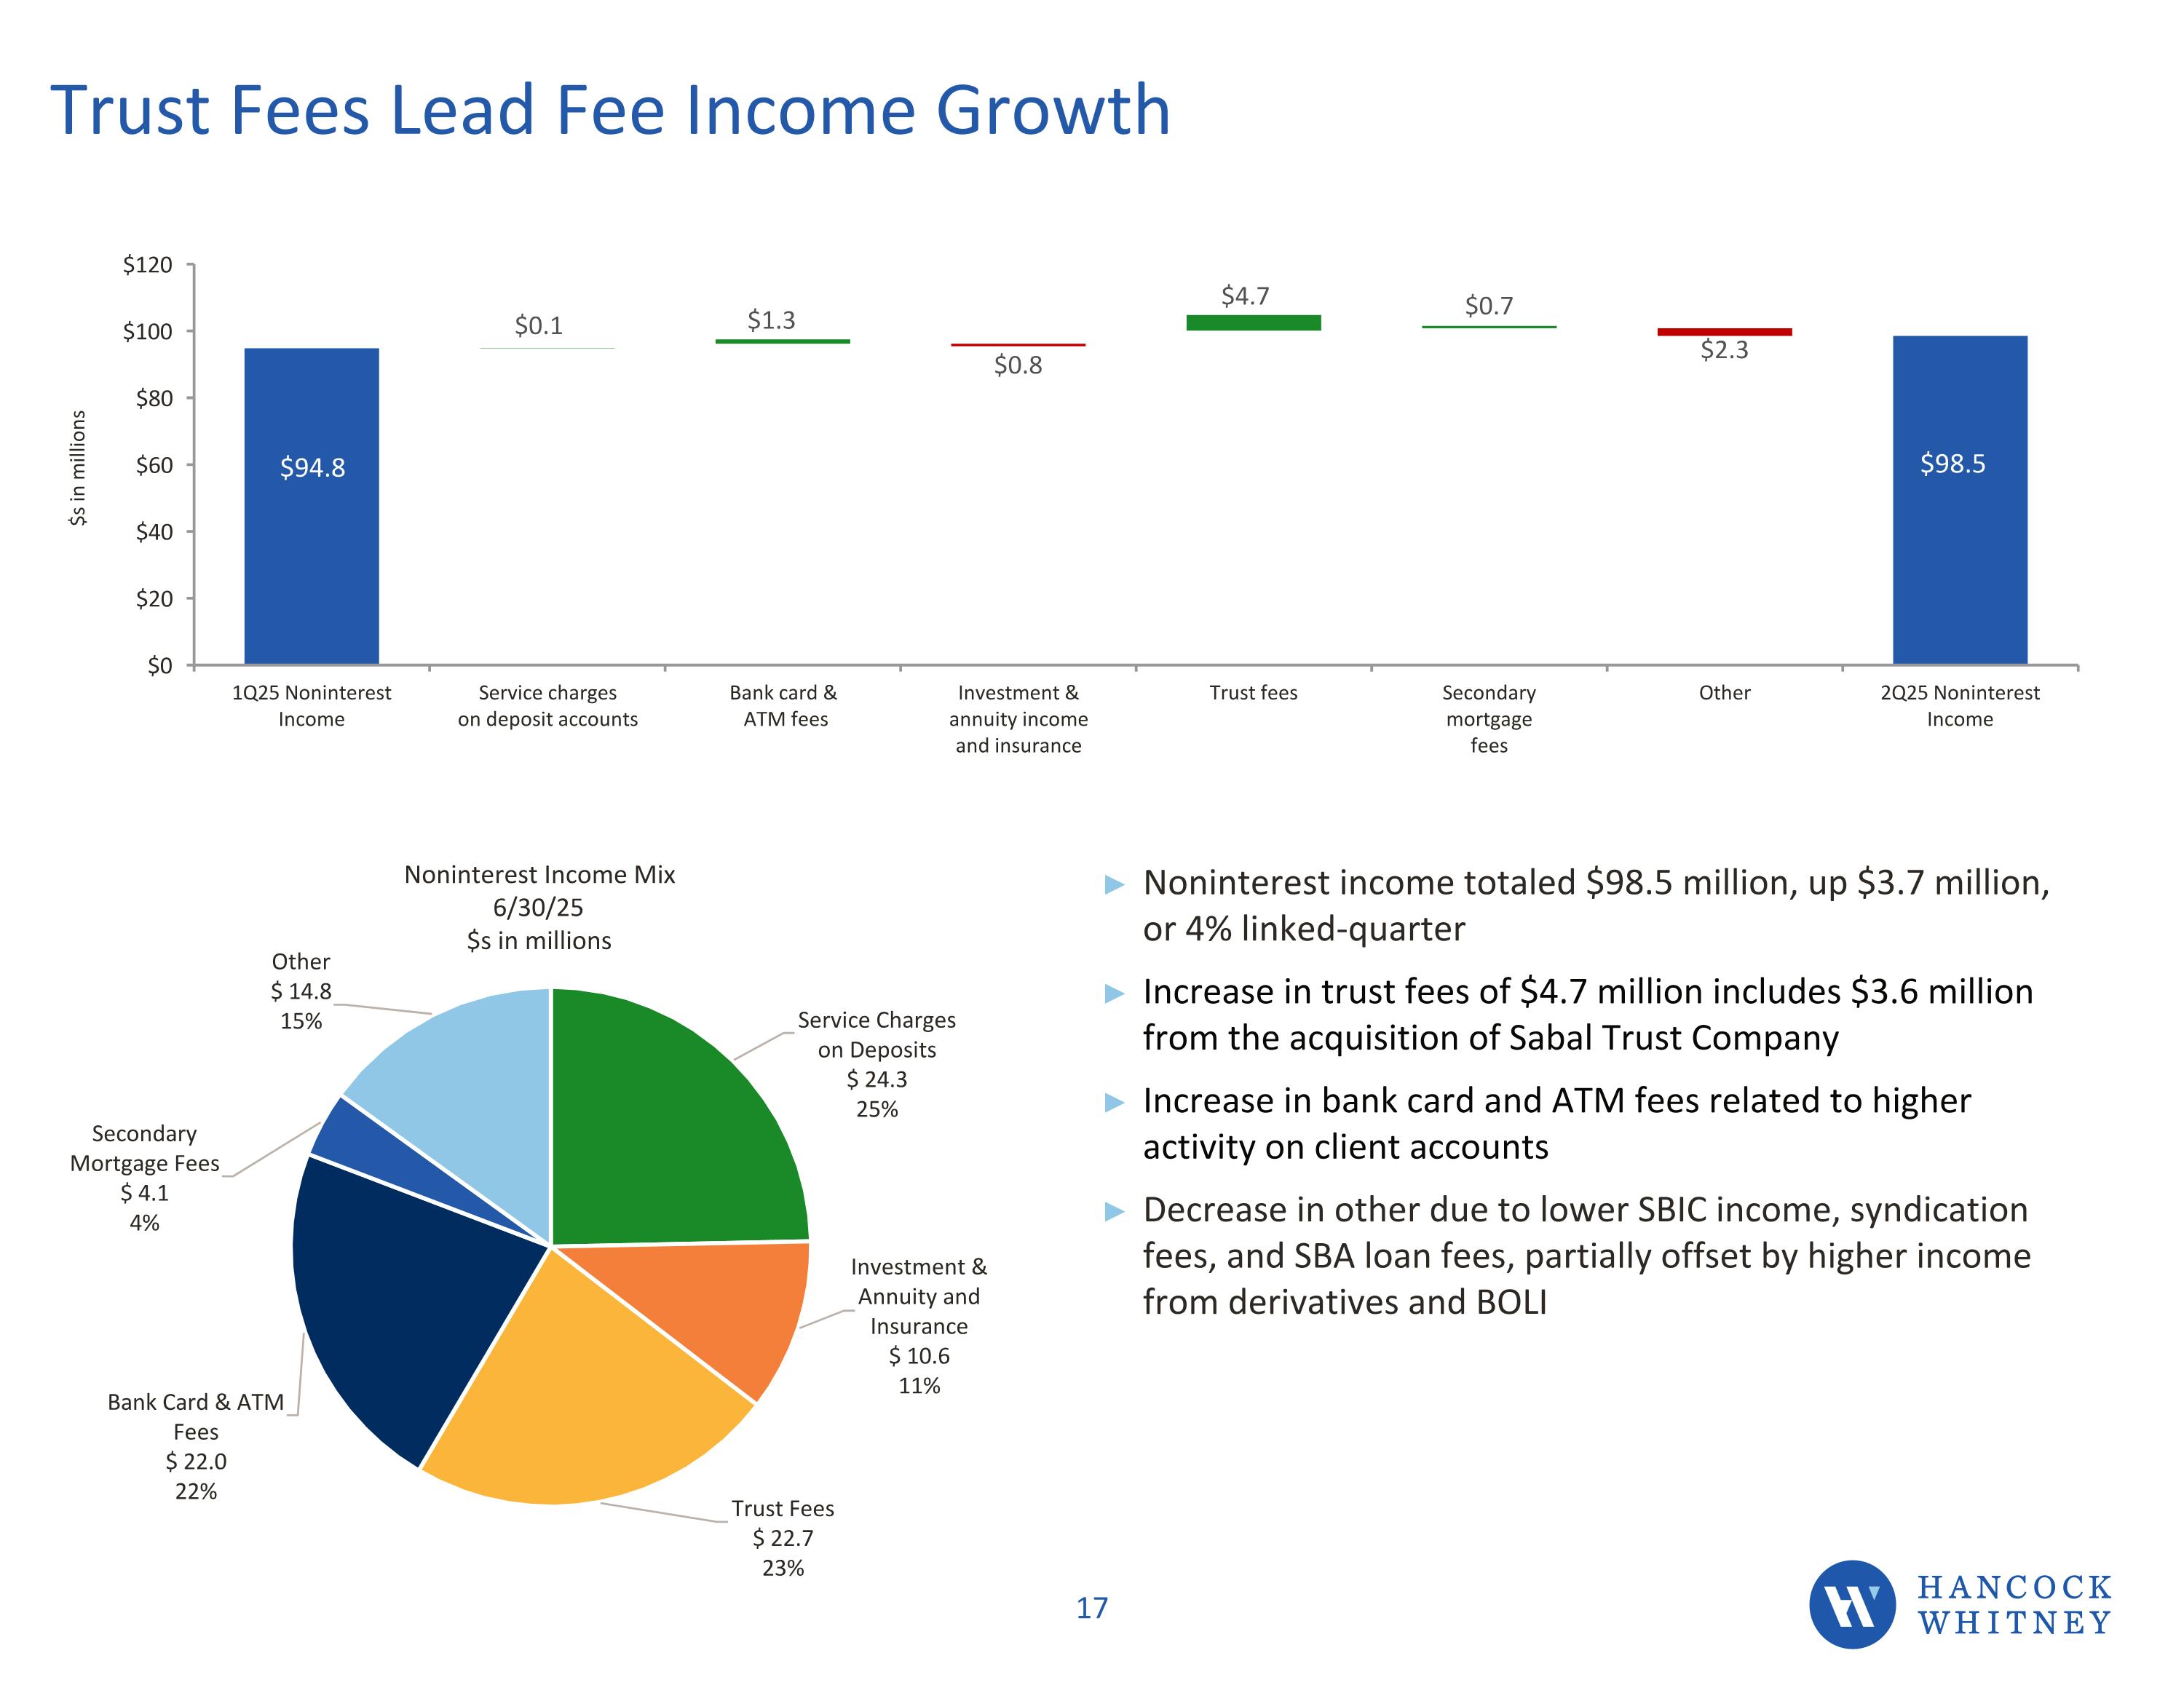
Trust Fees Lead Fee Income Growth Noninterest income totaled $98.5 million, up $3.7 million, or 4% linked-quarter Increase in trust fees of $4.7 million includes $3.6 million from the acquisition of Sabal Trust Company Increase in bank card and ATM fees related to higher activity on client accounts Decrease in other due to lower SBIC income, syndication fees, and SBA loan fees, partially offset by higher income from derivatives and BOLI Noninterest Income Mix 6/30/25 $s in millions Lower Mortgage, Specialty Income Partly Offset by Higher Service Fees Noninterest income totaled $82.4 million, down $1.3 million, or 2% linked-quarter Service charges and bank card & ATM fees up primarily due to increased activity, although lower than pre-pandemic levels Secondary mortgage fees continue to be impacted by the favorable rate environment, albeit a lower level of refinance activity compared to previous quarters Other income decrease related to lower levels of specialty income (BOLI) in 4Q20 partially offset by higher derivative income Expect 1Q21 fee income to be down related to anticipated lower levels of specialty income and secondary mortgage fees Secondary Mortgage Fees $11.5 14%Other $12.8 16% Noninterest Income Mix 12/31/20 $s in millions Service Charges on Deposit $19.9 24% Investment & Annuity and Insurance $5.8 7% Trust Fees $14.8 18% Bank Card & ATM Fees $17.6 21% 3Q20 NON INTEREST INCOME SERVICE CHARGES ON DEPOSIT accounts bank card & atm fees investment & annuity income and insurance trust fees secondary mortgage fees other 4q20 Non interest income Pie chart
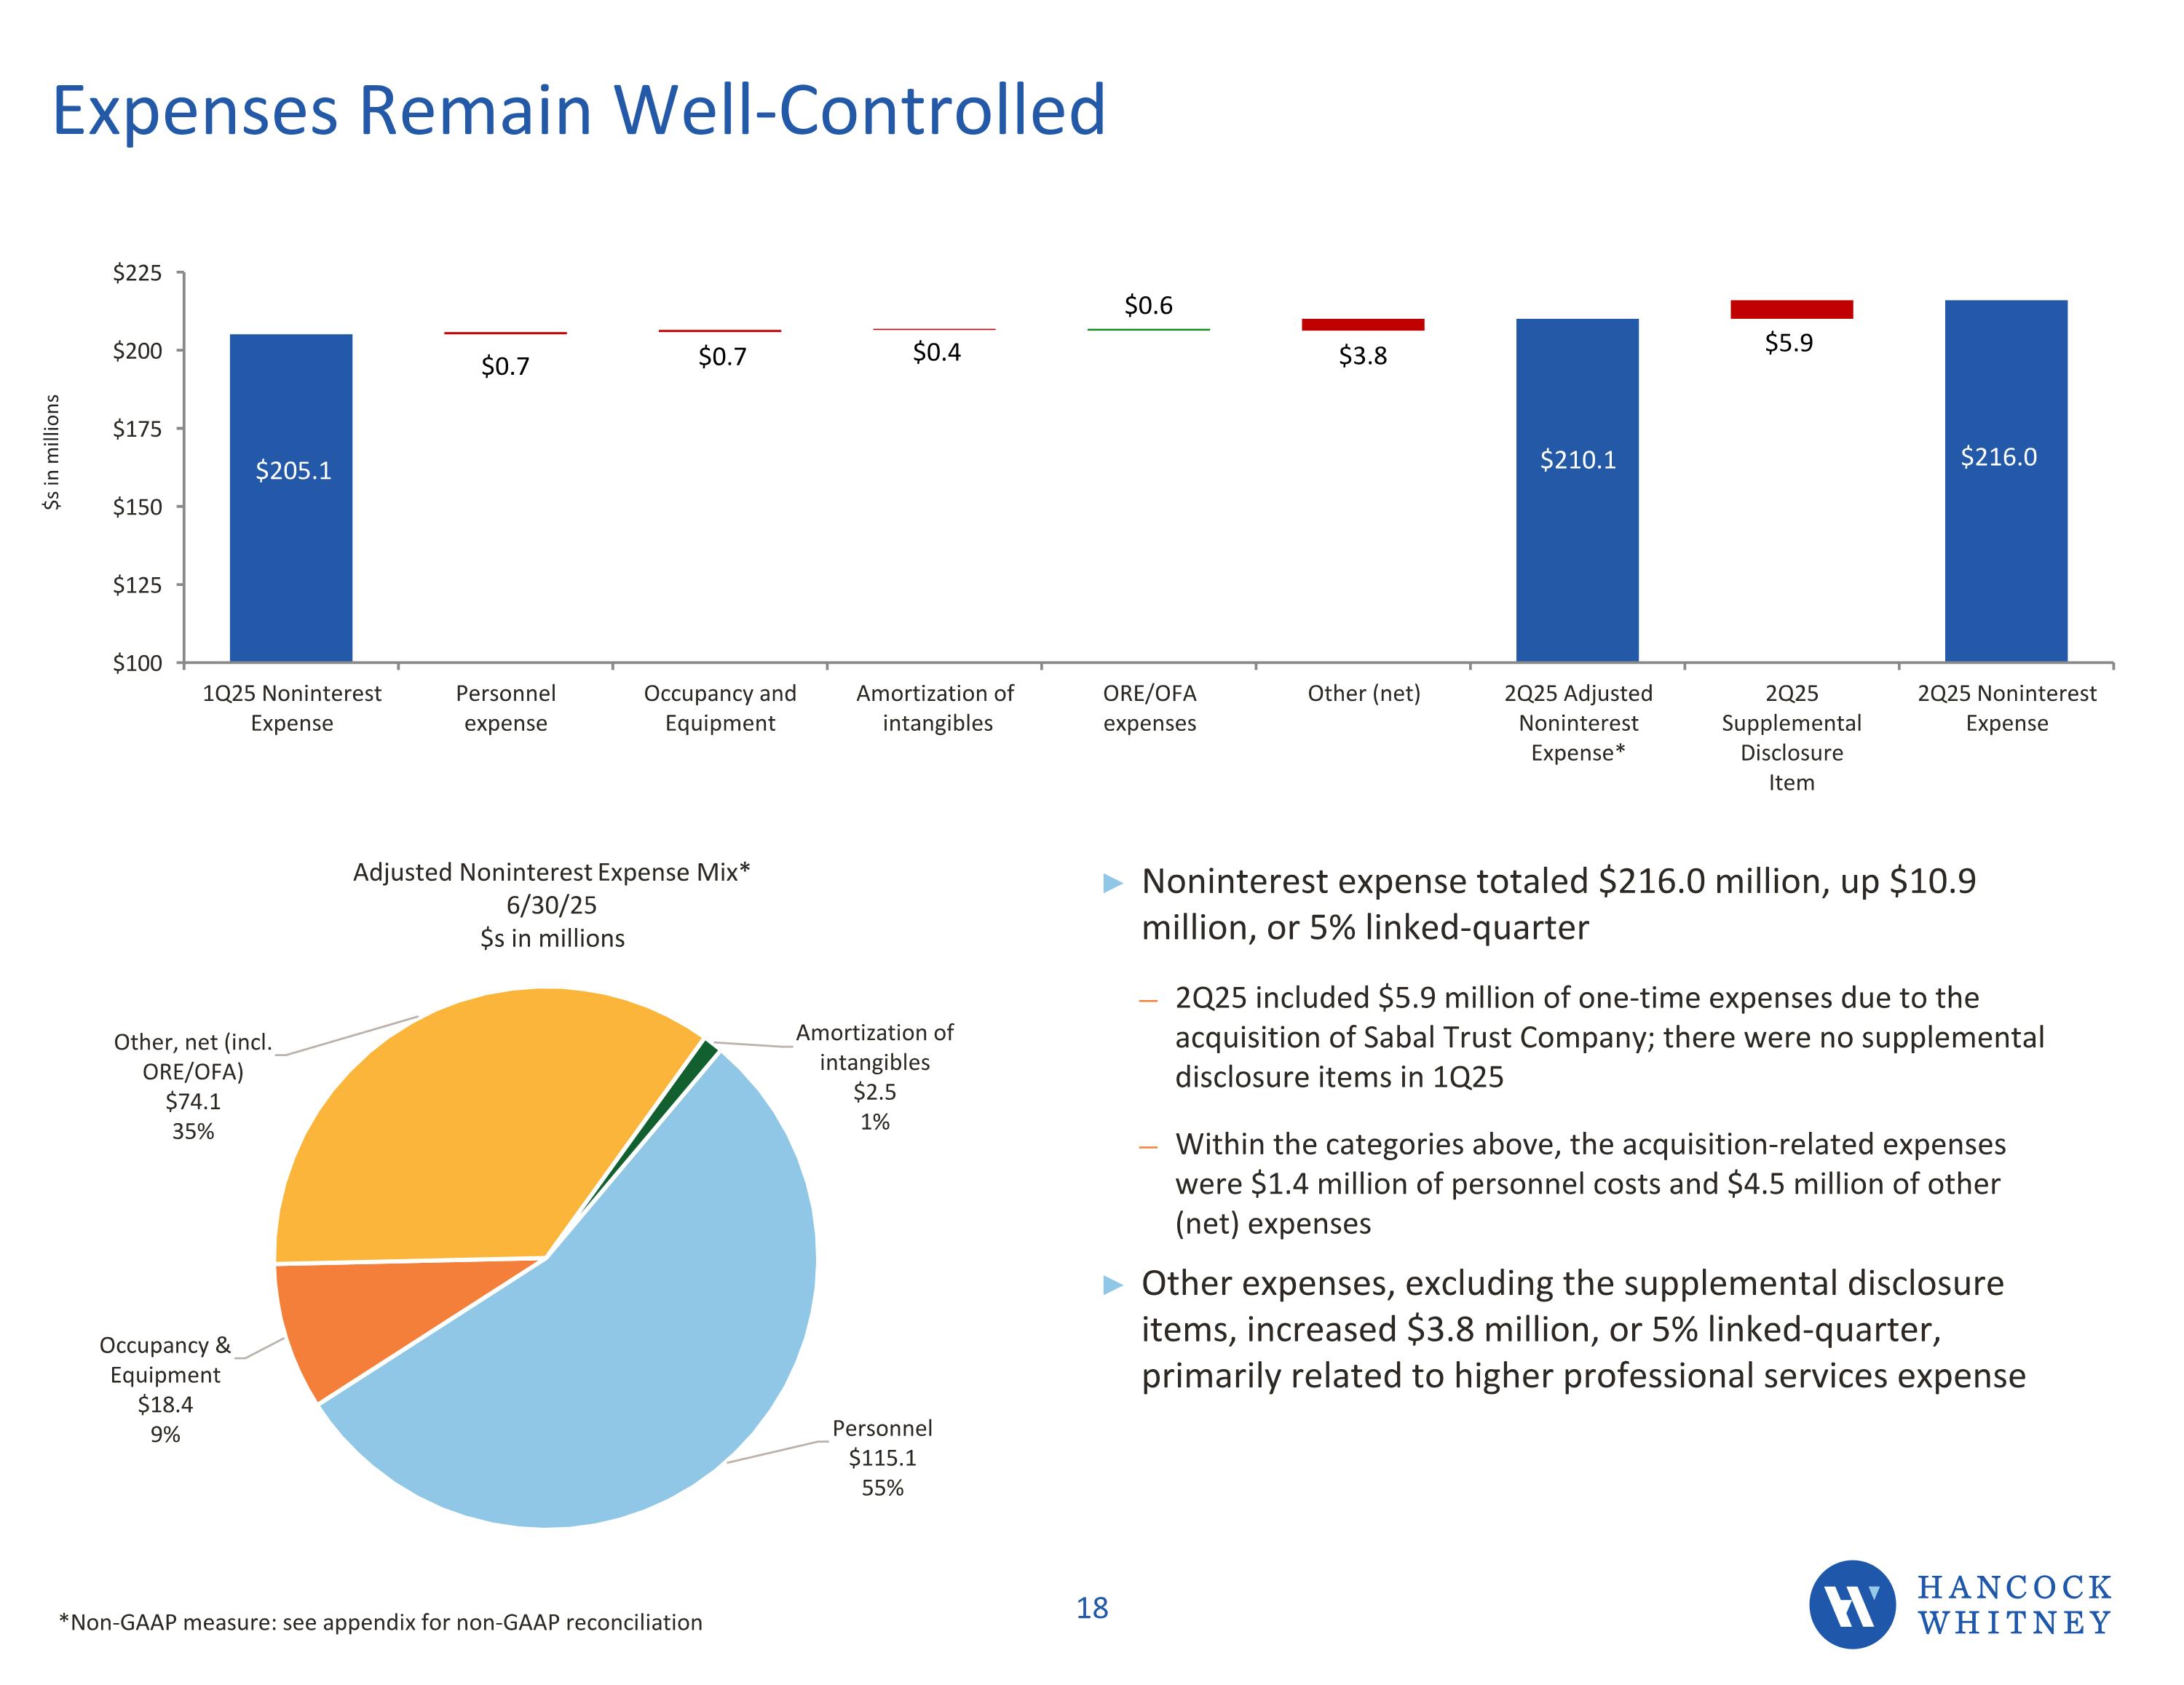
Expenses Remain Well-Controlled Noninterest expense totaled $216.0 million, up $10.9 million, or 5% linked-quarter 2Q25 included $5.9 million of one-time expenses due to the acquisition of Sabal Trust Company; there were no supplemental disclosure items in 1Q25 Within the categories above, the acquisition-related expenses were $1.4 million of personnel costs and $4.5 million of other (net) expenses Other expenses, excluding the supplemental disclosure items, increased $3.8 million, or 5% linked-quarter, primarily related to higher professional services expense A Focus on Expense Control; More Initiatives Underway Noninterest expense totaled $193.1 million, down $2.7 million, or 1% LQ Decline in personnel expense related to savings from efficiency measures taken to-date, including staff attrition and recent financial center closures Increase in other expenses mainly related to nonrecurring hurricane expense and branch closures Expense reduction initiatives to-date Closed 12 financial centers in 4Q20 8 additional financial centers closures announced in 1Q21 Ongoing branch rationalization reviews Closed Wealth Management trust offices in the NE corridor FTE down 210 compared to June 30, 2020 through staff attrition and other initiatives Early retirement package offered to select employees in 1Q21 Expect 1Q21 expenses to be flat as efficiency initiatives continue and offset typical beginning of the year increases; does not include nonrecurring charges for certain initiatives (i.e. early retirement) Adjusted Noninterest Expense Mix* 6/30/25 $s in millions *Non-GAAP measure: see appendix for non-GAAP reconciliation
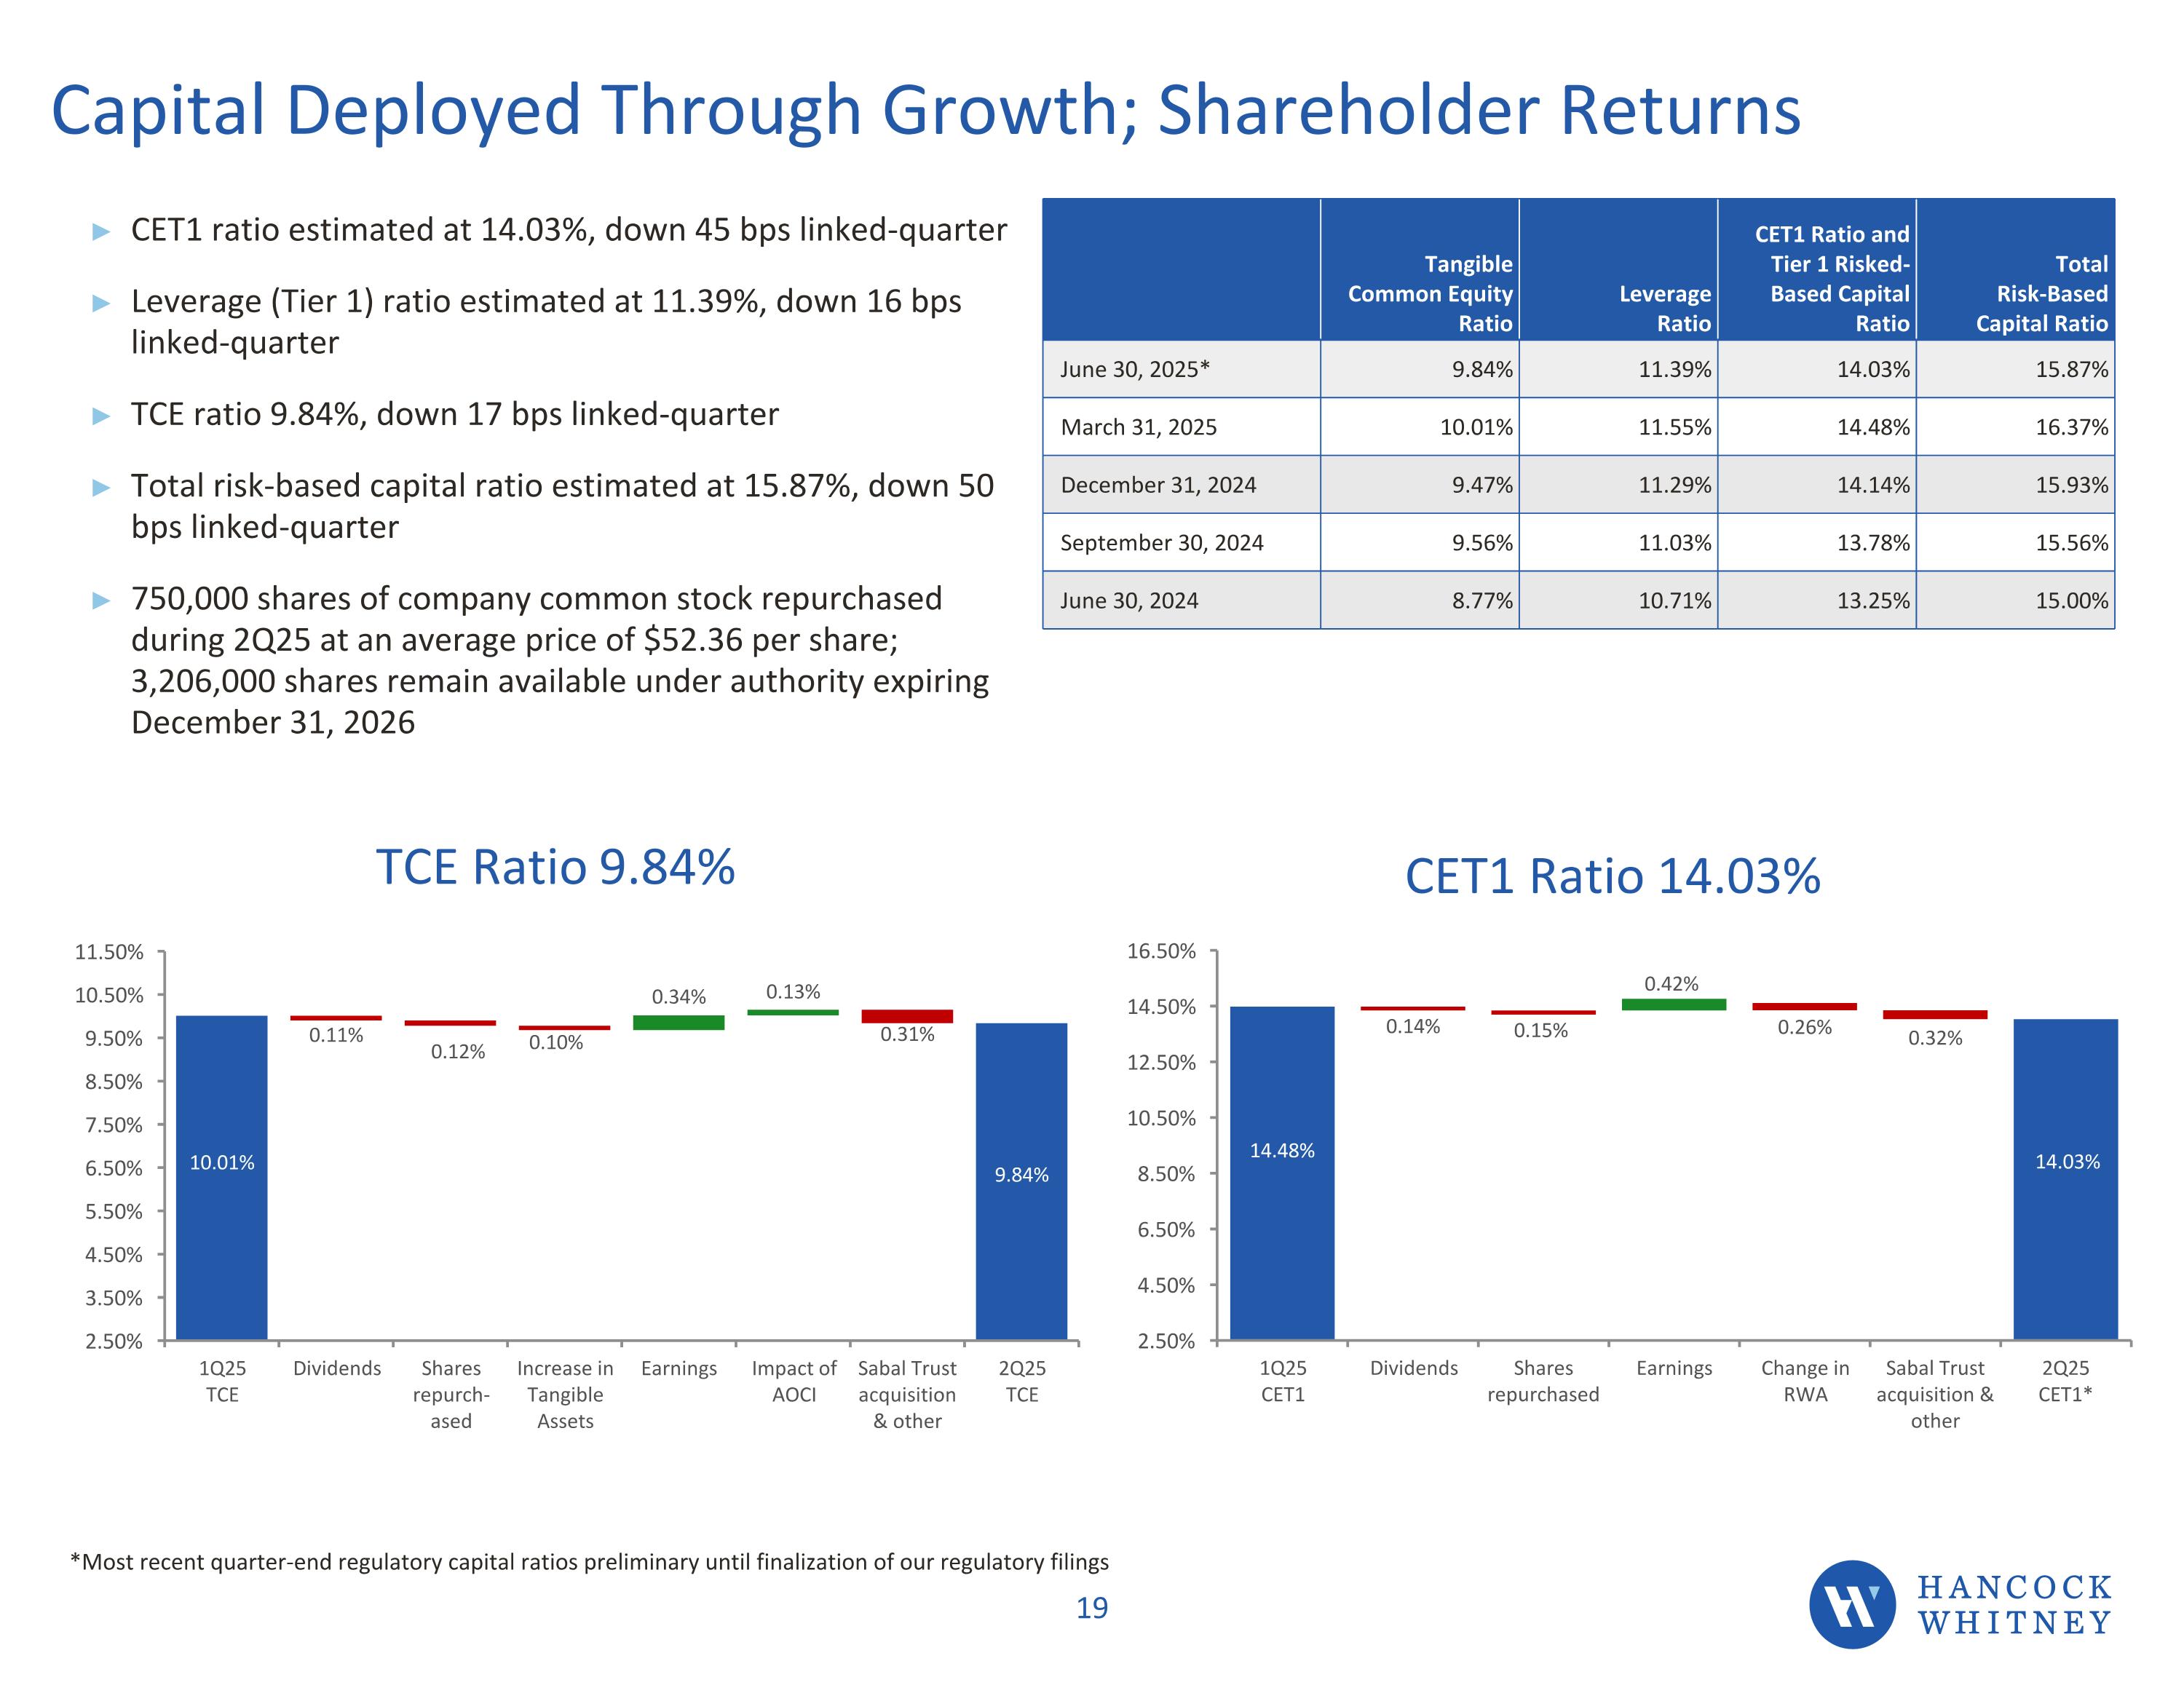
Capital Deployed Through Growth; Shareholder Returns CET1 ratio estimated at 14.03%, down 45 bps linked-quarter Leverage (Tier 1) ratio estimated at 11.39%, down 16 bps linked-quarter TCE ratio 9.84%, down 17 bps linked-quarter Total risk-based capital ratio estimated at 15.87%, down 50 bps linked-quarter 750,000 shares of company common stock repurchased during 2Q25 at an average price of $52.36 per share; 3,206,000 shares remain available under authority expiring December 31, 2026 Tangible Common Equity Ratio Leverage Ratio CET1 Ratio and Tier 1 Risked-Based Capital Ratio Total Risk-Based Capital Ratio June 30, 2025* 9.84% 11.39% 14.03% 15.87% March 31, 2025 10.01% 11.55% 14.48% 16.37% December 31, 2024 9.47% 11.29% 14.14% 15.93% September 30, 2024 9.56% 11.03% 13.78% 15.56% June 30, 2024 8.77% 10.71% 13.25% 15.00% CET1 Ratio 14.03% *Most recent quarter-end regulatory capital ratios preliminary until finalization of our regulatory filings TCE Ratio 9.84%
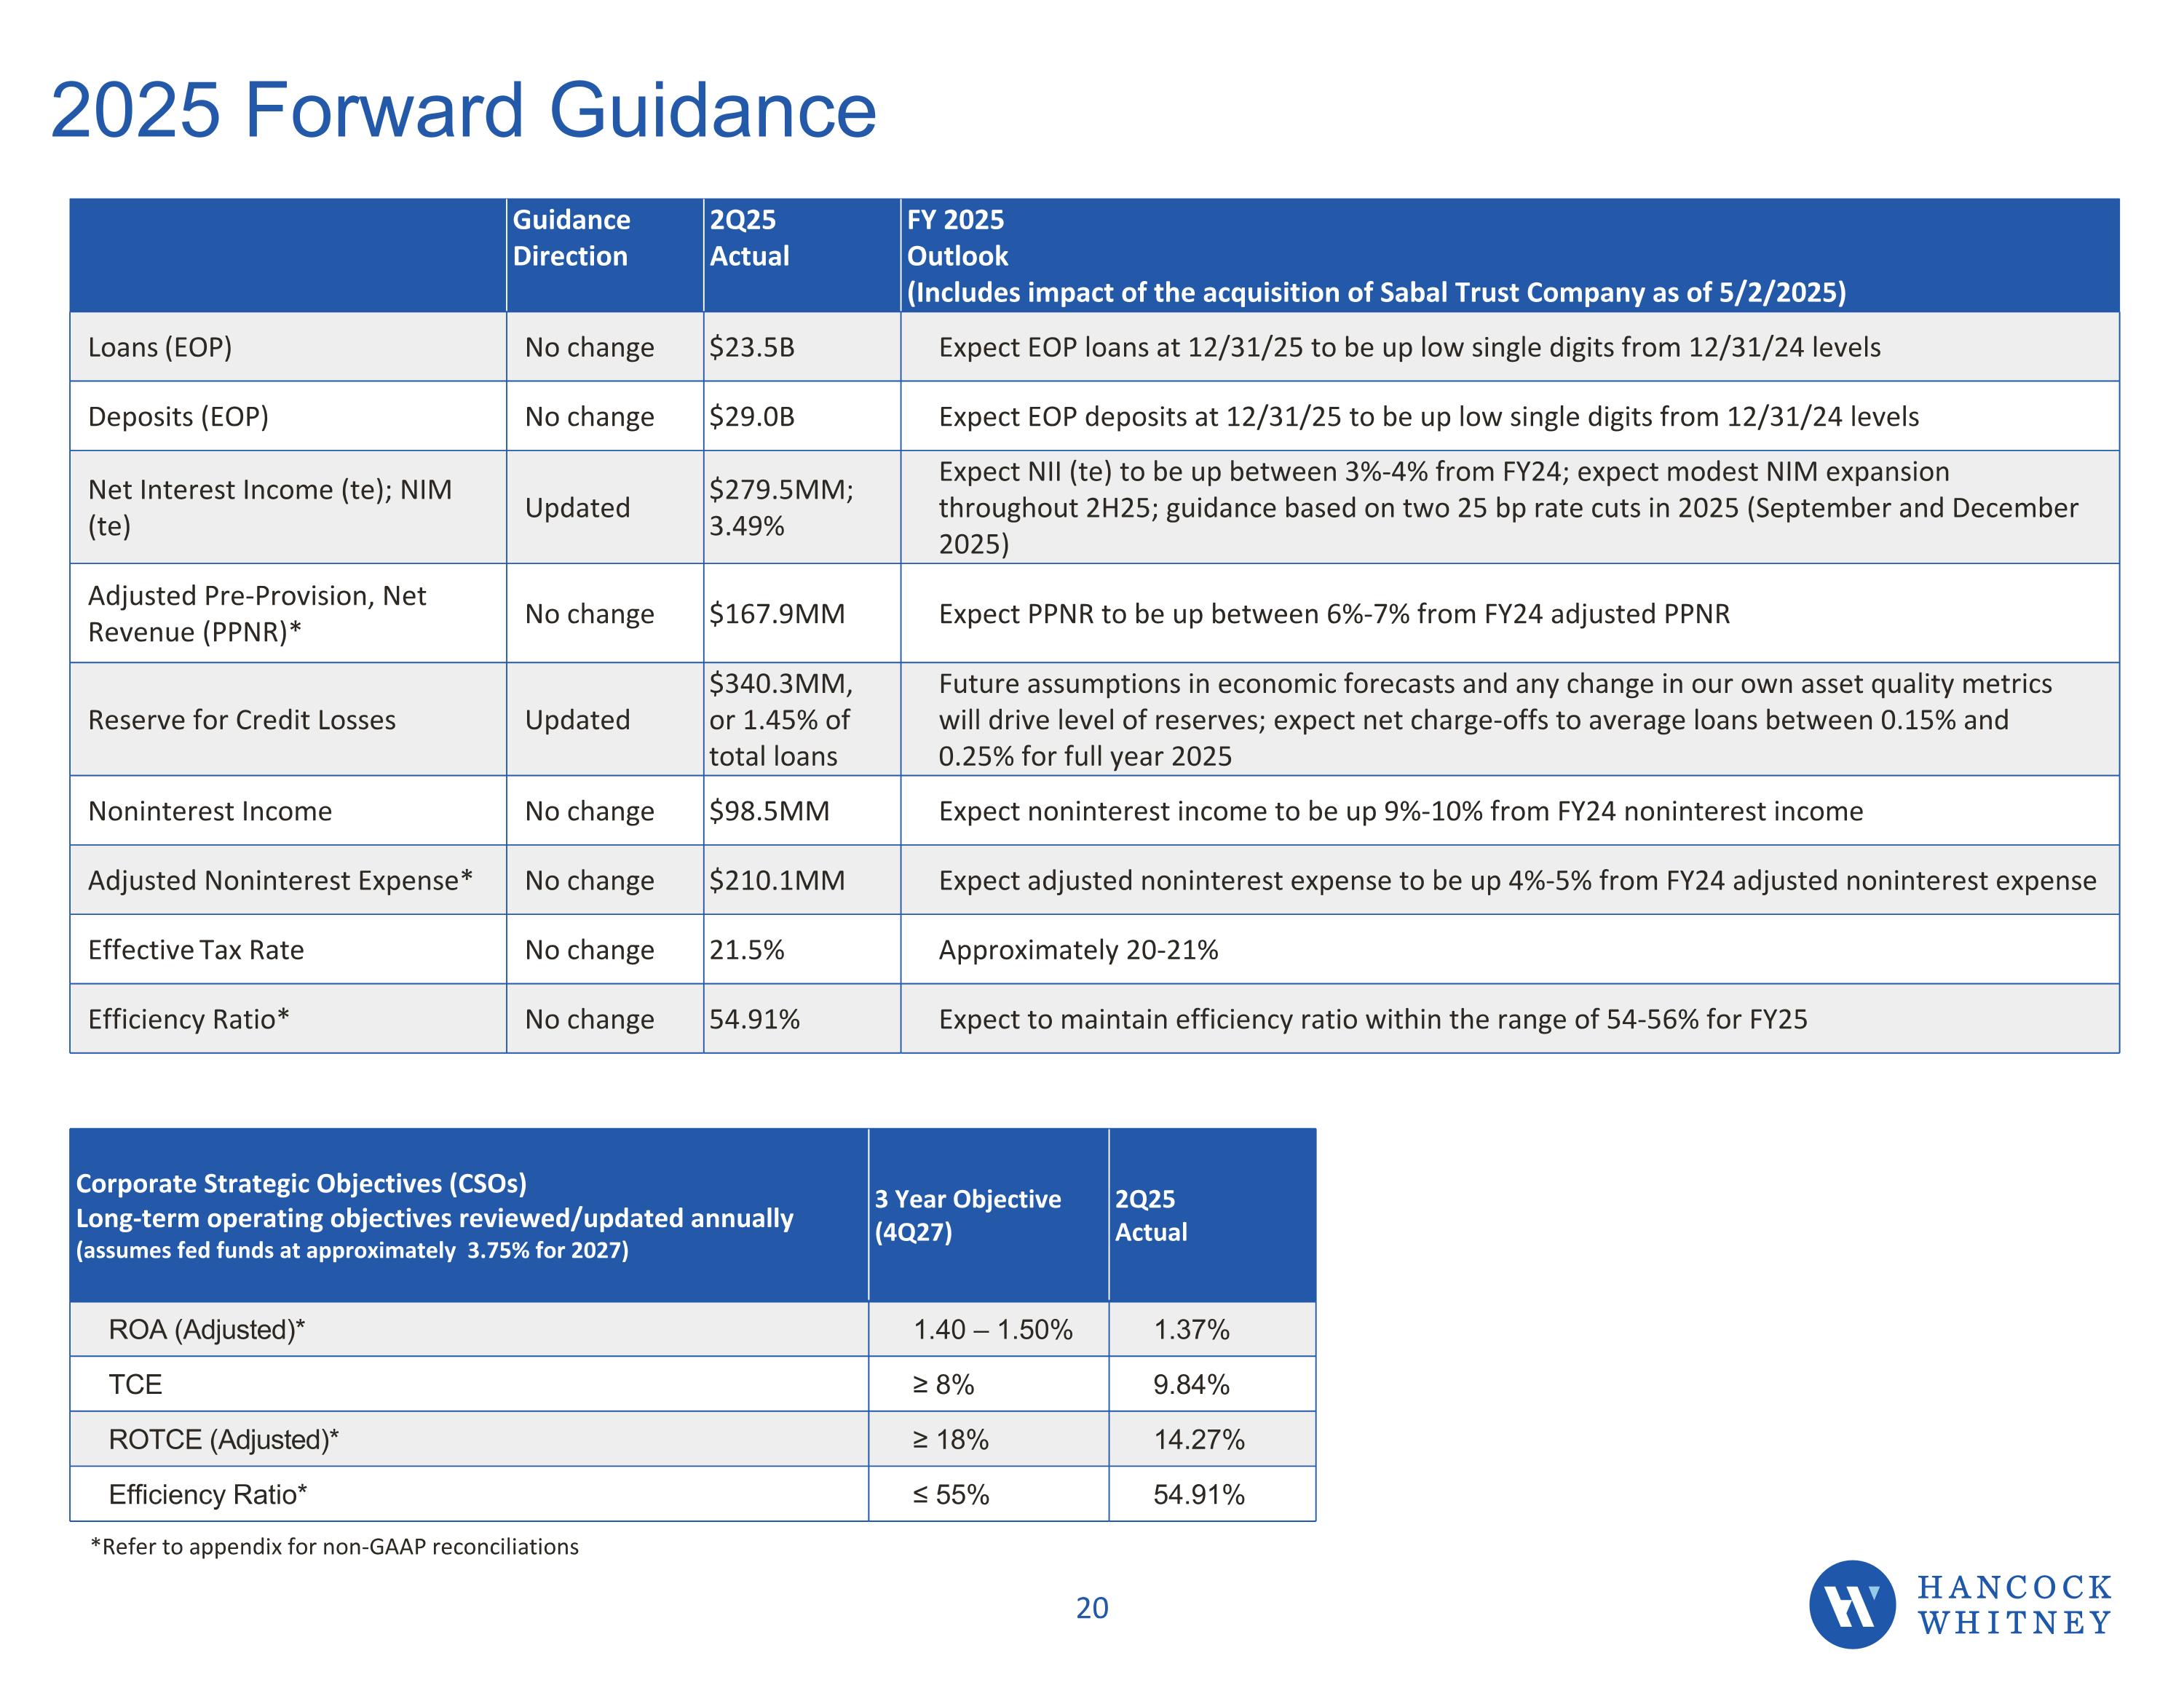
2025 Forward Guidance Guidance Direction 2Q25 Actual FY 2025 Outlook (Includes impact of the acquisition of Sabal Trust Company as of 5/2/2025) Loans (EOP) No change $23.5B Expect EOP loans at 12/31/25 to be up low single digits from 12/31/24 levels Deposits (EOP) No change $29.0B Expect EOP deposits at 12/31/25 to be up low single digits from 12/31/24 levels Net Interest Income (te); NIM (te) Updated $279.5MM; 3.49% Expect NII (te) to be up between 3%-4% from FY24; expect modest NIM expansion throughout 2H25; guidance based on two 25 bp rate cuts in 2025 (September and December 2025) Adjusted Pre-Provision, Net Revenue (PPNR)* No change $167.9MM Expect PPNR to be up between 6%-7% from FY24 adjusted PPNR Reserve for Credit Losses Updated $340.3MM, or 1.45% of total loans Future assumptions in economic forecasts and any change in our own asset quality metrics will drive level of reserves; expect net charge-offs to average loans between 0.15% and 0.25% for full year 2025 Noninterest Income No change $98.5MM Expect noninterest income to be up 9%-10% from FY24 noninterest income Adjusted Noninterest Expense* No change $210.1MM Expect adjusted noninterest expense to be up 4%-5% from FY24 adjusted noninterest expense Effective Tax Rate No change 21.5% Approximately 20-21% Efficiency Ratio* No change 54.91% Expect to maintain efficiency ratio within the range of 54-56% for FY25 Corporate Strategic Objectives (CSOs) Long-term operating objectives reviewed/updated annually (assumes fed funds at approximately 3.75% for 2027) 3 Year Objective (4Q27) 2Q25 Actual ROA (Adjusted)* 1.40 – 1.50% 1.37% TCE ≥ 8% 9.84% ROTCE (Adjusted)* ≥ 18% 14.27% Efficiency Ratio* ≤ 55% 54.91% *Refer to appendix for non-GAAP reconciliations
Appendix and Non-GAAP Reconciliations Appendix and Non-GAAP Reconciliations CHANCOCK WHITNEY
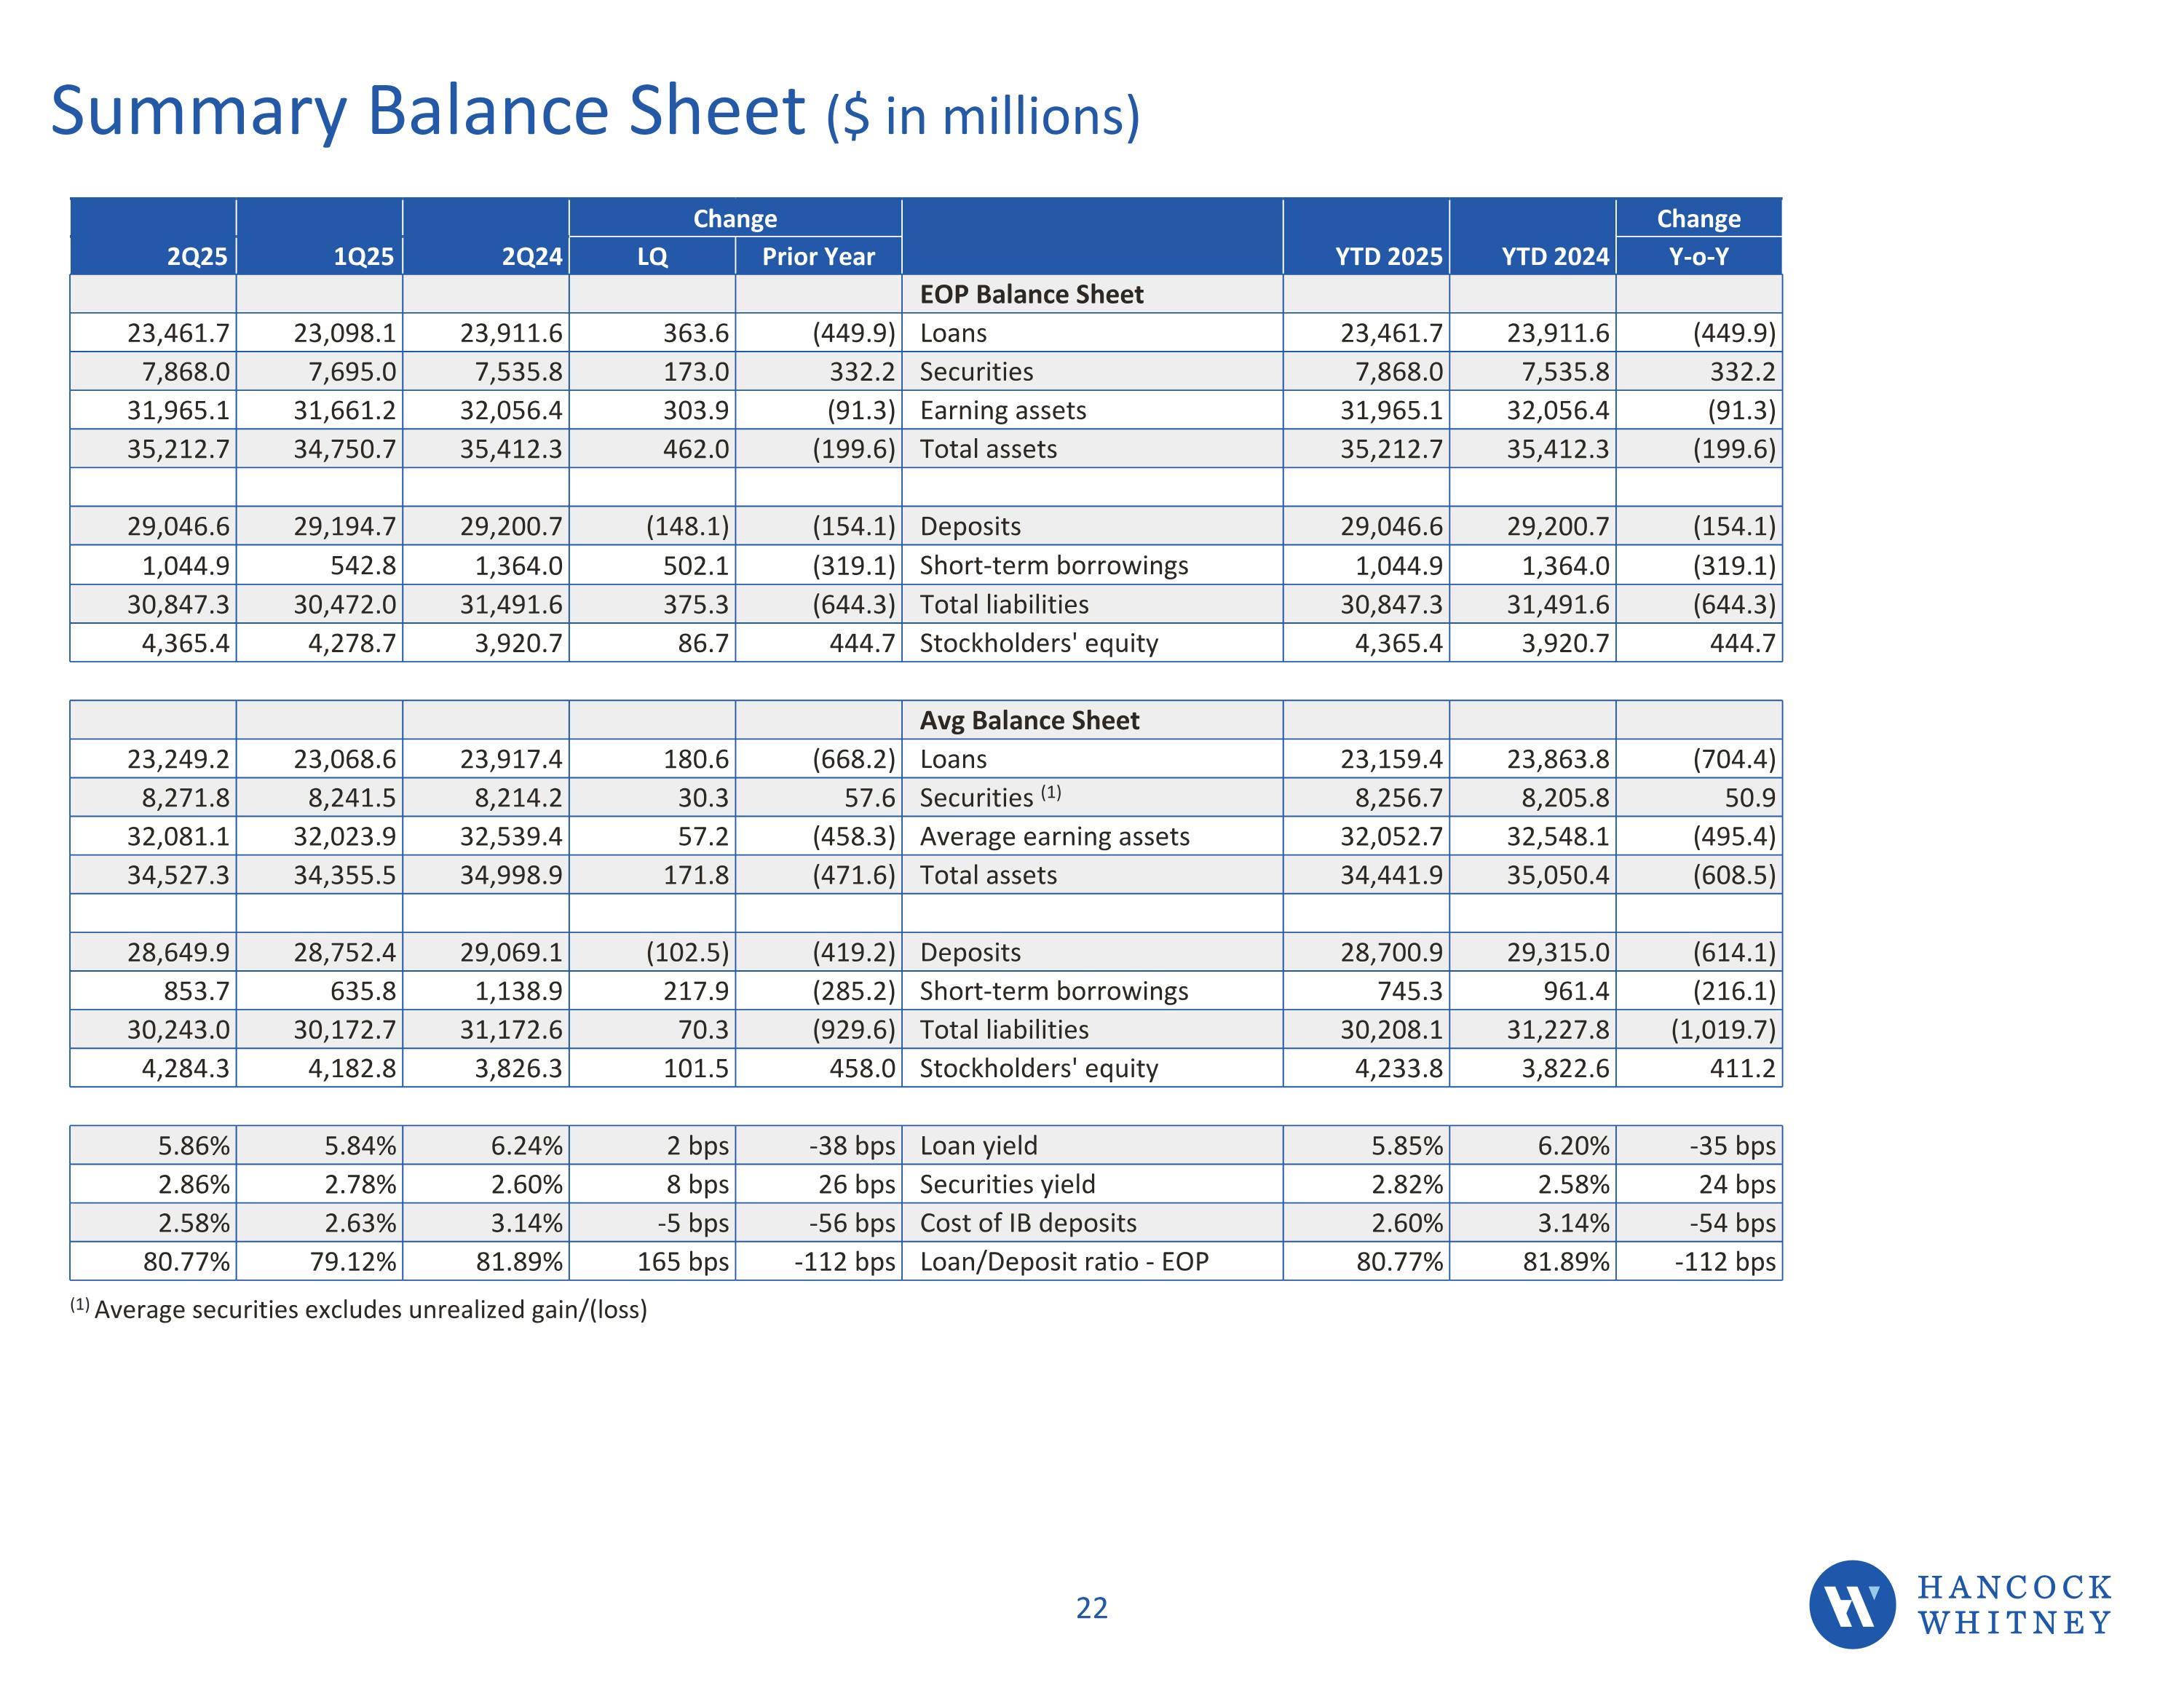
Summary Balance Sheet ($ in millions) (1) Average securities excludes unrealized gain/(loss) Summary Balance Sheet ($ in millions) 4Q20 and YTD 2020 include $2.0 billion and 3Q20 included $2.3 billion in PPP loans, net Average securities excludes unrealized gain /(loss) Change 4Q20 3Q20 4Q19 LQ PY Line Item YTD 2020 YTD 2019 Y-o-Y EOP Balance Sheet $21,789.9 $22,240.2 $21,212.8 ($450.3) $577.1 Loans (1) $21,789.9 $21,212.8 $577.1 7,356.5 7,056.3 6,243.3 300.2 1,113.2 Securities 7,356.5 6,243.3 1,113.2 30,616.3 30,179.1 27,622.2 437.2 2,994.1 Earning Assets 30,616.3 27,622.2 2,994.1 33,638.6 33,193.3 30,600.8 445.3 3,037.8 Total assets 33,638.6 30,600.8 3,037.8 $27,698.0 $27,030.7 $23,803.6 $667.3 $3,894.4 Deposits $27,698.0 $23,803.6 $3,894.4 1,667.5 1,906.9 2,714.9 (239.4) (1,047.4) Short-term borrowings 1,667.5 2,714.9 (1,047.4) 30,199.6 29,817.7 27,133.1 381.9 3,066.5 Total Liabilities 30,199.6 27,133.1 3,066.5 3,439.0 3,375.6 3,467.7 63.4 (28.7) Stockholders' Equity 3,439.0 3,467.7 (28.7) Avg Balance Sheet $22,065.7 $22,407.8 $21,037.9 ($342.1) $1,027.8 Loans $22,166.5 $20,380.0 $1,786.5 6,921.1 6,389.2 6,201.6 531.9 719.5 Securities (2) 6,398.7 5,864.2 534.5 29,875.5 29,412.3 27,441.5 463.2 2,434.0 Average earning assets 29,235.3 26,476.9 2,758.4 33,067.5 32,685.4 30,343.3 382.1 2,724.2 Total assets 32,391.0 29,125.4 3,265.6 $27,040.4 $26,763.8 $23,848.4 $276.6 $3,192.0 Deposits $26,212.3 $23,299.3 $2,913.0 1,779.5 1,733.3 2,393.4 46.2 (613.9) Short-term borrowings 1,978.2 1,942.1 36.1 29,660.8 29,333.8 26,869.6 327.0 2,791.2 Total Liabilities 28,957.9 25,822.8 3,135.1 3,406.6 3,351.6 3,473.7 55.0 (67.1) Stockholders' Equity 3,433.1 3,302.7 130.4 3.99% 3.95% 4.69% 4 bps -70 bps Loan Yield 4.13% 4.81% -68 bps 2.23% 2.31% 2.56% -8 bps -33 bps Securities Yield 2.38% 2.62% -24 bps 0.31% 0.39% 1.11% -8 bps -80 bps Cost of IB Deposits 0.57% 1.25% -68 bps 79% 82% 89% -361 bps -1045 bps Loan/Deposit Ratio (Period End) 79% 89% -1045 bps CHANCOCK WHITNEY 26 Change YTD 2025 YTD 2024 Change 2Q25 1Q25 2Q24 LQ Prior Year Y-o-Y EOP Balance Sheet 23,461.7 23,098.1 23,911.6 363.6 (449.9) Loans 23,461.7 23,911.6 (449.9) 7,868.0 7,695.0 7,535.8 173.0 332.2 Securities 7,868.0 7,535.8 332.2 31,965.1 31,661.2 32,056.4 303.9 (91.3) Earning assets 31,965.1 32,056.4 (91.3) 35,212.7 34,750.7 35,412.3 462.0 (199.6) Total assets 35,212.7 35,412.3 (199.6) 29,046.6 29,194.7 29,200.7 (148.1) (154.1) Deposits 29,046.6 29,200.7 (154.1) 1,044.9 542.8 1,364.0 502.1 (319.1) Short-term borrowings 1,044.9 1,364.0 (319.1) 30,847.3 30,472.0 31,491.6 375.3 (644.3) Total liabilities 30,847.3 31,491.6 (644.3) 4,365.4 4,278.7 3,920.7 86.7 444.7 Stockholders' equity 4,365.4 3,920.7 444.7 Avg Balance Sheet 23,249.2 23,068.6 23,917.4 180.6 (668.2) Loans 23,159.4 23,863.8 (704.4) 8,271.8 8,241.5 8,214.2 30.3 57.6 Securities (1) 8,256.7 8,205.8 50.9 32,081.1 32,023.9 32,539.4 57.2 (458.3) Average earning assets 32,052.7 32,548.1 (495.4) 34,527.3 34,355.5 34,998.9 171.8 (471.6) Total assets 34,441.9 35,050.4 (608.5) 28,649.9 28,752.4 29,069.1 (102.5) (419.2) Deposits 28,700.9 29,315.0 (614.1) 853.7 635.8 1,138.9 217.9 (285.2) Short-term borrowings 745.3 961.4 (216.1) 30,243.0 30,172.7 31,172.6 70.3 (929.6) Total liabilities 30,208.1 31,227.8 (1,019.7) 4,284.3 4,182.8 3,826.3 101.5 458.0 Stockholders' equity 4,233.8 3,822.6 411.2 5.86% 5.84% 6.24% 2 bps -38 bps Loan yield 5.85% 6.20% -35 bps 2.86% 2.78% 2.60% 8 bps 26 bps Securities yield 2.82% 2.58% 24 bps 2.58% 2.63% 3.14% -5 bps -56 bps Cost of IB deposits 2.60% 3.14% -54 bps 80.77% 79.12% 81.89% 165 bps -112 bps Loan/Deposit ratio - EOP 80.77% 81.89% -112 bps
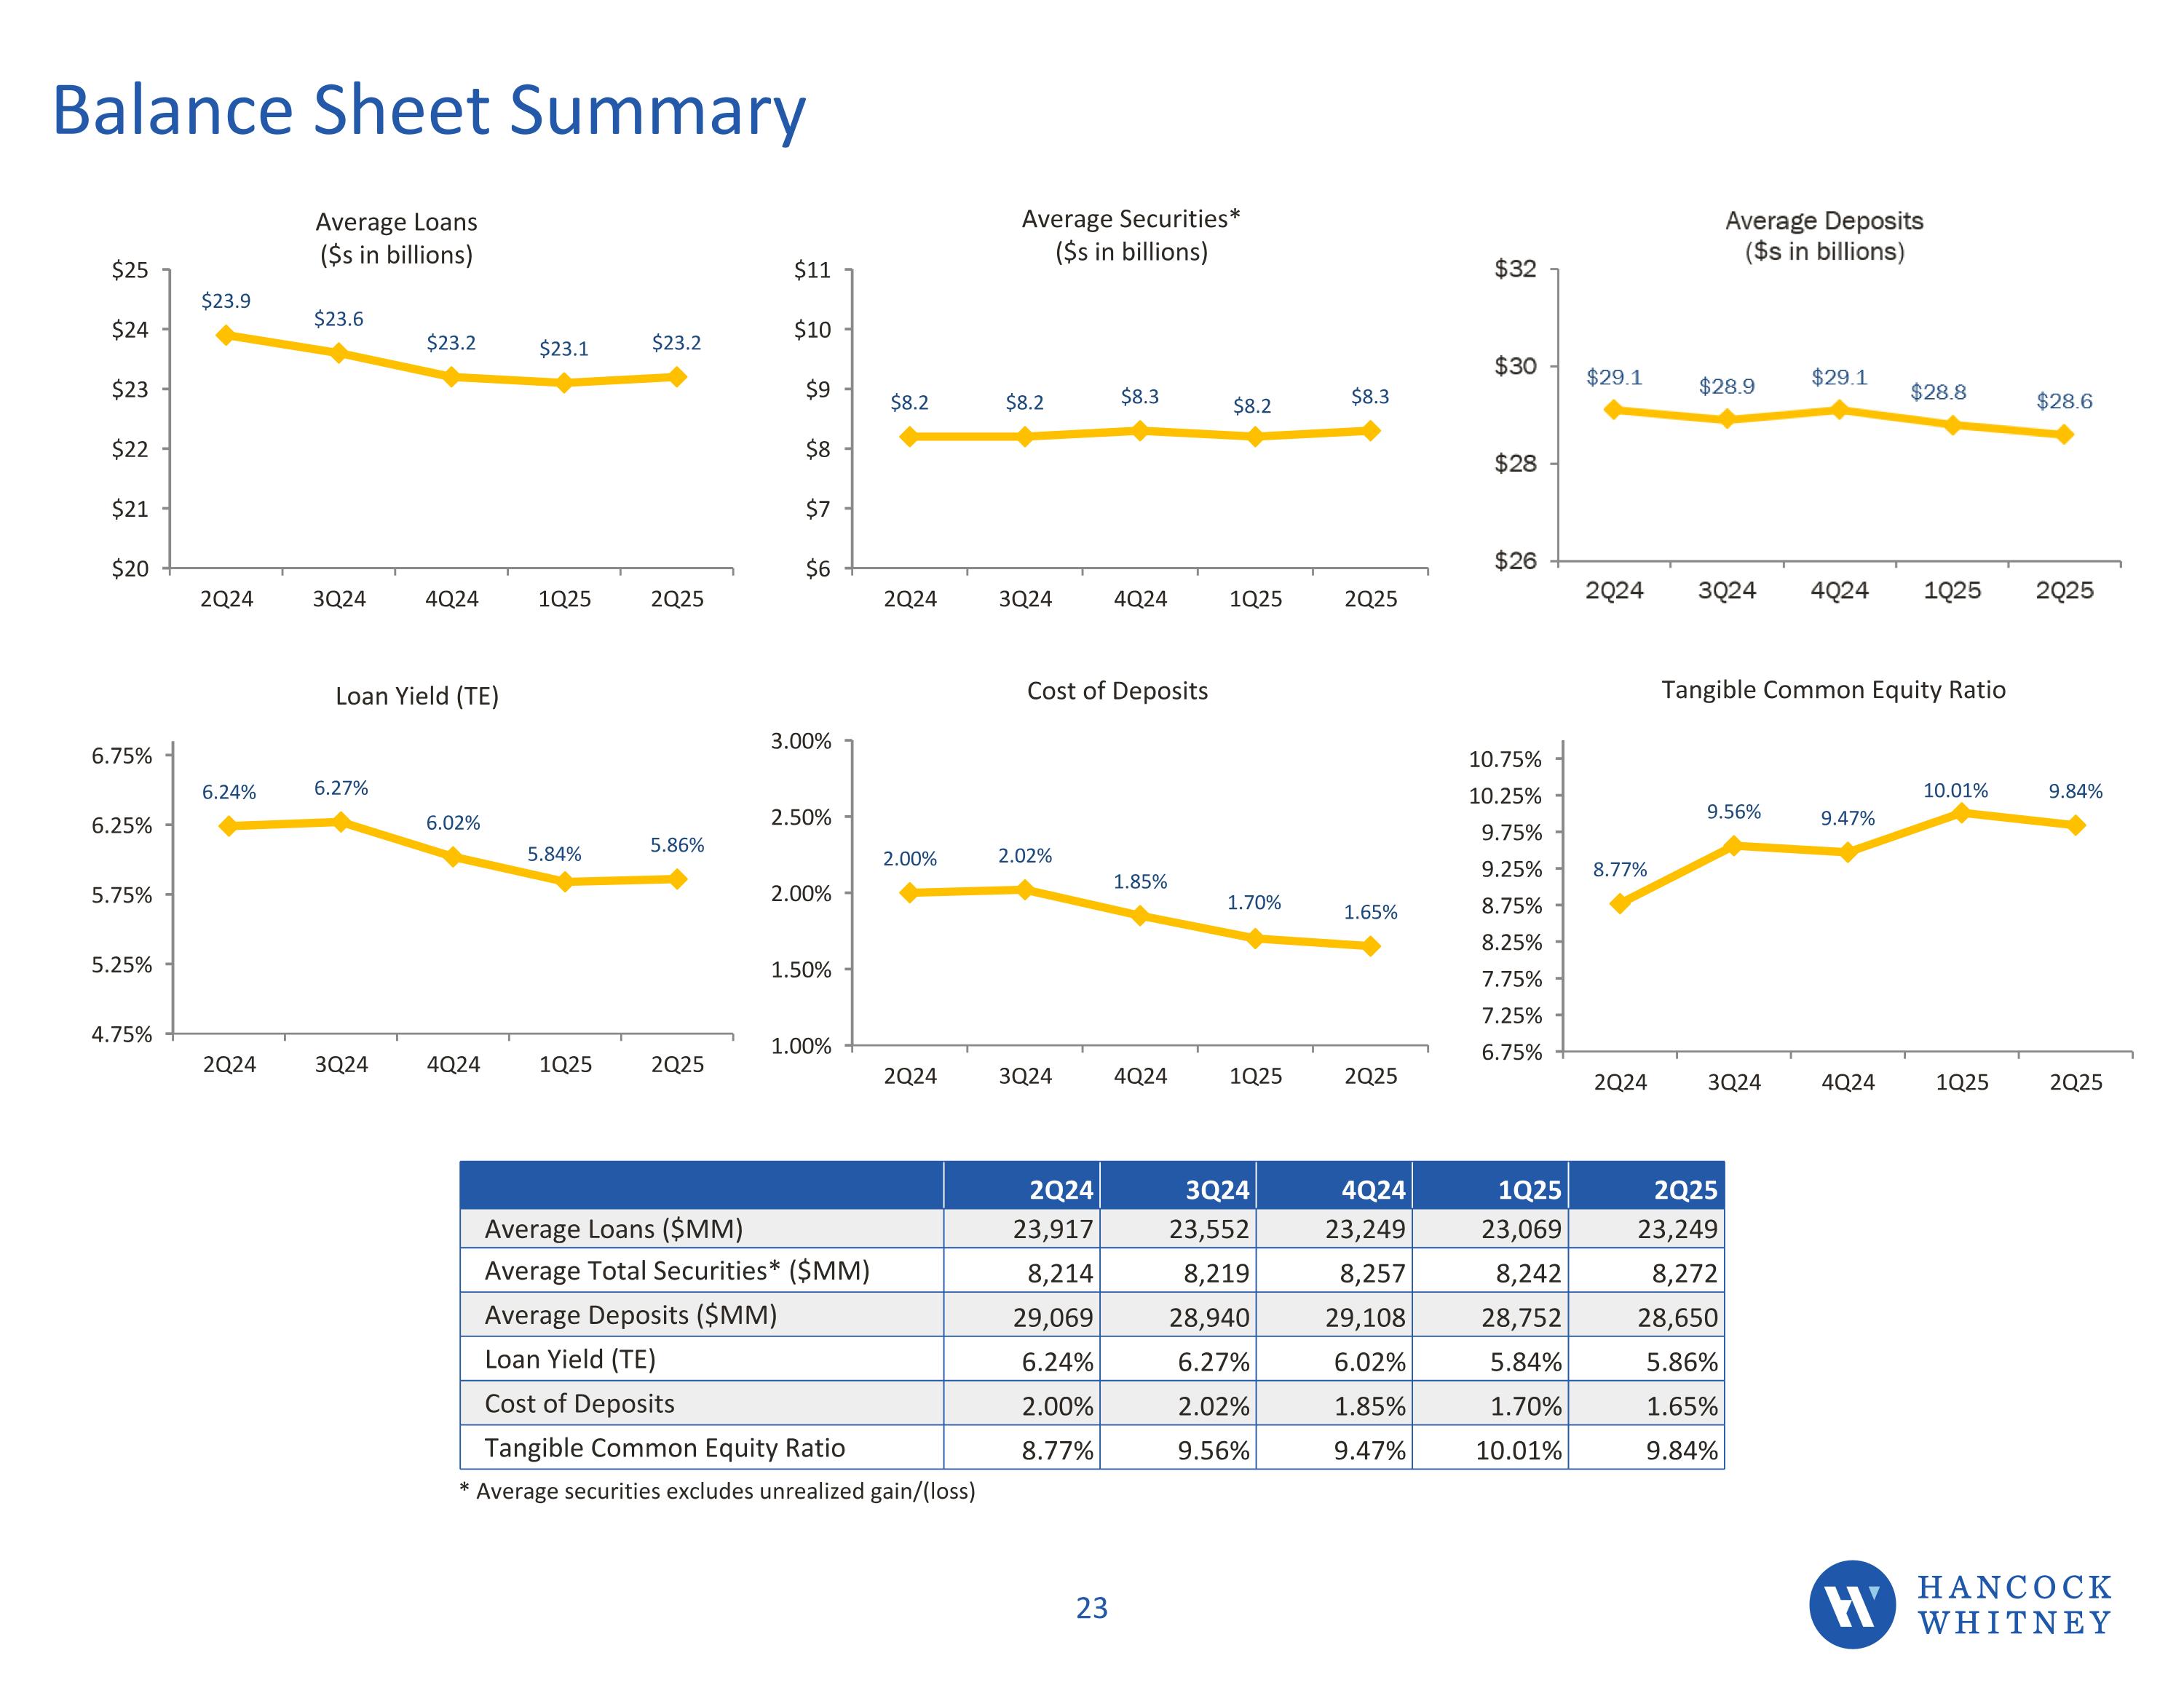
Balance Sheet Summary 2Q24 3Q24 4Q24 1Q25 2Q25 Average Loans ($MM) 23,917 23,552 23,249 23,069 23,249 Average Total Securities* ($MM) 8,214 8,219 8,257 8,242 8,272 Average Deposits ($MM) 29,069 28,940 29,108 28,752 28,650 Loan Yield (TE) 6.24% 6.27% 6.02% 5.84% 5.86% Cost of Deposits 2.00% 2.02% 1.85% 1.70% 1.65% Tangible Common Equity Ratio 8.77% 9.56% 9.47% 10.01% 9.84% * Average securities excludes unrealized gain/(loss)
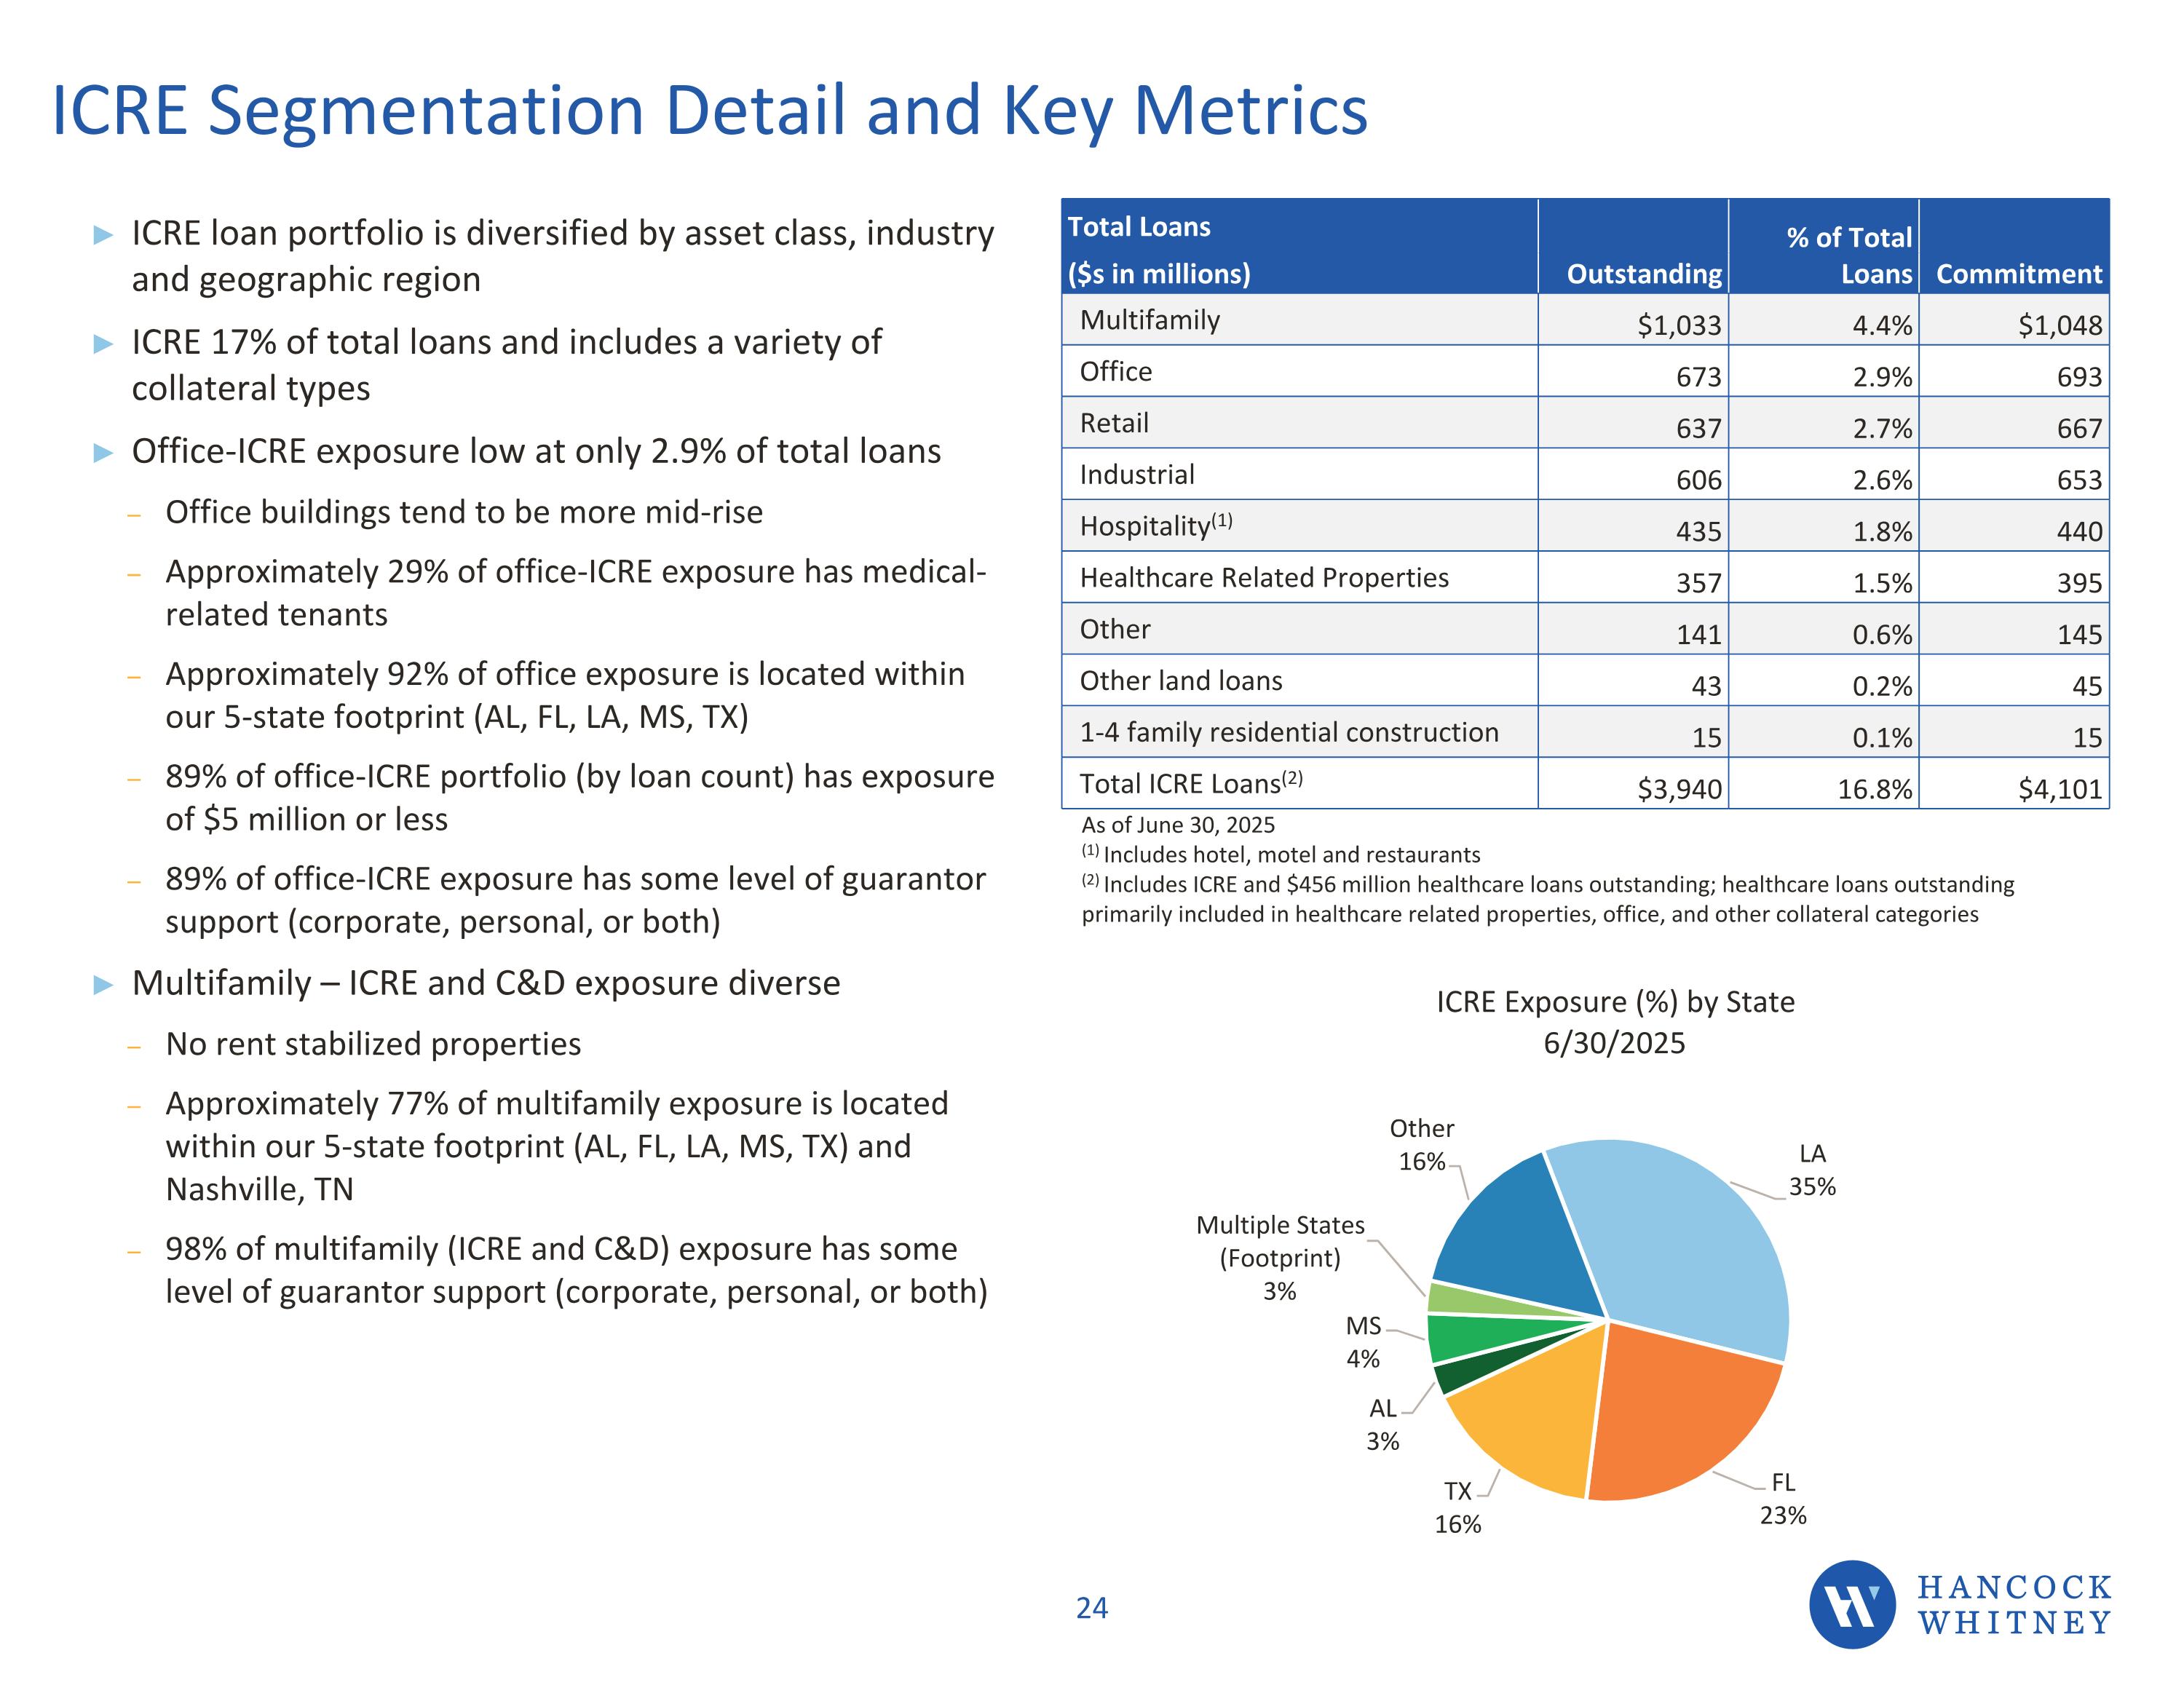
ICRE Segmentation Detail and Key Metrics ICRE loan portfolio is diversified by asset class, industry and geographic region ICRE 17% of total loans and includes a variety of collateral types Office-ICRE exposure low at only 2.9% of total loans Office buildings tend to be more mid-rise Approximately 29% of office-ICRE exposure has medical-related tenants Approximately 92% of office exposure is located within our 5-state footprint (AL, FL, LA, MS, TX) 89% of office-ICRE portfolio (by loan count) has exposure of $5 million or less 89% of office-ICRE exposure has some level of guarantor support (corporate, personal, or both) Multifamily – ICRE and C&D exposure diverse No rent stabilized properties Approximately 77% of multifamily exposure is located within our 5-state footprint (AL, FL, LA, MS, TX) and Nashville, TN 98% of multifamily (ICRE and C&D) exposure has some level of guarantor support (corporate, personal, or both) Total Loans Outstanding % of Total Loans Commitment ($s in millions) Multifamily $1,033 4.4% $1,048 Office 673 2.9% 693 Retail 637 2.7% 667 Industrial 606 2.6% 653 Hospitality(1) 435 1.8% 440 Healthcare Related Properties 357 1.5% 395 Other 141 0.6% 145 Other land loans 43 0.2% 45 1-4 family residential construction 15 0.1% 15 Total ICRE Loans(2) $3,940 16.8% $4,101 As of June 30, 2025 (1) Includes hotel, motel and restaurants (2) Includes ICRE and $456 million healthcare loans outstanding; healthcare loans outstanding primarily included in healthcare related properties, office, and other collateral categories
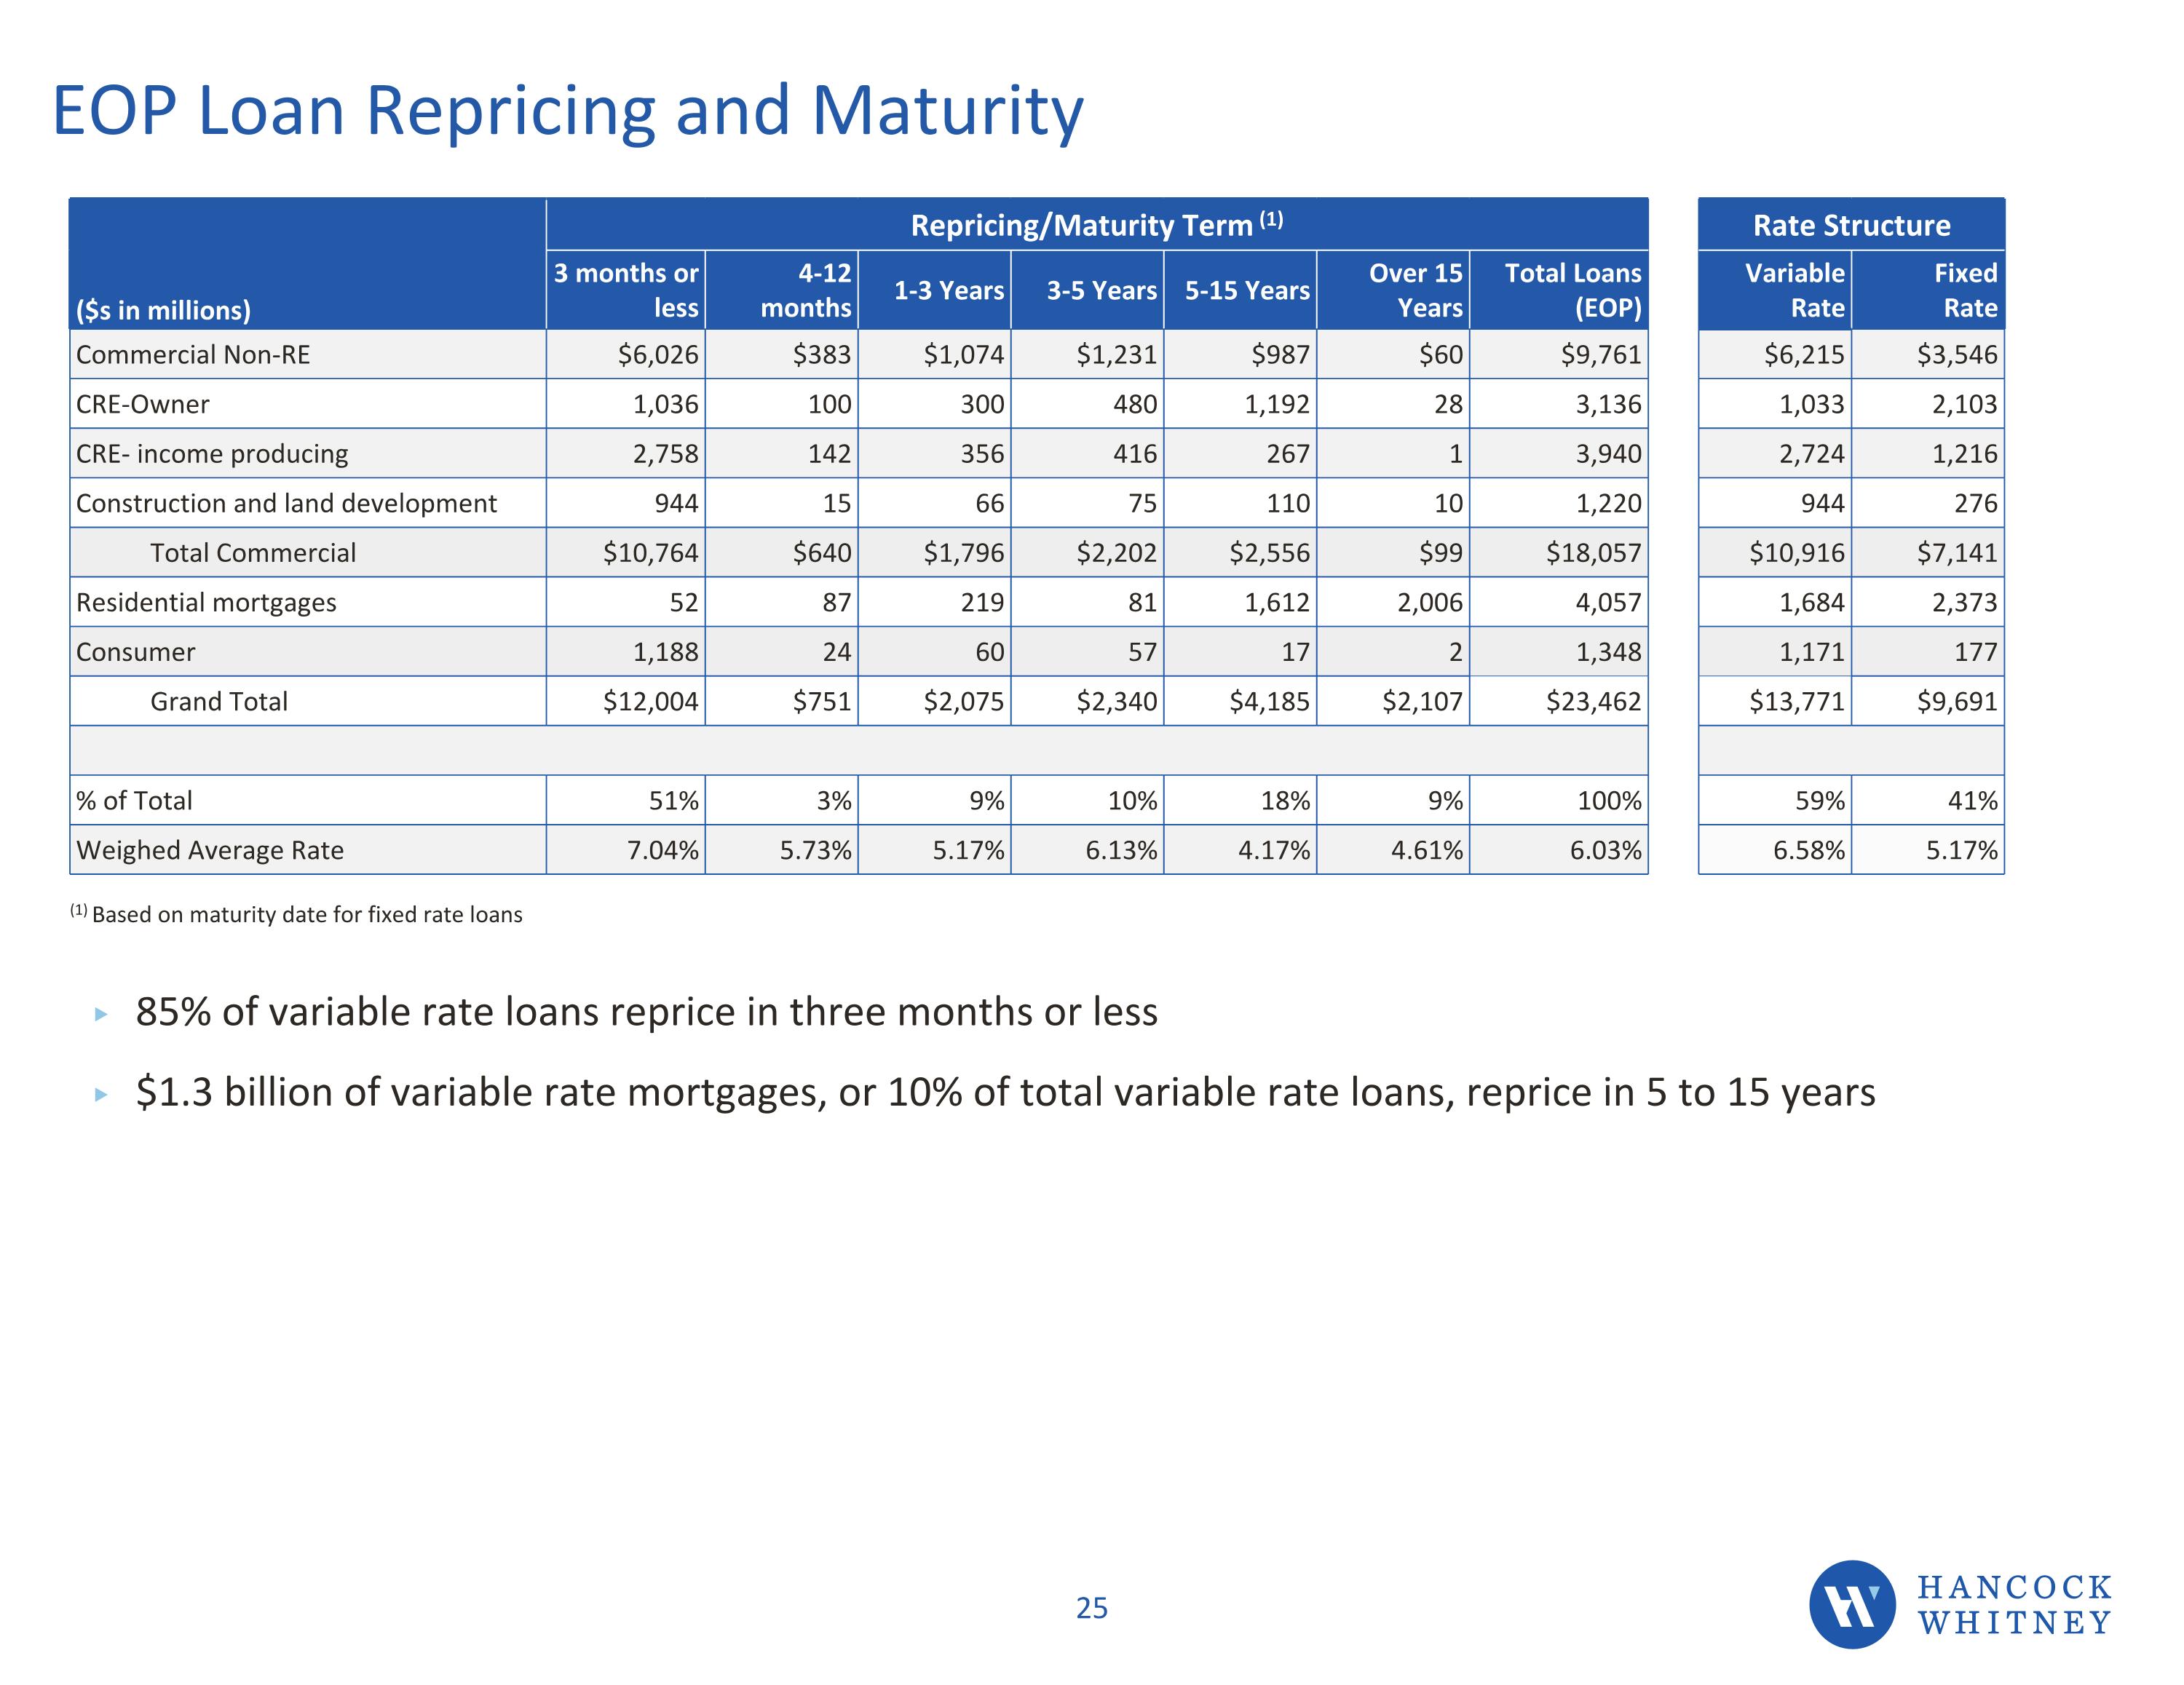
EOP Loan Repricing and Maturity ($s in millions) Repricing/Maturity Term (1) Rate Structure 3 months or less 4-12 months 1-3 Years 3-5 Years 5-15 Years Over 15 Years Total Loans (EOP) Variable Rate Fixed Rate Commercial Non-RE $6,026 $383 $1,074 $1,231 $987 $60 $9,761 $6,215 $3,546 CRE-Owner 1,036 100 300 480 1,192 28 3,136 1,033 2,103 CRE- income producing 2,758 142 356 416 267 1 3,940 2,724 1,216 Construction and land development 944 15 66 75 110 10 1,220 944 276 Total Commercial $10,764 $640 $1,796 $2,202 $2,556 $99 $18,057 $10,916 $7,141 Residential mortgages 52 87 219 81 1,612 2,006 4,057 1,684 2,373 Consumer 1,188 24 60 57 17 2 1,348 1,171 177 Grand Total $12,004 $751 $2,075 $2,340 $4,185 $2,107 $23,462 $13,771 $9,691 % of Total 51% 3% 9% 10% 18% 9% 100% 59% 41% Weighed Average Rate 7.04% 5.73% 5.17% 6.13% 4.17% 4.61% 6.03% 6.58% 5.17% (1) Based on maturity date for fixed rate loans 85% of variable rate loans reprice in three months or less $1.3 billion of variable rate mortgages, or 10% of total variable rate loans, reprice in 5 to 15 years
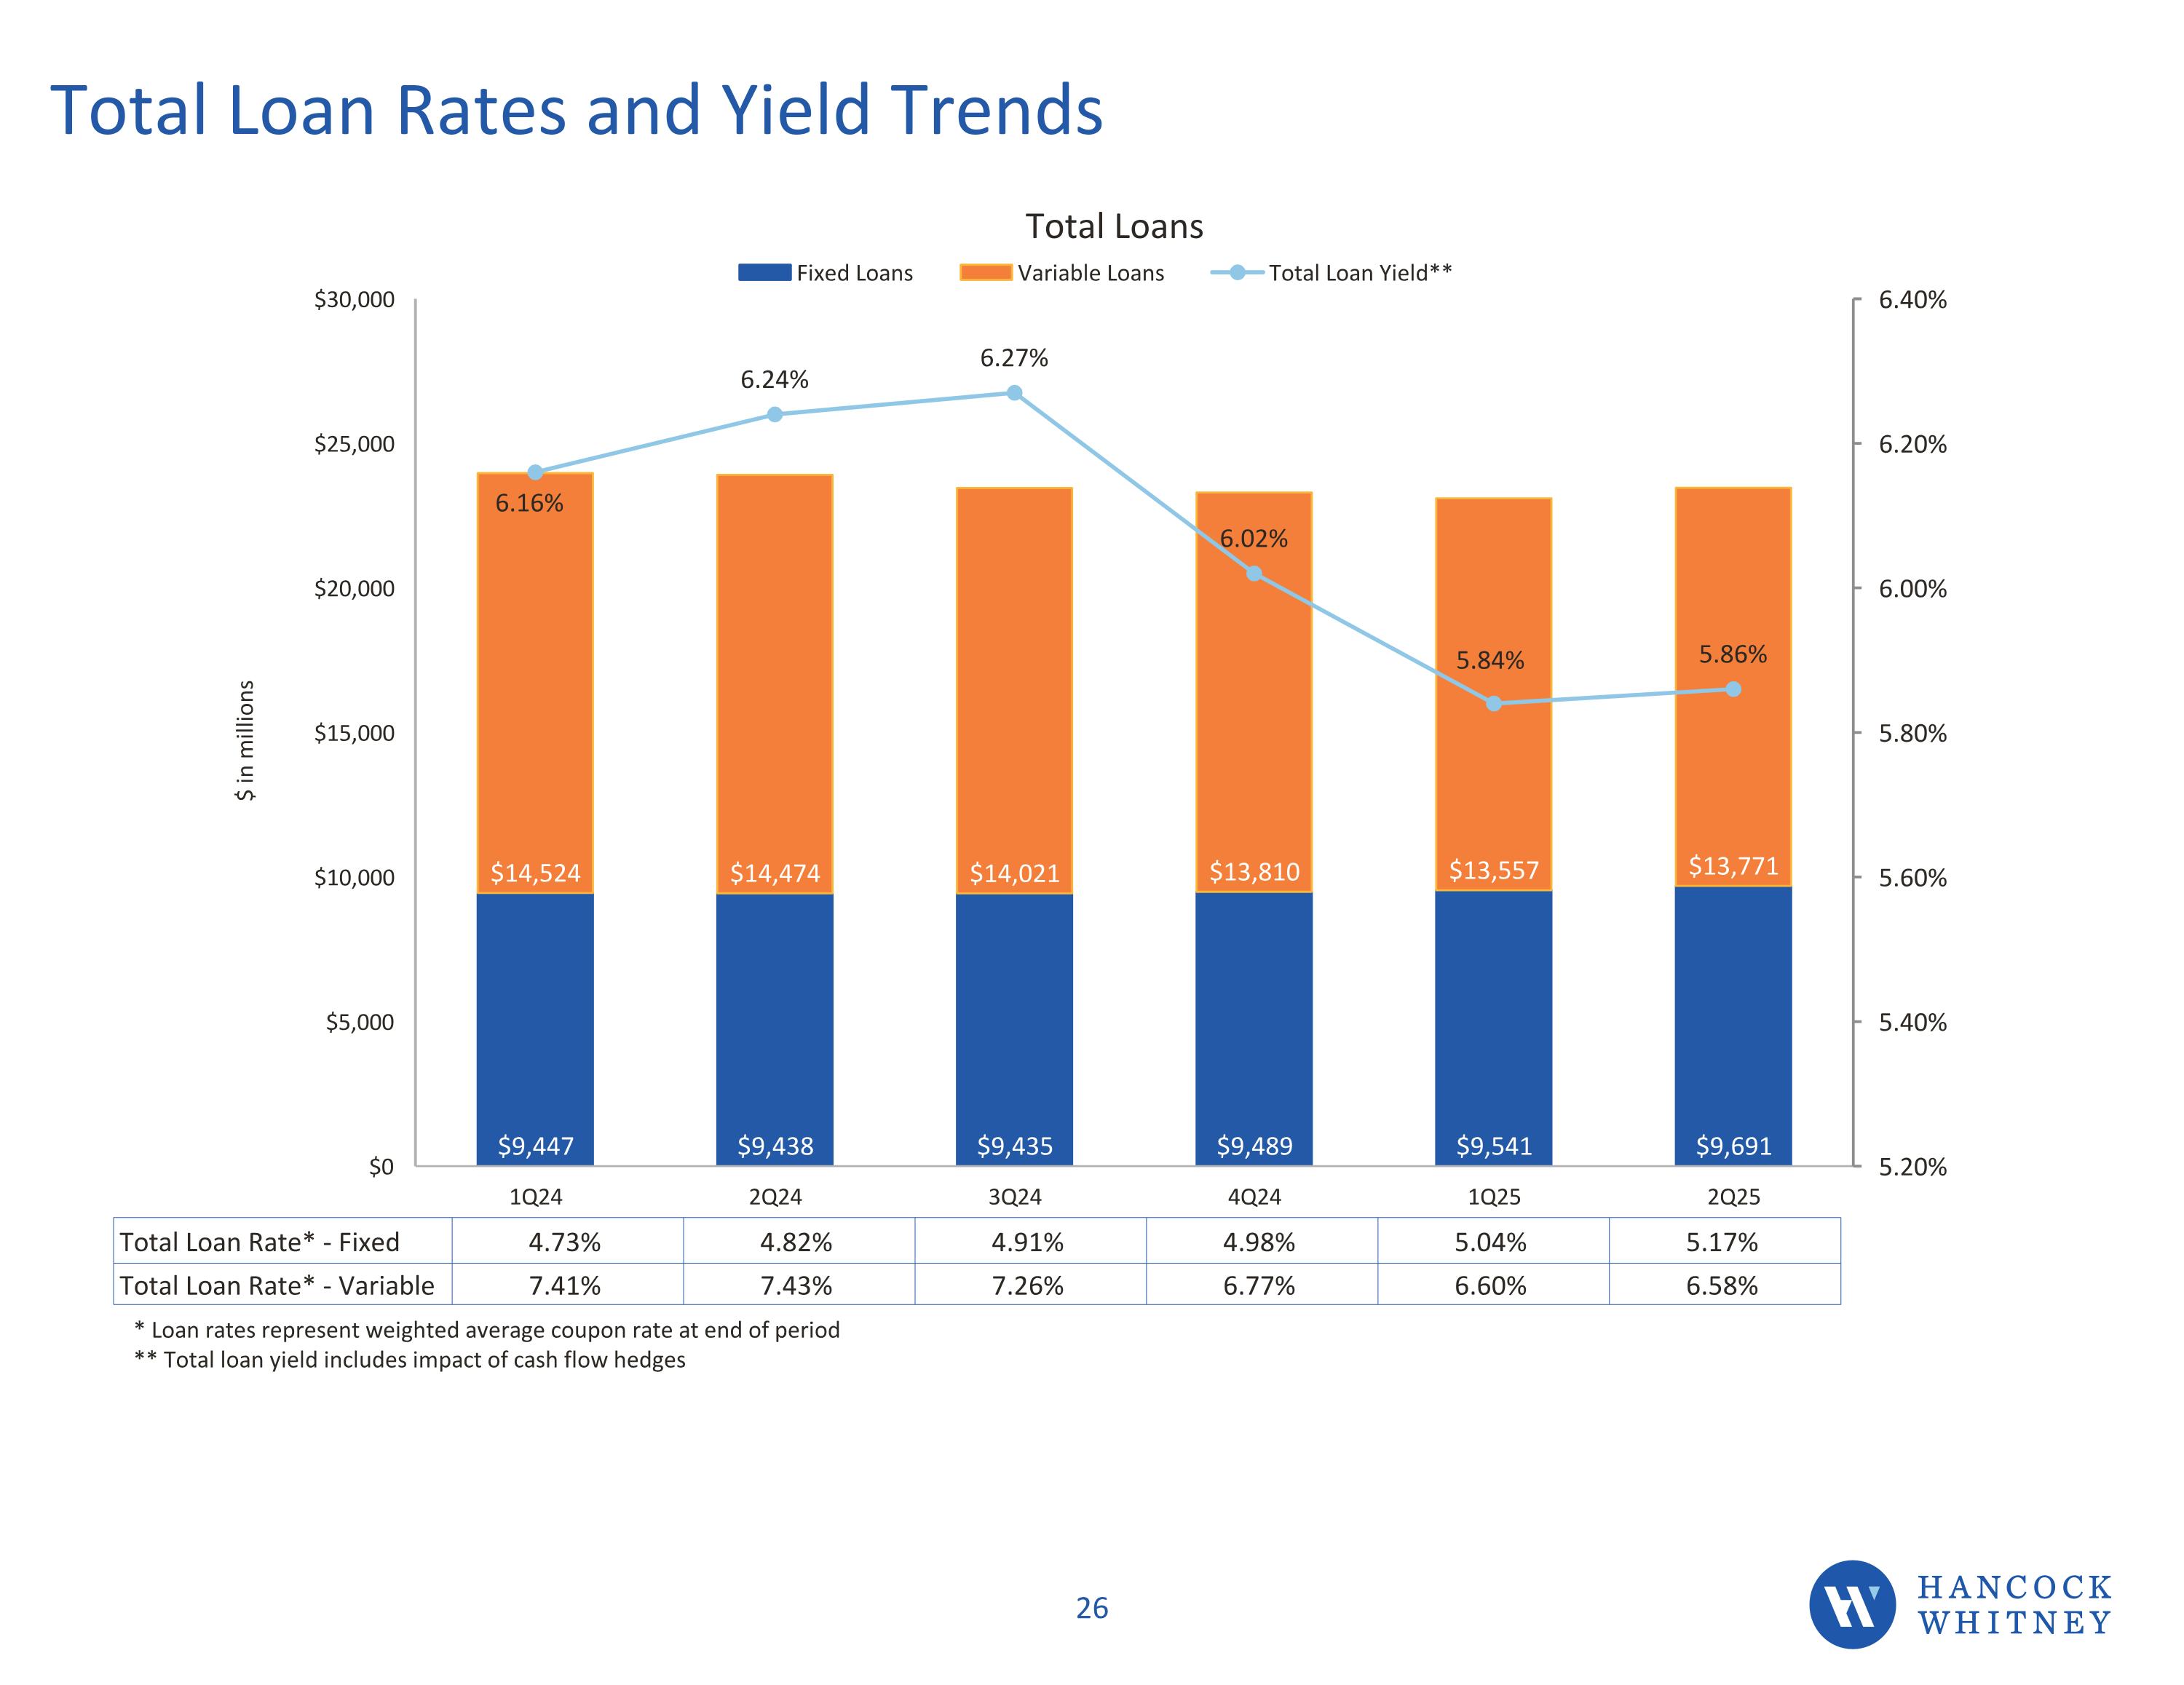
Total Loan Rates and Yield Trends $ in millions Total Loan Rate* - Fixed 4.73% 4.82% 4.91% 4.98% 5.04% 5.17% Total Loan Rate* - Variable 7.41% 7.43% 7.26% 6.77% 6.60% 6.58% * Loan rates represent weighted average coupon rate at end of period ** Total loan yield includes impact of cash flow hedges
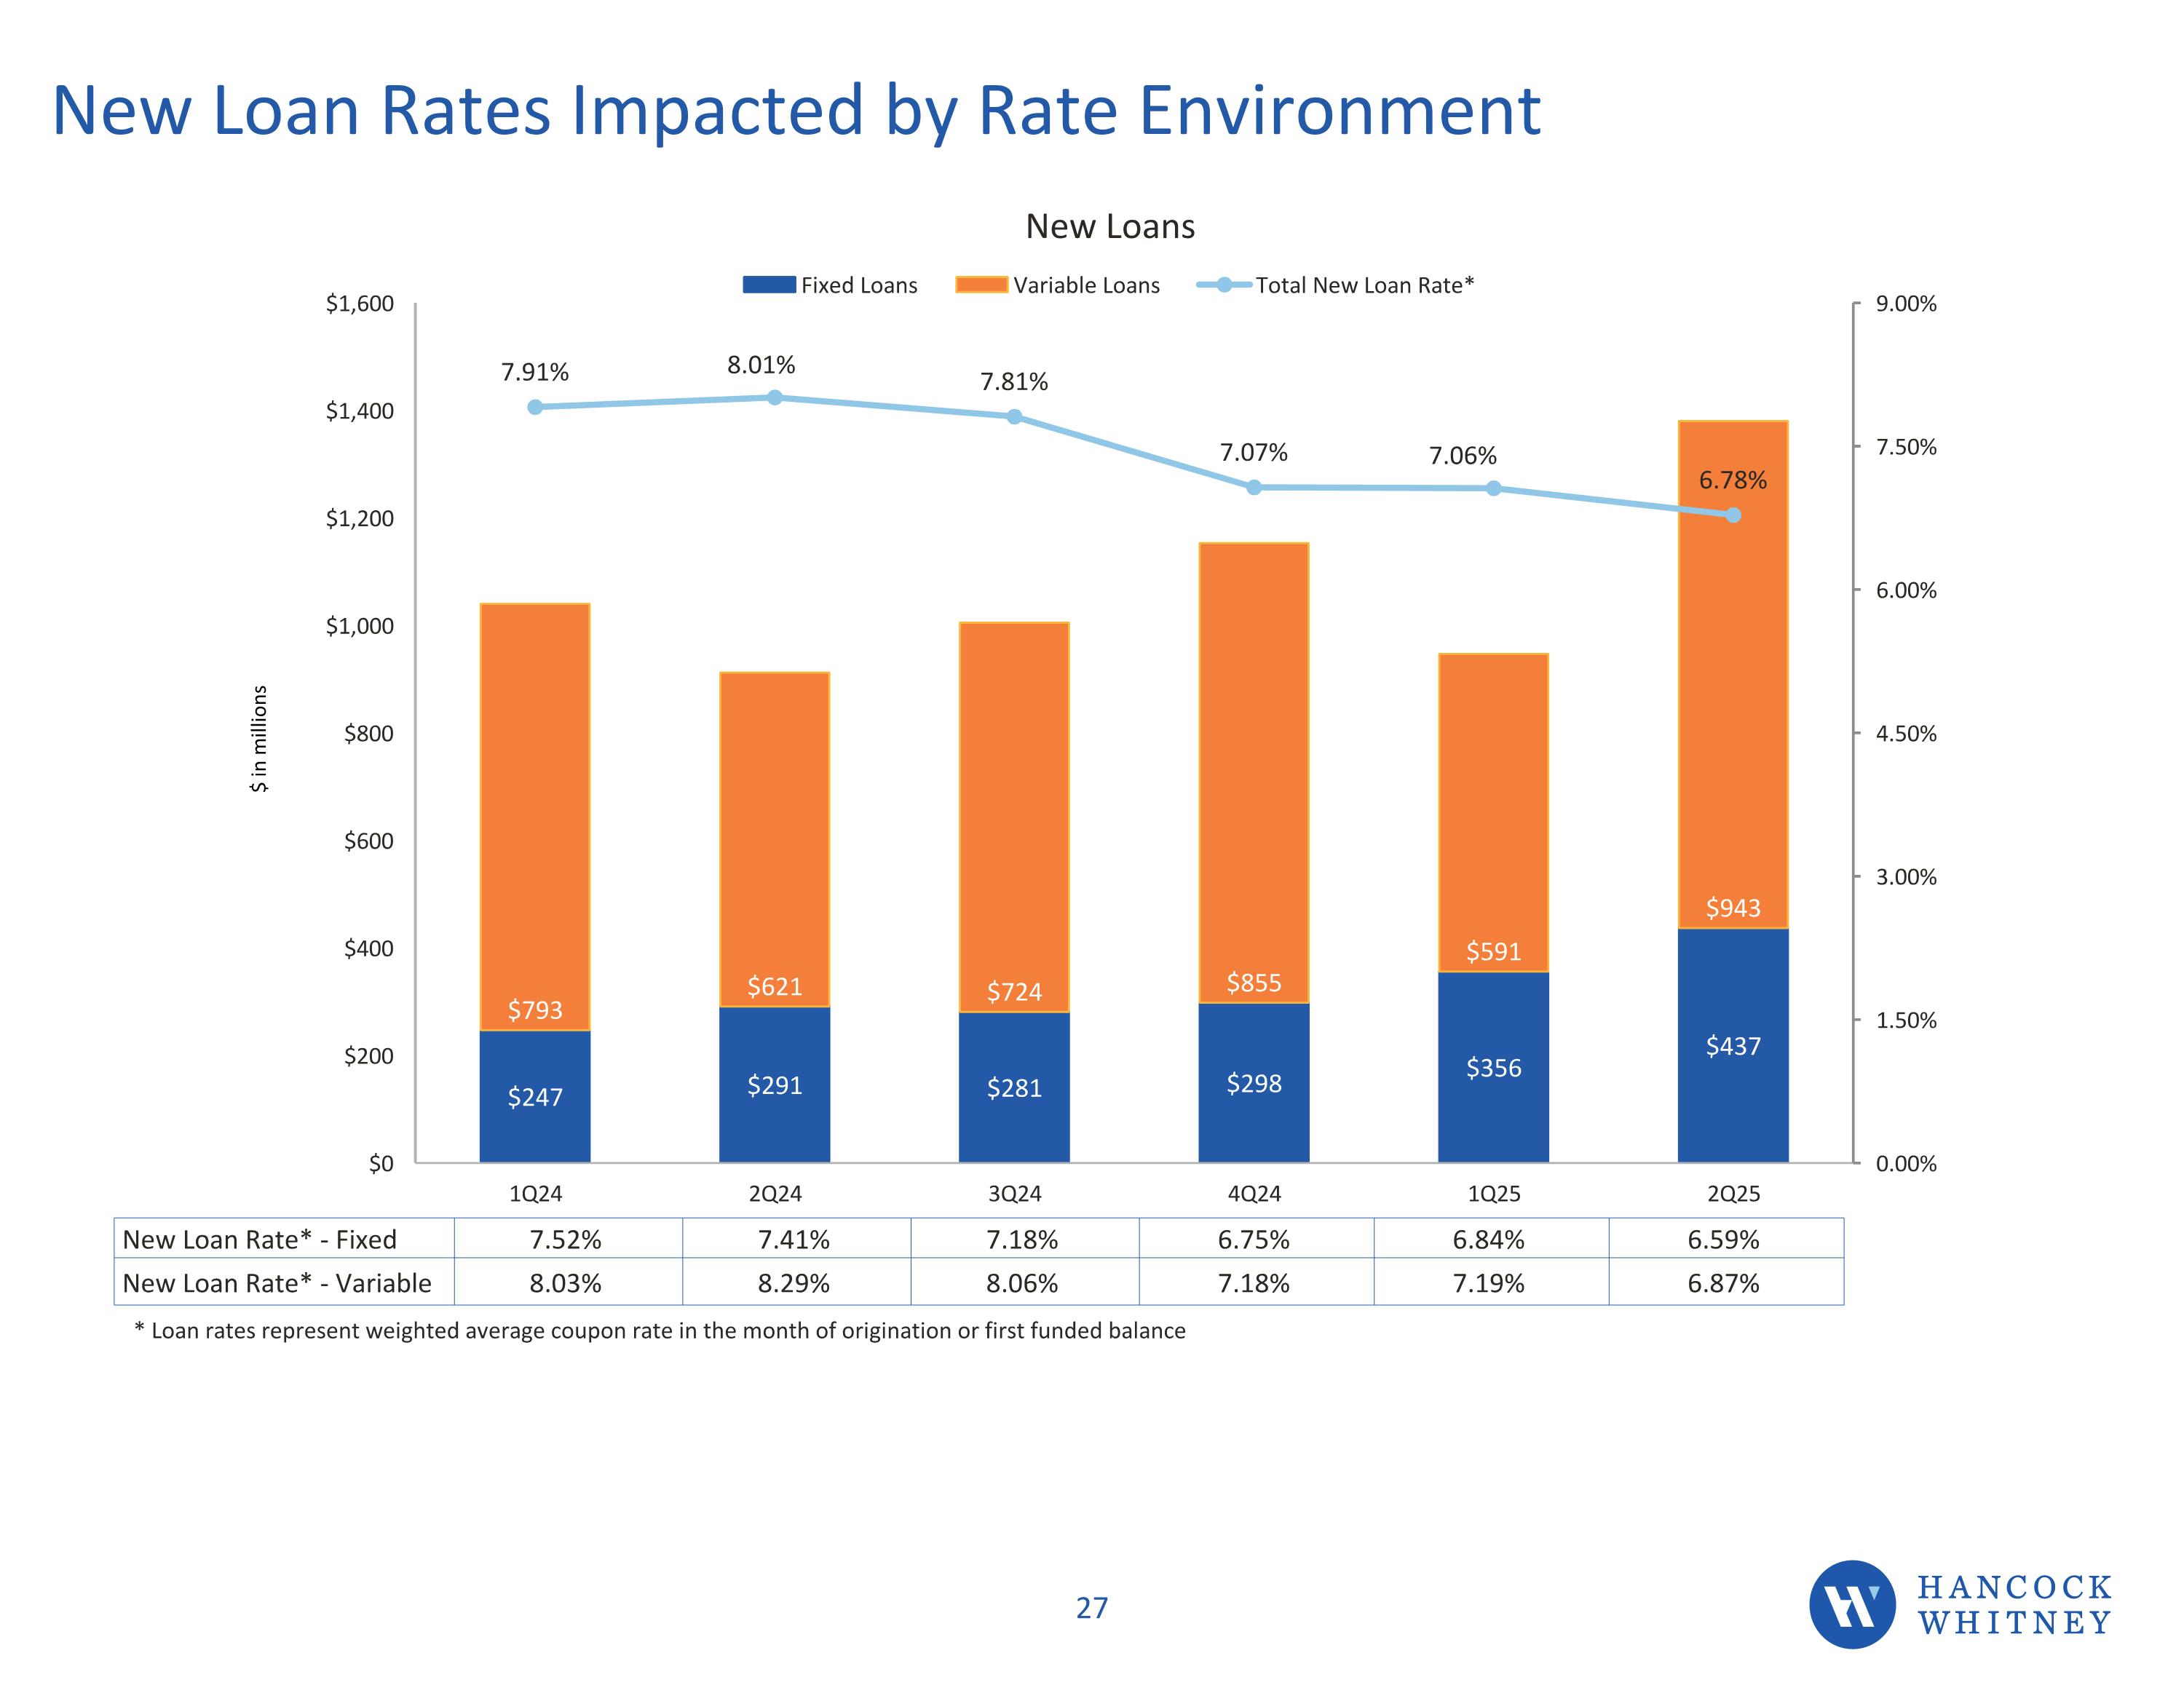
New Loan Rates Impacted by Rate Environment $ in millions New Loan Rate* - Fixed 7.52% 7.41% 7.18% 6.75% 6.84% 6.59% New Loan Rate* - Variable 8.03% 8.29% 8.06% 7.18% 7.19% 6.87% * Loan rates represent weighted average coupon rate in the month of origination or first funded balance
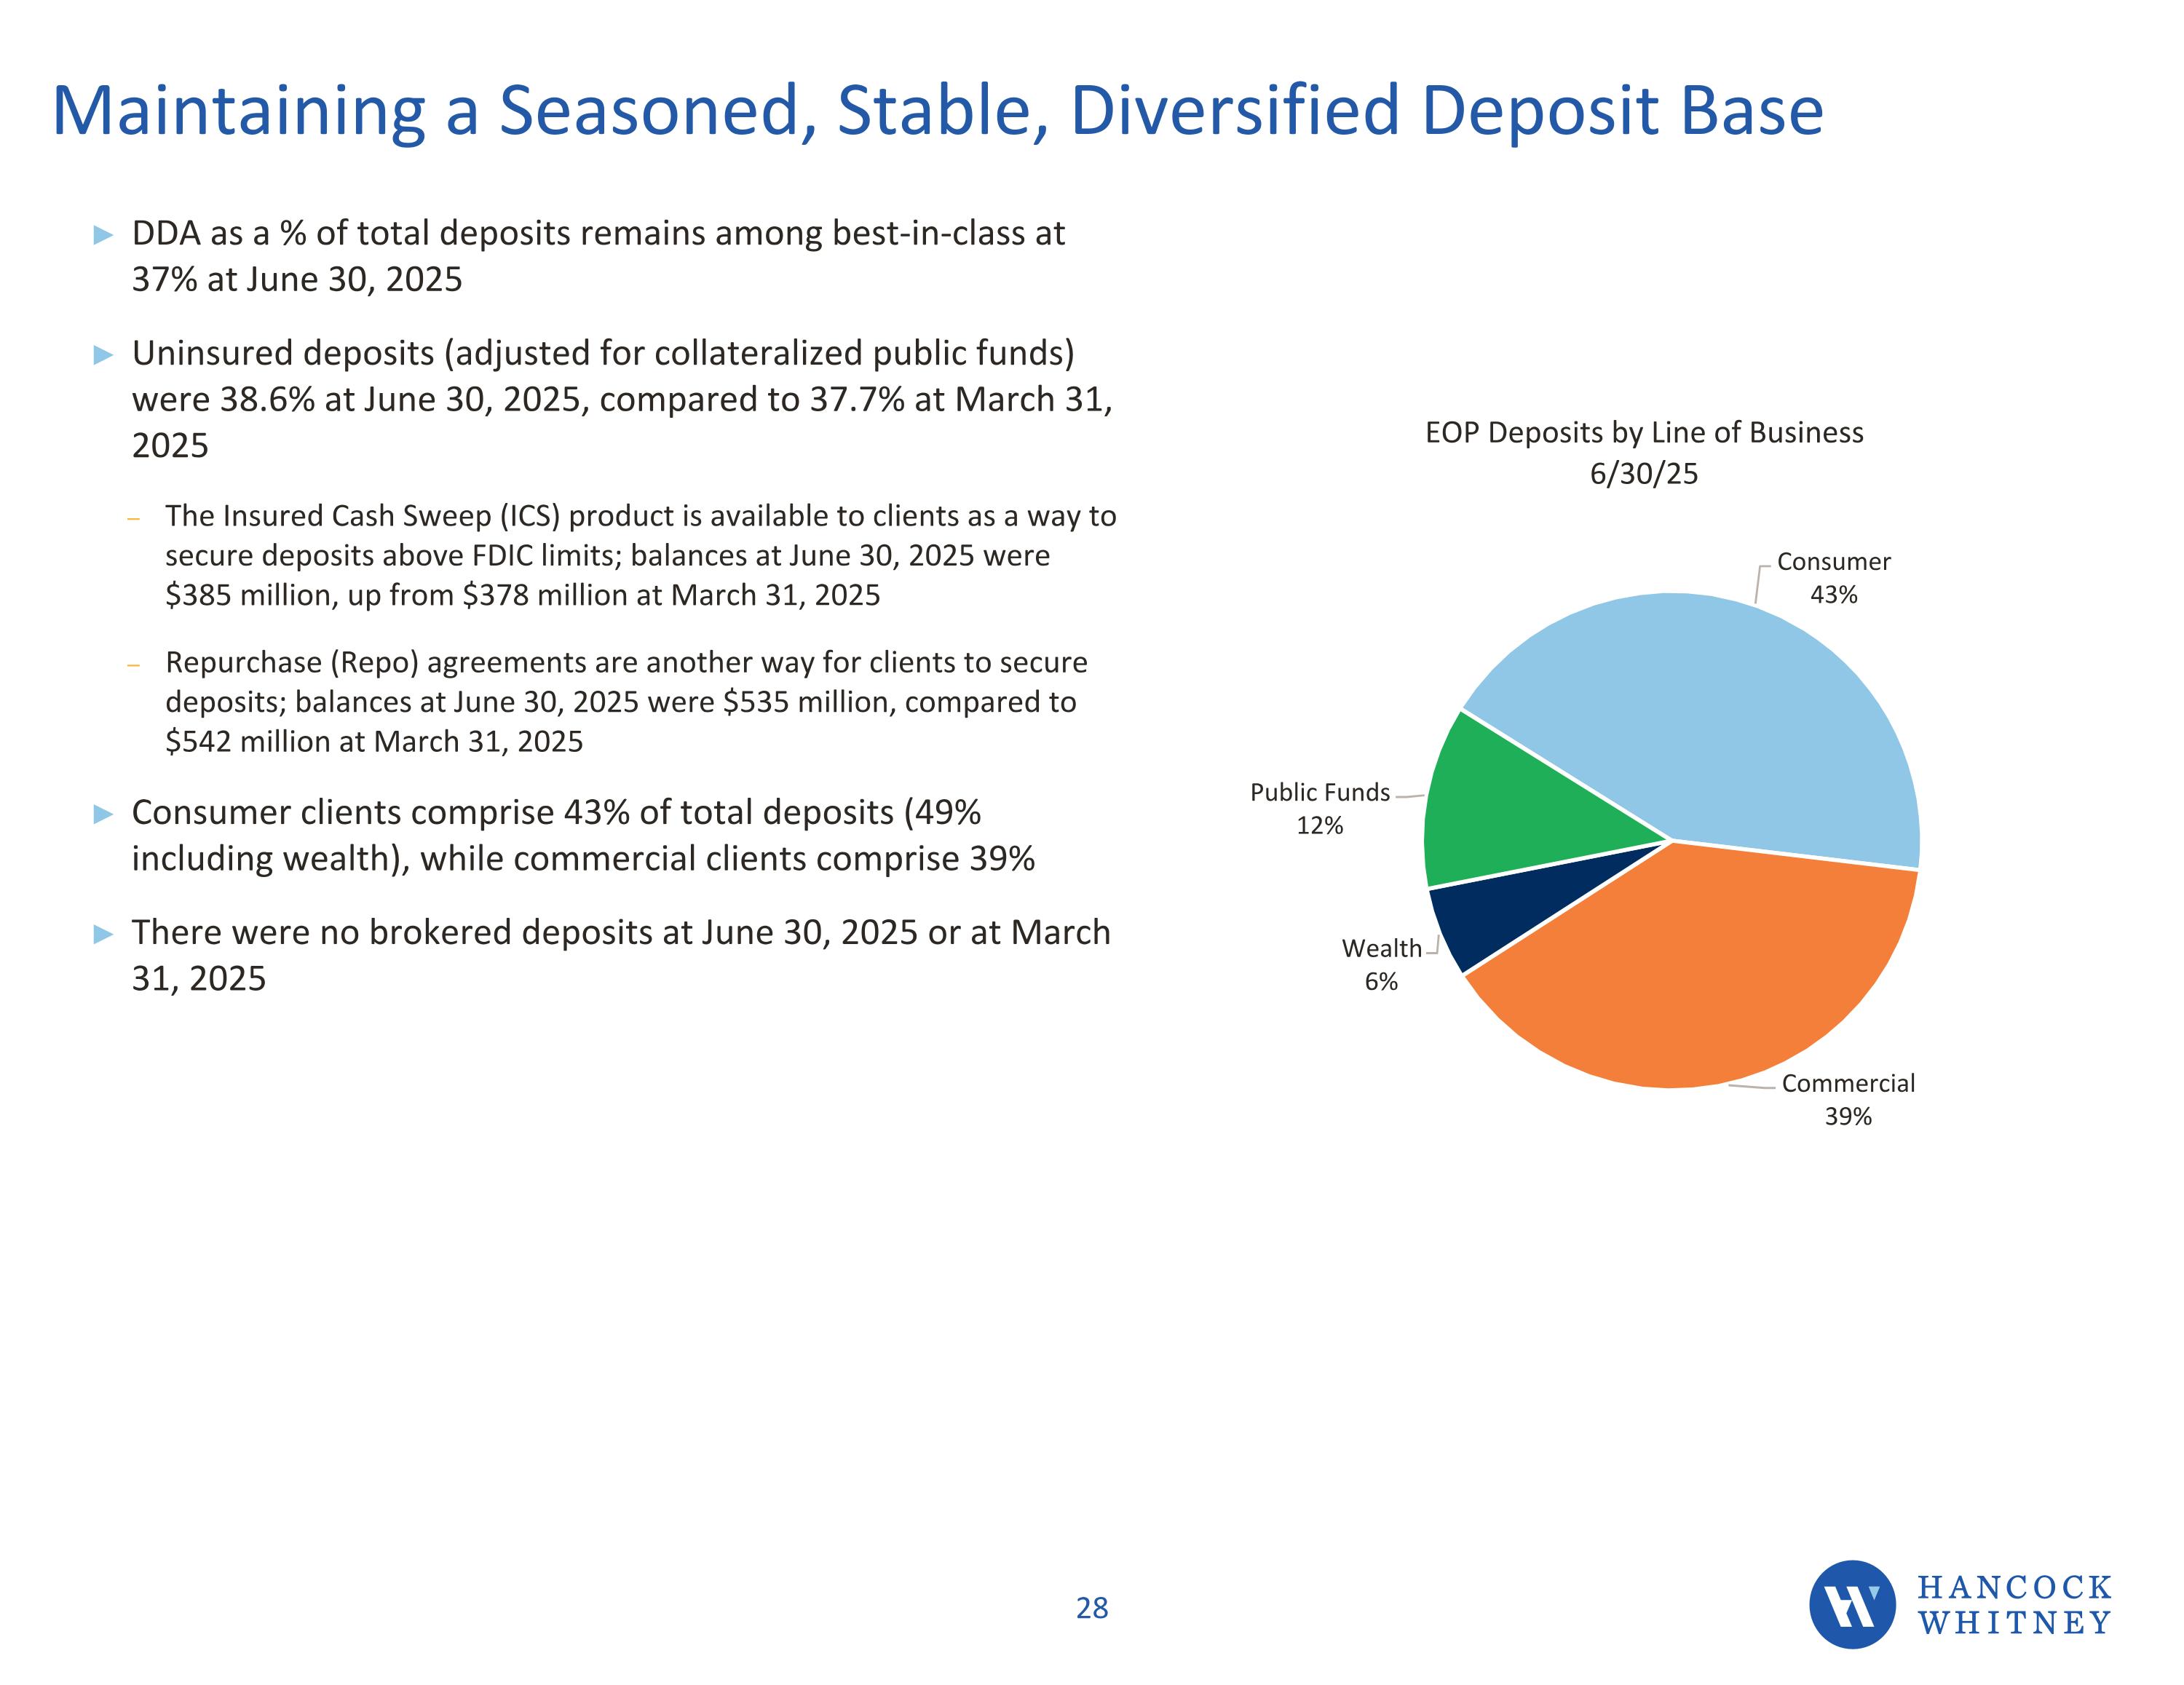
Maintaining a Seasoned, Stable, Diversified Deposit Base DDA as a % of total deposits remains among best-in-class at 37% at June 30, 2025 Uninsured deposits (adjusted for collateralized public funds) were 38.6% at June 30, 2025, compared to 37.7% at March 31, 2025 The Insured Cash Sweep (ICS) product is available to clients as a way to secure deposits above FDIC limits; balances at June 30, 2025 were $385 million, up from $378 million at March 31, 2025 Repurchase (Repo) agreements are another way for clients to secure deposits; balances at June 30, 2025 were $535 million, compared to $542 million at March 31, 2025 Consumer clients comprise 43% of total deposits (49% including wealth), while commercial clients comprise 39% There were no brokered deposits at June 30, 2025 or at March 31, 2025
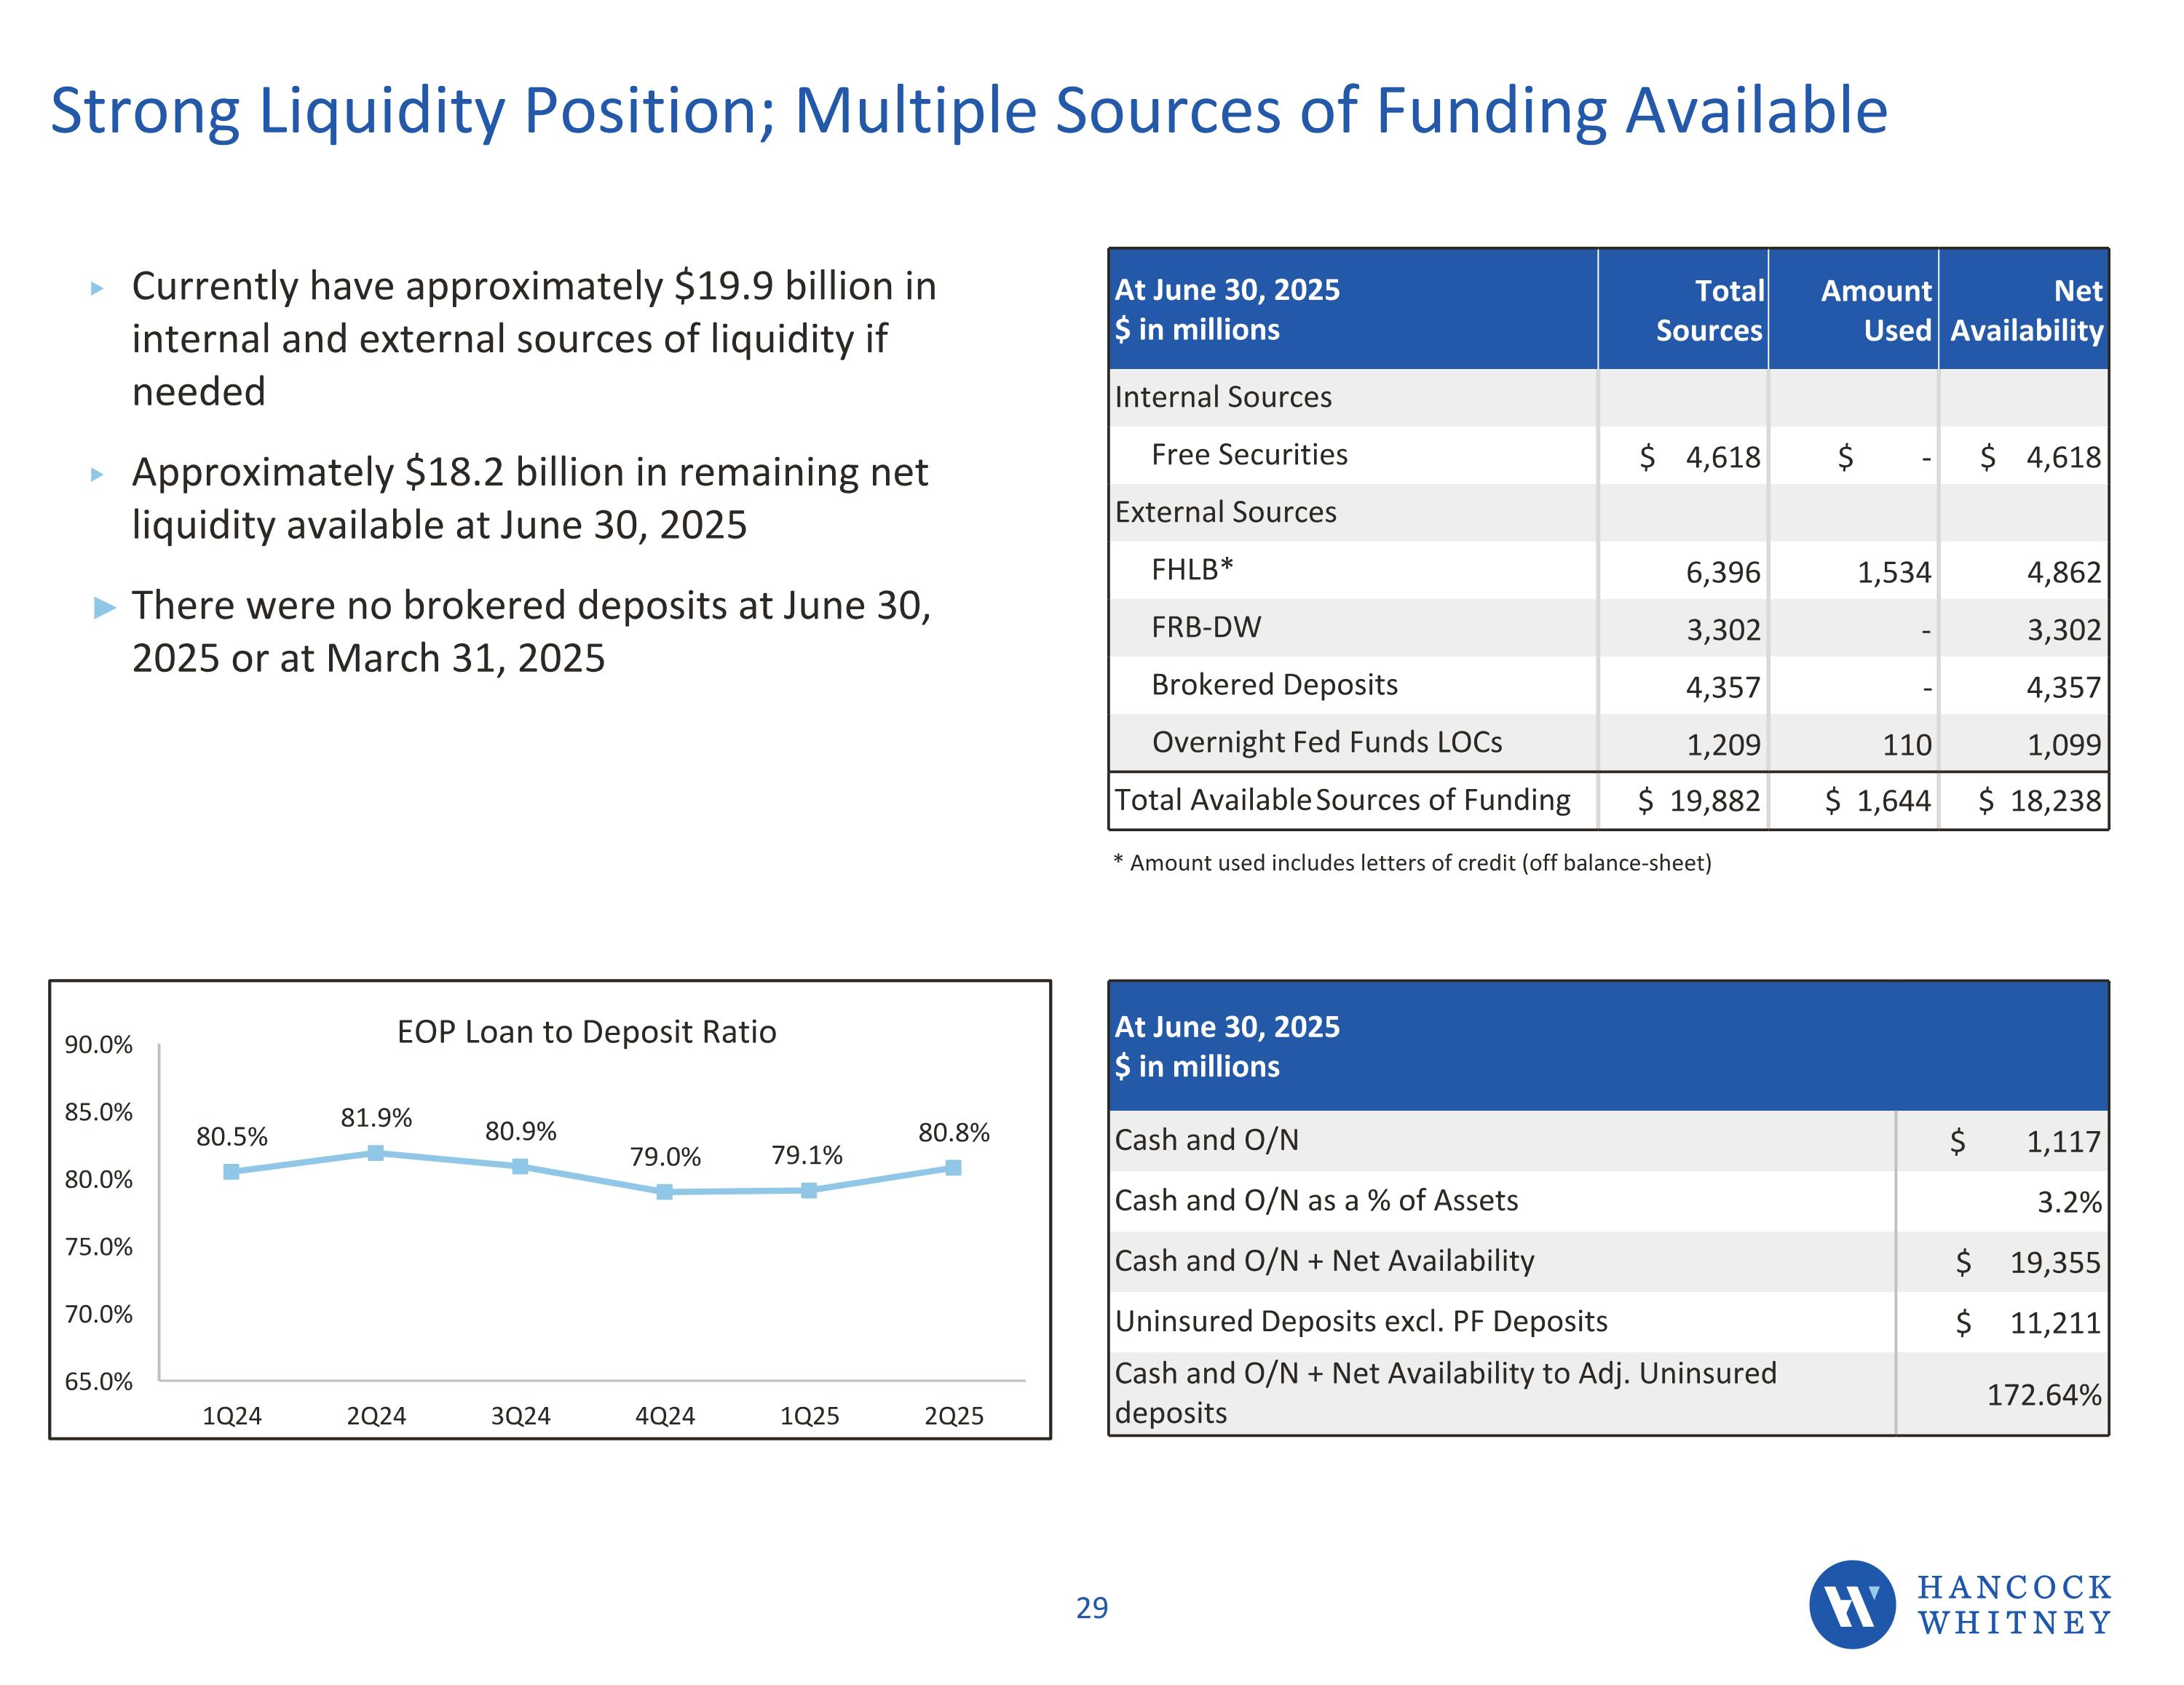
Currently have approximately $19.9 billion in internal and external sources of liquidity if needed Approximately $18.2 billion in remaining net liquidity available at June 30, 2025 There were no brokered deposits at June 30, 2025 or at March 31, 2025 At June 30, 2025 $ in millions Total Sources Amount Used Net Availability Internal Sources Free Securities $ 4,618 $ - $ 4,618 External Sources FHLB* 6,396 1,534 4,862 FRB-DW 3,302 - 3,302 Brokered Deposits 4,357 - 4,357 Overnight Fed Funds LOCs 1,209 110 1,099 Total Available Sources of Funding $ 19,882 $ 1,644 $ 18,238 Strong Liquidity Position; Multiple Sources of Funding Available At June 30, 2025 $ in millions Cash and O/N $ 1,117 Cash and O/N as a % of Assets 3.2% Cash and O/N + Net Availability $ 19,355 Uninsured Deposits excl. PF Deposits $ 11,211 Cash and O/N + Net Availability to Adj. Uninsured deposits 172.64% * Amount used includes letters of credit (off balance-sheet)
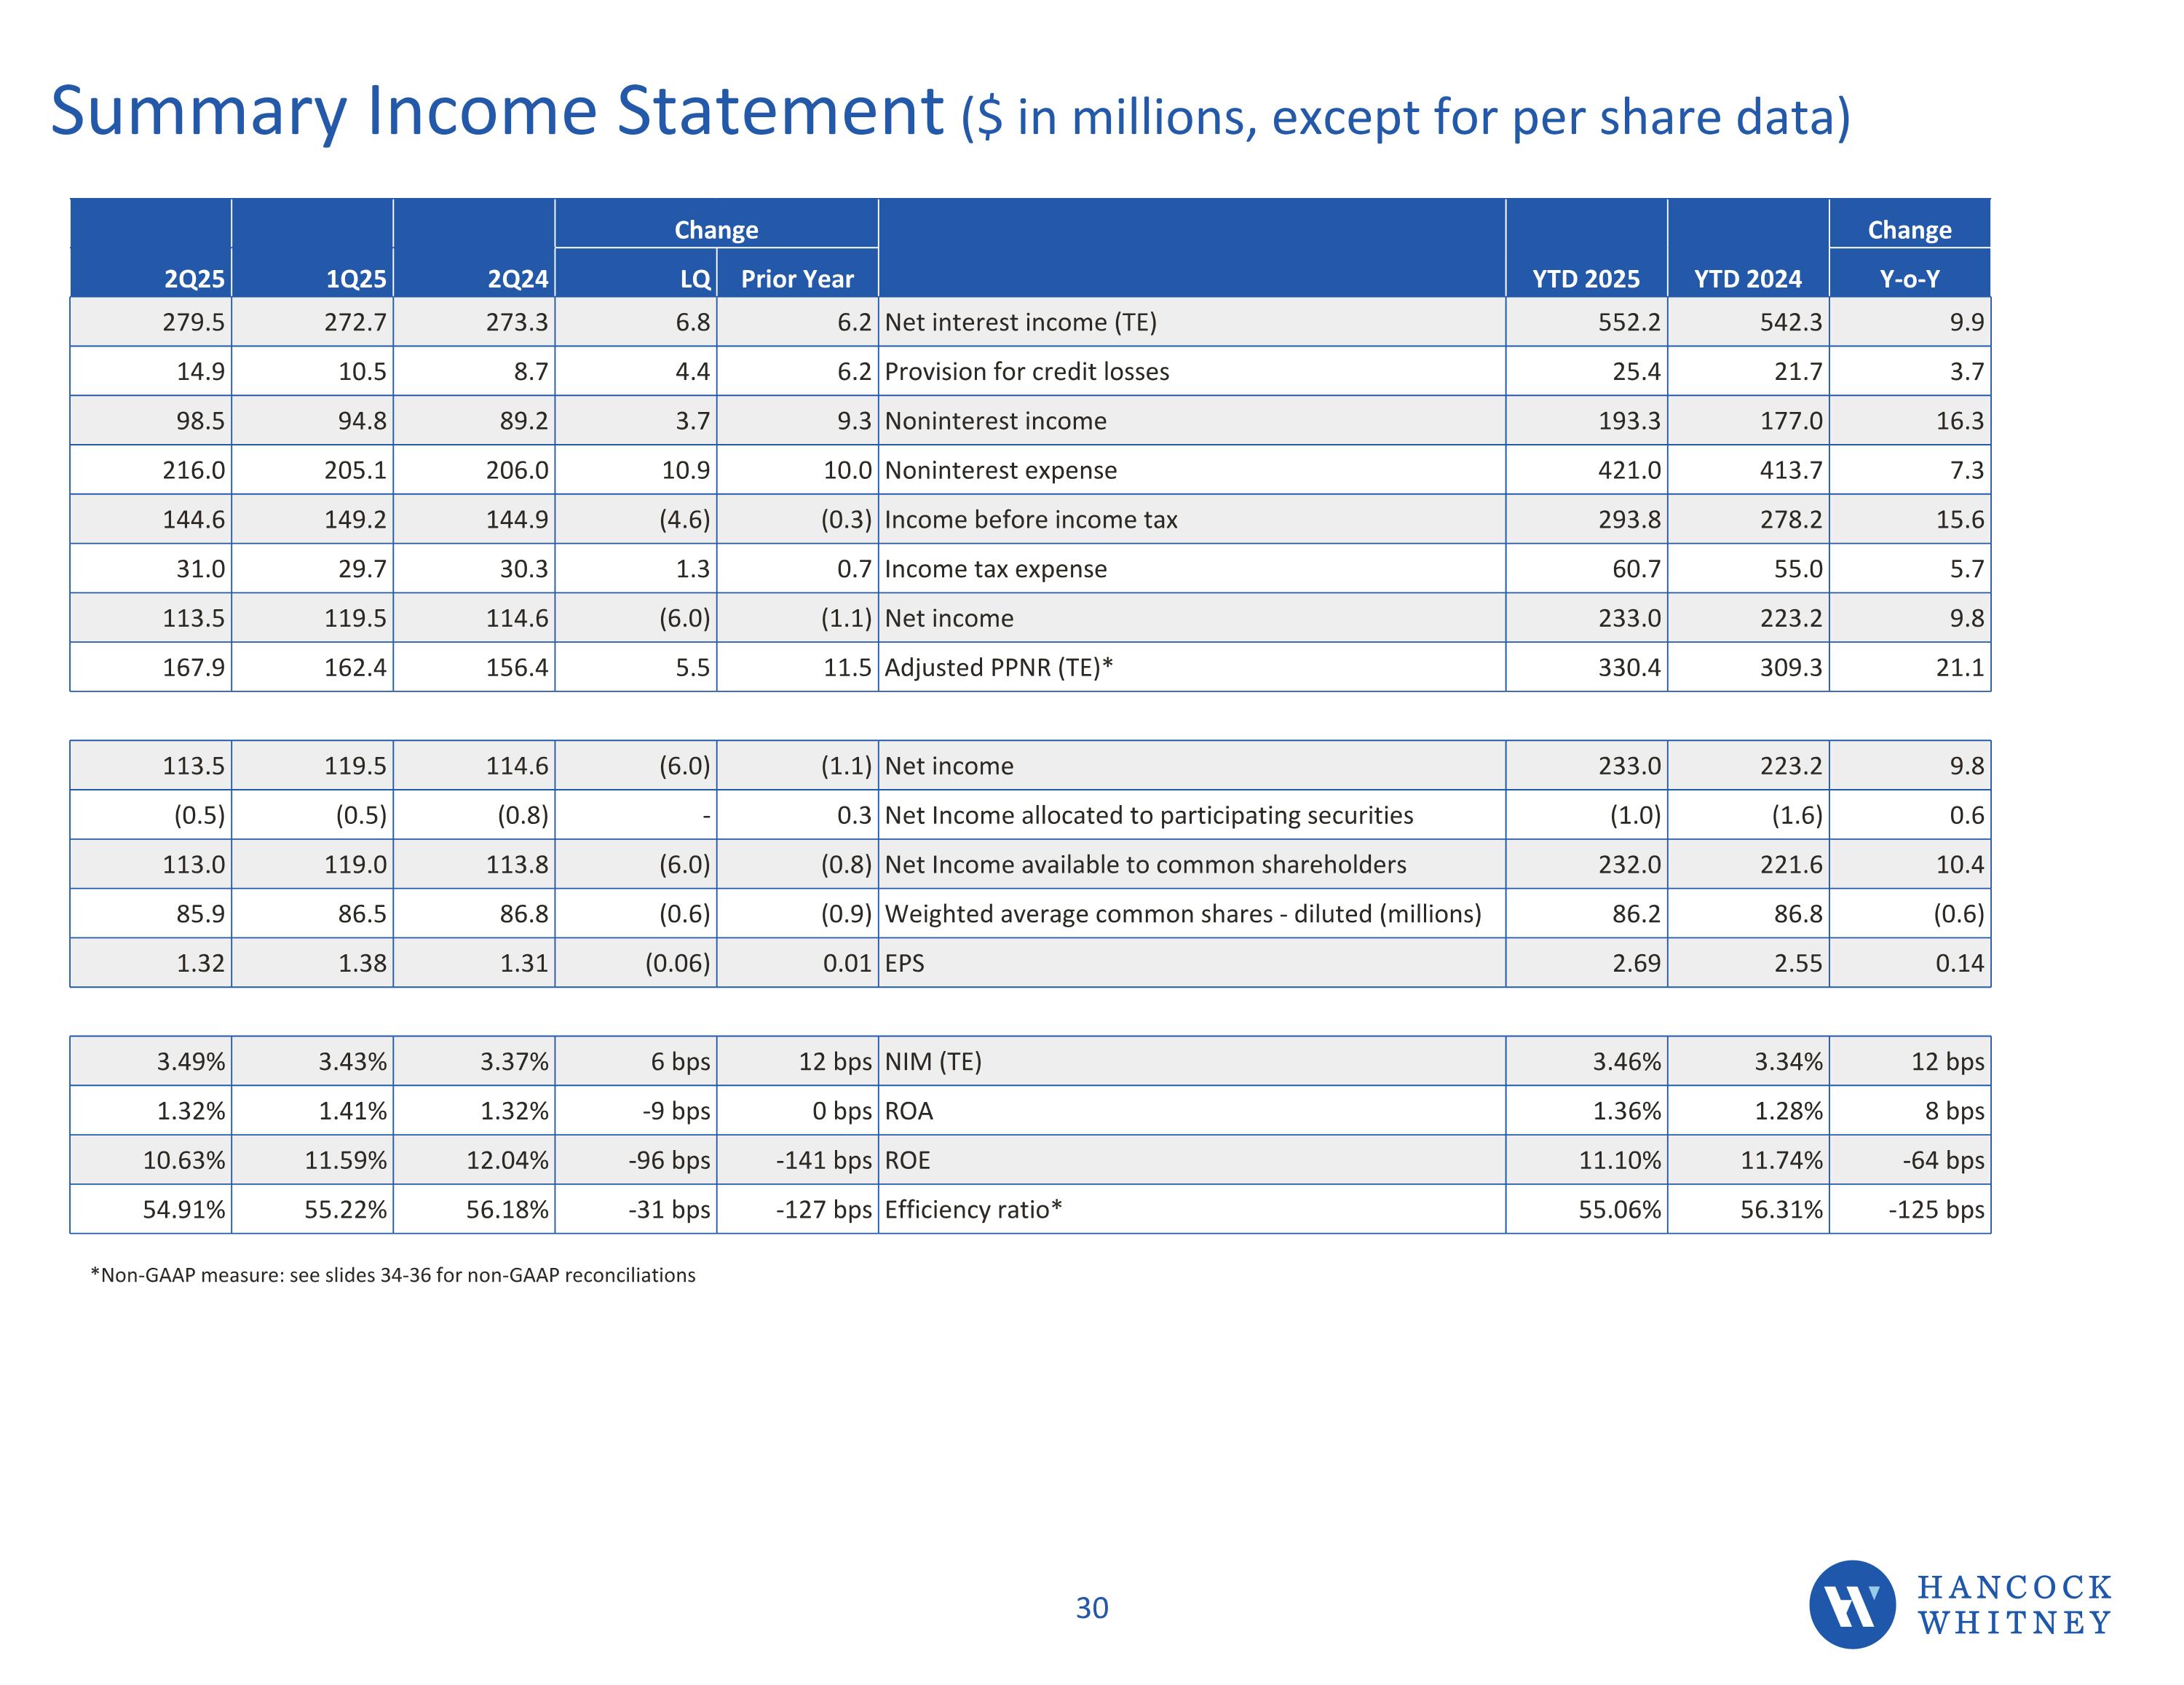
Summary Income Statement ($ in millions, except for per share data) *Non-GAAP measure: see slides 34-36 for non-GAAP reconciliations Change YTD 2025 YTD 2024 Change 2Q25 1Q25 2Q24 LQ Prior Year Y-o-Y 279.5 272.7 273.3 6.8 6.2 Net interest income (TE) 552.2 542.3 9.9 14.9 10.5 8.7 4.4 6.2 Provision for credit losses 25.4 21.7 3.7 98.5 94.8 89.2 3.7 9.3 Noninterest income 193.3 177.0 16.3 216.0 205.1 206.0 10.9 10.0 Noninterest expense 421.0 413.7 7.3 144.6 149.2 144.9 (4.6) (0.3) Income before income tax 293.8 278.2 15.6 31.0 29.7 30.3 1.3 0.7 Income tax expense 60.7 55.0 5.7 113.5 119.5 114.6 (6.0) (1.1) Net income 233.0 223.2 9.8 167.9 162.4 156.4 5.5 11.5 Adjusted PPNR (TE)* 330.4 309.3 21.1 113.5 119.5 114.6 (6.0) (1.1) Net income 233.0 223.2 9.8 (0.5) (0.5) (0.8) - 0.3 Net Income allocated to participating securities (1.0) (1.6) 0.6 113.0 119.0 113.8 (6.0) (0.8) Net Income available to common shareholders 232.0 221.6 10.4 85.9 86.5 86.8 (0.6) (0.9) Weighted average common shares - diluted (millions) 86.2 86.8 (0.6) 1.32 1.38 1.31 (0.06) 0.01 EPS 2.69 2.55 0.14 3.49% 3.43% 3.37% 6 bps 12 bps NIM (TE) 3.46% 3.34% 12 bps 1.32% 1.41% 1.32% -9 bps 0 bps ROA 1.36% 1.28% 8 bps 10.63% 11.59% 12.04% -96 bps -141 bps ROE 11.10% 11.74% -64 bps 54.91% 55.22% 56.18% -31 bps -127 bps Efficiency ratio* 55.06% 56.31% -125 bps
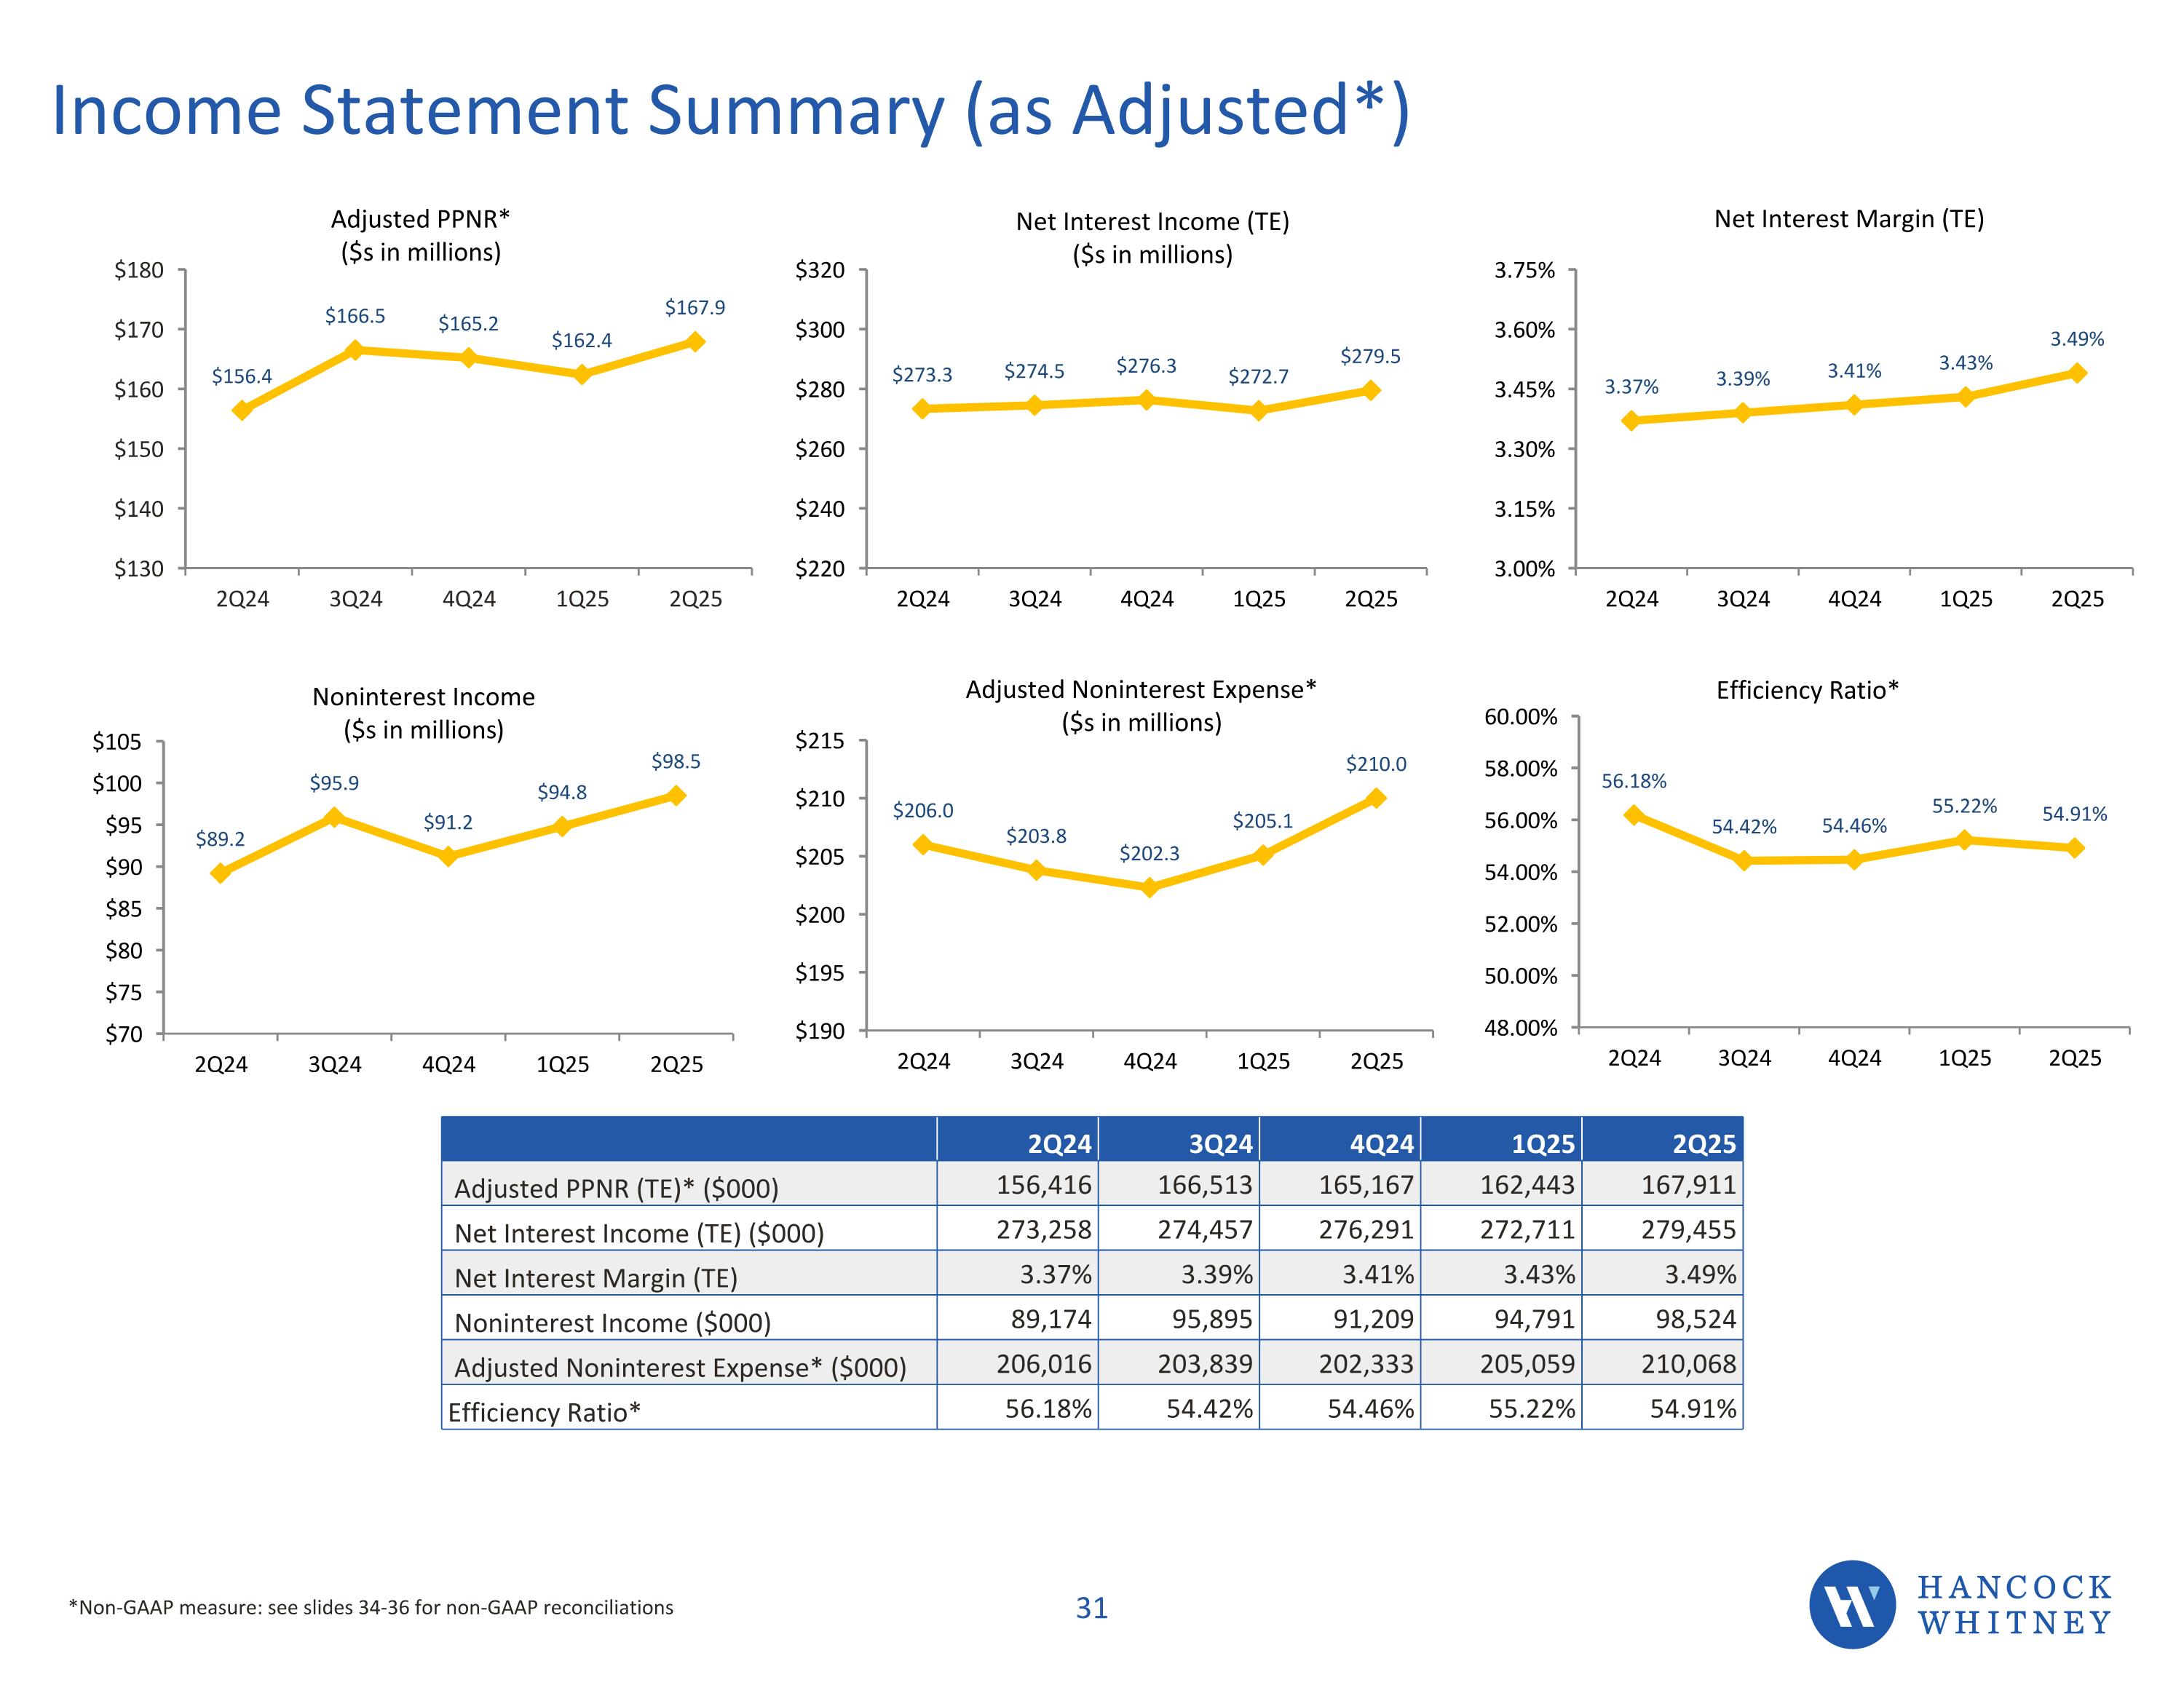
Income Statement Summary (as Adjusted*) *Non-GAAP measure: see slides 34-36 for non-GAAP reconciliations 2Q24 3Q24 4Q24 1Q25 2Q25 Adjusted PPNR (TE)* ($000) 156,416 166,513 165,167 162,443 167,911 Net Interest Income (TE) ($000) 273,258 274,457 276,291 272,711 279,455 Net Interest Margin (TE) 3.37% 3.39% 3.41% 3.43% 3.49% Noninterest Income ($000) 89,174 95,895 91,209 94,791 98,524 Adjusted Noninterest Expense* ($000) 206,016 203,839 202,333 205,059 210,068 Efficiency Ratio* 56.18% 54.42% 54.46% 55.22% 54.91% Results *Non-GAAP measures. See slides 29-31 for non-GAAP reconciliations 4Q19 1Q20 2Q20 3Q20 4Q20 Operating PPNR (TE)* ($000) 125,660 115,688 118,518 126,346 130,607 Net Interest Income (TE)* ($000) 236,736 234,636 241,114 238,372 241,401 Net Interest Margin (TE)* 3.43% 3.41% 3.23% 3.23% 3.22% Noninterest Income ($000) 82,924 84,387 73,943 83,748 82,350 Operating Expense* ($000) 194,000 203,335 196,539 195,774 193,144 Efficiency Ratio* 58.88% 62.06% 60.74% 59.29% 58.23% CHANCOCK WHITNEY 27
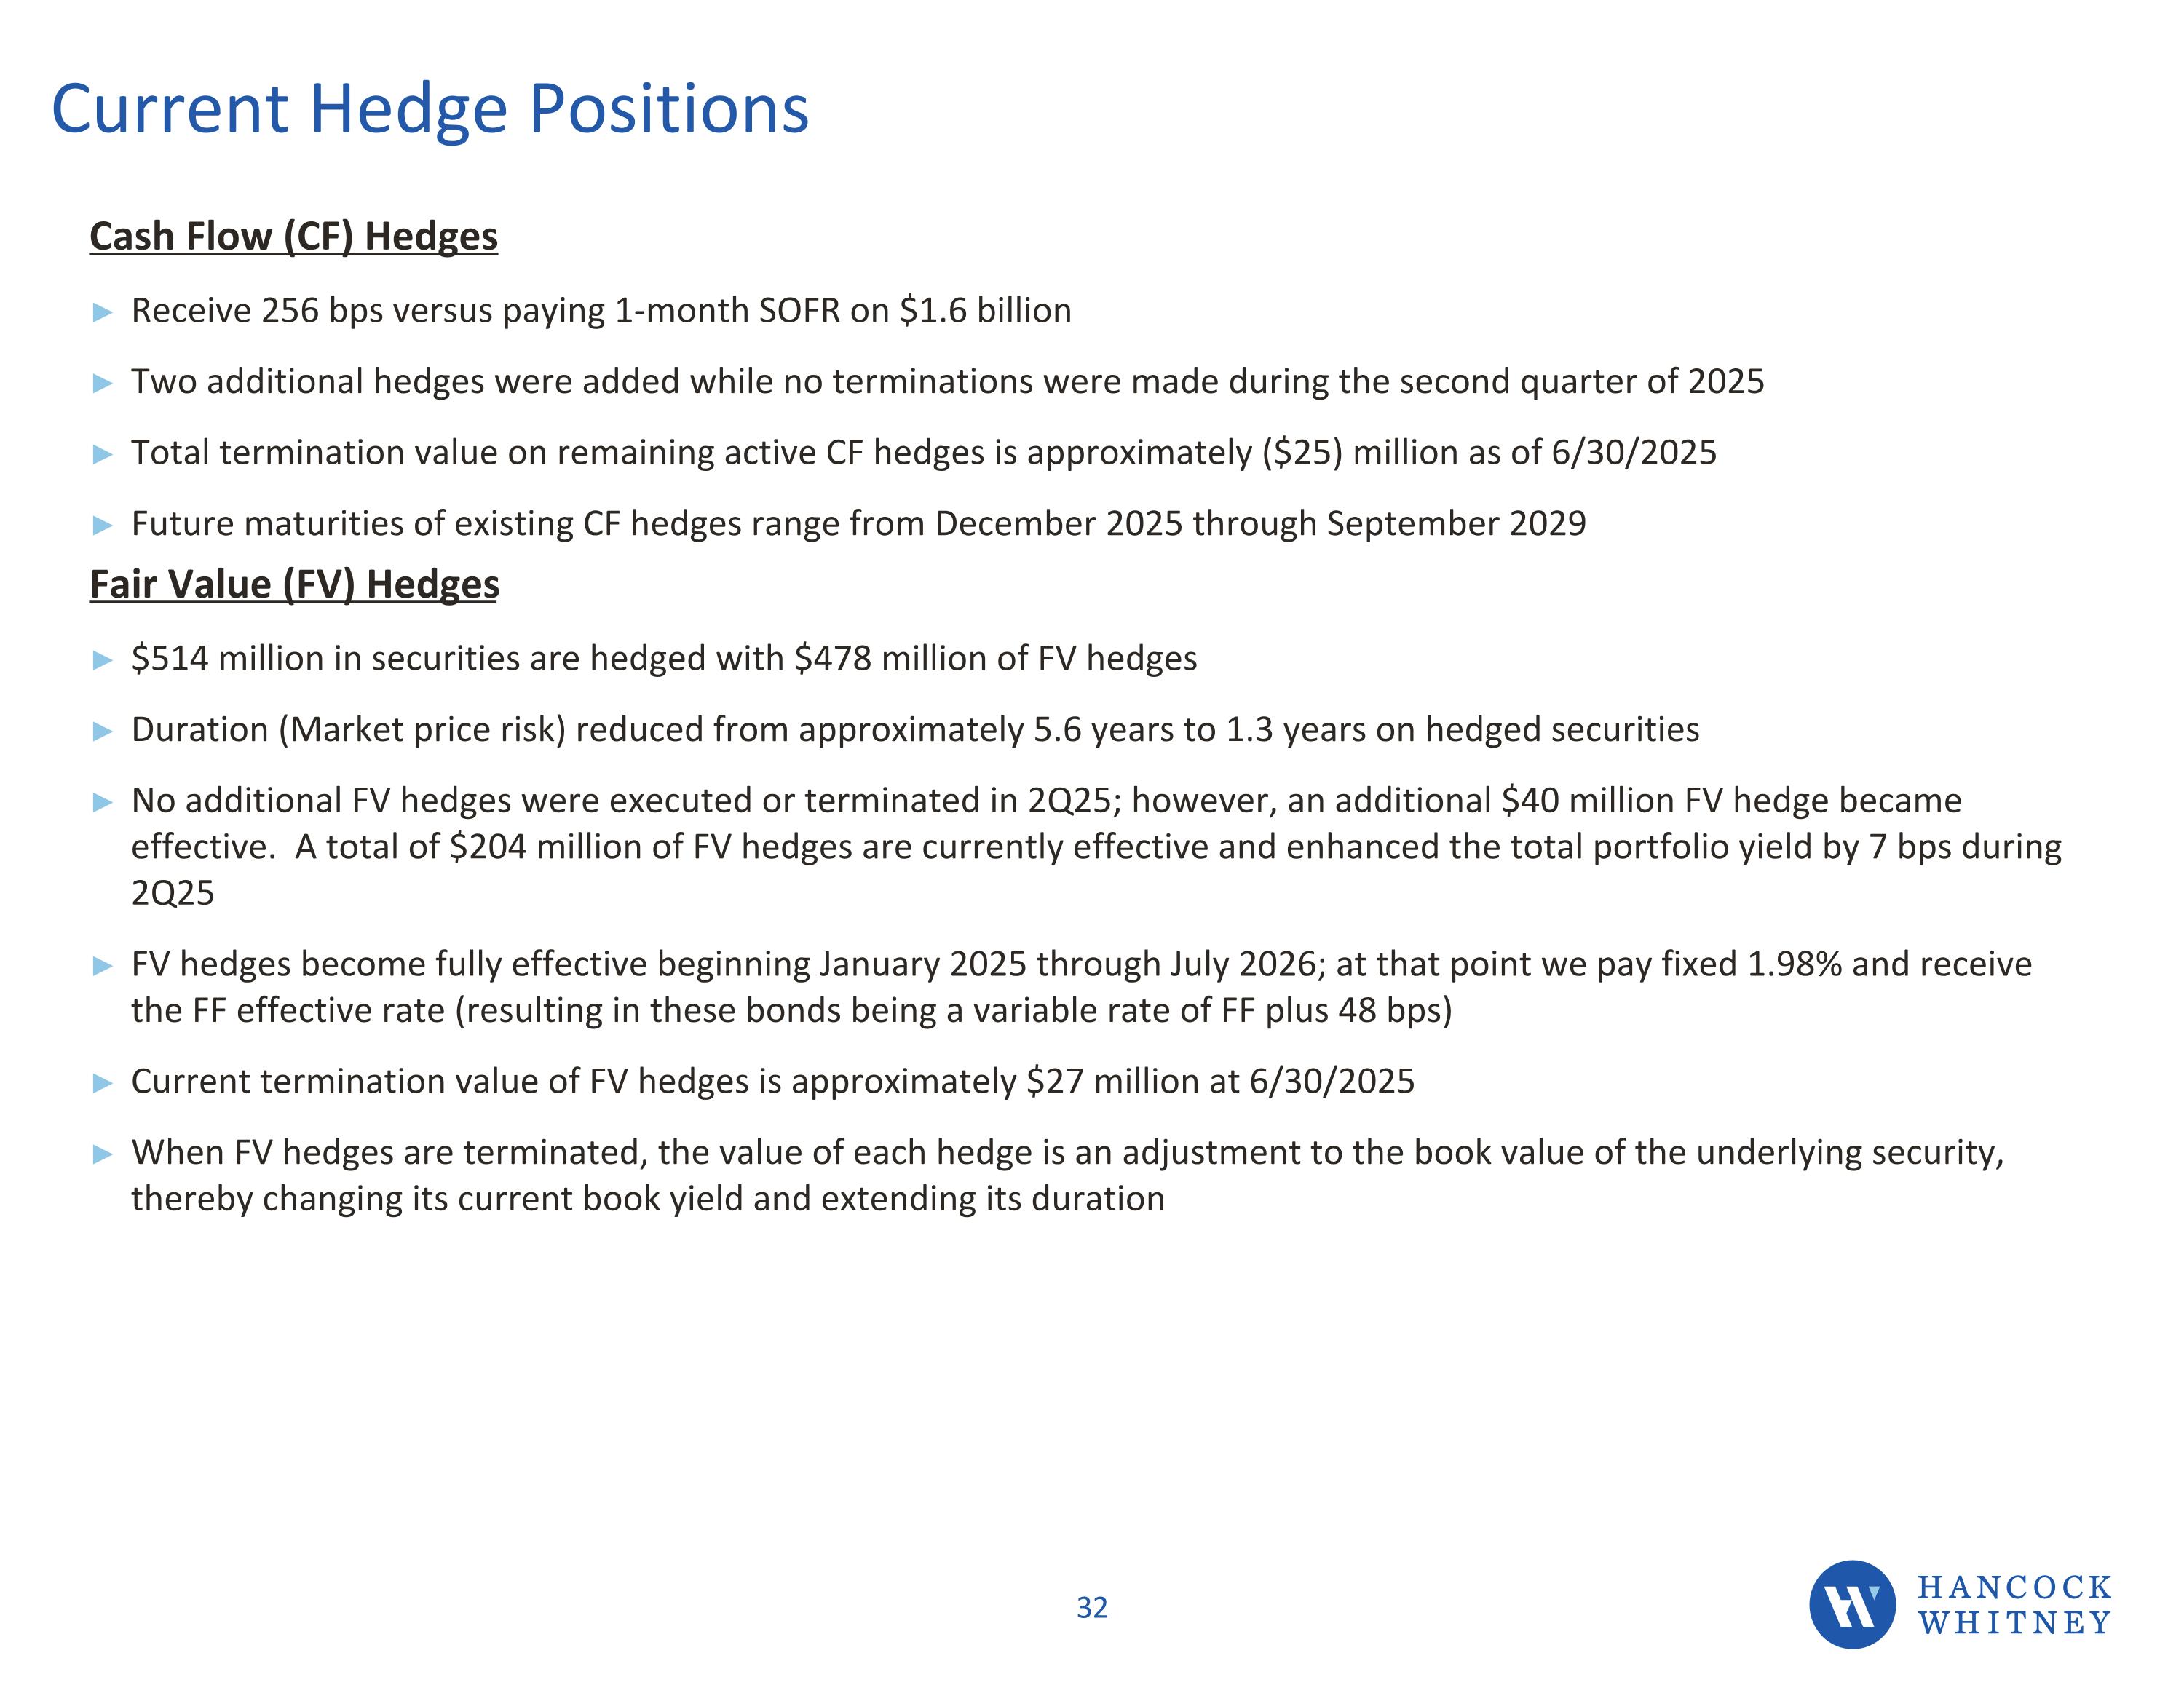
Current Hedge Positions Cash Flow (CF) Hedges Receive 256 bps versus paying 1-month SOFR on $1.6 billion Two additional hedges were added while no terminations were made during the second quarter of 2025 Total termination value on remaining active CF hedges is approximately ($25) million as of 6/30/2025 Future maturities of existing CF hedges range from December 2025 through September 2029 Fair Value (FV) Hedges $514 million in securities are hedged with $478 million of FV hedges Duration (Market price risk) reduced from approximately 5.6 years to 1.3 years on hedged securities No additional FV hedges were executed or terminated in 2Q25; however, an additional $40 million FV hedge became effective. A total of $204 million of FV hedges are currently effective and enhanced the total portfolio yield by 7 bps during 2Q25 FV hedges become fully effective beginning January 2025 through July 2026; at that point we pay fixed 1.98% and receive the FF effective rate (resulting in these bonds being a variable rate of FF plus 48 bps) Current termination value of FV hedges is approximately $27 million at 6/30/2025 When FV hedges are terminated, the value of each hedge is an adjustment to the book value of the underlying security, thereby changing its current book yield and extending its duration
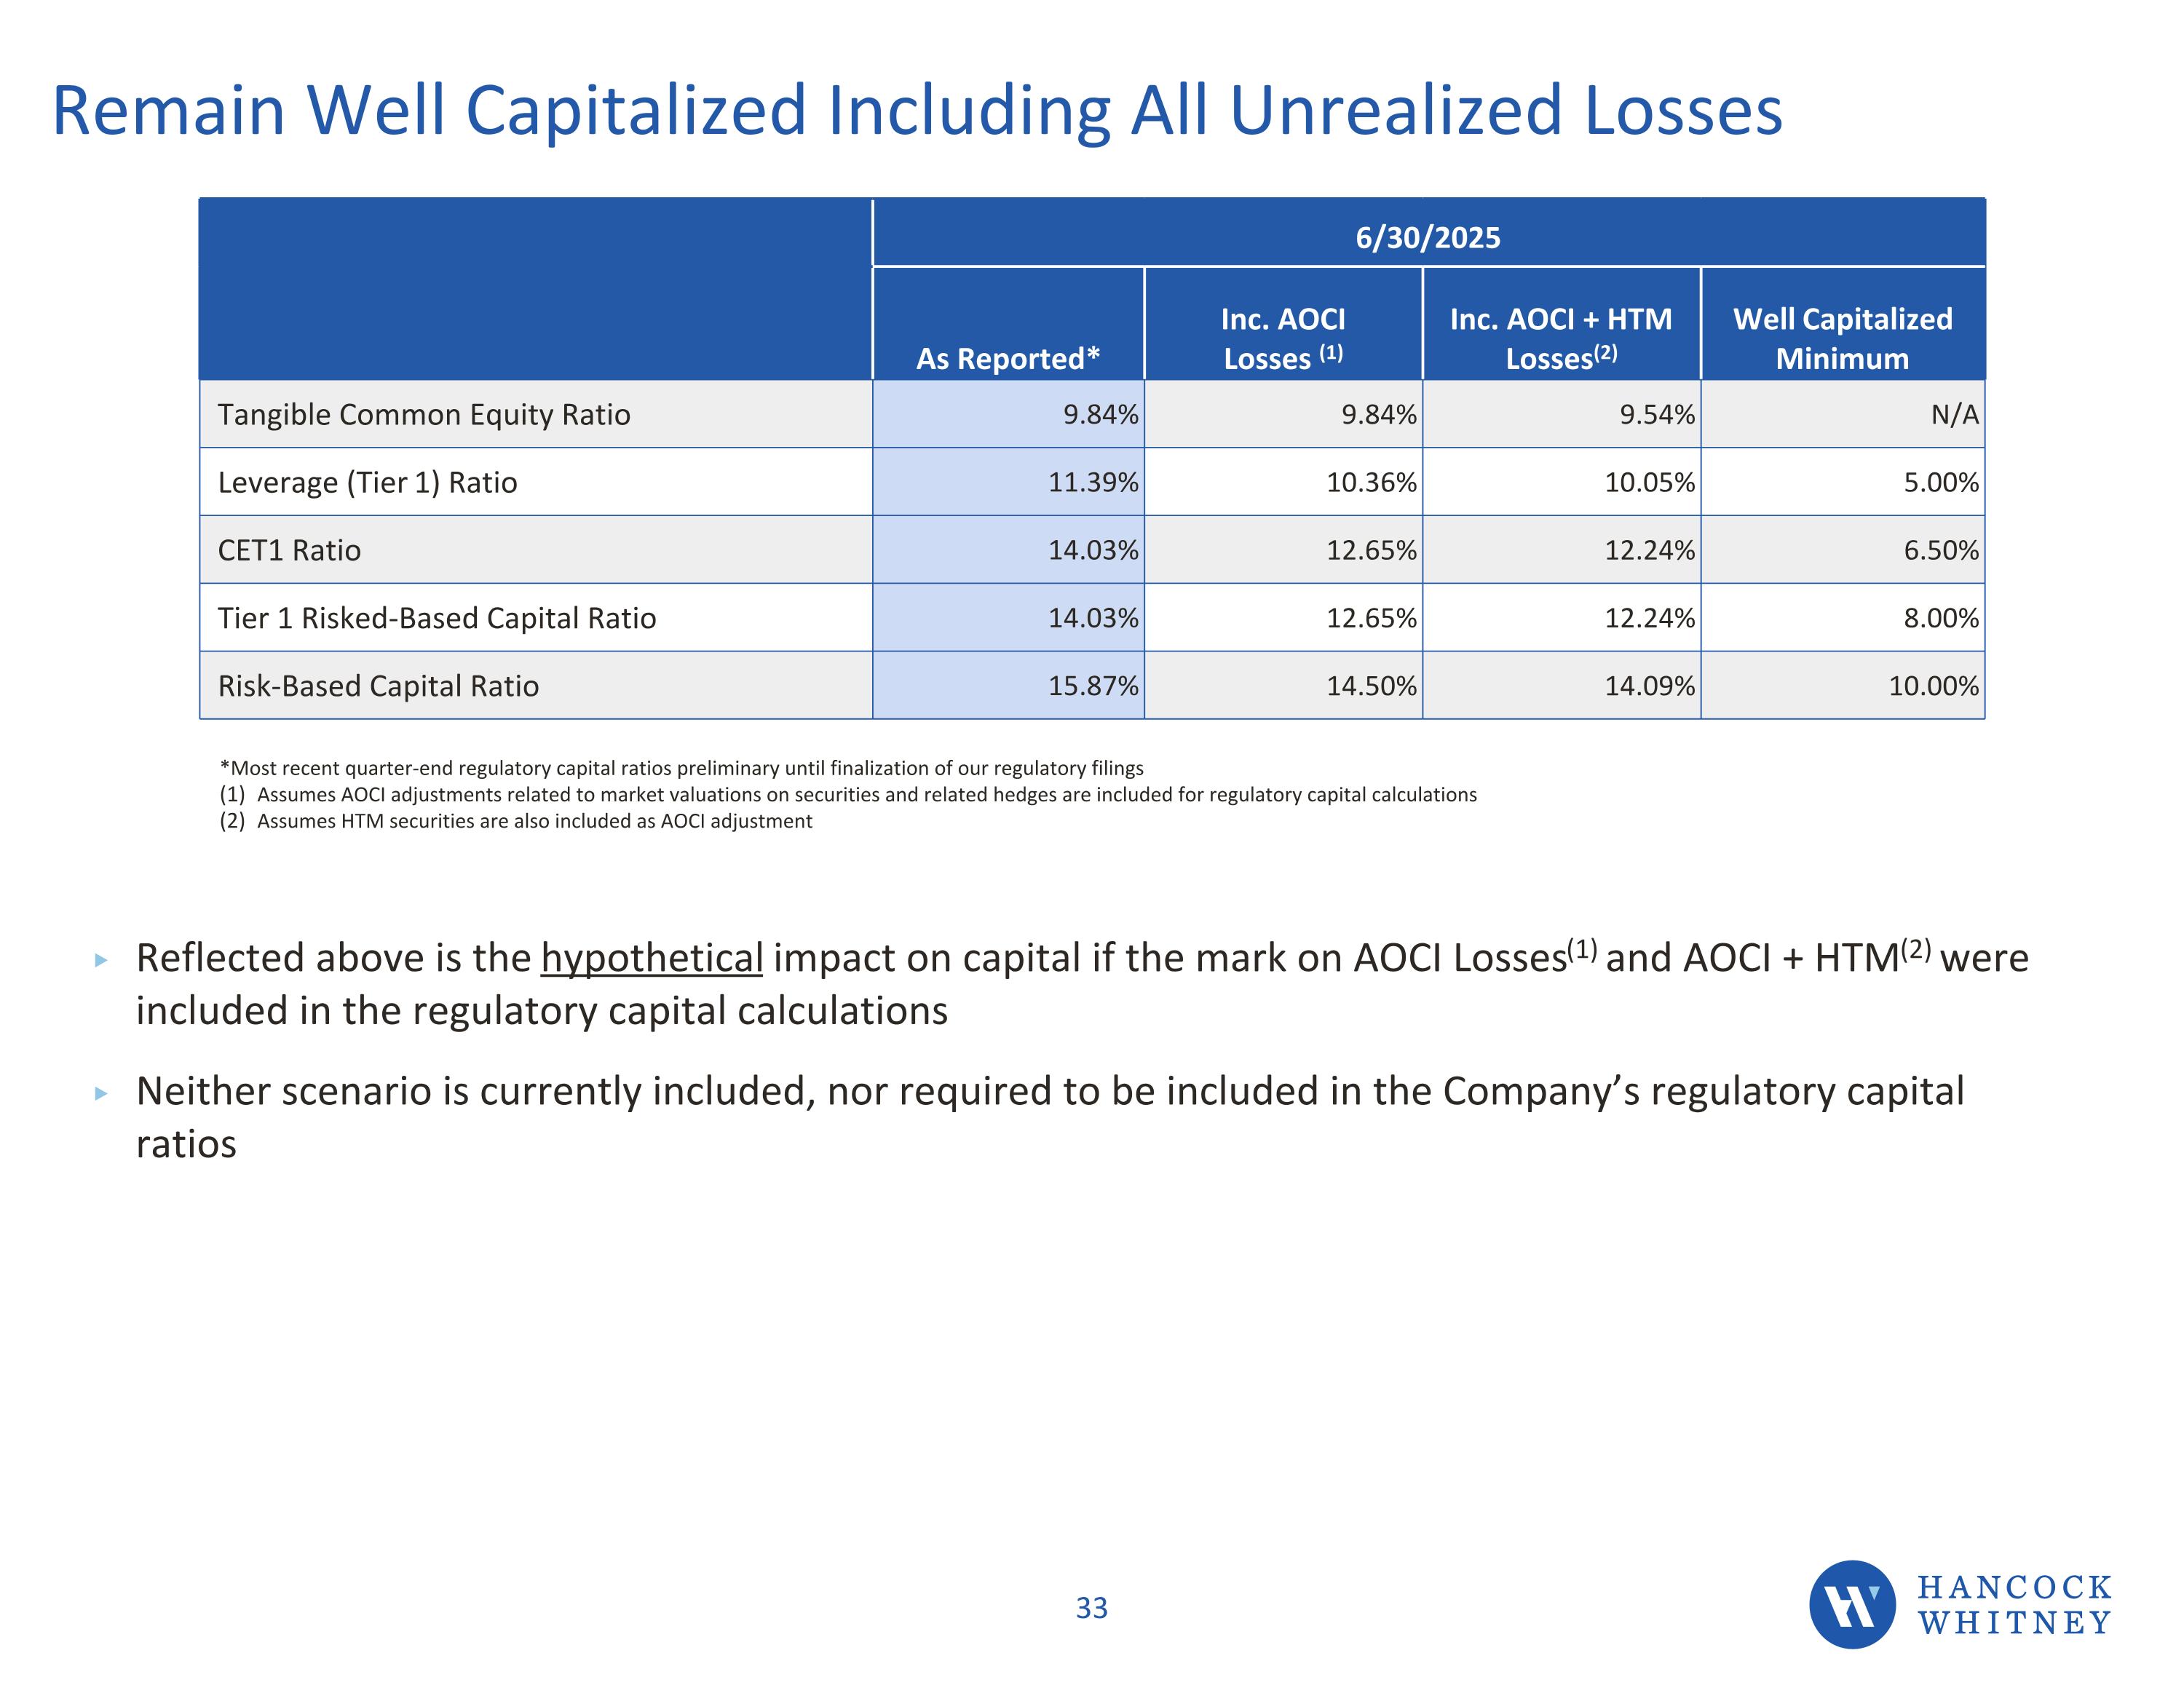
Remain Well Capitalized Including All Unrealized Losses 6/30/2025 As Reported* Inc. AOCI Losses (1) Inc. AOCI + HTM Losses(2) Well Capitalized Minimum Tangible Common Equity Ratio 9.84% 9.84% 9.54% N/A Leverage (Tier 1) Ratio 11.39% 10.36% 10.05% 5.00% CET1 Ratio 14.03% 12.65% 12.24% 6.50% Tier 1 Risked-Based Capital Ratio 14.03% 12.65% 12.24% 8.00% Risk-Based Capital Ratio 15.87% 14.50% 14.09% 10.00% Reflected above is the hypothetical impact on capital if the mark on AOCI Losses(1) and AOCI + HTM(2) were included in the regulatory capital calculations Neither scenario is currently included, nor required to be included in the Company’s regulatory capital ratios *Most recent quarter-end regulatory capital ratios preliminary until finalization of our regulatory filings Assumes AOCI adjustments related to market valuations on securities and related hedges are included for regulatory capital calculations Assumes HTM securities are also included as AOCI adjustment
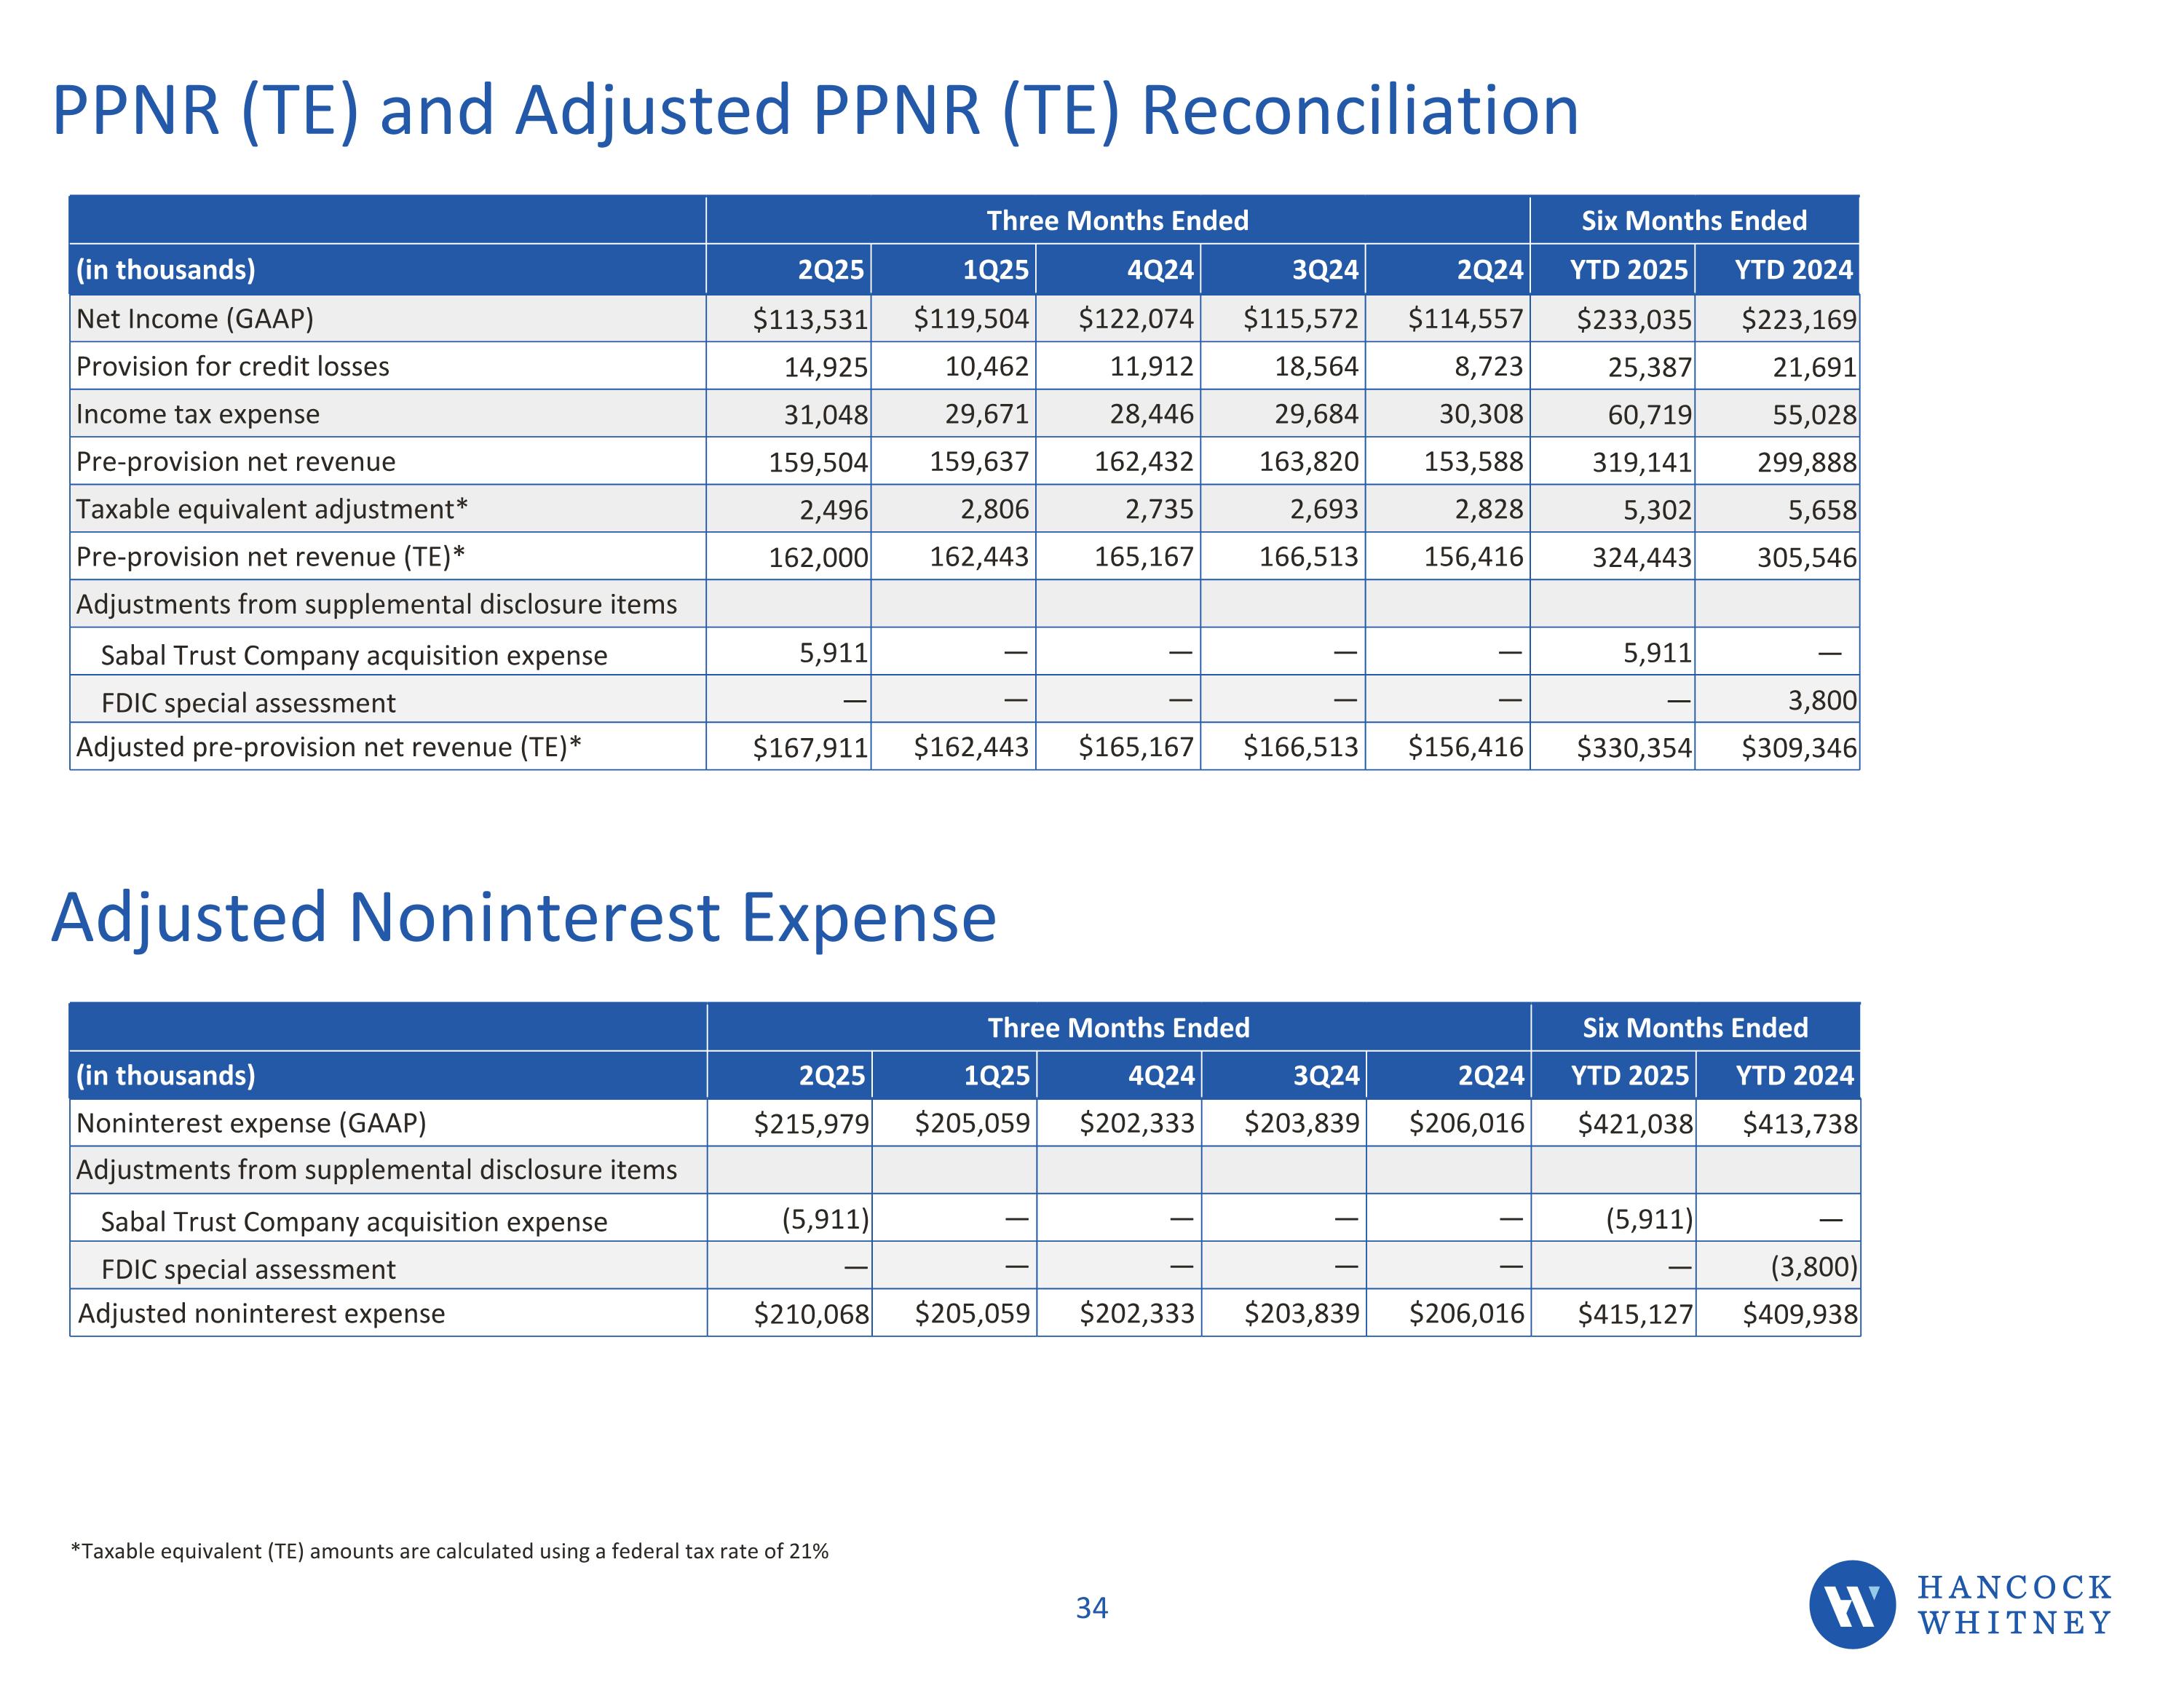
PPNR (TE) and Adjusted PPNR (TE) Reconciliation Three Months Ended Six Months Ended (in thousands) 2Q25 1Q25 4Q24 3Q24 2Q24 YTD 2025 YTD 2024 Net Income (GAAP) $113,531 $119,504 $122,074 $115,572 $114,557 $233,035 $223,169 Provision for credit losses 14,925 10,462 11,912 18,564 8,723 25,387 21,691 Income tax expense 31,048 29,671 28,446 29,684 30,308 60,719 55,028 Pre-provision net revenue 159,504 159,637 162,432 163,820 153,588 319,141 299,888 Taxable equivalent adjustment* 2,496 2,806 2,735 2,693 2,828 5,302 5,658 Pre-provision net revenue (TE)* 162,000 162,443 165,167 166,513 156,416 324,443 305,546 Adjustments from supplemental disclosure items Sabal Trust Company acquisition expense 5,911 — — — — 5,911 — FDIC special assessment — — — — — — 3,800 Adjusted pre-provision net revenue (TE)* $167,911 $162,443 $165,167 $166,513 $156,416 $330,354 $309,346 Total Revenue (TE), Operating PPNR (TE) Reconciliations Taxable equivalent (TE) amounts are calculated using a federal income tax rate of 21%. Three Months Ended (in thousands) 12/31/2020 9/30/2020 6/30/2020 3/31/2020 12/31/2019 Net interest income $238,286 $235,183 $237,866 $231,188 $233,156 Noninterest income 82,350 83,748 73,943 84,387 82,924 Total revenue $320,636 $318,931 $311,809 $315,575 $316,080 Taxable equivalent adjustment 3,115 3,189 3,248 3,448 3,580 Total revenue (TE) $323,751 $322,120 $315,057 $319,023 $319,660 Noninterest expense (193,144) (195,774) (196,539) (203,335) (197,856) Nonoperating expense — — — — 3,856 Operating pre-provision net revenue $130,607 $126,346 $118,518 $115,688 $125,660CHANCOCK WHITNEY 31 *Taxable equivalent (TE) amounts are calculated using a federal tax rate of 21% Adjusted Noninterest Expense Three Months Ended Six Months Ended (in thousands) 2Q25 1Q25 4Q24 3Q24 2Q24 YTD 2025 YTD 2024 Noninterest expense (GAAP) $215,979 $205,059 $202,333 $203,839 $206,016 $421,038 $413,738 Adjustments from supplemental disclosure items Sabal Trust Company acquisition expense (5,911) — — — — (5,911) — FDIC special assessment — — — — — — (3,800) Adjusted noninterest expense $210,068 $205,059 $202,333 $203,839 $206,016 $415,127 $409,938
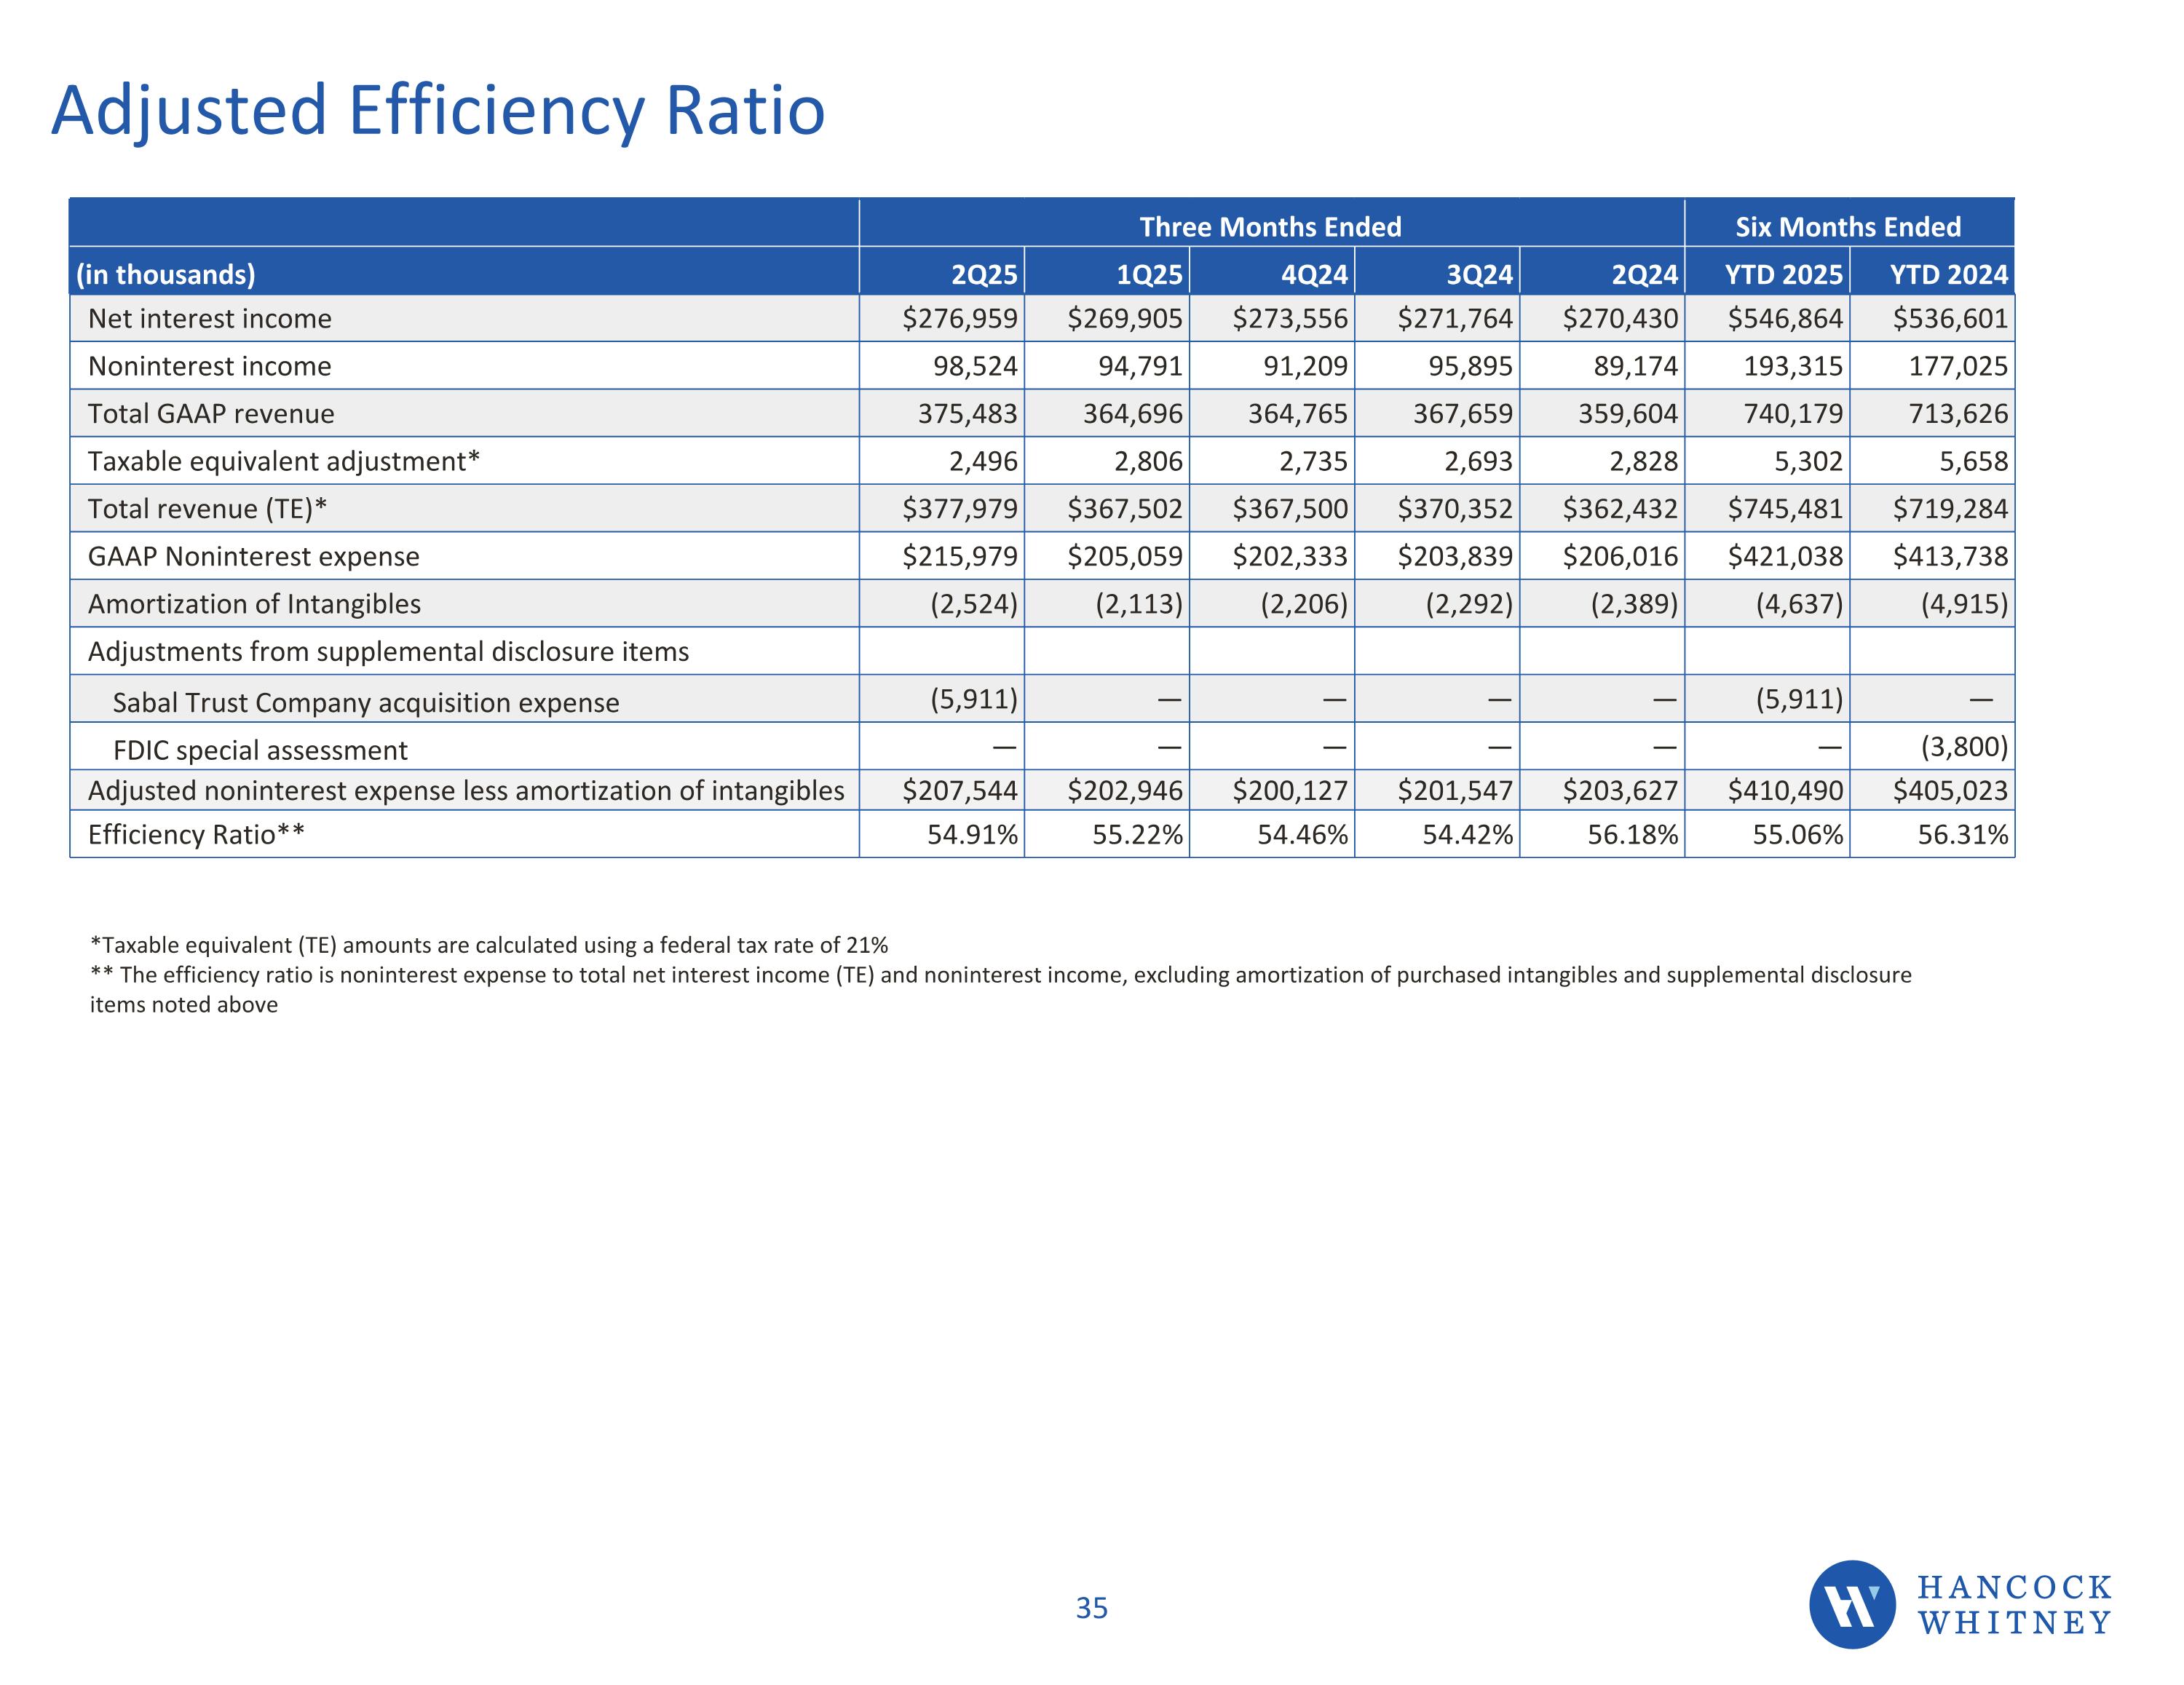
Adjusted Efficiency Ratio Three Months Ended Six Months Ended (in thousands) 2Q25 1Q25 4Q24 3Q24 2Q24 YTD 2025 YTD 2024 Net interest income $276,959 $269,905 $273,556 $271,764 $270,430 $546,864 $536,601 Noninterest income 98,524 94,791 91,209 95,895 89,174 193,315 177,025 Total GAAP revenue 375,483 364,696 364,765 367,659 359,604 740,179 713,626 Taxable equivalent adjustment* 2,496 2,806 2,735 2,693 2,828 5,302 5,658 Total revenue (TE)* $377,979 $367,502 $367,500 $370,352 $362,432 $745,481 $719,284 GAAP Noninterest expense $215,979 $205,059 $202,333 $203,839 $206,016 $421,038 $413,738 Amortization of Intangibles (2,524) (2,113) (2,206) (2,292) (2,389) (4,637) (4,915) Adjustments from supplemental disclosure items Sabal Trust Company acquisition expense (5,911) — — — — (5,911) — FDIC special assessment — — — — — — (3,800) Adjusted noninterest expense less amortization of intangibles $207,544 $202,946 $200,127 $201,547 $203,627 $410,490 $405,023 Efficiency Ratio** 54.91% 55.22% 54.46% 54.42% 56.18% 55.06% 56.31% *Taxable equivalent (TE) amounts are calculated using a federal tax rate of 21% ** The efficiency ratio is noninterest expense to total net interest income (TE) and noninterest income, excluding amortization of purchased intangibles and supplemental disclosure items noted above
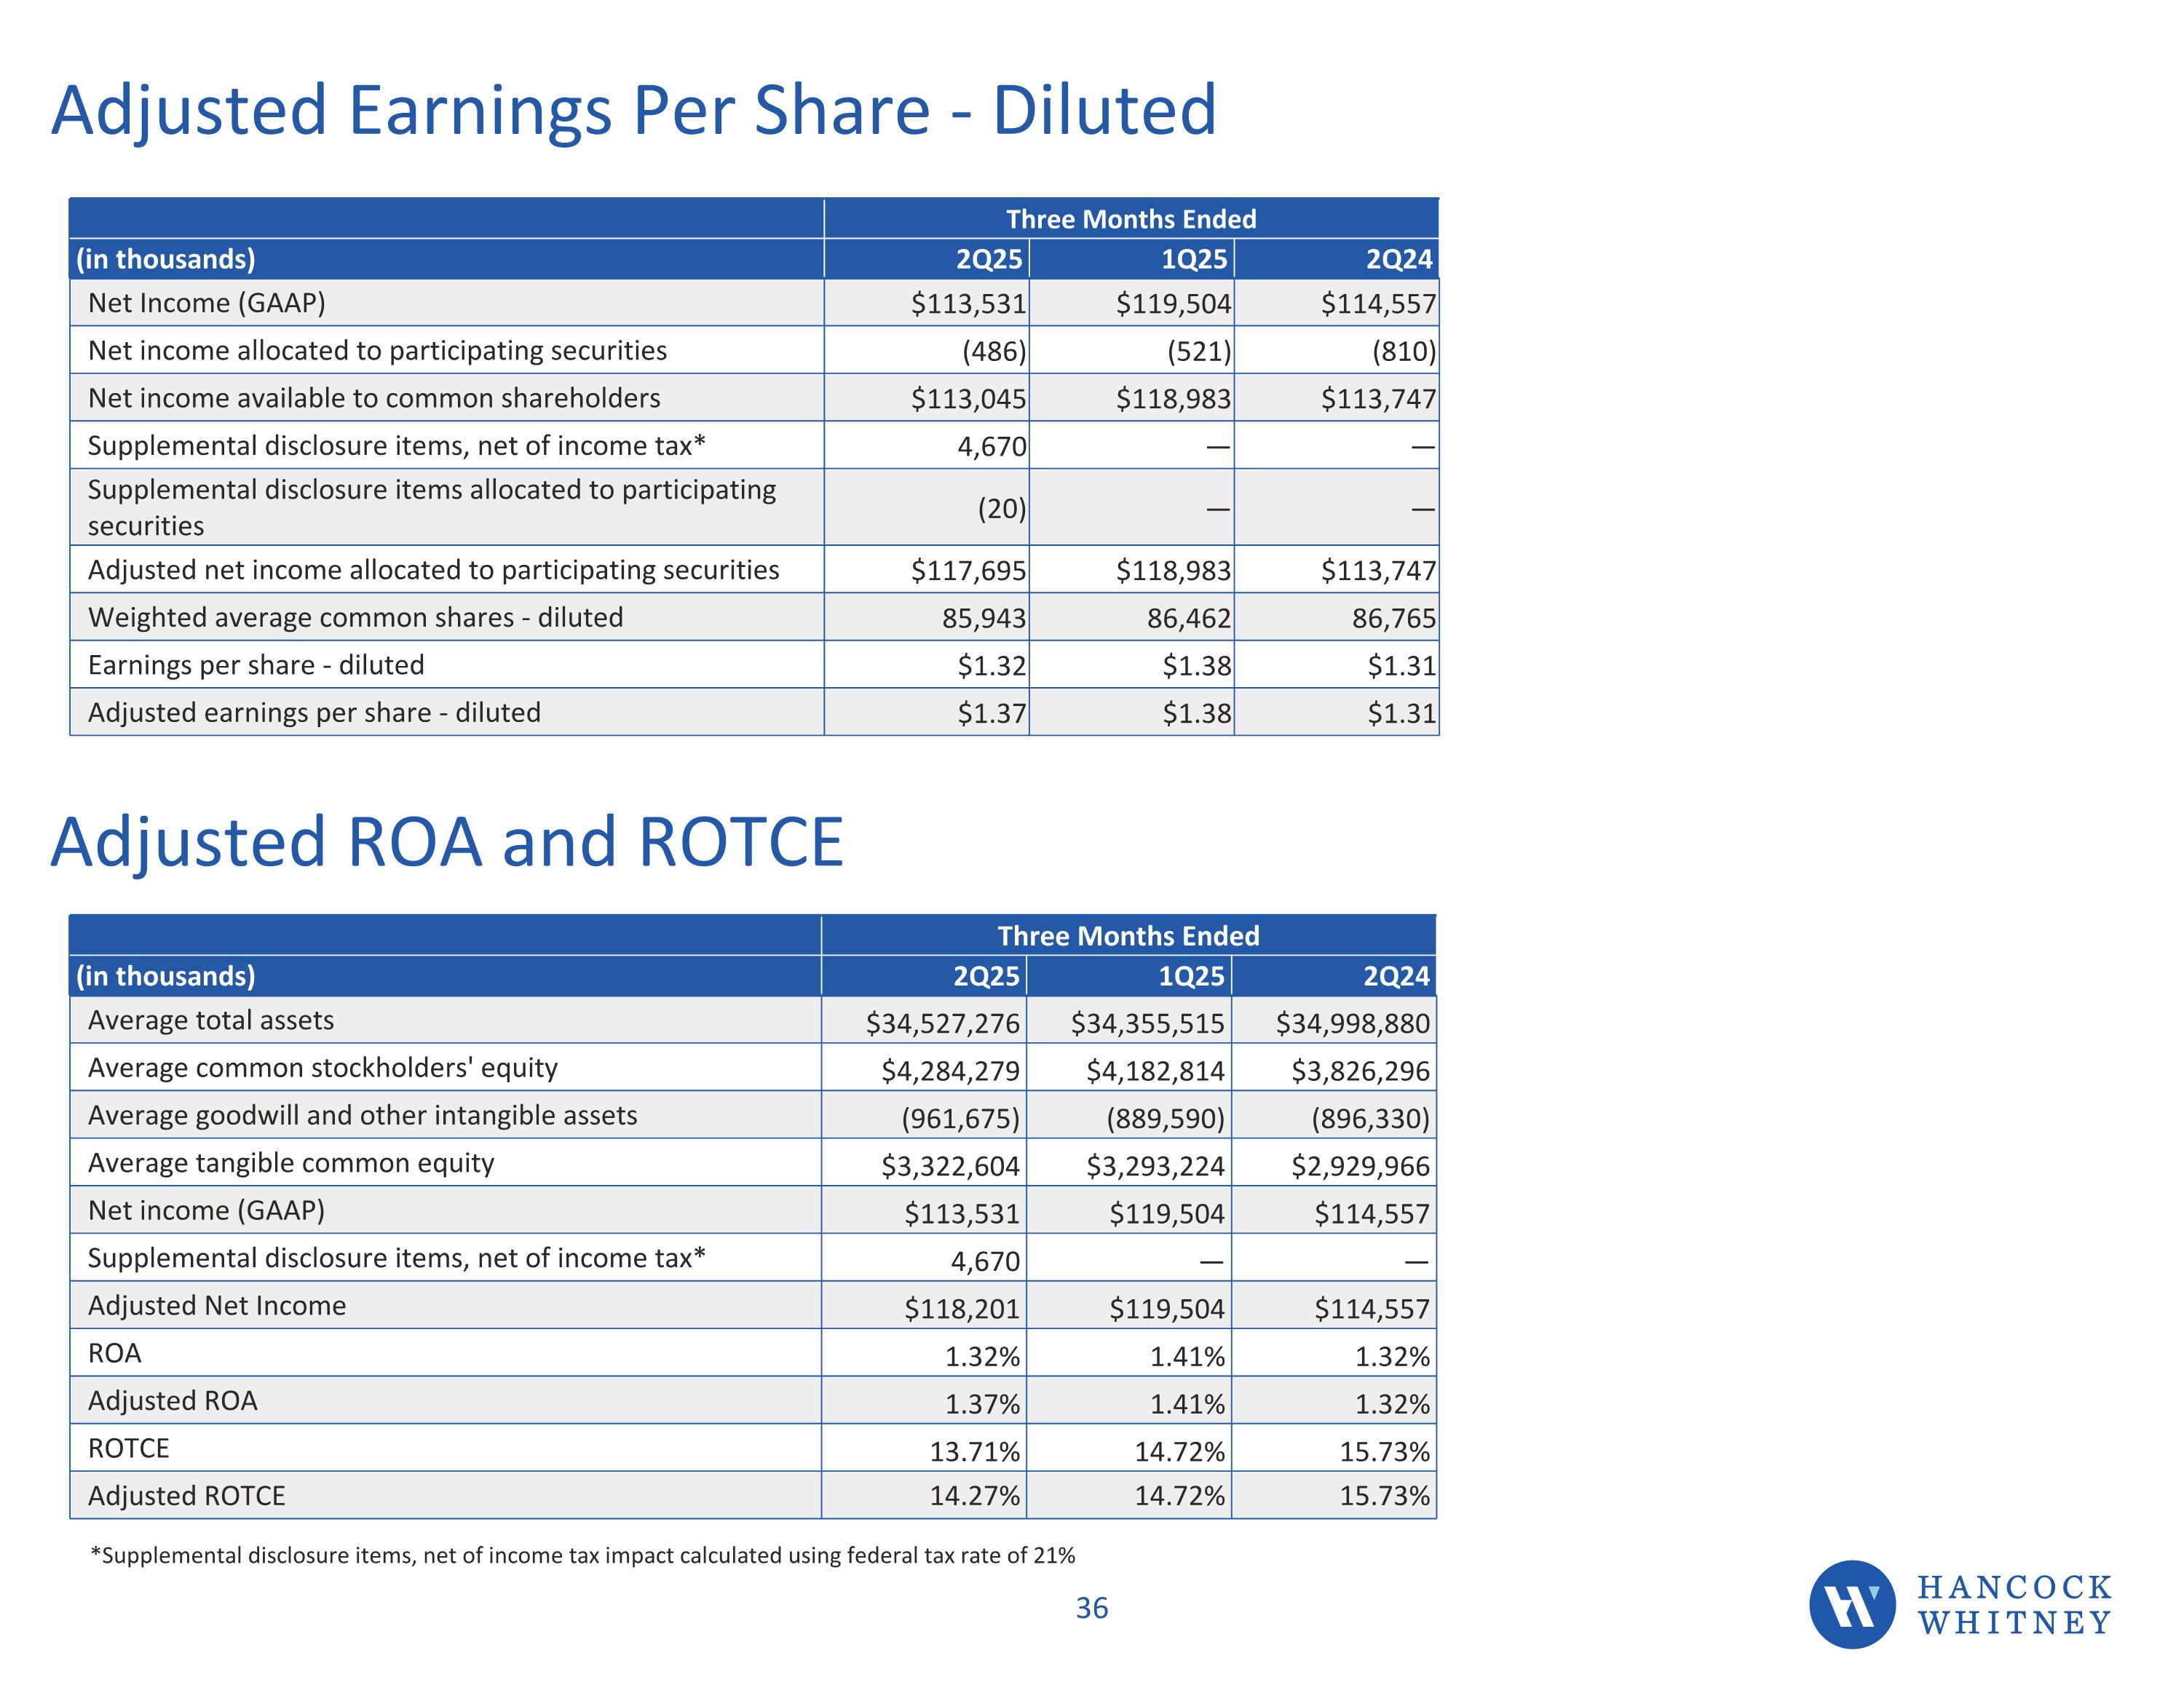
*Supplemental disclosure items, net of income tax impact calculated using federal tax rate of 21% Adjusted ROA and ROTCE Three Months Ended (in thousands) 2Q25 1Q25 2Q24 Average total assets $34,527,276 $34,355,515 $34,998,880 Average common stockholders' equity $4,284,279 $4,182,814 $3,826,296 Average goodwill and other intangible assets (961,675) (889,590) (896,330) Average tangible common equity $3,322,604 $3,293,224 $2,929,966 Net income (GAAP) $113,531 $119,504 $114,557 Supplemental disclosure items, net of income tax* 4,670 — — Adjusted Net Income $118,201 $119,504 $114,557 ROA 1.32% 1.41% 1.32% Adjusted ROA 1.37% 1.41% 1.32% ROTCE 13.71% 14.72% 15.73% Adjusted ROTCE 14.27% 14.72% 15.73% Adjusted Earnings Per Share - Diluted Three Months Ended (in thousands) 2Q25 1Q25 2Q24 Net Income (GAAP) $113,531 $119,504 $114,557 Net income allocated to participating securities (486) (521) (810) Net income available to common shareholders $113,045 $118,983 $113,747 Supplemental disclosure items, net of income tax* 4,670 — — Supplemental disclosure items allocated to participating securities (20) — — Adjusted net income allocated to participating securities $117,695 $118,983 $113,747 Weighted average common shares - diluted 85,943 86,462 86,765 Earnings per share - diluted $1.32 $1.38 $1.31 Adjusted earnings per share - diluted $1.37 $1.38 $1.31
Second Quarter 2025 Earnings Conference Call 7/15/2025 HANCOCK WHITNEY