PARTNERING WITH VERITEX TO ACCELERATE TEXAS GROWTH July 14, 2025
Disclaimer 2 CAUTION REGARDING FORWARD-LOOKING STATEMENTS The information
contained or incorporated by reference in this presentation contains certain forward-looking statements, including, but not limited to, certain plans, expectations, goals, projections, and statements about the benefits of the proposed
transaction, the plans, objectives, expectations and intentions of Huntington Bancshares Incorporated (“Huntington”) and Veritex Holdings, Inc. (“Veritex”), the expected timing of completion of the transaction, and other statements that are not
historical facts and are subject to numerous assumptions, risks, and uncertainties that are beyond the control of Huntington and Veritex. Such statements are subject to numerous assumptions, risks, estimates, uncertainties and other important
factors that change over time and could cause actual results to differ materially from any results, performance, or events expressed or implied by such forward-looking statements, including as a result of the factors referenced below.
Statements that do not describe historical or current facts, including statements about beliefs and expectations, are forward-looking statements. Forward-looking statements may be identified by words such as expect, anticipate, continue,
believe, intend, estimate, plan, trend, objective, target, goal, or similar expressions, or future or conditional verbs such as will, may, might, should, would, could, or similar variations. The forward-looking statements are intended to be
subject to the safe harbor provided by Section 27A of the Securities Act of 1933, Section 21E of the Securities Exchange Act of 1934, and the Private Securities Litigation Reform Act of 1995. Huntington and Veritex caution that the
forward-looking statements in this communication are not guarantees of future performance and involve a number of known and unknown risks, uncertainties and assumptions that are difficult to assess and are subject to change based on factors
which are, in many instances, beyond Huntington’s and Veritex’s control. While there is no assurance that any list of risks and uncertainties or risk factors is complete, below are certain factors which could cause actual results to differ
materially from those contained or implied in the forward-looking statements or historical performance: changes in general economic, political, or industry conditions; deterioration in business and economic conditions, including persistent
inflation, supply chain issues or labor shortages, instability in global economic conditions and geopolitical matters, as well as volatility in financial markets; changes in U.S. trade policies, including the imposition of tariffs and
retaliatory tariffs; the impact of pandemics and other catastrophic events or disasters on the global economy and financial market conditions and our business, results of operations, and financial condition; the impacts related to or resulting
from bank failures and other volatility, including potential increased regulatory requirements and costs, such as FDIC special assessments, long-term debt requirements and heightened capital requirements, and potential impacts to macroeconomic
conditions, which could affect the ability of depository institutions, including us, to attract and retain depositors and to borrow or raise capital; unexpected outflows of uninsured deposits which may require us to sell investment securities
at a loss; changing interest rates which could negatively impact the value of our portfolio of investment securities; the loss of value of our investment portfolio which could negatively impact market perceptions of us and could lead to deposit
withdrawals; the effects of social media on market perceptions of us and banks generally; cybersecurity risks; uncertainty in U.S. fiscal and monetary policy, including the interest rate policies of the Federal Reserve; volatility and
disruptions in global capital, foreign exchange and credit markets; movements in interest rates; competitive pressures on product pricing and services; success, impact, and timing of our business strategies, including market acceptance of any
new products or services including those implementing our “Fair Play” banking philosophy; changes in policies and standards for regulatory review of bank mergers; the nature, extent, timing, and results of governmental actions, examinations,
reviews, reforms, regulations, and interpretations, including those related to the Dodd-Frank Wall Street Reform and Consumer Protection Act and the Basel III regulatory capital reforms, as well as those involving the SEC, OCC, Federal Reserve,
FDIC, CFPB and state-level regulators; the occurrence of any event, change or other circumstances that could give rise to the right of one or both of the parties to terminate the merger agreement between Huntington and Veritex; the outcome of
any legal proceedings that may be instituted against Huntington or Veritex; delays in completing the transaction; the failure to obtain necessary regulatory approvals (and the risk that such approvals may result in the imposition of conditions
that could adversely affect the combined company or the expected benefits of the transaction); the failure to obtain Veritex shareholder approval or to satisfy any of the other conditions to the transaction on a timely basis or at all; the
possibility that the anticipated benefits of the transaction are not realized when expected or at all, including as a result of the impact of, or problems arising from, the integration of the two companies or as a result of the strength of the
economy and competitive factors in the areas where Huntington and Veritex do business; the possibility that the transaction may be more expensive to complete than anticipated, including as a result of unexpected factors or events; diversion of
management’s attention from ongoing business operations and opportunities; potential adverse reactions or changes to business, customer or employee relationships, including those resulting from the announcement or completion of the transaction;
the ability to complete the transaction and integration of Huntington and Veritex successfully; the dilution caused by Huntington’s issuance of additional shares of its capital stock in connection with the transaction; and other factors that
may affect the future results of Huntington and Veritex. Additional factors that could cause results to differ materially from those described above can be found in Huntington’s Annual Report on Form 10-K for the year ended December 31, 2024
and in its subsequent Quarterly Reports on Form 10-Q, including for the quarter ended March 31, 2025, each of which is on file with the Securities and Exchange Commission (the “SEC”) and available in the “Investor Relations” section of
Huntington’s website, http://www.huntington.com, under the heading “Investor Relations” and in other documents Huntington files with the SEC, and in Veritex’s Annual Report on Form 10-K for the year ended December 31, 2024 and in its subsequent
Quarterly Reports on Form 10-Q, including for the quarter ended March 31, 2025, each of which is on file with the SEC and available on Veritex’s investor relations website, ir.veritexbank.com, under the heading “Financials” and in other
documents Veritex files with the SEC. All forward-looking statements are expressly qualified in their entirety by the cautionary statements set forth above. Forward-looking statements speak only as of the date they are made and are based on
information available at that time. Neither Huntington nor Veritex assume any obligation to update forward-looking statements to reflect actual results, new information or future events, changes in assumptions or changes in circumstances or
other factors affecting forward- looking statements that occur after the date the forward-looking statements were made or to reflect the occurrence of unanticipated events except as required by federal securities laws. If Huntington or Veritex
update one or more forward- looking statements, no inference should be drawn that Huntington or Veritex will make additional updates with respect to those or other forward-looking statements. As forward-looking statements involve significant
risks and uncertainties, caution should be exercised against placing undue reliance on such statements.
Disclaimer Cont. 2 IMPORTANT ADDITIONAL INFORMATION In connection with the
proposed transaction, Huntington will file with the SEC a Registration Statement on Form S-4 that will include a Proxy Statement of Veritex and a Prospectus of Huntington, as well as other relevant documents concerning the proposed transaction.
The proposed transaction involving Huntington and Veritex will be submitted to Veritex’s shareholders for their consideration. This communication does not constitute an offer to sell or the solicitation of an offer to buy any securities or a
solicitation of any vote or approval, nor shall there be any sale of securities in any jurisdiction in which such offer, solicitation or sale would be unlawful prior to registration or qualification under the securities laws of any such
jurisdiction. INVESTORS AND SHAREHOLDERS OF VERITEX ARE URGED TO READ THE REGISTRATION STATEMENT AND THE PROXY STATEMENT/PROSPECTUS REGARDING THE TRANSACTION WHEN IT BECOMES AVAILABLE AND ANY OTHER RELEVANT DOCUMENTS FILED WITH THE SEC, AS WELL
AS ANY AMENDMENTS OR SUPPLEMENTS TO THOSE DOCUMENTS, BECAUSE THEY WILL CONTAIN IMPORTANT INFORMATION. Shareholders will be able to obtain a free copy of the definitive proxy statement/prospectus, as well as other filings containing information
about Huntington and Veritex, without charge, at the SEC’s website (http://www.sec.gov). Copies of the proxy statement/prospectus and the filings with the SEC that will be incorporated by reference in the proxy statement/prospectus can also be
obtained, without charge, by directing a request to Huntington Investor Relations, Huntington Bancshares Incorporated, Huntington Center, 41 South High Street, Columbus, Ohio 43287, (800) 576-5007 or to Veritex Investor Relations, Veritex
Holdings, Inc., 8214 Westchester Drive, Suite 800, Dallas, Texas 75225, (972) 349-6200. PARTICIPANTS IN THE SOLICITATION Huntington, Veritex, and certain of their respective directors and executive officers may be deemed to be participants in
the solicitation of proxies from the shareholders of Veritex in connection with the proposed transaction under the rules of the SEC. Information regarding the interests of the directors and executive officers of Huntington and Veritex and other
persons who may be deemed to be participants in the solicitation of shareholders of Veritex in connection with the transaction and a description of their direct and indirect interests, by security holdings or otherwise, will be included in the
definitive proxy statement/prospectus related to the transaction, which will be filed by Huntington with the SEC. Information regarding Huntington’s directors and executive officers is available in its definitive proxy statement relating to its
2025 Annual Meeting of Shareholders, which was filed with the SEC on March 6, 2025, and other documents filed by Huntington with the SEC. Information regarding Veritex’s directors and executive officers is available in its definitive proxy
statement relating to its 2025 Annual Meeting of Shareholders, which was filed with the SEC on April 29, 2025, and other documents filed by Veritex with the SEC. Other information regarding the participants in the proxy solicitation and a
description of their direct and indirect interests, by security holdings or otherwise, will be contained in the proxy statement/prospectus and other relevant materials filed with the SEC. Free copies of this document may be obtained as
described above under “Important Additional Information.”
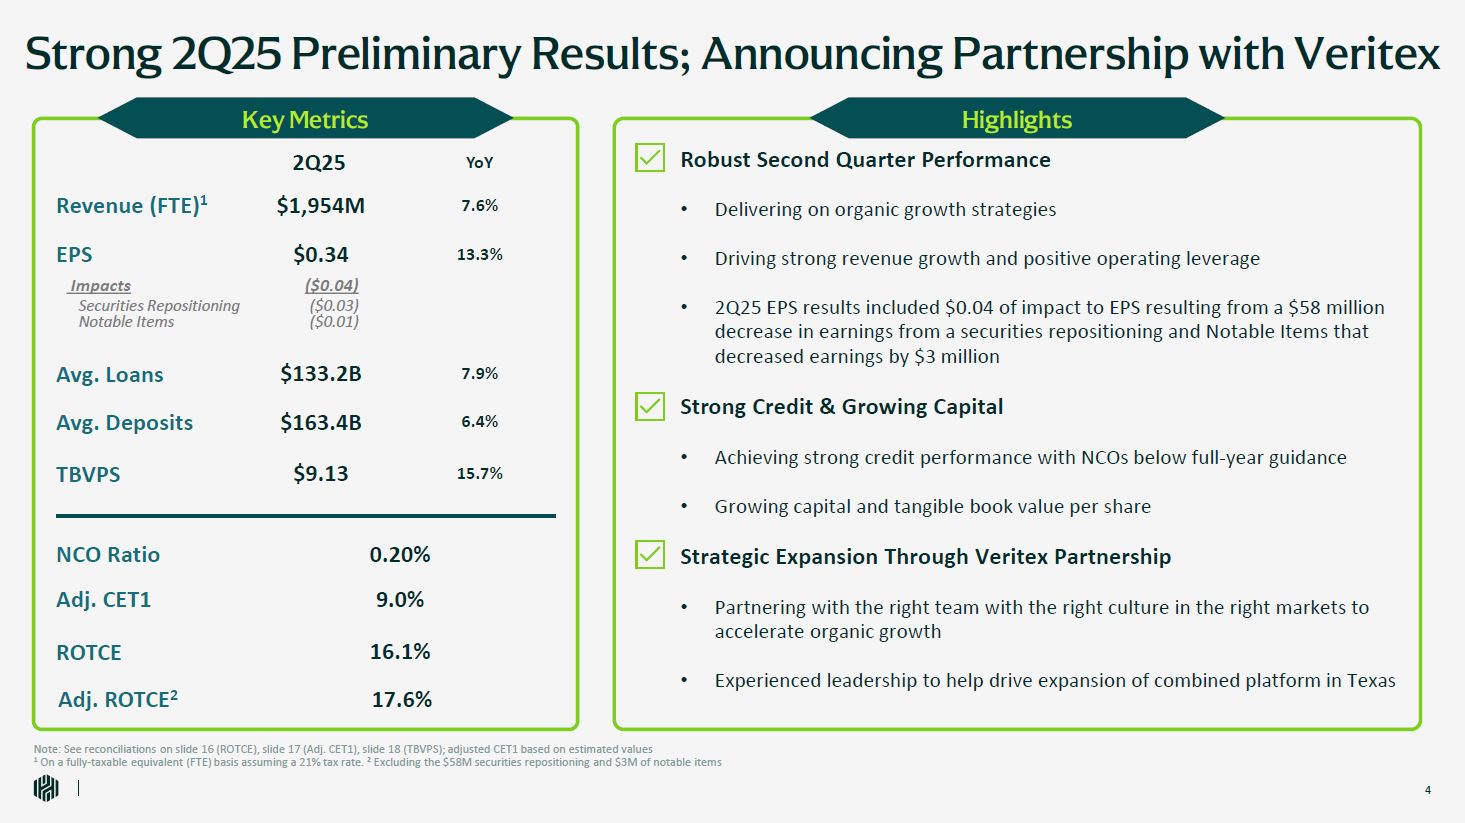
Strong 2Q25 Preliminary Results; Announcing Partnership with Veritex Note: See
reconciliations on slide 16 (ROTCE), slide 17 (Adj. CET1), slide 18 (TBVPS); adjusted CET1 based on estimated values 1 On a fully-taxable equivalent (FTE) basis assuming a 21% tax rate. 2 Excluding the $58M securities repositioning and $3M of
notable items Highlights Robust Second Quarter Performance Delivering on organic growth strategies Driving strong revenue growth and positive operating leverage 2Q25 EPS results included $0.04 of impact to EPS resulting from a $58 million
decrease in earnings from a securities repositioning and Notable Items that decreased earnings by $3 million Strong Credit & Growing Capital Achieving strong credit performance with NCOs below full-year guidance Growing capital and
tangible book value per share Strategic Expansion Through Veritex Partnership Partnering with the right team with the right culture in the right markets to accelerate organic growth Experienced leadership to help drive expansion of combined
platform in Texas YoY 2 Revenue (FTE)1 ROTCE Avg. Loans Avg. Deposits TBVPS NCO Ratio Adj. CET1 Key Metrics 2Q25 $1,954M 7.6% 13.3% 16.1% $133.2B 7.9% $163.4B 6.4% $9.13 15.7% 0.20% 9.0% EPS Impacts Securities
Repositioning Notable Items Adj. ROTCE2 17.6% $0.34 ($0.04) ($0.03) ($0.01)
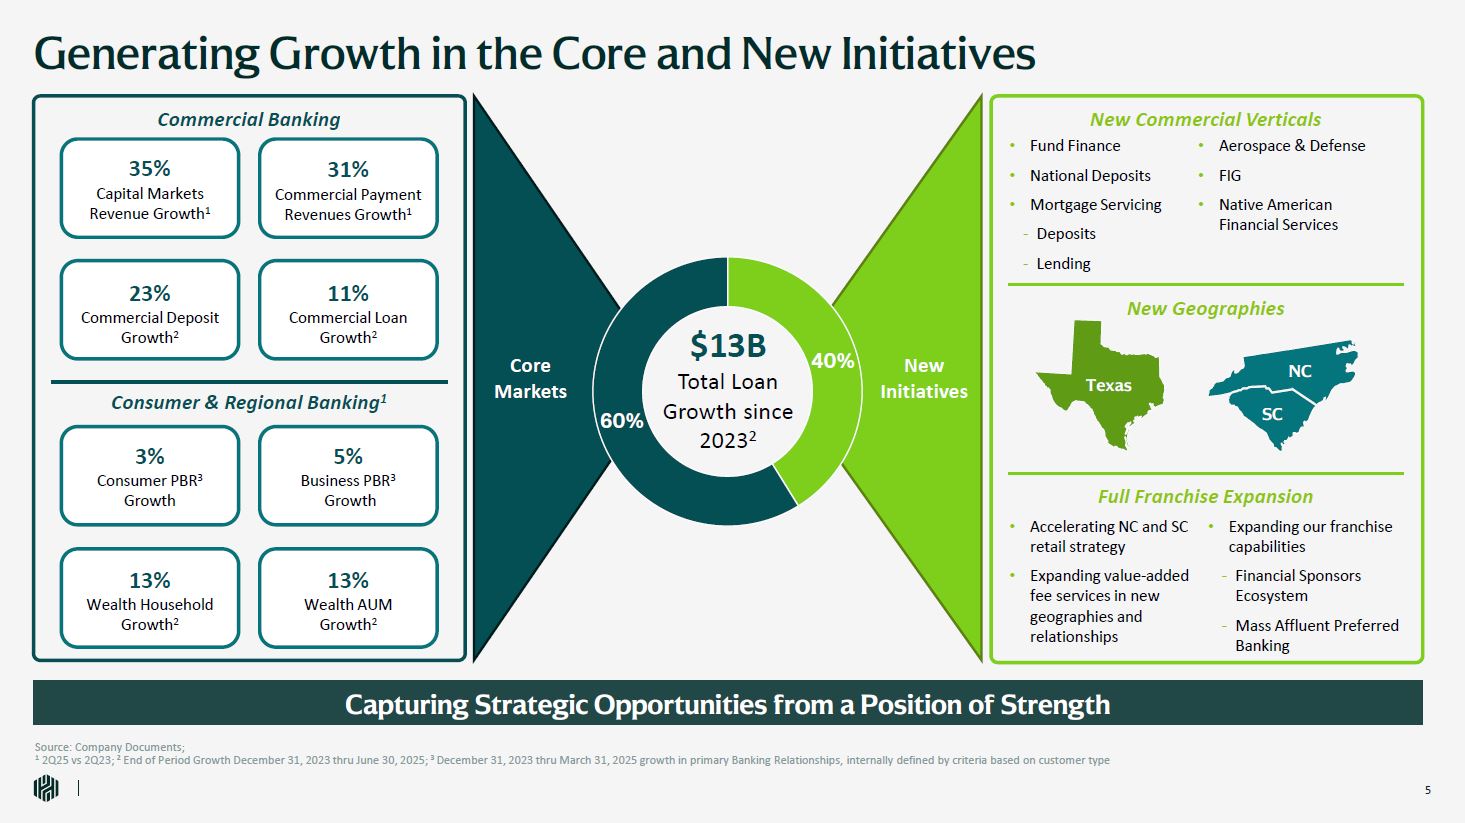
Generating Growth in the Core and New Initiatives Capturing Strategic
Opportunities from a Position of Strength Source: Company Documents; 1 2Q25 vs 2Q23; 2 End of Period Growth December 31, 2023 thru June 30, 2025; 3 December 31, 2023 thru March 31, 2025 growth in primary Banking Relationships, internally
defined by criteria based on customer type $13B Total Loan Growth since 20232 New Initiatives Core Markets New Geographies Fund Finance National Deposits Mortgage Servicing Deposits Lending Aerospace & Defense FIG Native
American Financial Services New Commercial Verticals Full Franchise Expansion NC SC Texas Accelerating NC and SC retail strategy Expanding value-added fee services in new geographies and relationships Expanding our franchise
capabilities Financial Sponsors Ecosystem Mass Affluent Preferred Banking Commercial Banking Consumer & Regional Banking1 3% Consumer PBR3 Growth 5% Business PBR3 Growth 13% Wealth Household Growth2 13% Wealth AUM
Growth2 35% Capital Markets Revenue Growth1 11% Commercial Loan Growth2 23% Commercial Deposit Growth2 31% Commercial Payment Revenues Growth1 40% 5 60%
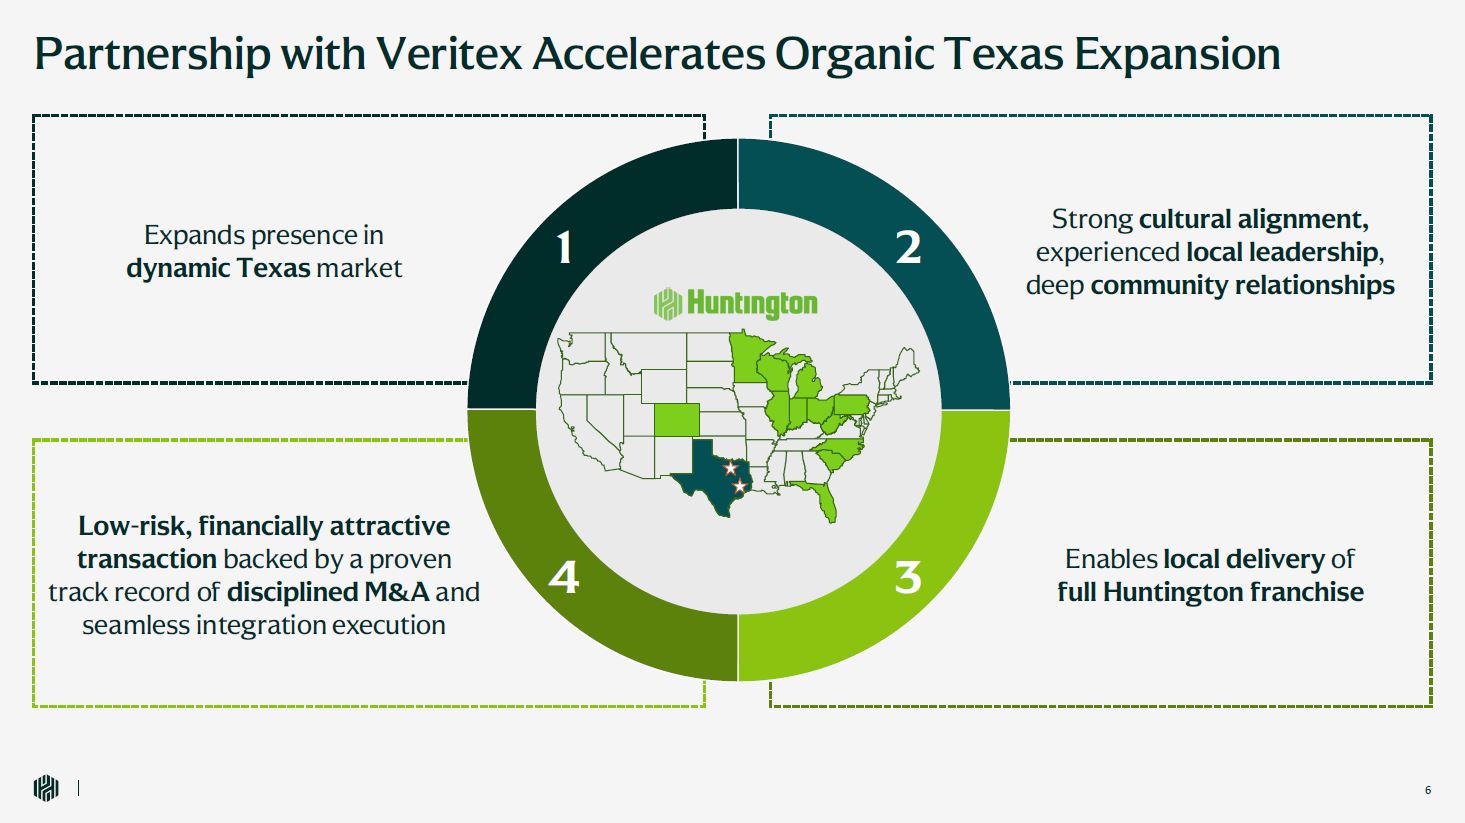
Strong cultural alignment, experienced local leadership, deep community
relationships Enables local delivery of full Huntington franchise Low-risk, financially attractive transaction backed by a proven track record of disciplined M&A and seamless integration execution Partnership with Veritex Accelerates
Organic Texas Expansion 2 3 4 Expands presence in dynamic Texas market 11 5
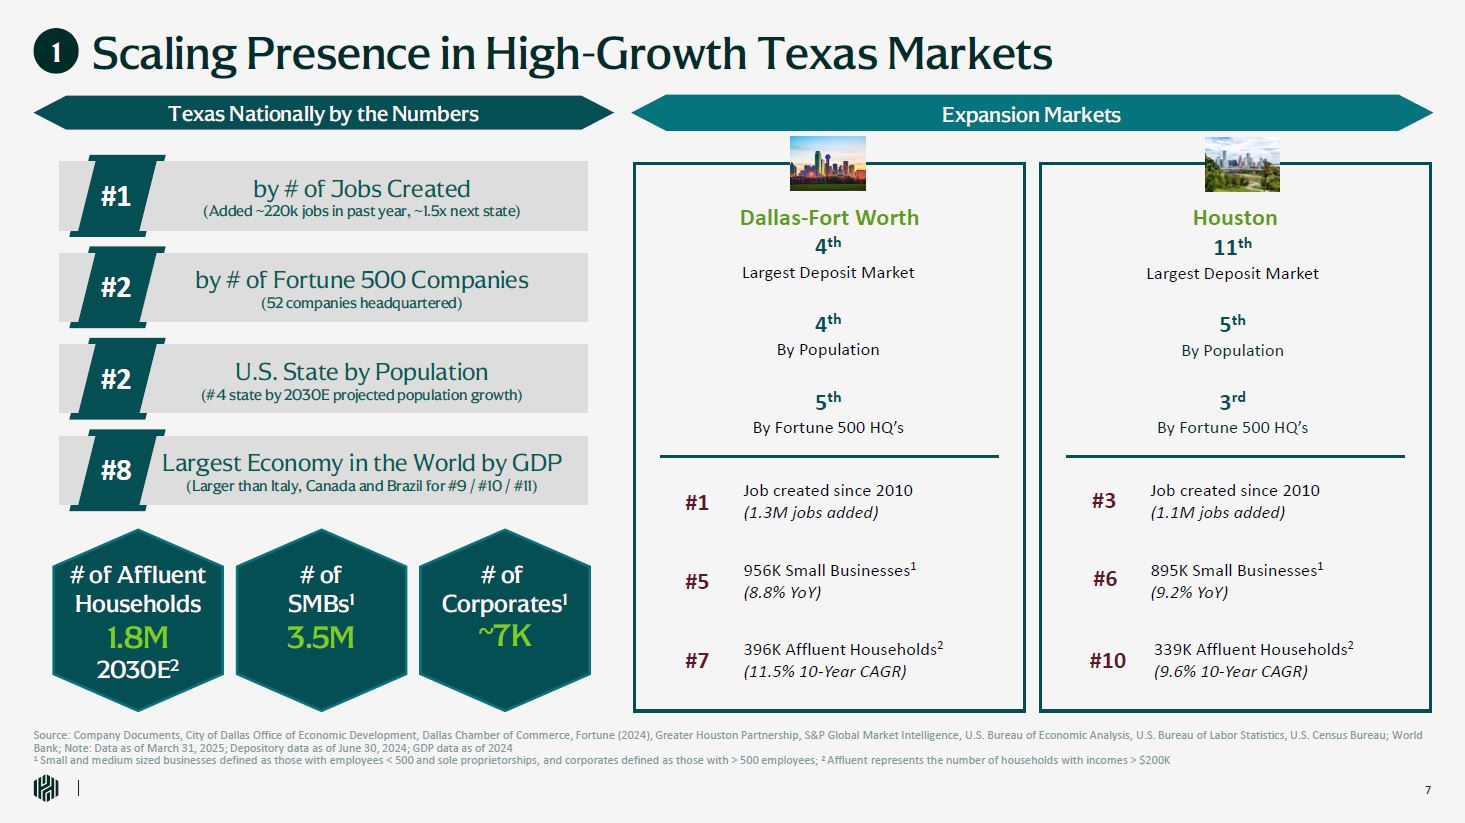
Scaling Presence in High-Growth Texas Markets 1 Source: Company Documents, City
of Dallas Office of Economic Development, Dallas Chamber of Commerce, Fortune (2024), Greater Houston Partnership, S&P Global Market Intelligence, U.S. Bureau of Economic Analysis, U.S. Bureau of Labor Statistics, U.S. Census Bureau; World
Bank; Note: Data as of March 31, 2025; Depository data as of June 30, 2024; GDP data as of 2024 1 Small and medium sized businesses defined as those with employees < 500 and sole proprietorships, and corporates defined as those with >
500 employees; 2 Affluent represents the number of households with incomes > $200K Dallas-Fort Worth 4th Largest Deposit Market 5th By Fortune 500 HQ’s Houston 11th Largest Deposit Market 5th By Population #1 Job created since
2010 (1.3M jobs added) #5 956K Small Businesses1 (8.8% YoY) #7 396K Affluent Households2 (11.5% 10-Year CAGR) #3 Job created since 2010 (1.1M jobs added) #6 895K Small Businesses1 (9.2% YoY) #10 339K Affluent Households2 (9.6%
10-Year CAGR) 4th By Population 3rd By Fortune 500 HQ’s Texas Nationally by the Numbers Expansion Markets Largest Economy in the World by GDP (Larger than Italy, Canada and Brazil for #9 / #10 / #11) #8 by # of Jobs Created (Added
~220k jobs in past year, ~1.5x next state) #1 by # of Fortune 500 Companies (52 companies headquartered) #2 # of Affluent Households 1.8M 2030E2 # of SMBs1 3.5M # of Corporates1 ~7K U.S. State by Population (#4 state by 2030E
projected population growth) #2 5
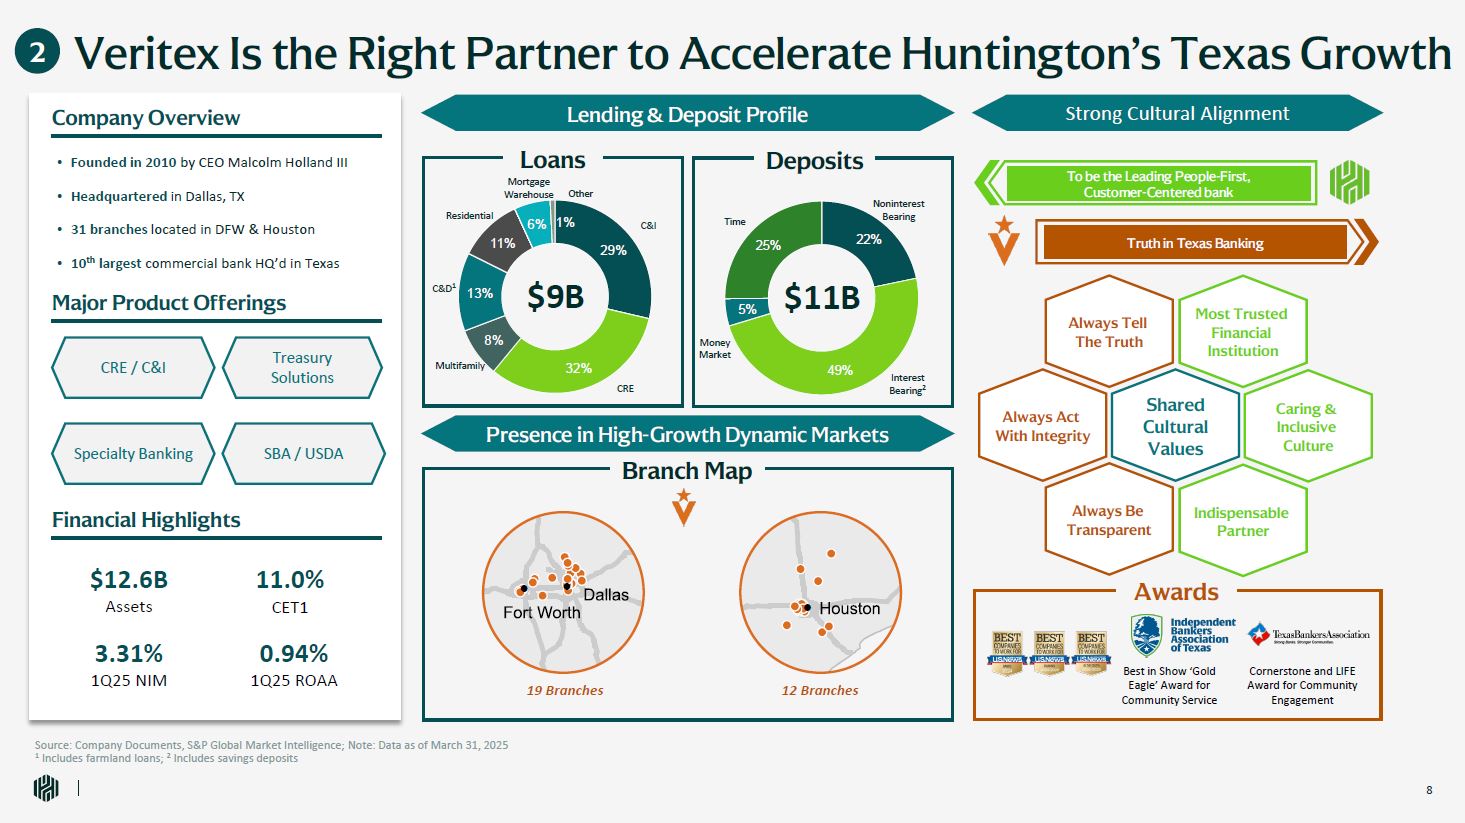
29% 32% 11% 6% 1% 22% 49% 5% 25% Veritex Is the Right Partner to
Accelerate Huntington’s Texas Growth Source: Company Documents, S&P Global Market Intelligence; Note: Data as of March 31, 2025 1 Includes farmland loans; 2 Includes savings deposits Branch Map Residential C&D1
13% 8% Multifamily CRE C&I $9B Lending & Deposit Profile Loans Deposits Mortgage Warehouse Other Noninterest Bearing Interest Bearing2 Money Market Time $11B $12.6B Assets 3.31% 1Q25 NIM 0.94% 1Q25
ROAA 11.0% CET1 CRE / C&I SBA / USDA Strong Cultural Alignment Best in Show ‘Gold Eagle’ Award for Community Service Company Overview Founded in 2010 by CEO Malcolm Holland III Headquartered in Dallas, TX 31 branches located in
DFW & Houston 10th largest commercial bank HQ’d in Texas Major Product Offerings Financial Highlights Specialty Banking Treasury Solutions Awards Presence in High-Growth Dynamic Markets Cornerstone and LIFE Award for
Community Engagement 19 Branches 2 Truth in Texas Banking To be the Leading People-First, Customer-Centered bank Always Tell The Truth Caring & Inclusive Culture Always Act With Integrity Most Trusted Financial
Institution Indispensable Partner Always Be Transparent Shared Cultural Values 12 Branches 10
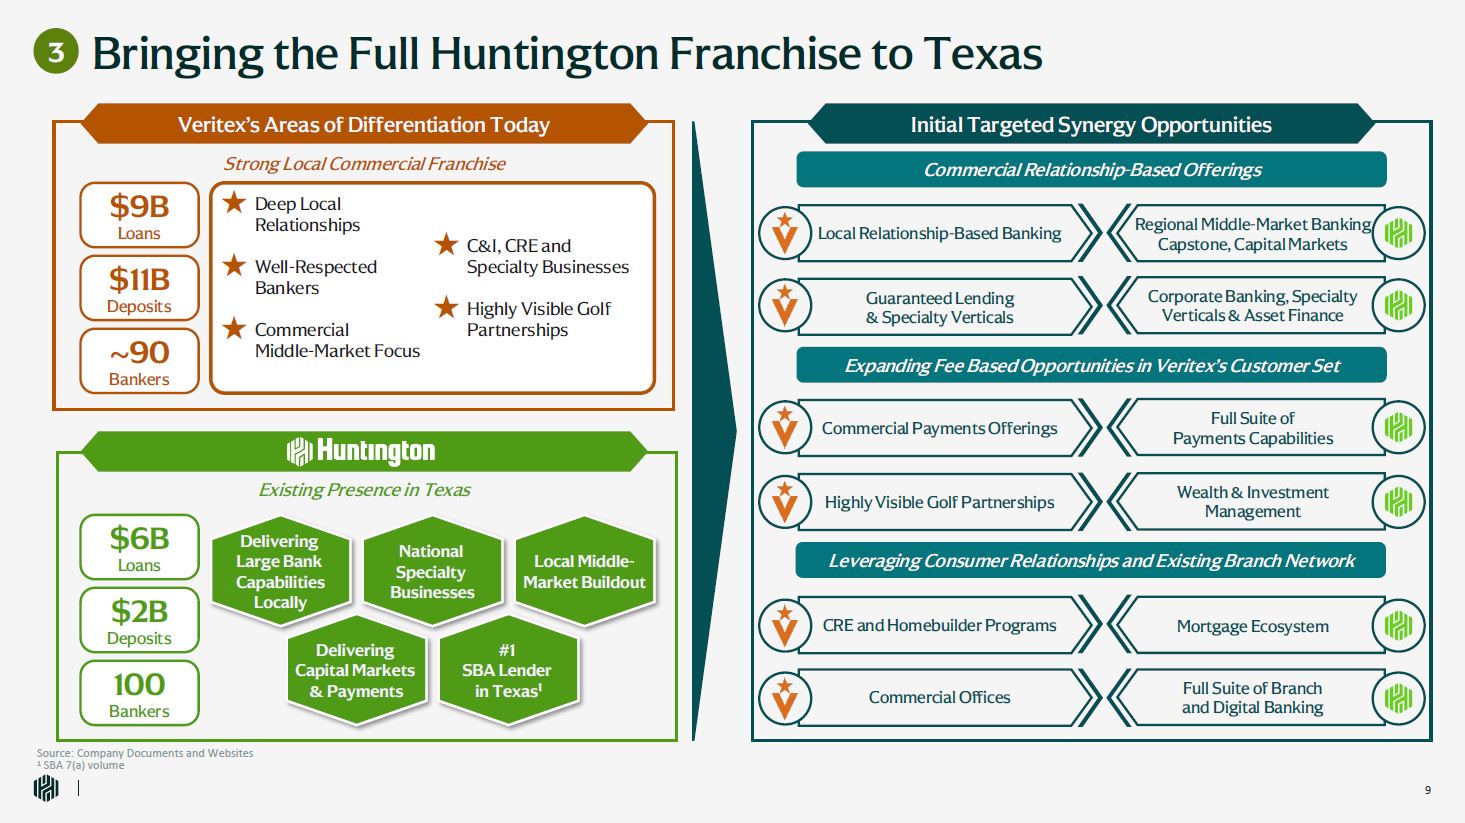
Bringing the Full Huntington Franchise to Texas Source: Company Documents and
Websites 1 SBA 7(a) volume 3 Strong Local Commercial Franchise Existing Presence in Texas Delivering Large Bank Capabilities Locally Delivering Capital Markets & Payments National Specialty Businesses #1 SBA Lender in Texas1 Local
Middle- Market Buildout $6B Loans $2B Deposits 100 Bankers Veritex’s Areas of Differentiation Today Initial Targeted Synergy Opportunities $9B Loans $11B Deposits ~90 Bankers Commercial Relationship-Based Offerings ★ Deep Local
Relationships ★ Well-Respected Bankers ★ Commercial Middle-Market Focus ★ C&I, CRE and Specialty Businesses ★ Highly Visible Golf Partnerships Leveraging Consumer Relationships and Existing Branch Network Expanding Fee Based
Opportunities in Veritex’s Customer Set Guaranteed Lending & Specialty Verticals Corporate Banking, Specialty Verticals & Asset Finance Commercial Offices Full Suite of Branch and Digital Banking Highly Visible Golf
Partnerships Wealth & Investment Management Commercial Payments Offerings Full Suite of Payments Capabilities Local Relationship-Based Banking Regional Middle-Market Banking Capstone, Capital Markets CRE and Homebuilder
Programs Mortgage Ecosystem 10
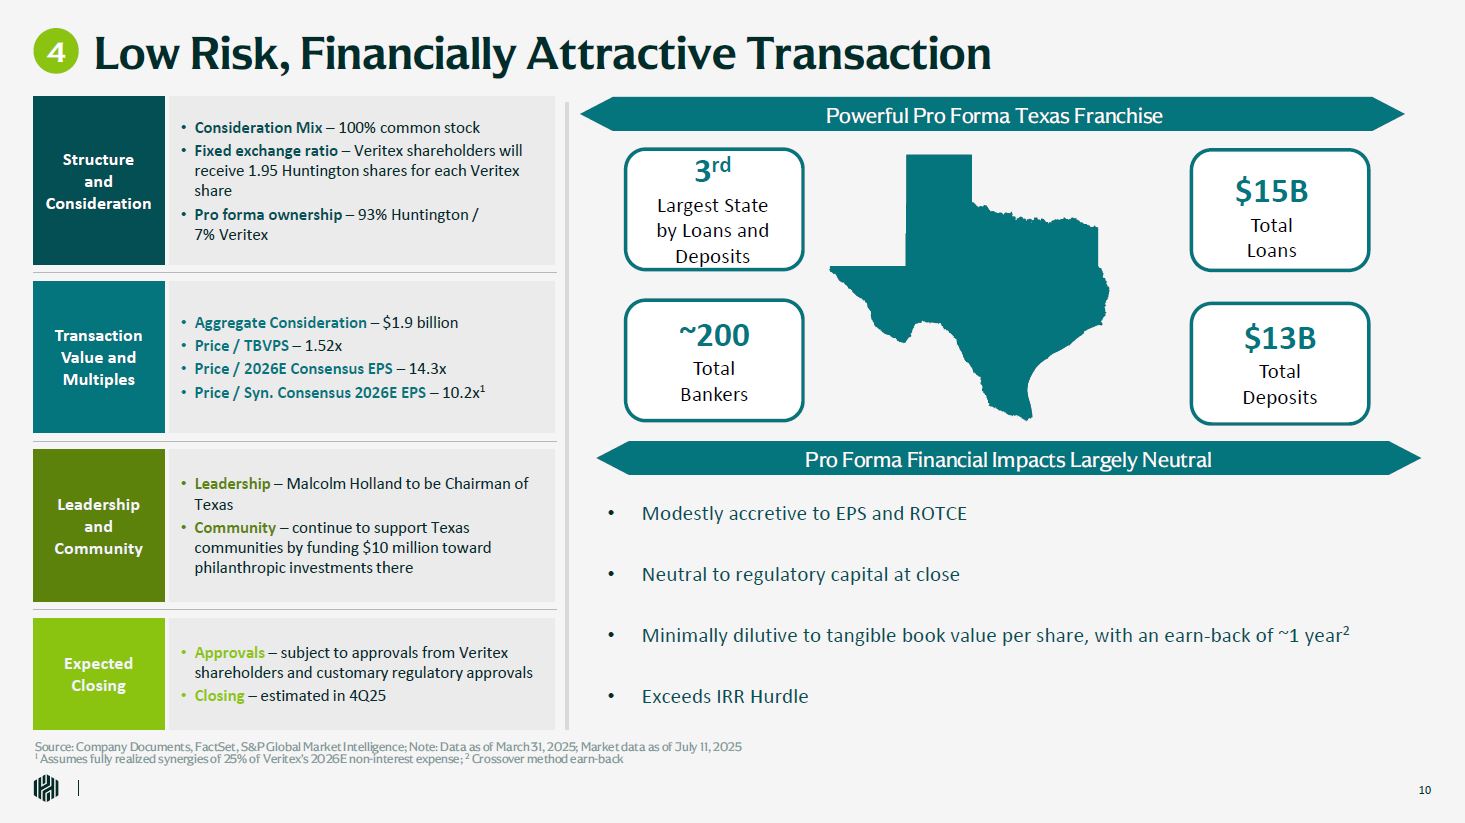
3rd Largest State by Loans and Deposits Low Risk, Financially Attractive
Transaction Source: Company Documents, FactSet, S&P Global Market Intelligence; Note: Data as of March 31, 2025; Market data as of July 11, 2025 1 Assumes fully realized synergies of 25% of Veritex’s 2026E non-interest expense; 2
Crossover method earn-back 4 Powerful Pro Forma Texas Franchise $15B Total Loans $13B Total Deposits ~200 Total Bankers Modestly accretive to EPS and ROTCE Neutral to regulatory capital at close Minimally dilutive to tangible book
value per share, with an earn-back of ~1 year2 Exceeds IRR Hurdle Pro Forma Financial Impacts Largely Neutral Structure and Consideration Consideration Mix – 100% common stock Fixed exchange ratio – Veritex shareholders will receive 1.95
Huntington shares for each Veritex share Pro forma ownership – 93% Huntington / 7% Veritex Transaction Value and Multiples Aggregate Consideration – $1.9 billion Price / TBVPS – 1.52x Price / 2026E Consensus EPS – 14.3x Price / Syn.
Consensus 2026E EPS – 10.2x1 Expected Closing Approvals – subject to approvals from Veritex shareholders and customary regulatory approvals Closing – estimated in 4Q25 Leadership and Community Leadership – Malcolm Holland to be Chairman of
Texas Community – continue to support Texas communities by funding $10 million toward philanthropic investments there 10
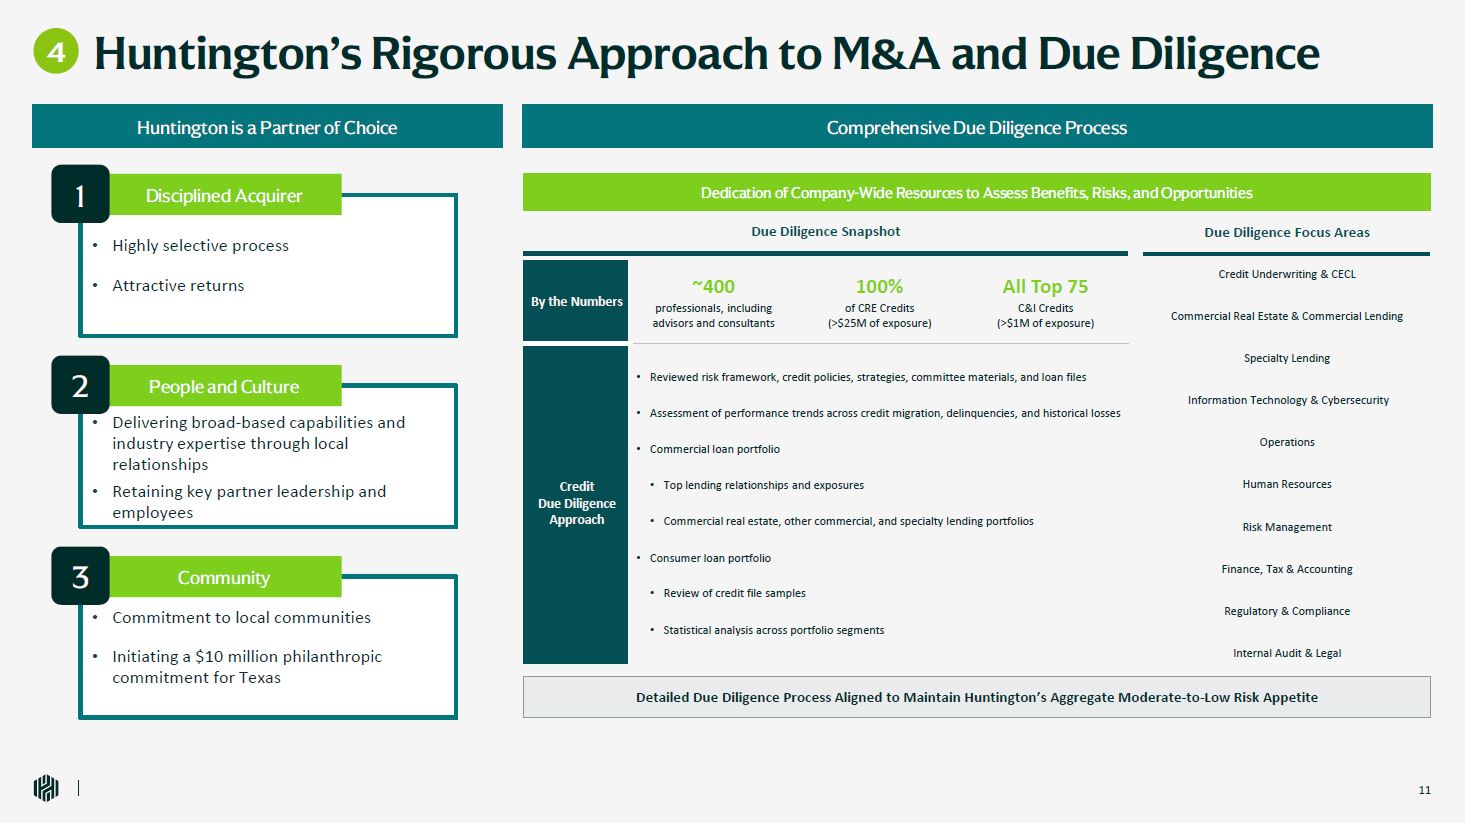
Huntington’s Rigorous Approach to M&A and Due Diligence Due Diligence
Snapshot Due Diligence Focus Areas By the Numbers ~400 professionals, including advisors and consultants 100% of CRE Credits (>$25M of exposure) All Top 75 C&I Credits (>$1M of exposure) Credit Underwriting &
CECL Commercial Real Estate & Commercial Lending Specialty Lending Information Technology & Cybersecurity Operations Human Resources Risk Management Finance, Tax & Accounting Regulatory & Compliance Internal Audit &
Legal Credit Due Diligence Approach Reviewed risk framework, credit policies, strategies, committee materials, and loan files Assessment of performance trends across credit migration, delinquencies, and historical losses Commercial loan
portfolio Top lending relationships and exposures Commercial real estate, other commercial, and specialty lending portfolios Consumer loan portfolio Review of credit file samples Statistical analysis across portfolio segments Detailed Due
Diligence Process Aligned to Maintain Huntington’s Aggregate Moderate-to-Low Risk Appetite Dedication of Company-Wide Resources to Assess Benefits, Risks, and Opportunities Comprehensive Due Diligence Process Huntington is a Partner of
Choice Highly selective process Attractive returns Disciplined Acquirer 1 Delivering broad-based capabilities and industry expertise through local relationships Retaining key partner leadership and employees People and
Culture 2 Commitment to local communities Initiating a $10 million philanthropic commitment for Texas Community 3 4 10
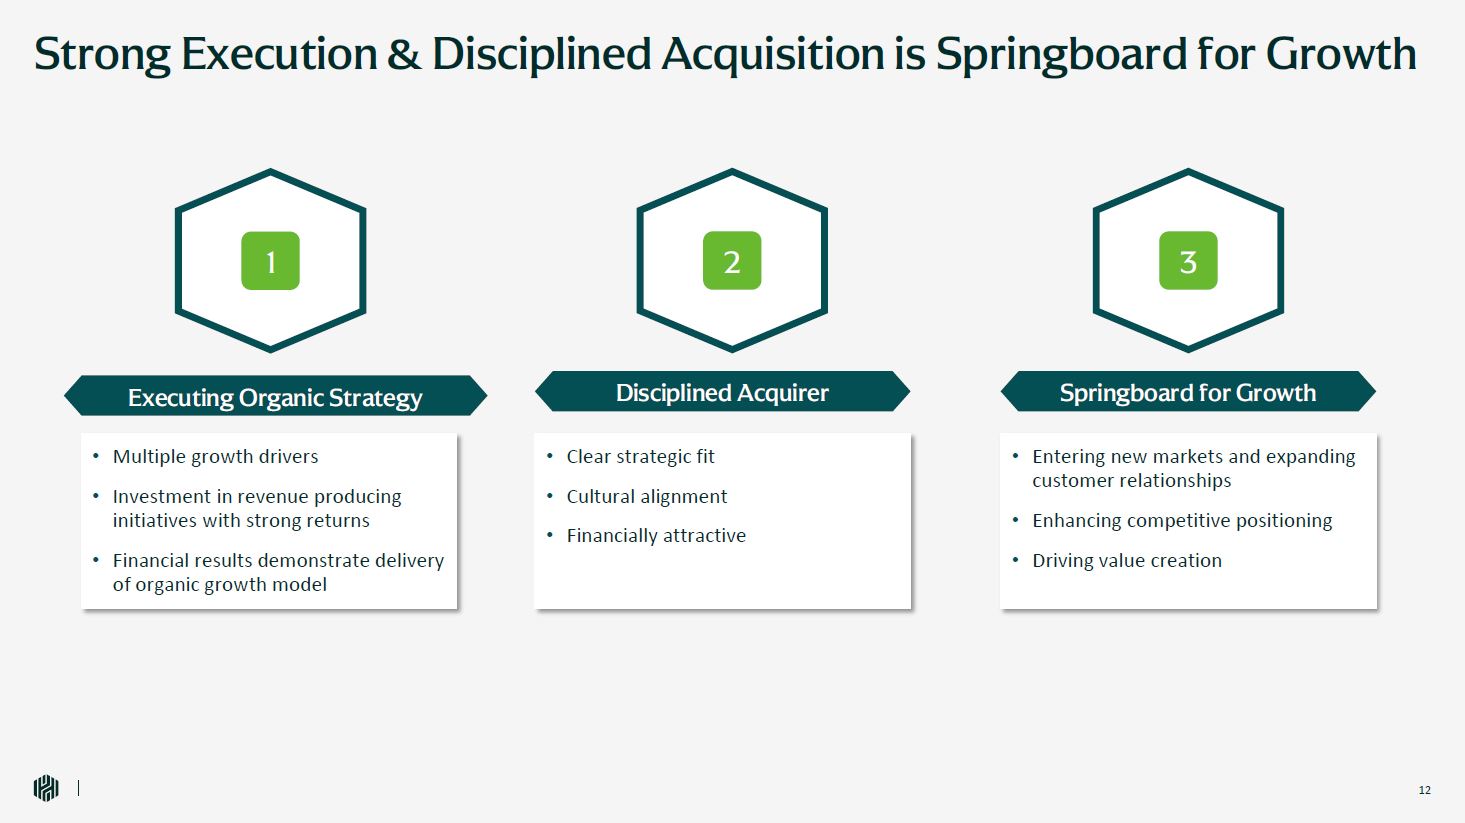
Strong Execution & Disciplined Acquisition is Springboard for Growth Multiple
growth drivers Investment in revenue producing initiatives with strong returns Financial results demonstrate delivery of organic growth model Executing Organic Strategy Clear strategic fit Cultural alignment Financially
attractive Disciplined Acquirer Entering new markets and expanding customer relationships Enhancing competitive positioning Driving value creation Springboard for Growth 1 2 3 10
APPENDIX
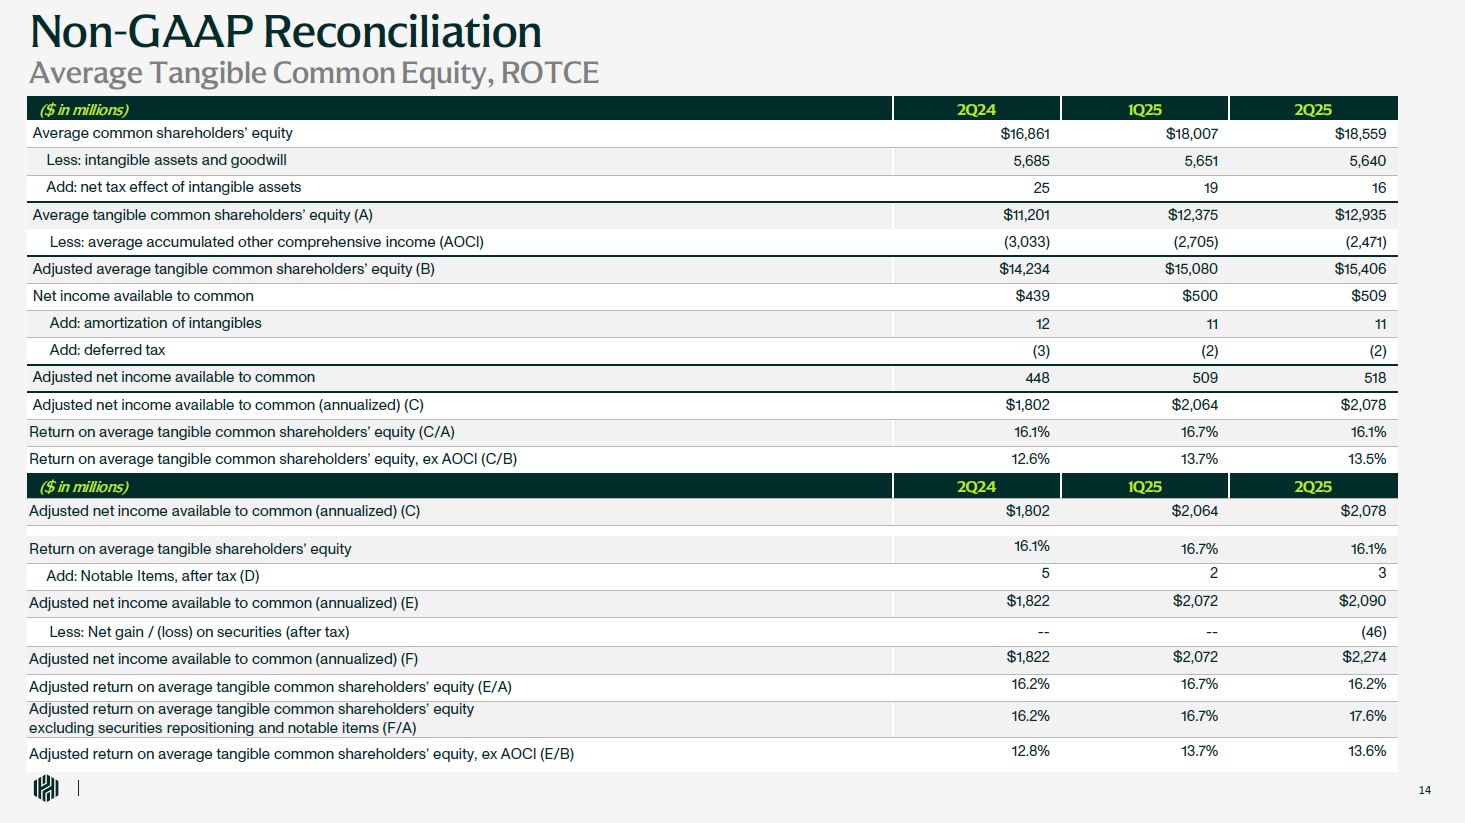
Non-GAAP Reconciliation Average Tangible Common Equity, ROTCE 14 ($ in
millions) 2Q24 1Q25 2Q25 Average common shareholders’ equity $16,861 $18,007 $18,559 Less: intangible assets and goodwill 5,685 5,651 5,640 Add: net tax effect of intangible assets 25 19 16 Average tangible common shareholders’
equity (A) $11,201 $12,375 $12,935 Less: average accumulated other comprehensive income (AOCI) (3,033) (2,705) (2,471) Adjusted average tangible common shareholders’ equity (B) $14,234 $15,080 $15,406 Net income available to
common $439 $500 $509 Add: amortization of intangibles 12 11 11 Add: deferred tax (3) (2) (2) Adjusted net income available to common 448 509 518 Adjusted net income available to common (annualized)
(C) $1,802 $2,064 $2,078 Return on average tangible common shareholders’ equity (C/A) 16.1% 16.7% 16.1% Return on average tangible common shareholders’ equity, ex AOCI (C/B) 12.6% 13.7% 13.5% ($ in
millions) 2Q24 1Q25 2Q25 Adjusted net income available to common (annualized) (C) $1,802 $2,064 $2,078 Return on average tangible shareholders’ equity 16.1% 16.7% 16.1% Add: Notable Items, after tax (D) 5 2 3 Adjusted net income
available to common (annualized) (E) $1,822 $2,072 $2,090 Less: Net gain / (loss) on securities (after tax) -- -- (46) Adjusted net income available to common (annualized) (F) $1,822 $2,072 $2,274 Adjusted return on average tangible
common shareholders’ equity (E/A) 16.2% 16.7% 16.2% Adjusted return on average tangible common shareholders’ equity excluding securities repositioning and notable items (F/A) 16.2% 16.7% 17.6% Adjusted return on average tangible common
shareholders’ equity, ex AOCI (E/B) 12.8% 13.7% 13.6%
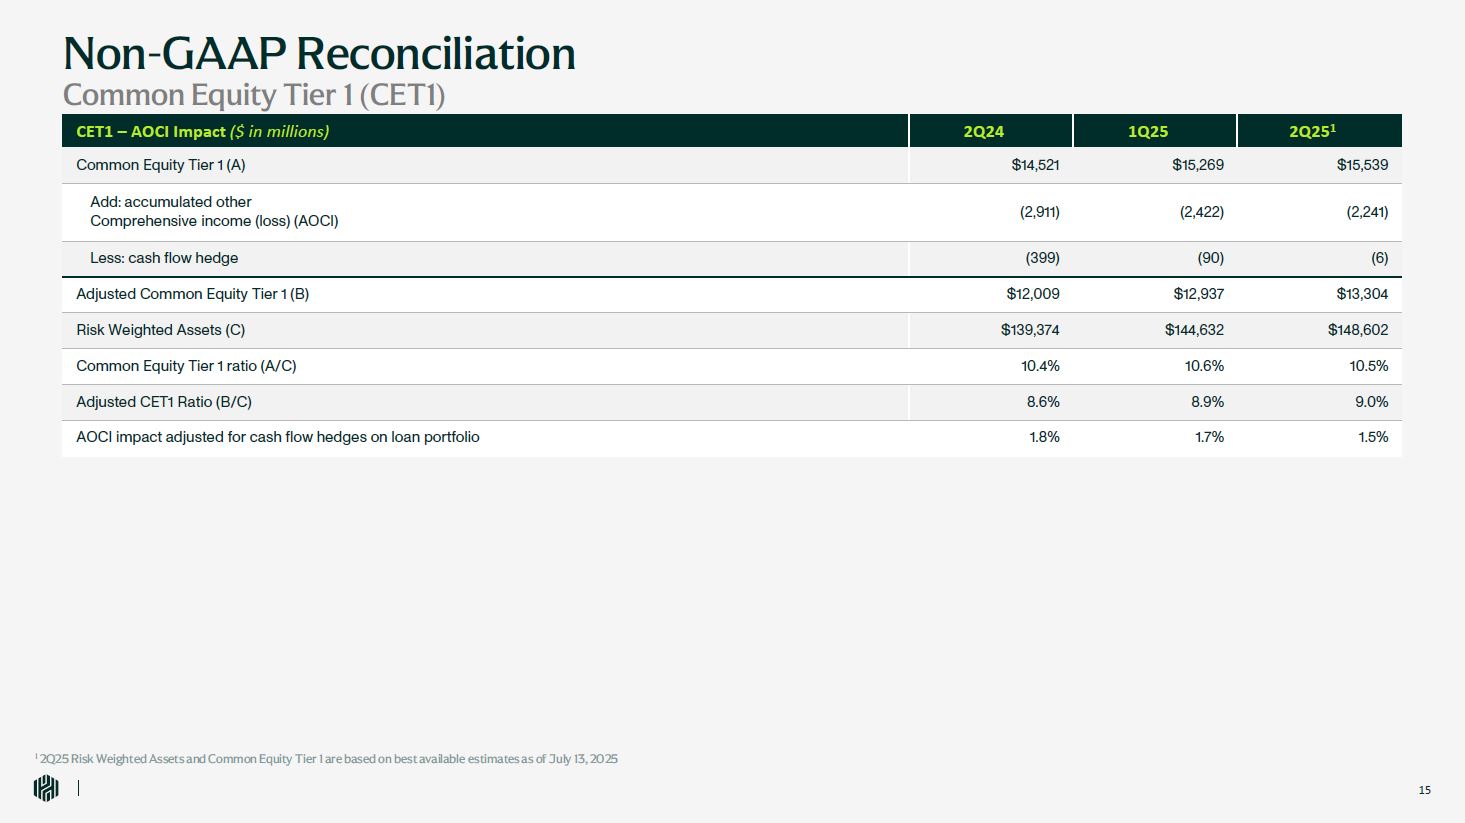
1 2Q25 Risk Weighted Assets and Common Equity Tier 1 are based on best available
estimates as of July 13, 2025 14 Non-GAAP Reconciliation Common Equity Tier 1 (CET1) CET1 – AOCI Impact ($ in millions) 2Q24 1Q25 2Q251 Common Equity Tier 1 (A) $14,521 $15,269 $15,539 Add: accumulated other Comprehensive income
(loss) (AOCI) (2,911) (2,422) (2,241) Less: cash flow hedge (399) (90) (6) Adjusted Common Equity Tier 1 (B) $12,009 $12,937 $13,304 Risk Weighted Assets (C) $139,374 $144,632 $148,602 Common Equity Tier 1 ratio
(A/C) 10.4% 10.6% 10.5% Adjusted CET1 Ratio (B/C) 8.6% 8.9% 9.0% AOCI impact adjusted for cash flow hedges on loan portfolio 1.8% 1.7% 1.5%
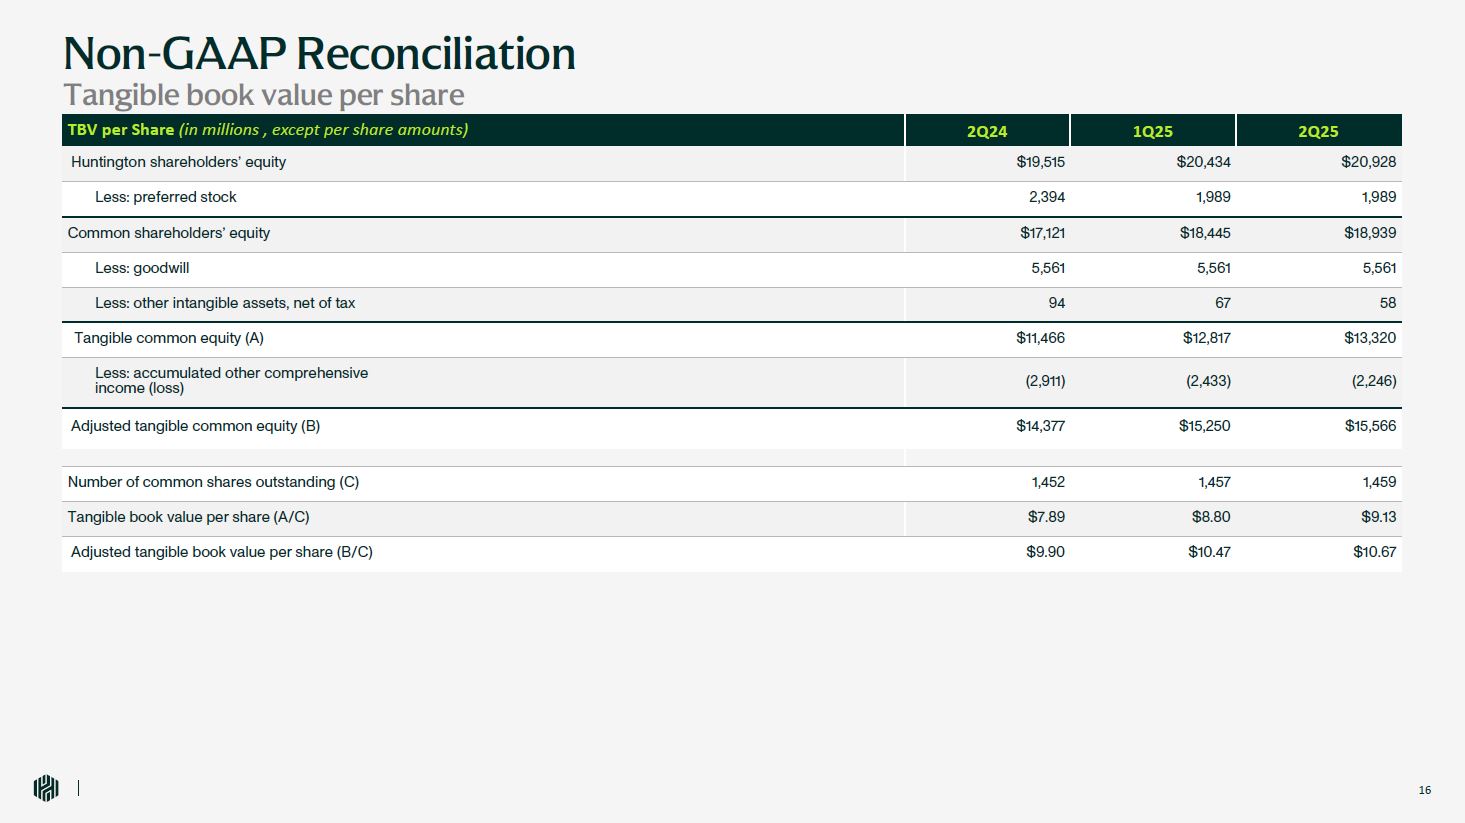
Non-GAAP Reconciliation Tangible book value per share 14 TBV per Share (in
millions , except per share amounts) 2Q24 1Q25 2Q25 Huntington shareholders’ equity $19,515 $20,434 $20,928 Less: preferred stock 2,394 1,989 1,989 Common shareholders’ equity $17,121 $18,445 $18,939 Less:
goodwill 5,561 5,561 5,561 Less: other intangible assets, net of tax 94 67 58 Tangible common equity (A) $11,466 $12,817 $13,320 Less: accumulated other comprehensive income (loss) (2,911) (2,433) (2,246) Adjusted tangible
common equity (B) $14,377 $15,250 $15,566 Number of common shares outstanding (C) 1,452 1,457 1,459 Tangible book value per share (A/C) $7.89 $8.80 $9.13 Adjusted tangible book value per share (B/C) $9.90 $10.47 $10.67

THANK YOU