Summary | Value of Initial Fixed | Company | ||||||||||||||||||||||
Compensation | Compensation | $100 Investment Based On: | Selected | |||||||||||||||||||||
Summary | Table | Actually | Peer Group | Measure: | ||||||||||||||||||||
Compensation | Compensation | Total for | Paid to | Total | Total | Net Income | Market | |||||||||||||||||
Table Total | Actually | Non-PEO | Non-PEO | Shareholder | Shareholder | (Loss) | Capitalization | |||||||||||||||||
Year | for PEO | Paid to PEO | NEO | NEO | Return | Return | (in thousands) | (in millions) | ||||||||||||||||
(a) |
| (b)(1) |
| (c)(2) |
| (d)(3) |
| (e)(4) |
| (f)(5) |
| (g)(6) |
| (h)(7) |
| (i)(8) | ||||||||
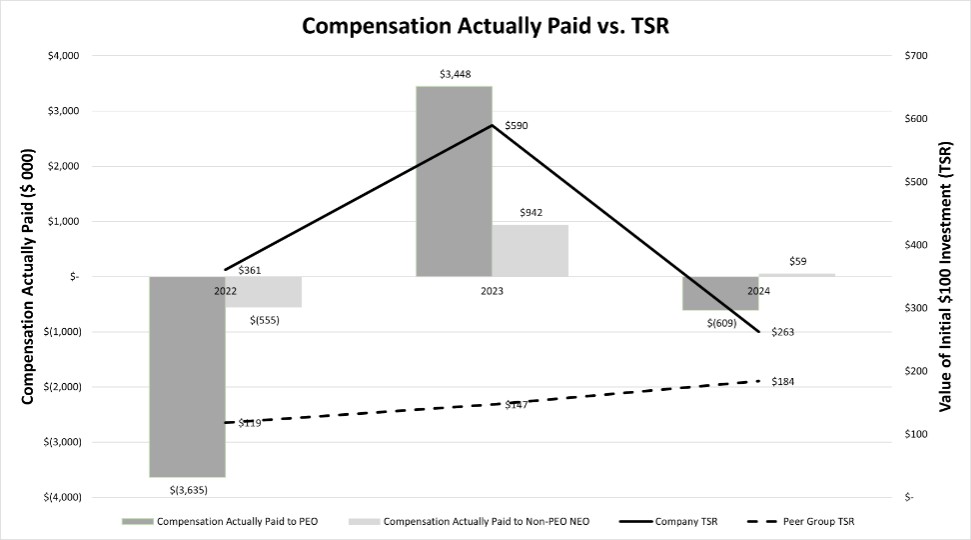
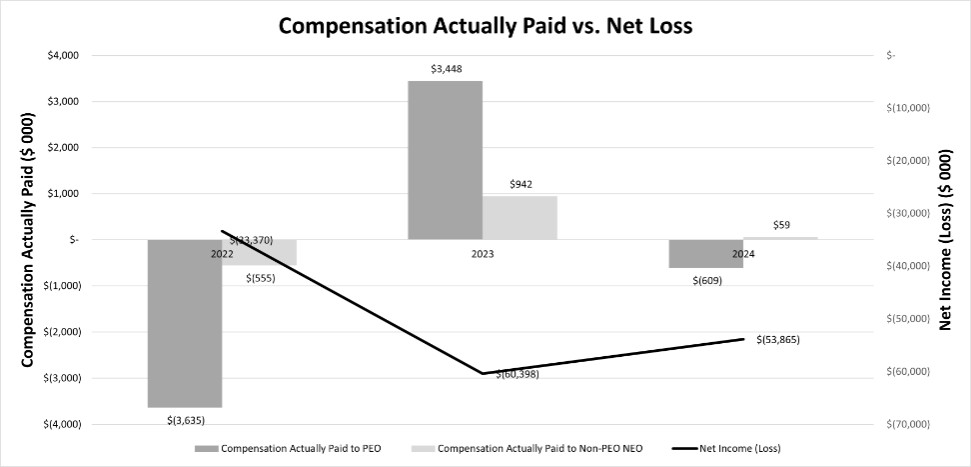
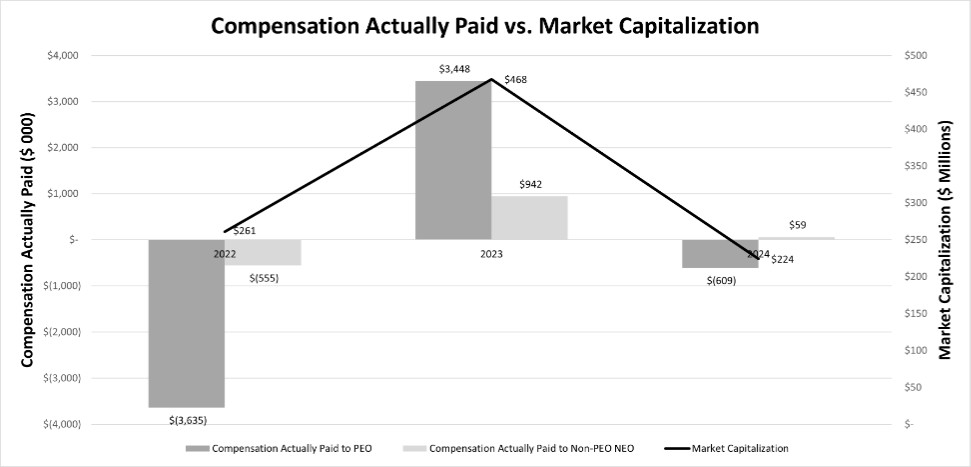
2024 | $ | 1,557,414 | $ | (609,287) | $ | 415,858 | $ | 59,121 | $ | 263 | $ | 184 | $ | (53,865) | $ | 224 | ||||||||
2023 | $ | 2,053,207 | $ | 3,447,726 | $ | 583,257 | $ | 942,188 | $ | 590 | $ | 147 | $ | (60,398) | $ | 468 | ||||||||
2022 | $ | 3,204,888 | $ | (3,634,867) | $ | 952,855 | $ | (555,004) | $ | 361 | $ | 119 | $ | (33,370) | $ | 261 | ||||||||
(1) The dollar amounts reported in column (b) represent the amounts of total compensation reported for Mr. Hong, our PEO, for each corresponding fiscal year in the “Total” column of the Summary Compensation Table.
(2) The dollar amounts reported in column (c) represent the amount of compensation actually paid (“CAP”) to Mr. Hong as computed in accordance with Item 402(v) of Regulation S-K, for each covered fiscal year. The dollar amounts do not reflect the actual amounts of compensation earned or received by or paid to Mr. Hong during the applicable fiscal year. In accordance with the requirements of Item 402(v) of Regulation S-K, the following adjustments were made to Mr. Hong’s total compensation for each covered fiscal year to determine CAP.
Change in | |||||||||||||||||||||
Fair Value as | |||||||||||||||||||||
of Vesting Date | |||||||||||||||||||||
of Stock Awards | |||||||||||||||||||||
and Option Awards | |||||||||||||||||||||
Fair Value at | Change in | Fair Value at | Granted in | ||||||||||||||||||
Fiscal Year End | Fair Value of | Vesting of Stock | Prior Fiscal Years | ||||||||||||||||||
Deduction of | of Outstanding and | Outstanding and | Awards and Option | For Which | |||||||||||||||||
Summary | Stock Awards | Unvested Stock | Unvested Stock Awards | Awards Granted | Applicable Vesting | ||||||||||||||||
Compensation | and Option | Awards and Option | and Option Awards | in Fiscal Year | Conditions Were | ||||||||||||||||
Table Total | Awards | Awards Granted | Granted in Prior | That Vested | Satisfied During | Compensation | |||||||||||||||
Year |
| for PEO |
| for PEO |
| in Fiscal Year |
| Fiscal Years |
| During Fiscal Year |
| Fiscal Year |
| Actually Paid | |||||||
2024 | $ | 1,557,414 | $ | (997,500) | $ | 628,125 | $ | (1,553,844) | $ | - | $ | (243,482) | $ | (609,287) | |||||||
2023 | $ | 2,053,207 | $ | (1,509,475) | $ | 938,120 | $ | 951,141 | $ | - | $ | 1,014,733 | $ | 3,447,726 | |||||||
2022 | $ | 3,204,888 | $ | (2,696,000) | $ | 805,000 | $ | (4,006,402) | $ | 315,000 | $ | (1,257,353) | $ | (3,634,867) | |||||||
(3) The dollar amounts reported in column (d) represent the amounts of total compensation reported for our only Non-PEO NEO, Ms. Sasaki, for each covered fiscal year in the “Total” column of the Summary Compensation Table for each applicable year.
(4) The dollar amounts reported in column (e) represent the amounts of CAP to Ms. Sasaki, as computed in accordance with Item 402(v) of Regulation S-K, for each covered fiscal year. The dollar amounts do not reflect the actual amount of compensation earned or received by or paid to Ms. Sasaki during the applicable fiscal year. In accordance with the requirements of Item 402(v) of Regulation S-K, the following adjustments were made to Ms. Sasaki’s total compensation for each covered fiscal year to determine CAP.
Change in | |||||||||||||||||||||
Fair Value as | |||||||||||||||||||||
of Vesting Date | |||||||||||||||||||||
of Stock Awards | |||||||||||||||||||||
and Option Awards | |||||||||||||||||||||
Fair Value at | Change in | Fair Value at | Granted in | ||||||||||||||||||
Deduction of | Fiscal Year End | Fair Value of | Vesting of Stock | Prior Fiscal Years | |||||||||||||||||
Summary | Stock Awards | of Outstanding and | Outstanding and | Awards and Option | For Which | ||||||||||||||||
Compensation | and Option | Unvested Stock | Unvested Stock Awards | Awards Granted | Applicable Vesting | ||||||||||||||||
Table Total | Awards | Awards and Option | and Option Awards | in Fiscal Year | Conditions Were | ||||||||||||||||
for Non-PEO | for Non-PEO | Awards Granted | Granted in Prior | That Vested | Satisfied During | Compensation | |||||||||||||||
Year |
| NEO |
| NEO |
| in Fiscal Year |
| Fiscal Years |
| During Fiscal Year |
| Fiscal Year |
| Actually Paid | |||||||
2024 | $ | 415,858 | $ | (133,000) | $ | 83,750 | $ | (273,656) | $ | - | $ | (33,831) | $ | 59,121 | |||||||
2023 | $ | 583,257 | $ | (302,500) | $ | 188,000 | $ | 198,469 | $ | - | $ | 274,962 | $ | 942,188 | |||||||
2022 | $ | 952,855 | $ | (674,000) | $ | 201,250 | $ | (753,093) | $ | 78,750 | $ | (360,766) | $ | (555,004) | |||||||
(5) The cumulative Company total shareholder return (“TSR”) amounts reported in column (f) are calculated by dividing the sum of the cumulative amount of dividends for the period starting at the market close on the last trading day before the Company’s earliest fiscal year in the table through and including the end of the fiscal year for which the TSR amount is being calculated (the “measurement period”), assuming dividend reinvestment, and the difference between the Company’s share price at the end and the beginning of the measurement period by the Company’s share price at the beginning of the measurement period. The comparison assumes $100 was invested in the Company for the measurement period. Historical stock performance is not necessarily indicative of future stock performance.
(6) The cumulative Peer Group TSR amounts reported in column (g) utilizes the S&P 500 Index, which we also utilize in the stock performance graph required by Item 201(e) of Regulation S-K included in our 2024 Annual Report. The comparison assumes $100 was invested in the S&P 500 Index for the measurement period. Historical stock performance is not necessarily indicative of future stock performance.
(7) The dollar amounts reported in column (h) represent the amounts of net income (loss), in thousands, reflected in our audited financial statements for each covered fiscal year.
(8) While the Company uses numerous financial and non-financial performance measures for the purpose of evaluating performance for the Company’s compensation programs, we determined that market capitalization at each fiscal year-end, as reported in column (i), to be the most important financial performance measure (that is not otherwise required to be disclosed in the table) used to link the Company’s performance to CAP to our PEO and Non-PEO NEO, which we believe is a strong driver in determining the Company’s performance. The Company’s market capitalization is calculated as the product of (i) the total number of outstanding shares of the Company’s voting and non-voting common stock held by non-affiliates of the Company as of the close of market on the last trading day of the Company’s completed fiscal year and (ii) the last reported sales price of the Company’s common stock as of the close of market on such trading day, as reported on the OTCQB® marketplace.
(1) The dollar amounts reported in column (b) represent the amounts of total compensation reported for Mr. Hong, our PEO, for each corresponding fiscal year in the “Total” column of the Summary Compensation Table.
(3) The dollar amounts reported in column (d) represent the amounts of total compensation reported for our only Non-PEO NEO, Ms. Sasaki, for each covered fiscal year in the “Total” column of the Summary Compensation Table for each applicable year.
(6) The cumulative Peer Group TSR amounts reported in column (g) utilizes the S&P 500 Index, which we also utilize in the stock performance graph required by Item 201(e) of Regulation S-K included in our 2024 Annual Report. The comparison assumes $100 was invested in the S&P 500 Index for the measurement period. Historical stock performance is not necessarily indicative of future stock performance.
(2) The dollar amounts reported in column (c) represent the amount of compensation actually paid (“CAP”) to Mr. Hong as computed in accordance with Item 402(v) of Regulation S-K, for each covered fiscal year. The dollar amounts do not reflect the actual amounts of compensation earned or received by or paid to Mr. Hong during the applicable fiscal year. In accordance with the requirements of Item 402(v) of Regulation S-K, the following adjustments were made to Mr. Hong’s total compensation for each covered fiscal year to determine CAP.
Change in | |||||||||||||||||||||
Fair Value as | |||||||||||||||||||||
of Vesting Date | |||||||||||||||||||||
of Stock Awards | |||||||||||||||||||||
and Option Awards | |||||||||||||||||||||
Fair Value at | Change in | Fair Value at | Granted in | ||||||||||||||||||
Fiscal Year End | Fair Value of | Vesting of Stock | Prior Fiscal Years | ||||||||||||||||||
Deduction of | of Outstanding and | Outstanding and | Awards and Option | For Which | |||||||||||||||||
Summary | Stock Awards | Unvested Stock | Unvested Stock Awards | Awards Granted | Applicable Vesting | ||||||||||||||||
Compensation | and Option | Awards and Option | and Option Awards | in Fiscal Year | Conditions Were | ||||||||||||||||
Table Total | Awards | Awards Granted | Granted in Prior | That Vested | Satisfied During | Compensation | |||||||||||||||
Year |
| for PEO |
| for PEO |
| in Fiscal Year |
| Fiscal Years |
| During Fiscal Year |
| Fiscal Year |
| Actually Paid | |||||||
2024 | $ | 1,557,414 | $ | (997,500) | $ | 628,125 | $ | (1,553,844) | $ | - | $ | (243,482) | $ | (609,287) | |||||||
2023 | $ | 2,053,207 | $ | (1,509,475) | $ | 938,120 | $ | 951,141 | $ | - | $ | 1,014,733 | $ | 3,447,726 | |||||||
2022 | $ | 3,204,888 | $ | (2,696,000) | $ | 805,000 | $ | (4,006,402) | $ | 315,000 | $ | (1,257,353) | $ | (3,634,867) | |||||||
(4) The dollar amounts reported in column (e) represent the amounts of CAP to Ms. Sasaki, as computed in accordance with Item 402(v) of Regulation S-K, for each covered fiscal year. The dollar amounts do not reflect the actual amount of compensation earned or received by or paid to Ms. Sasaki during the applicable fiscal year. In accordance with the requirements of Item 402(v) of Regulation S-K, the following adjustments were made to Ms. Sasaki’s total compensation for each covered fiscal year to determine CAP.
Change in | |||||||||||||||||||||
Fair Value as | |||||||||||||||||||||
of Vesting Date | |||||||||||||||||||||
of Stock Awards | |||||||||||||||||||||
and Option Awards | |||||||||||||||||||||
Fair Value at | Change in | Fair Value at | Granted in | ||||||||||||||||||
Deduction of | Fiscal Year End | Fair Value of | Vesting of Stock | Prior Fiscal Years | |||||||||||||||||
Summary | Stock Awards | of Outstanding and | Outstanding and | Awards and Option | For Which | ||||||||||||||||
Compensation | and Option | Unvested Stock | Unvested Stock Awards | Awards Granted | Applicable Vesting | ||||||||||||||||
Table Total | Awards | Awards and Option | and Option Awards | in Fiscal Year | Conditions Were | ||||||||||||||||
for Non-PEO | for Non-PEO | Awards Granted | Granted in Prior | That Vested | Satisfied During | Compensation | |||||||||||||||
Year |
| NEO |
| NEO |
| in Fiscal Year |
| Fiscal Years |
| During Fiscal Year |
| Fiscal Year |
| Actually Paid | |||||||
2024 | $ | 415,858 | $ | (133,000) | $ | 83,750 | $ | (273,656) | $ | - | $ | (33,831) | $ | 59,121 | |||||||
2023 | $ | 583,257 | $ | (302,500) | $ | 188,000 | $ | 198,469 | $ | - | $ | 274,962 | $ | 942,188 | |||||||
2022 | $ | 952,855 | $ | (674,000) | $ | 201,250 | $ | (753,093) | $ | 78,750 | $ | (360,766) | $ | (555,004) | |||||||
For Fiscal 2024, the financial performance measures that the Company considers to have been the most important in linking CAP to our PEO and Non-PEO NEO to the Company’s performance are as follows:
| ● | Market Capitalization |
| ● | Revenue |
| ● | EBITDA |
(8) While the Company uses numerous financial and non-financial performance measures for the purpose of evaluating performance for the Company’s compensation programs, we determined that market capitalization at each fiscal year-end, as reported in column (i), to be the most important financial performance measure (that is not otherwise required to be disclosed in the table) used to link the Company’s performance to CAP to our PEO and Non-PEO NEO, which we believe is a strong driver in determining the Company’s performance. The Company’s market capitalization is calculated as the product of (i) the total number of outstanding shares of the Company’s voting and non-voting common stock held by non-affiliates of the Company as of the close of market on the last trading day of the Company’s completed fiscal year and (ii) the last reported sales price of the Company’s common stock as of the close of market on such trading day, as reported on the OTCQB® marketplace.