Shareholder Report
Dec. 31, 2024
USD ($)
Holding
capitalgroup.com/ETF-literature
(800) 421-4225
.
What were the fund costs for the last year?
(based on a hypothetical $10,000 investment)Fund | Cost of $10,000 Investment | Costs paid as a percentage of a $10,000 investment |
| CGCB | $ 27 | 0.27 % |
Management's discussion of fund performance
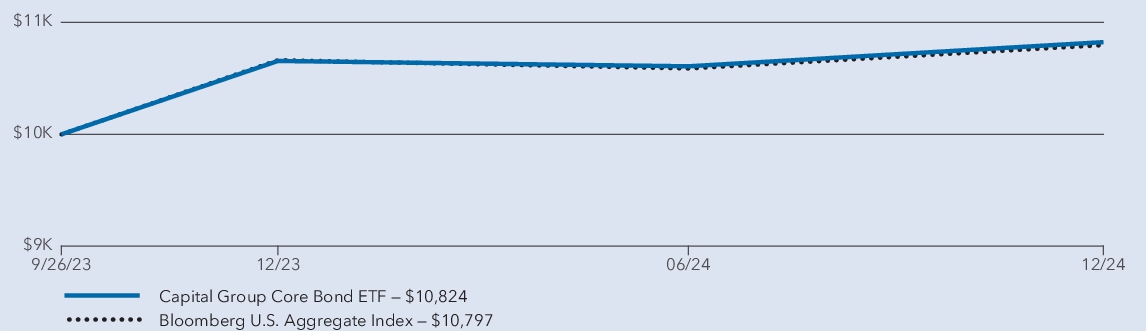
The fund's shares gained 1.58% for the year ended December 31, 2024. These results compare with a 1.25% gain for the Bloomberg U.S. Aggregate Index. For information on returns for additional periods, including the fund lifetime, please refer to
capitalgroup.com/ETF-returns
.What factors influenced results
During the fund’s fiscal year, the U.S. Federal Reserve (Fed) lowered its policy rate by 100 basis points via rate cuts in each of its last three meetings in 2024. While rates at the very front end of the yield curve have fallen since the Fed’s initial cut, longer term yields have increased. The upward trend in long-term yields has reflected the bond market’s expectations for resilient U.S. economic growth, among other factors.
Overall, many of the fund’s sectors contributed positively to relative returns for the portfolio. In particular, sector allocation decisions including overweights to securitized bonds and corporate credit were additive. Security selection within securitized sectors and corporate credit was also positive for relative returns.
Conversely, interest rate exposures, including duration and yield curve positioning, slightly detracted from relative results.
Average annual total returns
1 year | Since inception 1 | |
| Capital Group Core Bond ETF 2 | 1.58 % | 6.47 % |
| Bloomberg U.S. Aggregate Index 3 | 1.25 % | 6.26 % |
1
The fund began investment operations on September 26, 2023.2
Investment results assume all distributions are reinvested and reflect applicable fees and expenses. When applicable, results reflect fee waivers and/or expense reimbursements, without which they would have been lower.3
Results assume all distributions are reinvested. Any market index shown is unmanaged, and therefore, has no expenses. Investors cannot invest directly in an index. Source(s): Bloomberg Index Services Ltd.Key fund statistics
| Fund net assets (in millions) | $ 1,579 |
| Total number of portfolio holdings | 598 |
| Total advisory fees paid (in millions) | $ 2 |
| Portfolio turnover rate including mortgage dollar roll transactions | 354 % |
| Portfolio turnover rate excluding mortgage dollar roll transactions | 125 % |
Portfolio holdings by asset type
(percent of net assets)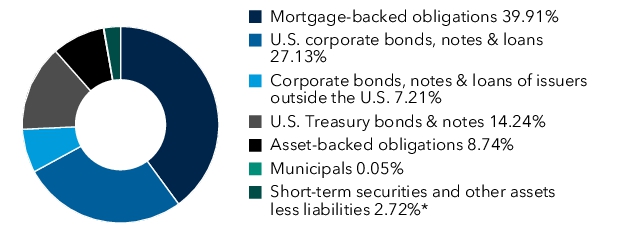
*Includes derivatives.
capitalgroup.com/ETF-literature
(800) 421-4225
.
What were the fund costs for the last year?
(based on a hypothetical $10,000 investment)Fund | Cost of $10,000 Investment | Costs paid as a percentage of a $10,000 investment |
| CGCP | $ 35 | 0.34 % |
Management's discussion of fund performance
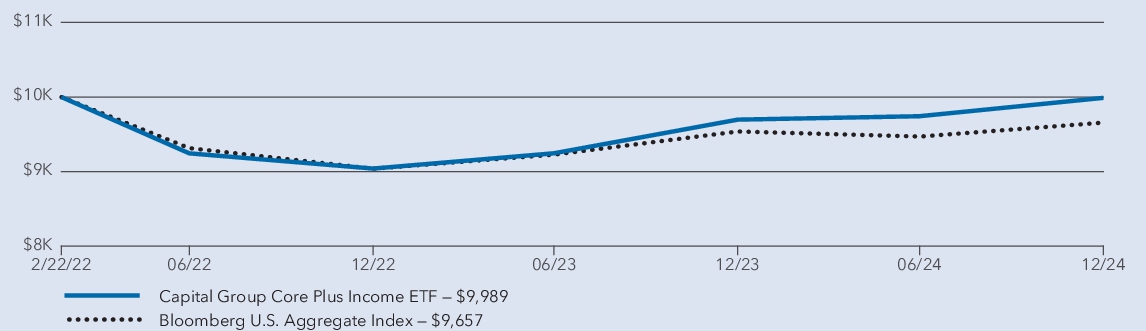
The fund's shares gained 3.01% for the year ended December 31, 2024. These results compare with a 1.25% gain for the Bloomberg U.S. Aggregate Index. For information on returns for additional periods, including the fund lifetime, please refer to
capitalgroup.com/ETF-returns
.What factors influenced results
During the fund’s fiscal year, the U.S. Federal Reserve (Fed) lowered its policy rate three times. Following its first rate cut in September 2024, the Fed made additional rate reductions in November and December. While ultra-short bond yields have fallen significantly since the Fed’s initial cut, longer term yields have increased. The upward trend in long-term yields reflected the bond market’s expectations for resilient U.S. economic growth.
Within the portfolio, sector and security selection proved beneficial. Overweight exposure to high-yield corporates and securitized credit were key positive drivers. High-yield markets were helped by interest rate cuts from the Fed and the anticipation of pro-business policies from the incoming administration. Curve positioning also helped relative returns as the curve steepened over the period.
Conversely, duration exposure hurt relative returns. Being overweight duration towards the end of the year detracted as yields rose across the curve in response to less dovish rhetoric from the Fed and improved economic expectations. Being underweight to investment-grade corporates was a further detractor.
Average annual total returns
1 year | Since inception 1 | |
| Capital Group Core Plus Income ETF 2 | 3.01 % | (0.04 ) % |
| Bloomberg U.S. Aggregate Index 3 | 1.25 % | (1.21 ) % |
1
The fund began investment operations on February 22, 2022.2
Investment results assume all distributions are reinvested and reflect applicable fees
and expenses. When applicable, results reflect fee waivers and/or expense reimbursements, without which they would have been lower.3
Results assume all distributions are reinvested. Any market index shown is unmanaged, and therefore, has no expenses. Investors cannot invest directly in an index. Source(s): Bloomberg Index Services Ltd.Key fund statistics
| Fund net assets (in millions) | $ 3,985 |
| Total number of portfolio holdings | 1,155 |
| Total advisory fees paid (in millions) | $ 9 |
| Portfolio turnover rate including mortgage dollar roll transactions | 420 % |
| Portfolio turnover rate excluding mortgage dollar roll transactions | 83 % |
Po
(percent of net assets)rtfol
io holdings by asset type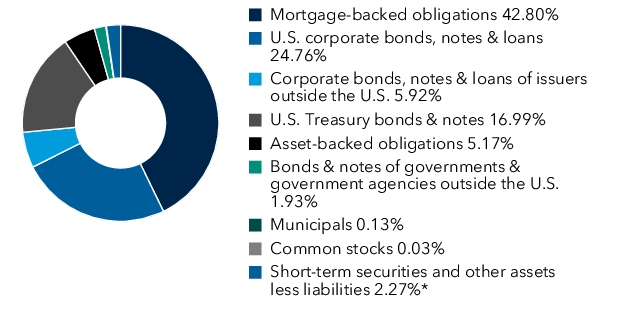
*Includes derivatives.
capitalgroup.com/ETF-literature
(800) 421-4225
.
What were the fund costs for the period?
(based on a hypothetical
$10
,000 investment)Fund | Cost of $10,000 Investment | Costs paid as a percentage of a $10,000 investment |
| CGIB | $ 24* | 0.45 % † |
*
Based on operations for the period from June 25, 2024 to December 31, 2024. Expenses for the full year wo
uld be higher.†
Annualized.Management's discussion of fund performance
The fund's shares gained 2.79% for the period from June 25, 2024 to December 31, 2024. These results compare with a 3.95% gain for the Bloomberg Global Aggregate ex-USD (USD Hedged) Index. For information on returns for additional periods, including the fund lifetime, please refer to
capitalgroup.com/ETF-returns
.What factors influenced results
During the fund’s fiscal year, the global bond market experienced record-setting inflows as investors poured assets into developed and emerging markets bond funds, seeking to lock in some of the highest starting yields in decades. Additionally, easing inflation across many global regions enabled central banks to lower interest rates, offering investors the potential for price appreciation.
The fund’s off-benchmark allocation to high-yield corporate and emerging markets sovereign bonds had a positive impact on returns. In addition, active positions in the Turkish lira funded from a negative exposure to the Chinese renminbi helped the fund’s results. In credit, the fund’s greater-than-benchmark allocation to Commonwealth of Australia and state of New South Wales Australia bonds contributed positively to returns.
One of the primary detractors from results during the fiscal year was the fund’s lack of exposure to the Chinese government bond market. Additionally, the fund’s greater-than-benchmark allocation to the asset-backed securities (ABS) and commercial mortgage-backed securities (CMBS) markets weighed on comparative returns, as did its off-benchmark allocation to Brazilian interest rates. Finally, the fund’s less-than-benchmark allocation to investment-grade corporate bonds slightly detracted from comparative results.
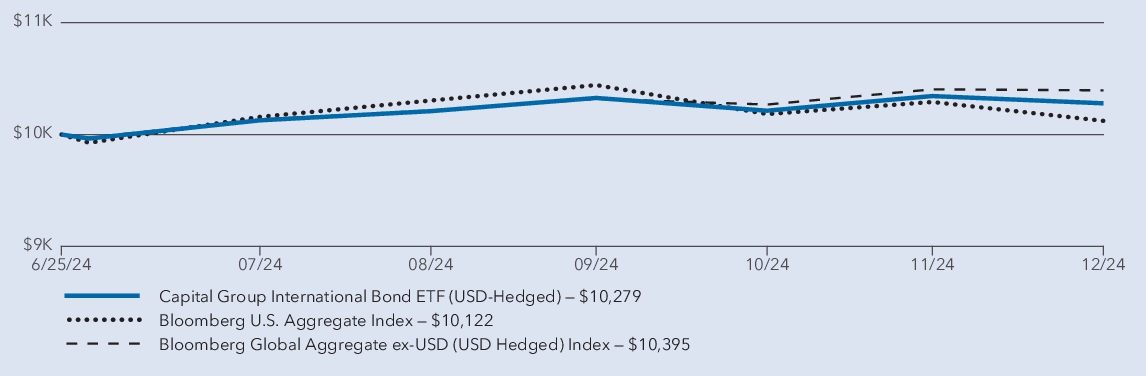
Average annual total returns
Since inception 1 | |
| Capital Group International Bond ETF (USD-Hedged) 2 | 2.79 % |
| Bloomberg U.S. Aggregate Index 3 | 1.22 % |
| Bloomberg Global Aggregate ex-USD (USD Hedged) Index 3 | 3.95 % |
1
The fund began investment operations on June 25, 2024.2
Investment results assume all distributions are reinvested and reflect applicable fees and expenses. When applicable, results reflect fee waivers and/or expense reimbursements, without which they would have been lower.3
Results assume all distributions are reinvested. Any market index shown is unmanaged, and therefore, has no expenses. Investors cannot invest directly in an index. Source(s): Bloomberg Index Services Ltd.Key fund statistics
| Fund net assets (in thousands) | $ 50,053 |
| Total number of portfolio holdings | 167 |
| Total advisory fees paid (in thousands) | $ 117 |
| Portfolio turnover rate including mortgage dollar roll transactions | 185 % |
| Portfolio turnover rate excluding mortgage dollar roll transactions | 118 % |
Portfolio holdings by asset type
(percent of net assets)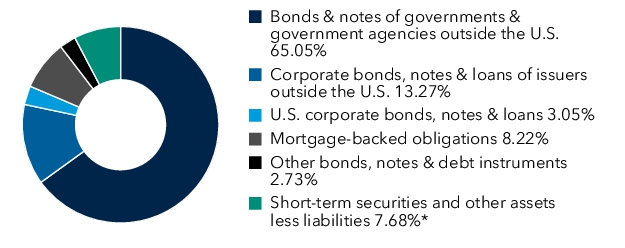
*Includes derivatives.
capitalgroup.com/ETF-literature
(800) 421-4225
.
What were the fund costs for the last year?
(based on a hypothetical $10
,000 investment)Fund | Cost of $10,000 Investment | Costs paid as a percentage of a $10,000 investment |
| CGMU | $ 27 | 0.27 % |
Management's discussion of fund performance
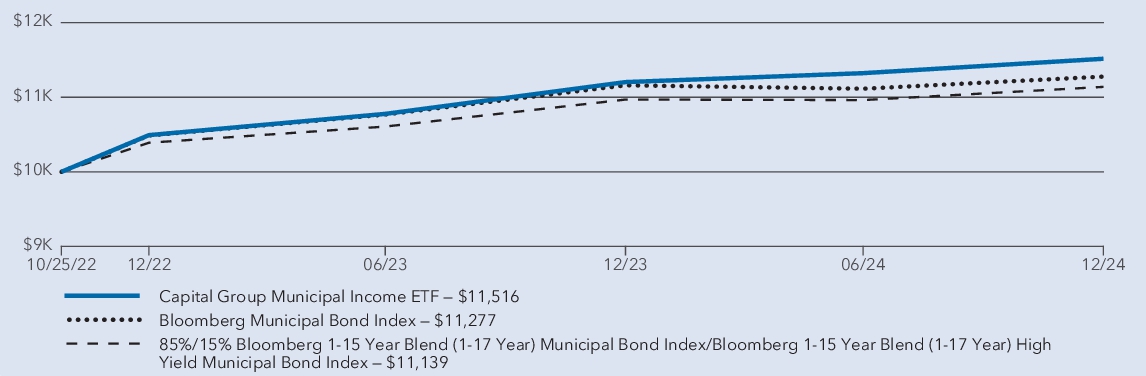
The fund's shares gained 2.80% for the year ended December 31, 2024. These results compare with a 1.55% gain for the 85%/15% Bloomberg 1-15 Year Blend (1-17 Year) Municipal Bond Index/Bloomberg 1-15 Year Blend (1-17 Year) High Yield Municipal Bond Index. For information on returns for additional periods, including the fund lifetime, please refer to .
capitalgroup.com/ETF-returns
What factors influenced results
In September, the U.S. Federal Reserve (Fed) cut rates for the first time since 2020 and followed with additional reductions in November and December. While shorter term bond yields fell significantly since the Fed’s initial cut, longer term yields rose. Municipal bond yields began at elevated levels in 2024 and continued to rise throughout the year.
During the period, each of the fund’s sectors added positive returns to the overall portfolio, with corporates, housing and health care bonds being particularly additive. Holdings in escrowed, special tax and education bonds were also positive, though below the portfolio’s overall return. Curve positioning further helped the fund’s absolute returns.
Conversely, holdings in non-general obligation governmental, tobacco and general obligation bonds detracted from the broader portfolio’s return. Duration positioning also dampened the fund’s overall results.
Average annual t
otal
returns1 year | Since inception 1 | |
| Capital Group Municipal Income ETF 2 | 2.80 % | 6.68 % |
| Bloomberg Municipal Bond Index 3 | 1.05 % | 5.66 % |
| 1.55 % | 5.06 % |
Effective July 24, 2024, the fund's primary benchmark changed from the 85%/15% Bloomberg 1-15 Year Blend (1-17 Year) Municipal Bond Index/Bloomberg 1-15 Year Blend (1-17 Year) High Yield Municipal Bond Index (the "Previous Primary Benchmark") to the Bloomberg Municipal Bond Index, a broad-based index that represents the overall applicable securities market, as required by the SEC. The Previous Primary Benchmark provides a means to compare the fund's results to a benchmark that the investment adviser believes is more representative of the fund's investment universe. There is no change in the fund's investment strategies as a result of the benchmark change.
1
The fund began investment operations on October 25, 2022.2
Investment results assume all distributions are reinvested and reflect applicable fees and expenses. When applicable, results reflect fee waivers and/or expense reimbursements, without which they would have been lower.3
Results assume all distributions are reinvested. Any market index shown
is unmanaged, and therefore, has no expenses. Investors cannot invest directly in an index. Source(s): Bloomberg Index Services Ltd.Key fund statistics
| Fund net assets (in millions) | $ 2,666 |
| Total number of portfolio holdings | 1,370 |
| Total advisory fees paid (in millions) | $ 4 |
| Portfolio turnover rate | 29 % |
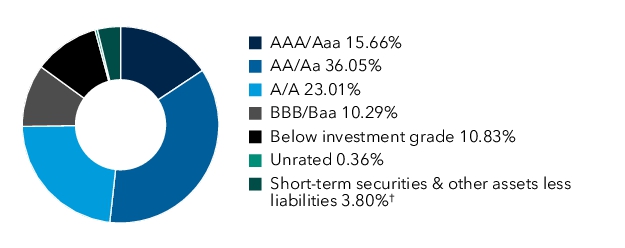
Portfolio quality summary
*
*
Bond ratings, which typically range from AAA/Aaa (highest) to D (lowest), are assigned by credit rating agencies such as Standard & Poor’s, Moody’s and/or Fitch as an indication of an issuer’s creditworthiness. In assigning a credit rating to a security, the fund looks specifically to the ratings assigned to the issuer of the security by Standard & Poor’s, Moody’s and/or Fitch. If agency ratings differ, the security will be considered to have received the highest of those ratings, consistent with the fund’s investment policies.†
Includes derivatives.capitalgroup.com/ETF-literature
(800) 421-4225
.
What were the fund costs for the period?
(based on a hypothetical $10,000 investment)Fund | Cost of $10,000 Investment | Costs paid as a percentage of a $10,000 investment |
| CGHM | $ 18* | 0.34 % † |
*
Based on operations for the period from June 25, 2024 to December 31, 2024. Expenses for the full year would be higher.†
Annualized.Management's discussion of fund performa
nc
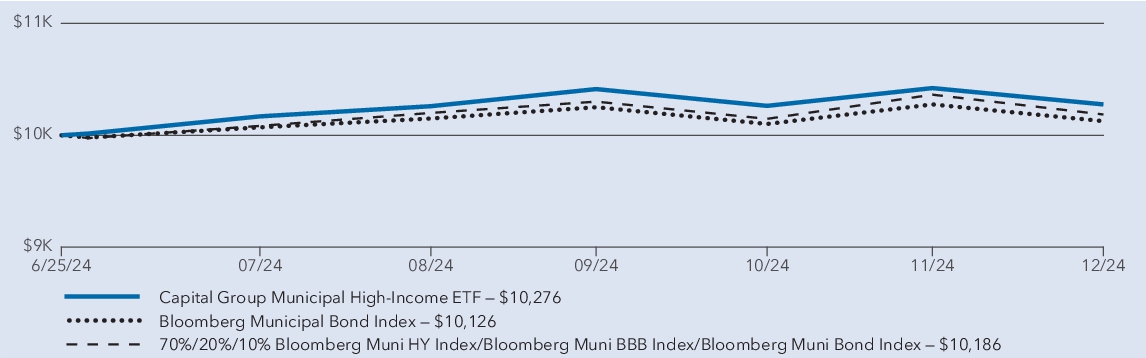
eThe fund's shares gained 2.76% for the period from June 25, 2024 to December 31, 2024. These results compare with a 1.86% gain for the 70%/20%/10% Bloomberg Muni HY Index/Bloomberg Muni BBB Index/Bloomberg Muni Bond Index. For information on returns for additional periods, including the fund lifetime, please refer to
capitalgroup.com/ETF-returns
.What factors influenced results
In September, the U.S. Federal Reserve (Fed) cut rates for the first time since 2020 and followed with additional reductions in November and December. While shorter term bond yields fell significantly since the Fed’s initial cut, longer term yields rose. Municipal bond yields began at elevated levels in 2024 and continued to rise throughout the year.
The fund’s holdings in the non-general obligation governmental debt and transportation bonds saw positive returns surpassing those of the overall portfolio. Curve positioning further helped the fund’s absolute returns. Select overweight positions, which posted strong results, were additive to results.
Conversely, investments in the tobacco, housing and escrowed sectors were the notable detractors to overall results. Also, duration positioning negatively impacted the overall results. Additionally, while security selection was a slight positive for results, sector/industry selection was a meaningful negative detractor to absolute returns.
Average annual total returns
Since inception 1 | |
| Capital Group Municipal High-Income ETF 2 | 2.76 % |
| Bloomberg Municipal Bond Index 3 | 1.26 % |
| 70%/20%/10% Bloomberg Muni HY Index/Bloomberg Muni BBB Index/Bloomberg Muni Bond Index 3 | 1.86 % |
1
The fund began investment operations on June 25, 2024.2
Investment results assume all distributions are reinvested and reflect applicab
le fees and expenses. When applicable, results reflect fee waivers and/or expense reimbursements, without which they would have been lower.3
Results assume all distributions are reinvested. Any market index shown is unmanaged, and therefore, has no expenses. Investors cannot invest directly in an index. Source(s): Bloomberg Index Services Ltd.Key fund statistics
| Fund net assets (in thousands) | $ 84,552 |
| Total number of portfolio holdings | 320 |
| Total advisory fees paid (in thousands) | $ 99 |
| Portfolio turnover rate | 25 % |
Portfolio qu
al
ity summary*
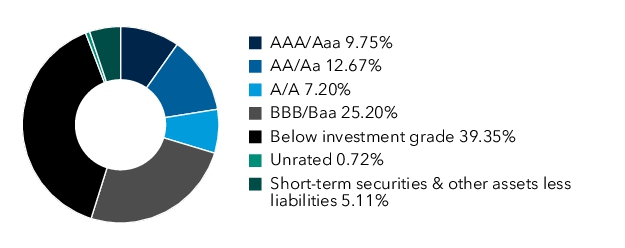
*
Bond ratings, which typically range from AAA/Aaa (highest) to D (lowest), are assigned by credit rating agencies such as Standard & Poor’s, Moody’s and/or Fitch as an indication of an issuer’s creditworthiness. In assigning a credit rating to a security, the fund looks specifically to the ratings assigned to the issuer of the security by Standard & Poor’s, Moody’s and/or Fitch. If agency ratings differ, the security will be considered to have received the highest of those ratings, consistent with the fund’s investment policies.capitalgroup.com/ETF-literature
(800) 421-4225
.
What were the fund costs for the last y
(based on a hypothetical $10,000 investment)ea
r?Fund | Cost of $10,000 Investment | Costs paid as a percentage of a $10,000 investment |
| CGSD | $ 26 | 0.25 % |
Management's discussion of fund performance
The fund's shares gained 5.51% for the year ended December 31, 2024. These results compare with a 4.36% gain for the Bloomberg U.S. Government/Credit (1-3 years) Index. For information on returns for additional periods, including the fund lifetime, please refer to
capitalgroup.com/ETF-returns
.What factors influenced results
During the fund’s fiscal year, the U.S. Federal Reserve (Fed) lowered its policy rate three times. Following its first rate cut in September 2024, the Fed made additional rate reductions in November and December. While ultra-short bond yields have fallen significantly since the Fed’s initial cut, longer term yields have increased. The upward trend in long-term yields reflected the bond market’s expectations for stronger U.S. economic growth.
Within the fund, credit sectors contributed positively to relative results, with securitized credit posting the strongest returns. The fund’s holdings in asset-backed securities and commercial mortgage-backed securities were particularly additive to relative results during the period. Residential mortgage-backed securities and investment-grade (BBB/Baa and above) corporate bonds also contributed. Duration and curve positioning both helped the fund’s returns.
The negative carry, or cost, of using futures to manage duration and cur
v
e positioning slightly offset positive relative returns. Exposure and selection within investment-grade financials also slightly detracted.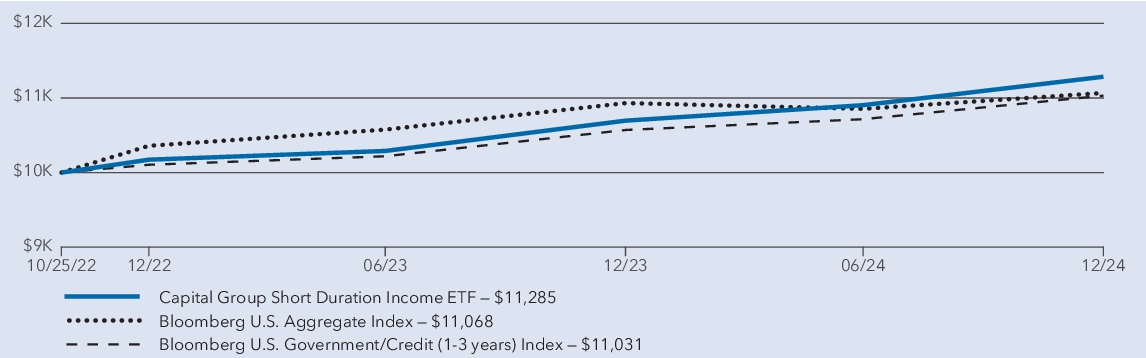
Average annual total returns
1 year | Since inception 1 | |
| Capital Group Short Duration Income ETF 2 | 5.51 % | 5.69 % |
| Bloomberg U.S. Aggregate Index 3 | 1.25 % | 4.76 % |
| Bloomberg U.S. Government/Credit (1-3 years) Index 3 | 4.36 % | 4.60 % |
Effective July 24, 2024, the fund's primary benchmark changed from the Bloomberg U.S. Government/Credit (1-3 years) Index (the "Previous Primary Benchmark") to the Bloomberg U.S. Aggregate Index, a broad-based index that represents the overall applicable securities market, as required by the SEC. The Previous Primary Benchmark provides a means to compare the fund's results to a benchmark that the investment adviser believes is more representative of the fund's investment universe. There is no change in the fund's investment strategies as a result of the benchmark change.
1
The fund began investment operations on October 25, 2022.
2
Investment results assume all distributions are reinvested and reflect applicable fees and expenses. When applicable, results reflect fee waivers and/or expense reimbursements, without which they would have been lower.3
Results assume all distributions are reinvested. Any market index shown is unmanaged, and therefore, has no expenses. Investors cannot invest directly in an index. Source(s): Bloomberg Index Services Ltd.Key fund statistics
| Fund net assets (in millio n s) | $ 874 |
| Total number of portfolio holdings | 771 |
| Total advisory fees paid (in millions) | $ 1 |
| Portfolio turnover rate including mortgage dollar roll transactions | 192 % |
| Portfolio turnover rate exclu din g mortgage dollar roll transactions | 42 % |
Portfolio holdings by asset type
(percent of ne
t assets)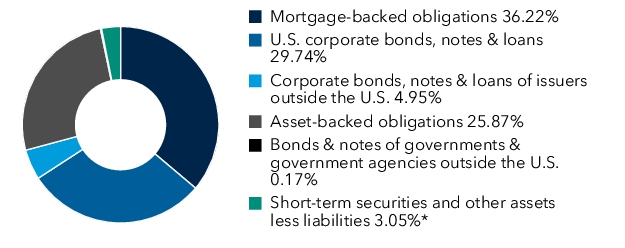
*Includes derivatives.
capitalgroup.com/ETF-literature
(800) 421-4225
.
What were the fund costs for the last year?
(based on a hypothetical $10,000 investment)Fund | Cost of $10,000 Investment | Costs paid as a percentage of a $10,000 investment |
| CGSM | $ 25 | 0.25 % |
Management's discussion of fund performance
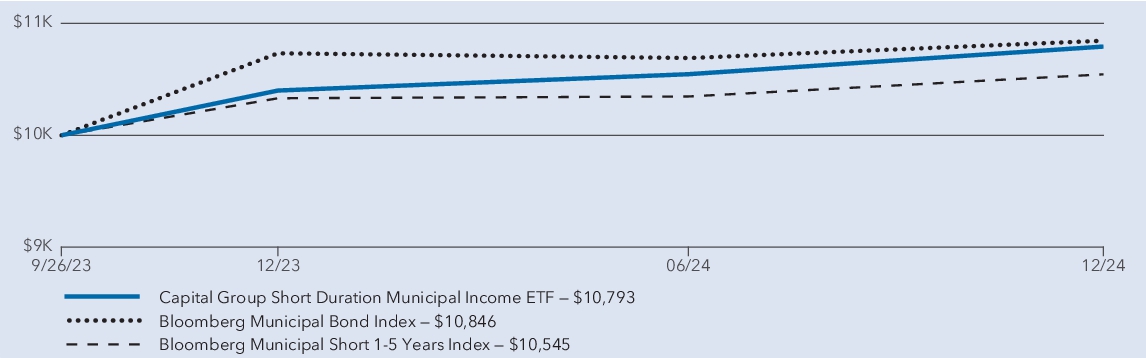
The fund's shares gained 3.77% for the year ended December 31, 2024. These results compare with a 2.07% gain for the Bloomberg Municipal Short 1-5 Years Index. For information on returns for additional periods, including the fund lifetime, please refer to .
capitalgroup.com/ETF-returns
What factors influenced results
In September, the U.S. Federal Reserve (Fed) cut rates for the first time since 2020 and followed with additional reductions in November and December. While shorter term bond yields fell significantly since the Fed’s initial cut, longer term yields rose. Municipal bond yields began at elevated levels in 2024 and continued to rise throughout the year.
During the period, each of the fund’s sectors added positive returns to the overall portfolio, with holdings in health care, corporates and special tax bonds being particularly additive. Transportation and housing bonds were also positive, though below the portfolio’s overall return. Curve positioning further helped the fund’s absolute returns.
Conversely, holdings in education and non-general obligation governmental bonds detracted from the broader portfolio’s return.
Average annual total returns
1 year | Since inception 1 | |
| Capital Group Short Duration Municipal Income ETF 2 | 3.77 % | 7.93 % |
| Bloomberg Municipal Bond Index 3 | 1.05 % | 6.64 % |
| Bloomberg Municipal Short 1-5 Years Index 3 | 2.07 % | 4.29 % |
Effective July 24, 2024, the fund's primary benchmark changed from the Bloomberg Municipal Short 1-5 Years Index (the "Previous Primary Benchmark") to the Bloomberg Municipal Bond Index, a
br
oad-based index that represents the overall applicable securities market, as required by the SEC. The Previous Primary Benchmark provides a means to compare the fund's results to a benchmark that the investment adviser believes is more representative of the fund's investment universe. There is no change in the fund's investment strategies as a result of the benchmark change.1
The fund began investment operations on September 26, 2023.2
Investment results assume all distributions are reinvested and reflect applicable fees and expenses. When applicable, results reflect fee waivers and/or expense reimbursements, without which they would have been lower.3
Results assume all distributions are reinvested. Any market index shown is unmanaged
, and therefore, has no expenses. Investors cannot invest directly in an index. Source(s): Bloomberg Index Services Ltd.br
oad-based index that represents the overall applicable securities market, as required by the SEC.
Key fund statistics
| Fund net assets (in thousands) | $ 553,877 |
| Total number of portfolio holdings | 508 |
| Total advisory fees paid (in thousands) | $ 615 |
| Portfolio turnover rate | 54 % |
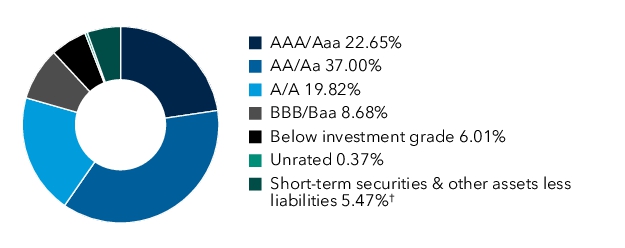
Portfolio quality summary
*
*
Bond ratings, which typically range from AAA/Aaa (highest) to D (lowest), are assigned by credit rating agencies such as Standard & Poor’s, Moody’s and/or Fitch as an indication of an issuer’s creditworthiness. In assigning a credit rating to a security, the fund looks specifically to the ratings assigned to the issuer of the security by Standard & Poor’s, Moody’s and/or Fitch. If agency ratings differ, the security will be considered to have received the highest of those ratings, consistent with the fund’s investment policies.†
Includes derivatives.capitalgroup.com/ETF-literature
(800) 421-4225
.
What were the fund costs for the period?
(based on a hypothetical $10,000 investment)Fund | Cost of $10,000 Investment | Costs paid as a percentage of a $10,000 investment |
| CGUI | $ 9* | 0.18 % † |
*
Based on operation
s for the period from June 25, 2024 to December 31, 2024. Expenses for the full
year would be higher.†
Annualized.Management's discussion of fund performance
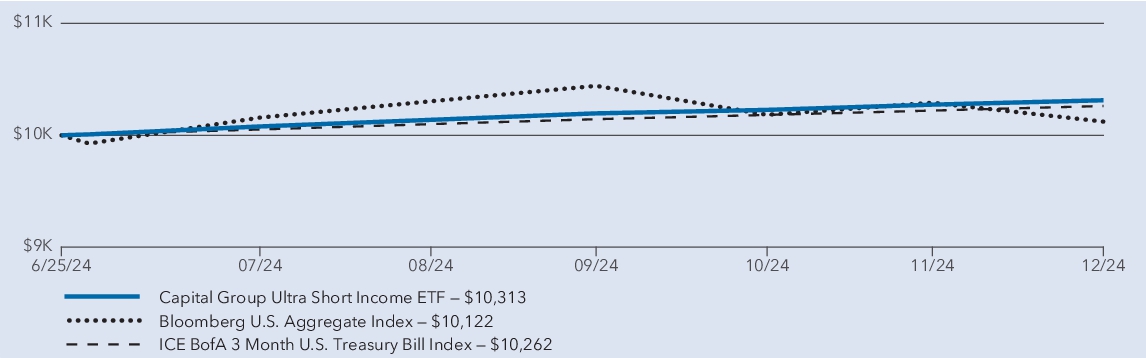
The fund's shares gained 3.14% for the period from June 25, 2024 to December 31, 2024. These results compare with a 2.62% gain for the ICE BofA 3 Month U.S. Treasury Bill Index. For information on returns for additional periods, including the fund lifetime, please refer to
capitalgroup.com/ETF-returns
.What factors influenced results
During the fund’s fiscal year, the U.S. Federal Reserve (Fed) lowered its policy rate three times. Following its first rate cut in September 2024, the Fed made additional rate reductions in November and December. While ultra-short bond yields have fallen significantly since the Fed’s initial cut, longer term yields have increased. The upward trend in long-term yields reflected the bond market’s expectations for stronger U.S. economic growth.
Securitized bonds and investment-grade corporate bonds added to the fund’s positive returns for the six months since it launched. The fund’s holdings in asset-backed securities and both financial and industrial investment-grade corporate bonds were particularly additive to results during the period. Duration positioning further aided the fund’s relative returns.
Exposure to longer maturity bonds detracted from the portfolio’s relative results. Commercial paper holdings had no impact on returns.
Average annual total returns
Since inception 1 | |
| Capital Group Ultra Short Income ETF 2 | 3.14 % |
| Bloomberg U.S. Aggregate Index 3 | 1.22 % |
| ICE BofA 3 Month U.S. Treasury Bill Index 3 | 2.62 % |
1
The fund began investment operations on June 25, 2024.2
Investment results assume all distributions are reinvested and reflect applicable fees and expenses. When applicable, results reflect fee waivers and/or expense reimbursements, without which they would have been lower.3
Results assume all distributions are reinvested. Any market index shown is unmanaged, and therefore, has no expenses. Investors cannot invest directly in an index. Source(s): Bloomberg Index Services Ltd. and ICE Data Indices, LLC.Key fund statistics
| Fund net assets (in thousands) | $ 34,669 |
| Total number of portfolio holdings | 194 |
| Total advisory fees paid (in thousands) | $ 30 |
| Portfolio turnover rate | 26 % |
Portfolio holdings by asset type
(percent of net assets)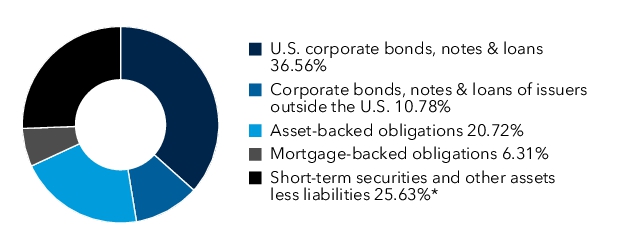
*Includes derivatives.
capitalgroup.com/ETF-literature
(800) 421-4225
.
What were the fund costs for the last year?
(based on a hypothetical $10,000 investment)Fund | Cost of $10,000 Investment | Costs paid as a percentage of a $10,000 investment |
| CGMS | $ 40 | 0.39 % |
Management's discussion of fund performance
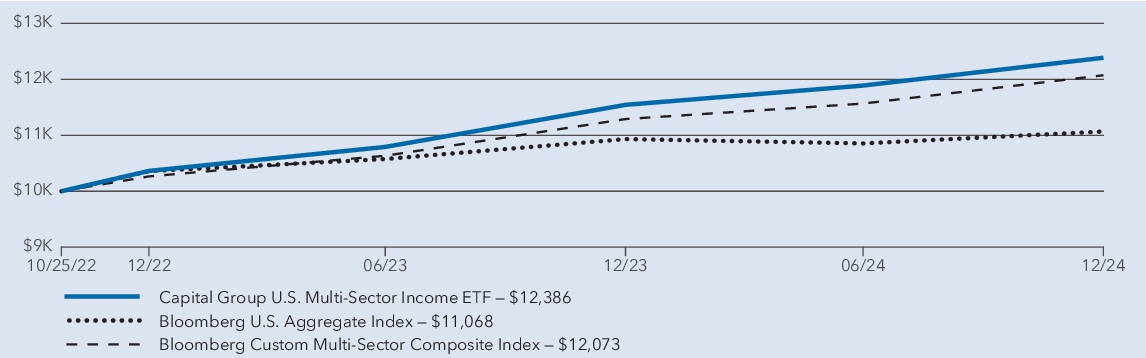
The fund's shares gained 7.29% for the year ended December 31, 2024. These results compare with a 1.25% gain for the Bloomberg U.S. Aggregate Index. For information on returns for additional periods, including the fund lifetime, please refer to
capitalgroup.com/ETF-returns
.What factors influenced results
The U.S. Federal Reserve (Fed) lowered its monetary policy rate three times during the fund’s fiscal year. Following rate cuts in September and November, the Fed reduced rates again in December 2024. While shorter term bond yields fell significantly since the Fed’s initial cut, longer term yields rose. This upward trend in longer term yields reflected the bond market’s anticipation of stronger U.S. economic growth.
Within the fund, each of the sectors contributed positively to overall returns. The fund’s position in opportunistic bonds and securitized debt were particularly additive to absolute results during the period. Likewise, returns for most high-yield corporate bonds surpassed those of the overall portfolio. From a ratings perspective, returns for high-yield bonds outpaced those of the overall portfolio except for BB/Ba-rated bonds.
Conversely, holdings in investment-grade corporate bonds, while still positive, detracted somewhat from the broader portfolio’s return. Additionally, exposure to high-yield derivatives negatively impacted absolute returns.
Average annual total returns
1 year | Since inception 1 | |
| Capital Group U.S. Multi-Sector Income ETF 2 | 7.29 % | 10.29 % |
| Bloomberg U.S. Aggregate Index 3 | 1.25 % | 4.76 % |
| Bloomberg Custom Multi-Sector Composite Index 3 | 6.93 % | 9.23 % |
1
The fund began investment operations on October 25, 2022.2
Investment results assume all distributions are reinvested and reflect applicable fees and expenses. When applicable, results reflect fee waivers and/or expense reimbursements, without which they would have been lower.3
Results assume all distributions are reinvested. Any market index shown is unmanaged, and therefore, has no expenses. Investors cannot invest directly in an index. Source(s): Bloomberg Index Services Ltd.Key fund statistics
| Fund net assets (in millions) | $ 1,951 |
| Total number of portfolio holdings | 1,139 |
| Total advisory fees paid (in millions) | $ 4 |
| Portfolio turnover rate including mortgage dollar roll transactions | 41 % |
| Portfolio turnover rate excluding mortgage dollar roll transactions | 39 % |
Portfolio holding
(percent of net assets)s
by asset type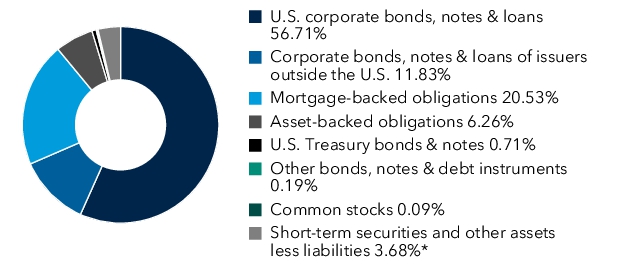
*Includes derivatives.
| [1] | Based on operations for the period from June 25, 2024 to December 31, 2024. Expenses for the full year would be higher. |
| [2] | Annualized. |