http://fasb.org/us-gaap/2025#AccountingStandardsUpdate202307Memberhttp://fasb.org/us-gaap/2025#RealEstateInvestmentPropertyNethttp://fasb.org/us-gaap/2025#RealEstateInvestmentPropertyNethttp://fasb.org/us-gaap/2025#SecuredOvernightFinancingRateSofrOvernightIndexSwapRateMemberhttp://fasb.org/us-gaap/2025#SecuredOvernightFinancingRateSofrOvernightIndexSwapRateMemberhttp://fasb.org/us-gaap/2025#SecuredOvernightFinancingRateSofrOvernightIndexSwapRateMemberhttp://fasb.org/us-gaap/2025#SecuredOvernightFinancingRateSofrMemberhttp://fasb.org/us-gaap/2025#RevenueFromContractWithCustomerExcludingAssessedTaxhttp://fasb.org/us-gaap/2025#RevenueFromContractWithCustomerExcludingAssessedTaxhttp://fasb.org/us-gaap/2025#OtherLiabilitieshttp://fasb.org/us-gaap/2025#OtherLiabilitieshttp://fasb.org/srt/2025#ChiefExecutiveOfficerMember2019-12-312019-12-312019-12-312019-12-312019-12-312019-12-312019-12-312020-12-312020-12-312020-12-312020-12-312020-12-312020-12-312020-12-312020-12-312020-12-312020-12-312020-12-312020-12-312020-12-312020-12-312020-12-312020-12-312020-12-312020-12-312020-12-312020-12-312020-12-312020-12-312020-12-312020-12-312020-12-312020-12-312020-12-312020-12-312020-12-312020-12-312020-12-312020-12-312020-12-312020-12-312020-12-312020-12-312020-12-312020-12-312021-12-312021-12-312021-12-312021-12-312021-12-312021-12-312021-12-312021-12-312021-12-312021-12-312021-12-312021-12-312021-12-312021-12-312021-12-312021-12-312021-12-312021-12-312021-12-312021-12-312021-12-312021-12-312021-12-312021-12-312021-12-312021-12-312021-12-312021-12-312021-12-312021-12-312021-12-312021-12-312021-12-312021-12-312021-12-312021-12-312021-12-312021-12-312021-12-312021-12-312021-12-312021-12-312021-12-312021-12-312021-12-312021-12-312021-12-312021-12-312021-12-312021-12-312021-12-312021-12-312021-12-312021-12-312021-12-312021-12-312021-12-312021-12-312021-12-312021-12-312021-12-312021-12-312021-12-312021-12-312021-12-312021-12-312021-12-312021-12-312021-12-312021-12-312021-12-312021-12-312021-12-312021-12-312021-12-312021-12-312021-12-312021-12-312021-12-312021-12-312021-12-312021-12-312021-12-312021-12-312021-12-312021-12-312021-12-312021-12-312021-12-312021-12-312021-12-312021-12-312021-12-312021-12-312021-12-312021-12-312021-12-312021-12-312021-12-312021-12-312021-12-312021-12-312022-12-312022-12-312022-12-312022-12-312022-12-312022-12-312022-12-312022-12-312022-12-312022-12-312022-12-312022-12-312022-12-312022-12-312022-12-312022-12-312022-12-312022-12-312022-12-312022-12-312022-12-312022-12-312022-12-312022-12-312022-12-312022-12-312022-12-312022-12-312022-12-312022-12-312022-12-312022-12-312022-12-312022-12-312022-12-312022-12-312022-12-312022-12-312022-12-312022-12-312022-12-312022-12-312022-12-312022-12-312022-12-312022-12-312022-12-312022-12-312022-12-312022-12-312020-12-312020-12-312021-12-312021-12-312021-12-312021-12-312021-12-312022-12-312021-12-312022-12-312022-12-312022-12-312022-12-312019-12-312019-12-312020-12-312020-12-312021-12-312021-12-312022-12-312019-12-312019-12-312019-12-312020-12-312021-12-312021-12-312022-12-312021-12-312021-12-312021-12-312021-12-312021-12-312021-12-312021-12-312021-12-312021-12-312022-12-312021-12-312021-12-312021-12-312021-12-312021-12-312021-12-312021-12-312021-12-312021-12-312021-12-31
Exhibit 99.1
EXPLANATORY NOTE
Starwood Real Estate Income Trust, Inc. is filing this exhibit (this “Exhibit”) to the Current Report on Form 8-K/A (this “Form 8-K/A”) solely to recast reportable segment financial information and related disclosures included in the Company’s Annual Report on Form 10-K for the fiscal year ended December 31, 2024, filed with the Securities and Exchange Commission on March 21, 2025 (the “2024 Form 10-K”), to reflect changes implemented during the first quarter of 2025, as described in the Company’s Quarterly Report on Form 10-Q for the period ended March 31, 2025 (the “2025 Form 10-Q”). The information in this Exhibit is not an amendment to or restatement of the 2024 Form 10-K.
ITEM 1. BUSINESS
References herein to “Starwood Real Estate Income Trust,” “Company,” “we,” “us,” or “our” refer to Starwood Real Estate Income Trust, Inc., a Maryland corporation, and its subsidiaries unless the context specifically requires otherwise.
General Description of Business and Operations
We were formed on June 22, 2017 as a Maryland corporation and elected to be taxed as a real estate investment trust (“REIT”) for U.S. federal income tax purposes commencing with our taxable year ended December 31, 2019. We are organized to invest primarily in stabilized, income-oriented commercial real estate and debt secured by commercial real estate. Our portfolio is principally comprised of properties located in the United States and is diversified on a global basis through investments in properties outside of the United States, with a focus on Europe. To a lesser extent, we also invest in real estate debt, which could include loans secured by real estate and real estate-related securities. We are the sole general partner of Starwood REIT Operating Partnership, L.P., a Delaware limited partnership (the “Operating Partnership”). Starwood REIT Special Limited Partner, L.L.C. (the “Special Limited Partner”), a wholly owned subsidiary of Starwood Capital Group Holdings, L.P. (the “Sponsor”), owns a special limited partner interest in the Operating Partnership. Substantially all of our business is conducted through the Operating Partnership. We and the Operating Partnership are externally managed by the Advisor, an affiliate of the Sponsor.
Our board of directors has at all times had oversight and policy-making authority over us, including responsibility for governance, financial controls, compliance and disclosure with respect to the Operating Partnership. Pursuant to an advisory agreement among the Advisor, the Operating Partnership and us (the “Advisory Agreement”), we have delegated to the Advisor the authority to source, evaluate and monitor our investment opportunities and make decisions related to the acquisition, management, financing and disposition of our assets, in accordance with our investment objectives, guidelines, policies and limitations, subject to oversight by our board of directors.
As of December 31, 2024, we owned 461 consolidated real estate properties, 933 single-family rental units, two investments in unconsolidated real-estate ventures and one real estate debt investment. As of January 1, 2025, we operate in five reportable segments: Multifamily, Industrial, Office, Other and Investments in Real Estate Debt. Effective January 1, 2022, the Hospitality and Medical Office segments were combined within the Other segment and previous amounts have been recasted to conform with current period presentation. Effective January 1, 2025, the Single-Family Rental properties and Self-Storage properties segments were combined within the Other properties segment and previous amounts have been recasted to conform with current period presentation.
On December 27, 2017, we commenced our initial public offering of up to $5.0 billion in shares of common stock. On June 2, 2021, our initial public offering terminated and we commenced a follow-on public offering of up to $10.0 billion in shares of common stock. On August 10, 2022, our follow-on public offering terminated and we commenced our third public offering of up to $18.0 billion in shares of common stock, consisting of up to $16.0 billion in shares in our primary offering and up to $2.0 billion in shares pursuant to our distribution reinvestment plan. We intend to continue selling shares in our third public offering on a monthly basis.
As of March 21, 2025, we had received net proceeds of $14.1 billion from the sale of our common stock through our public offerings. We have contributed the net proceeds from our public offerings to the Operating Partnership in exchange for a corresponding number of Class T, Class S, Class D and Class I units. The Operating Partnership has primarily used the net proceeds to make investments in real estate, real estate debt and real estate-related securities.
In April 2024, we launched a program (the “DST Program”) to raise capital, through the Operating Partnership, through private placement offerings exempt from registration under the Securities Act of 1933, as amended (the “Securities Act”), by selling beneficial interests (the “DST Interests”) in specific Delaware statutory trusts (“DSTs”) holding real properties (the “DST Properties”). We expect that the DST Program will give us the opportunity to expand and diversify our capital-raising strategies by offering what we believe to be an attractive investment product for investors that may be seeking like-kind replacement properties to
complete tax-deferred exchange transactions under Section 1031 of the Internal Revenue Code (the “Code”). Affiliates of the Advisor will receive fees in connection with the sale of the DST Interests and the management of the DSTs. We intend to use the net offering proceeds from the DST Program to make investments in accordance with our investment strategy and policies, reduce our borrowings, repay indebtedness, fund the repurchase of shares under our share repurchase plan and for other corporate purposes. As of March 21, 2025, we have raised approximately $37.0 million in gross offering proceeds through the DST Program.
Investment Objectives
Our investment objectives are to invest in assets that will enable us to:
•provide current income in the form of regular, stable cash distributions to achieve an attractive distribution yield;
•preserve and protect invested capital;
•realize appreciation in NAV from proactive investment management and asset management; and
•provide an investment alternative for stockholders seeking to allocate a portion of their long-term investment portfolios to commercial real estate with lower volatility than public real estate companies.
We cannot assure you that we will achieve our investment objectives. See Item 1A. — “Risk Factors” section of this Annual Report on Form 10-K.
Review of our Policies
Our independent directors have reviewed our policies and determined that they are in the best interests of our stockholders. Set forth below is a discussion of the basis for such determination. In addition, our board of directors, including our independent directors, has examined the material terms, factors and circumstances surrounding any related party transactions or arrangements described herein. On the basis of such examination, our board of directors, including our independent directors, has determined that such transactions occurring in the year ended December 31, 2024 are fair and reasonable to us and on terms and conditions not less favorable to us than those available from unaffiliated third parties.
Investment Strategy
Our investment strategy seeks to capitalize on Starwood Capital’s scale and the real-time information provided by its real estate holdings to identify and acquire our target investments at attractive pricing. We also seek to benefit from Starwood Capital’s reputation and ability to transact in scale with speed and certainty, and its long-standing and extensive relationships in the real estate industry. Starwood Capital is a private investment firm with a primary focus on global real estate. Since its inception in 1991, Starwood Capital has raised over $80 billion of capital and currently has approximately $115 billion of assets under management. Our objective is to bring Starwood Capital’s leading real estate investment platform to income-focused investors.
Our investment strategy is primarily to acquire stabilized, income-oriented commercial real estate. Our portfolio is principally comprised of properties located in the United States and is diversified on a global basis through investments in properties outside of the United States, with a focus on Europe. To a lesser extent, and subject to the investment limitations described herein, we may also invest in real estate debt, including loans secured by real estate and real estate-related debt securities, and real estate-related equity securities. Our investments in real estate-related debt and equity securities provide us with current income, a source of liquidity for our share repurchase plan, cash management and other purposes.
We believe that our structure as a perpetual-life REIT will allow us to acquire and manage our investment portfolio in a more active and flexible manner. We do not have a pre-determined operational period or the need to provide a “liquidity” event, potentially in an unfavorable market, at the end of that period.
Investments in Properties
To execute our investment strategy, we invest primarily in stabilized, income-oriented commercial real estate. Our portfolio is principally comprised of properties located in the United States and is diversified on a global basis through investments in properties outside of the United States, with a focus on Europe. These may include multifamily, industrial, and office assets, as well as other property types, including, without limitation, single-family rental, self-storage, retail, medical office, student housing, senior living, data centers, and manufactured housing properties. We may also acquire assets that require some amount of capital investment in order to be renovated or repositioned. We generally will limit investment in new developments on a standalone basis, but we may consider development that is ancillary to an overall investment.
We do not designate specific sector allocations for the portfolio; rather we invest in markets or asset classes where we see the best opportunities that support our investment objectives.
Investments in Real Estate Debt
While our portfolio is principally comprised of properties, to a lesser extent, we may also invest in real estate debt, including loans secured by real estate and real estate-related debt securities. An allocation of our overall portfolio to real estate debt may allow us to add sources of income and further diversify our portfolio.
Our investments in loans secured by real estate may include first mortgages, subordinated mortgages and mezzanine loans, participations in such loans and other debt secured by or relating to the types of commercial real estate that are the focus of our real estate strategy. The type of real estate debt investments we seek to acquire are obligations backed principally by real estate of the type that generally meets our criteria for direct investment. Mortgage loans are typically secured by multifamily or commercial property and are subject to risks of delinquency and foreclosure. The ability of a borrower to repay a loan secured by an income-producing property typically is dependent primarily upon the successful operation of such property rather than upon the existence of independent income or assets of the borrower. Mezzanine loans may take the form of subordinated loans secured by a pledge of the ownership interests of either the entity owning the real property or an entity that owns (directly or indirectly) the interest in the entity owning the real property. These types of investments may involve a higher degree of risk than mortgage lending because the investment may become unsecured because of foreclosure by the senior lender. We do not intend to make loans to other persons or to engage in the purchase and sale of any types of investments other than those related to real estate.
We may also invest in real estate-related debt securities to provide us with current income and an additional source of liquidity for cash management, satisfying any stock repurchases we chose to make in any particular month and for other purposes. Our real estate-related debt securities investments may focus on investments in commercial mortgage-backed securities (“CMBS”) and, to a lesser extent, agency and non-agency residential mortgage-backed securities (“RMBS”) and collateralized loan obligations (“CLOs”).
Investments in Real Estate-Related Equity Securities
We also may invest in real estate-related equity securities investments, with a focus on non-controlling equity positions of public real estate-related companies, including preferred equity. We believe that investments in real estate-related equity securities may also provide an additional source of liquidity for cash management, satisfying any stock repurchases we chose to make in any particular month and for other purposes.
We do not intend that our investments in real estate-related debt and equity securities will require us to register as an investment company under the Investment Company Act, and we intend to generally divest appropriate securities before any such registration would be required. We may also invest, without limitation, in securities that are unregistered (but are eligible for purchase and sale by certain qualified institutional buyers) or are held by control persons of the issuer and securities that are subject to contractual restrictions on their resale.
Borrowing Policies
We use financial leverage to provide additional funds to support our investment activities. This allows us to make more investments than would otherwise be possible, resulting in a broader portfolio of investments. Subject to the limitation on indebtedness for money borrowed in our charter described below, our target leverage ratio is 50% to 65%. Our leverage ratio is measured by dividing (i) property-level and entity-level debt net of cash and loan-related restricted cash, by (ii) our gross real estate assets (measured using the greater of fair market value or cost) plus the equity in our real estate debt and real estate-related equity securities portfolios. For purposes of determining our gross real estate assets, we will include the asset values of the DST Properties due to the master lease structure, including the Operating Partnership’s fair market value option (the “FMV Option”). Our leverage ratio calculation does not include (i) indebtedness incurred in connection with funding a deposit in advance of the closing of an investment, (ii) indebtedness incurred as other working capital advances or (iii) the financing liability resulting from the sale of DST Properties included in our NAV calculation. Furthermore, the refinancing of any amount of existing indebtedness is not deemed to constitute incurrence of new indebtedness so long as no additional amount of net indebtedness is incurred in connection therewith (excluding the amount of transaction expenses associated with such refinancing).
Our real estate-related debt portfolio may have embedded leverage through the use of repurchase agreements. We may also have embedded leverage through the use of derivatives, including, but not limited to, total return swaps, securities lending arrangements and credit default swaps.
During times of increased investment and capital market activity, but subject to the limitation on indebtedness for money borrowed in our charter described below, we may employ greater leverage in order to quickly build a broader portfolio of assets. We may leverage
our portfolio by assuming or incurring secured or unsecured property-level or entity-level debt. An example of property-level debt is a mortgage loan secured by an individual property or portfolio of properties incurred or assumed in connection with our acquisition of such property or portfolio of properties. An example of entity-level debt is a line of credit obtained by us or our Operating Partnership. We may decide to seek to obtain additional lines of credit under which we would reserve borrowing capacity. Borrowings under our current lines of credit or any future lines of credit may be used not only to repurchase shares, but also to fund acquisitions or for any other corporate purpose.
Our actual leverage level is affected by a number of factors, some of which are outside our control. Significant inflows of proceeds from the sale of shares of our common stock generally cause our leverage as a percentage of our net assets, or our leverage ratio, to decrease, at least temporarily. Significant outflows of equity as a result of repurchases of shares of our common stock generally cause our leverage ratio to increase, at least temporarily. Our leverage ratio also increases or decreases with decreases or increases, respectively, in the value of our portfolio. If we borrow under a line of credit to fund repurchases of shares of our common stock or for other purposes, our leverage would increase and may exceed our target leverage. In such cases, our leverage may remain at the higher level until we receive additional net proceeds from our continuous offering or sell some of our assets to repay outstanding indebtedness.
Our board of directors reviews our aggregate borrowings at least quarterly. In connection with such review, our board of directors may determine to modify our target leverage ratio in light of then-current economic conditions, relative costs of debt and equity capital, fair values of our properties, general conditions in the market for debt and equity securities, growth and investment opportunities or other factors. We may exceed our targeted leverage ratio at times if the Advisor deems it advisable for us. For example, if we fund a repurchase under a line of credit, we will consider actual borrowings when determining whether we are at our leverage target, but not unused borrowing capacity. If, therefore, we are at a leverage ratio in the range of 50% to 65% of our gross real estate assets and we borrow additional amounts under a line of credit, or if the value of our portfolio decreases, our leverage could exceed the range of 50% to 65%. In the event that our leverage ratio exceeds our target, regardless of the reason, we will thereafter endeavor to manage our leverage back down to our target.
There is no limit on the amount we may borrow with respect to any individual property or portfolio. However, under our charter we may not incur indebtedness for money borrowed in an amount exceeding 300% of the cost of our net assets, which approximates borrowing 75% of the cost of our investments. “Net assets” is defined as our total assets other than intangibles valued at cost (prior to deducting depreciation, reserves for bad debts and other non-cash reserves) less total liabilities. However, we may borrow in excess of this amount if such excess is approved by a majority of our independent directors, and disclosed to stockholders in our next quarterly report, along with justification for such excess.
Our charter prohibits us from obtaining loans from any of our directors, Starwood Capital or any of their affiliates, unless approved by a majority of our board of directors (including a majority of our independent directors) not otherwise interested in the transaction as fair, competitive and commercially reasonable and on terms and conditions not less favorable than comparable loans between unaffiliated parties under the same circumstances.
Our Taxation as a REIT
We believe we have operated in a manner that has allowed us to be taxed as a REIT under Sections 856 through 860 of the Code, for federal income tax purposes, beginning with our taxable year ended December 31, 2019 and intend to continue to operate in a manner that will allow us to continue to qualify as a REIT. As long as we qualify for taxation as a REIT, we generally will not be subject to U.S. federal corporate income tax on our net taxable income (determined without regard to our net capital gain and dividends paid deduction) that we timely distribute to our stockholders. Even if we qualify for taxation as a REIT, we may be subject to certain state and local taxes, taxes imposed by foreign jurisdictions attributed to certain non-U.S. investments, taxes on our income and property, and federal income and excise taxes in certain circumstances, including on our undistributed taxable income.
We have formed certain subsidiaries to function as taxable REIT subsidiaries (“TRSs”). In general, a TRS may perform additional services for our tenants and generally may engage in any real estate or non-real estate-related business other than management or operation of a lodging facility or a health care facility. The TRSs are subject to taxation at the federal, state, local and foreign levels, as applicable. We will account for applicable income taxes by utilizing the asset and liability method. As such, we will record deferred tax assets and liabilities for the future tax consequences resulting from the difference between the carrying value of existing assets and liabilities and their respective tax basis. A valuation allowance for deferred tax assets is provided if we believe it is more likely than not that some or all of the deferred tax asset may not be realized.
Governmental Regulations
As an owner of real estate, our operations are subject, in certain instances, to supervision and regulation by U.S. and other governmental authorities, and may be subject to various laws and judicial and administrative decisions imposing various requirements
and restrictions, which, include among other things: (i) federal and state securities laws and regulations; (ii) federal, state and local tax laws and regulations; (iii) state and local laws relating to real property; (iv) federal, state and local environmental laws, ordinances, and regulations; and (v) various laws relating to housing, including permanent and temporary rent control and stabilization laws, the Americans with Disabilities Act of 1990 and the Fair Housing Amendment Act of 1988, among others.
Compliance with the federal, state and local laws described above has not had a material, adverse effect on our business, assets, results of operations, financial condition and ability to pay distributions, and we do not believe that our existing portfolio will require us to incur material expenditures to comply with these laws and regulations.
Competition
We face competition from various entities for investment opportunities in properties, including other REITs, pension funds, insurance companies, investment funds and companies, partnerships and developers. In addition to third-party competitors, other programs sponsored by the Advisor and its affiliates, particularly those with investment strategies that overlap with ours, may seek investment opportunities under Starwood Capital’s prevailing policies and procedures. Many of these entities may have greater access to capital to acquire properties than we have.
In the face of this competition, we have access to our Advisor’s and Sponsor’s professionals and their industry expertise and relationships, which we believe provide us with a competitive advantage and help us source, evaluate and compete for potential investments. We believe these relationships will enable us to compete more effectively for attractive investment opportunities. However, we may not be able to achieve our business goals or expectations due to the competitive risks that we face. For additional information concerning these competitive risks, see Item 1A. “Risk Factors—General Risks Related to Investments in Real Estate.”
Human Capital
We have no employees. Our operations are conducted by the Advisor. Our executive officers serve as officers of the Advisor, and are employed by an affiliate of the Advisor. See Item 13. “Certain Relationships and Related Transactions, and Director Independence—Our Relationship with Our Advisor and Starwood Capital.”
Conflicts of Interest
We are subject to conflicts of interest arising out of our relationship with Starwood Capital, including the Advisor and its affiliates. See Item 1A “Risk Factors—Risks Related to Conflicts of Interest.”
Available Information
Stockholders may obtain copies of our filings with the U.S. Securities and Exchange Commission (the “SEC”), free of charge from the website maintained by the SEC at www.sec.gov or from our website at www.starwoodnav.reit.
We are providing the address to our website solely for the information of investors. The information on our website is not a part of, nor is it incorporated by reference into this report. From time to time, we may use our website as a distribution channel for information about our Company. The information we post through this channel may be deemed material. Accordingly, investors should monitor this channel, in addition to following our press releases and SEC filings.
ITEM 7. MANAGEMENT’S DISCUSSION AND ANALYSIS OF FINANCIAL CONDITION AND RESULTS OF OPERATIONS
References herein to “Starwood Real Estate Income Trust, Inc.,” “Company,” “we,” “us,” or “our” refer to Starwood Real Estate Income Trust, Inc. and its subsidiaries unless the context specifically requires otherwise.
The following discussion should be read in conjunction with the consolidated financial statements and notes thereto appearing elsewhere in this Annual Report on Form 10-K. In addition to historical data, this discussion contains forward-looking statements about our business, operations and financial performance based on current expectations that involve risks, uncertainties and assumptions. Our actual results may differ materially from those in this discussion as a result of various factors, including but not limited to those discussed under Item 1A. “Risk Factors” in this Annual Report on Form 10-K.
Overview
We were formed on June 22, 2017 as a Maryland corporation to invest primarily in stabilized, income-oriented commercial real estate and debt secured by commercial real estate. Our portfolio is principally comprised of properties located in the United States and is diversified on a global basis through investments in properties outside of the United States, with a focus on Europe. To a lesser extent, we also invest in real estate debt, including loans secured by real estate and real estate-related securities. We are an externally advised, perpetual-life REIT. We own all or substantially all of our assets through the Operating Partnership, of which we are the sole general partner. We and the Operating Partnership are externally managed by the Advisor.
Our board of directors has at all times oversight and policy-making authority over us, including responsibility for governance, financial controls, compliance and disclosure. Pursuant to an advisory agreement among the Advisor, the Operating Partnership and us (the “Advisory Agreement”), we have delegated to the Advisor the authority to source, evaluate and monitor our investment opportunities and make decisions related to the acquisition, management, financing and disposition of our assets, in accordance with our investment objectives, guidelines, policies and limitations, subject to oversight by our board of directors.
We have elected to be taxed as a REIT under the Code for U.S. federal income tax purposes, commencing with our taxable year ended December 31, 2019. We generally will not be subject to U.S. federal income taxes on our taxable income to the extent we annually distribute all of our net taxable income (determined without regard to our net capital gain and dividends-paid deduction) to stockholders and maintain our qualification as a REIT.
Public Offerings
On December 27, 2017, we commenced our initial public offering of up to $5.0 billion in shares of our common stock. On June 2, 2021, our initial public offering terminated and we commenced our follow-on public offering of up to $10.0 billion in shares of common stock. On August 10, 2022, the follow-on public offering terminated and we commenced our third public offering of up to $18.0 billion in shares of common stock, consisting of up to $16.0 billion in shares in our primary offering and up to $2.0 billion in shares pursuant to our distribution reinvestment plan. We intend to continue selling shares in our third public offering on a monthly basis.
As of March 21, 2025, we had received net proceeds of $14.1 billion from the sale of our common stock through our public offerings. We have contributed the net proceeds from our public offerings to the Operating Partnership in exchange for a corresponding number of Class T, Class S, Class D and Class I units. The Operating Partnership has primarily used the net proceeds to make investments in real estate and real estate debt as further described below under “Portfolio”.
DST Program
In April 2024, we, through the Operating Partnership, commenced the DST Program to issue and sell up to a maximum aggregate offering amount of $1.0 billion of DST Interests in specific DSTs holding one or more DST Properties. These DST Interests will be issued and sold to “accredited investors,” as that term is defined under Regulation D promulgated by the SEC under the Securities Act, in private placements exempt from registration pursuant to Section 4(a)(2) of the Securities Act (the “DST Offerings”).
Under the DST Program, each DST Property may be sourced from our real properties or from third parties, which will be held in a DST are leased-back to a wholly owned subsidiary of the Operating Partnership on a long-term basis through January 2, 2031, unless sooner terminated pursuant to master lease agreements. Each master lease agreement will be guaranteed by the Operating Partnership, which will retain a FMV Option, giving it the right, but not the obligation, to acquire the DST Interests in the applicable DST from the investors in exchange for Operating Partnership units or cash, at the Operating Partnership’s discretion. Such FMV Option shall be exercisable any time after two years from the closing of the applicable DST Offering. The Operating Partnership, in its sole and absolute discretion, may assign its rights in the FMV Option to a subsidiary, an affiliate, a successor entity to the Operating
Partnership or the acquiror of a majority of the Operating Partnership’s assets. After a one-year holding period, investors who acquire Operating Partnership units pursuant to the FMV Option generally have the right to cause the Operating Partnership to redeem all or a portion of their Operating Partnership units for, at our sole discretion, shares of our common stock, cash, or a combination of both.
We expect that the DST Program will give us the opportunity to expand and diversify our capital-raising strategies by offering what we believe to be an attractive investment product for investors that may be seeking like-kind replacement properties to complete tax-deferred exchange transactions under Section 1031 of the Code. Affiliates of the Advisor are expected to receive fees in connection with the sale of the DST Interests and the management of the DSTs. We intend to use the net offering proceeds from the DST Program to make investments in accordance with our investment strategy and policies, reduce our borrowings, repay indebtedness, fund the repurchase of shares of all classes of our common stock under our share repurchase plan and for other corporate purposes.
As of December 31, 2024, we have raised approximately $25.8 million in gross offering proceeds through the DST Program.
Investment Objectives
Our investment objectives are to invest in assets that will enable us to:
•provide current income in the form of regular, stable cash distributions to achieve an attractive distribution yield;
•preserve and protect invested capital;
•realize appreciation in NAV from proactive investment management and asset management; and
•provide an investment alternative for stockholders seeking to allocate a portion of their long-term investment portfolios to commercial real estate with lower volatility than publicly traded real estate companies.
We cannot assure you that we will achieve our investment objectives. See Item 1A.“Risk Factors” section of this Annual Report on Form 10-K.
Recent Developments
2024 Performance
Through year-end 2024, our Class I shares delivered an inception-to-date annualized return of +6.8%. For the year ended December 31, 2024, performance for the Class I shares was +0.2%. For the fifth consecutive year, 100% of our distributions during the year ended December 31, 2024 were characterized as a Return of Capital (“ROC”) for federal income tax purposes. Our annualized distribution rate is 5.7% and equates to approximately 9.7% on a tax-equivalent basis for investors in the highest income tax bracket.
Performance for the year was impacted by interest rates, both positively and negatively. Short-term interest rates declined with the Federal Reserve’s three rate cuts beginning in September 2024. Lower rates, combined with a sense that the worst is behind us, led to lower credit spreads and overall borrowing costs. This helped to stabilize asset values. The offset to lower short-term rates was a negative impact to the mark-to-market value of our interest rate hedges, which are in-place to protect distributable cash flow. Excluding these hedges, our total net return for the year ended December 31, 2024, would have been +2.4%, underscoring the positive direction of real estate values.
Portfolio Update
While rent growth slowed throughout the year due to elevated supply deliveries, fundamentals in our portfolio remained solid. Revenue growth in our two largest reporting segments (rental housing and industrial) outperformed the top 50 markets average by nearly 3% on a combined basis. This outperformance was primarily driven by our unique affordable housing portfolio within rental residential (which benefits from inflation and wage indexed rents) and allocation to in-fill, last mile and infrastructure centric industrial investments (which experienced lower levels of new supply growth). Bigger picture, supply and demand fundamentals for rental housing continue to benefit from an estimated four to five million unit shortfall and industrial continues to benefit from the growth in e-commerce and the need to deliver products to consumers faster.
We believe our portfolio is strategically positioned, with 92% allocated to asset classes with strong long-term fundamentals, including rental housing, industrial, and a floating-rate real estate term loan. In addition, our assets are approximately 80% located in the sunbelt markets, which benefit from outsized long-term demand drivers including population growth, job growth, and superior affordability. Another 8% is invested internationally for diversification and high barriers to new supply.
Across our Consolidated Balance Sheet, we have emphasized downside protection with approximately 88% of our secured property debt currently being fixed-rate or hedged, and having three-and-a-half years of duration remaining. Due to an improving capital markets environment, we are looking to be opportunistic in extending loan maturities and, in several cases, reducing credit spreads. For example, we recently successfully refinanced the $1.2 billion loan on our Extended Stay portfolio with a spread that is 110 bps inside previous levels, generating meaningful interest savings and increasing cash-on-cash yields. At present, our portfolio has an average cost of debt of approximately 3.8% with limited near-term loan maturities. The major challenge for most investors in this environment has maturing debt or unhedged interest rates, and we are well positioned from this perspective.
Outlook
As we look to 2025 and beyond, we expect to see continued cash flow growth due to several factors. Supply and demand fundamentals should continue to improve as new supply starts have declined 60-70% in multifamily and industrial. The realization of lower deliveries should begin to take hold in late 2025 and into early 2026. In the meantime, demand for multifamily apartments remains robust with national absorption levels near 20-year highs. Affordability continues to play a key factor in driving demand. Our average multifamily rent is nearly half that of the median U.S. mortgage payment. Wage growth has also outpaced rent growth, which has improved the rent-to-income of our portfolio and now stands at a very healthy 21%, providing room for future rent increases. Since affordable housing rents are formulaic (tied to inflation and wage growth) and a portion of our historical allowable rent increases have been deferred into the future, we have good visibility into continued mid-single-digit rent growth in 2025. Similarly, within our industrial portfolio, our releasing spreads were a positive 50% throughout 2024 and rents remain approximately 20% below market, which should also allow for continued cash flow growth as leases roll over the next several years.
Liquidity
We continue to prioritize generating liquidity for stockholders submitting share repurchase requests, while also staying focused on protecting and maximizing value for our stockholders who remain fully invested. This requires picking the right spots to generate liquidity as the markets continue to improve.
Our current liquidity stands at approximately $0.6 billion, representing approximately 6.8% of NAV. Through the end of February 2025, we have successfully executed select asset sales totaling approximately $0.8 billion on a gross basis. From a timing standpoint, our decision to wait for the first Fed rate cuts proved to be the right one. The capital markets between September 2024 and November 2024 provided an optimal three-month window for asset sales, as short-term rates declined and investor demand was strong. Fortunately, nearly all of our asset sales were either closed or were under contract before interest rate volatility and before the uncertainty of the new administration’s fiscal and trade policy took shape. Once these asset sales are finalized, we expect total liquidity to increase to approximately $0.9 billion, or approximately 10% of our NAV. We will continue to evaluate additional select asset sales and other strategic initiatives to strengthen liquidity throughout the year.
Please refer to Item 1A. “Risk Factors” in this Annual Report on Form 10-K for additional disclosure relating to material trends or uncertainties that may impact our business.
2024 Highlights
Operating Results:
•Declared monthly net distributions totaling $494.3 million for the year ended December 31, 2024. The details of the average annualized distribution rates and total returns are shown in the following table:
|
|
|
|
|
|
Class T |
Class S |
Class D |
Class I |
|
Shares |
Shares |
Shares |
Shares |
Average Annualized Distribution Rate |
4.8% |
4.8% |
5.6% |
5.7% |
Year-to-Date Total Return, without upfront selling commissions and dealer manager fees |
(0.6%) |
(0.7%) |
(0.1%) |
0.2% |
Annualized Inception-to-Date Total Return, without upfront selling commissions and dealer manager fees |
6.1% |
6.0% |
6.4% |
6.8% |
Annualized Inception-to-Date Total Return, assuming full upfront selling commissions and dealer manager fees |
5.5% |
5.4% |
6.1% |
N/A |
Disposition Activity:
•Sold seven industrial properties, two hotel properties, one net-lease property, and 83 single-family rental units for total net proceeds of $204.9 million during the year ended December 31, 2024.
Financing Activity:
•Received net borrowings of $454.5 million from our unsecured line of credit during the year ended December 31, 2024.
•Entered into a senior secured revolving credit facility agreement with a total borrowing capacity of $150.0 million during the year ended December 31, 2024. The senior secured revolving credit facility agreement matures in January 2026, at which time we may request an additional one-year extension thereafter. Interest under the senior secured revolving credit facility is determined based on one-month U.S. dollar denominated Secured Overnight Financing Rate (“SOFR”) plus 2.5%. During the year ended December 31, 2024, no amounts were borrowed under this senior secured revolving credit facility.
Portfolio
Summary of Portfolio
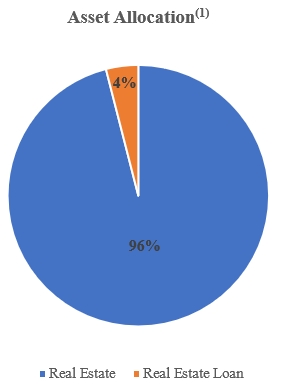
The following chart outlines the percentage of our assets across investments in real estate and our investment in a real estate loan based on fair value as of December 31, 2024:
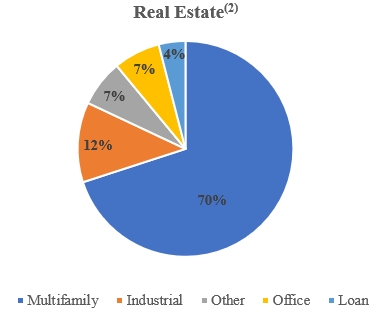
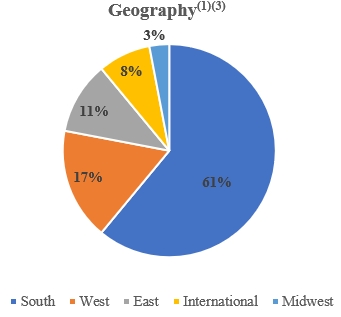
The following charts further describe the composition of our investments in real estate and our investment in a real estate loan based on fair value as of December 31, 2024:
(1)Investments in real estate includes our direct property investments and our unconsolidated investments. Our investment in a real estate loan includes our term loan.
(2)Includes our direct property investments, our unconsolidated investments and our investment in a term loan.
(3)Geography weighting includes our term loan. Geography weighting is measured as the asset value of real estate properties, unconsolidated real estate ventures, and our investment in a real estate loan for each geographical category against the total value of all (i) real estate properties, (ii) unconsolidated real estate ventures, and (iii) our investment in a real estate loan.
Investments in Real Estate
The following table provides a summary of our portfolio as of December 31, 2024 ($ in thousands):
|
|
|
|
|
|
|
|
|
|
|
|
|
|
|
|
|
Segment |
|
Number of
Consolidated
Properties |
|
Sq. Feet
(in millions)
/ Number of
Units/Keys |
|
Occupancy
Rate (1) |
|
Gross Asset Value (2) |
|
|
Segment
Revenue for the year ended December 31, 2024 |
|
|
Percentage of
Segment
Revenue |
Multifamily |
|
284 |
|
66,919 units |
|
95% |
|
$ |
16,065,200 |
|
|
$ |
1,233,802 |
|
|
73% |
Industrial |
|
124 |
|
17.18 sq. ft. |
|
96% |
|
|
2,833,370 |
|
|
|
183,907 |
|
|
11% |
Office |
|
20 |
|
3.90 sq. ft. |
|
90% |
|
|
1,530,364 |
|
|
|
166,798 |
|
|
10% |
Other Properties(3) (4) |
|
33 |
|
N/A (5) |
|
N/A |
|
|
1,121,867 |
|
|
|
103,278 |
|
|
6% |
Total |
|
461 |
|
|
|
|
|
$ |
21,550,801 |
|
|
$ |
1,687,785 |
|
|
100% |
(1)The occupancy rate for our multifamily investments is defined as the number of leased units divided by the total unit count as of December 31, 2024. The occupancy rate for our industrial and office investments is defined as all leased square footage divided by the total available square footage as of December 31, 2024.
(2)Based on fair value as of December 31, 2024.
(3)Includes a 100% interest in a subsidiary with 24 single-family rental units and a 95% interest in a consolidated joint venture with 909 single-family rental units.
(4)Excludes our investments in unconsolidated real estate ventures.
(5)Includes approximately 2.6 million sq. ft. across our self-storage, medical office and retail properties, 431 keys at our consolidated hospitality properties and 933 single-family rental units.
Average Effective Annual Base Rents
The following table provides a summary of the average effective annual base rents across our portfolio as of December 31, 2024:
|
|
|
|
|
|
Property Type |
|
Average Effective Annual
Base Rent per Leased
Square Foot / Units |
|
Multifamily(1) |
|
$ |
|
18,082 |
|
Industrial(2) |
|
$ |
|
7.42 |
|
Office(2) |
|
$ |
|
34.20 |
|
(1)For multifamily properties, average effective annual base rent per leased unit represents the annualized base rent for the year ended December 31, 2024. The average effective annual base rent includes the effects of rent concessions and abatements and excludes tenant recoveries, straight-line rent, and above-market and below-market lease amortization.
(2)For industrial and office properties, average effective annual base rent represents the annualized base rent per leased square foot for the year ended December 31, 2024. The average effective annual base rent includes the effects of rent concessions and abatements and excludes tenant recoveries, straight-line rent, and above-market and below-market lease amortization.
The following table provides information regarding our portfolio of real estate properties as of December 31, 2024:
|
|
|
|
|
|
|
|
|
|
|
|
|
|
|
Segment and Investment |
|
Number of
Properties |
|
Location |
|
Acquisition
Date |
|
Ownership
Interest (1) |
|
Sq. Feet
(in millions)
/ Number of
Units/Keys |
|
|
Occupancy(2) |
Multifamily: |
|
|
|
|
|
|
|
|
|
|
|
|
|
Florida Multifamily Portfolio |
|
4 |
|
Jacksonville/Naples, FL |
|
January 2019 |
|
100% |
|
|
1,150 |
|
|
100% |
Phoenix Property |
|
1 |
|
Mesa, AZ |
|
January 2019 |
|
100% |
|
|
256 |
|
|
96% |
Columbus Multifamily |
|
3 |
|
Columbus, OH |
|
September/October 2019 |
|
96% |
|
|
690 |
|
|
96% |
Cascades Apartments(3) |
|
1 |
|
Charlotte, NC |
|
October 2019 |
|
79% |
|
|
570 |
|
|
87% |
Exchange on Erwin |
|
1 |
|
Durham, NC |
|
November 2019 |
|
100% |
|
|
265 |
|
|
87% |
Avida Apartments |
|
1 |
|
Salt Lake City, UT |
|
December 2019 |
|
100% |
|
|
400 |
|
|
94% |
Southeast Affordable Housing Portfolio |
|
22 |
|
Various |
|
Various 2020 |
|
100% |
|
|
4,384 |
|
|
95% |
Florida Affordable Housing Portfolio II |
|
4 |
|
Jacksonville, FL |
|
October 2020 |
|
100% |
|
|
958 |
|
|
93% |
Mid-Atlantic Affordable Housing Portfolio |
|
28 |
|
Various |
|
October 2020 |
|
100% |
|
|
3,660 |
|
|
96% |
Kalina Way(3) |
|
1 |
|
Salt Lake City, UT |
|
December 2020 |
|
79% |
|
|
264 |
|
|
98% |
Southeast Affordable Housing Portfolio II |
|
9 |
|
DC, FL, GA, MD, SC, VA |
|
May 2021 |
|
100% |
|
|
1,642 |
|
|
98% |
Azalea Multifamily Portfolio |
|
17 |
|
TX, FL, NC, MD, TN, GA |
|
June/July 2021 |
|
100% |
|
|
5,620 |
|
|
95% |
Keystone Castle Hills |
|
1 |
|
Dallas, TX |
|
July 2021 |
|
100% |
|
|
690 |
|
|
96% |
Greater Boston Affordable Portfolio |
|
5 |
|
Boston, MA |
|
August/September 2021 |
|
98% |
|
|
842 |
|
|
97% |
Columbus Preferred Portfolio |
|
2 |
|
Columbus, OH |
|
September 2021 |
|
96% |
|
|
400 |
|
|
96% |
The Palmer Dadeland |
|
1 |
|
Dadeland, FL |
|
September 2021 |
|
100% |
|
|
844 |
|
|
95% |
Seven Springs Apartments |
|
1 |
|
Burlington, MA |
|
September 2021 |
|
100% |
|
|
331 |
|
|
95% |
Maison’s Landing |
|
1 |
|
Taylorsville, UT |
|
September 2021 |
|
100% |
|
|
492 |
|
|
95% |
Sawyer Flats |
|
1 |
|
Gaithersburg, MD |
|
October 2021 |
|
100% |
|
|
648 |
|
|
95% |
Raleigh Multifamily Portfolio |
|
6 |
|
Raleigh, NC |
|
November 2021 |
|
95% |
|
|
2,291 |
|
|
93% |
SEG Multifamily Portfolio |
|
62 |
|
Various |
|
November 2021 |
|
100% |
|
|
15,461 |
|
|
93% |
South Florida Multifamily Portfolio |
|
3 |
|
Various |
|
November 2021 |
|
95% |
|
|
1,150 |
|
|
95% |
Florida Affordable Housing Portfolio III |
|
16 |
|
Various |
|
November 2021 |
|
100% |
|
|
2,660 |
|
|
96% |
Central Park Portfolio |
|
9 |
|
Denver, CO |
|
December 2021 |
|
100% |
|
|
1,445 |
|
|
93% |
National Affordable Housing Portfolio |
|
17 |
|
Various |
|
December 2021 |
|
100% |
|
|
3,264 |
|
|
95% |
Phoenix Affordable Housing Portfolio |
|
7 |
|
Phoenix, AZ |
|
April/May 2022 |
|
100% |
|
|
1,462 |
|
|
96% |
Mid-Atlantic Affordable Housing Portfolio II |
|
8 |
|
DC, GA |
|
April 2022 |
|
100% |
|
|
1,449 |
|
|
96% |
Texas and North Carolina Multifamily Portfolio |
|
5 |
|
TX, NC |
|
April/June 2022 |
|
95% |
|
|
1,601 |
|
|
94% |
Summit Multifamily Portfolio |
|
34 |
|
Various |
|
May/June 2022 |
|
100% |
|
|
8,812 |
|
|
94% |
Florida Affordable Housing Portfolio IV |
|
9 |
|
Various, FL |
|
June/July 2022 |
|
100% |
|
|
2,054 |
|
|
98% |
Blue Multifamily Portfolio |
|
4 |
|
Various |
|
August 2022 |
|
100% |
|
|
1,164 |
|
|
95% |
Total Multifamily |
|
284 |
|
|
|
|
|
|
|
|
66,919 |
|
|
|
Industrial: |
|
|
|
|
|
|
|
|
|
|
|
|
|
Airport Logistics Park |
|
6 |
|
Nashville, TN |
|
September 2020 |
|
100% |
|
|
0.40 |
|
|
100% |
Marshfield Industrial Portfolio |
|
4 |
|
Baltimore, MD |
|
October 2020 |
|
100% |
|
|
1.33 |
|
|
100% |
Denver/Boulder Industrial Portfolio |
|
16 |
|
Denver, CO |
|
April 2021 |
|
100% |
|
|
1.68 |
|
|
92% |
Reno Logistics Portfolio |
|
18 |
|
Reno, NV |
|
May 2021 |
|
100% |
|
|
3.04 |
|
|
96% |
Northern Italy Industrial Portfolio |
|
4 |
|
Northern Italy |
|
August 2021 |
|
100% |
|
|
0.75 |
|
|
100% |
Southwest Light Industrial Portfolio |
|
15 |
|
AZ, NV |
|
September 2021 |
|
100% |
|
|
2.48 |
|
|
93% |
Norway Logistics Portfolio |
|
2 |
|
Oslo, Norway |
|
February 2022 |
|
100% |
|
|
0.37 |
|
|
100% |
American Industrial Center |
|
25 |
|
Orlando, FL |
|
April 2022 |
|
100% |
|
|
0.82 |
|
|
94% |
Middlebrook Crossroads |
|
18 |
|
Bridgewater, NJ |
|
May 2022 |
|
95% |
|
|
0.58 |
|
|
93% |
Verona Oppeano |
|
5 |
|
Verona, Italy |
|
June 2022 |
|
100% |
|
|
2.64 |
|
|
100% |
Denmark Logistics Portfolio |
|
10 |
|
Eastern Denmark |
|
June 2022 |
|
100% |
|
|
1.97 |
|
|
100% |
Belgioioso Logistics |
|
1 |
|
Greater Milan, Italy |
|
August 2022 |
|
100% |
|
|
1.12 |
|
|
100% |
Total Industrial |
|
124 |
|
|
|
|
|
|
|
|
17.18 |
|
|
|
Office: |
|
|
|
|
|
|
|
|
|
|
|
|
|
Florida Office Portfolio |
|
11 |
|
Jacksonville, FL |
|
May 2019 |
|
97% |
|
|
1.27 |
|
|
76% |
Columbus Office Portfolio |
|
1 |
|
Columbus, OH |
|
October 2019 |
|
96% |
|
|
0.32 |
|
|
100% |
Nashville Office |
|
1 |
|
Nashville, TN |
|
February 2020 |
|
100% |
|
|
0.36 |
|
|
100% |
60 State Street |
|
1 |
|
Boston, MA |
|
March 2020 |
|
100% |
|
|
0.91 |
|
|
95% |
Stonebridge |
|
3 |
|
Atlanta, GA |
|
February 2021 |
|
100% |
|
|
0.46 |
|
|
100% |
M Campus |
|
2 |
|
Paris, France |
|
December 2021 |
|
100% |
|
|
0.24 |
|
|
99% |
Barcelona Mediacomplex |
|
1 |
|
Barcelona, Spain |
|
June 2022 |
|
100% |
|
|
0.34 |
|
|
100% |
Total Office |
|
20 |
|
|
|
|
|
|
|
|
3.90 |
|
|
|
|
|
|
|
|
|
|
|
|
|
|
|
|
|
|
Segment and Investment |
|
Number of
Properties |
|
Location |
|
Acquisition
Date |
|
Ownership
Interest (1) |
|
Sq. Feet
(in millions)
/ Number of
Units/Keys |
|
|
Occupancy(2) |
Other Properties: |
|
|
|
|
|
|
|
|
|
|
|
|
|
U.S. Select Service Portfolio |
|
3 |
|
CO, OH, AR |
|
January 2019 |
|
100% |
|
|
431 |
|
|
74% |
Fort Lauderdale Hotel (5) |
|
1 |
|
Fort Lauderdale, FL |
|
March 2019 |
|
43% |
|
|
236 |
|
|
64% |
Exchange on Erwin - Commercial |
|
2 |
|
Durham, NC |
|
November 2019 |
|
100% |
|
|
0.10 |
|
|
93% |
Barlow |
|
1 |
|
Chevy Chase, MD |
|
March 2020 |
|
100% |
|
|
0.29 |
|
|
80% |
Marketplace at the Outlets |
|
1 |
|
West Palm Beach, FL |
|
December 2021 |
|
100% |
|
|
0.30 |
|
|
100% |
Single-Family Rental Joint Venture |
|
N/A |
|
Various |
|
Various |
|
95% |
|
|
909 |
|
|
88% |
Sun Belt Single-Family Rental Portfolio |
|
N/A |
|
Various |
|
December 2021 |
|
100% |
|
|
24 |
|
|
58% |
Morningstar Self-Storage Joint Venture |
|
26 |
|
Various |
|
December 2021/March 2022 |
|
95% |
|
|
1.90 |
|
|
84% |
Extended Stay Portfolio (5) |
|
196 |
|
Various |
|
July 2022 |
|
45% |
|
|
24,935 |
|
|
78% |
Total Other Properties |
|
230 |
|
|
|
|
|
|
|
N/A (4) |
|
|
|
|
|
|
|
|
|
|
|
|
|
|
|
|
|
Total Investment Properties |
|
658 |
|
|
|
|
|
|
|
|
|
|
|
(1)Certain of the joint venture agreements entered into by us provide the other partner a profits interest based on certain internal rate of return hurdles being achieved. Such investments are consolidated by us and any profits interest due to the other partner will be reported within non-controlling interests in consolidated joint ventures on our Consolidated Balance Sheets. The table also includes two investments (197 total properties) owned by two unconsolidated real estate ventures.
(2) The occupancy rate for our multifamily and certain other properties, including single-family rental investments, is defined as the number of leased units divided by the total unit count as of December 31, 2024. The occupancy rate for our industrial and office properties is defined as all leased square footage divided by the total available square footage as of December 31, 2024. The occupancy rate for our other investments, including self-storage investments, is defined as all leased square footage divided by the total available square footage as well as the trailing 12 month average occupancy for hospitality and extended stay investments for the period ended December 31, 2024.
(3)Held through our DST Program as of December 31, 2024. These properties have been consolidated on our Consolidated Balance Sheets. Any profits interest due to the third-party investors in the DST Program are reported within non-controlling interests in consolidated joint ventures on our Consolidated Balance Sheets.
(4)Includes 2.6 million sq. ft. across our self-storage, medical office and retail properties and 25,602 keys at our hospitality and extended stay properties.
(5)Investment in unconsolidated real estate ventures.
Impairment of Investments in Real Estate
Management reviews its consolidated real estate properties for impairment each quarter or when there is an event or change in circumstances that indicates an impaired value. If the carrying amount of the real estate investment is no longer recoverable and exceeds the fair value of such investment, an impairment loss is recognized. The impairment loss is recognized based on the excess of the carrying amount of the asset over its fair value. The evaluation of anticipated future cash flows is highly subjective and is based in part on assumptions regarding future occupancy, rental rates and capital requirements that could differ materially from actual results. Since cash flows on real estate properties are considered on an undiscounted basis to determine whether an asset has been impaired, our strategy of holding properties over the long term directly decreases the likelihood of recording an impairment loss. If our strategy changes or market conditions otherwise dictate an earlier sale date, an impairment loss may be recognized, and such loss could be material to our results. If we determine that an impairment has occurred, the affected assets must be reduced to their fair value.
During the year ended December 31, 2024, we recognized an aggregate $150.4 million of impairment charges related predominantly to multifamily properties and, to a lesser extent, one hospitality property and one industrial property. During the year ended December 31, 2023, we recognized an aggregate of $188.8 million of impairment charges related predominantly to single-family rental properties and, to a lesser extent, two hospitality properties, in the Consolidated Statements of Operations and Comprehensive Loss. During the year ended December 31, 2022, we did not recognize any impairment charges on investments in real estate. The estimated fair values of the impaired properties held as of December 31, 2024, were primarily based on recently completed sales transactions, letters of intent, or non-binding purchase and sales contracts. These inputs are considered Level 2 inputs for purposes of the fair value hierarchy. There are inherent uncertainties in making these estimates such as current and future macroeconomic conditions.
Impairment of Investments in Unconsolidated Real Estate Ventures
Management reviews our investments in unconsolidated joint ventures for impairment each quarter and will record impairment charges when events or circumstances change indicating that a decline in the fair values below the carrying values has occurred and such decline is other-than-temporary. The ultimate realization of the investment in unconsolidated joint ventures is dependent on a number of factors, including the performance of each investment and market conditions.
During the years ended December 31, 2024, 2023, and 2022, we did not recognize any impairments on our investments in unconsolidated real estate ventures.
Investments in Real Estate Debt
The following table details our investment in real estate debt as of December 31, 2024 ($ in thousands):
|
|
|
|
|
|
|
|
|
|
|
|
|
|
|
|
|
|
|
December 31, 2024 |
|
Type of Loan |
|
Number of Positions |
|
Coupon (1) |
|
Maturity Date |
|
Cost Basis |
|
|
Fair Value |
|
Term loan |
|
1 |
|
B + 4.75% |
|
June 2027 |
|
$ |
956,877 |
|
|
$ |
852,461 |
|
(1)The symbol “B” refers to the relevant benchmark rate, which is the three-month Bank Bill Swap Bid Rate (“BBSY”).
During June 2022, we provided financing in the form of a term loan to an unaffiliated entity in connection with its acquisition of Australia’s largest hotel and casino company. The loan is in the amount of AUD 1,377 million and has an initial term of five years, with a two-year extension option. The loan is pre-payable at the option of the borrower at any time.
Lease Expirations
The following table details the expiring leases at our industrial, office and other properties by annualized base rent as of December 31, 2024 ($ in thousands). The table below excludes our multifamily and certain other properties, including single-family rental and self-storage properties, as substantially all leases at such properties expire within 12 months:
|
|
|
|
|
|
|
|
|
|
|
|
|
|
|
|
|
|
|
|
|
|
|
|
|
|
|
|
|
|
|
|
|
|
|
Industrial |
|
Office |
|
Other Properties |
|
Total |
Year |
|
Annualized
Base Rent (1) |
|
|
% of Total
Annualized
Base
Rent
Expiring |
|
Annualized
Base Rent (1) |
|
|
% of Total
Annualized
Base
Rent
Expiring |
|
Annualized
Base Rent (1) |
|
|
% of Total
Annualized
Base
Rent
Expiring |
|
Annualized
Base Rent (1) |
|
|
% of Total
Annualized
Base
Rent
Expiring |
2025 |
|
$ |
|
19,706 |
|
|
|
7% |
|
$ |
|
6,839 |
|
|
|
2% |
|
$ |
|
1,636 |
|
|
|
1% |
|
$ |
|
28,181 |
|
|
|
10% |
2026 |
|
|
|
22,884 |
|
|
|
8% |
|
|
|
13,125 |
|
|
|
4% |
|
|
|
2,978 |
|
|
|
1% |
|
|
|
38,987 |
|
|
|
13% |
2027 |
|
|
|
27,197 |
|
|
|
9% |
|
|
|
13,264 |
|
|
|
4% |
|
|
|
1,841 |
|
|
|
1% |
|
|
|
42,302 |
|
|
|
14% |
2028 |
|
|
|
14,982 |
|
|
|
5% |
|
|
|
11,619 |
|
|
|
4% |
|
|
|
4,757 |
|
|
|
1% |
|
|
|
31,358 |
|
|
|
10% |
2029 |
|
|
|
14,452 |
|
|
|
5% |
|
|
|
7,860 |
|
|
|
3% |
|
|
|
3,143 |
|
|
|
1% |
|
|
|
25,455 |
|
|
|
9% |
2030 |
|
|
|
12,690 |
|
|
|
4% |
|
|
|
18,129 |
|
|
|
6% |
|
|
|
2,159 |
|
|
|
1% |
|
|
|
32,978 |
|
|
|
11% |
2031 |
|
|
|
5,562 |
|
|
|
2% |
|
|
|
24,888 |
|
|
|
8% |
|
|
|
1,957 |
|
|
|
1% |
|
|
|
32,407 |
|
|
|
11% |
2032 |
|
|
|
2,924 |
|
|
|
1% |
|
|
|
9,115 |
|
|
|
3% |
|
|
|
1,234 |
|
|
|
0% |
|
|
|
13,273 |
|
|
|
4% |
2033 |
|
|
|
6,819 |
|
|
|
2% |
|
|
|
29,234 |
|
|
|
10% |
|
|
|
2,104 |
|
|
|
1% |
|
|
|
38,157 |
|
|
|
13% |
2034 |
|
|
|
1,305 |
|
|
|
0% |
|
|
|
6,017 |
|
|
|
2% |
|
|
|
1,259 |
|
|
|
0% |
|
|
|
8,581 |
|
|
|
2% |
Thereafter |
|
|
|
2,278 |
|
|
|
1% |
|
|
|
3,062 |
|
|
|
1% |
|
|
|
4,166 |
|
|
|
1% |
|
|
|
9,506 |
|
|
|
3% |
Total |
|
$ |
|
130,799 |
|
|
|
44% |
|
$ |
|
143,152 |
|
|
|
47% |
|
$ |
|
27,234 |
|
|
|
9% |
|
$ |
|
301,185 |
|
|
|
100% |
(1)Annualized base rent is determined from the annualized base rent per leased square foot of the applicable year and excludes tenant recoveries, straight-line rent and above-market and below-market lease amortization.
Certain operating leases contain early termination options that require advance notification and may include payment of penalty, which, in most cases, is substantial enough to be deemed economically disadvantageous by a tenant to exercise. As of December 31, 2024, approximately 1% of our industrial portfolio square footage and approximately 21% of our office portfolio square footage is subject to early termination provisions. Approximately 4% of our office portfolio that is subject to these early termination provisions have early termination dates prior to January 1, 2028.
During the year ended December 31, 2024, two tenants exercised early lease termination provisions, impacting 56,747 square feet across our industrial and office properties, which represents 0.3% of our combined square footage owned across our industrial and office properties. During the year ended December 31, 2023, two tenants exercised early lease termination provisions, impacting 64,122 square feet across our industrial and office properties, which represents 0.3% of our combined square footage owned across our industrial and office properties.
Results of Operations
The following table sets forth information regarding our consolidated results of operations ($ in thousands):
|
|
|
|
|
|
|
|
|
|
|
|
|
|
|
|
|
|
For the Year Ended December 31, |
|
|
2024 vs. 2023 |
|
|
|
2024 |
|
|
2023 |
|
|
$ |
|
Revenues |
|
|
|
|
|
|
|
|
|
|
|
|
Rental revenue |
|
$ |
|
1,649,291 |
|
|
$ |
|
1,695,917 |
|
|
$ |
|
(46,626 |
) |
Other revenue |
|
|
|
38,494 |
|
|
|
|
58,401 |
|
|
|
|
(19,907 |
) |
Total revenues |
|
|
|
1,687,785 |
|
|
|
|
1,754,318 |
|
|
|
|
(66,533 |
) |
Expenses |
|
|
|
|
|
|
|
|
|
|
|
|
Property operating |
|
|
|
714,991 |
|
|
|
|
748,522 |
|
|
|
|
(33,531 |
) |
General and administrative |
|
|
|
47,048 |
|
|
|
|
45,144 |
|
|
|
|
1,904 |
|
Management fees |
|
|
|
105,356 |
|
|
|
|
153,411 |
|
|
|
|
(48,055 |
) |
Performance participation allocation |
|
|
|
— |
|
|
|
|
— |
|
|
|
|
— |
|
Impairment of investments in real estate |
|
|
|
150,392 |
|
|
|
|
188,804 |
|
|
|
|
(38,412 |
) |
Depreciation and amortization |
|
|
|
742,220 |
|
|
|
|
811,788 |
|
|
|
|
(69,568 |
) |
Total expenses |
|
|
|
1,760,007 |
|
|
|
|
1,947,669 |
|
|
|
|
(187,662 |
) |
Other (expense) income |
|
|
|
|
|
|
|
|
|
|
|
|
Loss from unconsolidated real estate ventures |
|
|
|
(13,435 |
) |
|
|
|
(11,624 |
) |
|
|
|
(1,811 |
) |
Income from investments in real estate debt, net |
|
|
|
95,755 |
|
|
|
|
123,138 |
|
|
|
|
(27,383 |
) |
Net gain on dispositions of real estate |
|
|
|
87,108 |
|
|
|
|
289,818 |
|
|
|
|
(202,710 |
) |
Interest expense |
|
|
|
(641,420 |
) |
|
|
|
(583,476 |
) |
|
|
|
(57,944 |
) |
Loss on extinguishment of debt |
|
|
|
— |
|
|
|
|
(93 |
) |
|
|
|
93 |
|
Other expense, net |
|
|
|
(179,994 |
) |
|
|
|
(299,930 |
) |
|
|
|
119,936 |
|
Total other expense |
|
|
|
(651,986 |
) |
|
|
|
(482,167 |
) |
|
|
|
(169,819 |
) |
Net loss |
|
|
|
(724,208 |
) |
|
|
|
(675,518 |
) |
|
|
|
(48,690 |
) |
Net loss (income) attributable to non-controlling interests in consolidated joint ventures |
|
|
|
3,228 |
|
|
|
|
(3,350 |
) |
|
|
|
6,578 |
|
Net loss attributable to non-controlling
interests in Operating Partnership |
|
|
|
36,097 |
|
|
|
|
29,165 |
|
|
|
|
6,932 |
|
Net loss attributable to stockholders |
|
$ |
|
(684,883 |
) |
|
$ |
|
(649,703 |
) |
|
$ |
|
(35,180 |
) |
Revenues
Rental revenue primarily consists of base rent arising from tenant leases at our multifamily, industrial, office, and other properties. Rental revenue is recognized on a straight-line basis over the life of the lease, including any rent steps or abatement provisions. During the years ended December 31, 2024 and 2023, rental revenue was $1.6 billion and $1.7 billion, respectively. The decrease in rental revenue was driven by a lower average investment in real estate balance as a result of asset dispositions, slightly offset by an increase in average rental rates for multifamily and industrial assets for the year ended December 31, 2024 compared to the year ended December 31, 2023.
Other revenue primarily consists of revenue generated by our hospitality properties. Hospitality revenue consists primarily of room revenue. During the years ended December 31, 2024 and 2023, other revenue was $38.5 million and $58.4 million, respectively, resulting in a year over year decrease of $19.9 million as a result of dispositions of hospitality properties.
Expenses
Property operating expenses consist of the costs of ownership and operation of our real estate investments. Examples of property operating expenses include real estate taxes, insurance, utilities and repair and maintenance expenses. Property operating expenses also include general and administrative expenses unrelated to the operations of the properties. During the years ended December 31, 2024 and 2023, property operating expenses were $715.0 million and $748.5 million, respectively. The decrease was driven primarily by a lower average investment in real estate balance as a result of asset dispositions, offset by an increase in insurance and real estate tax expenses.
General and administrative expenses are corporate-level expenses that relate mainly to our compliance and administration costs and consist primarily of legal fees, accounting fees, transfer agent fees and other professional fees. During the year ended December 31,
2024, general and administrative expenses increased approximately $1.9 million compared to the year ended December 31, 2023 and was primarily driven by an increase in professional fees.
Management fees are earned by our Advisor for providing services pursuant to the Advisory Agreement. During the years ended December 31, 2024 and 2023, management fees were $105.4 million and $153.4 million, respectively. The decrease was primarily due to the reduction in our average NAV from December 31, 2023 to December 31, 2024. The decrease was also driven by the 20% waiver of the Advisor’s management fee effective in May 2024, thereby reducing fees from 1.25% of NAV to 1% of NAV, until our share repurchase plan has been reinstated to the monthly repurchase limit of 2% of NAV and quarterly repurchase limit of 5% of NAV.
Performance participation allocation relates to allocations from the Operating Partnership to the Special Limited Partner based on the total return of the Operating Partnership. Total return is defined as distributions paid or accrued plus the change in NAV. The performance participation allocation is measured annually and any amount earned by the Special Limited Partner becomes payable as of December 31 of the applicable year. During the years ended December 31, 2024 and 2023, there was no performance participation allocation as the return hurdle was not achieved.
During the year ended December 31, 2024, the Company recognized an aggregate of $150.4 million of impairment charges related predominantly to multifamily properties and, to a lesser extent, one hospitality and one industrial property. During the year ended December 31, 2023, the Company recognized an aggregate of $188.8 million of impairment charges related primarily to single-family rental properties.
Depreciation and amortization expenses are impacted by the values assigned to buildings, personal property and in-place lease assets as part of the initial purchase price allocation. During the years ended December 31, 2024 and 2023, depreciation and amortization expenses were $742.2 million and $811.8 million, respectively. The decrease was driven by a lower average investment in real estate balance as a result of asset dispositions during the year ended December 31, 2024 and throughout the year ended December 31, 2023.
Other Expense
During the years ended December 31, 2024 and 2023, income from investments in real estate debt was $95.8 million and $123.1 million, respectively, which consisted of interest income, unrealized gains/(losses) and realized gains/(losses) resulting from changes in the fair value of our real estate debt investments and related hedges. The decrease was primarily driven by the disposition of our investments in real estate debt securities and the disposition of our GBP-denominated term loan investment.
During the year ended December 31, 2024, we recorded $87.1 million of net gains from the disposition of seven industrial properties, two hotel properties, one net lease property, and 83 single-family rental units. During the year ended December 31, 2023, we recorded $289.8 million of net gains from the disposition of 10 multifamily properties, 33 industrial properties, three hotel properties, 2,199 single-family rental units, and one net-lease property.
During the years ended December 31, 2024 and 2023, interest expense was $641.4 million and $583.5 million, respectively, which primarily consisted of interest expense incurred on our mortgage notes, credit facilities, unsecured revolving credit facility and borrowings under our secured financings on investments in real estate debt. The increase was primarily driven by an increase in borrowings on our unsecured line of credit.
During the years ended December 31, 2024 and 2023, other expense was ($180.0) million and ($299.9) million, respectively. These results were primarily driven by unrealized losses of ($221.7) million during the year ended December 31, 2024, compared to unrealized losses of ($332.2) million during the year ended December 31, 2023, relating to the change in the fair value of our interest rate caps and interest rate swaps. The interest rate caps and swaps are used primarily to limit our interest rate payments on certain of our variable rate borrowings.
Refer to Part II, Item 7. Management’s Discussion and Analysis of Financial Condition and Results of Operations in our Annual Report on Form 10-K for the year ended December 31, 2023 for discussion of our consolidated results of operations for the year ended December 31, 2023 compared to the year ended December 31, 2022, which specific discussion is incorporated herein by reference.
Liquidity and Capital Resources
Our primary sources of liquidity include cash and cash equivalents and available borrowings under our unsecured line of credit and senior secured revolving credit facility. The following table summarizes amounts available under these sources as of December 31, 2024 ($ in thousands):
|
|
|
|
|
|
|
|
December 31, 2024 |
|
|
Cash and cash equivalents |
|
$ |
281,512 |
|
|
Available borrowings on undrawn unsecured line of credit |
|
|
188,000 |
|
|
Available borrowings on undrawn senior secured revolving credit facility |
|
|
150,000 |
|
|
Total available liquidity and capital resources |
|
$ |
619,512 |
|
|
Our primary needs for liquidity and capital resources are to fund our investments, to make distributions to our stockholders, to repurchase shares of our common stock pursuant to our share repurchase plan, to pay our offering and operating expenses and capital expenditures and to pay debt service on the outstanding indebtedness we incur. Our operating expenses include, among other things, fees and expenses related to managing our properties and other investments, the management fee we pay to the Advisor (to the extent the Advisor elects to receive the management fee in cash), the performance participation allocation that the Operating Partnership will pay to the Special Limited Partner (to the extent that the Special Limited Partner elects to receive the performance participation allocation in cash) and general corporate expenses.
Our cash needs for acquisitions and other investments will be funded primarily from the sale of shares of our common stock and through the assumption or incurrence of debt. For the year ended December 31, 2024, we raised $0.2 billion of gross proceeds in our public offering. In addition, for the year ended December 31, 2024, we have repurchased $1.1 billion in shares of our common stock under our share repurchase plan.
Other potential future sources of capital include secured or unsecured financings from banks or other lenders and proceeds from the sale of assets and investments in real estate-related debt securities. If necessary, we may use financings or other sources of capital in the event of unforeseen significant capital expenditures. From inception through December 31, 2024, our distributions have been entirely funded from cash flow from operating activities.
The following table is a summary of our indebtedness as of December 31, 2024 and 2023 ($ in thousands):
|
|
|
|
|
|
|
|
|
|
|
|
|
|
|
|
|
|
|
|
|
|
|
|
|
|
Principal Balance Outstanding(3)(4) |
|
Indebtedness |
|
Weighted
Average
Interest Rate(1) |
|
Weighted
Average
Maturity Date(2) |
|
Maximum
Facility
Size |
|
|
December 31,
2024 |
|
|
December 31,
2023 |
|
Fixed rate loans |
|
|
|
|
|
|
|
|
|
|
|
|
|
Fixed rate mortgages |
|
3.09% |
|
April 2031 |
|
N/A |
|
|
$ |
2,978,914 |
|
|
$ |
3,049,322 |
|
Total fixed rate loans |
|
|
|
|
|
|
|
|
|
2,978,914 |
|
|
|
3,049,322 |
|
Variable rate loans |
|
|
|
|
|
|
|
|
|
|
|
|
|
Floating rate mortgages |
|
B + 1.83% |
|
September 2027 |
|
N/A |
|
|
|
9,658,934 |
|
|
|
9,893,894 |
|
Variable rate secured credit facility(5) |
|
B + 2.25% |
|
December 2025 |
|
$164,152 |
|
|
|
164,152 |
|
|
|
165,000 |
|
Senior secured revolving credit facility(6) |
|
B + 2.50% |
|
January 2027 |
|
$150,000 |
|
|
|
— |
|
|
|
— |
|
Total variable rate loans |
|
|
|
|
|
|
|
|
|
9,823,086 |
|
|
|
10,058,894 |
|
Total loans secured by the Company’s
properties |
|
|
|
|
|
|
|
|
|
12,802,000 |
|
|
|
13,108,216 |
|
|
|
|
|
|
|
|
|
|
|
|
|
|
|
Secured financings on investments in real estate debt |
|
B + 2.82% |
|
June 2027 |
|
$ |
468,082 |
|
|
|
468,082 |
|
|
|
763,579 |
|
Unsecured line of credit(7) |
|
B + 2.50% |
|
May 2027 |
|
$ |
1,550,000 |
|
|
|
1,362,000 |
|
|
|
907,500 |
|
Total Indebtedness |
|
|
|
|
|
|
|
|
$ |
14,632,082 |
|
|
$ |
14,779,295 |
|
(1)The symbol “B” refers to the relevant floating benchmark rates, which includes one-month SOFR, NYFED 30 day SOFR, three-month EURIBOR and three-month CIBOR, as applicable to each loan.
(2)For loans where we, at our own discretion, have extension options, the maximum maturity date has been assumed.
(3)The majority of our mortgages contain prepayment provisions including (but not limited to) lockout periods, yield or spread maintenance provisions and fixed penalties.
(4)Excludes a $12.6 million mortgage loan on a property classified as held-for-sale as of December 31, 2024. As of December 31, 2023, there were no properties, and their related mortgage loans, that met the criteria to be classified as held-for-sale.
(5)The repayment of the variable rate secured credit facility is guaranteed by the Operating Partnership.
(6)The repayment of the senior secured revolving credit facility is secured by pledges of ownership interests in holding companies that are directly under the Operating Partnership.
(7)The repayment of the line of credit facility is guaranteed by us.
During the period from January 1, 2025 through March 21, 2025, we repurchased $0.1 billion of common stock under our share repurchase plan.
In January 2025, we received repurchase requests in excess of the 0.33% monthly limit. As per the terms of our share repurchase plan, we honored all repurchase requests for January 2025 on a pro rata basis up to the 0.33% monthly limitation. As such, approximately 4% of each stockholder’s January repurchase request was satisfied.
In February 2025, we received repurchase requests in excess of the 0.33% monthly limit. As per the terms of our share repurchase plan, we honored all repurchase requests for February 2025 on a pro rata basis up to the 0.33% monthly limitation. As such, approximately 4% of each stockholder’s February repurchase request was satisfied.
During the period from January 1, 2025 through March 21, 2025, we repaid $0.3 billion of net borrowings on our unsecured line of credit.
Asset Dispositions
During the period from January 1, 2025 through March 21, 2025, we received $0.2 billion of net proceeds from sales of investments in real estate.
Cash Flows
The following table provides a breakdown of the net change in our cash and cash equivalents and restricted cash ($ in thousands):
|
|
|
|
|
|
|
|
|
|
|
|
|
|
|
|
For the Year Ended |
|
|
December 31, 2024 |
|
|
December 31, 2023 |
|
|
December 31, 2022 |
|
Cash flows provided by operating activities |
$ |
|
429,191 |
|
|
$ |
|
556,567 |
|
|
$ |
|
594,911 |
|
Cash flows provided by (used in) investing activities |
|
|
914,537 |
|
|
|
|
2,231,720 |
|
|
|
|
(6,486,694 |
) |
Cash flows (used in) provided by financing activities |
|
|
(1,365,034 |
) |
|
|
|
(3,193,911 |
) |
|
|
|
5,911,019 |
|
Effect of exchange rate changes |
|
|
3,605 |
|
|
|
|
(10,350 |
) |
|
|
|
(3,182 |
) |
Net (decrease) increase in cash and cash equivalents and restricted cash |
$ |
|
(17,701 |
) |
|
$ |
|
(415,974 |
) |
|
$ |
|
16,054 |
|
Cash flows provided by operating activities decreased $127.4 million during the year ended December 31, 2024 compared to the year ended December 31, 2023. This decrease is primarily attributable to an increase in net interest expense during the period and a reduction in property operating income as a result of asset sales during the year ended December 31, 2023. Cash flows provided by operating activities decreased $38.3 million during the year ended December 31, 2023 compared to the year ended December 31, 2022, primarily due to an increase in interest expense on our borrowings, offset by an increase in net operating income (defined as rental revenue less property operating expenses) on our investments in real estate.
Cash flows provided by investing activities decreased by approximately $1.3 billion during the year December 31, 2024 compared to the year ended December 31, 2023. The decrease was primarily due to a reduction of approximately $1.7 billion in proceeds from dispositions of real estate, offset by an increase of approximately $0.5 billion in proceeds from the dispositions of real estate debt investments and real estate debt securities. Cash flows provided by investing activities increased $8.7 billion during the year ended December 31, 2023 primarily due to a $5.1 billion decrease in real estate acquisitions, $2.2 billion in dispositions of real estate investments, a decrease in term loan originations of $1.1 billion, a $0.5 billion decrease in investment in unconsolidated real estate ventures compared to the year ended December 31, 2022.
Cash flows used in financing activities decreased by approximately $1.8 billion during the year ended December 31, 2024 compared to the year ended December 31, 2023. The decrease was primarily driven by an approximate $1.5 billion decrease in repurchases of our common stock, an approximate $0.7 billion decrease in net borrowings on our mortgage notes, credit facilities and unsecured line of credit, and was offset by approximately $0.2 billion in repayments under secured financings on investments in real estate debt and an approximate $0.2 billion decrease in net proceeds from the issuance of our common stock. Cash flows from financing activities decreased by approximately $9.1 billion during the year ended December 31, 2023. The decrease was primarily due to a $4.5 billion decrease in net proceeds from the issuance of our common stock, a $1.3 billion increase in repurchases of common stock, and a decrease of $2.8 billion of net debt borrowings.
Critical Accounting Policies
The preparation of the financial statements in accordance with GAAP involves significant judgments and assumptions and requires estimates about matters that are inherently uncertain. These judgments will affect our reported amounts of assets and liabilities and our disclosure of contingent assets and liabilities at the dates of the financial statements and the reported amounts of revenue and expenses during the reporting periods. With different estimates or assumptions, materially different amounts could be reported in our financial statements. We consider our accounting policies over investments in real estate and lease intangibles, investments in real estate debt, and revenue recognition to be our critical accounting policies. Refer to Note 2 — “Summary of Significant Accounting Policies” to our consolidated financial statements for further descriptions of such accounting policies.
Recent Accounting Pronouncements
See Note 2 — “Summary of Significant Accounting Policies” to our consolidated financial statements for a discussion concerning recent accounting pronouncements.
Off-Balance Sheet Arrangements
We have no existing off-balance sheet arrangements.
ITEM 8. FINANCIAL STATEMENTS AND SUPPLEMENTARY DATA
For the financial statements required by this item and the reports of the independent accountants thereon required by Item 14(a)(2), see the accompanying Consolidated Financial Statements beginning on page 22.
INDEX TO CONSOLIDATED FINANCIAL STATEMENTS
REPORT OF INDEPENDENT REGISTERED PUBLIC ACCOUNTING FIRM
To the Stockholders and the Board of Directors of Starwood Real Estate Income Trust, Inc.
Opinion on the Financial Statements
We have audited the accompanying consolidated balance sheets of Starwood Real Estate Income Trust, Inc. and subsidiaries (the “Company”) as of December 31, 2024 and 2023, the related consolidated statements of operations and comprehensive loss, changes in equity, and cash flows for each of the three years in the period ended December 31, 2024, and the related notes and the schedule listed in the Index at Item 15 (collectively referred to as the “financial statements”). In our opinion, the financial statements present fairly, in all material respects, the financial position of the Company as of December 31, 2024 and 2023, and the results of its operations and its cash flows for each of the three years in the period ended December 31, 2024, in conformity with accounting principles generally accepted in the United States of America.
Basis for Opinion
These financial statements are the responsibility of the Company’s management. Our responsibility is to express an opinion on the Company’s financial statements based on our audits. We are a public accounting firm registered with the Public Company Accounting Oversight Board (United States) (PCAOB) and are required to be independent with respect to the Company in accordance with the U.S. federal securities laws and the applicable rules and regulations of the Securities and Exchange Commission and the PCAOB.
We conducted our audits in accordance with the standards of the PCAOB. Those standards require that we plan and perform the audit to obtain reasonable assurance about whether the financial statements are free of material misstatement, whether due to error or fraud. The Company is not required to have, nor were we engaged to perform, an audit of its internal control over financial reporting. As part of our audits, we are required to obtain an understanding of internal control over financial reporting but not for the purpose of expressing an opinion on the effectiveness of the Company’s internal control over financial reporting. Accordingly, we express no such opinion.
Our audits included performing procedures to assess the risks of material misstatement of the financial statements, whether due to error or fraud, and performing procedures that respond to those risks. Such procedures included examining, on a test basis, evidence regarding the amounts and disclosures in the financial statements. Our audits also included evaluating the accounting principles used and significant estimates made by management, as well as evaluating the overall presentation of the financial statements. We believe that our audits provide a reasonable basis for our opinion.
Critical Audit Matter
The critical audit matter communicated below is a matter arising from the current-period audit of the financial statements that was communicated or required to be communicated to the audit committee and that (1) relates to accounts or disclosures that are material to the financial statements and (2) involved our especially challenging, subjective, or complex judgments. The communication of critical audit matters does not alter in any way our opinion on the financial statements, taken as a whole, and we are not, by communicating the critical audit matter below, providing a separate opinion on the critical audit matter or on the accounts or disclosures to which it relates.
Impairment of Investments in Real Estate — Refer to Note 2 to the financial statements
Critical Audit Matter Description
The Company’s management reviews its real estate properties for impairment each quarter or when there is an event or change in circumstances that indicates an impaired value. The impairment loss is recognized based on the excess of the carrying amount of the asset over its fair value. The evaluation of anticipated future cash flows is highly subjective and is based in part on assumptions regarding future occupancy, rental rates and capital requirements. Since cash flows on real estate properties considered to be “long-lived assets to be held and used” are considered on an undiscounted basis to determine whether an asset has been impaired, the Company’s strategy of holding real estate properties over the long term decreases the likelihood of recording an impairment loss. The Company uses significant judgment in assessing events or circumstances which may indicate impairment, including but not limited to management’s intended holding periods. If the Company’s strategy changes or market conditions otherwise dictate an earlier sale date, such changes may have a significant impact on the estimates of recoverability and an impairment loss may be recognized.
We identified the estimated holding periods used in determining the recoverability of certain real estate properties as a critical audit matter because of the subjective judgment made by management to determine the holding periods for real estate properties as part of their impairment analysis. This required a higher degree of auditor judgment and an increased extent of effort when performing audit procedures to evaluate the reasonableness of management’s assumption, given the inherent unpredictability involved in the timing of sales of real estate properties.
How the Critical Audit Matter Was Addressed in the Audit
Our audit procedures related to the assessment of the Company’s intended holding periods included the following, among others:
•We held discussions with the Company’s management and evaluated the reasonableness of management’s assertions regarding the intended holding periods of its real estate properties, more specifically by performing the following:
oEngaged in discussions with senior management, including legal and compliance and asset management, and inspected Management Investment Committee and Board of Director meeting minutes regarding the assumption utilized in determining the intended holding periods.
oEvaluated audit evidence (e.g., hindsight analyses and disposition forecast) to determine whether it supported or contradicted the conclusions reached by management.
/s/ Deloitte & Touche LLP
New York, New York
March 21, 2025 (June 13, 2025, as to the effects of the change in reportable segments described in Note 15)
We have served as the Company’s auditor since 2017.
Starwood Real Estate Income Trust, Inc.
Consolidated Balance Sheets
(in thousands, except share and per share data)
|
|
|
|
|
|
|
|
|
|
|
December 31, 2024 |
|
|
December 31, 2023 |
|
Assets |
|
|
|
|
|
|
Investments in real estate, net |
|
$ |
17,830,254 |
|
|
$ |
19,580,358 |
|
Investments in real estate debt |
|
|
852,461 |
|
|
|
1,589,350 |
|
Investments in unconsolidated real estate ventures |
|
|
420,861 |
|
|
|
456,002 |
|
Cash and cash equivalents |
|
|
281,512 |
|
|
|
294,984 |
|
Restricted cash |
|
|
241,422 |
|
|
|
245,651 |
|
Other assets |
|
|
1,365,479 |
|
|
|
947,629 |
|
Total assets |
|
$ |
20,991,989 |
|
|
$ |
23,113,974 |
|
Liabilities and Equity |
|
|
|
|
|
|
Mortgage notes and secured credit facilities, net |
|
$ |
12,744,587 |
|
|
$ |
13,028,910 |
|
Secured financings on investments in real estate debt, net |
|
|
467,988 |
|
|
|
762,352 |
|
Unsecured line of credit |
|
|
1,362,000 |
|
|
|
907,500 |
|
Other liabilities |
|
|
447,095 |
|
|
|
484,358 |
|
Subscriptions received in advance |
|
|
1,113 |
|
|
|
13,225 |
|
Due to affiliates |
|
|
275,601 |
|
|
|
320,957 |
|
Total liabilities |
|
|
15,298,384 |
|
|
|
15,517,302 |
|
|
|
|
|
|
|
|
Commitments and contingencies |
|
|
— |
|
|
|
— |
|
Redeemable non-controlling interests |
|
|
434,878 |
|
|
|
459,862 |
|
|
|
|
|
|
|
|
Equity |
|
|
|
|
|
|
Preferred stock, $0.01 par value per share, 100,000,000 shares authorized;
none issued and outstanding as of December 31, 2024 and December 31, 2023 |
|
|
— |
|
|
|
— |
|
Common stock — Class T shares, $0.01 par value per share, 500,000,000 shares
authorized; 5,055,645 and 5,282,025 shares issued and outstanding as of
December 31, 2024 and December 31, 2023, respectively |
|
|
51 |
|
|
|
53 |
|
Common stock — Class S shares, $0.01 par value per share, 1,000,000,000 shares
authorized; 181,391,241 and 195,023,616 shares issued and outstanding as of
December 31, 2024 and December 31, 2023, respectively |
|
|
1,814 |
|
|
|
1,950 |
|
Common stock — Class D shares, $0.01 par value per share, 500,000,000 shares
authorized; 25,928,114 and 27,512,551 shares issued and outstanding as of
December 31, 2024 and December 31, 2023, respectively |
|
|
259 |
|
|
|
275 |
|
Common stock — Class I shares, $0.01 par value per share, 1,000,000,000 shares
authorized; 189,397,713 and 202,990,052 shares issued and outstanding as of
December 31, 2024 and December 31, 2023, respectively |
|
|
1,894 |
|
|
|
2,030 |
|
Additional paid-in capital |
|
|
8,932,123 |
|
|
|
9,641,219 |
|
Accumulated other comprehensive loss |
|
|
(50,756 |
) |
|
|
(15,729 |
) |
Accumulated deficit and cumulative distributions |
|
|
(3,691,379 |
) |
|
|
(2,537,302 |
) |
Total stockholders’ equity |
|
|
5,194,006 |
|
|
|
7,092,496 |
|
Non-controlling interests in consolidated joint ventures |
|
|
64,721 |
|
|
|
44,314 |
|
Total equity |
|
|
5,258,727 |
|
|
|
7,136,810 |
|
Total liabilities and equity |
|
$ |
20,991,989 |
|
|
$ |
23,113,974 |
|
See accompanying notes to consolidated financial statements.
Starwood Real Estate Income Trust, Inc.
Consolidated Statements of Operations and Comprehensive Loss
(in thousands, except share and per share data)
|
|
|
|
|
|
|
|
|
|
|
|
|
|
|
|
|
|
For the Year Ended December 31, |
|
|
|
2024 |
|
|
2023 |
|
|
2022 |
|
Revenues |
|
|
|
|
|
|
|
|
|
|
|
|
Rental revenue |
|
$ |
|
1,649,291 |
|
|
$ |
|
1,695,917 |
|
|
$ |
|
1,520,655 |
|
Other revenue |
|
|
|
38,494 |
|
|
|
|
58,401 |
|
|
|
|
58,693 |
|
Total revenues |
|
|
|
1,687,785 |
|
|
|
|
1,754,318 |
|
|
|
|
1,579,348 |
|
Expenses |
|
|
|
|
|
|
|
|
|
|
|
|
Property operating |
|
|
|
714,991 |
|
|
|
|
748,522 |
|
|
|
|
650,594 |
|
General and administrative |
|
|
|
47,048 |
|
|
|
|
45,144 |
|
|
|
|
44,708 |
|
Management fees |
|
|
|
105,356 |
|
|
|
|
153,411 |
|
|
|
|
167,100 |
|
Performance participation allocation |
|
|
|
— |
|
|
|
|
— |
|
|
|
|
102,348 |
|
Impairment of investments in real estate |
|
|
|
150,392 |
|
|
|
|
188,804 |
|
|
|
|
— |
|
Depreciation and amortization |
|
|
|
742,220 |
|
|
|
|
811,788 |
|
|
|
|
848,943 |
|
Total expenses |
|
|
|
1,760,007 |
|
|
|
|
1,947,669 |
|
|
|
|
1,813,693 |
|
Other (expense) income |
|
|
|
|
|
|
|
|
|
|
|
|
(Loss) income from unconsolidated real estate ventures |
|
|
|
(13,435 |
) |
|
|
|
(11,624 |
) |
|
|
|
12,189 |
|
Income from investments in real estate debt, net |
|
|
|
95,755 |
|
|
|
|
123,138 |
|
|
|
|
99,787 |
|
Net gain on dispositions of real estate |
|
|
|
87,108 |
|
|
|
|
289,818 |
|
|
|
|
— |
|
Interest expense |
|
|
|
(641,420 |
) |
|
|
|
(583,476 |
) |
|
|
|
(428,853 |
) |
Loss on extinguishment of debt |
|
|
|
— |
|
|
|
|
(93 |
) |
|
|
|
(313 |
) |
Other (expense) income, net |
|
|
|
(179,994 |
) |
|
|
|
(299,930 |
) |
|
|
|
485,608 |
|
Total other (expense) income |
|
|
|
(651,986 |
) |
|
|
|
(482,167 |
) |
|
|
|
168,418 |
|
Net loss |
|
$ |
|
(724,208 |
) |
|
$ |
|
(675,518 |
) |
|
$ |
|
(65,927 |
) |
Net loss (income) attributable to non-controlling
interests in consolidated joint ventures |
|
$ |
|
3,228 |
|
|
$ |
|
(3,350 |
) |
|
$ |
|
(1,927 |
) |
Net loss attributable to non-controlling
interests in Operating Partnership |
|
|
|
36,097 |
|
|
|
|
29,165 |
|
|
|
|
2,146 |
|
Net loss attributable to stockholders |
|
$ |
|
(684,883 |
) |
|
$ |
|
(649,703 |
) |
|
$ |
|
(65,708 |
) |
Net loss per share of common stock, basic and diluted |
|
$ |
|
(1.68 |
) |
|
$ |
|
(1.39 |
) |
|
$ |
|
(0.14 |
) |
Weighted-average shares of common stock
outstanding, basic and diluted |
|
|
|
408,242,726 |
|
|
|
|
467,332,784 |
|
|
|
|
469,864,983 |
|
|
|
|
|
|
|
|
|
|
|
|
|
|
Comprehensive loss: |
|
|
|
|
|
|
|
|
|
|
|
|
Net loss |
|
$ |
|
(724,208 |
) |
|
$ |
|
(675,518 |
) |
|
$ |
|
(65,927 |
) |
Other comprehensive (loss) income item: |
|
|
|
|
|
|
|
|
|
|
|
|
Foreign currency translation adjustments |
|
|
|
(35,027 |
) |
|
|
|
8,578 |
|
|
|
|
(23,777 |
) |
Other comprehensive (loss) income |
|
$ |
|
(35,027 |
) |
|
$ |
|
8,578 |
|
|
$ |
|
(23,777 |
) |
Comprehensive loss |
|
$ |
|
(759,235 |
) |
|
$ |
|
(666,940 |
) |
|
$ |
|
(89,704 |
) |
See accompanying notes to consolidated financial statements.
Starwood Real Estate Income Trust, Inc.
Consolidated Statements of Changes in Equity
(in thousands)
|
|
|
|
|
|
|
|
|
|
|
|
|
|
|
|
|
|
|
|
|
|
|
|
|
|
|
|
|
|
|
|
|
|
|
|
|
|
|
|
|
|
|
|
|
|
|
|
|
|
|
Par Value |
|
|
|
|
|
|
|
|
|
|
|
|
|
|
|
|
|
|
|
|
|
|
|
|
|
|
Common
Stock
Class T |
|
|
Common
Stock
Class S |
|
|
Common
Stock
Class D |
|
|
Common
Stock
Class I |
|
|
Additional
Paid-in
Capital |
|
|
Accumulated
Other
Comprehensive
Loss |
|
|
Accumulated
Deficit and
Cumulative
Distributions |
|
|
Total
Stockholders’
Equity |
|
|
Non-
controlling
Interests |
|
|
Total
Equity |
|
Balance at December 31, 2021 |
$ |
|
46 |
|
|
$ |
|
1,544 |
|
|
$ |
|
221 |
|
|
$ |
|
1,636 |
|
|
$ |
|
7,388,885 |
|
|
$ |
|
(530 |
) |
|
$ |
|
(757,575 |
) |
|
$ |
|
6,634,227 |
|
|
$ |
|
39,491 |
|
|
$ |
|
6,673,718 |
|
Common stock issued, net |
|
|
11 |
|
|
|
|
809 |
|
|
|
|
105 |
|
|
|
|
1,093 |
|
|
|
|
5,419,639 |
|
|
|
|
— |
|
|
|
|
— |
|
|
|
|
5,421,657 |
|
|
|
|
— |
|
|
|
|
5,421,657 |
|
Offering costs, net |
|
|
— |
|
|
|
|
— |
|
|
|
|
— |
|
|
|
|
— |
|
|
|
|
(195,642 |
) |
|
|
|
— |
|
|
|
|
— |
|
|
|
|
(195,642 |
) |
|
|
|
— |
|
|
|
|
(195,642 |
) |
Distribution reinvestments |
|
|
1 |
|
|
|
|
37 |
|
|
|
|
7 |
|
|
|
|
37 |
|
|
|
|
221,011 |
|
|
|
|
— |
|
|
|
|
— |
|
|
|
|
221,093 |
|
|
|
|
— |
|
|
|
|
221,093 |
|
Amortization of restricted stock grants |
|
|
— |
|
|
|
|
— |
|
|
|
|
— |
|
|
|
|
— |
|
|
|
|
894 |
|
|
|
|
— |
|
|
|
|
— |
|
|
|
|
894 |
|
|
|
|
— |
|
|
|
|
894 |
|
Common stock repurchased |
|
|
(1 |
) |
|
|
|
(144 |
) |
|
|
|
(23 |
) |
|
|
|
(321 |
) |
|
|
|
(1,346,819 |
) |
|
|
|
— |
|
|
|
|
— |
|
|
|
|
(1,347,308 |
) |
|
|
|
— |
|
|
|
|
(1,347,308 |
) |
Net loss ($2,146 allocated to redeemable
non-controlling interest) |
|
|
— |
|
|
|
|
— |
|
|
|
|
— |
|
|
|
|
— |
|
|
|
|
— |
|
|
|
|
— |
|
|
|
|
(65,708 |
) |
|
|
|
(65,708 |
) |
|
|
|
1,927 |
|
|
|
|
(63,781 |
) |
Contributions from non-controlling
interests |
|
|
— |
|
|
|
|
— |
|
|
|
|
— |
|
|
|
|
— |
|
|
|
|
— |
|
|
|
|
— |
|
|
|
|
— |
|
|
|
|
— |
|
|
|
|
14,899 |
|
|
|
|
14,899 |
|
Distributions to non-controlling interests |
|
|
— |
|
|
|
|
— |
|
|
|
|
— |
|
|
|
|
— |
|
|
|
|
— |
|
|
|
|
— |
|
|
|
|
— |
|
|
|
|
— |
|
|
|
|
(2,291 |
) |
|
|
|
(2,291 |
) |
Distributions declared on common stock
(see Note 11) |
|
|
— |
|
|
|
|
— |
|
|
|
|
— |
|
|
|
|
— |
|
|
|
|
— |
|
|
|
|
— |
|
|
|
|
(531,973 |
) |
|
|
|
(531,973 |
) |
|
|
|
— |
|
|
|
|
(531,973 |
) |
Other comprehensive loss |
|
|
— |
|
|
|
|
— |
|
|
|
|
— |
|
|
|
|
— |
|
|
|
|
— |
|
|
|
|
(23,777 |
) |
|
|
|
— |
|
|
|
|
(23,777 |
) |
|
|
|
— |
|
|
|
|
(23,777 |
) |
Allocation to redeemable non-controlling
interest |
|
|
— |
|
|
|
|
— |
|
|
|
|
— |
|
|
|
|
— |
|
|
|
|
(21,698 |
) |
|
|
|
— |
|
|
|
|
— |
|
|
|
|
(21,698 |
) |
|
|
|
— |
|
|
|
|
(21,698 |
) |
Balance at December 31, 2022 |
$ |
|
57 |
|
|
$ |
|
2,246 |
|
|
$ |
|
310 |
|
|
$ |
|
2,445 |
|
|
$ |
|
11,466,270 |
|
|
$ |
|
(24,307 |
) |
|
$ |
|
(1,355,256 |
) |
|
$ |
|
10,091,765 |
|
|
$ |
|
54,026 |
|
|
$ |
|
10,145,791 |
|
Common stock issued (transferred) |
$ |
|
(1 |
) |
|
$ |
|
49 |
|
|
$ |
|
(2 |
) |
|
$ |
|
148 |
|
|
$ |
|
502,396 |
|
|
$ |
|
— |
|
|
$ |
|
— |
|
|
$ |
|
502,590 |
|
|
$ |
|
— |
|
|
$ |
|
502,590 |
|
Offering costs, net |
|
|
— |
|
|
|
|
— |
|
|
|
|
— |
|
|
|
|
— |
|
|
|
|
59,039 |
|
|
|
|
— |
|
|
|
|
— |
|
|
|
|
59,039 |
|
|
|
|
— |
|
|
|
|
59,039 |
|
Distribution reinvestments |
|
|
1 |
|
|
|
|
37 |
|
|
|
|
3 |
|
|
|
|
38 |
|
|
|
|
207,306 |
|
|
|
|
— |
|
|
|
|
— |
|
|
|
|
207,385 |
|
|
|
|
— |
|
|
|
|
207,385 |
|
Amortization of restricted stock grants |
|
|
— |
|
|
|
|
— |
|
|
|
|
— |
|
|
|
|
— |
|
|
|
|
840 |
|
|
|
|
— |
|
|
|
|
— |
|
|
|
|
840 |
|
|
|
|
— |
|
|
|
|
840 |
|
Common stock repurchased |
|
|
(4 |
) |
|
|
|
(382 |
) |
|
|
|
(36 |
) |
|
|
|
(601 |
) |
|
|
|
(2,609,472 |
) |
|
|
|
— |
|
|
|
|
— |
|
|
|
|
(2,610,495 |
) |
|
|
|
— |
|
|
|
|
(2,610,495 |
) |
Net loss ($29,165 allocated to redeemable
non-controlling interest) |
|
|
— |
|
|
|
|
— |
|
|
|
|
— |
|
|
|
|
— |
|
|
|
|
— |
|
|
|
|
— |
|
|
|
|
(649,703 |
) |
|
|
|
(649,703 |
) |
|
|
|
3,350 |
|
|
|
|
(646,353 |
) |
Contributions from non-controlling
interests |
|
|
— |
|
|
|
|
— |
|
|
|
|
— |
|
|
|
|
— |
|
|
|
|
— |
|
|
|
|
— |
|
|
|
|
— |
|
|
|
|
— |
|
|
|
|
510 |
|
|
|
|
510 |
|
Distributions to non-controlling interests |
|
|
— |
|
|
|
|
— |
|
|
|
|
— |
|
|
|
|
— |
|
|
|
|
— |
|
|
|
|
— |
|
|
|
|
— |
|
|
|
|
— |
|
|
|
|
(13,572 |
) |
|
|
|
(13,572 |
) |
Distributions declared on common stock
(see Note 11) |
|
|
— |
|
|
|
|
— |
|
|
|
|
— |
|
|
|
|
— |
|
|
|
|
— |
|
|
|
|
— |
|
|
|
|
(532,343 |
) |
|
|
|
(532,343 |
) |
|
|
|
— |
|
|
|
|
(532,343 |
) |
Other comprehensive income |
|
|
— |
|
|
|
|
— |
|
|
|
|
— |
|
|
|
|
— |
|
|
|
|
— |
|
|
|
|
8,578 |
|
|
|
|
— |
|
|
|
|
8,578 |
|
|
|
|
— |
|
|
|
|
8,578 |
|
Allocation to redeemable non-controlling
interest |
|
|
— |
|
|
|
|
— |
|
|
|
|
— |
|
|
|
|
— |
|
|
|
|
14,840 |
|
|
|
|
— |
|
|
|
|
— |
|
|
|
|
14,840 |
|
|
|
|
— |
|
|
|
|
14,840 |
|
Balance at December 31, 2023 |
$ |
|
53 |
|
|
$ |
|
1,950 |
|
|
$ |
|
275 |
|
|
$ |
|
2,030 |
|
|
$ |
|
9,641,219 |
|
|
$ |
|
(15,729 |
) |
|
$ |
|
(2,537,302 |
) |
|
$ |
|
7,092,496 |
|
|
$ |
|
44,314 |
|
|
$ |
|
7,136,810 |
|
Common stock issued (transferred) |
$ |
|
(2 |
) |
|
$ |
|
2 |
|
|
$ |
|
3 |
|
|
$ |
|
95 |
|
|
$ |
|
222,752 |
|
|
$ |
|
— |
|
|
$ |
|
— |
|
|
$ |
|
222,850 |
|
|
$ |
|
— |
|
|
$ |
|
222,850 |
|
Offering costs, net |
|
|
— |
|
|
|
|
— |
|
|
|
|
— |
|
|
|
|
— |
|
|
|
|
(1,156 |
) |
|
|
|
— |
|
|
|
|
— |
|
|
|
|
(1,156 |
) |
|
|
|
(622 |
) |
|
|
|
(1,778 |
) |
Distribution reinvestments |
|
|
1 |
|
|
|
|
37 |
|
|
|
|
5 |
|
|
|
|
32 |
|
|
|
|
171,003 |
|
|
|
|
— |
|
|
|
|
— |
|
|
|
|
171,078 |
|
|
|
|
— |
|
|
|
|
171,078 |
|
Amortization of restricted stock grants |
|
|
— |
|
|
|
|
— |
|
|
|
|
— |
|
|
|
|
— |
|
|
|
|
840 |
|
|
|
|
— |
|
|
|
|
— |
|
|
|
|
840 |
|
|
|
|
— |
|
|
|
|
840 |
|
Common stock repurchased |
|
|
(1 |
) |
|
|
|
(175 |
) |
|
|
|
(24 |
) |
|
|
|
(263 |
) |
|
|
|
(1,065,378 |
) |
|
|
|
— |
|
|
|
|
— |
|
|
|
|
(1,065,841 |
) |
|
|
|
— |
|
|
|
|
(1,065,841 |
) |
Net loss ($36,097 allocated to redeemable
non-controlling interest) |
|
|
— |
|
|
|
|
— |
|
|
|
|
— |
|
|
|
|
— |
|
|
|
|
— |
|
|
|
|
— |
|
|
|
|
(684,883 |
) |
|
|
|
(684,883 |
) |
|
|
|
(3,228 |
) |
|
|
|
(688,111 |
) |
Contributions from non-controlling
interests |
|
|
— |
|
|
|
|
— |
|
|
|
|
— |
|
|
|
|
— |
|
|
|
|
— |
|
|
|
|
— |
|
|
|
|
— |
|
|
|
|
— |
|
|
|
|
26,567 |
|
|
|
|
26,567 |
|
Distributions to non-controlling interests |
|
|
— |
|
|
|
|
— |
|
|
|
|
— |
|
|
|
|
— |
|
|
|
|
— |
|
|
|
|
— |
|
|
|
|
— |
|
|
|
|
— |
|
|
|
|
(2,310 |
) |
|
|
|
(2,310 |
) |
Distributions declared on common stock
(see Note 11) |
|
|
— |
|
|
|
|
— |
|
|
|
|
— |
|
|
|
|
— |
|
|
|
|
— |
|
|
|
|
— |
|
|
|
|
(469,194 |
) |
|
|
|
(469,194 |
) |
|
|
|
— |
|
|
|
|
(469,194 |
) |
Other comprehensive loss |
|
|
— |
|
|
|
|
— |
|
|
|
|
— |
|
|
|
|
— |
|
|
|
|
— |
|
|
|
|
(35,027 |
) |
|
|
|
— |
|
|
|
|
(35,027 |
) |
|
|
|
— |
|
|
|
|
(35,027 |
) |
Allocation to redeemable non-controlling
interest |
|
|
— |
|
|
|
|
— |
|
|
|
|
— |
|
|
|
|
— |
|
|
|
|
(37,157 |
) |
|
|
|
— |
|
|
|
|
— |
|
|
|
|
(37,157 |
) |
|
|
|
— |
|
|
|
|
(37,157 |
) |
Balance at December 31, 2024 |
$ |
|
51 |
|
|
$ |
|
1,814 |
|
|
$ |
|
259 |
|
|
$ |
|
1,894 |
|
|
$ |
|
8,932,123 |
|
|
$ |
|
(50,756 |
) |
|
$ |
|
(3,691,379 |
) |
|
$ |
|
5,194,006 |
|
|
$ |
|
64,721 |
|
|
$ |
|
5,258,727 |
|
See accompanying notes to consolidated financial statements.
Starwood Real Estate Income Trust, Inc.
Consolidated Statements of Cash Flows
(in thousands)
|
|
|
|
|
|
|
|
|
|
|
|
|
|
|
For the Year Ended December 31, |
|
|
|
2024 |
|
|
2023 |
|
|
2022 |
|
Cash flows from operating activities |
|
|
|
|
|
|
|
|
|
Net loss |
|
$ |
(724,208 |
) |
|
$ |
(675,518 |
) |
|
$ |
(65,927 |
) |
Adjustments to reconcile net loss to net cash provided by operating activities |
|
|
|
|
|
|
|
|
|
Management fees |
|
|
105,356 |
|
|
|
153,411 |
|
|
|
167,100 |
|
Performance participation allocation |
|
|
— |
|
|
|
— |
|
|
|
102,348 |
|
Impairment of investments in real estate |
|
|
150,392 |
|
|
|
188,804 |
|
|
|
— |
|
Depreciation and amortization |
|
|
742,220 |
|
|
|
811,788 |
|
|
|
848,943 |
|
Amortization of deferred financing costs |
|
|
22,252 |
|
|
|
35,111 |
|
|
|
37,573 |
|
Straight-line rent amortization |
|
|
(10,213 |
) |
|
|
(13,181 |
) |
|
|
(12,098 |
) |
Deferred income amortization |
|
|
(22,572 |
) |
|
|
(19,796 |
) |
|
|
(13,295 |
) |
Unrealized loss (gain) on changes in fair value of financial instruments |
|
|
153,827 |
|
|
|
349,941 |
|
|
|
(505,658 |
) |
Foreign currency (gain) loss |
|
|
41,062 |
|
|
|
(14,786 |
) |
|
|
49,536 |
|
Loss on extinguishment of debt |
|
|
— |
|
|
|
93 |
|
|
|
313 |
|
Amortization of restricted stock grants |
|
|
840 |
|
|
|
840 |
|
|
|
894 |
|
Net gain on dispositions of investments in real estate |
|
|
(87,108 |
) |
|
|
(289,818 |
) |
|
|
— |
|
Realized loss on sale of investments in real estate debt |
|
|
7,563 |
|
|
|
4,445 |
|
|
|
13,162 |
|
Realized loss on sale of real estate-related equity securities |
|
|
— |
|
|
|
49,181 |
|
|
|
22,021 |
|
Loss from unconsolidated real estate ventures |
|
|
13,435 |
|
|
|
11,624 |
|
|
|
(12,189 |
) |
Distributions of earnings from unconsolidated real estate ventures |
|
|
21,819 |
|
|
|
14,132 |
|
|
|
11,161 |
|
Other items |
|
|
(26,947 |
) |
|
|
(71,584 |
) |
|
|
4,136 |
|
Change in assets and liabilities |
|
|
|
|
|
|
|
|
|
Decrease (increase) in other assets |
|
|
26,022 |
|
|
|
8,707 |
|
|
|
(105,356 |
) |
(Increase) decrease in due to affiliates |
|
|
(1,994 |
) |
|
|
3,340 |
|
|
|
715 |
|
Increase in other liabilities |
|
|
17,445 |
|
|
|
9,833 |
|
|
|
51,532 |
|
Net cash provided by operating activities |
|
|
429,191 |
|
|
|
556,567 |
|
|
|
594,911 |
|
Cash flows from investing activities |
|
|
|
|
|
|
|
|
|
Acquisitions of real estate |
|
|
— |
|
|
|
— |
|
|
|
(5,126,079 |
) |
Proceeds from dispositions of real estate |
|
|
443,158 |
|
|
|
2,179,605 |
|
|
|
— |
|
Capital improvements to real estate |
|
|
(185,536 |
) |
|
|
(180,182 |
) |
|
|
(143,326 |
) |
Contributions to investments in unconsolidated real estate ventures |
|
|
(113 |
) |
|
|
(126 |
) |
|
|
(470,181 |
) |
Origination and purchase of investments in real estate debt |
|
|
— |
|
|
|
— |
|
|
|
(1,091,605 |
) |
Purchase of real estate-related debt and equity securities |
|
|
— |
|
|
|
— |
|
|
|
(85,653 |
) |
Proceeds from paydown of principal and settlement of investments in real estate debt and equity securities |
|
|
641,299 |
|
|
|
180,195 |
|
|
|
372,974 |
|
Purchase of derivative instruments |
|
|
(19,392 |
) |
|
|
(18,628 |
) |
|
|
— |
|
Proceeds from derivative contracts |
|
|
35,121 |
|
|
|
70,856 |
|
|
|
57,176 |
|
Net cash provided by (used in) investing activities |
|
|
914,537 |
|
|
|
2,231,720 |
|
|
|
(6,486,694 |
) |
Cash flows from financing activities |
|
|
|
|
|
|
|
|
|
Proceeds from issuance of common stock, net |
|
|
100,127 |
|
|
|
305,275 |
|
|
|
4,762,264 |
|
Offering costs paid |
|
|
(42,143 |
) |
|
|
(54,404 |
) |
|
|
(75,639 |
) |
Subscriptions received in advance |
|
|
1,113 |
|
|
|
13,225 |
|
|
|
40,221 |
|
Repurchases of common stock |
|
|
(1,065,841 |
) |
|
|
(2,611,115 |
) |
|
|
(1,347,308 |
) |
Borrowings from mortgage notes, secured credit facilities and unsecured line of credit |
|
|
1,257,514 |
|
|
|
2,371,482 |
|
|
|
4,017,869 |
|
Repayments of mortgage notes, secured credit facilities and unsecured line of credit |
|
|
(1,053,477 |
) |
|
|
(2,841,975 |
) |
|
|
(1,638,583 |
) |
Repayments under secured financings on investments in real estate debt, short term, net |
|
|
— |
|
|
|
(5,469 |
) |
|
|
— |
|
Borrowings under secured financings on investments in real estate debt |
|
|
— |
|
|
|
— |
|
|
|
644,128 |
|
Repayments under secured financings on investments in real estate debt |
|
|
(243,384 |
) |
|
|
— |
|
|
|
(128,380 |
) |
Payment of deferred financing costs |
|
|
(17,752 |
) |
|
|
(1,688 |
) |
|
|
(64,252 |
) |
Contributions from non-controlling interests |
|
|
26,567 |
|
|
|
510 |
|
|
|
14,899 |
|
Distributions to non-controlling interests |
|
|
(2,310 |
) |
|
|
(13,572 |
) |
|
|
(2,291 |
) |
Distributions |
|
|
(325,448 |
) |
|
|
(356,180 |
) |
|
|
(311,909 |
) |
Net cash (used in) provided by financing activities |
|
|
(1,365,034 |
) |
|
|
(3,193,911 |
) |
|
|
5,911,019 |
|
Effect of exchange rate changes |
|
|
3,605 |
|
|
|
(10,350 |
) |
|
|
(3,182 |
) |
Net change in cash and cash equivalents and restricted cash |
|
|
(17,701 |
) |
|
|
(415,974 |
) |
|
|
16,054 |
|
Cash and cash equivalents and restricted cash, beginning of the year |
|
|
540,635 |
|
|
|
956,609 |
|
|
|
940,555 |
|
Cash and cash equivalents and restricted cash, end of the year |
|
$ |
522,934 |
|
|
$ |
540,635 |
|
|
$ |
956,609 |
|
Reconciliation of cash and cash equivalents and restricted cash to the consolidated balance sheets: |
|
|
|
|
|
|
|
|
|
Cash and cash equivalents |
|
$ |
281,512 |
|
|
$ |
294,984 |
|
|
$ |
643,516 |
|
Restricted cash |
|
|
241,422 |
|
|
|
245,651 |
|
|
|
313,093 |
|
Total cash and cash equivalents and restricted cash |
|
$ |
522,934 |
|
|
$ |
540,635 |
|
|
$ |
956,609 |
|
Supplemental disclosure of cash flow information: |
|
|
|
|
|
|
|
|
|
Cash paid for interest |
|
$ |
965,385 |
|
|
$ |
913,268 |
|
|
$ |
442,971 |
|
Non-cash investing and financing activities: |
|
|
|
|
|
|
|
|
|
Accrued stockholder servicing fees due to affiliate |
|
$ |
(114 |
) |
|
$ |
(62,323 |
) |
|
$ |
171,464 |
|
Assumption of mortgage notes in conjunction with acquisitions of real estate |
|
$ |
— |
|
|
$ |
— |
|
|
$ |
267,030 |
|
Issuance of Operating Partnership units as consideration for acquisitions of real estate |
|
$ |
— |
|
|
$ |
— |
|
|
$ |
190,459 |
|
Issuance of Class I shares for payment of management fee |
|
$ |
108,503 |
|
|
$ |
157,094 |
|
|
$ |
162,190 |
|
Exchange of redeemable non-controlling interest for Class I shares |
|
$ |
1,144 |
|
|
$ |
— |
|
|
$ |
— |
|
Redeemable non-controlling interest issued as settlement for performance participation allocation |
|
$ |
— |
|
|
$ |
102,348 |
|
|
$ |
204,225 |
|
Accrued distributions |
|
$ |
40,612 |
|
|
$ |
43,044 |
|
|
$ |
49,306 |
|
Distribution reinvestment |
|
$ |
171,078 |
|
|
$ |
207,385 |
|
|
$ |
221,093 |
|
Allocation to redeemable non-controlling interests |
|
$ |
37,157 |
|
|
$ |
14,840 |
|
|
$ |
21,698 |
|
Accrued capital expenditures |
|
$ |
1,616 |
|
|
$ |
6,045 |
|
|
$ |
14,802 |
|
See accompanying notes to consolidated financial statements.
Starwood Real Estate Income Trust, Inc.
Notes to Consolidated Financial Statements
1.Organization and Business Purpose
Starwood Real Estate Income Trust, Inc. (the “Company”) was formed on June 22, 2017 as a Maryland corporation and has elected to be taxed as a real estate investment trust (“REIT”) for U.S. federal income tax purposes. The Company is organized to invest primarily in stabilized, income-oriented commercial real estate and debt secured by commercial real estate. The Company’s portfolio is principally comprised of properties located in the United States. The Company has diversified its portfolio on a global basis through the acquisition of properties outside of the United States, with a focus on Europe. To a lesser extent, the Company has invested in debt secured by commercial real estate and real estate-related securities. The Company is the sole general partner of Starwood REIT Operating Partnership, L.P., a Delaware limited partnership (the “Operating Partnership”). Starwood REIT Special Limited Partner, L.L.C. (the “Special Limited Partner”), a wholly owned subsidiary of Starwood Capital Group Holdings, L.P. (the “Sponsor” and together with any entity that is controlled by, controls or is under common control with the Sponsor, and any of their respective predecessor entities, “Starwood Capital”), owns a special limited partner interest in the Operating Partnership. Substantially all of the Company’s business is conducted through the Operating Partnership. The Company and the Operating Partnership are externally managed by Starwood REIT Advisors, L.L.C. (the “Advisor”), an affiliate of the Sponsor.
On December 27, 2017, the Company commenced its initial public offering of up to $5.0 billion in shares of common stock. On June 2, 2021, the initial public offering terminated and the Company commenced a follow-on public offering of up to $10.0 billion in shares of common stock. On August 10, 2022, the follow-on public offering terminated and the Company commenced its third public offering of up to $18.0 billion in shares of common stock, consisting of up to $16.0 billion in shares in its primary offering and up to $2.0 billion in shares pursuant to its distribution reinvestment plan. As of December 31, 2024, the Company had received aggregate net proceeds of $14.1 billion from the sale of shares of its common stock through its public offerings.
In April 2024, the Company launched a program (the “DST Program”) to raise capital, through its Operating Partnership, through private placement offerings exempt from registration under the Securities Act of 1933, as amended (the “Securities Act”), by selling beneficial interests in specific Delaware statutory trusts (“DSTs”) holding real properties (the “DST Properties”). As of December 31, 2024, the Company has raised approximately $25.8 million in gross offering proceeds through the DST Program.
As of December 31, 2024, the Company owned 461 consolidated real estate properties, 933 single-family rental units, two investments in unconsolidated real estate ventures and one real estate debt investment. As of January 1, 2025, the Company operates in five reportable segments: Multifamily, Industrial, Office, Other, and Investments in Real Estate Debt. As of January 1, 2025, the Single-Family Rental properties and Self-Storage properties segments were combined within the Other properties segment and previous amounts have been recasted to conform with current period presentation. Financial results by segment are reported in Note 15.
2.Summary of Significant Accounting Policies
Principles of Consolidation and Basis of Presentation
The accompanying audited consolidated financial statements have been prepared in accordance with accounting principles generally accepted in the United States of America (“GAAP”). All significant intercompany balances and transactions have been eliminated in consolidation.
The accompanying consolidated financial statements include the accounts of the Company, the Company’s subsidiaries and joint ventures in which the Company has a controlling interest. For consolidated joint ventures, the non-controlling partner’s share of the assets, liabilities and operations of the joint ventures is included in non-controlling interests as equity of the Company. The non-controlling partner’s interest is generally computed as the joint venture partner’s ownership percentage. Certain of the joint ventures formed by the Company provide the other partner a profits interest based on certain return hurdles being achieved. Any profits interest due to the other partner is reported within non-controlling interests.
In determining whether the Company has a controlling financial interest in a partially owned entity and the requirement to consolidate the accounts of that entity, the Company considers whether the entity is a variable interest entity (“VIE”) and whether it is the primary beneficiary. The Company is the primary beneficiary of a VIE when it has (i) the power to direct the most significant activities impacting the economic performance of the VIE and (ii) the obligation to absorb losses or receive benefits significant to the VIE. The Operating Partnership is considered to be a VIE. The Company consolidates the Operating Partnership because it has the ability to direct the most significant activities of the entity such as purchases, dispositions, financings, budgets, and overall operating plans. The Company meets the VIE disclosure exemption criteria, as the Company’s interest in the Operating Partnership is considered a majority voting interest. Where the Company does not have the power to direct the activities of the VIE that most significantly impact its economic performance, the Company’s interest for those partially owned entities are accounted for using the equity method of accounting.
The Company has a DST Program to raise capital through private placement offerings by selling beneficial interests (the “DST Interests”) in specific DSTs holding real properties. Under the DST Program, each private placement offers interest in one or more DST Properties. DST Properties may be sourced from properties currently owned by the Operating Partnership or newly acquired properties. The underlying interest of real properties sold to investors pursuant to such private placements are leased-back to a wholly owned subsidiary of the Operating Partnership on a long-term basis through January 2, 2031, unless sooner terminated pursuant to master lease agreements. These master lease agreements are fully guaranteed by the Operating Partnership in the form of demand notes capitalizing the lessee. Additionally, the Operating Partnership retains a fair market value purchase option giving it the right, but not the obligation, to acquire the interests in the DSTs from the investors at a later time in exchange for Operating Partnership units.
Under the master lease agreements, a wholly owned indirect subsidiary of the Operating Partnership is responsible for subleasing the property to occupying tenants and all underlying costs associated with operating the property and is responsible for paying rent to the DST that owns such property. For financial reporting purposes (and not for income tax purposes), the sale of the DST Properties is accounted for as a failed sale-leaseback transaction and, as a result, the DST Properties are included in the Company’s consolidated balance sheet. The master lease agreements are absolute leases, pursuant to which the master tenant will pay the stated rent and will be responsible for paying leasing costs, operating expenses, real estate taxes, special assessments, sales and use taxes, utilities, insurance and repairs for maintenance related to the DST Properties.
As of December 31, 2024, the Company held two properties through the DST Program and the total investments in real estate, net associated with the DST Properties was $163.0 million. There were no properties held through the DST Program as of December 31, 2023.
The Company has determined that the DST entities are VIEs. The Company has determined that it is the primary beneficiary of these VIEs. As a result, these DST entities are included in the Company’s consolidated financial statements. As of December 31, 2024, the total liabilities of the Company’s consolidated VIEs, excluding the Operating Partnership, were $0.1 billion. Such amounts are included on the Company’s Consolidated Balance Sheets. There were no assets of the Company’s consolidated VIEs as of December 31, 2024, due to certain intercompany eliminations upon consolidation. There were no assets or liabilities in the consolidated VIEs, excluding the Operating Partnership, as of December 31, 2023.
The preparation of financial statements in conformity with GAAP requires management to make estimates and assumptions that affect the reported amounts of assets and liabilities and disclosures of contingent assets and liabilities at the date of the balance sheet. Actual results could differ from those estimates.
Cash and Cash Equivalents
Cash and cash equivalents represent cash held in banks, cash on hand, and liquid investments with original maturities of three months or less. The Company may have bank balances in excess of federally insured amounts; however, the Company deposits its cash and cash equivalents with high credit-quality institutions to minimize credit risk exposure.
Restricted Cash
Restricted cash consists of cash received for subscriptions prior to the date in which the subscriptions are effective, amounts in escrow related to real estate taxes and insurance in connection with mortgages at certain of the Company’s properties, and tenant security deposits. The Company’s restricted cash pertaining to subscriptions received in advance is held primarily in a bank account controlled by the Company’s transfer agent but in the name of the Company.
Investments in Real Estate
In accordance with the guidance for business combinations, the Company determines whether the acquisition of a property qualifies as a business combination, which requires that the assets acquired and liabilities assumed constitute a business. If the property acquired is not a business, the Company accounts for the transaction as an asset acquisition. All property acquisitions to date have been accounted for as asset acquisitions.
Upon the acquisition of a property, the Company assesses the fair value of acquired tangible and intangible assets (including land, buildings, tenant improvements, “above-market” and “below-market” leases, acquired in-place leases, other identified intangible assets and assumed liabilities) and allocates the purchase price to the acquired assets and assumed liabilities. The Company assesses and considers fair value based on estimated cash flow projections that utilize discount and/or capitalization rates that it deems appropriate, as well as other available market information. Estimates of future cash flows are based on a number of factors including the historical operating results, known and anticipated trends and market and economic conditions. The Company capitalizes acquisition-related costs associated with asset acquisitions.
The fair value of the tangible assets of an acquired property considers the value of the property as if it were vacant. The Company also considers an allocation of purchase price of other acquired intangibles, including acquired in-place leases that may have a customer relationship intangible value, including (but not limited to) the nature and extent of the existing relationship with the tenants, the tenants’ credit quality and expectations of lease renewals. Based on its acquisitions to date, the Company’s allocation to customer relationship intangible assets has not been material.
The cost of buildings and improvements includes the purchase price of the Company’s properties and any acquisition-related costs, along with any subsequent improvements to such properties.
The Company’s investments in real estate are stated at cost and are generally depreciated on a straight-line basis over the estimated useful lives of the assets as follows:
|
|
|
Description |
|
Depreciable Life |
Building |
|
30 - 42 years |
Building and land improvements |
|
5 - 30 years |
Furniture, fixtures and equipment |
|
1 - 10 years |
Lease intangibles and leasehold improvements |
|
Shorter of useful life or lease term |
Repairs and maintenance are expensed to operations as incurred and are included in Property operating expenses on the Company’s Consolidated Statements of Operations and Comprehensive Loss. Significant improvements to properties are capitalized. When assets are sold or retired, their costs and related accumulated depreciation are removed from the accounts with the resulting gains or losses reflected in net income or loss for the period.
The Company records acquired above-market and below-market leases at their fair values (using a discount rate which reflects the risks associated with the leases acquired) equal to the difference between (1) the contractual amounts to be received pursuant to each in-place lease and (2) management’s estimate of fair market lease rates for each corresponding in-place lease, measured over a period equal to the remaining term of the lease for above-market leases and the initial term plus the term of any below-market fixed rate renewal options for below-market leases. Other intangible assets acquired include amounts for in-place lease values that are based on the Company’s evaluation of the specific characteristics of each tenant’s lease. Factors to be considered include estimates of carrying costs during hypothetical expected lease-up periods considering current market conditions, and costs to execute similar leases. In estimating carrying costs, the Company includes real estate taxes, insurance and other operating expenses and estimates of lost rentals at market rates during the expected lease-up periods, depending on local market conditions. In estimating costs to execute similar leases, the Company considers leasing commissions, legal and other related expenses.
The amortization of acquired above-market and below-market leases is recorded as an adjustment to Rental revenue on the Company’s Consolidated Statements of Operations and Comprehensive Loss. The amortization of in-place leases is recorded as an adjustment to Depreciation and amortization expense on the Company’s Consolidated Statements of Operations and Comprehensive Loss.
Certain of the Company’s investments in real estate are subject to a ground lease, for which a lease liability and corresponding right-of-use (“ROU”) asset were recognized. The Company calculates the amount of the lease liability and ROU asset by taking the present value of the remaining lease payments, and adjusting the ROU asset for any existing straight-line ground rent liability and acquired ground lease intangibles. The Company’s estimated incremental borrowing rate of a loan with a similar term as the ground lease was used as the discount rate. The lease liability is included as a component of Other liabilities and the related ROU asset is recorded as a component of Investments in real estate, net on the Company’s Consolidated Balance Sheets.
Impairment of Investments in Real Estate
The Company’s management reviews its real estate properties for impairment each quarter or when there is an event or change in circumstances that indicates an impaired value. If the carrying amount of the real estate investment is no longer recoverable and exceeds the fair value of such investment, an impairment loss is recognized. The impairment loss is recognized based on the excess of the carrying amount of the asset over its fair value. The evaluation of anticipated future cash flows is highly subjective and is based in part on assumptions regarding future occupancy, rental rates and capital requirements that could differ materially from actual results. Since cash flows on real estate properties considered to be “long-lived assets to be held and used” are considered on an undiscounted basis to determine whether an asset has been impaired, the Company’s strategy of holding properties over the long term decreases the likelihood of recording an impairment loss. If the Company’s strategy changes or market conditions otherwise dictate an earlier sale date, an impairment loss may be recognized and such loss could be material to the Company’s results. If the Company determines that an impairment has occurred, the affected assets must be reduced to their fair value. Impairment charges are recorded in the Consolidated Statements of Operations and Comprehensive Loss.
During the year ended December 31, 2024, the Company recognized an aggregate $150.4 million of impairment charges related predominantly to multifamily properties and, to a lesser extent, one hospitality property and one industrial property. During the year ended December 31, 2023, the Company recognized an aggregate of $188.8 million of impairment charges related predominantly to single-family rental properties and, to a lesser extent, two hospitality properties, in the Consolidated Statements of Operations and Comprehensive Loss. The estimated fair values of the impaired properties held as of December 31, 2024 and 2023, were primarily based on recently completed sales transactions, letters of intent, or non-binding purchase and sales contracts. During the year ended December 31, 2022, the Company did not recognize any impairment charges on investments in real estate.
Properties Held-for-Sale
The Company classifies the assets and liabilities related to its investments in real estate as held-for-sale when a sale is probable to occur within one year. The Company considers a sale to be probable when a binding contract has been executed, the buyer has posted a non-refundable deposit, and there are limited contingencies to closing. The Company records held-for-sale investments in real estate at the lower of depreciated cost or fair value, less estimated closing costs. Held-for-sale assets and liabilities are presented within Other assets and Other liabilities on the Company’s Consolidated Balance Sheets. As of December 31, 2024, 11 multifamily properties and one hospitality property met the criteria to be classified as held-for-sale. As of December 31, 2023, there were no real estate investments that met the criteria to be classified as held-for-sale.
Investments in Unconsolidated Real Estate Ventures
Investments in unconsolidated joint ventures are initially recorded at cost, and subsequently adjusted for equity in earnings and cash contributions and distributions. Under the equity method of accounting, the net equity investment of the Company is reflected within the Consolidated Balance Sheets, and the Company’s share of net income or loss from the joint ventures is included within the Company’s Consolidated Statements of Operations and Comprehensive Loss. The joint venture agreements may designate different percentage allocations among investors for profits and losses; however, the Company’s recognition of joint venture income or loss generally follows the joint venture’s distribution priorities, which may change upon the achievement of certain investment return thresholds. The Company’s investments in unconsolidated joint ventures are reviewed for impairment quarterly and the Company records impairment charges when events or circumstances change indicating that a decline in the fair values below the carrying values has occurred and such decline is other-than-temporary. The ultimate realization of the investment in unconsolidated joint ventures is dependent on a number of factors, including the performance of each investment and market conditions. During the periods presented, no such impairment occurred.
Investments in Real Estate Debt
The Company’s investments in real estate debt consists of loans secured by real estate and real estate-related securities. The Company classifies its real estate-related securities as trading securities and record such investments at fair value. As such, the resulting unrealized gains and losses of such securities are recorded as a component of Income from investments in real estate debt, net on the Company’s Consolidated Statements of Operations and Comprehensive Loss. During the year ended December 31, 2024, the Company’s real estate-related debt securities portfolio was completely disposed of.
The Company elected the fair value option (“FVO”) for its loans secured by real estate. As such, the resulting unrealized gains and losses of such loans are recorded as a component of Income from investments in real estate debt, net on the Company’s Consolidated Statements of Operations and Comprehensive Loss.
Interest income from the Company’s investments in real estate-related debt securities is recognized over the life of each investment using the effective interest method and is recorded on the accrual basis. Recognition of premiums and discounts associated with these investments is deferred and recorded over the term of the investment as an adjustment to yield. Upfront costs and fees related to items for which the FVO is elected shall be recognized in earnings as incurred and not deferred. Such items are recorded as components of Income from investments in real estate debt on the Company’s Consolidated Statements of Operations and Comprehensive Loss.
Derivative Instruments
The Company uses derivative financial instruments such as interest rate caps, interest rate swaps and foreign currency swaps to manage risks from fluctuations in exchange rates and interest rates.
The Company records its derivatives on its Consolidated Balance Sheets at fair value and such amounts are included as a component of Other assets or Other liabilities. Any changes in the fair value of these derivatives are recorded as components of Other (expense) income, net on the Company’s Consolidated Statements of Operations and Comprehensive Loss.
Foreign Currency
The Company’s functional currency is the U.S. dollar. Nonmonetary assets and liabilities are translated at historical rates and monetary assets and liabilities are translated at exchange rates in effect at the end of the reporting period. Income statement accounts are translated at average rates for the reporting period. Gains and losses from translation of foreign denominated transactions into U.S. dollars are included in current results of operations. Gains and losses resulting from foreign currency transactions are also included in current results of operations. The effects of translating the assets, liabilities and income of the Company’s foreign investments held by entities with functional currencies other than the U.S. dollar are included in the Company’s Consolidated Statements of Operations and Comprehensive Loss. Aggregate foreign currency transaction gains (losses) included in operations totaled ($41.1) million, $14.8 million and ($49.5) million for the years ended December 31, 2024, 2023 and 2022, respectively. These amounts are recorded as a component of Other (expense) income, net in the Company’s Consolidated Statements of Operations and Comprehensive Loss. Cumulative translation adjustments arising from the translation of non-U.S. dollar denominated assets and liabilities are recorded in Other comprehensive (loss) income.
Fair Value Measurements
Under normal market conditions, the fair value of an investment is the amount that would be received to sell an asset or transfer a liability in an orderly transaction between market participants at the measurement date (i.e., the exit price). Additionally, there is a hierarchal framework that prioritizes and ranks the level of market price observability used in measuring investments at fair value. Market price observability is impacted by a number of factors, including the type of investment and the characteristics specific to the investment and the state of the market place, including the existence and transparency of transactions between market participants. Investments with readily available active quoted prices or for which fair value can be measured from actively quoted prices generally will have a higher degree of market price observability and a lesser degree of judgment used in measuring fair value.
Investments measured and reported at fair value are classified and disclosed in one of the following levels within the fair value hierarchy:
Level 1 — quoted prices are available in active markets for identical investments as of the measurement date. The Company does not adjust the quoted price for these investments.
Level 2 — quoted prices are available in markets that are not active or model inputs are based on inputs that are either directly or indirectly observable as of the measurement date.
Level 3 — pricing inputs are unobservable and include instances where there is minimal, if any, market activity for the investment. These inputs require significant judgment or estimation by management or third parties when determining fair value and generally represent anything that does not meet the criteria of Levels 1 and 2. Due to the inherent uncertainty of these estimates, these values may differ materially from the values that would have been used had a ready market for these investments existed.
Valuation of assets and liabilities measured at fair value
The Company’s investments in real estate debt are reported at fair value. The Company’s investments in real estate debt include commercial mortgage-backed securities (“CMBS”). The Company generally determines the fair value of its CMBS investments by utilizing third-party pricing service providers. In determining the value of a particular investment, the pricing service providers may use broker-dealer quotations, reported trades or valuation estimates from their internal pricing models to determine the reported price. The pricing service providers’ internal models for real estate-related securities usually consider the attributes applicable to a particular class of security (e.g., credit rating or seniority), current market data, and estimated cash flows for each class and incorporate deal collateral performance such as prepayment speeds and default rates, as available.
Certain of the Company’s investments in real estate debt include loans secured by real estate, such as its term loans, which may not have readily available market quotations. In such cases, the Company will generally determine the initial value based on the origination amount or acquisition price of such investment if acquired by the Company or the par value of such investment if originated by the Company. Following the initial measurement, the Company will determine fair value by utilizing or reviewing certain of the following inputs (i) market yield data, (ii) discounted cash flow modeling, (iii) collateral asset performance, (iv) local or macro real estate performance, (v) capital market conditions, (vi) debt yield or loan-to-value ratios, and (vii) borrower financial condition and performance.
During the years ended December 31, 2024, 2023, and 2022, the Company recorded net unrealized gains (losses) on its investments in real estate debt securities of $5.3 million, $10.0 million, and ($18.3) million, respectively. The Company’s securities portfolio was completely disposed of by June 30, 2024. Such amounts are recorded as a component of Income from investments in real estate debt, net on the Company’s Consolidated Statements of Operations and Comprehensive Loss.
The Company’s derivative financial instruments are reported at fair value. The Company’s interest rate swap agreements are valued using a discounted cash flow analysis based on the terms of the contract and the forward interest rate curve adjusted for the Company’s non-performance risk. The Company’s interest rate cap positions are valued using models developed by the respective counterparty as well as third party pricing service providers that use as their basis readily observable market parameters (such as forward yield curves and credit default swap data).
The fair values of the Company’s foreign currency forward contracts are determined by comparing the contracted forward exchange rate to the current market exchange rate. The current market exchange rates are determined by using market spot rates, forward rates and interest rate curves for the underlying instruments.
The fair values of the Company’s financial instruments (other than investments in real estate debt, mortgage notes, credit facilities, unsecured line of credit and derivative instruments), including cash and cash equivalents, restricted cash and other financial instruments, approximate their carrying or contract value. The Company utilizes a discounted cash flow model to value its loans secured by real estate (considering loan features, credit quality of the loans and includes a review of market yield data, collateral asset performance, local and macro real estate performance, capital market conditions, debt yield, loan-to-value ratios, borrower financial condition and performance, among other factors). The Company continuously monitors and assesses the credit quality of individual loans including the review of delinquency and loan-to-value ratios on its loans secured by real estate. Such loans have floating interest rates with market terms and there are no underlying credit quality issues as of December 31, 2024.
The following table details the Company’s assets and liabilities measured at fair value on a recurring basis ($ in thousands):
|
|
|
|
|
|
|
|
|
|
|
|
|
|
|
|
|
|
|
|
|
|
|
|
|
|
|
|
|
|
|
|
|
|
|
December 31, 2024 |
|
|
December 31, 2023 |
|
|
|
Level 1 |
|
|
Level 2 |
|
|
Level 3 |
|
|
Total |
|
|
Level 1 |
|
|
Level 2 |
|
|
Level 3 |
|
|
Total |
|
Assets: |
|
|
|
|
|
|
|
|
|
|
|
|
|
|
|
|
|
|
|
|
|
|
|
|
Investments in real estate debt |
|
$ |
— |
|
|
$ |
— |
|
|
$ |
852,461 |
|
|
$ |
852,461 |
|
|
$ |
— |
|
|
$ |
201,070 |
|
|
$ |
1,388,280 |
|
|
$ |
1,589,350 |
|
Derivatives |
|
|
— |
|
|
|
368,871 |
|
|
|
— |
|
|
|
368,871 |
|
|
|
— |
|
|
|
554,263 |
|
|
|
— |
|
|
|
554,263 |
|
Total |
|
$ |
— |
|
|
$ |
368,871 |
|
|
$ |
852,461 |
|
|
$ |
1,221,332 |
|
|
$ |
— |
|
|
$ |
755,333 |
|
|
$ |
1,388,280 |
|
|
$ |
2,143,613 |
|
|
|
|
|
|
|
|
|
|
|
|
|
|
|
|
|
|
|
|
|
|
|
|
|
|
Liabilities: |
|
|
|
|
|
|
|
|
|
|
|
|
|
|
|
|
|
|
|
|
|
|
|
|
Derivatives |
|
$ |
— |
|
|
$ |
9,505 |
|
|
$ |
— |
|
|
$ |
9,505 |
|
|
$ |
— |
|
|
$ |
46,178 |
|
|
$ |
— |
|
|
$ |
46,178 |
|
Total |
|
$ |
— |
|
|
$ |
9,505 |
|
|
$ |
— |
|
|
$ |
9,505 |
|
|
$ |
— |
|
|
$ |
46,178 |
|
|
$ |
— |
|
|
$ |
46,178 |
|
The following table details the Company’s assets measured at fair value on a recurring basis using Level 3 inputs ($ in thousands):
|
|
|
|
|
|
|
Investments in
Real Estate Debt |
|
Balance as of December 31, 2023 |
|
$ |
1,388,280 |
|
Dispositions |
|
|
(438,092 |
) |
Included in net loss |
|
|
|
Foreign currency exchange |
|
|
(93,260 |
) |
Realized losses on dispositions |
|
|
(4,418 |
) |
Unrealized loss |
|
|
(49 |
) |
Balance as of December 31, 2024 |
|
$ |
852,461 |
|
The following table contains the quantitative inputs and assumptions used for items categorized in Level 3 of the fair value hierarchy ($ in thousands):
|
|
|
|
|
|
|
|
|
|
|
|
|
|
|
December 31, 2024 |
|
|
Fair Value |
|
|
Valuation Technique |
|
Unobservable Inputs |
|
Weighted Average |
|
Impact to Valuation from an Increase in Input |
Investments in real estate debt |
|
$ |
852,461 |
|
|
Discounted Cash Flow |
|
Discount Rate |
|
9.5% |
|
Decrease |
|
|
|
|
|
|
|
|
|
|
|
|
|
|
|
December 31, 2023 |
|
|
Fair Value |
|
|
Valuation Technique |
|
Unobservable Inputs |
|
Weighted Average |
|
Impact to Valuation from an Increase in Input |
Investments in real estate debt |
|
$ |
1,388,280 |
|
|
Discounted Cash Flow |
|
Discount Rate |
|
9.7% |
|
Decrease |
Valuation of assets measured at fair value on a nonrecurring basis
Certain of the Company’s assets are not measured at fair value on an ongoing basis but are subject to fair value adjustments, such as when there is evidence of impairment, and therefore measured at fair value on a nonrecurring basis. The Company reviews its real estate properties for impairment each quarter or when there is an event or change in circumstances that indicates an impaired value.
During the year ended December 31, 2024, the Company recognized an aggregate $150.4 million of impairment charges related predominantly to multifamily properties and, to a lesser extent, one hospitality property and one industrial property. During the year ended December 31, 2023, the Company recognized an aggregate of $188.8 million of impairment charges related predominantly to single-family rental properties and, to a lesser extent, two hospitality properties, in the Consolidated Statements of Operations and Comprehensive Loss. During the year ended December 31, 2022, the Company did not recognize any impairment charges on investments in real estate.
As of December 31, 2024 and 2023, the estimated fair value of the Company’s remaining impaired assets was $856.1 million and $53.8 million, respectively. As of December 31, 2024 and 2023, the carrying value of the Company’s remaining impaired assets was $855.6 million and $53.0 million, respectively. The estimated fair values of the impaired properties held as of December 31, 2024 and 2023, were primarily based on recently completed sales transactions, letters of intent, or non-binding purchase and sales contracts. These inputs are considered Level 2 inputs for purposes of the fair value hierarchy. There are inherent uncertainties in making these estimates such as current and future macroeconomic conditions.
Valuation of liabilities not measured at fair value
Fair value of the Company’s indebtedness is estimated by modeling the cash flows required by the Company’s debt agreements and discounting them back to the present value using an appropriate discount rate. Additionally, the Company considers current market rates and conditions by evaluating similar borrowing agreements with comparable loan-to-value ratios and credit profiles. The inputs used in determining the fair value of the Company’s indebtedness are considered Level 3. As of December 31, 2024 and 2023, the fair value of the Company’s mortgage notes, secured credit facilities, and secured financings on investments in real estate debt was approximately $423.3 million and $390.9 million below the outstanding principal balance, respectively.
Deferred Charges
The Company’s deferred charges include financing and leasing costs. Deferred financing costs include legal, structuring and other loan costs incurred by the Company for its financing agreements. Deferred financing costs related to the Company’s mortgage notes are recorded as an offset to the related liability and amortized over the term of the applicable financing instruments as interest expense. Deferred financing costs related to the Company’s credit facilities and its unsecured line of credit are recorded as a component of Other assets on the Company’s Consolidated Balance Sheets and amortized over the term of the applicable financing agreement. Deferred leasing costs incurred in connection with new leases, which consist primarily of brokerage commissions, are recorded as a component of Other assets on the Company’s Consolidated Balance Sheets and amortized over the life of the related lease.
The Company commences revenue recognition on its leases based on a number of factors, including the initial determination that the contract is or contains a lease. Generally, all of the Company’s contracts are, or contain leases, and therefore revenue is recognized when the lessee takes possession of or controls the physical use of the leased assets. In most instances this occurs on the lease commencement date. At the inception or acquisition of a lease, including new leases that arise from amendments, the Company assesses the terms and conditions of the lease to determine the proper lease classification.
A lease is classified as an operating lease if none of the following criteria are met: (i) ownership transfers to the lessee at the end of the lease term, (ii) the lessee has a purchase option that is reasonably expected to be exercised, (iii) the lease term is for a major part of the economic life of the leased property, (iv) the present value of the future lease payments and any residual value guaranteed by the lessee that is not already reflected in the lease payments equals or exceeds substantially all of the fair value of the leased property, and (v) the leased property is of such a specialized nature that it is expected to have no future alternative use to the Company at the end of the lease term. If one or more of these criteria are met, the lease will generally be classified as a sales-type lease, unless the lease contains a residual value guarantee from a third party other than the lessee, in which case it would be classified as a direct financing lease under certain circumstances in accordance with ASC 842, Leases.
The Company’s rental revenue primarily consists of fixed contractual base rent arising from tenant leases at the Company’s properties under operating leases. Revenue under operating leases that are deemed probable of collection, is recognized as revenue on a straight-line basis over the non-cancelable terms of the related leases. For leases that have fixed and measurable rent escalations, the difference between such rental income earned and the cash rent due under the provisions of the lease is recorded on the Company’s Consolidated Balance Sheets. The Company’s Hospitality revenue consists of room revenue and food and beverage revenue. Room revenue is recognized when the related room is occupied and other hospitality revenue is recognized when the service is rendered. For leases that are deemed not probable of collection, revenue is recorded as the lesser of (i) the amount which would be recognized on a straight-line basis or (ii) cash that has been received from the tenant, with any tenant and deferred rent receivable balances charged as a direct write-off against rental income in the period of the change in the collectability determination.
Certain of the Company’s contracts contain nonlease components (e.g., charges for management fees, common area maintenance, and reimbursement of third-party maintenance expenses) in addition to lease components (i.e., monthly rental charges). Services related to nonlease components are provided over the same period of time as, and billed in the same manner as, monthly rental charges. The Company elected to apply the practical expedient available under ASC 842, for all classes of assets, not to segregate the lease components from the nonlease components when accounting for operating leases. Since the lease component is the predominant component under each of these leases, combined revenues from both the lease and nonlease components are accounted for in accordance with ASC 842 and reported as Rental revenues in the Company’s Consolidated Statements of Operations and Comprehensive Loss.
In connection with its investments, the Company has utilized loan programs designed to encourage housing development. The proceeds from these loans are governed by restrictive covenants. For certain housing development loans, so long as the Company remains in compliance with the covenants and program requirements, the loans will be forgiven in equal annual installments until the loans are discharged in full. The Company treats these loans as deferred income and records them as a component of Other liabilities on the Company’s Consolidated Balance Sheets. As of December 31, 2024 and 2023, deferred income related to these loans amounted to $3.4 million and $3.4 million, respectively. As the loan balances are reduced during the compliance period, the Company will record income associated with the discharge of the loans as a component of Other revenue in the Company’s Consolidated Statements of Operations and Comprehensive Loss. For each of the years ended December 31, 2024, 2023 and 2022, Other revenue related to these loans amounted to $0.8 million.
Other revenues and interest income are recorded on an accrual basis.
Organization and Offering Expenses
Organization costs are expensed as incurred and recorded as a component of General and administrative expenses in the Company’s Consolidated Statements of Operations and Comprehensive Loss and offering costs are charged to equity as such amounts are incurred.
The Advisor advanced $7.3 million of organization and offering expenses on behalf of the Company (including legal, accounting, and other expenses attributable to the organization, but excluding upfront selling commissions, dealer manager fees and stockholder servicing fees) through December 21, 2019, the first anniversary of the date on which the proceeds from escrow were released. The Company reimbursed the Advisor for all such advanced expenses ratably over a 60 month period, which commenced in January 2020, and these amounts were fully reimbursed as of December 31, 2024. These organization and offering costs were recorded as a component of Due to affiliates on the Company’s Consolidated Balance Sheets as of December 31, 2023.
Starwood Capital, L.L.C. (the “Dealer Manager”), a registered broker-dealer affiliated with the Advisor, serves as the dealer manager for the Company’s public offering. The Dealer Manager is entitled to receive selling commissions and dealer manager fees based on the transaction price of each applicable class of shares sold in the primary offering. The Dealer Manager is also entitled to receive a stockholder servicing fee based on the aggregate net asset value (“NAV”) of the Company’s outstanding Class T shares, Class S shares and Class D shares.
The following table details the selling commissions, dealer manager fees, and stockholder servicing fees for each applicable share class as of December 31, 2024:
|
|
|
|
|
|
|
|
|
|
|
Common
Stock
Class T |
|
Common
Stock
Class S |
|
Common
Stock
Class D |
|
Common
Stock
Class I |
Selling commissions and dealer manager fees
(% of transaction price) |
|
up to 3.5% |
|
up to 3.5% |
|
up to 1.5% |
|
— |
Stockholder servicing fee (% of NAV) |
|
0.85% |
|
0.85% |
|
0.25% |
|
— |
For Class T shares sold in the primary offering, investors will pay upfront selling commissions of up to 3.0% of the transaction price and upfront dealer manager fees of 0.5% of the transaction price, however such amounts may vary at certain participating broker-dealers, provided that the sum will not exceed 3.5% of the transaction price. For Class S shares sold in the primary offering, investors will pay upfront selling commissions of up to 3.5% of the transaction price. For Class D shares sold in the primary offering, investors will pay upfront selling commissions of up to 1.5% of the transaction price.
The Dealer Manager is entitled to receive stockholder servicing fees of 0.85% per annum of the aggregate NAV for Class S shares and Class T shares. For Class T shares such stockholder servicing fee includes, a representative stockholder servicing fee of 0.65% per annum, and a dealer stockholder servicing fee of 0.20% per annum, of the aggregate NAV for the Class T shares, however, with respect to Class T shares sold through certain participating broker-dealers, the representative stockholder servicing fee and the dealer stockholder servicing fee may be other amounts, provided that the sum of such fees will always equal 0.85% per annum of the NAV of such shares. For Class D shares the Dealer Manager is entitled to a stockholder servicing fee equal to 0.25% per annum of the aggregate NAV for the Class D shares. There is no stockholder servicing fee with respect to Class I shares.
The Dealer Manager has entered into agreements with the selected dealers distributing the Company’s shares in the Company’s public offering, which provide, among other things, for the re-allowance of the full amount of the selling commissions and dealer manager fees received and all or a portion of the stockholder servicing fees to such selected dealers. The Company will cease paying the stockholder servicing fee with respect to any Class T share, Class S share or Class D share sold in the primary offering at the end of the month in which the total selling commissions, dealer manager fees and stockholder servicing fees paid with respect to the shares held by such stockholder within such account would exceed 8.75% (or, in the case of Class T shares sold through certain participating broker-dealers, a lower limit as set forth in any applicable agreement between the Dealer Manager and a participating broker-dealer) of the gross proceeds from the sale of such share (including the gross proceeds of any shares issued under the Company’s distribution reinvestment plan with respect thereto). The Company will accrue the full cost of the stockholder servicing fee as an offering cost at the time each Class T, Class S and Class D share is sold during the offering. As of December 31, 2024 and 2023, the Company had accrued $262.3 million and $301.0 million, respectively, of stockholder servicing fees related to shares sold and recorded such amount as a component of Due to affiliates on the Company’s Consolidated Balance Sheets.
Income Taxes
The Company elected to be taxed as a REIT under the Internal Revenue Code (the “Code”), for federal income tax purposes, beginning with its taxable year ended December 31, 2019. As long as the Company qualifies for taxation as a REIT, it generally will not be subject to U.S. federal corporate income tax on its net taxable income that is currently distributed to its stockholders. A REIT is subject to a number of organizational and operational requirements, including a requirement that it currently distributes at least 90% of its REIT taxable income (subject to certain adjustments) to its stockholders. If the Company fails to qualify as a REIT in a taxable year, without the benefit of certain relief provisions, it will be subject to federal and state income tax on its taxable income at regular corporate tax rates. Even if the Company qualifies for taxation as a REIT, it may also be subject to certain federal, state, local, and foreign taxes on its income and assets, including (i) taxes on any undistributed income, (ii) taxes related to its taxable REIT subsidiaries (“TRSs”), and (iii) certain state or local income taxes. The Company and the Operating Partnership’s tax returns for three years from the date filed are subject to examination.
The Company has formed wholly-owned subsidiaries to function as TRSs and filed TRS elections, together with such subsidiaries, with the Internal Revenue Service. In general, a TRS may perform additional services for the Company’s tenants and generally may engage in any real estate or non-real estate-related business other than management or operation of a lodging facility or a health care facility. The TRSs are subject to taxation at the federal, state, local, and foreign levels, as applicable, at regular corporate tax rates. The Company accounts for applicable income taxes by utilizing the asset and liability method. As such, the Company records deferred tax assets and liabilities for the future tax consequences resulting from the difference between the carrying value of existing assets and liabilities and their respective tax basis. A valuation allowance for deferred tax assets is provided if the Company believes all or some portion of the deferred tax asset may not be realized.
The Organization for Economic Co-operation and Development (“OECD”) has a framework to implement a global minimum corporate tax of 15% for companies with global revenues and profits above certain thresholds (referred to as “Pillar 2”), with certain aspects of Pillar 2 effective January 1, 2024 and other aspects effective January 1, 2025. While it is uncertain whether the United States will enact legislation to adopt Pillar 2, certain foreign jurisdictions where the Company owns real estate assets has adopted legislation. The Company does not expect Pillar 2 to have a material impact on the Company’s effective tax rate or the Company’s Consolidated Statements of Operations and Comprehensive Loss.
For the years ended December 31, 2024, 2023 and 2022, the Company recognized an income tax expense of ($10.1) million, ($5.0) million and ($2.1) million, respectively, within Other (expense) income, net in the Company’s Consolidated Statements of Operations and Comprehensive Loss. As of December 31, 2024 and 2023, the Company recorded a net deferred tax liability of $35.5 million and $30.7 million, respectively, primarily due to assumed capital gains from three European investments, within Other liabilities on the Company’s Consolidated Balance Sheets.
As of December 31, 2024, net operating loss (“NOL”) carryforwards for federal, state and foreign income tax purposes totaled $93.2 million, and are primarily driven by dispositions of residential rental units within one of the Company’s TRSs and valuation adjustments in certain foreign jurisdictions. Although the federal NOL carryforwards do not expire, the Company has recorded full valuation allowances against certain deferred tax assets for which the Company believes it is more likely than not that the Company will not realize a benefit from these in future taxable years.
Net Loss per Share
Basic net loss per share is computed by dividing net loss attributable to stockholders for the period by the weighted average number of common shares outstanding during the period. All classes of common stock are allocated net loss at the same rate per share and receive the same gross distribution per share. Diluted loss per share is computed by dividing net loss attributable to stockholders for the period by the weighted average number of common shares and common share equivalents outstanding (unless their effect is antidilutive) for the period. There are no common share equivalents outstanding that would have a dilutive effect as a result of the net loss, and accordingly, the weighted average number of common shares outstanding is identical for both basic and diluted shares for the years ended December 31, 2024, 2023 and 2022.
The restricted stock grants of Class I shares held by the Company’s independent directors are not considered to be participating securities because they do not contain non-forfeitable rights to distributions. As a result, there is no impact of these restricted stock grants on basic and diluted net loss per common share until the restricted stock grants have fully vested.
Recent Accounting Pronouncements
In November 2023, the Financial Accounting Standards Board issued Accounting Standards Update 2023-07, “Segment Reporting (Topic 280): Improvements to Reportable Segment Disclosures” (“ASU 2023-07”). The amendments are intended to increase reportable segment disclosure requirements primarily through enhanced disclosures of significant segment expenses that are readily provided to the chief operating decision maker (“CODM”) and included in segment profit or loss and disclosure of the title and position of the CODM and how the CODM uses the reported segment measures in assessing segment performance and deciding how to allocate resources. ASU 2023-07 is effective on a retrospective basis for fiscal years beginning after December 15, 2023, and interim periods within fiscal years beginning after December 15, 2024. The Company adopted ASU 2023-07 retrospectively as of January 1, 2024. Refer to Note 15 — “Segment Reporting” for the impact of the adoption of this standard. The adoption of ASU 2023-07 did not have a material impact on the consolidated financial statements.
In November 2024, the FASB issued Accounting Standards Update No. 2024-03, “Income Statement — Reporting Comprehensive Income — Expense Disaggregation Disclosures (Subtopic 220-40): Disaggregation of Income Statement Expenses” (“ASU 2024-03”), which requires disclosure of certain costs and expenses on an interim and annual basis in the notes to the consolidated financial statements. The guidance is effective for annual reporting periods beginning after December 15, 2026 and interim periods within annual reporting periods beginning after December 15, 2027. Early adoption is permitted. The guidance is to be applied either (1) prospectively to financial statements issued for reporting periods after the effective date or (2) retrospectively to any or all prior periods presented in the financial statements. The Company is currently evaluating the potential impact of adopting this standard on the consolidated financial statements and related disclosures.
Investments in Real Estate
Investments in real estate, net consisted of the following ($ in thousands):
|
|
|
|
|
|
|
|
|
|
|
December 31, 2024 |
|
|
December 31, 2023 |
|
Building and building improvements |
|
$ |
16,614,464 |
|
|
$ |
17,612,162 |
|
Land and land improvements |
|
|
2,965,720 |
|
|
|
3,144,932 |
|
Furniture, fixtures and equipment |
|
|
272,521 |
|
|
|
304,650 |
|
Right-of-use asset - operating lease(1) |
|
|
105,230 |
|
|
|
105,230 |
|
Total |
|
|
19,957,935 |
|
|
|
21,166,974 |
|
Accumulated depreciation and amortization |
|
|
(2,127,681 |
) |
|
|
(1,586,616 |
) |
Investments in real estate, net |
|
$ |
17,830,254 |
|
|
$ |
19,580,358 |
|
(1)Refer to Note 14 for additional details on the Company’s leases.
Asset Acquisitions
The Company did not acquire any investments in real estate during the years ended December 31, 2024, 2023 and 2022.
Asset Dispositions
During the year ended December 31, 2024, the Company sold an aggregate of $0.3 billion of investments in real estate, net, generating total net cash proceeds, net of mortgage repayments, of approximately $0.2 billion. During the year ended December 31, 2024, the Company recorded $87.1 million of net gains from the disposition of seven industrial properties, two hospitality properties, one net lease property, and 83 single-family rental units.
During the year ended December 31, 2023, the Company sold an aggregate of $1.9 billion of investments in real estate, net, generating total net cash proceeds, net of mortgage repayments, of approximately $775.9 million. During the year ended December 31, 2023, the Company recorded $289.8 million of net gains from the disposition of 10 multifamily properties, 33 industrial properties, three hospitality properties, 2,199 single-family rental units, and one net-lease property.
During the year ended December 31, 2022, there were no dispositions of investments in real estate.
Investments in Real Estate - Held-for-sale
As of December 31, 2024, 11 multifamily properties and one hospitality property met the criteria to be classified as held-for-sale. As of December 31, 2023, there were no real estate investments that met the criteria to be classified as held-for-sale. The held-for-sale assets and liabilities associated with assets held-for-sale are included as components of Other assets and Other liabilities, respectively, on the Company’s Consolidated Balance Sheets.
The following table details the assets and liabilities of the Company’s investments in real estate classified as held-for-sale ($ in thousands):
|
|
|
|
|
|
|
|
|
|
|
December 31, 2024 |
|
|
December 31, 2023 |
|
Assets: |
|
|
|
|
|
|
Investments in real estate, net |
|
$ |
679,121 |
|
|
$ |
— |
|
Other assets |
|
|
6,553 |
|
|
|
— |
|
Total assets |
|
$ |
685,674 |
|
|
$ |
— |
|
|
|
|
|
|
|
|
Liabilities: |
|
|
|
|
|
|
Mortgage notes, net |
|
$ |
12,602 |
|
|
$ |
— |
|
Other liabilities |
|
|
5,655 |
|
|
|
— |
|
Total liabilities |
|
$ |
18,257 |
|
|
$ |
— |
|
Investments in Unconsolidated Real Estate Ventures
The following table details the Company’s equity investments in unconsolidated real estate ventures ($ in thousands):
|
|
|
|
|
|
|
|
|
|
|
|
|
|
|
|
|
Investments in Unconsolidated
Real Estate Ventures |
|
Segment |
|
Date
Acquired |
|
Number of Properties |
|
Ownership Interest |
|
December 31, 2024 |
|
|
December 31, 2023 |
|
Extended Stay Portfolio |
|
Other |
|
July 2022 |
|
196 |
|
45% |
|
$ |
411,309 |
|
|
$ |
446,424 |
|
Fort Lauderdale Hotel |
|
Other |
|
March 2019 |
|
1 |
|
43% |
|
|
9,552 |
|
|
|
9,578 |
|
Total investments in unconsolidated real estate ventures |
|
|
|
|
|
$ |
420,861 |
|
|
$ |
456,002 |
|
The following table details the Company’s (loss) income from equity investments in unconsolidated real estate ventures ($ in thousands):
|
|
|
|
|
|
|
|
|
|
|
|
|
|
|
|
|
|
|
Year Ended December 31, |
|
Investments in Unconsolidated Real Estate Ventures |
|
Segment |
|
2024 |
|
|
2023 |
|
|
2022 |
|
Extended Stay Portfolio |
|
Other |
|
$ |
(13,790 |
) |
|
$ |
(11,266 |
) |
|
$ |
11,915 |
|
Fort Lauderdale Hotel |
|
Other |
|
|
355 |
|
|
|
(358 |
) |
|
|
274 |
|
Total (loss) income from unconsolidated real estate ventures |
$ |
(13,435 |
) |
|
$ |
(11,624 |
) |
|
$ |
12,189 |
|
The gross carrying amount and accumulated amortization of the Company’s intangible assets and liabilities consisted of the following ($ in thousands):
|
|
|
|
|
|
|
|
|
|
|
December 31, 2024 |
|
|
December 31, 2023 |
|
Intangible assets: (1) |
|
|
|
|
|
|
|
In-place lease intangibles |
$ |
|
226,714 |
|
|
$ |
|
292,348 |
|
Above-market lease intangibles |
|
|
35,344 |
|
|
|
|
44,463 |
|
Other |
|
|
35,345 |
|
|
|
|
41,823 |
|
Total intangible assets |
|
|
297,403 |
|
|
|
|
378,634 |
|
Accumulated amortization: |
|
|
|
|
|
|
|
In-place lease amortization |
|
|
(106,980 |
) |
|
|
|
(127,185 |
) |
Above-market lease amortization |
|
|
(16,348 |
) |
|
|
|
(18,913 |
) |
Other |
|
|
(12,130 |
) |
|
|
|
(12,500 |
) |
Total accumulated amortization |
|
|
(135,458 |
) |
|
|
|
(158,598 |
) |
Intangible assets, net |
$ |
|
161,945 |
|
|
$ |
|
220,036 |
|
Intangible liabilities: (2) |
|
|
|
|
|
|
|
Below-market lease intangibles |
$ |
|
74,189 |
|
|
$ |
|
87,173 |
|
Total intangible liabilities |
|
|
74,189 |
|
|
|
|
87,173 |
|
Accumulated amortization: |
|
|
|
|
|
|
|
Below-market lease amortization |
|
|
(26,588 |
) |
|
|
|
(27,606 |
) |
Total accumulated amortization |
|
|
(26,588 |
) |
|
|
|
(27,606 |
) |
Intangible liabilities, net |
$ |
|
47,601 |
|
|
$ |
|
59,567 |
|
(1)Included in Other assets on the Company’s Consolidated Balance Sheets.
(2)Included in Other liabilities on the Company’s Consolidated Balance Sheets.
The estimated future amortization on the Company’s intangibles for each of the next five years and thereafter as of December 31, 2024 is as follows ($ in thousands):
|
|
|
|
|
|
|
|
|
|
|
|
|
|
|
|
|
|
|
In-place
Lease Intangibles |
|
|
Above-market
Lease Intangibles |
|
|
Other |
|
|
Below-market
Lease Intangibles |
|
2025 |
|
$ |
24,511 |
|
|
$ |
3,778 |
|
|
$ |
2,694 |
|
|
$ |
(6,211 |
) |
2026 |
|
|
20,119 |
|
|
|
3,528 |
|
|
|
2,694 |
|
|
|
(5,602 |
) |
2027 |
|
|
16,661 |
|
|
|
2,990 |
|
|
|
2,694 |
|
|
|
(4,716 |
) |
2028 |
|
|
13,373 |
|
|
|
2,432 |
|
|
|
2,693 |
|
|
|
(4,654 |
) |
2029 |
|
|
10,931 |
|
|
|
2,342 |
|
|
|
3,399 |
|
|
|
(3,869 |
) |
Thereafter |
|
|
34,139 |
|
|
|
3,926 |
|
|
|
9,041 |
|
|
|
(22,549 |
) |
|
|
$ |
119,734 |
|
|
$ |
18,996 |
|
|
$ |
23,215 |
|
|
$ |
(47,601 |
) |
5.Investments in Real Estate Debt
The following tables detail the Company’s investments in real estate debt as of December 31, 2024 and 2023 ($ in thousands):
|
|
|
|
|
|
|
|
|
|
|
|
|
|
|
|
|
|
|
December 31, 2024 |
|
Type of Security/Loan |
|
Number of Positions |
|
Coupon (1) |
|
Maturity Date |
|
Cost Basis |
|
|
Fair Value |
|
Term loan |
|
1 |
|
B + 4.75% |
|
June 2027 |
|
$ |
956,877 |
|
|
$ |
852,461 |
|
Total investments in real estate debt |
|
1 |
|
B + 4.75% |
|
June 2027 |
|
$ |
956,877 |
|
|
$ |
852,461 |
|
|
|
|
|
|
|
|
|
|
|
|
|
|
|
|
|
|
|
|
December 31, 2023 |
|
Type of Security/Loan |
|
Number of
Positions |
|
Weighted
Average
Coupon (1) |
|
Weighted Average
Maturity Date (2) |
|
Cost Basis |
|
|
Fair Value |
|
CMBS - floating |
|
6 |
|
B + 4.69% |
|
October 2036 |
|
$ |
206,252 |
|
|
$ |
201,070 |
|
Term loans |
|
2 |
|
B + 4.95% |
|
January 2027 |
|
|
1,451,462 |
|
|
|
1,388,280 |
|
Total investments in real estate debt |
|
8 |
|
B + 4.92% |
|
March 2028 |
|
$ |
1,657,714 |
|
|
$ |
1,589,350 |
|
__________
(1)The symbol “B” refers to the relevant benchmark rates, which includes one-month Secured Overnight Financing Rate (“SOFR”), three-month Bank Bill Swap Bid Rate (“BBSY”) and Sterling Overnight Index Average (“SONIA”) as applicable to each security and loan.
(2)Weighted average maturity date is based on the fully extended maturity date of the underlying collateral.
During June 2022, the Company provided financing in the form of a term loan to an unaffiliated entity in connection with its acquisition of Australia’s largest hotel and casino company. The loan is in the amount of AUD 1,377 million and has an initial term of five years, with a two-year extension option. The loan is pre-payable at the option of the borrower at any time.
During February 2021, the Company provided financing in the form of a term loan to an unaffiliated entity in connection with its acquisition of a premier United Kingdom holiday company. The original loan was in the amount of £360 million and has an initial term of five years, with a two-year extension option. The loan was pre-payable at the option of the borrower at any time. In November 2023, the borrower partially prepaid £8.0 million of the original loan amount.
In June 2024, the Company disposed of the remaining £352.0 million of the original loan amount. In connection with the disposition, the Company repaid all related borrowings under secured financing agreements of £193.6 million. During the year ended December 31, 2024, the Company recorded $4.4 million of net realized losses from the disposition of this investment in real estate debt, which is included in Income from investments in real estate debt, net in the Consolidated Statements of Operations and Comprehensive Loss.
During the year ended December 31, 2024, the Company disposed of $201.1 million of investments in real estate-related debt securities and recorded net realized losses resulting from these dispositions of $3.1 million. Such amounts are recorded as a component of Income from investments in real estate debt, net on the Company’s Consolidated Statements of Operations and Comprehensive Loss.
During the year ended December 31, 2023, the Company recorded net realized losses on its investments in real estate-related debt securities of $4.4 million. During the year ended December 31, 2022, the Company recorded net realized losses on its investments in real estate debt securities of $13.2 million. Such amounts are recorded as a component of Income from investments in real estate debt, net in the Company’s Consolidated Statements of Operations and Comprehensive Loss.
6.Mortgage Notes and Secured Credit Facilities
The following table is a summary of the mortgage notes and credit facilities secured by the Company’s properties as of December 31, 2024 and 2023 ($ in thousands):
|
|
|
|
|
|
|
|
|
|
|
|
|
|
|
|
|
|
|
|
|
|
|
Principal Balance Outstanding(3)(4) |
|
Indebtedness |
|
Weighted
Average
Interest Rate(1) |
|
Weighted
Average
Maturity Date(2) |
|
Maximum
Facility
Size |
|
December 31, 2024 |
|
|
December 31, 2023 |
|
Fixed rate loans |
|
|
|
|
|
|
|
|
|
|
|
|
Fixed rate mortgages |
|
3.09% |
|
April 2031 |
|
N/A |
|
$ |
2,978,914 |
|
|
$ |
3,049,322 |
|
Total fixed rate loans |
|
|
|
|
|
|
|
|
2,978,914 |
|
|
|
3,049,322 |
|
Variable rate loans |
|
|
|
|
|
|
|
|
|
|
|
|
Floating rate mortgages |
|
B + 1.83% |
|
September 2027 |
|
N/A |
|
|
9,658,934 |
|
|
|
9,893,894 |
|
Variable rate secured credit facility(5) |
|
B + 2.25% |
|
December 2025 |
|
$164,152 |
|
|
164,152 |
|
|
|
165,000 |
|
Senior secured revolving credit facility(6) |
|
B + 2.50% |
|
January 2027 |
|
$150,000 |
|
|
— |
|
|
|
— |
|
Total variable rate loans |
|
|
|
|
|
|
|
|
9,823,086 |
|
|
|
10,058,894 |
|
Total loans secured by the Company’s properties |
|
|
|
|
|
|
|
|
12,802,000 |
|
|
|
13,108,216 |
|
Deferred financing costs, net |
|
|
|
|
|
|
|
|
(51,246 |
) |
|
|
(73,066 |
) |
Discount on assumed debt, net |
|
|
|
|
|
|
|
|
(6,167 |
) |
|
|
(6,240 |
) |
Mortgage notes and secured credit facilities, net |
|
|
|
$ |
12,744,587 |
|
|
$ |
13,028,910 |
|
__________
(1)The symbol “B” refers to the relevant floating benchmark rates, which includes one-month SOFR, Federal Reserve Bank of New York (“NYFED”) 30 day SOFR, three-month Euro Interbank Offered Rate (“EURIBOR”) and three-month Norwegian Interbank Offered Rate (“NIBOR”), as applicable to each loan.
(2)For loans where the Company, at its own discretion, has extension options, the maximum maturity date has been assumed.
(3)The majority of the Company’s mortgages contain prepayment provisions including (but not limited to) lockout periods, yield or spread maintenance provisions and fixed penalties.
(4)Excludes a $12.6 million mortgage loan on a property classified as held-for-sale as of December 31, 2024. As of December 31, 2023, there were no properties, and their related mortgage loans, that met the criteria to be classified as held-for-sale.
(5)The repayment of the variable rate secured credit facility is guaranteed by the Operating Partnership.
(6)The repayment of the senior secured revolving credit facility is secured by pledges of ownership interests in holding companies that are directly under the Operating Partnership.
In July 2024, the Company entered into a senior secured revolving credit facility agreement with a total borrowing capacity of $150.0 million. The senior secured revolving credit facility agreement matures in January 2026, at which time the Company may request an additional one-year extension thereafter. Interest under the senior secured revolving credit facility is determined based on one-month U.S. dollar denominated SOFR plus 2.5%.
The following table presents the future principal payments under the Company’s mortgage notes and secured credit facilities as of December 31, 2024 ($ in thousands):
|
|
|
|
|
|
Year |
|
Amount |
|
2025 |
|
$ |
|
1,370,609 |
|
2026 |
|
|
|
4,835,910 |
|
2027 |
|
|
|
2,116,753 |
|
2028 |
|
|
|
223,462 |
|
2029 |
|
|
|
194,100 |
|
Thereafter |
|
|
|
4,061,166 |
|
Total |
|
$ |
|
12,802,000 |
|
Pursuant to lender agreements for certain of the Company’s mortgages, the Company has the ability to draw $50.9 million for leasing commissions, and tenant and building improvements.
The Company’s mortgage notes and secured credit facilities may contain customary events of default and covenants, including limitations on liens and indebtedness and maintenance of certain financial ratios. The Company was in compliance with all corporate and all property level financial covenants with no events of default as of December 31, 2024 and 2023, respectively.
7.Secured Financings on Investments in Real Estate Debt
Secured financings on investments in real estate debt are treated as collateralized financing transactions and are carried at their contractual amounts, including accrued interest, as specified in the respective agreements. Although structured as a sale and repurchase obligation, a secured financing on investments in real estate debt operates as a financing under which securities are pledged as collateral to secure a short-term loan equal in value to a specified percentage of the market value of the pledged collateral. While used as collateral, the Company retains beneficial ownership of the pledged collateral, including the right to distributions. At the maturity of a secured financing on investments in real estate debt, the Company is required to repay the loan and concurrently receive the pledged collateral from the lender or, with the consent of the lender, renew such agreement at the then-prevailing financing rate.
Interest rates on these borrowings are determined based on prevailing rates corresponding to the terms of the borrowings, and interest is paid at the termination of the borrowing at which time the Company may enter into a new borrowing arrangement at prevailing market rates with the same counterparty or repay that counterparty and negotiate financing with a different counterparty.
The fair value of financial instruments pledged as collateral on the Company’s secured financings on investments in real estate debt disclosed in the tables below represents the Company’s fair value of such instruments, which may differ from the fair value assigned to the collateral by its counterparties.
During June 2022, the Company entered into a repurchase agreement with Morgan Stanley Bank, N.A. (“Morgan Stanley”), Guardians of New Zealand Superannuation as manager and administrator of the New Zealand Superannuation Fund (“NZ Super”), and BAWAG P.S.K. Bank für Arbeit und Wirtschaft und Osterreichische Postsparkasse Aktiengesellschaft (“BAWAG”) in order to finance its term loan investment (the “Syndicated RA”) to an unaffiliated entity in connection with its acquisition of three Australian hospitality and leisure resorts.
During February 2021, the Company entered into a repurchase agreement with Barclays Bank PLC in order to finance its term loan investment (the “Barclays RA”) to an unaffiliated entity in connection with its acquisition of a premier United Kingdom holiday company. Effective February 15, 2022, the reference rate for the calculation of interest transitioned from the three–month U.S. dollar-denominated LIBOR to SONIA. The Barclays RA interest rate was equal to the SONIA daily non-cumulative EFR rate plus a spread. During the year ended December 31, 2024, in connection with the disposition of this term loan investment, the Company repaid all related borrowings under secured financing agreements of £193.6 million.
For financial statement purposes, the Company does not offset its secured financings on investments in real estate debt and securities lending transactions because the conditions for netting as specified by GAAP are not met. Although not offset on the Company’s Consolidated Balance Sheets, these transactions are summarized in the following tables ($ in thousands):
|
|
|
|
|
|
|
|
|
|
|
|
|
|
|
|
|
|
|
December 31, 2024 |
|
Indebtedness |
|
Maturity Date |
|
Coupon |
|
Collateral
Assets(1) |
|
|
Outstanding
Balance |
|
Syndicated RA(2) |
|
June 2027 |
|
BBSY + 2.82% |
|
$ |
852,461 |
|
|
$ |
467,988 |
|
|
|
|
|
|
|
$ |
852,461 |
|
|
$ |
467,988 |
|
|
|
|
|
|
|
|
|
|
|
|
|
|
|
|
|
|
|
|
December 31, 2023 |
|
Indebtedness |
|
Maturity Date |
|
Coupon |
|
Collateral
Assets(1) |
|
|
Outstanding
Balance |
|
Barclays RA |
|
February 2026 |
|
SONIA + 2.55% |
|
$ |
448,729 |
|
|
$ |
246,801 |
|
Syndicated RA(2) |
|
June 2027 |
|
BBSY + 2.82% |
|
|
939,551 |
|
|
|
515,551 |
|
|
|
|
|
|
|
$ |
1,388,280 |
|
|
$ |
762,352 |
|
__________
(1)Represents the fair value of the Company’s real estate-related term loan investments.
(2)Outstanding balance is reflected net of $0.9 million and $1.2 million of unamortized deferred financing costs as of December 31, 2024 and 2023, respectively.
8.Unsecured Line of Credit
During May 2022, the Company increased its unsecured line of credit by $1.1 billion with additional banks for a total borrowing capacity of approximately $1.6 billion. In May 2024, the Company entered into an amendment to extend its unsecured line of credit for two years, at which time the Company may request an additional one-year extension thereafter. Interest under the unsecured line of credit is determined based on one-month U.S. dollar-denominated SOFR plus 2.5%. The repayment of the unsecured line of credit is guaranteed by the Company. As of December 31, 2024 and 2023, there were approximately $1.4 billion and $0.9 billion of borrowings outstanding on the unsecured line of credit, respectively.
9.Other Assets and Other Liabilities
The following table summarizes the components of Other assets ($ in thousands):
|
|
|
|
|
|
|
|
|
|
|
December 31, 2024 |
|
|
December 31, 2023 |
|
Held-for-sale assets |
|
$ |
685,674 |
|
|
$ |
— |
|
Derivative instruments |
|
|
368,871 |
|
|
|
554,263 |
|
Intangible assets, net |
|
|
161,945 |
|
|
|
220,036 |
|
Receivables |
|
|
106,545 |
|
|
|
127,573 |
|
Prepaid expenses |
|
|
23,920 |
|
|
|
24,022 |
|
Deferred financing costs, net |
|
|
14,671 |
|
|
|
6,006 |
|
Interest receivable |
|
|
216 |
|
|
|
7,929 |
|
Deferred tax assets |
|
|
— |
|
|
|
5,043 |
|
Other |
|
|
3,637 |
|
|
|
2,757 |
|
Total other assets |
|
$ |
1,365,479 |
|
|
$ |
947,629 |
|
The following table summarizes the components of Other liabilities ($ in thousands):
|
|
|
|
|
|
|
|
|
|
|
December 31, 2024 |
|
|
December 31, 2023 |
|
Accounts payable and accrued expenses |
|
$ |
74,097 |
|
|
$ |
75,809 |
|
Real estate taxes payable |
|
|
68,784 |
|
|
|
73,145 |
|
Accrued interest expense |
|
|
58,650 |
|
|
|
69,642 |
|
Intangible liabilities, net |
|
|
47,601 |
|
|
|
59,567 |
|
Tenant security deposits |
|
|
41,880 |
|
|
|
44,374 |
|
Distributions payable |
|
|
40,612 |
|
|
|
43,044 |
|
Deferred tax liabilities |
|
|
35,485 |
|
|
|
35,792 |
|
Held-for-sale liabilities |
|
|
18,257 |
|
|
|
— |
|
Deposits received on pending sales |
|
|
14,790 |
|
|
|
— |
|
Right-of-use liability - operating leases |
|
|
12,328 |
|
|
|
12,402 |
|
Derivative instruments |
|
|
9,505 |
|
|
|
46,178 |
|
Deferred income |
|
|
8,430 |
|
|
|
11,894 |
|
Other taxes payable |
|
|
10,267 |
|
|
|
5,005 |
|
Other |
|
|
6,409 |
|
|
|
7,506 |
|
Total other liabilities |
|
$ |
447,095 |
|
|
$ |
484,358 |
|
The Company uses derivative financial instruments to minimize the risks and/or costs associated with the Company’s investments and financing transactions. The Company has not designated any of its derivative financial instruments as hedges as defined under GAAP. Although not designated as hedging instruments under GAAP, the Company’s derivatives are not speculative and are used to manage the Company’s exposure to interest rate movements, fluctuations in foreign exchange rates, and other identified risks.
The use of derivative financial instruments involves certain risks, including the risk that the counterparties to these contractual arrangements do not perform as agreed. To mitigate this risk, the Company enters into derivative financial instruments with counterparties it believes to have appropriate credit ratings and that are major financial institutions with which the Company and its affiliates may also have other financial relationships.
Interest Rate Contracts
Certain of the Company’s transactions expose the Company to interest rate risks, which include exposure to variable interest rates on certain loans secured by the Company’s real estate in addition to its secured financings of investments in real estate debt. The Company uses derivative financial instruments, which includes interest rate caps and swaps, and may also include options, floors, and other interest rate derivative contracts, to limit the Company’s exposure to the future variability of interest rates.
The following tables detail the Company’s outstanding interest rate derivatives that were non-designated hedges of interest rate risk (notional amounts in thousands):
|
|
|
|
|
|
|
|
|
|
|
|
|
|
|
|
December 31, 2024 |
Interest Rate Derivatives |
|
Number of Instruments |
|
Notional Amount |
|
|
Weighted Average Strike Rate |
|
Index |
|
Weighted Average Maturity (Years) |
Interest Rate Caps - Property debt |
|
69 |
|
$ |
|
9,401,374 |
|
|
2.1% |
|
SOFR |
|
1.3 |
Interest Rate Caps - Property debt |
|
3 |
|
€ |
|
109,905 |
|
|
1.0% |
|
EURIBOR |
|
0.4 |
Interest Rate Swaps - Property debt |
|
1 |
|
$ |
|
120,061 |
|
|
0.8% |
|
SOFR |
|
0.2 |
Interest Rate Swaps - Property debt |
|
3 |
|
€ |
|
207,721 |
|
|
1.9% |
|
EURIBOR |
|
2.6 |
Interest Rate Swaps - Property debt |
|
2 |
|
NOK |
|
520,000 |
|
|
2.5% |
|
NIBOR |
|
3.1 |
Total interest rate derivatives |
|
78 |
|
|
|
|
|
2.1% |
|
|
|
1.4 |
|
|
|
|
|
|
|
|
|
|
|
|
|
|
|
December 31, 2023 |
Interest Rate Derivatives |
|
Number of Instruments |
|
Notional Amount |
|
|
Weighted Average Strike Rate |
|
Index |
|
Weighted Average Maturity (Years) |
Interest Rate Caps - Property debt |
|
70 |
|
$ |
|
9,567,541 |
|
|
1.6% |
|
SOFR |
|
2.1 |
Interest Rate Caps - Property debt |
|
4 |
|
€ |
|
175,468 |
|
|
1.1% |
|
EURIBOR |
|
1.0 |
Interest Rate Swaps - Property debt |
|
1 |
|
$ |
|
117,863 |
|
|
0.8% |
|
SOFR |
|
1.2 |
Interest Rate Swaps - Property debt |
|
3 |
|
€ |
|
213,458 |
|
|
1.9% |
|
EURIBOR |
|
3.6 |
Interest Rate Swaps - Property debt |
|
2 |
|
NOK |
|
520,000 |
|
|
2.5% |
|
NIBOR |
|
4.1 |
Total interest rate derivatives |
|
80 |
|
|
|
|
|
1.6% |
|
|
|
2.1 |
Foreign Currency Forward Contracts
Certain of the Company’s international investments expose it to fluctuations in foreign currency exchange rates and interest rates. These fluctuations may impact the value of the Company’s cash receipts and payments in terms of its functional currency, the U.S. dollar. The Company uses foreign currency forward contracts to protect the value or fix the amount of certain investments or cash flows in terms of the U.S. dollar.
The following table details the Company’s outstanding foreign currency forward contracts that were non-designated hedges of foreign currency risk (notional amounts in thousands):
|
|
|
|
|
|
|
|
|
|
|
|
|
|
|
|
|
December 31, 2024 |
|
|
December 31, 2023 |
|
Foreign Currency Forward Contracts |
|
Number of Instruments |
|
Notional Amount |
|
|
Number of Instruments |
|
Notional Amount |
|
Buy USD/Sell EUR Forward |
|
40 |
|
€ |
|
528,759 |
|
|
60 |
|
€ |
|
577,283 |
|
Buy USD/Sell DKK Forward |
|
8 |
|
DKK |
|
1,210,016 |
|
|
12 |
|
DKK |
|
1,301,016 |
|
Buy USD/Sell AUD Forward |
|
5 |
|
AUD |
|
621,759 |
|
|
5 |
|
AUD |
|
621,759 |
|
Buy USD/Sell NOK Forward |
|
12 |
|
NOK |
|
412,700 |
|
|
9 |
|
NOK |
|
1,160,941 |
|
Buy USD/Sell GBP Forward |
|
— |
|
£ |
|
— |
|
|
4 |
|
£ |
|
142,858 |
|
Valuation and Financial Statement Impact
The following table details the fair value of the Company’s derivative financial instruments ($ in thousands):
|
|
|
|
|
|
|
|
|
|
|
|
|
|
|
|
|
|
|
Fair Value of Derivatives in an Asset (1) Position |
|
|
Fair Value of Derivatives in a Liability (2) Position |
|
|
|
December 31, 2024 |
|
|
December 31, 2023 |
|
|
December 31, 2024 |
|
|
December 31, 2023 |
|
Interest rate derivatives |
|
$ |
325,991 |
|
|
$ |
537,390 |
|
|
$ |
— |
|
|
$ |
— |
|
Foreign currency forward contracts |
|
|
42,880 |
|
|
|
16,873 |
|
|
|
9,505 |
|
|
|
46,178 |
|
Total derivatives |
|
$ |
368,871 |
|
|
$ |
554,263 |
|
|
$ |
9,505 |
|
|
$ |
46,178 |
|
(1)Included in Other assets on the Company’s Consolidated Balance Sheets.
(2)Included in Other liabilities on the Company’s Consolidated Balance Sheets.
The following table details the effect of the Company’s derivative financial instruments in the Consolidated Statements of Operations and Comprehensive Loss ($ in thousands):
|
|
|
|
|
|
|
|
|
|
|
|
|
|
|
|
|
|
|
For the Year Ended December 31, |
|
Type of Derivative |
|
Net Realized/Unrealized (Loss) Gain |
|
2024 |
|
|
2023 |
|
|
2022 |
|
Interest Rate Caps - Property debt |
|
Unrealized (loss) gain(1) |
|
$ |
(212,711 |
) |
|
$ |
(305,693 |
) |
|
$ |
498,696 |
|
Interest Rate Swaps - Property debt |
|
Unrealized (loss) gain(1) |
|
|
(9,031 |
) |
|
|
(26,468 |
) |
|
|
32,972 |
|
Foreign Currency Forward Contracts |
|
Unrealized gain (loss) (2) |
|
|
62,680 |
|
|
|
(67,466 |
) |
|
|
30,556 |
|
Foreign Currency Forward Contracts |
|
Realized gain(1) |
|
|
14,034 |
|
|
|
26,112 |
|
|
|
57,176 |
|
Interest Rate Caps - Property debt |
|
Realized gain(1) |
|
|
1,831 |
|
|
|
26,778 |
|
|
|
— |
|
Interest Rate Swaps - Property debt |
|
Realized gain(1) |
|
|
179 |
|
|
|
12,088 |
|
|
|
— |
|
Total |
|
|
|
$ |
(143,018 |
) |
|
$ |
(334,649 |
) |
|
$ |
619,400 |
|
(1) Included in Other (expense) income, net in the Company’s Consolidated Statements of Operations and Comprehensive Loss.
(2) A portion of this amount is included in Income from investments in real estate debt, net and the remaining amount is included in Other (expense) income, net in the Company’s Consolidated Statements of Operations and Comprehensive Loss.
11.Equity and Redeemable Non-controlling Interests
Authorized Capital
The Company is authorized to issue preferred stock and four classes of common stock consisting of Class T shares, Class S shares, Class D shares, and Class I shares. The Company’s board of directors has the ability to establish the preferences and rights of each class or series of preferred stock, without stockholder approval, and as such, it may afford the holders of any series or class of preferred stock preferences, powers and rights senior to the rights of holders of common stock. The differences among the common share classes relate to upfront selling commissions, dealer manager fees and ongoing stockholder servicing fees. See Note 2 for a further description of such items. Other than the differences in upfront selling commissions, dealer manager fees and ongoing stockholder servicing fees, each class of common stock is subject to the same economic and voting rights.
As of December 31, 2024, the Company had the authority to issue 3,100,000,000 shares of capital stock, consisting of the following:
|
|
|
|
|
|
|
|
|
|
Classification |
|
Number of
Shares |
|
|
Par Value |
|
Preferred Stock |
|
|
100,000,000 |
|
|
$ |
|
0.01 |
|
Class T Shares |
|
|
500,000,000 |
|
|
$ |
|
0.01 |
|
Class S Shares |
|
|
1,000,000,000 |
|
|
$ |
|
0.01 |
|
Class D Shares |
|
|
500,000,000 |
|
|
$ |
|
0.01 |
|
Class I Shares |
|
|
1,000,000,000 |
|
|
$ |
|
0.01 |
|
Total |
|
|
3,100,000,000 |
|
|
|
|
|
Common Stock
The following table details the movement in the Company’s outstanding shares of common stock:
|
|
|
|
|
|
|
|
|
|
|
|
|
|
|
|
|
|
|
|
|
|
|
Class T |
|
|
Class S |
|
|
Class D |
|
|
Class I |
|
|
Total |
|
January 1, 2022 |
|
|
4,648,436 |
|
|
|
154,381,036 |
|
|
|
22,142,299 |
|
|
|
163,624,500 |
|
|
|
344,796,271 |
|
Common stock shares issued (1) |
|
|
1,112,055 |
|
|
|
80,943,605 |
|
|
|
10,500,831 |
|
|
|
109,276,249 |
|
|
|
201,832,740 |
|
Distribution reinvestment plan shares issued |
|
|
125,187 |
|
|
|
3,647,656 |
|
|
|
720,473 |
|
|
|
3,664,723 |
|
|
|
8,158,039 |
|
Common stock shares repurchased |
|
|
(164,182 |
) |
|
|
(14,415,387 |
) |
|
|
(2,389,430 |
) |
|
|
(32,146,156 |
) |
|
|
(49,115,155 |
) |
Independent directors’ restricted stock grant(2) |
|
|
— |
|
|
|
— |
|
|
|
— |
|
|
|
35,697 |
|
|
|
35,697 |
|
December 31, 2022 |
|
|
5,721,496 |
|
|
|
224,556,910 |
|
|
|
30,974,173 |
|
|
|
244,455,013 |
|
|
|
505,707,592 |
|
|
|
|
|
|
|
|
|
|
|
|
|
|
|
|
|
Common stock shares issued (1) |
|
|
(98,898 |
) |
|
|
4,915,057 |
|
|
|
(153,390 |
) |
|
|
14,803,271 |
|
|
|
19,466,040 |
|
Distribution reinvestment plan shares issued |
|
|
141,944 |
|
|
|
3,788,883 |
|
|
|
335,712 |
|
|
|
3,849,211 |
|
|
|
8,115,750 |
|
Common stock shares repurchased |
|
|
(482,517 |
) |
|
|
(38,237,234 |
) |
|
|
(3,643,944 |
) |
|
|
(60,147,804 |
) |
|
|
(102,511,499 |
) |
Independent directors’ restricted stock grant(2) |
|
|
— |
|
|
|
— |
|
|
|
— |
|
|
|
30,361 |
|
|
|
30,361 |
|
December 31, 2023 |
|
|
5,282,025 |
|
|
|
195,023,616 |
|
|
|
27,512,551 |
|
|
|
202,990,052 |
|
|
|
430,808,244 |
|
|
|
|
|
|
|
|
|
|
|
|
|
|
|
|
|
Common stock shares issued (1) |
|
|
(230,764 |
) |
|
|
209,158 |
|
|
|
293,126 |
|
|
|
9,457,765 |
|
|
|
9,729,285 |
|
Distribution reinvestment plan shares issued |
|
|
142,951 |
|
|
|
3,660,648 |
|
|
|
500,536 |
|
|
|
3,204,529 |
|
|
|
7,508,664 |
|
Common stock shares repurchased |
|
|
(138,567 |
) |
|
|
(17,502,181 |
) |
|
|
(2,378,099 |
) |
|
|
(26,288,430 |
) |
|
|
(46,307,277 |
) |
Independent directors’ restricted stock grant(2) |
|
|
— |
|
|
|
— |
|
|
|
— |
|
|
|
33,797 |
|
|
|
33,797 |
|
December 31, 2024 |
|
|
5,055,645 |
|
|
|
181,391,241 |
|
|
|
25,928,114 |
|
|
|
189,397,713 |
|
|
|
401,772,713 |
|
__________
(1)Includes exchanges between share classes.
(2)The independent directors’ restricted stock grant represents $0.8 million, $0.8 million and $0.8 million of the annual compensation paid to the independent directors for the years ended December 31, 2024, 2023 and 2022, respectively. Each grant is amortized over the one-year service period of such grant.
Share Repurchases
The Company has adopted a share repurchase plan whereby, subject to certain limitations, stockholders may request on a monthly basis that the Company repurchases all or any portion of their shares. Should repurchase requests, in the Company’s judgment, place an undue burden on its liquidity, adversely affect its operations or risk having an adverse impact on the Company as a whole, or should the Company otherwise determine that investing its liquid assets in real properties or other illiquid investments rather than repurchasing its shares is in the best interests of the Company as a whole, then the Company may choose to repurchase fewer shares than have been requested to be repurchased, or none at all. Further, the Company’s board of directors may modify or suspend the Company’s share repurchase plan if it deems such action to be in the Company’s best interest and in the best interest of its stockholders. In addition, the total amount of shares that the Company may repurchase is limited. From the Company’s inception until its share repurchase plan was amended as described below, the total amount of shares that the Company could repurchase was limited, in any calendar month, to shares whose aggregate value (based on the repurchase price per share on the date of the repurchase) was no more than 2% of its aggregate NAV per month (measured using the aggregate NAV attributable to stockholders as of the end of the immediately preceding month) and no more than 5% of its aggregate NAV per calendar quarter (measured using the aggregate NAV attributable to stockholders as of the end of the immediately preceding quarter). In the event that the Company determines to repurchase some but not all of the shares submitted for repurchase during any month, shares repurchased at the end of the month will be repurchased on a pro rata basis.
On May 23, 2024, the Company amended its share repurchase plan such that, beginning with repurchases during the month of May 2024, the Company limits share repurchases to 0.33% of NAV per month (measured using the aggregate NAV attributable to stockholders as of the end of the immediately preceding month) and, beginning on July 1, 2024, the Company limits share repurchases to 1% of NAV per quarter (measured using the aggregate NAV attributable to stockholders as of the end of the immediately preceding quarter).
For the years ended December 31, 2024, 2023 and 2022, the Company repurchased 46.3 million, 102.5 million and 49.1 million shares of common stock representing a total of $1.1 billion, $2.6 billion and $1.3 billion, respectively.
Distributions
The Company generally intends to distribute substantially all of its taxable income, which does not necessarily equal net income as calculated in accordance with GAAP, to its stockholders each year to comply with the REIT provisions of the Code.
Each class of common stock receives the same gross distribution per share. The net distribution varies for each class based on the applicable stockholder servicing fee, which is deducted from the monthly distribution per share and is paid directly to the applicable distributor.
The following table details the aggregate distributions declared for each applicable class of common stock:
|
|
|
|
|
|
|
|
|
|
|
|
|
|
|
|
|
|
|
|
|
|
|
Year Ended December 31, 2024 |
|
|
|
Class T |
|
|
Class S |
|
|
Class D |
|
|
Class I |
|
Aggregate gross distributions declared per share of common stock |
|
$ |
|
1.2420 |
|
|
$ |
|
1.2420 |
|
|
$ |
|
1.2420 |
|
|
$ |
|
1.2420 |
|
Stockholder servicing fee per share of common stock |
|
|
|
(0.1923 |
) |
|
|
|
(0.1929 |
) |
|
|
|
(0.0556 |
) |
|
|
|
— |
|
Net distributions declared per share of common stock |
|
$ |
|
1.0497 |
|
|
$ |
|
1.0491 |
|
|
$ |
|
1.1864 |
|
|
$ |
|
1.2420 |
|
|
|
|
|
|
|
|
|
|
|
|
|
|
|
|
|
|
|
|
Year Ended December 31, 2023 |
|
|
|
Class T |
|
|
Class S |
|
|
Class D |
|
|
Class I |
|
Aggregate gross distributions declared per share of common stock |
|
$ |
|
1.2420 |
|
|
$ |
|
1.2420 |
|
|
$ |
|
1.2420 |
|
|
$ |
|
1.2420 |
|
Stockholder servicing fee per share of common stock |
|
|
|
(0.2157 |
) |
|
|
|
(0.2158 |
) |
|
|
|
(0.0622 |
) |
|
|
|
— |
|
Net distributions declared per share of common stock |
|
$ |
|
1.0263 |
|
|
$ |
|
1.0262 |
|
|
$ |
|
1.1798 |
|
|
$ |
|
1.2420 |
|
|
|
|
|
|
|
|
|
|
|
|
|
|
|
|
|
|
|
|
Year Ended December 31, 2022 |
|
|
|
Class T |
|
|
Class S |
|
|
Class D |
|
|
Class I |
|
Aggregate gross distributions declared per share of common stock |
|
$ |
|
1.2420 |
|
|
$ |
|
1.2420 |
|
|
$ |
|
1.2420 |
|
|
$ |
|
1.2420 |
|
Stockholder servicing fee per share of common stock |
|
|
|
(0.2320 |
) |
|
|
|
(0.2318 |
) |
|
|
|
(0.0672 |
) |
|
|
|
— |
|
Net distributions declared per share of common stock |
|
$ |
|
1.0100 |
|
|
$ |
|
1.0102 |
|
|
$ |
|
1.1748 |
|
|
$ |
|
1.2420 |
|
Redeemable Non-controlling Interests
In connection with its performance participation interest, the Special Limited Partner holds Class I units in the Operating Partnership. See Note 12 for further details of the Special Limited Partner’s performance participation interest. Because the Special Limited Partner has the ability to redeem its Class I units for cash, at its election, the Company has classified these Class I units as Redeemable non-controlling interest in mezzanine equity on the Company’s Consolidated Balance Sheets. The redeemable non-controlling interest is recorded at the greater of the carrying amount, adjusted for its share of the allocation of income or loss and distributions, or the redemption value, which is equivalent to fair value, of such units at the end of each measurement period. In addition to the Special Limited Partner’s interest noted above, certain third parties also have a redeemable non-controlling interest.
The following table details the redeemable non-controlling interests activity related to the Special Limited Partner and third-party Operating Partnership unitholders for the years ended December 31, 2024 and 2023 ($ in thousands):
|
|
|
|
|
|
|
|
|
|
|
|
|
|
|
Special Limited Partner(1) |
|
|
Third-party Operating Partnership unitholders |
|
|
Total |
|
Balance at December 31, 2022 |
|
$ |
238,322 |
|
|
$ |
188,777 |
|
|
$ |
427,099 |
|
Settlement of performance participation allocation |
|
|
102,348 |
|
|
|
— |
|
|
|
102,348 |
|
Repurchases |
|
|
— |
|
|
|
(620 |
) |
|
|
(620 |
) |
GAAP loss allocation |
|
|
(18,753 |
) |
|
|
(10,412 |
) |
|
|
(29,165 |
) |
Distributions |
|
|
(16,065 |
) |
|
|
(8,895 |
) |
|
|
(24,960 |
) |
Fair value allocation |
|
|
(10,160 |
) |
|
|
(4,680 |
) |
|
|
(14,840 |
) |
Balance at December 31, 2023 |
|
$ |
295,692 |
|
|
$ |
164,170 |
|
|
$ |
459,862 |
|
Settlement of performance participation allocation |
|
|
— |
|
|
|
— |
|
|
|
— |
|
Conversion to Class I shares |
|
|
— |
|
|
|
(1,144 |
) |
|
|
(1,144 |
) |
GAAP loss allocation |
|
|
(23,306 |
) |
|
|
(12,791 |
) |
|
|
(36,097 |
) |
Distributions |
|
|
(16,065 |
) |
|
|
(8,835 |
) |
|
|
(24,900 |
) |
Fair value allocation |
|
|
24,551 |
|
|
|
12,606 |
|
|
|
37,157 |
|
Balance at December 31, 2024 |
|
$ |
280,872 |
|
|
$ |
154,006 |
|
|
$ |
434,878 |
|
(1)Includes units transferred to Barry S. Sternlicht, which are deemed to be beneficially owned by Mr. Sternlicht.
12.Related Party Transactions
Management Fee and Performance Participation Allocation
Prior to May 2024, the Advisor was entitled to an annual management fee equal to (i) 1.25% of the Company’s NAV per annum payable monthly, before giving effect to any accruals for the management fee, the stockholder servicing fee, the performance participation interest or any distributions, plus (ii) 1.25% per annum of the aggregate DST Property consideration for all DST Properties subject to the fair market value option held by the Operating Partnership. For avoidance of doubt, the Advisor does not receive a duplicative management fee with respect to any DST Property. Additionally, to the extent the Operating Partnership issues Operating Partnership units to parties other than the Company, the Operating Partnership will pay the Advisor an annual management fee equal to 1.25% of the Operating Partnership’s NAV attributable to such Operating Partnership units not held by the Company, payable monthly. The management fee can be paid, at the Advisor’s election, in cash, shares of common stock, or Operating Partnership units.
In connection with the share repurchase plan amendment, the Advisor has agreed, commencing with the month of May 2024, to waive 20% of its management fee, thereby reducing it from 1.25% of NAV to 1% of NAV, until the Company’s share repurchase plan has been reinstated to the monthly repurchase limit of 2% of NAV (measured using the aggregate NAV attributable to stockholders as of the end of the immediately preceding month) and quarterly repurchase limit of 5% of NAV (measured using the aggregate NAV attributable to stockholders as of the end of the immediately preceding quarter).
During the years ended December 31, 2024, 2023, and 2022, the Company incurred management fees of $105.4 million, $153.4 million, and $167.1 million, respectively.
To date, the Advisor has elected to receive the management fee in shares of the Company’s common stock. The Company issued 4,336,544 and 5,673,483 unregistered Class I shares to the Advisor as payment for the 2024 and 2023 management fees, respectively, and also had a payable of $7.7 million and $10.9 million related to the management fees as of December 31, 2024 and 2023, respectively, which are included in Due to affiliates on the Company’s Consolidated Balance Sheets. During January 2025, the Advisor was issued 354,652 unregistered Class I shares as payment for the $7.7 million management fee accrued as of December 31, 2024. During January 2024, the Advisor was issued 473,622 unregistered Class I shares to the Advisor as payment for the $10.9 million management fee accrued as of December 31, 2023. The shares issued to the Advisor for payment of the management fee were issued at the applicable NAV per share at the end of each month for which the fee was earned.
Additionally, the Special Limited Partner, an affiliate of the Advisor, holds a performance participation interest in the Operating Partnership that entitles it to receive an allocation of the Operating Partnership’s total return to its capital account. Total return is defined as distributions paid or accrued plus the change in NAV. Under the Operating Partnership’s limited partnership agreement, the annual total return will be allocated solely to the Special Limited Partner after the other unit holders have received a total return of 5% (after recouping any loss carryforward amount) and such allocation will continue until the allocation between the Special Limited Partner and all other unit holders is equal to 12.5% and 87.5%, respectively. Thereafter, the Special Limited Partner will receive an allocation of 12.5% of the annual total return. The annual distribution of the performance participation interest will be paid in cash or Class I units of the Operating Partnership, at the election of the Special Limited Partner. During the years ended December 31, 2024 and 2023, the Company did not recognize a performance participation allocation as certain thresholds were not achieved. During the year ended December 31, 2022, the Company recognized $102.3 million of performance participation interest in the Company’s consolidated financial statements.
The performance participation interest for 2022 became payable on December 31, 2022 and, in January 2023, the Company caused the Operating Partnership to issue 3,886,034 Class I units in the Operating Partnership to the Special Limited Partner as payment for the performance participation interest for 2022. Such Class I units were issued at the NAV per unit as of December 31, 2022.
Investment in Real Estate Debt - Dispositions
During the year ended December 31, 2024, the Company disposed of its £352.0 million GBP term loan investment through a series of disposition transactions, as follows: (i) £176.0 million was sold to an affiliate of the Advisor for a net purchase price of £174.2 million; and (ii) £176.0 million was sold to an affiliate of the Advisor and an unaffiliated third-party, who co-invested in the transaction, for an aggregate purchase price of £174.2 million. The purchase price was determined by the unaffiliated and independent third-party. In connection with the disposition, the Company repaid all related borrowings under secured financing agreements of £193.6 million.
Related Party Share Ownership
As of December 31, 2024, the Advisor, its employees, and its affiliates, including the Company’s executive officers, hold an aggregate of $526.9 million in the Company, across shares of common stock of the Company and Class I units in the Operating Partnership. During the year ended December 31, 2024, the Company repurchased 2.1 million Class I shares held by the Advisor and certain directors for total consideration of $46.3 million. During the year ended December 31, 2023, the Company repurchased 3.2 million Class I shares held by the Advisor and certain directors for total consideration of $80.6 million. The Advisor repurchases were used primarily to settle tax obligations incurred by the Advisor.
Due to Affiliates
The following table details the components of Due to affiliates ($ in thousands):
|
|
|
|
|
|
|
|
|
|
|
December 31, 2024 |
|
|
December 31, 2023 |
|
Accrued stockholder servicing fee |
|
$ |
262,264 |
|
|
$ |
301,017 |
|
Performance participation allocation |
|
|
— |
|
|
|
— |
|
Accrued management fee |
|
|
7,701 |
|
|
|
10,853 |
|
Advanced operating expenses |
|
|
1,844 |
|
|
|
4,458 |
|
Accrued affiliate service provider expenses |
|
|
3,792 |
|
|
|
3,068 |
|
Advanced organization and offering costs |
|
|
— |
|
|
|
1,561 |
|
Total |
|
$ |
275,601 |
|
|
$ |
320,957 |
|
Accrued stockholder servicing fee
The Company accrues the full amount of the future stockholder servicing fees payable to the Dealer Manager for Class T shares, Class S shares, and Class D shares up to the 8.75% limit at the time such shares are sold. The Dealer Manager has entered into agreements with the participating broker dealers distributing the Company’s shares in the public offerings, which provide, among other things, for the re-allowance of the full amount of the selling commissions and dealer manager fees and all or a portion of the stockholder servicing fees received by the Dealer Manager to such participating broker dealers.
Advanced organization and offering costs
The Advisor and its affiliates incurred $7.3 million of organization and offering costs (excluding upfront selling commissions, dealer manager fees and stockholder servicing fees) on behalf of the Company through December 21, 2019. Such amount was being reimbursed to the Advisor ratably over 60 months, which commenced in January 2020 and were fully reimbursed as of December 31, 2024.
Accrued affiliate service provider expenses
The Company has engaged and expects to continue to engage Highmark Residential (formerly Milestone Management), a portfolio company owned by an affiliate of the Sponsor, to provide day-to-day operational and management services (including leasing, construction management, revenue management, accounting, legal and contract management, expense management, and capital expenditure projects and transaction support services) for a portion of the Company’s multifamily properties. The cost for such services is a percentage of the gross receipts and project costs, respectively, (which will be reviewed periodically and adjusted if appropriate), plus actual costs allocated for transaction support services. During the years ended December 31, 2024, 2023 and 2022, the Company incurred approximately $31.6 million, $25.8 million and $17.3 million of expenses due to Highmark Residential in connection with its operational and management services, respectively. These amounts are included in Property operating expenses on the Company’s Consolidated Statements of Operations and Comprehensive Loss.
The Company has engaged Rinaldi, Finkelstein & Franklin L.L.C. (“RFF”), a law firm owned and controlled by Ellis F. Rinaldi, Co-General Counsel and Senior Managing Director of the Sponsor and certain of its affiliates, to provide corporate legal support services to the Company. During the years ended December 31, 2024, 2023 and 2022, the amounts incurred for services provided by RFF were $0.5 million, $0.3 million and $0.5 million, respectively.
The Company has engaged Essex Title, LLC (“Essex”), a title agent company majority owned by Starwood Capital. Essex acts as an agent for one or more underwriters in issuing title policies and/or providing support services in connection with investments by the Company, Starwood Capital and its affiliates and third parties. Essex focuses on transactions in rate-regulated states where the cost of title insurance is non-negotiable. Essex will not perform services in non-regulated states for the Company, unless (i) in the context of a
portfolio transaction that includes properties in rate-regulated states, (ii) as part of a syndicate of title insurance companies where the rate is negotiated by other insurers or their agents, (iii) when a third party is paying all or a material portion of the premium or (iv) when providing only support services to the underwriter. Essex earns fees, which would have otherwise been paid to third parties, by providing title agency services and facilitating placement of title insurance with underwriters. Starwood Capital receives distributions from Essex in connection with investments by the Company based on its equity interest in Essex. In each case, there will be no related offset to the Company. During the years ended December 31, 2024, 2023 and 2022 the Company incurred $0.5 million, $1.5 million, and $4.3 million of expenses for services provided by Essex, respectively.
The Company has engaged Starwood Retail Partners to provide leasing and legal services for any retail and certain industrial and other properties the Company acquires. During the years ended December 31, 2024 and 2023, the Company incurred approximately $0.4 million and $0.2 million of expenses from Starwood Retail Partners, respectively. During the year ended December 31, 2022, the Company incurred an insignificant amount of expenses from Starwood Retail Partners.
The Company has incurred legal expenses from third party law firms whose lawyers have been seconded to affiliates of Starwood Capital for the purpose of providing legal services in Europe to investment vehicles sponsored by Starwood Capital. During the year ended December 31, 2024, the Company incurred an insignificant amount of expenses relating to these services provided. During the years ended December 31, 2023 and 2022, the amounts incurred for services provided were $0.2 million and $0.4 million, respectively.
The Company has engaged STR Management Co, LLC, an affiliate of the Advisor, to provide property management services to certain of the Company’s residential units that function as short term rental assets. The costs for such services is a percentage of gross revenue produced by the short-term rentals on a monthly basis. During the years ended December 31, 2024, 2023 and 2022, the Company incurred approximately $1.6 million, $0.8 million and $0.2 million of expenses for services provided from SCG STR Management Co, LLC, respectively.
The Company has entered into an agreement with an affiliate of Starwood Global Opportunity Fund XI to assist with property management of the Company’s assets in Spain and Italy. The Starwood Capital Group (“SCG”) Southern Europe Team charges market fees for such property management services. During the years ended December 31, 2024, 2023 and 2022, the amounts incurred for services provided by the SCG Southern Europe Team were $0.3 million, respectively.
Advanced operating expenses
As of December 31, 2023, the Advisor had advanced an insignificant amount of expenses on the Company’s behalf for general corporate expenses provided by unaffiliated third parties. Such amounts (incurred prior to 2019) were being reimbursed to the Advisor ratably over a 60 month period, which commenced in January 2020 and were fully reimbursed as of December 31, 2024.
As of December 31, 2024, 2023 and 2022, the Advisor had incurred approximately $12.9 million, $14.5 million and $15.8 million, respectively, of expenses on the Company’s behalf for general corporate expenses. Such amounts are being reimbursed to the Advisor one month in arrears.
DST Program expenses
During the year ended December 31, 2024, the Company incurred approximately $2.0 million of expenses in connection with the DST Program. No expenses were incurred by the Company in connection with the DST Program during the years ended December 31, 2023 and 2022, respectively.
13.Commitments and Contingencies
As of December 31, 2024 and 2023, the Company is not subject to any material litigation nor is the Company aware of any material litigation threatened against it.
Lessee
Certain of the Company’s investments in real estate are subject to a ground lease. The Company’s ground leases are classified as right of use liability – operating leases based on the characteristics of the respective lease. Right-of-use liabilities are presented within Other liabilities on the Company’s Consolidated Balance Sheets. The ground leases were acquired as part of the acquisition of real estate and
no incremental costs were incurred for such ground leases. The Company’s ground leases are non-cancelable and do not contain any additional renewal options.
The following table presents the future lease payments due under the Company’s ground leases as of December 31, 2024 ($ in thousands):
|
|
|
|
|
|
Year |
|
Operating
Leases |
|
2025 |
|
$ |
|
714 |
|
2026 |
|
|
|
714 |
|
2027 |
|
|
|
714 |
|
2028 |
|
|
|
714 |
|
2029 |
|
|
|
714 |
|
Thereafter |
|
|
|
24,351 |
|
Total undiscounted future lease payments |
|
|
|
27,921 |
|
Difference between undiscounted cash flows and discounted cash flows |
|
|
|
(15,593 |
) |
Total lease liability |
|
$ |
|
12,328 |
|
The Company utilized its incremental borrowing rate, which was between 4.5% and 6%, to determine its lease liabilities. As of December 31, 2024, the weighted average remaining lease term of the Company’s operating leases was 35 years.
Payments under the Company’s ground leases contain fixed payment components. The Company’s ground leases contained escalations prior to the Company’s hold period.
Lessor
The Company’s rental revenue primarily consists of rent earned from operating leases at the Company’s multifamily, industrial, office, and other properties. Leases at the Company’s industrial, office and other properties generally include a fixed base rent and certain leases also contain a variable component. The variable component of the Company’s operating leases at its industrial, office and other properties primarily consist of the reimbursement of operating expenses such as real estate taxes, insurance, and common area maintenance costs.
Leases at the Company’s industrial, office and other properties are generally longer term and may contain extension and termination options at the lessee’s election. The Company’s rental revenue earned from leases at the Company’s multifamily and certain other properties, including single-family rental and self-storage properties, primarily consists of a fixed base rent and certain leases contain a variable component that allows for the pass-through of certain operating expenses such as utilities. Leases at the Company’s multifamily and certain other properties including single-family rental and self-storage properties, are short term in nature, generally not greater than 12 months in length.
The following table summarizes the fixed and variable components of the Company’s operating leases ($ in thousands):
|
|
|
|
|
|
|
|
|
|
|
|
|
|
|
|
|
|
For the Year Ended December 31, |
|
|
|
2024 |
|
|
2023 |
|
|
2022 |
|
Fixed lease payments |
|
$ |
|
1,498,556 |
|
|
$ |
|
1,540,130 |
|
|
$ |
|
1,376,577 |
|
Variable lease payments |
|
|
|
150,735 |
|
|
|
|
155,787 |
|
|
|
|
144,078 |
|
Rental revenue |
|
$ |
|
1,649,291 |
|
|
$ |
|
1,695,917 |
|
|
$ |
|
1,520,655 |
|
The following table presents the undiscounted future minimum rents the Company expects to receive for its industrial, office, and other properties as of December 31, 2024 ($ in thousands). Leases at the Company’s multifamily and certain other properties, including single-family and self-storage properties, are short term, generally 12 months or less, and are therefore not included.
|
|
|
|
|
|
Year |
|
Future Minimum Rents |
|
2025 |
|
$ |
|
268,710 |
|
2026 |
|
|
|
243,312 |
|
2027 |
|
|
|
214,445 |
|
2028 |
|
|
|
176,798 |
|
2029 |
|
|
|
151,733 |
|
Thereafter |
|
|
|
357,324 |
|
Total |
|
$ |
|
1,412,322 |
|
As of January 1, 2025, the Company operates in five reportable segments: Multifamily properties, Industrial properties, Office properties, Other properties, and Investments in real estate debt. Effective January 1, 2025, the Single-Family Rental properties and Self-Storage properties segments were combined within the Other properties segment and previous amounts have been recasted to conform with current period presentation. The CODM is the Company’s Chief Executive Officer, who manages the Company, including allocating resources and evaluating results based on the performance of each segment individually. The Company believes that segment net operating income is the key performance metric that captures the unique operating characteristics of each segment. The Company allocates resources and evaluates results based on the performance of each segment individually. All property revenue and property operating expenses are disaggregated by operating segment. The CODM does not evaluate general and administrative expenses, management fee expenses, depreciation and amortization expense, interest expense, other expense, net, impairment of investments in real estate, net gains on dispositions of real estate, or losses on extinguishment of debt, by segment.
The following table sets forth the total assets by segment ($ in thousands):
|
|
|
|
|
|
|
|
|
|
|
December 31, 2024 |
|
|
December 31, 2023 |
|
Multifamily |
$ |
|
14,451,751 |
|
|
$ |
|
15,161,836 |
|
Industrial |
|
|
2,442,951 |
|
|
|
|
2,820,658 |
|
Office |
|
|
1,571,229 |
|
|
|
|
1,651,347 |
|
Other properties(1) |
|
|
1,519,640 |
|
|
|
|
1,788,105 |
|
Investments in real estate debt |
|
|
852,461 |
|
|
|
|
1,589,350 |
|
Other (Corporate) |
|
|
153,957 |
|
|
|
|
102,678 |
|
Total assets |
$ |
|
20,991,989 |
|
|
$ |
|
23,113,974 |
|
(1)Other properties includes hospitality, single-family rental, self-storage, medical office and retail properties and two investments in unconsolidated real estate ventures.
The following table sets forth the financial results by segment for the year ended December 31, 2024 ($ in thousands):
|
|
|
|
|
|
|
|
|
|
|
|
|
|
|
|
|
|
|
|
|
|
|
|
|
|
|
|
|
|
|
Multifamily |
|
|
Industrial |
|
|
Office |
|
|
Other |
|
|
Investments
in Real
Estate Debt |
|
|
Total |
|
Revenues: |
|
|
|
|
|
|
|
|
|
|
|
|
|
|
|
|
|
|
|
|
|
|
|
Rental revenue |
$ |
|
1,218,669 |
|
|
$ |
|
183,244 |
|
|
$ |
|
166,586 |
|
|
$ |
|
80,792 |
|
|
$ |
|
— |
|
|
$ |
|
1,649,291 |
|
Other revenue |
|
|
15,133 |
|
|
|
|
663 |
|
|
|
|
212 |
|
|
|
|
22,486 |
|
|
|
|
— |
|
|
|
|
38,494 |
|
Total revenues |
|
|
1,233,802 |
|
|
|
|
183,907 |
|
|
|
|
166,798 |
|
|
|
|
103,278 |
|
|
|
|
— |
|
|
|
|
1,687,785 |
|
Expenses: |
|
|
|
|
|
|
|
|
|
|
|
|
|
|
|
|
|
|
|
|
|
|
|
Property operating |
|
|
559,566 |
|
|
|
|
46,071 |
|
|
|
|
60,784 |
|
|
|
|
48,570 |
|
|
|
|
— |
|
|
|
|
714,991 |
|
Total segment expenses |
|
|
559,566 |
|
|
|
|
46,071 |
|
|
|
|
60,784 |
|
|
|
|
48,570 |
|
|
|
|
— |
|
|
|
|
714,991 |
|
Loss from unconsolidated
real estate ventures |
|
|
— |
|
|
|
|
— |
|
|
|
|
— |
|
|
|
|
(13,435 |
) |
|
|
|
— |
|
|
|
|
(13,435 |
) |
Income from investments in
real estate debt, net |
|
|
— |
|
|
|
|
— |
|
|
|
|
— |
|
|
|
|
— |
|
|
|
|
95,755 |
|
|
|
|
95,755 |
|
Segment net operating income |
$ |
|
674,236 |
|
|
$ |
|
137,836 |
|
|
$ |
|
106,014 |
|
|
$ |
|
41,273 |
|
|
$ |
|
95,755 |
|
|
$ |
|
1,055,114 |
|
|
|
|
|
|
|
|
|
|
|
|
|
|
|
|
|
|
|
|
|
|
|
|
|
General and administrative |
|
|
|
|
|
|
|
|
|
|
|
|
|
|
|
|
|
|
(47,048 |
) |
Management fees |
|
|
|
|
|
|
|
|
|
|
|
|
|
|
|
|
|
|
(105,356 |
) |
Impairment of investments in real estate |
|
|
|
|
|
|
|
|
|
|
(150,392 |
) |
Depreciation and amortization |
|
|
|
|
|
|
|
|
|
|
|
|
|
|
|
|
|
|
(742,220 |
) |
Net gain on dispositions of real estate |
|
|
|
|
|
|
|
|
|
|
|
|
87,108 |
|
Interest expense |
|
|
|
|
|
|
|
|
|
|
|
|
|
|
|
|
|
|
(641,420 |
) |
Other expense, net |
|
|
|
|
|
|
|
|
|
|
|
|
|
|
|
|
|
|
(179,994 |
) |
Net loss |
|
|
|
|
|
|
|
|
|
|
|
|
|
|
|
|
$ |
|
(724,208 |
) |
Net loss attributable to non-controlling interests in consolidated joint ventures |
|
|
|
|
|
|
|
|
|
|
3,228 |
|
Net loss attributable to non-controlling interests in Operating Partnership |
|
|
|
|
|
|
|
|
|
|
|
|
36,097 |
|
Net loss attributable to stockholders |
|
|
|
|
|
|
|
|
|
|
$ |
|
(684,883 |
) |
The following table sets forth the financial results by segment for the year ended December 31, 2023 ($ in thousands):
|
|
|
|
|
|
|
|
|
|
|
|
|
|
|
|
|
|
|
|
|
|
|
|
|
|
|
|
|
|
|
Multifamily |
|
|
Industrial |
|
|
Office |
|
|
Other |
|
|
Investments
in Real
Estate Debt |
|
|
Total |
|
Revenues: |
|
|
|
|
|
|
|
|
|
|
|
|
|
|
|
|
|
|
|
|
|
|
|
Rental revenue |
$ |
|
1,215,981 |
|
|
$ |
|
203,419 |
|
|
$ |
|
157,463 |
|
|
$ |
|
119,054 |
|
|
$ |
|
— |
|
|
$ |
|
1,695,917 |
|
Other revenue |
|
|
10,394 |
|
|
|
|
4 |
|
|
|
|
285 |
|
|
|
|
47,718 |
|
|
|
|
— |
|
|
|
|
58,401 |
|
Total revenues |
|
|
1,226,375 |
|
|
|
|
203,423 |
|
|
|
|
157,748 |
|
|
|
|
166,772 |
|
|
|
|
— |
|
|
|
|
1,754,318 |
|
Expenses: |
|
|
|
|
|
|
|
|
|
|
|
|
|
|
|
|
|
|
|
|
|
|
|
Property operating |
|
|
552,760 |
|
|
|
|
51,163 |
|
|
|
|
59,668 |
|
|
|
|
84,931 |
|
|
|
|
— |
|
|
|
|
748,522 |
|
Total segment expenses |
|
|
552,760 |
|
|
|
|
51,163 |
|
|
|
|
59,668 |
|
|
|
|
84,931 |
|
|
|
|
— |
|
|
|
|
748,522 |
|
Loss from unconsolidated
real estate ventures |
|
|
— |
|
|
|
|
— |
|
|
|
|
— |
|
|
|
|
(11,624 |
) |
|
|
|
— |
|
|
|
|
(11,624 |
) |
Income from investments in real
estate debt, net |
|
|
— |
|
|
|
|
— |
|
|
|
|
— |
|
|
|
|
— |
|
|
|
|
123,138 |
|
|
|
|
123,138 |
|
Segment net operating income |
$ |
|
673,615 |
|
|
$ |
|
152,260 |
|
|
$ |
|
98,080 |
|
|
$ |
|
70,217 |
|
|
$ |
|
123,138 |
|
|
$ |
|
1,117,310 |
|
|
|
|
|
|
|
|
|
|
|
|
|
|
|
|
|
|
|
|
|
|
|
|
|
General and administrative |
|
|
|
|
|
|
|
|
|
|
|
|
|
|
|
|
|
|
(45,144 |
) |
Management fees |
|
|
|
|
|
|
|
|
|
|
|
|
|
|
|
|
|
|
(153,411 |
) |
Impairment of investments in real estate |
|
|
|
|
|
|
|
|
|
|
|
|
|
|
|
|
|
|
(188,804 |
) |
Depreciation and amortization |
|
|
|
|
|
|
|
|
|
|
|
|
|
|
|
|
|
|
(811,788 |
) |
Net gain on dispositions of real estate |
|
|
|
|
|
|
|
|
|
|
|
|
|
|
|
|
|
|
289,818 |
|
Interest expense |
|
|
|
|
|
|
|
|
|
|
|
|
|
|
|
|
|
|
(583,476 |
) |
Loss on extinguishment of debt |
|
|
|
|
|
|
|
|
|
|
|
|
|
|
|
|
|
|
|
|
|
|
(93 |
) |
Other expense, net |
|
|
|
|
|
|
|
|
|
|
|
|
|
|
|
|
|
|
(299,930 |
) |
Net loss |
|
|
|
|
|
|
|
|
|
|
|
|
|
|
|
|
$ |
|
(675,518 |
) |
Net income attributable to non-controlling interests in consolidated joint ventures |
|
|
|
|
|
|
|
|
|
|
|
|
(3,350 |
) |
Net loss attributable to non-controlling interests in Operating Partnership |
|
|
|
|
|
|
|
|
|
|
|
|
29,165 |
|
Net loss attributable to stockholders |
|
|
|
|
|
|
|
|
|
|
|
|
|
|
$ |
|
(649,703 |
) |
The following table sets forth the financial results by segment for the year ended December 31, 2022 ($ in thousands):
|
|
|
|
|
|
|
|
|
|
|
|
|
|
|
|
|
|
|
|
|
|
|
|
|
|
|
|
|
|
|
Multifamily |
|
|
Industrial |
|
|
Office |
|
|
Other |
|
|
Investments
in Real
Estate Debt |
|
|
Total |
|
Revenues: |
|
|
|
|
|
|
|
|
|
|
|
|
|
|
|
|
|
|
|
|
|
|
|
Rental revenue |
$ |
|
1,068,277 |
|
|
$ |
|
177,998 |
|
|
$ |
|
136,185 |
|
|
$ |
|
138,195 |
|
|
$ |
|
— |
|
|
$ |
|
1,520,655 |
|
Other revenue |
|
|
11,114 |
|
|
|
|
42 |
|
|
|
|
416 |
|
|
|
|
47,121 |
|
|
|
|
— |
|
|
|
|
58,693 |
|
Total revenues |
|
|
1,079,391 |
|
|
|
|
178,040 |
|
|
|
|
136,601 |
|
|
|
|
185,316 |
|
|
|
|
— |
|
|
|
|
1,579,348 |
|
Expenses: |
|
|
|
|
|
|
|
|
|
|
|
|
|
|
|
|
|
|
|
|
|
|
|
Property operating |
|
|
467,413 |
|
|
|
|
44,983 |
|
|
|
|
52,972 |
|
|
|
|
85,226 |
|
|
|
|
— |
|
|
|
|
650,594 |
|
Total segment expenses |
|
|
467,413 |
|
|
|
|
44,983 |
|
|
|
|
52,972 |
|
|
|
|
85,226 |
|
|
|
|
— |
|
|
|
|
650,594 |
|
Income from unconsolidated
real estate ventures |
|
|
— |
|
|
|
|
— |
|
|
|
|
— |
|
|
|
|
12,189 |
|
|
|
|
— |
|
|
|
|
12,189 |
|
Income from investments in real
estate debt |
|
|
— |
|
|
|
|
— |
|
|
|
|
— |
|
|
|
|
— |
|
|
|
|
99,787 |
|
|
|
|
99,787 |
|
Segment net operating income |
$ |
|
611,978 |
|
|
$ |
|
133,057 |
|
|
$ |
|
83,629 |
|
|
$ |
|
112,279 |
|
|
$ |
|
99,787 |
|
|
$ |
|
1,040,730 |
|
|
|
|
|
|
|
|
|
|
|
|
|
|
|
|
|
|
|
|
|
|
|
|
|
General and administrative |
|
|
|
|
|
|
|
|
|
|
|
|
|
|
|
|
|
|
(44,708 |
) |
Management fees |
|
|
|
|
|
|
|
|
|
|
|
|
|
|
|
|
|
|
(167,100 |
) |
Performance participation allocation |
|
|
|
|
|
|
|
|
|
|
|
|
|
|
|
|
|
|
(102,348 |
) |
Depreciation and amortization |
|
|
|
|
|
|
|
|
|
|
|
|
|
|
|
|
|
|
(848,943 |
) |
Interest expense |
|
|
|
|
|
|
|
|
|
|
|
|
|
|
|
|
|
|
(428,853 |
) |
Loss on extinguishment of debt |
|
|
|
|
|
|
|
|
|
|
|
|
|
|
|
|
|
|
(313 |
) |
Other income, net |
|
|
|
|
|
|
|
|
|
|
|
|
|
|
|
|
|
|
485,608 |
|
Net loss |
|
|
|
|
|
|
|
|
|
|
|
|
|
|
|
|
$ |
|
(65,927 |
) |
Net income attributable to non-controlling interests in consolidated joint ventures |
|
|
|
|
|
|
|
|
|
|
|
|
(1,927 |
) |
Net loss attributable to non-controlling interests in Operating Partnership |
|
|
|
|
|
|
|
|
|
|
|
|
2,146 |
|
Net loss attributable to stockholders |
|
|
|
|
|
|
|
|
|
|
|
|
|
|
$ |
|
(65,708 |
) |
Financing and Capital Activity
During the period from January 1, 2025 through March 21, 2025, the Company repurchased $0.1 billion of common stock through its share repurchase plan.
During the period from January 1, 2025 through March 21, 2025, the Company repaid $0.3 billion of net borrowings on its unsecured line of credit.
Asset Dispositions
During the period from January 1, 2025 through March 21, 2025, the Company received $0.2 billion of net proceeds from sales of investments in real estate.
Reportable Segment Changes
As of January 1, 2025, the Company operates in five reportable segments: Multifamily, Industrial, Office, Other, and Investments in Real Estate Debt. As of January 1, 2025, the Single-Family Rental properties and Self-Storage properties segments were combined within the Other properties segment and previous amounts have been recasted to conform with current period presentation.
ITEM 15. EXHIBITS, FINANCIAL STATEMENT SCHEDULES
(a)List of documents filed:
(1)The consolidated financial statements of the Company.
(2)Financial Statement Schedules:
The following financial statement schedule for the year ended December 31, 2024 is submitted herewith:
|
|
|
|
|
|
|
Page |
|
|
|
|
|
Real Estate and Accumulated Depreciation (Schedule III) |
|
60 |
The agreements and other documents filed as exhibits to the 2024 Form 10-K are omitted and have not been amended or restated as part of this Form 8-K/A. This Form 8-K/A does not reflect events occurring after the Company filed the 2024 Form 10-K and does not modify or update the disclosures therein in any way, other than to illustrate the impact of the segment changes as described above. For developments subsequent to the filing of the 2024 Form 10-K, refer to the 2025 Form 10-Q. This Form 8-K/A should be read in conjunction with the 2024 Form 10-K and the 2025 Form 10-Q.
Schedule III – Real Estate and Accumulated Depreciation as of December 31, 2024 ($ in thousands)
|
|
|
|
|
|
|
|
|
|
|
|
|
|
|
|
|
|
|
|
|
|
|
|
|
|
|
|
|
|
|
|
|
|
|
|
|
|
|
|
|
|
|
|
|
|
|
|
|
|
|
|
Initial Cost |
|
|
Costs Capitalized
Subsequent
to Acquisition |
|
|
Gross Amounts at which
Carried at the Close of
Period(2) |
|
|
|
|
|
|
|
|
|
Description |
|
Location |
|
Encumbrances(1) |
|
|
Land and
Land
Improvements |
|
Building and
Building
Improvements |
|
Land and
Land
Improvements |
|
Building and
Building
Improvements |
|
Land and
Land
Improvements |
|
Building and
Building
Improvements |
|
Total |
|
Accumulated
Depreciation(1) |
|
|
Year
Acquired |
Multifamily properties: |
|
|
|
|
|
|
|
|
|
|
|
|
|
|
|
|
|
|
|
|
|
|
|
|
|
|
|
|
|
|
|
|
|
Phoenix Property |
|
Mesa, AZ |
|
$ |
|
43,542 |
|
|
$ |
|
9,472 |
|
$ |
|
35,909 |
|
$ |
|
(2,757 |
) |
$ |
|
1,910 |
|
$ |
|
6,715 |
|
$ |
|
37,819 |
|
$ |
|
44,534 |
|
$ |
|
(6,436 |
) |
|
2019 |
Florida Multifamily Portfolio |
|
|
|
|
|
|
|
|
|
|
|
|
|
|
|
|
|
|
|
|
|
|
|
|
|
|
|
|
|
|
|
|
|
Various Properties (2) |
|
Jacksonville, FL |
|
|
|
36,455 |
|
|
|
|
11,574 |
|
|
|
37,920 |
|
|
|
(2,449 |
) |
|
|
4,678 |
|
|
|
9,125 |
|
|
|
42,598 |
|
|
|
51,723 |
|
|
|
(6,925 |
) |
|
2019 |
Various Properties (2) |
|
Naples FL |
|
|
|
36,112 |
|
|
|
|
14,045 |
|
|
|
37,025 |
|
|
|
(2,256 |
) |
|
|
3,166 |
|
|
|
11,789 |
|
|
|
40,191 |
|
|
|
51,980 |
|
|
|
(6,593 |
) |
|
2019 |
Columbus Multifamily (2 properties) |
|
Columbus, OH |
|
|
|
68,326 |
|
|
|
|
6,093 |
|
|
|
96,153 |
|
|
|
946 |
|
|
|
6,968 |
|
|
|
7,039 |
|
|
|
103,121 |
|
|
|
110,160 |
|
|
|
(12,900 |
) |
|
2019 |
Cascades Apartments |
|
Charlotte, NC |
|
|
|
72,195 |
|
|
|
|
12,711 |
|
|
|
92,689 |
|
|
|
(2,060 |
) |
|
|
2,411 |
|
|
|
10,651 |
|
|
|
95,100 |
|
|
|
105,751 |
|
|
|
(14,279 |
) |
|
2019 |
Exchange on Erwin |
|
Durham, NC |
|
|
|
50,542 |
|
|
|
|
18,313 |
|
|
|
54,839 |
|
|
|
(541 |
) |
|
|
275 |
|
|
|
17,772 |
|
|
|
55,114 |
|
|
|
72,886 |
|
|
|
(8,469 |
) |
|
2019 |
Avida Apartments |
|
Salt Lake City, UT |
|
|
|
56,355 |
|
|
|
|
8,018 |
|
|
|
73,763 |
|
|
|
196 |
|
|
|
1,865 |
|
|
|
8,214 |
|
|
|
75,628 |
|
|
|
83,842 |
|
|
|
(11,221 |
) |
|
2019 |
Kalina Way |
|
Salt Lake City, UT |
|
|
|
57,928 |
|
|
|
|
7,101 |
|
|
|
74,739 |
|
|
|
500 |
|
|
|
503 |
|
|
|
7,601 |
|
|
|
75,242 |
|
|
|
82,843 |
|
|
|
(10,895 |
) |
|
2020 |
Southeast Affordable Housing Portfolio |
|
|
|
|
|
|
|
|
|
|
|
|
|
|
|
|
|
|
|
|
|
|
|
|
|
|
|
|
|
|
|
|
|
Riverwalk |
|
Brighton, CO |
|
|
|
19,015 |
|
|
|
|
3,280 |
|
|
|
20,932 |
|
|
|
332 |
|
|
|
1,261 |
|
|
|
3,612 |
|
|
|
22,193 |
|
|
|
25,805 |
|
|
|
(3,723 |
) |
|
2020 |
Patriots Pointe |
|
Concord, NC |
|
|
|
7,760 |
|
|
|
|
1,564 |
|
|
|
7,904 |
|
|
|
217 |
|
|
|
536 |
|
|
|
1,781 |
|
|
|
8,440 |
|
|
|
10,221 |
|
|
|
(1,632 |
) |
|
2020 |
Willow Ridge |
|
Greensboro, NC |
|
|
|
5,200 |
|
|
|
|
2,157 |
|
|
|
4,656 |
|
|
|
108 |
|
|
|
466 |
|
|
|
2,265 |
|
|
|
5,122 |
|
|
|
7,387 |
|
|
|
(1,232 |
) |
|
2020 |
Creekside at Bellemeade |
|
High Point, NC |
|
|
|
4,640 |
|
|
|
|
2,031 |
|
|
|
4,415 |
|
|
|
109 |
|
|
|
336 |
|
|
|
2,140 |
|
|
|
4,751 |
|
|
|
6,891 |
|
|
|
(1,535 |
) |
|
2020 |
Villa Biscayne |
|
Homestead, FL |
|
|
|
20,339 |
|
|
|
|
4,575 |
|
|
|
23,600 |
|
|
|
106 |
|
|
|
549 |
|
|
|
4,681 |
|
|
|
24,149 |
|
|
|
28,830 |
|
|
|
(4,243 |
) |
|
2020 |
Various Properties (3) |
|
Jacksonville, FL |
|
|
|
82,042 |
|
|
|
|
24,178 |
|
|
|
90,108 |
|
|
|
798 |
|
|
|
7,220 |
|
|
|
24,976 |
|
|
|
97,328 |
|
|
|
122,304 |
|
|
|
(17,862 |
) |
|
2020 |
Oak Crest |
|
Kannapolis, NC |
|
|
|
9,373 |
|
|
|
|
2,137 |
|
|
|
10,411 |
|
|
|
245 |
|
|
|
966 |
|
|
|
2,382 |
|
|
|
11,377 |
|
|
|
13,759 |
|
|
|
(2,280 |
) |
|
2020 |
Stone Creek |
|
Morrisville, NC |
|
|
|
8,364 |
|
|
|
|
1,844 |
|
|
|
7,492 |
|
|
|
133 |
|
|
|
836 |
|
|
|
1,977 |
|
|
|
8,328 |
|
|
|
10,305 |
|
|
|
(1,715 |
) |
|
2020 |
Various Properties (3) |
|
Newport News, VA |
|
|
|
43,333 |
|
|
|
|
11,169 |
|
|
|
50,997 |
|
|
|
429 |
|
|
|
3,698 |
|
|
|
11,598 |
|
|
|
54,695 |
|
|
|
66,293 |
|
|
|
(8,996 |
) |
|
2020 |
Various Properties (2) |
|
Orlando, FL |
|
|
|
72,451 |
|
|
|
|
19,513 |
|
|
|
75,364 |
|
|
|
476 |
|
|
|
2,101 |
|
|
|
19,989 |
|
|
|
77,465 |
|
|
|
97,454 |
|
|
|
(13,655 |
) |
|
2020 |
Overlook at Simms Creek |
|
Raleigh, NC |
|
|
|
25,691 |
|
|
|
|
7,189 |
|
|
|
23,030 |
|
|
|
160 |
|
|
|
1,315 |
|
|
|
7,349 |
|
|
|
24,345 |
|
|
|
31,694 |
|
|
|
(4,924 |
) |
|
2020 |
Various Properties (2) |
|
Sanford, FL |
|
|
|
65,853 |
|
|
|
|
14,916 |
|
|
|
75,253 |
|
|
|
362 |
|
|
|
2,520 |
|
|
|
15,278 |
|
|
|
77,773 |
|
|
|
93,051 |
|
|
|
(13,123 |
) |
|
2020 |
Ponce Harbor |
|
St. Augustine, FL |
|
|
|
15,601 |
|
|
|
|
3,294 |
|
|
|
18,870 |
|
|
|
144 |
|
|
|
613 |
|
|
|
3,438 |
|
|
|
19,483 |
|
|
|
22,921 |
|
|
|
(3,587 |
) |
|
2020 |
Las Villas de Kino |
|
Tucson, AZ |
|
|
|
26,255 |
|
|
|
|
9,513 |
|
|
|
24,278 |
|
|
|
971 |
|
|
|
2,793 |
|
|
|
10,484 |
|
|
|
27,071 |
|
|
|
37,555 |
|
|
|
(5,273 |
) |
|
2020 |
Lexington Club |
|
Vero Beach, FL |
|
|
|
14,738 |
|
|
|
|
2,972 |
|
|
|
19,583 |
|
|
|
147 |
|
|
|
957 |
|
|
|
3,119 |
|
|
|
20,540 |
|
|
|
23,659 |
|
|
|
(3,781 |
) |
|
2020 |
Parkside Royal Poinciana |
|
West Palm Beach, FL |
|
|
|
10,045 |
|
|
|
|
4,624 |
|
|
|
8,889 |
|
|
|
339 |
|
|
|
1,803 |
|
|
|
4,963 |
|
|
|
10,692 |
|
|
|
15,655 |
|
|
|
(2,238 |
) |
|
2020 |
Mid-Atlantic Affordable Housing Portfolio |
|
|
|
|
|
|
|
|
|
|
|
|
|
|
|
|
|
|
|
|
|
|
|
|
|
|
|
|
|
|
|
|
|
Various Properties (2) |
|
Chesapeake, VA |
|
|
|
26,880 |
|
|
|
|
6,467 |
|
|
|
28,766 |
|
|
|
212 |
|
|
|
1,219 |
|
|
|
6,679 |
|
|
|
29,985 |
|
|
|
36,664 |
|
|
|
(4,477 |
) |
|
2020 |
Columbia Hills |
|
Columbia, TN |
|
|
|
9,740 |
|
|
|
|
2,871 |
|
|
|
9,816 |
|
|
|
200 |
|
|
|
920 |
|
|
|
3,071 |
|
|
|
10,736 |
|
|
|
13,807 |
|
|
|
(1,998 |
) |
|
2020 |
Foxridge |
|
Durham, NC |
|
|
|
10,333 |
|
|
|
|
2,524 |
|
|
|
10,986 |
|
|
|
129 |
|
|
|
679 |
|
|
|
2,653 |
|
|
|
11,665 |
|
|
|
14,318 |
|
|
|
(1,948 |
) |
|
2020 |
Crestview |
|
Fredericksburg, VA |
|
|
|
26,720 |
|
|
|
|
4,358 |
|
|
|
30,470 |
|
|
|
101 |
|
|
|
850 |
|
|
|
4,459 |
|
|
|
31,320 |
|
|
|
35,779 |
|
|
|
(4,649 |
) |
|
2020 |
Bridgeport |
|
Hampton, VA |
|
|
|
17,130 |
|
|
|
|
4,285 |
|
|
|
18,075 |
|
|
|
118 |
|
|
|
826 |
|
|
|
4,403 |
|
|
|
18,901 |
|
|
|
23,304 |
|
|
|
(2,831 |
) |
|
2020 |
Various Properties (2) |
|
Harrisonburg, VA |
|
|
|
11,760 |
|
|
|
|
4,022 |
|
|
|
11,222 |
|
|
|
131 |
|
|
|
569 |
|
|
|
4,153 |
|
|
|
11,791 |
|
|
|
15,944 |
|
|
|
(2,318 |
) |
|
2020 |
Cascade Village |
|
Holland, MI |
|
|
|
13,680 |
|
|
|
|
3,389 |
|
|
|
14,530 |
|
|
|
585 |
|
|
|
1,053 |
|
|
|
3,974 |
|
|
|
15,583 |
|
|
|
19,557 |
|
|
|
(2,610 |
) |
|
2020 |
Parkview |
|
Huntersville, NC |
|
|
|
11,191 |
|
|
|
|
1,876 |
|
|
|
12,739 |
|
|
|
45 |
|
|
|
192 |
|
|
|
1,921 |
|
|
|
12,931 |
|
|
|
14,852 |
|
|
|
(1,955 |
) |
|
2020 |
Various Properties (4) |
|
Manassas, VA |
|
|
|
70,695 |
|
|
|
|
10,637 |
|
|
|
81,855 |
|
|
|
419 |
|
|
|
1,328 |
|
|
|
11,056 |
|
|
|
83,183 |
|
|
|
94,239 |
|
|
|
(12,031 |
) |
|
2020 |
Autumn Ridge |
|
Memphis, TN |
|
|
|
7,547 |
|
|
|
|
2,591 |
|
|
|
7,180 |
|
|
|
149 |
|
|
|
470 |
|
|
|
2,740 |
|
|
|
7,650 |
|
|
|
10,390 |
|
|
|
(1,338 |
) |
|
2020 |
Genito Glen |
|
Midlothian, VA |
|
|
|
10,960 |
|
|
|
|
2,703 |
|
|
|
11,559 |
|
|
|
96 |
|
|
|
374 |
|
|
|
2,799 |
|
|
|
11,933 |
|
|
|
14,732 |
|
|
|
(1,989 |
) |
|
2020 |
Kings Ridge |
|
Newport News, VA |
|
|
|
15,572 |
|
|
|
|
4,729 |
|
|
|
15,539 |
|
|
|
352 |
|
|
|
1,047 |
|
|
|
5,081 |
|
|
|
16,586 |
|
|
|
21,667 |
|
|
|
(2,877 |
) |
|
2020 |
River Birch |
|
Raleigh, NC |
|
|
|
19,411 |
|
|
|
|
4,168 |
|
|
|
21,150 |
|
|
|
147 |
|
|
|
905 |
|
|
|
4,315 |
|
|
|
22,055 |
|
|
|
26,370 |
|
|
|
(3,155 |
) |
|
2020 |
Falcon Pointe |
|
Rosenberg, TX |
|
|
|
9,440 |
|
|
|
|
1,876 |
|
|
|
10,461 |
|
|
|
120 |
|
|
|
461 |
|
|
|
1,996 |
|
|
|
10,922 |
|
|
|
12,918 |
|
|
|
(1,967 |
) |
|
2020 |
Sterling Crest |
|
Saginaw, MI |
|
|
|
8,800 |
|
|
|
|
4,176 |
|
|
|
7,229 |
|
|
|
386 |
|
|
|
862 |
|
|
|
4,562 |
|
|
|
8,091 |
|
|
|
12,653 |
|
|
|
(1,699 |
) |
|
2020 |
Las Villas de Leon |
|
San Antonio, TX |
|
|
|
7,560 |
|
|
|
|
2,347 |
|
|
|
7,458 |
|
|
|
324 |
|
|
|
990 |
|
|
|
2,671 |
|
|
|
8,448 |
|
|
|
11,119 |
|
|
|
(1,597 |
) |
|
2020 |
Stonegate |
|
Stafford, VA |
|
|
|
28,880 |
|
|
|
|
3,963 |
|
|
|
33,721 |
|
|
|
92 |
|
|
|
584 |
|
|
|
4,055 |
|
|
|
34,305 |
|
|
|
38,360 |
|
|
|
(4,727 |
) |
|
2020 |
River Park Place |
|
Vero Beach, FL |
|
|
|
8,538 |
|
|
|
|
2,661 |
|
|
|
8,425 |
|
|
|
161 |
|
|
|
553 |
|
|
|
2,822 |
|
|
|
8,978 |
|
|
|
11,800 |
|
|
|
(1,613 |
) |
|
2020 |
Ocean Gate |
|
Virginia Beach, VA |
|
|
|
20,080 |
|
|
|
|
4,347 |
|
|
|
21,957 |
|
|
|
169 |
|
|
|
645 |
|
|
|
4,516 |
|
|
|
22,602 |
|
|
|
27,118 |
|
|
|
(3,438 |
) |
|
2020 |
Autumn Wind |
|
Winchester, VA |
|
|
|
9,840 |
|
|
|
|
2,724 |
|
|
|
10,005 |
|
|
|
161 |
|
|
|
351 |
|
|
|
2,885 |
|
|
|
10,356 |
|
|
|
13,241 |
|
|
|
(1,975 |
) |
|
2020 |
Various Properties (3) |
|
Woodbridge, VA |
|
|
|
55,243 |
|
|
|
|
8,617 |
|
|
|
63,627 |
|
|
|
349 |
|
|
|
1,710 |
|
|
|
8,966 |
|
|
|
65,337 |
|
|
|
74,303 |
|
|
|
(9,506 |
) |
|
2020 |
|
|
|
|
|
|
|
|
|
|
|
|
|
|
|
|
|
|
|
|
|
|
|
|
|
|
|
|
|
|
|
|
|
|
|
|
|
|
|
|
|
|
|
|
|
|
|
|
|
|
|
|
Initial Cost |
|
|
Costs Capitalized
Subsequent
to Acquisition |
|
|
Gross Amounts at which
Carried at the Close of
Period(2) |
|
|
|
|
|
|
|
|
|
Description |
|
Location |
|
Encumbrances |
|
|
Land and
Land
Improvements |
|
Building and
Building
Improvements |
|
Land and
Land
Improvements |
|
Building and
Building
Improvements |
|
Land and
Land
Improvements |
|
Building and
Building
Improvements |
|
Total |
|
Accumulated
Depreciation(1) |
|
|
Year
Acquired |
Florida Affordable Housing Portfolio II (4 properties) |
|
Jacksonville, FL |
|
$ |
|
85,840 |
|
|
$ |
|
16,599 |
|
$ |
|
95,453 |
|
$ |
|
459 |
|
$ |
|
12,442 |
|
$ |
|
17,058 |
|
$ |
|
107,895 |
|
$ |
|
124,953 |
|
$ |
|
(16,011 |
) |
|
2021 |
Southeast Affordable Housing Portfolio II |
|
|
|
|
|
|
|
|
|
|
|
|
|
|
|
|
|
|
|
|
|
|
|
|
|
|
|
|
|
|
|
|
|
Culpeper Commons |
|
Culpeper, VA |
|
|
|
12,483 |
|
|
|
|
4,058 |
|
|
|
13,749 |
|
|
|
123 |
|
|
|
848 |
|
|
|
4,181 |
|
|
|
14,597 |
|
|
|
18,778 |
|
|
|
(2,673 |
) |
|
2021 |
Magnolia Creste |
|
Dallas, GA |
|
|
|
16,438 |
|
|
|
|
2,650 |
|
|
|
21,475 |
|
|
|
239 |
|
|
|
503 |
|
|
|
2,889 |
|
|
|
21,978 |
|
|
|
24,867 |
|
|
|
(3,248 |
) |
|
2021 |
Glen Creek |
|
Elkton, MD |
|
|
|
15,263 |
|
|
|
|
5,985 |
|
|
|
16,353 |
|
|
|
218 |
|
|
|
875 |
|
|
|
6,203 |
|
|
|
17,228 |
|
|
|
23,431 |
|
|
|
(3,412 |
) |
|
2021 |
England Run |
|
Fredericksburg, VA |
|
|
|
18,812 |
|
|
|
|
3,857 |
|
|
|
23,614 |
|
|
|
188 |
|
|
|
694 |
|
|
|
4,045 |
|
|
|
24,308 |
|
|
|
28,353 |
|
|
|
(3,491 |
) |
|
2021 |
Rocky Creek |
|
Greenville, SC |
|
|
|
14,395 |
|
|
|
|
3,030 |
|
|
|
17,079 |
|
|
|
198 |
|
|
|
868 |
|
|
|
3,228 |
|
|
|
17,947 |
|
|
|
21,175 |
|
|
|
(2,735 |
) |
|
2021 |
Grande Court Boggy |
|
Kissimmee, FL |
|
|
|
34,904 |
|
|
|
|
9,361 |
|
|
|
41,265 |
|
|
|
200 |
|
|
|
744 |
|
|
|
9,561 |
|
|
|
42,009 |
|
|
|
51,570 |
|
|
|
(6,723 |
) |
|
2021 |
Magnolia Village |
|
Lawrenceville, GA |
|
|
|
15,783 |
|
|
|
|
5,107 |
|
|
|
16,645 |
|
|
|
215 |
|
|
|
657 |
|
|
|
5,322 |
|
|
|
17,302 |
|
|
|
22,624 |
|
|
|
(3,244 |
) |
|
2021 |
Park Ridge |
|
Stafford, VA |
|
|
|
20,255 |
|
|
|
|
3,778 |
|
|
|
25,689 |
|
|
|
101 |
|
|
|
449 |
|
|
|
3,879 |
|
|
|
26,138 |
|
|
|
30,017 |
|
|
|
(3,480 |
) |
|
2021 |
Glen Ridge |
|
Woodbridge, VA |
|
|
|
21,667 |
|
|
|
|
4,159 |
|
|
|
27,218 |
|
|
|
200 |
|
|
|
725 |
|
|
|
4,359 |
|
|
|
27,943 |
|
|
|
32,302 |
|
|
|
(3,595 |
) |
|
2021 |
Azalea Multifamily Portfolio |
|
|
|
|
|
|
|
|
|
|
|
|
|
|
|
|
|
|
|
|
|
|
|
|
|
|
|
|
|
|
|
|
|
Luxe |
|
Aubrey, TX |
|
|
|
52,290 |
|
|
|
|
10,084 |
|
|
|
78,835 |
|
|
|
(1,428 |
) |
|
|
(12,665 |
) |
|
|
8,656 |
|
|
|
66,170 |
|
|
|
74,826 |
|
|
|
(8,048 |
) |
|
2021 |
Travesia |
|
Austin, TX |
|
|
|
75,460 |
|
|
|
|
13,787 |
|
|
|
79,703 |
|
|
|
293 |
|
|
|
1,087 |
|
|
|
14,080 |
|
|
|
80,790 |
|
|
|
94,870 |
|
|
|
(8,084 |
) |
|
2021 |
Afton Ridge |
|
Concord, NC |
|
|
|
54,062 |
|
|
|
|
9,516 |
|
|
|
62,919 |
|
|
|
104 |
|
|
|
125 |
|
|
|
9,620 |
|
|
|
63,044 |
|
|
|
72,664 |
|
|
|
(6,524 |
) |
|
2021 |
Various Properties (2) |
|
Dallas, TX |
|
|
|
84,140 |
|
|
|
|
13,031 |
|
|
|
125,670 |
|
|
|
375 |
|
|
|
2,184 |
|
|
|
13,406 |
|
|
|
127,854 |
|
|
|
141,260 |
|
|
|
(12,620 |
) |
|
2021 |
Clearbrook |
|
Frederick, MD |
|
|
|
62,090 |
|
|
|
|
12,564 |
|
|
|
51,451 |
|
|
|
63 |
|
|
|
246 |
|
|
|
12,627 |
|
|
|
51,697 |
|
|
|
64,324 |
|
|
|
(5,171 |
) |
|
2021 |
Thornton Park |
|
Jacksonville, FL |
|
|
|
66,616 |
|
|
|
|
9,950 |
|
|
|
91,924 |
|
|
|
369 |
|
|
|
324 |
|
|
|
10,319 |
|
|
|
92,248 |
|
|
|
102,567 |
|
|
|
(9,043 |
) |
|
2021 |
Gwinnett Stadium |
|
Lawrenceville, GA |
|
|
|
41,090 |
|
|
|
|
5,199 |
|
|
|
48,131 |
|
|
|
170 |
|
|
|
221 |
|
|
|
5,369 |
|
|
|
48,352 |
|
|
|
53,721 |
|
|
|
(4,538 |
) |
|
2021 |
Park Place |
|
Morrisville, NC |
|
|
|
52,920 |
|
|
|
|
9,295 |
|
|
|
57,281 |
|
|
|
107 |
|
|
|
541 |
|
|
|
9,402 |
|
|
|
57,822 |
|
|
|
67,224 |
|
|
|
(6,188 |
) |
|
2021 |
Autumn Wood |
|
Murfreesboro, TN |
|
|
|
42,490 |
|
|
|
|
6,114 |
|
|
|
54,974 |
|
|
|
185 |
|
|
|
(44 |
) |
|
|
6,299 |
|
|
|
54,930 |
|
|
|
61,229 |
|
|
|
(5,862 |
) |
|
2021 |
Millenia |
|
Orlando, FL |
|
|
|
36,890 |
|
|
|
|
6,305 |
|
|
|
47,647 |
|
|
|
98 |
|
|
|
1,101 |
|
|
|
6,403 |
|
|
|
48,748 |
|
|
|
55,151 |
|
|
|
(4,858 |
) |
|
2021 |
Various Properties (2) |
|
Pflugerville, TX |
|
|
|
107,590 |
|
|
|
|
24,606 |
|
|
|
142,875 |
|
|
|
580 |
|
|
|
2,586 |
|
|
|
25,186 |
|
|
|
145,461 |
|
|
|
170,647 |
|
|
|
(14,461 |
) |
|
2021 |
Lakehouse |
|
Plant City, FL |
|
|
|
16,940 |
|
|
|
|
3,334 |
|
|
|
23,339 |
|
|
|
37 |
|
|
|
195 |
|
|
|
3,371 |
|
|
|
23,534 |
|
|
|
26,905 |
|
|
|
(2,544 |
) |
|
2021 |
Victoria Grand |
|
Tallahassee, FL |
|
|
|
47,390 |
|
|
|
|
7,002 |
|
|
|
61,768 |
|
|
|
120 |
|
|
|
580 |
|
|
|
7,122 |
|
|
|
62,348 |
|
|
|
69,470 |
|
|
|
(6,338 |
) |
|
2021 |
Keystone Castle Hills |
|
Dallas, TX |
|
|
|
89,922 |
|
|
|
|
23,122 |
|
|
|
99,118 |
|
|
|
990 |
|
|
|
2,033 |
|
|
|
24,112 |
|
|
|
101,151 |
|
|
|
125,263 |
|
|
|
(16,660 |
) |
|
2021 |
Greater Boston Affordable Portfolio (5 properties) |
|
Boston, MA |
|
|
|
142,059 |
|
|
|
|
60,313 |
|
|
|
176,849 |
|
|
|
449 |
|
|
|
(85 |
) |
|
|
60,762 |
|
|
|
176,764 |
|
|
|
237,526 |
|
|
|
(16,946 |
) |
|
2021 |
Columbus Preferred Portfolio |
|
|
|
|
|
|
|
|
|
|
|
|
|
|
|
|
|
|
|
|
|
|
|
|
|
|
|
|
|
|
|
|
|
5188 Baxter Park |
|
Westerville, OH |
|
|
|
21,700 |
|
|
|
|
6,795 |
|
|
|
23,058 |
|
|
|
(1,253 |
) |
|
|
1,234 |
|
|
|
5,542 |
|
|
|
24,292 |
|
|
|
29,834 |
|
|
|
(2,225 |
) |
|
2021 |
1025 Luxe Avenue |
|
Columbus, OH |
|
|
|
45,500 |
|
|
|
|
7,955 |
|
|
|
43,178 |
|
|
|
(27 |
) |
|
|
176 |
|
|
|
7,928 |
|
|
|
43,354 |
|
|
|
51,282 |
|
|
|
(3,902 |
) |
|
2021 |
The Palmer Dadeland |
|
Miami, FL |
|
|
|
259,800 |
|
|
|
|
56,854 |
|
|
|
304,585 |
|
|
|
723 |
|
|
|
2,187 |
|
|
|
57,577 |
|
|
|
306,772 |
|
|
|
364,349 |
|
|
|
(30,985 |
) |
|
2021 |
Seven Springs Apartments |
|
Burlington, MA |
|
|
|
117,110 |
|
|
|
|
27,104 |
|
|
|
164,679 |
|
|
|
30 |
|
|
|
697 |
|
|
|
27,134 |
|
|
|
165,376 |
|
|
|
192,510 |
|
|
|
(16,375 |
) |
|
2021 |
Maison’s Landing |
|
Salt Lake City, UT |
|
|
|
102,120 |
|
|
|
|
14,890 |
|
|
|
152,592 |
|
|
|
343 |
|
|
|
1,736 |
|
|
|
15,233 |
|
|
|
154,328 |
|
|
|
169,561 |
|
|
|
(17,038 |
) |
|
2021 |
Sawyer Flats |
|
Gaithersburg, MD |
|
|
|
144,060 |
|
|
|
|
32,701 |
|
|
|
168,846 |
|
|
|
1,385 |
|
|
|
2,929 |
|
|
|
34,086 |
|
|
|
171,775 |
|
|
|
205,861 |
|
|
|
(18,127 |
) |
|
2021 |
Florida Affordable Housing Portfolio III |
|
|
|
|
|
|
|
|
|
|
|
|
|
|
|
|
|
|
|
|
|
|
|
|
|
|
|
|
|
|
|
|
|
Various Properties (2) |
|
Bradenton, FL |
|
|
|
75,290 |
|
|
|
|
20,960 |
|
|
|
101,049 |
|
|
|
631 |
|
|
|
2,186 |
|
|
|
21,591 |
|
|
|
103,235 |
|
|
|
124,826 |
|
|
|
(15,593 |
) |
|
2021 |
Enclave on Woodbridge |
|
Fernandina Beach, FL |
|
|
|
25,690 |
|
|
|
|
6,407 |
|
|
|
36,228 |
|
|
|
56 |
|
|
|
783 |
|
|
|
6,463 |
|
|
|
37,011 |
|
|
|
43,474 |
|
|
|
(5,544 |
) |
|
2021 |
Charleston Place |
|
Holly Hill, FL |
|
|
|
17,520 |
|
|
|
|
5,930 |
|
|
|
21,309 |
|
|
|
91 |
|
|
|
935 |
|
|
|
6,021 |
|
|
|
22,244 |
|
|
|
28,265 |
|
|
|
(3,626 |
) |
|
2021 |
Brookwood Forest |
|
Jacksonville, FL |
|
|
|
23,560 |
|
|
|
|
4,250 |
|
|
|
35,025 |
|
|
|
223 |
|
|
|
948 |
|
|
|
4,473 |
|
|
|
35,973 |
|
|
|
40,446 |
|
|
|
(4,404 |
) |
|
2021 |
Various Properties (2) |
|
Lakeland, FL |
|
|
|
37,080 |
|
|
|
|
7,112 |
|
|
|
57,801 |
|
|
|
601 |
|
|
|
779 |
|
|
|
7,713 |
|
|
|
58,580 |
|
|
|
66,293 |
|
|
|
(7,927 |
) |
|
2021 |
Club at Sugar Mill |
|
Port Orange, FL |
|
|
|
14,260 |
|
|
|
|
4,449 |
|
|
|
15,946 |
|
|
|
114 |
|
|
|
669 |
|
|
|
4,563 |
|
|
|
16,615 |
|
|
|
21,178 |
|
|
|
(2,678 |
) |
|
2021 |
Nantucket Cove |
|
Springhill, FL |
|
|
|
15,800 |
|
|
|
|
4,592 |
|
|
|
20,167 |
|
|
|
99 |
|
|
|
425 |
|
|
|
4,691 |
|
|
|
20,592 |
|
|
|
25,283 |
|
|
|
(3,495 |
) |
|
2021 |
Various Properties (5) |
|
Tampa, FL |
|
|
|
73,610 |
|
|
|
|
26,276 |
|
|
|
96,632 |
|
|
|
621 |
|
|
|
1,211 |
|
|
|
26,897 |
|
|
|
97,843 |
|
|
|
124,740 |
|
|
|
(14,547 |
) |
|
2021 |
Savannah Bay |
|
Tarpon Springs, FL |
|
|
|
12,610 |
|
|
|
|
5,374 |
|
|
|
9,640 |
|
|
|
129 |
|
|
|
456 |
|
|
|
5,503 |
|
|
|
10,096 |
|
|
|
15,599 |
|
|
|
(2,066 |
) |
|
2021 |
Nantucket Bay |
|
Temple Terrace, FL |
|
|
|
15,150 |
|
|
|
|
6,364 |
|
|
|
18,782 |
|
|
|
147 |
|
|
|
239 |
|
|
|
6,511 |
|
|
|
19,021 |
|
|
|
25,532 |
|
|
|
(2,731 |
) |
|
2021 |
Raleigh Multifamily Portfolio |
|
|
|
|
|
|
|
|
|
|
|
|
|
|
|
|
|
|
|
|
|
|
|
|
|
|
|
|
|
|
|
|
|
2600 Harvest Creek Place |
|
Cary, NC |
|
|
|
60,900 |
|
|
|
|
16,094 |
|
|
|
77,575 |
|
|
|
(11 |
) |
|
|
1,583 |
|
|
|
16,083 |
|
|
|
79,158 |
|
|
|
95,241 |
|
|
|
(7,496 |
) |
|
2021 |
5140 Copper Ridge Drive |
|
Durham, NC |
|
|
|
41,900 |
|
|
|
|
8,733 |
|
|
|
53,561 |
|
|
|
(6 |
) |
|
|
1,484 |
|
|
|
8,727 |
|
|
|
55,045 |
|
|
|
63,772 |
|
|
|
(5,388 |
) |
|
2021 |
1000 Henrico Lane |
|
Morrisville, NC |
|
|
|
68,600 |
|
|
|
|
12,383 |
|
|
|
86,037 |
|
|
|
(9 |
) |
|
|
1,680 |
|
|
|
12,374 |
|
|
|
87,717 |
|
|
|
100,091 |
|
|
|
(8,162 |
) |
|
2021 |
Various Properties (3) |
|
Raleigh, NC |
|
|
|
196,000 |
|
|
|
|
40,491 |
|
|
|
252,991 |
|
|
|
(28 |
) |
|
|
7,052 |
|
|
|
40,463 |
|
|
|
260,043 |
|
|
|
300,506 |
|
|
|
(21,174 |
) |
|
2021 |
|
|
|
|
|
|
|
|
|
|
|
|
|
|
|
|
|
|
|
|
|
|
|
|
|
|
|
|
|
|
|
|
|
|
|
|
|
|
|
|
|
|
|
|
|
|
|
|
|
|
|
|
Initial Cost |
|
|
Costs Capitalized
Subsequent
to Acquisition |
|
|
Gross Amounts at which
Carried at the Close of
Period(2) |
|
|
|
|
|
|
|
|
|
Description |
|
Location |
|
Encumbrances |
|
|
Land and
Land
Improvements |
|
Building and
Building
Improvements |
|
Land and
Land
Improvements |
|
Building and
Building
Improvements |
|
Land and
Land
Improvements |
|
Building and
Building
Improvements |
|
Total |
|
Accumulated
Depreciation(1) |
|
|
Year
Acquired |
South Florida Multifamily Portfolio |
|
|
|
|
|
|
|
|
|
|
|
|
|
|
|
|
|
|
|
|
|
|
|
|
|
|
|
|
|
|
|
|
|
Bella Vista |
|
Boca Raton, FL |
|
$ |
|
95,500 |
|
|
$ |
|
13,144 |
|
$ |
|
125,094 |
|
$ |
|
3,987 |
|
$ |
|
(2,954 |
) |
$ |
|
17,131 |
|
$ |
|
122,140 |
|
$ |
|
139,271 |
|
$ |
|
(11,030 |
) |
|
2021 |
Stonybrook |
|
Boynton Beach, FL |
|
|
|
67,600 |
|
|
|
|
12,346 |
|
|
|
81,036 |
|
|
|
740 |
|
|
|
1,659 |
|
|
|
13,086 |
|
|
|
82,695 |
|
|
|
95,781 |
|
|
|
(7,961 |
) |
|
2021 |
Centro Sunforest |
|
Davie, FL |
|
|
|
103,300 |
|
|
|
|
25,015 |
|
|
|
152,738 |
|
|
|
(3,584 |
) |
|
|
1,636 |
|
|
|
21,431 |
|
|
|
154,374 |
|
|
|
175,805 |
|
|
|
(14,614 |
) |
|
2021 |
SEG Multifamily Portfolio |
|
|
|
|
|
|
|
|
|
|
|
|
|
|
|
|
|
|
|
|
|
|
|
|
|
|
|
|
|
|
|
|
|
Alta Mill Apartments |
|
Austell, GA |
|
|
|
62,965 |
|
|
|
|
13,213 |
|
|
|
82,343 |
|
|
|
(799 |
) |
|
|
13,236 |
|
|
|
12,414 |
|
|
|
95,579 |
|
|
|
107,993 |
|
|
|
(11,110 |
) |
|
2021 |
Estate on Quarry Lake Apartments |
|
Austin, TX |
|
|
|
45,403 |
|
|
|
|
9,565 |
|
|
|
59,725 |
|
|
|
(2,444 |
) |
|
|
12,857 |
|
|
|
7,121 |
|
|
|
72,582 |
|
|
|
79,703 |
|
|
|
(8,135 |
) |
|
2021 |
Various Properties (2) |
|
Brunswick, GA |
|
|
|
35,823 |
|
|
|
|
7,529 |
|
|
|
47,011 |
|
|
|
974 |
|
|
|
5,952 |
|
|
|
8,503 |
|
|
|
52,963 |
|
|
|
61,466 |
|
|
|
(8,105 |
) |
|
2021 |
Lodge at Mallard Creek |
|
Charlotte, NC |
|
|
|
35,524 |
|
|
|
|
7,816 |
|
|
|
48,785 |
|
|
|
(1,257 |
) |
|
|
9,644 |
|
|
|
6,559 |
|
|
|
58,429 |
|
|
|
64,988 |
|
|
|
(7,014 |
) |
|
2021 |
Brook Valley Apartments |
|
Douglasville, GA |
|
|
|
22,951 |
|
|
|
|
4,837 |
|
|
|
30,158 |
|
|
|
600 |
|
|
|
4,178 |
|
|
|
5,437 |
|
|
|
34,336 |
|
|
|
39,773 |
|
|
|
(4,509 |
) |
|
2021 |
Various Properties (4) |
|
Everett, WA |
|
|
|
137,405 |
|
|
|
|
31,576 |
|
|
|
198,984 |
|
|
|
(1,960 |
) |
|
|
28,693 |
|
|
|
29,616 |
|
|
|
227,677 |
|
|
|
257,293 |
|
|
|
(22,939 |
) |
|
2021 |
Towne Creek |
|
Gainesville, GA |
|
|
|
15,766 |
|
|
|
|
3,307 |
|
|
|
20,549 |
|
|
|
1,331 |
|
|
|
2,306 |
|
|
|
4,638 |
|
|
|
22,855 |
|
|
|
27,493 |
|
|
|
(2,973 |
) |
|
2021 |
Icon on the Greenway |
|
Gastonia, NC |
|
|
|
24,747 |
|
|
|
|
5,110 |
|
|
|
31,932 |
|
|
|
(1,696 |
) |
|
|
6,808 |
|
|
|
3,414 |
|
|
|
38,740 |
|
|
|
42,154 |
|
|
|
(4,954 |
) |
|
2021 |
Woodland Park Apartments |
|
Greensboro, NC |
|
|
|
18,173 |
|
|
|
|
3,484 |
|
|
|
27,201 |
|
|
|
1,557 |
|
|
|
(2,668 |
) |
|
|
5,041 |
|
|
|
24,533 |
|
|
|
29,574 |
|
|
|
(3,856 |
) |
|
2021 |
Estates at Bellwood Apartments |
|
Greenville, SC |
|
|
|
15,267 |
|
|
|
|
3,266 |
|
|
|
20,401 |
|
|
|
585 |
|
|
|
2,371 |
|
|
|
3,851 |
|
|
|
22,772 |
|
|
|
26,623 |
|
|
|
(3,558 |
) |
|
2021 |
Audubon Park Apartments |
|
Hanahan, SC |
|
|
|
26,144 |
|
|
|
|
5,397 |
|
|
|
33,706 |
|
|
|
(207 |
) |
|
|
5,415 |
|
|
|
5,190 |
|
|
|
39,121 |
|
|
|
44,311 |
|
|
|
(4,860 |
) |
|
2021 |
Waterford Landing Apartments |
|
Hermitage, TN |
|
|
|
25,745 |
|
|
|
|
5,616 |
|
|
|
64,899 |
|
|
|
(1,067 |
) |
|
|
(22,753 |
) |
|
|
4,549 |
|
|
|
42,146 |
|
|
|
46,695 |
|
|
|
(5,072 |
) |
|
2021 |
Various Properties (2) |
|
High Point, NC |
|
|
|
33,187 |
|
|
|
|
5,848 |
|
|
|
36,515 |
|
|
|
(517 |
) |
|
|
5,473 |
|
|
|
5,331 |
|
|
|
41,988 |
|
|
|
47,319 |
|
|
|
(5,980 |
) |
|
2021 |
Northtowne Village Apartments |
|
Hixson, TN |
|
|
|
17,463 |
|
|
|
|
3,621 |
|
|
|
41,985 |
|
|
|
(304 |
) |
|
|
(15,473 |
) |
|
|
3,317 |
|
|
|
26,512 |
|
|
|
29,829 |
|
|
|
(3,363 |
) |
|
2021 |
Revival on Main |
|
Kennesaw, GA |
|
|
|
47,897 |
|
|
|
|
9,920 |
|
|
|
61,794 |
|
|
|
(2,263 |
) |
|
|
11,819 |
|
|
|
7,657 |
|
|
|
73,613 |
|
|
|
81,270 |
|
|
|
(7,026 |
) |
|
2021 |
Various Properties (2) |
|
Knoxville, TN |
|
|
|
138,503 |
|
|
|
|
29,131 |
|
|
|
337,357 |
|
|
|
6,268 |
|
|
|
(132,374 |
) |
|
|
35,399 |
|
|
|
204,983 |
|
|
|
240,382 |
|
|
|
(31,339 |
) |
|
2021 |
Lee's Crossing |
|
La Grange, GA |
|
|
|
28,738 |
|
|
|
|
6,053 |
|
|
|
37,698 |
|
|
|
882 |
|
|
|
6,095 |
|
|
|
6,935 |
|
|
|
43,793 |
|
|
|
50,728 |
|
|
|
(6,218 |
) |
|
2021 |
Durant at Sugarloaf Apartments |
|
Lawrenceville, GA |
|
|
|
39,914 |
|
|
|
|
8,390 |
|
|
|
52,333 |
|
|
|
4,520 |
|
|
|
2,844 |
|
|
|
12,910 |
|
|
|
55,177 |
|
|
|
68,087 |
|
|
|
(7,708 |
) |
|
2021 |
Racquet Club |
|
Lexington, KY |
|
|
|
34,027 |
|
|
|
|
8,663 |
|
|
|
53,959 |
|
|
|
2,563 |
|
|
|
7,435 |
|
|
|
11,226 |
|
|
|
61,394 |
|
|
|
72,620 |
|
|
|
(8,005 |
) |
|
2021 |
Nickel Creek |
|
Lynnwood, WA |
|
|
|
33,229 |
|
|
|
|
8,062 |
|
|
|
50,855 |
|
|
|
(558 |
) |
|
|
9,433 |
|
|
|
7,504 |
|
|
|
60,288 |
|
|
|
67,792 |
|
|
|
(5,995 |
) |
|
2021 |
Northwood Apartments |
|
Macon, GA |
|
|
|
20,955 |
|
|
|
|
4,400 |
|
|
|
27,497 |
|
|
|
321 |
|
|
|
3,710 |
|
|
|
4,721 |
|
|
|
31,207 |
|
|
|
35,928 |
|
|
|
(4,587 |
) |
|
2021 |
Falls at Sope Creek |
|
Marietta, GA |
|
|
|
60,171 |
|
|
|
|
12,667 |
|
|
|
78,943 |
|
|
|
(98 |
) |
|
|
13,088 |
|
|
|
12,569 |
|
|
|
92,031 |
|
|
|
104,600 |
|
|
|
(10,049 |
) |
|
2021 |
Ashmore Bridge Estates Apartments |
|
Mauldin, SC |
|
|
|
27,341 |
|
|
|
|
5,548 |
|
|
|
42,280 |
|
|
|
679 |
|
|
|
(2,808 |
) |
|
|
6,227 |
|
|
|
39,472 |
|
|
|
45,699 |
|
|
|
(5,937 |
) |
|
2021 |
Waterstone at Murietta Apartments |
|
Murieta, CA |
|
|
|
83,122 |
|
|
|
|
18,884 |
|
|
|
117,823 |
|
|
|
(897 |
) |
|
|
18,780 |
|
|
|
17,987 |
|
|
|
136,603 |
|
|
|
154,590 |
|
|
|
(15,472 |
) |
|
2021 |
Wyndchase Bellevue Apartments |
|
Nashville, TN |
|
|
|
31,233 |
|
|
|
|
6,531 |
|
|
|
75,691 |
|
|
|
(2,562 |
) |
|
|
(25,067 |
) |
|
|
3,969 |
|
|
|
50,624 |
|
|
|
54,593 |
|
|
|
(5,498 |
) |
|
2021 |
Woodland Crossing Apartments |
|
New Bern, NC |
|
|
|
23,849 |
|
|
|
|
5,261 |
|
|
|
32,819 |
|
|
|
(1,846 |
) |
|
|
7,085 |
|
|
|
3,415 |
|
|
|
39,904 |
|
|
|
43,319 |
|
|
|
(5,198 |
) |
|
2021 |
Ranchstone |
|
Parker, CO |
|
|
|
74,540 |
|
|
|
|
17,012 |
|
|
|
126,989 |
|
|
|
(7,748 |
) |
|
|
5,133 |
|
|
|
9,264 |
|
|
|
132,122 |
|
|
|
141,386 |
|
|
|
(14,700 |
) |
|
2021 |
Gio Apartments |
|
Plano, TX |
|
|
|
86,714 |
|
|
|
|
22,546 |
|
|
|
140,590 |
|
|
|
(7,861 |
) |
|
|
(5,254 |
) |
|
|
14,685 |
|
|
|
135,336 |
|
|
|
150,021 |
|
|
|
(19,470 |
) |
|
2021 |
Grande Oaks |
|
Roswell, GA |
|
|
|
44,504 |
|
|
|
|
9,373 |
|
|
|
58,394 |
|
|
|
243 |
|
|
|
934 |
|
|
|
9,616 |
|
|
|
59,328 |
|
|
|
68,944 |
|
|
|
(7,635 |
) |
|
2021 |
Brandemere |
|
Salem, NC |
|
|
|
29,425 |
|
|
|
|
5,274 |
|
|
|
32,967 |
|
|
|
764 |
|
|
|
4,315 |
|
|
|
6,038 |
|
|
|
37,282 |
|
|
|
43,320 |
|
|
|
(5,641 |
) |
|
2021 |
Various Properties (2) |
|
Savannah, GA |
|
|
|
57,876 |
|
|
|
|
11,943 |
|
|
|
82,787 |
|
|
|
(1,529 |
) |
|
|
3,800 |
|
|
|
10,414 |
|
|
|
86,587 |
|
|
|
97,001 |
|
|
|
(11,194 |
) |
|
2021 |
Smoky Crossing Apartments |
|
Seymour, TN |
|
|
|
50,591 |
|
|
|
|
10,371 |
|
|
|
120,337 |
|
|
|
(68 |
) |
|
|
(44,553 |
) |
|
|
10,303 |
|
|
|
75,784 |
|
|
|
86,087 |
|
|
|
(10,419 |
) |
|
2021 |
Grove Veridian |
|
Spartanburg, NC |
|
|
|
12,074 |
|
|
|
|
2,555 |
|
|
|
15,966 |
|
|
|
363 |
|
|
|
1,847 |
|
|
|
2,918 |
|
|
|
17,813 |
|
|
|
20,731 |
|
|
|
(2,718 |
) |
|
2021 |
Patriot Point |
|
Spring Lake, NC |
|
|
|
18,886 |
|
|
|
|
3,238 |
|
|
|
20,253 |
|
|
|
275 |
|
|
|
2,626 |
|
|
|
3,513 |
|
|
|
22,879 |
|
|
|
26,392 |
|
|
|
(3,441 |
) |
|
2021 |
Retreat at Hidden Bay |
|
St. Marys, GA |
|
|
|
15,167 |
|
|
|
|
3,170 |
|
|
|
19,810 |
|
|
|
(295 |
) |
|
|
3,223 |
|
|
|
2,875 |
|
|
|
23,033 |
|
|
|
25,908 |
|
|
|
(3,146 |
) |
|
2021 |
Various Properties (11) |
|
Waldorf, MD |
|
|
|
259,942 |
|
|
|
|
57,581 |
|
|
|
359,089 |
|
|
|
37,208 |
|
|
|
22,343 |
|
|
|
94,789 |
|
|
|
381,432 |
|
|
|
476,221 |
|
|
|
(52,346 |
) |
|
2021 |
Various Properties (2) |
|
Warner Robins, GA |
|
|
|
38,916 |
|
|
|
|
8,171 |
|
|
|
51,003 |
|
|
|
2,705 |
|
|
|
4,828 |
|
|
|
10,876 |
|
|
|
55,831 |
|
|
|
66,707 |
|
|
|
(9,125 |
) |
|
2021 |
Various Properties (3) |
|
Wilmington, NC |
|
|
|
69,351 |
|
|
|
|
14,485 |
|
|
|
90,475 |
|
|
|
(85 |
) |
|
|
13,704 |
|
|
|
14,400 |
|
|
|
104,179 |
|
|
|
118,579 |
|
|
|
(13,044 |
) |
|
2021 |
|
|
|
|
|
|
|
|
|
|
|
|
|
|
|
|
|
|
|
|
|
|
|
|
|
|
|
|
|
|
|
|
|
|
|
|
|
|
|
|
|
|
|
|
|
|
|
|
|
|
|
|
Initial Cost |
|
|
Costs Capitalized
Subsequent
to Acquisition |
|
|
Gross Amounts at which
Carried at the Close of
Period(2) |
|
|
|
|
|
|
|
|
|
Description |
|
Location |
|
Encumbrances |
|
|
Land and
Land
Improvements |
|
Building and
Building
Improvements |
|
Land and
Land
Improvements |
|
Building and
Building
Improvements |
|
Land and
Land
Improvements |
|
Building and
Building
Improvements |
|
Total |
|
Accumulated
Depreciation(1) |
|
|
Year
Acquired |
National Affordable Housing Portfolio |
|
|
|
|
|
|
|
|
|
|
|
|
|
|
|
|
|
|
|
|
|
|
|
|
|
|
|
|
|
|
|
|
|
Various Properties (3) |
|
Austin, TX |
|
$ |
|
103,128 |
|
|
$ |
|
18,627 |
|
$ |
|
135,799 |
|
$ |
|
(2,036 |
) |
$ |
|
7,001 |
|
$ |
|
16,591 |
|
$ |
|
142,800 |
|
$ |
|
159,391 |
|
$ |
|
(16,690 |
) |
|
2021 |
Centre Court |
|
Bradenton, FL |
|
|
|
20,787 |
|
|
|
|
5,335 |
|
|
|
29,299 |
|
|
|
478 |
|
|
|
867 |
|
|
|
5,813 |
|
|
|
30,166 |
|
|
|
35,979 |
|
|
|
(4,903 |
) |
|
2021 |
Forest Glen |
|
Durham, NC |
|
|
|
13,345 |
|
|
|
|
2,975 |
|
|
|
10,821 |
|
|
|
1,073 |
|
|
|
(287 |
) |
|
|
4,048 |
|
|
|
10,534 |
|
|
|
14,582 |
|
|
|
(1,571 |
) |
|
2021 |
Rose Cove SLC |
|
Farmington, UT |
|
|
|
14,420 |
|
|
|
|
4,649 |
|
|
|
16,909 |
|
|
|
985 |
|
|
|
(16 |
) |
|
|
5,634 |
|
|
|
16,893 |
|
|
|
22,527 |
|
|
|
(2,102 |
) |
|
2021 |
Venice Cove FLL |
|
Ft Lauderdale, FL |
|
|
|
18,934 |
|
|
|
|
5,878 |
|
|
|
21,379 |
|
|
|
3,148 |
|
|
|
(2,533 |
) |
|
|
9,026 |
|
|
|
18,846 |
|
|
|
27,872 |
|
|
|
(2,484 |
) |
|
2021 |
Chelsea Commons |
|
Greenacres, FL |
|
|
|
30,349 |
|
|
|
|
12,348 |
|
|
|
44,910 |
|
|
|
(499 |
) |
|
|
1,823 |
|
|
|
11,849 |
|
|
|
46,733 |
|
|
|
58,582 |
|
|
|
(6,842 |
) |
|
2021 |
Hampton Ridge Jax |
|
Jacksonville, FL |
|
|
|
11,104 |
|
|
|
|
2,476 |
|
|
|
9,005 |
|
|
|
90 |
|
|
|
2,904 |
|
|
|
2,566 |
|
|
|
11,909 |
|
|
|
14,475 |
|
|
|
(1,708 |
) |
|
2021 |
San Marcos Villas |
|
Lake Park, FL |
|
|
|
50,042 |
|
|
|
|
18,054 |
|
|
|
65,663 |
|
|
|
(4,002 |
) |
|
|
6,220 |
|
|
|
14,052 |
|
|
|
71,883 |
|
|
|
85,935 |
|
|
|
(9,296 |
) |
|
2021 |
Mayflower Harbor |
|
Lehi, UT |
|
|
|
30,820 |
|
|
|
|
9,050 |
|
|
|
32,915 |
|
|
|
(526 |
) |
|
|
2,012 |
|
|
|
8,524 |
|
|
|
34,927 |
|
|
|
43,451 |
|
|
|
(4,359 |
) |
|
2021 |
Grande Court Sarasota |
|
North Port, FL |
|
|
|
16,087 |
|
|
|
|
5,010 |
|
|
|
18,221 |
|
|
|
991 |
|
|
|
(247 |
) |
|
|
6,001 |
|
|
|
17,974 |
|
|
|
23,975 |
|
|
|
(3,275 |
) |
|
2021 |
Commander Place |
|
Orlando, FL |
|
|
|
28,586 |
|
|
|
|
5,713 |
|
|
|
31,374 |
|
|
|
(1,072 |
) |
|
|
2,578 |
|
|
|
4,641 |
|
|
|
33,952 |
|
|
|
38,593 |
|
|
|
(4,018 |
) |
|
2021 |
Villas Shaver |
|
Pasadena, TX |
|
|
|
25,594 |
|
|
|
|
3,182 |
|
|
|
23,197 |
|
|
|
3,292 |
|
|
|
(2,742 |
) |
|
|
6,474 |
|
|
|
20,455 |
|
|
|
26,929 |
|
|
|
(3,611 |
) |
|
2021 |
Pemberly Palms |
|
Vero Beach, FL |
|
|
|
21,563 |
|
|
|
|
4,645 |
|
|
|
25,507 |
|
|
|
1,142 |
|
|
|
248 |
|
|
|
5,787 |
|
|
|
25,755 |
|
|
|
31,542 |
|
|
|
(3,888 |
) |
|
2021 |
Pasco Woods |
|
Wesley Chapel, FL |
|
|
|
21,146 |
|
|
|
|
4,511 |
|
|
|
24,772 |
|
|
|
53 |
|
|
|
728 |
|
|
|
4,564 |
|
|
|
25,500 |
|
|
|
30,064 |
|
|
|
(3,734 |
) |
|
2021 |
Colony Park |
|
West Palm Beach, FL |
|
|
|
21,214 |
|
|
|
|
6,626 |
|
|
|
24,101 |
|
|
|
862 |
|
|
|
216 |
|
|
|
7,488 |
|
|
|
24,317 |
|
|
|
31,805 |
|
|
|
(3,830 |
) |
|
2021 |
Central Park Portfolio (9 properties) |
|
Denver, CO |
|
|
|
329,898 |
|
|
|
|
74,722 |
|
|
|
532,982 |
|
|
|
1,466 |
|
|
|
7,588 |
|
|
|
76,188 |
|
|
|
540,570 |
|
|
|
616,758 |
|
|
|
(52,562 |
) |
|
2021 |
Mid-Atlantic Affordable Housing Portfolio II |
|
|
|
|
|
|
|
|
|
|
|
|
|
|
|
|
|
|
|
|
|
|
|
|
|
|
|
|
|
|
|
|
|
Lakewood Villas ATL |
|
Atlanta, GA |
|
|
|
19,937 |
|
|
|
|
5,659 |
|
|
|
19,470 |
|
|
|
227 |
|
|
|
647 |
|
|
|
5,886 |
|
|
|
20,117 |
|
|
|
26,003 |
|
|
|
(3,014 |
) |
|
2022 |
Ivy Creek Buford |
|
Buford, GS |
|
|
|
30,731 |
|
|
|
|
6,784 |
|
|
|
36,309 |
|
|
|
524 |
|
|
|
647 |
|
|
|
7,308 |
|
|
|
36,956 |
|
|
|
44,264 |
|
|
|
(4,315 |
) |
|
2022 |
Various Properties (2) |
|
Fredericksburg, VA |
|
|
|
67,101 |
|
|
|
|
18,748 |
|
|
|
86,640 |
|
|
|
379 |
|
|
|
1,309 |
|
|
|
19,127 |
|
|
|
87,949 |
|
|
|
107,076 |
|
|
|
(8,983 |
) |
|
2022 |
Cobblestone Kennesaw |
|
Kennesaw, GA |
|
|
|
19,311 |
|
|
|
|
6,818 |
|
|
|
20,700 |
|
|
|
216 |
|
|
|
392 |
|
|
|
7,034 |
|
|
|
21,092 |
|
|
|
28,126 |
|
|
|
(2,834 |
) |
|
2022 |
Galaxy Silver Spring |
|
Silver Springs, MD |
|
|
|
36,418 |
|
|
|
|
9,832 |
|
|
|
54,956 |
|
|
|
323 |
|
|
|
783 |
|
|
|
10,155 |
|
|
|
55,739 |
|
|
|
65,894 |
|
|
|
(4,398 |
) |
|
2022 |
Sky Terrace |
|
Stafford, VA |
|
|
|
37,257 |
|
|
|
|
7,836 |
|
|
|
52,382 |
|
|
|
231 |
|
|
|
621 |
|
|
|
8,067 |
|
|
|
53,003 |
|
|
|
61,070 |
|
|
|
(5,197 |
) |
|
2022 |
Highland Warranton |
|
Warranton, VA |
|
|
|
18,211 |
|
|
|
|
6,136 |
|
|
|
17,652 |
|
|
|
378 |
|
|
|
256 |
|
|
|
6,514 |
|
|
|
17,908 |
|
|
|
24,422 |
|
|
|
(2,141 |
) |
|
2022 |
Texas and North Carolina Multifamily Portfolio |
|
|
|
|
|
|
|
|
|
|
|
|
|
|
|
|
|
|
|
|
|
|
|
|
|
|
|
|
|
|
|
|
|
Watervue |
|
Fort Worth, TX |
|
|
|
69,831 |
|
|
|
|
12,114 |
|
|
|
81,045 |
|
|
|
327 |
|
|
|
490 |
|
|
|
12,441 |
|
|
|
81,535 |
|
|
|
93,976 |
|
|
|
(9,171 |
) |
|
2022 |
Bunker Hill |
|
Houston, TX |
|
|
|
64,451 |
|
|
|
|
5,855 |
|
|
|
79,938 |
|
|
|
134 |
|
|
|
502 |
|
|
|
5,989 |
|
|
|
80,440 |
|
|
|
86,429 |
|
|
|
(7,057 |
) |
|
2022 |
Regalia |
|
Mansfield, TX |
|
|
|
57,707 |
|
|
|
|
8,595 |
|
|
|
68,599 |
|
|
|
195 |
|
|
|
419 |
|
|
|
8,790 |
|
|
|
69,018 |
|
|
|
77,808 |
|
|
|
(7,174 |
) |
|
2022 |
Litchford |
|
Raleigh, NC |
|
|
|
53,535 |
|
|
|
|
11,588 |
|
|
|
70,431 |
|
|
|
99 |
|
|
|
339 |
|
|
|
11,687 |
|
|
|
70,770 |
|
|
|
82,457 |
|
|
|
(6,730 |
) |
|
2022 |
Whispering Creek |
|
San Antonio, TX |
|
|
|
35,229 |
|
|
|
|
5,025 |
|
|
|
42,064 |
|
|
|
333 |
|
|
|
468 |
|
|
|
5,358 |
|
|
|
42,532 |
|
|
|
47,890 |
|
|
|
(4,426 |
) |
|
2022 |
Phoenix Affordable Housing Portfolio |
|
|
|
|
|
|
|
|
|
|
|
|
|
|
|
|
|
|
|
|
|
|
|
|
|
|
|
|
|
|
|
|
|
Desert Eagle |
|
Glendale, AZ |
|
|
|
28,171 |
|
|
|
|
8,420 |
|
|
|
37,708 |
|
|
|
255 |
|
|
|
1,220 |
|
|
|
8,675 |
|
|
|
38,928 |
|
|
|
47,603 |
|
|
|
(4,118 |
) |
|
2022 |
Various Properties (3) |
|
Mesa, AZ |
|
|
|
101,114 |
|
|
|
|
25,347 |
|
|
|
142,096 |
|
|
|
855 |
|
|
|
3,828 |
|
|
|
26,202 |
|
|
|
145,924 |
|
|
|
172,126 |
|
|
|
(14,889 |
) |
|
2022 |
Lake Pleasant Village |
|
Peoria, AZ |
|
|
|
23,579 |
|
|
|
|
7,346 |
|
|
|
31,972 |
|
|
|
316 |
|
|
|
610 |
|
|
|
7,662 |
|
|
|
32,582 |
|
|
|
40,244 |
|
|
|
(3,545 |
) |
|
2022 |
Various Properties (2) |
|
Phoenix, AZ |
|
|
|
59,683 |
|
|
|
|
13,992 |
|
|
|
73,080 |
|
|
|
682 |
|
|
|
1,935 |
|
|
|
14,674 |
|
|
|
75,015 |
|
|
|
89,689 |
|
|
|
(6,960 |
) |
|
2022 |
Summit Multifamily Portfolio |
|
|
|
|
|
|
|
|
|
|
|
|
|
|
|
|
|
|
|
|
|
|
|
|
|
|
|
|
|
|
|
|
|
Vintage Amelia |
|
Amelia Island, FL |
|
|
|
37,759 |
|
|
|
|
8,015 |
|
|
|
57,141 |
|
|
|
252 |
|
|
|
(2,887 |
) |
|
|
8,267 |
|
|
|
54,254 |
|
|
|
62,521 |
|
|
|
(6,347 |
) |
|
2022 |
Vantage Ashland |
|
Ashland City, TN |
|
|
|
33,279 |
|
|
|
|
5,712 |
|
|
|
56,903 |
|
|
|
196 |
|
|
|
555 |
|
|
|
5,908 |
|
|
|
57,458 |
|
|
|
63,366 |
|
|
|
(5,880 |
) |
|
2022 |
Ethos Austin |
|
Austin, TX |
|
|
|
46,823 |
|
|
|
|
11,085 |
|
|
|
72,024 |
|
|
|
340 |
|
|
|
2,141 |
|
|
|
11,425 |
|
|
|
74,165 |
|
|
|
85,590 |
|
|
|
(7,681 |
) |
|
2022 |
Walnut Bastrop |
|
Bastrop, TX |
|
|
|
27,479 |
|
|
|
|
5,643 |
|
|
|
44,116 |
|
|
|
258 |
|
|
|
604 |
|
|
|
5,901 |
|
|
|
44,720 |
|
|
|
50,621 |
|
|
|
(4,534 |
) |
|
2022 |
Various Properties (2) |
|
Burleson, TX |
|
|
|
81,272 |
|
|
|
|
12,479 |
|
|
|
139,515 |
|
|
|
205 |
|
|
|
664 |
|
|
|
12,684 |
|
|
|
140,179 |
|
|
|
152,863 |
|
|
|
(12,959 |
) |
|
2022 |
Ethan Pointe |
|
Burlington, NC |
|
|
|
38,879 |
|
|
|
|
5,884 |
|
|
|
61,163 |
|
|
|
273 |
|
|
|
449 |
|
|
|
6,157 |
|
|
|
61,612 |
|
|
|
67,769 |
|
|
|
(6,400 |
) |
|
2022 |
Stonebriar Frisco |
|
Frisco, TX |
|
|
|
63,679 |
|
|
|
|
8,210 |
|
|
|
107,353 |
|
|
|
492 |
|
|
|
457 |
|
|
|
8,702 |
|
|
|
107,810 |
|
|
|
116,512 |
|
|
|
(9,052 |
) |
|
2022 |
Darby Holly Springs |
|
Holly Springs, GA |
|
|
|
50,693 |
|
|
|
|
11,933 |
|
|
|
82,863 |
|
|
|
199 |
|
|
|
284 |
|
|
|
12,132 |
|
|
|
83,147 |
|
|
|
95,279 |
|
|
|
(8,157 |
) |
|
2022 |
Various Properties (2) |
|
Indianapolis, IN |
|
|
|
80,786 |
|
|
|
|
10,047 |
|
|
|
135,908 |
|
|
|
753 |
|
|
|
2,316 |
|
|
|
10,800 |
|
|
|
138,224 |
|
|
|
149,024 |
|
|
|
(12,924 |
) |
|
2022 |
Orchard Hills |
|
Jeffersonville, IN |
|
|
|
36,393 |
|
|
|
|
5,720 |
|
|
|
52,149 |
|
|
|
167 |
|
|
|
1,396 |
|
|
|
5,887 |
|
|
|
53,545 |
|
|
|
59,432 |
|
|
|
(5,674 |
) |
|
2022 |
Various Properties (2) |
|
Knoxville, TN |
|
|
|
89,686 |
|
|
|
|
8,278 |
|
|
|
145,987 |
|
|
|
563 |
|
|
|
971 |
|
|
|
8,841 |
|
|
|
146,958 |
|
|
|
155,799 |
|
|
|
(12,530 |
) |
|
2022 |
Woodland Lakes Lansing |
|
Lansing, MI |
|
|
|
43,093 |
|
|
|
|
8,179 |
|
|
|
61,911 |
|
|
|
301 |
|
|
|
1,512 |
|
|
|
8,480 |
|
|
|
63,423 |
|
|
|
71,903 |
|
|
|
(8,022 |
) |
|
2022 |
|
|
|
|
|
|
|
|
|
|
|
|
|
|
|
|
|
|
|
|
|
|
|
|
|
|
|
|
|
|
|
|
|
|
|
|
|
|
|
|
|
|
|
|
|
|
|
|
|
|
|
|
Initial Cost |
|
|
Costs Capitalized
Subsequent
to Acquisition |
|
|
Gross Amounts at which
Carried at the Close of
Period(2) |
|
|
|
|
|
|
|
|
|
Description |
|
Location |
|
Encumbrances |
|
|
Land and
Land
Improvements |
|
Building and
Building
Improvements |
|
Land and
Land
Improvements |
|
Building and
Building
Improvements |
|
Land and
Land
Improvements |
|
Building and
Building
Improvements |
|
Total |
|
Accumulated
Depreciation(1) |
|
|
Year
Acquired |
Various Properties (4) |
|
Louisville, KY |
|
$ |
|
121,345 |
|
|
$ |
|
17,123 |
|
$ |
|
178,426 |
|
$ |
|
722 |
|
$ |
|
(2,134 |
) |
$ |
|
17,845 |
|
$ |
|
176,292 |
|
$ |
|
194,137 |
|
$ |
|
(17,560 |
) |
|
2022 |
Lakeside Marietta |
|
Marietta, GA |
|
|
|
70,893 |
|
|
|
|
14,659 |
|
|
|
124,095 |
|
|
|
339 |
|
|
|
1,141 |
|
|
|
14,998 |
|
|
|
125,236 |
|
|
|
140,234 |
|
|
|
(11,596 |
) |
|
2022 |
Reserve Maryville |
|
Maryville, TN |
|
|
|
29,093 |
|
|
|
|
6,455 |
|
|
|
37,771 |
|
|
|
181 |
|
|
|
2,529 |
|
|
|
6,636 |
|
|
|
40,300 |
|
|
|
46,936 |
|
|
|
(4,712 |
) |
|
2022 |
Vintage Juliet |
|
Mt. Juliet, TN |
|
|
|
54,311 |
|
|
|
|
4,981 |
|
|
|
84,725 |
|
|
|
97 |
|
|
|
331 |
|
|
|
5,078 |
|
|
|
85,056 |
|
|
|
90,134 |
|
|
|
(7,003 |
) |
|
2022 |
Various Properties (2) |
|
Murfreesboro, TN |
|
|
|
82,058 |
|
|
|
|
9,480 |
|
|
|
138,701 |
|
|
|
221 |
|
|
|
814 |
|
|
|
9,701 |
|
|
|
139,515 |
|
|
|
149,216 |
|
|
|
(12,463 |
) |
|
2022 |
Hickory Point Nashville |
|
Nashville, TN |
|
|
|
49,479 |
|
|
|
|
7,534 |
|
|
|
81,694 |
|
|
|
402 |
|
|
|
571 |
|
|
|
7,936 |
|
|
|
82,265 |
|
|
|
90,201 |
|
|
|
(8,133 |
) |
|
2022 |
Emerson Pflugerville |
|
Pflugerville, TX |
|
|
|
53,679 |
|
|
|
|
11,087 |
|
|
|
83,771 |
|
|
|
242 |
|
|
|
693 |
|
|
|
11,329 |
|
|
|
84,464 |
|
|
|
95,793 |
|
|
|
(8,657 |
) |
|
2022 |
Prinwood Place |
|
Portage, MI |
|
|
|
12,993 |
|
|
|
|
1,672 |
|
|
|
19,257 |
|
|
|
93 |
|
|
|
507 |
|
|
|
1,765 |
|
|
|
19,764 |
|
|
|
21,529 |
|
|
|
(2,114 |
) |
|
2022 |
Foxwood Raleigh |
|
Raleigh, NC |
|
|
|
94,380 |
|
|
|
|
20,149 |
|
|
|
142,196 |
|
|
|
182 |
|
|
|
1,021 |
|
|
|
20,331 |
|
|
|
143,217 |
|
|
|
163,548 |
|
|
|
(14,054 |
) |
|
2022 |
Sugar Flats SLC |
|
Salt Lake City, UT |
|
|
|
32,148 |
|
|
|
|
6,265 |
|
|
|
51,531 |
|
|
|
143 |
|
|
|
787 |
|
|
|
6,408 |
|
|
|
52,318 |
|
|
|
58,726 |
|
|
|
(4,082 |
) |
|
2022 |
Ranch 123 Apartments |
|
Seguin, TX |
|
|
|
20,993 |
|
|
|
|
4,347 |
|
|
|
43,170 |
|
|
|
158 |
|
|
|
222 |
|
|
|
4,505 |
|
|
|
43,392 |
|
|
|
47,897 |
|
|
|
(4,299 |
) |
|
2022 |
Vintage Tollgate |
|
Thompson’s Station, TN |
|
|
|
41,879 |
|
|
|
|
4,392 |
|
|
|
70,715 |
|
|
|
151 |
|
|
|
421 |
|
|
|
4,543 |
|
|
|
71,136 |
|
|
|
75,679 |
|
|
|
(6,262 |
) |
|
2022 |
Reserve Tuscaloosa |
|
Tuscaloosa, AL |
|
|
|
31,393 |
|
|
|
|
5,878 |
|
|
|
47,916 |
|
|
|
367 |
|
|
|
921 |
|
|
|
6,245 |
|
|
|
48,837 |
|
|
|
55,082 |
|
|
|
(4,984 |
) |
|
2022 |
Stonebrook Tyler |
|
Tyler, TX |
|
|
|
27,393 |
|
|
|
|
5,048 |
|
|
|
47,359 |
|
|
|
209 |
|
|
|
435 |
|
|
|
5,257 |
|
|
|
47,794 |
|
|
|
53,051 |
|
|
|
(4,701 |
) |
|
2022 |
Blue Multifamily Portfolio |
|
|
|
|
|
|
|
|
|
|
|
|
|
|
|
|
|
|
|
|
|
|
|
|
|
|
|
|
|
|
|
|
|
Grand Dominion |
|
San Antonio, TX |
|
|
|
37,958 |
|
|
|
|
8,110 |
|
|
|
61,274 |
|
|
|
422 |
|
|
|
497 |
|
|
|
8,532 |
|
|
|
61,771 |
|
|
|
70,303 |
|
|
|
(6,009 |
) |
|
2022 |
Florida Affordable Housing Portfolio IV |
|
|
|
|
|
|
|
|
|
|
|
|
|
|
|
|
|
|
|
|
|
|
|
|
|
|
|
|
|
|
|
|
|
Sonrise Villas |
|
Fellsmere, FL |
|
|
|
23,301 |
|
|
|
|
5,733 |
|
|
|
24,605 |
|
|
|
56 |
|
|
|
325 |
|
|
|
5,789 |
|
|
|
24,930 |
|
|
|
30,719 |
|
|
|
(3,160 |
) |
|
2022 |
Various Properties (2) |
|
Lakeland, FL |
|
|
|
19,778 |
|
|
|
|
6,864 |
|
|
|
21,559 |
|
|
|
135 |
|
|
|
429 |
|
|
|
6,999 |
|
|
|
21,988 |
|
|
|
28,987 |
|
|
|
(2,245 |
) |
|
2022 |
Overlook at Monroe |
|
Sanford, FL |
|
|
|
21,146 |
|
|
|
|
4,502 |
|
|
|
25,665 |
|
|
|
118 |
|
|
|
1,236 |
|
|
|
4,620 |
|
|
|
26,901 |
|
|
|
31,521 |
|
|
|
(2,933 |
) |
|
2022 |
Raintree Apartments |
|
Clermont, FL |
|
|
|
42,249 |
|
|
|
|
6,481 |
|
|
|
54,591 |
|
|
|
106 |
|
|
|
706 |
|
|
|
6,587 |
|
|
|
55,297 |
|
|
|
61,884 |
|
|
|
(4,275 |
) |
|
2022 |
Madison Cove |
|
Gainesville, FL |
|
|
|
9,080 |
|
|
|
|
2,409 |
|
|
|
8,111 |
|
|
|
20 |
|
|
|
267 |
|
|
|
2,429 |
|
|
|
8,378 |
|
|
|
10,807 |
|
|
|
(942 |
) |
|
2022 |
Various Properties (2) |
|
Kissimmee, FL |
|
|
|
92,897 |
|
|
|
|
16,861 |
|
|
|
110,587 |
|
|
|
(527 |
) |
|
|
934 |
|
|
|
16,334 |
|
|
|
111,521 |
|
|
|
127,855 |
|
|
|
(9,277 |
) |
|
2022 |
Mystic Pointe II |
|
Orlando, FL |
|
|
|
39,717 |
|
|
|
|
5,221 |
|
|
|
52,249 |
|
|
|
34 |
|
|
|
231 |
|
|
|
5,255 |
|
|
|
52,480 |
|
|
|
57,735 |
|
|
|
(3,861 |
) |
|
2022 |
|
|
|
|
|
|
|
|
|
|
|
|
|
|
|
|
|
|
|
|
|
|
|
|
|
|
|
|
|
|
|
|
|
|
Total Multifamily Properties |
|
|
|
$ |
|
9,075,399 |
|
|
$ |
|
1,946,385 |
|
$ |
|
12,325,962 |
|
$ |
|
55,322 |
|
$ |
|
164,495 |
|
$ |
|
2,001,707 |
|
$ |
|
12,490,457 |
|
$ |
|
14,492,164 |
|
$ |
|
(1,467,446 |
) |
|
|
|
|
|
|
|
|
|
|
|
|
|
|
|
|
|
|
|
|
|
|
|
|
|
|
|
|
|
|
|
|
|
|
|
|
|
|
|
|
|
|
|
|
|
|
|
|
|
|
|
|
|
|
Initial Cost |
|
|
Costs Capitalized
Subsequent
to Acquisition |
|
|
Gross Amounts at which
Carried at the Close of
Period(2) |
|
|
|
|
|
|
|
|
|
Description |
|
Location |
|
Encumbrances |
|
|
Land and
Land
Improvements |
|
Building and
Building
Improvements |
|
Land and
Land
Improvements |
|
Building and
Building
Improvements |
|
Land and
Land
Improvements |
|
Building and
Building
Improvements |
|
Total |
|
Accumulated
Depreciation(1) |
|
|
Year
Acquired |
Industrial Properties: |
|
|
|
|
|
|
|
|
|
|
|
|
|
|
|
|
|
|
|
|
|
|
|
|
|
|
|
|
|
|
|
|
|
Marshfield Industrial Portfolio (4 properties) |
|
Baltimore, MD |
|
$ |
|
106,698 |
|
|
$ |
|
21,720 |
|
$ |
|
139,433 |
|
$ |
|
188 |
|
$ |
|
122 |
|
$ |
|
21,908 |
|
$ |
|
139,555 |
|
$ |
|
161,463 |
|
$ |
|
(18,109 |
) |
|
2020 |
Airport Logistics Park (6 properties) |
|
Nashville, TN |
|
|
|
35,000 |
|
|
|
|
7,031 |
|
|
|
53,728 |
|
|
|
1 |
|
|
|
96 |
|
|
|
7,032 |
|
|
|
53,824 |
|
|
|
60,856 |
|
|
|
(7,431 |
) |
|
2020 |
Denver/Boulder Industrial Portfolio (16 properties) |
|
Louisville, CO |
|
|
|
268,064 |
|
|
|
|
67,951 |
|
|
|
311,651 |
|
|
|
207 |
|
|
|
521 |
|
|
|
68,158 |
|
|
|
312,172 |
|
|
|
380,330 |
|
|
|
(36,242 |
) |
|
2021 |
Reno Logistics Portfolio (18 properties) |
|
Sparks, NV |
|
|
|
262,740 |
|
|
|
|
60,235 |
|
|
|
316,742 |
|
|
|
164 |
|
|
|
1,540 |
|
|
|
60,399 |
|
|
|
318,282 |
|
|
|
378,681 |
|
|
|
(40,050 |
) |
|
2021 |
Southwest Light Industrial Portfolio |
|
|
|
|
|
|
|
|
|
|
|
|
|
|
|
|
|
|
|
|
|
|
|
|
|
|
|
|
|
|
|
|
|
Various Properties (4) |
|
Las Vegas, NV |
|
|
|
58,142 |
|
|
|
|
23,537 |
|
|
|
54,203 |
|
|
|
56 |
|
|
|
89 |
|
|
|
23,593 |
|
|
|
54,292 |
|
|
|
77,885 |
|
|
|
(6,261 |
) |
|
2021 |
Various Properties (11) |
|
Phoenix, AZ |
|
|
|
283,042 |
|
|
|
|
66,229 |
|
|
|
333,663 |
|
|
|
287 |
|
|
|
249 |
|
|
|
66,516 |
|
|
|
333,912 |
|
|
|
400,428 |
|
|
|
(32,685 |
) |
|
2021 |
American Industrial Center (25 properties) |
|
Longwood, FL |
|
|
|
83,700 |
|
|
|
|
47,553 |
|
|
|
90,772 |
|
|
|
(1,613 |
) |
|
|
(2,617 |
) |
|
|
45,940 |
|
|
|
88,155 |
|
|
|
134,095 |
|
|
|
(9,956 |
) |
|
2022 |
Middlebrook Crossroads (18 properties) |
|
Bridgewood, NJ |
|
|
|
66,566 |
|
|
|
|
49,370 |
|
|
|
62,650 |
|
|
|
686 |
|
|
|
641 |
|
|
|
50,056 |
|
|
|
63,291 |
|
|
|
113,347 |
|
|
|
(6,598 |
) |
|
2022 |
Northern Italy Industrial Portfolio (4 properties) |
|
Various Provinces, Italy |
|
|
|
40,488 |
|
|
|
|
14,509 |
|
|
|
65,804 |
|
|
|
(677 |
) |
|
|
(6,425 |
) |
|
|
13,832 |
|
|
|
59,379 |
|
|
|
73,211 |
|
|
|
(5,886 |
) |
|
2021 |
Norway Logistics Portfolio (2 properties) |
|
Oslo, Norway |
|
|
|
45,785 |
|
|
|
|
31,971 |
|
|
|
63,541 |
|
|
|
(5,466 |
) |
|
|
(9,430 |
) |
|
|
26,505 |
|
|
|
54,111 |
|
|
|
80,616 |
|
|
|
(3,883 |
) |
|
2022 |
Verona Oppeano (5 properties) |
|
Oppeano VR, Italy |
|
|
|
145,385 |
|
|
|
|
47,225 |
|
|
|
243,541 |
|
|
|
(1,396 |
) |
|
|
(7,214 |
) |
|
|
45,829 |
|
|
|
236,327 |
|
|
|
282,156 |
|
|
|
(15,682 |
) |
|
2022 |
Denmark Logistics Portfolio (10 properties) |
|
Denmark |
|
|
|
93,868 |
|
|
|
|
42,311 |
|
|
|
166,314 |
|
|
|
2,328 |
|
|
|
9,195 |
|
|
|
44,639 |
|
|
|
175,509 |
|
|
|
220,148 |
|
|
|
(13,451 |
) |
|
2022 |
Belgioioso Logistics |
|
Greater Milan, Italy |
|
|
|
56,366 |
|
|
|
|
18,857 |
|
|
|
72,460 |
|
|
|
1,723 |
|
|
|
6,717 |
|
|
|
20,580 |
|
|
|
79,177 |
|
|
|
99,757 |
|
|
|
(5,057 |
) |
|
2022 |
|
|
|
|
|
|
|
|
|
|
|
|
|
|
|
|
|
|
|
|
|
|
|
|
|
|
|
|
|
|
|
|
|
|
Total Industrial Properties |
|
|
|
$ |
|
1,545,844 |
|
|
$ |
|
498,499 |
|
$ |
|
1,974,502 |
|
$ |
|
(3,512 |
) |
$ |
|
(6,516 |
) |
$ |
|
494,987 |
|
$ |
|
1,967,986 |
|
$ |
|
2,462,973 |
|
$ |
|
(201,291 |
) |
|
|
|
|
|
|
|
|
|
|
|
|
|
|
|
|
|
|
|
|
|
|
|
|
|
|
|
|
|
|
|
|
|
|
|
|
Office Properties: |
|
|
|
|
|
|
|
|
|
|
|
|
|
|
|
|
|
|
|
|
|
|
|
|
|
|
|
|
|
|
|
|
|
Florida Office Portfolio (11 properties) |
|
Jacksonville, FL |
|
$ |
|
121,010 |
|
|
$ |
|
53,465 |
|
$ |
|
153,163 |
|
$ |
|
4 |
|
$ |
|
18,198 |
|
$ |
|
53,469 |
|
$ |
|
171,361 |
|
$ |
|
224,830 |
|
$ |
|
(38,816 |
) |
|
2019 |
Columbus Office Portfolio |
|
Columbus, OH |
|
|
|
53,024 |
|
|
|
|
3,013 |
|
|
|
50,064 |
|
|
|
118 |
|
|
|
3,099 |
|
|
|
3,131 |
|
|
|
53,163 |
|
|
|
56,294 |
|
|
|
(12,085 |
) |
|
2019 |
60 State Street |
|
Boston, MA |
|
|
|
418,073 |
|
|
|
|
- |
|
|
|
478,150 |
|
|
|
472 |
|
|
|
25,203 |
|
|
|
472 |
|
|
|
503,353 |
|
|
|
503,825 |
|
|
|
(74,230 |
) |
|
2020 |
Nashville Office |
|
Nashville, TN |
|
|
|
164,152 |
|
|
|
|
21,647 |
|
|
|
229,183 |
|
|
|
- |
|
|
|
899 |
|
|
|
21,647 |
|
|
|
230,082 |
|
|
|
251,729 |
|
|
|
(33,986 |
) |
|
2020 |
Stonebridge (3 properties) |
|
Alpharetta, GA |
|
|
|
64,500 |
|
|
|
|
15,205 |
|
|
|
101,624 |
|
|
|
- |
|
|
|
4,351 |
|
|
|
15,205 |
|
|
|
105,975 |
|
|
|
121,180 |
|
|
|
(17,071 |
) |
|
2021 |
M Campus (2 properties) |
|
Meudon, France |
|
|
|
115,792 |
|
|
|
|
40,964 |
|
|
|
184,078 |
|
|
|
(1,996 |
) |
|
|
(19,082 |
) |
|
|
38,968 |
|
|
|
164,996 |
|
|
|
203,964 |
|
|
|
(12,585 |
) |
|
2021 |
Barcelona Mediacomplex |
|
Barcelona, Spain |
|
|
|
65,237 |
|
|
|
|
29,780 |
|
|
|
120,082 |
|
|
|
(658 |
) |
|
|
(1 |
) |
|
|
29,122 |
|
|
|
120,081 |
|
|
|
149,203 |
|
|
|
(7,628 |
) |
|
2022 |
|
|
|
|
|
|
|
|
|
|
|
|
|
|
|
|
|
|
|
|
|
|
|
|
|
|
|
|
|
|
|
|
|
|
Total Office Properties |
|
|
|
$ |
|
1,001,788 |
|
|
$ |
|
164,074 |
|
$ |
|
1,316,344 |
|
$ |
|
(2,060 |
) |
$ |
|
32,667 |
|
$ |
|
162,014 |
|
$ |
|
1,349,011 |
|
$ |
|
1,511,025 |
|
$ |
|
(196,401 |
) |
|
|
|
|
|
|
|
|
|
|
|
|
|
|
|
|
|
|
|
|
|
|
|
|
|
|
|
|
|
|
|
|
|
|
|
|
|
|
|
|
|
|
|
|
|
|
|
|
|
|
|
|
|
|
|
|
|
|
|
|
|
|
|
|
|
|
|
|
|
|
|
|
|
|
|
|
|
|
|
|
|
|
|
|
|
|
|
|
|
|
|
|
|
|
|
|
|
|
|
|
|
|
|
|
|
|
|
|
|
|
|
|
|
|
|
|
|
|
|
|
|
|
Initial Cost |
|
|
Costs Capitalized
Subsequent
to Acquisition |
|
|
Gross Amounts at which
Carried at the Close of
Period(2) |
|
|
|
|
|
|
|
|
|
Description |
|
Location |
|
Encumbrances |
|
|
Land and
Land
Improvements |
|
Building and
Building
Improvements |
|
Land and
Land
Improvements |
|
Building and
Building
Improvements |
|
Land and
Land
Improvements |
|
Building and
Building
Improvements |
|
Total |
|
Accumulated
Depreciation(1) |
|
|
Year
Acquired |
Other Properties: |
|
|
|
|
|
|
|
|
|
|
|
|
|
|
|
|
|
|
|
|
|
|
|
|
|
|
|
|
|
|
|
|
|
U.S. Select Service Portfolio |
|
|
|
|
|
|
|
|
|
|
|
|
|
|
|
|
|
|
|
|
|
|
|
|
|
|
|
|
|
|
|
|
|
Hyatt Place Boulder |
|
Boulder, CO |
|
$ |
|
23,833 |
|
|
$ |
|
13,890 |
|
$ |
|
33,673 |
|
$ |
|
6 |
|
$ |
|
2,320 |
|
$ |
|
13,896 |
|
$ |
|
35,993 |
|
$ |
|
49,889 |
|
$ |
|
(5,615 |
) |
|
2019 |
Residence Inn Cleveland |
|
Cleveland, OH |
|
|
|
11,615 |
|
|
|
|
2,867 |
|
|
|
19,944 |
|
|
|
344 |
|
|
|
2,938 |
|
|
|
3,211 |
|
|
|
22,882 |
|
|
|
26,093 |
|
|
|
(3,536 |
) |
|
2019 |
Exchange on Erwin - Commercial (2 properties) |
|
Durham, NC |
|
|
|
24,908 |
|
|
|
|
13,492 |
|
|
|
20,157 |
|
|
|
1 |
|
|
|
347 |
|
|
|
13,493 |
|
|
|
20,504 |
|
|
|
33,997 |
|
|
|
(4,061 |
) |
|
2019 |
Barlow |
|
Chevy Chase, MD |
|
|
|
108,160 |
|
|
|
|
31,902 |
|
|
|
112,291 |
|
|
|
208 |
|
|
|
5,355 |
|
|
|
32,110 |
|
|
|
117,646 |
|
|
|
149,756 |
|
|
|
(17,159 |
) |
|
2020 |
Marketplace at the Outlets |
|
West Palm Beach, FL |
|
|
|
79,000 |
|
|
|
|
41,833 |
|
|
|
83,890 |
|
|
|
6 |
|
|
|
795 |
|
|
|
41,839 |
|
|
|
84,685 |
|
|
|
126,524 |
|
|
|
(12,852 |
) |
|
2021 |
Amherst Single Family Residential Portfolio |
|
Various |
|
$ |
|
239,756 |
|
|
$ |
|
126,917 |
|
$ |
|
202,836 |
|
$ |
|
3,095 |
|
$ |
|
17,460 |
|
$ |
|
130,012 |
|
$ |
|
220,296 |
|
$ |
|
350,308 |
|
$ |
|
(27,382 |
) |
|
2021 - 2022 |
Sunbelt Single-Family Rental Portfolio |
|
Various |
|
|
|
— |
|
|
|
|
2,379 |
|
|
|
6,794 |
|
|
|
— |
|
|
|
424 |
|
|
|
2,379 |
|
|
|
7,218 |
|
|
|
9,597 |
|
|
|
(1,020 |
) |
|
2021 |
Morningstar Self-Storage Joint Venture |
|
|
|
|
|
|
|
|
|
|
|
|
|
|
|
|
|
|
|
|
|
|
|
|
|
|
|
|
|
|
|
|
|
Alabaster |
|
Alabaster, AL |
|
$ |
|
14,861 |
|
|
$ |
|
2,313 |
|
$ |
|
15,843 |
|
$ |
|
(1,209 |
) |
$ |
|
1,253 |
|
$ |
|
1,104 |
|
$ |
|
17,096 |
|
$ |
|
18,200 |
|
$ |
|
(1,338 |
) |
|
2021 |
OKC Bethany |
|
Bethany, OK |
|
|
|
4,160 |
|
|
|
|
1,688 |
|
|
|
5,486 |
|
|
|
1,849 |
|
|
|
(1,209 |
) |
|
|
3,537 |
|
|
|
4,277 |
|
|
|
7,814 |
|
|
|
(464 |
) |
|
2021 |
Mountain Brook |
|
Birmingham, AL |
|
|
|
15,056 |
|
|
|
|
5,723 |
|
|
|
14,463 |
|
|
|
(3,228 |
) |
|
|
3,280 |
|
|
|
2,495 |
|
|
|
17,743 |
|
|
|
20,238 |
|
|
|
(1,456 |
) |
|
2021 |
Ladson |
|
Charleston, SC |
|
|
|
7,965 |
|
|
|
|
2,044 |
|
|
|
7,688 |
|
|
|
(1,642 |
) |
|
|
1,688 |
|
|
|
402 |
|
|
|
9,376 |
|
|
|
9,778 |
|
|
|
(725 |
) |
|
2021 |
Various Properties (3) |
|
Charlotte, NC |
|
|
|
30,811 |
|
|
|
|
9,140 |
|
|
|
40,818 |
|
|
|
(2,028 |
) |
|
|
5,712 |
|
|
|
7,112 |
|
|
|
46,530 |
|
|
|
53,642 |
|
|
|
(3,608 |
) |
|
2021 |
Bryan/College Station |
|
College Station, TX |
|
|
|
9,921 |
|
|
|
|
3,036 |
|
|
|
17,786 |
|
|
|
(118 |
) |
|
|
370 |
|
|
|
2,918 |
|
|
|
18,156 |
|
|
|
21,074 |
|
|
|
(1,505 |
) |
|
2021 |
Cornelius |
|
Cornelius, NC |
|
|
|
8,663 |
|
|
|
|
3,217 |
|
|
|
13,736 |
|
|
|
(272 |
) |
|
|
472 |
|
|
|
2,945 |
|
|
|
14,208 |
|
|
|
17,153 |
|
|
|
(1,204 |
) |
|
2021 |
OKC Edmond |
|
Edmond, OK |
|
|
|
4,217 |
|
|
|
|
2,550 |
|
|
|
5,282 |
|
|
|
2,793 |
|
|
|
(1,164 |
) |
|
|
5,343 |
|
|
|
4,118 |
|
|
|
9,461 |
|
|
|
(464 |
) |
|
2021 |
Flagler Village |
|
Ft Lauderdale, FL |
|
|
|
- |
|
|
|
|
6,979 |
|
|
|
34,644 |
|
|
|
8 |
|
|
|
131 |
|
|
|
6,987 |
|
|
|
34,775 |
|
|
|
41,762 |
|
|
|
(2,431 |
) |
|
2022 |
Lake Wylie |
|
Lake Wylie, SC |
|
|
|
7,476 |
|
|
|
|
2,928 |
|
|
|
5,947 |
|
|
|
(1,066 |
) |
|
|
1,070 |
|
|
|
1,862 |
|
|
|
7,017 |
|
|
|
8,879 |
|
|
|
(580 |
) |
|
2021 |
OKC Midwest City |
|
Midwest City, OK |
|
|
|
7,236 |
|
|
|
|
1,968 |
|
|
|
9,874 |
|
|
|
2,154 |
|
|
|
(2,176 |
) |
|
|
4,122 |
|
|
|
7,698 |
|
|
|
11,820 |
|
|
|
(813 |
) |
|
2021 |
Mooresville |
|
Mooresville, NC |
|
|
|
7,825 |
|
|
|
|
2,602 |
|
|
|
13,388 |
|
|
|
(50 |
) |
|
|
128 |
|
|
|
2,552 |
|
|
|
13,516 |
|
|
|
16,068 |
|
|
|
(1,115 |
) |
|
2021 |
Campbell Station |
|
Nashville, TN |
|
|
|
11,388 |
|
|
|
|
4,563 |
|
|
|
12,615 |
|
|
|
1,059 |
|
|
|
(1,060 |
) |
|
|
5,622 |
|
|
|
11,555 |
|
|
|
17,177 |
|
|
|
(1,053 |
) |
|
2021 |
OKC Norman |
|
Norman, OK |
|
|
|
6,250 |
|
|
|
|
1,342 |
|
|
|
8,634 |
|
|
|
1,469 |
|
|
|
(1,903 |
) |
|
|
2,811 |
|
|
|
6,731 |
|
|
|
9,542 |
|
|
|
(697 |
) |
|
2021 |
Various Properties (5) |
|
Oklahoma City, OK |
|
|
|
19,967 |
|
|
|
|
4,977 |
|
|
|
27,249 |
|
|
|
5,662 |
|
|
|
(6,171 |
) |
|
|
10,639 |
|
|
|
21,078 |
|
|
|
31,717 |
|
|
|
(2,272 |
) |
|
2021 |
FL Mall |
|
Orlando, FL |
|
|
|
7,881 |
|
|
|
|
1,949 |
|
|
|
6,803 |
|
|
|
(103 |
) |
|
|
190 |
|
|
|
1,846 |
|
|
|
6,993 |
|
|
|
8,839 |
|
|
|
(574 |
) |
|
2021 |
Various Properties (2) |
|
San Antonio, TX |
|
|
|
13,694 |
|
|
|
|
4,380 |
|
|
|
17,399 |
|
|
|
(1,507 |
) |
|
|
1,640 |
|
|
|
2,873 |
|
|
|
19,039 |
|
|
|
21,912 |
|
|
|
(1,562 |
) |
|
2021 |
Rea |
|
Waxhaw, NC |
|
|
|
15,999 |
|
|
|
|
4,661 |
|
|
|
24,139 |
|
|
|
(1,888 |
) |
|
|
1,962 |
|
|
|
2,773 |
|
|
|
26,101 |
|
|
|
28,874 |
|
|
|
(2,052 |
) |
|
2021 |
Highway 78 |
|
Wylie, TX |
|
|
|
7,392 |
|
|
|
|
3,098 |
|
|
|
10,714 |
|
|
|
(969 |
) |
|
|
1,065 |
|
|
|
2,129 |
|
|
|
11,779 |
|
|
|
13,908 |
|
|
|
(971 |
) |
|
2021 |
|
|
|
|
|
|
|
|
|
|
|
|
|
|
|
|
|
|
|
|
|
|
|
|
|
|
|
|
|
|
|
|
|
|
Total Other Properties |
|
|
|
$ |
|
688,034 |
|
|
$ |
|
302,438 |
|
$ |
|
772,093 |
|
$ |
|
4,574 |
|
$ |
|
34,917 |
|
$ |
|
307,012 |
|
$ |
|
807,010 |
|
$ |
|
1,114,022 |
|
$ |
|
(96,509 |
) |
|
|
|
|
|
|
|
|
|
|
|
|
|
|
|
|
|
|
|
|
|
|
|
|
|
|
|
|
|
|
|
|
|
|
|
|
Portfolio Total |
|
|
|
$ |
|
12,311,065 |
|
|
$ |
|
2,911,396 |
|
$ |
|
16,388,901 |
|
$ |
|
54,324 |
|
$ |
|
225,563 |
|
$ |
|
2,965,720 |
|
$ |
|
16,614,464 |
|
$ |
|
19,580,184 |
|
$ |
|
(1,961,647 |
) |
|
|
__________
(1)Encumbrances excludes approximately $0.5 billion of outstanding mortgage notes held as of December 31, 2024, associated with properties classified as held-for-sale.
(2)Refer to Note 2 to the Company’s consolidated financial statements for details of depreciable lives.
(3)As of December 31, 2024, the aggregate cost basis for tax purposes was $20.1 billion.
The total included on Schedule III above does not include furniture, fixtures and equipment totaling $272.5 million and right-of-use operating lease assets of $105.2 million. Accumulated Depreciation does not include $156.1 million of accumulated depreciation related to furniture, fixtures and equipment assets. The total included on Schedule III above also does not include assets that are held-for-sale.
The following table summarizes activity for real estate and accumulated depreciation for the years ended December 31, 2024 and 2023 ($ in thousands):
|
|
|
|
|
|
|
|
|
|
|
|
|
December 31, 2024 |
|
|
December 31, 2023 |
|
Real Estate(1): |
|
|
|
|
|
|
|
|
Balance at the beginning of year |
|
$ |
|
21,061,744 |
|
|
$ |
|
23,161,692 |
|
Additions during the year: |
|
|
|
|
|
|
|
|
Building and building improvements |
|
|
|
137,879 |
|
|
|
|
152,709 |
|
Land and land improvements |
|
|
|
24,272 |
|
|
|
|
29,205 |
|
Furniture, fixtures and equipment |
|
|
|
5,534 |
|
|
|
|
10,579 |
|
Dispositions during the year: |
|
|
|
|
|
|
|
|
Building and building improvements |
|
|
|
(261,465 |
) |
|
|
|
(1,649,905 |
) |
Land and land improvements |
|
|
|
(91,188 |
) |
|
|
|
(416,215 |
) |
Furniture, fixtures and equipment |
|
|
|
(18,605 |
) |
|
|
|
(37,517 |
) |
Impairment of investments in real estate |
|
|
|
(150,392 |
) |
|
|
|
(188,804 |
) |
Assets held-for-sale |
|
|
|
(855,074 |
) |
|
|
|
— |
|
Balance at the end of the year |
|
$ |
|
19,852,705 |
|
|
$ |
|
21,061,744 |
|
|
|
|
|
|
|
|
|
|
Accumulated depreciation(2): |
|
|
|
|
|
|
|
|
Balance at the beginning of the year |
|
$ |
|
(1,578,637 |
) |
|
$ |
|
(1,013,703 |
) |
Accumulated depreciation, net of dispositions |
|
|
|
(630,327 |
) |
|
|
|
(564,934 |
) |
Accumulated depreciation on assets held-for-sale |
|
|
|
91,200 |
|
|
|
|
— |
|
Balance at the end of the year |
|
$ |
|
(2,117,764 |
) |
|
$ |
|
(1,578,637 |
) |
__________
(1)Real estate includes furniture, fixtures and equipment totaling $272.5 million and $304.7 million for the years ended December 31, 2024 and 2023, respectively. Real estate excludes right-of-use operating lease assets of $105.2 million for the years ended December 31, 2024 and 2023.
(2)Accumulated depreciation excludes amortization on right-of-use operating lease assets of $9.9 million and $8.0 million for the years ended December 31, 2024 and 2023.