What were the Fund costs for the past year?
(based on a hypothetical $10,000 investment)
|
Fund Name
|
Costs of a $10,000 investment
|
Costs paid as a percentage of a $10,000 investment
|
|---|---|---|
|
Defiance Daily Target 2X Long AVGO ETF
|
$
85
|
1.29
%
|
Costs paid as a percentage of a $10,000 investment is an annualized figure. The Fund commenced operations August 21, 2024. Expenses for a full reporting period would be higher than the figures shown.
How did the Fund perform last year and what affected its performance?
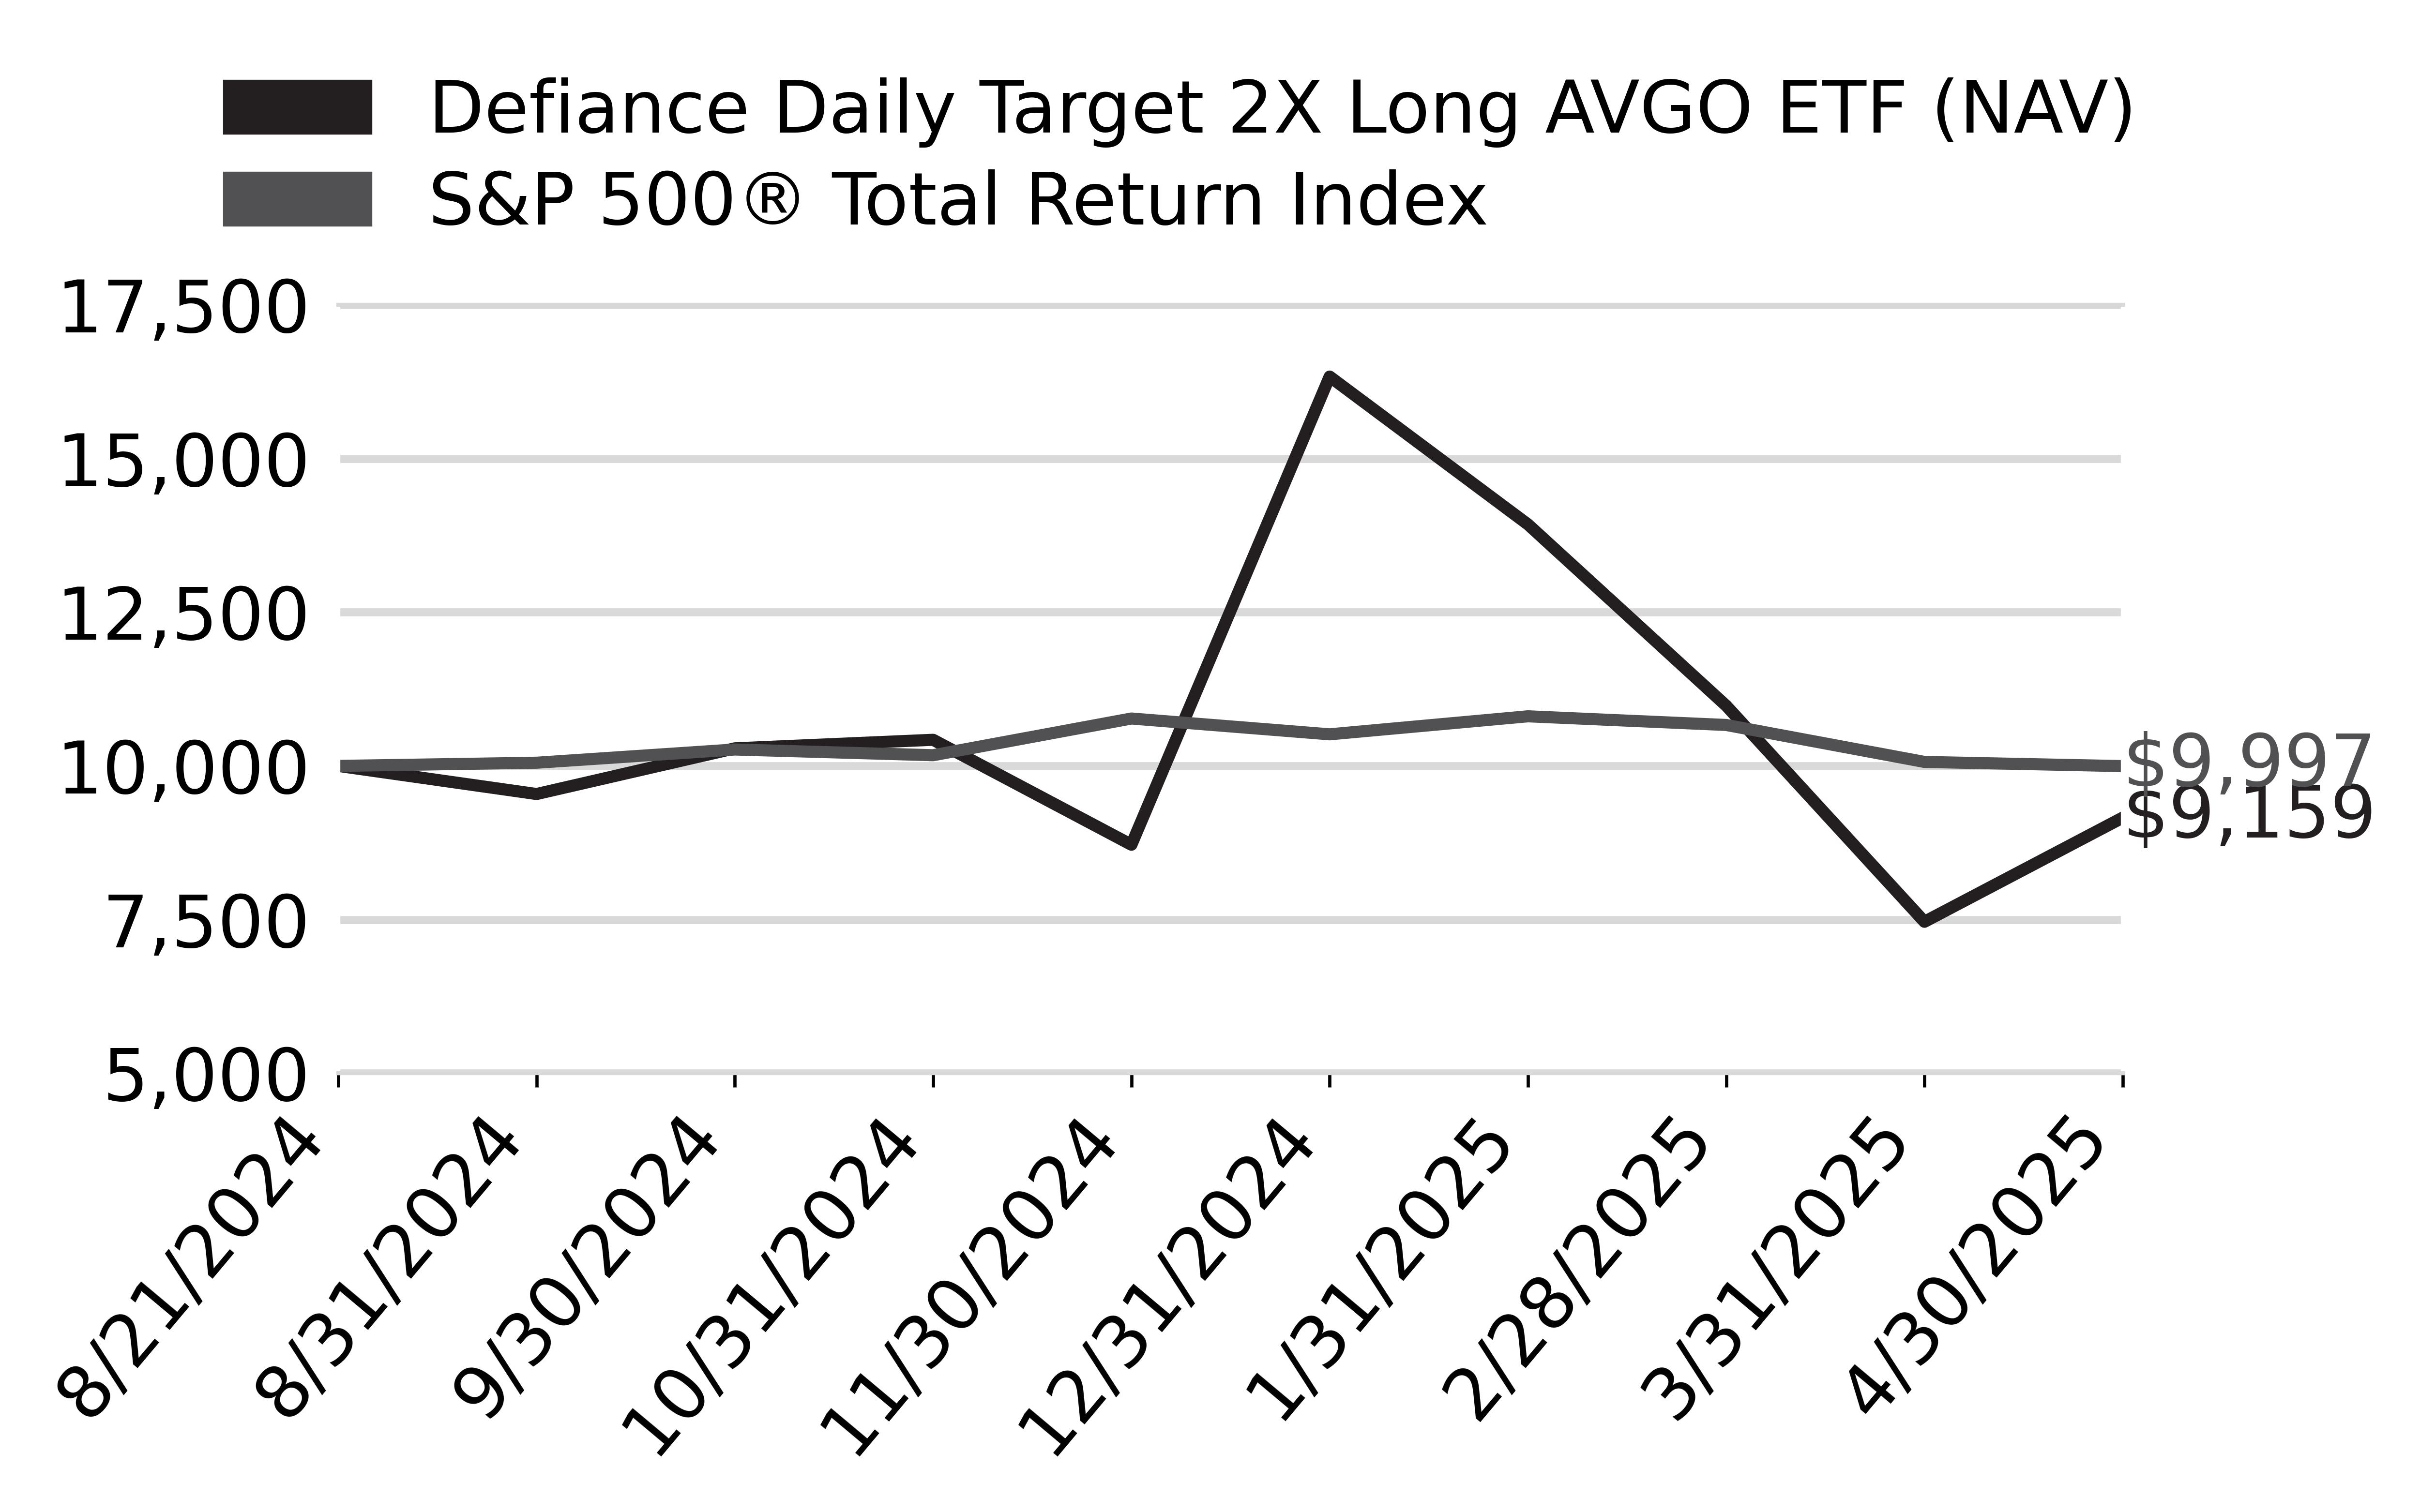
From inception through 4/30/25, AVGX had a NAV total return of -8.41%. AVGX seeks to deliver twice the daily performance of AVGO. Therefore, any fluctuations in AVGO’s stock price are magnified in AVGX. Periods of high volatility can lead to amplified gains or losses.
What Factors Influenced Performance
The Fund's 2x leverage means that over periods longer than a day, the effects of compounding can lead to returns that deviate significantly from the expected 2x multiple, especially in volatile markets.
High volatility in the underlying stock can exacerbate the compounding effects, leading to greater divergence from the expected performance over time.
Investor sentiment towards the semiconductor industry and technology sector at large can impact AVGO's stock performance. Broader market trends, including interest rate changes and economic indicators, may have influenced investor behavior during this period. Developments within the semiconductor industry, such as supply chain dynamics, demand for chips, and competition, could have affected Broadcom's stock performance. Positive industry trends may have supported the stock's rise, while challenges could have contributed to its subsequent decline. Broadcom's stock experienced significant fluctuations, reaching an all-time high in December before declining by the end of April. These movements were influenced by the company's earnings performance, investor sentiment, and broader sector trends.
Cumulative Performance
(Initial Investment of $10,000)
Annual Performance
|
Returns for the Period ending April 30, 2025
|
Since Inception
8/21/24
|
|---|---|
|
Defiance Daily Target 2X Long AVGO ETF - at NAV
|
-
8.41
%
|
|
S&P 500
®
Total Return Index
|
-
0.03
%
|
Key Fund Statistics
(as of April 30, 2025 )
|
Fund Size (Thousands)
|
$
72,117
|
|
Number of Holdings
|
6
|
|
Total Advisory Fee
|
$
439,855
|
|
Portfolio Turnover
|
1,661
%
|
What did the Fund invest in?
(as of April 30, 2025 )
Security Type (% of net assets)

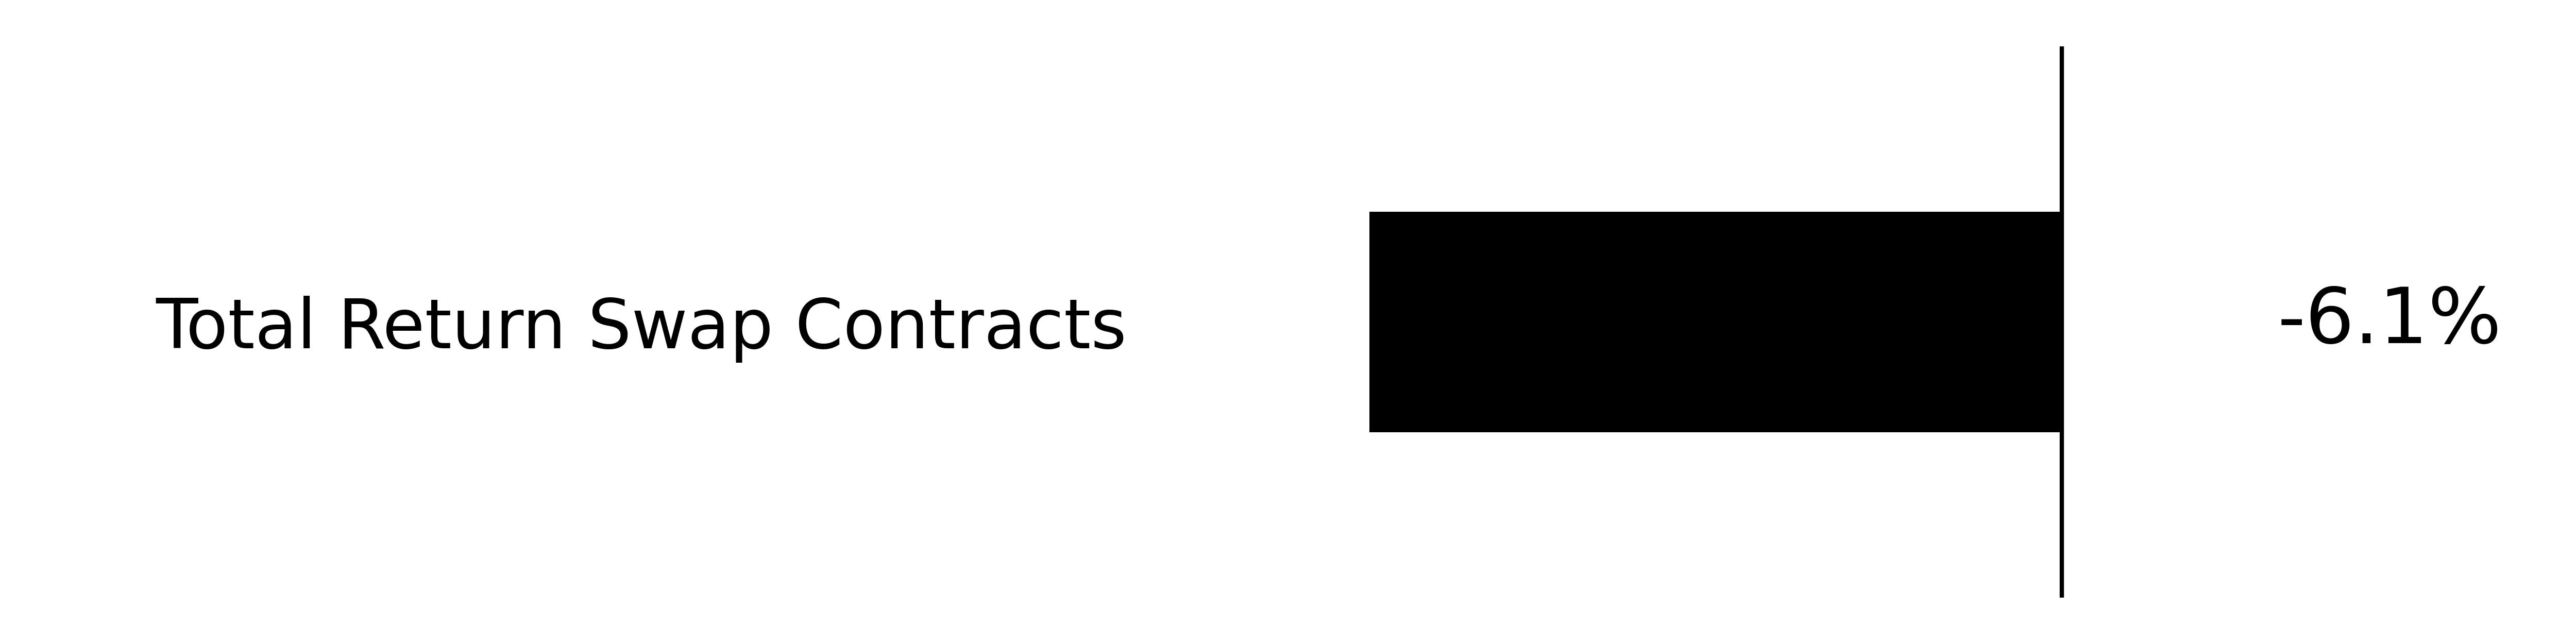
Security Type - Other Financial Instruments
(% of net assets)
Percentages are based on total net assets. Percentages for swap contracts are based unrealized appreciation (depreciation). Monthly reset swap values are not presented, as the unrealized appreciation (depreciation) resets at each month-end. Cash & Cash Equivalents represents short-term investments and other assets in excess of liabilities.
|
Top Holdings
|
% of Total Net Assets
|
|---|---|
|
Broadcom, Inc.
|
|
|
Broadcom, Inc. Swap; Maturity Date: 01/20/2026
|
|
|
First American Government Obligations Fund - Class X, 4.25%
|
|
|
Broadcom, Inc. Swap; Maturity Date: 09/15/2025
|
|
|
Broadcom, Inc. Swap; Maturity Date: 10/28/2025
|
|
|
Broadcom, Inc. Swap; Maturity Date: 11/10/2025
|
| * | Percentages for swap contracts are based unrealized appreciation (depreciation). Monthly reset swap values are not presented, as the unrealized appreciation (depreciation) resets at each month-end. |
What were the Fund costs for the past year?
(based on a hypothetical $10,000 investment)
|
Fund Name
|
Costs of a $10,000 investment
|
Costs paid as a percentage of a $10,000 investment
|
|---|---|---|
|
Defiance Daily Target 2X Long HIMS ETF
|
$
15
|
1.29
%
|
Costs paid as a percentage of a $10,000 investment is an annualized figure. The Fund commenced operations March 12, 2025. Expenses for a full reporting period would be higher than the figures shown.
How did the Fund perform last year and what affected its performance?
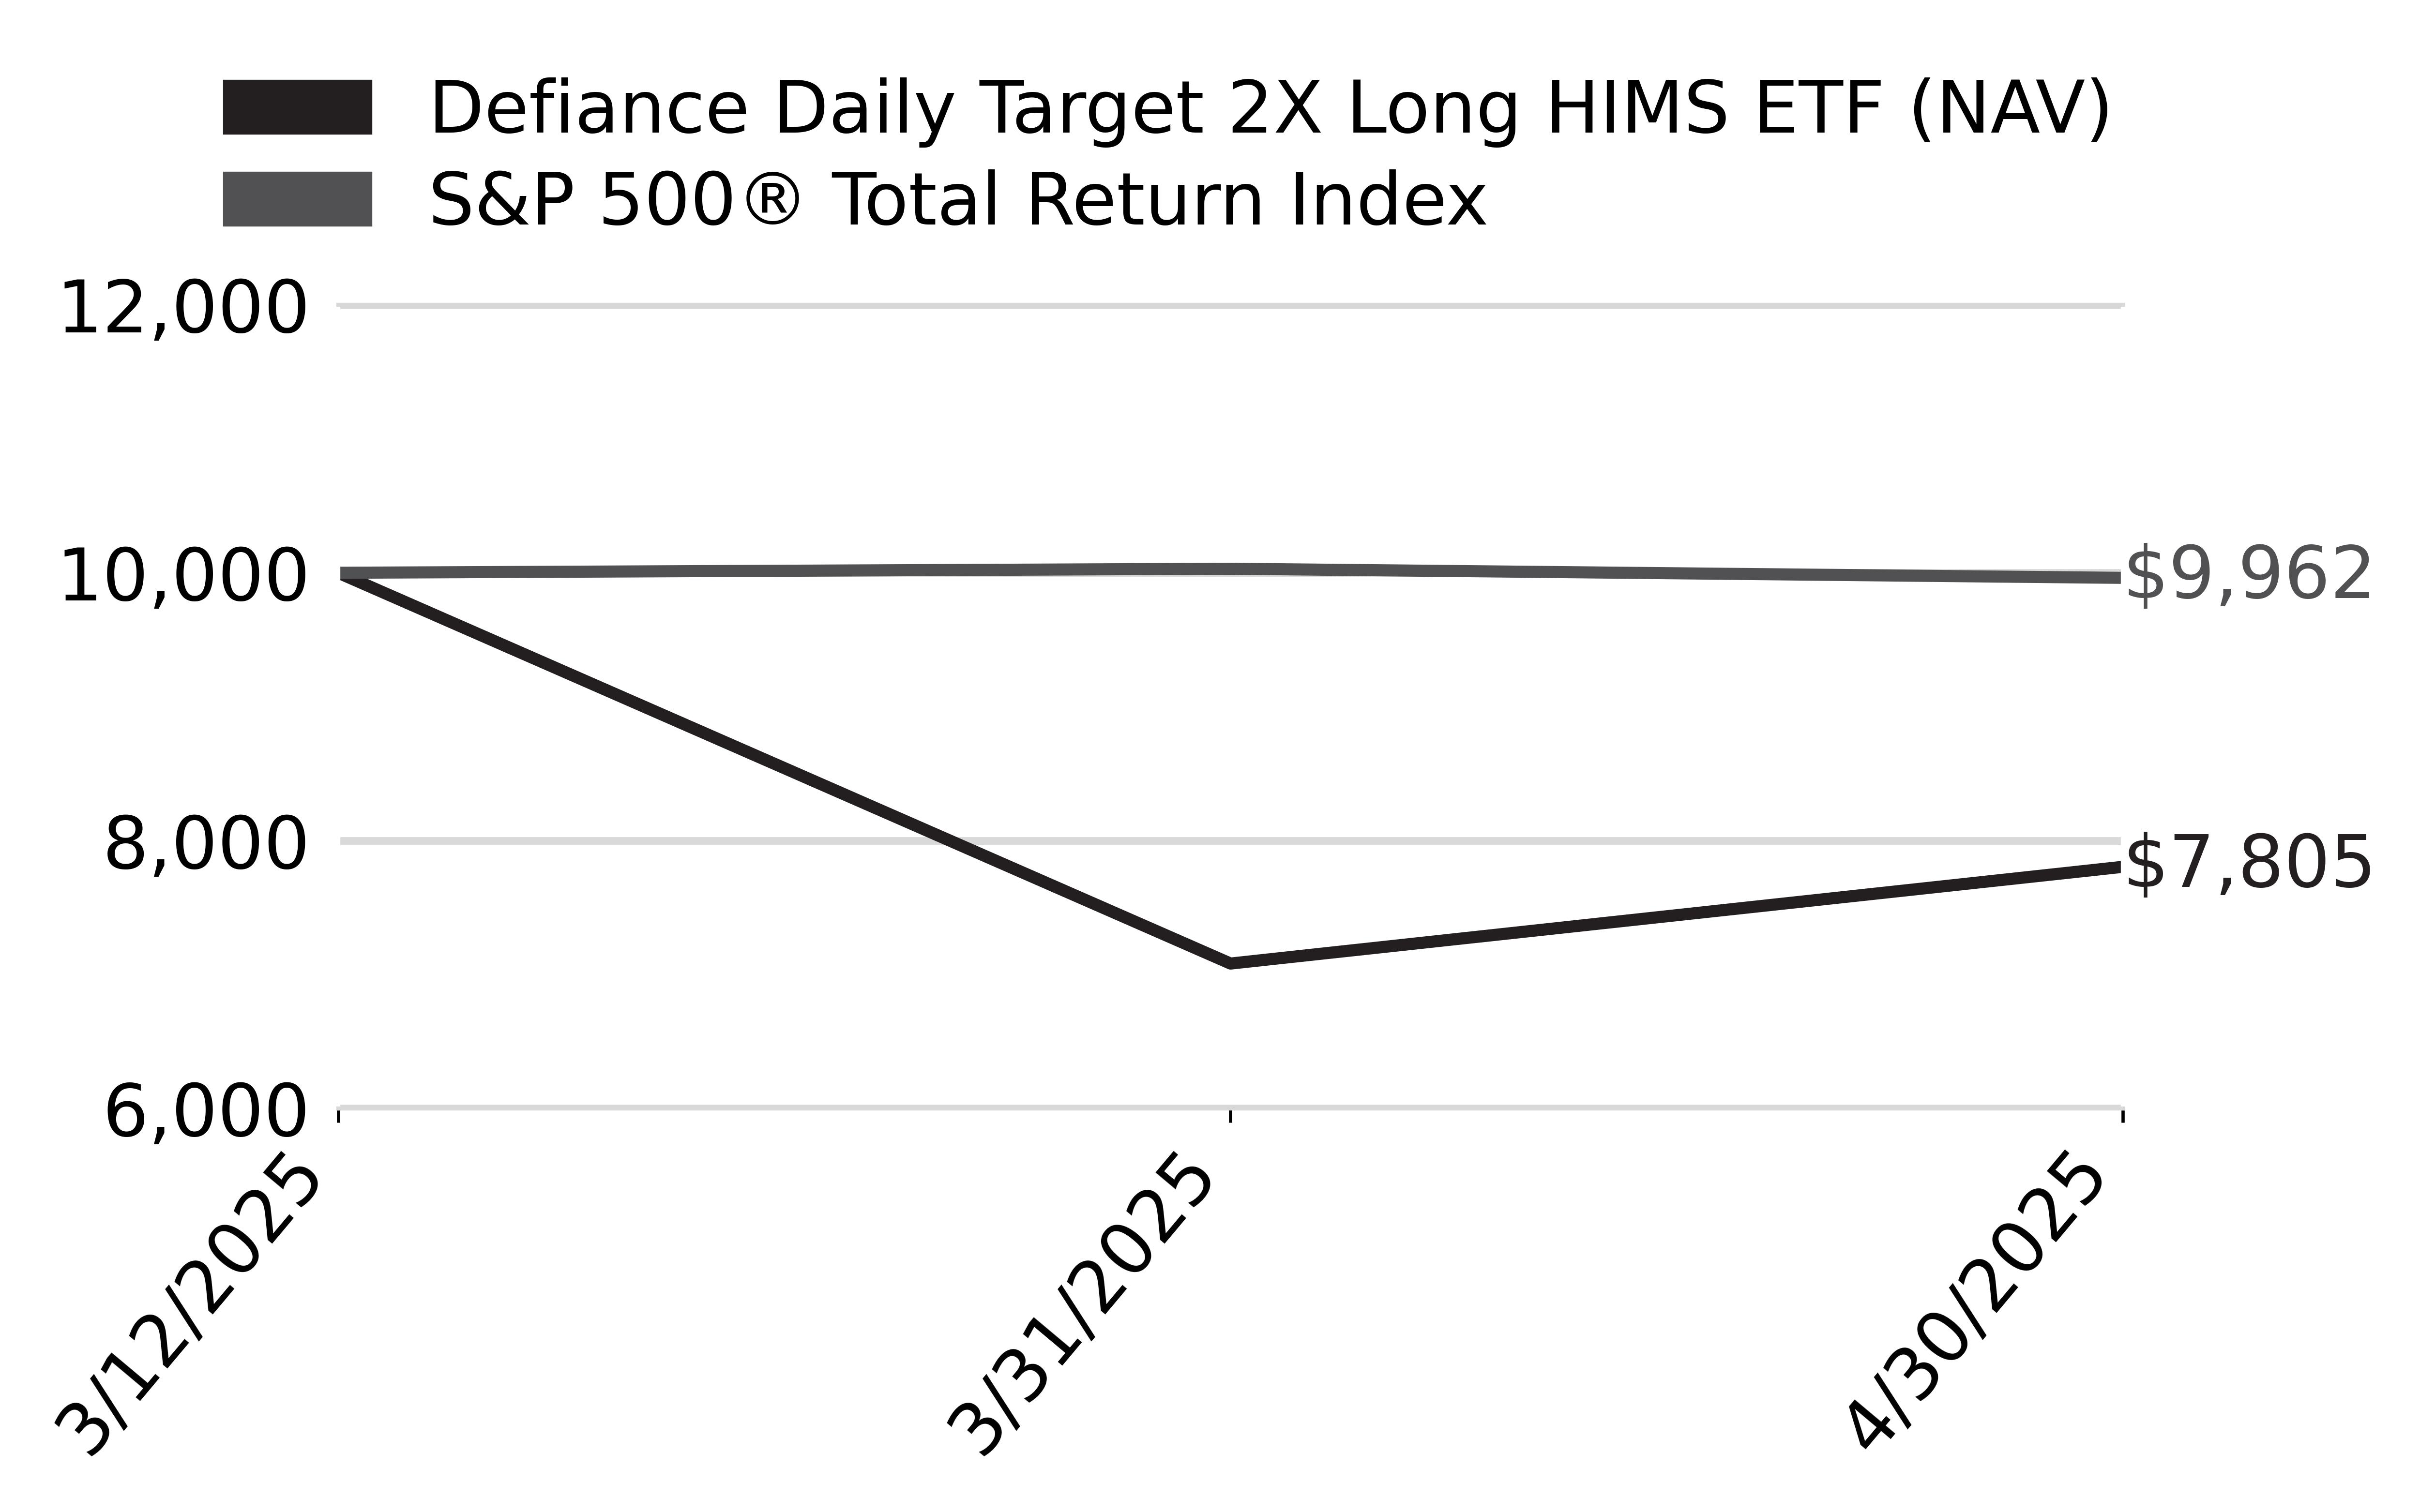
From inception through 4/30/25, HIMZ had a NAV return of -21.94%. HIMZ seeks to deliver twice the daily performance of HIMS. Therefore, any fluctuations in HIMS's stock price are magnified in HIMZ.
What Factors Influenced Performance
The fund's 2x leverage means that over periods longer than a day, the effects of compounding can lead to returns that deviate significantly from the expected 2x multiple, especially in volatile markets. High volatility in HIMS's stock can exacerbate the compounding effects, leading to greater divergence from the expected performance over time. Hims & Hers Health's performance and stock volatility was shaped by external competitive pressures, regulatory changes, and internal strategic decisions. The initial decline in March was driven by intensified competition and regulatory constraints on compounded medications. However, the company's swift strategic pivot to personalized treatments contributed to a stock recovery in April, demonstrating resilience in a dynamic market environment.
Cumulative Performance
(Initial Investment of $10,000)
Annual Performance
|
Returns for the Period ending April 30, 2025
|
Since Inception
3/12/25
|
|---|---|
|
Defiance Daily Target 2X Long HIMS ETF - at NAV
|
-
21.94
%
|
|
S&P 500
®
Total Return Index
|
-
0.38
%
|
Key Fund Statistics
(as of April 30, 2025 )
|
Fund Size (Thousands)
|
$
17,564
|
|
Number of Holdings
|
3
|
|
Total Advisory Fee
|
$
8,034
|
|
Portfolio Turnover
|
251
%
|
What did the Fund invest in?
(as of April 30, 2025 )
Security Type (% of net assets)

Security Type - Other Financial Instruments
(% of net assets)

Percentages are based on total net assets. Percentages for swap contracts are based unrealized appreciation (depreciation). Monthly reset swap values are not presented, as the unrealized appreciation (depreciation) resets at each month-end. Cash & Cash Equivalents represents short-term investments and other assets in excess of liabilities.
|
Top Holdings
|
% of Total Net Assets
|
|---|---|
|
First American Government Obligations Fund - Class X, 4.25%
|
|
|
Hims & Hers Health, Inc.
|
|
|
Hims & Hers Health, Inc. Swap; Maturity Date: 04/13/2026
|
| * | Percentages for swap contracts are based unrealized appreciation (depreciation). Monthly reset swap values are not presented, as the unrealized appreciation (depreciation) resets at each month-end. |
What were the Fund costs for the past year?
(based on a hypothetical $10,000 investment)
|
Fund Name
|
Costs of a $10,000 investment
|
Costs paid as a percentage of a $10,000 investment
|
|---|---|---|
|
Defiance Daily Target 2X Long HOOD ETF
|
$
18
|
1.29
%
|
Costs paid as a percentage of a $10,000 investment is an annualized figure. The Fund commenced operations March 18, 2025. Expenses for a full reporting period would be higher than the figures shown.
How did the Fund perform last year and what affected its performance?
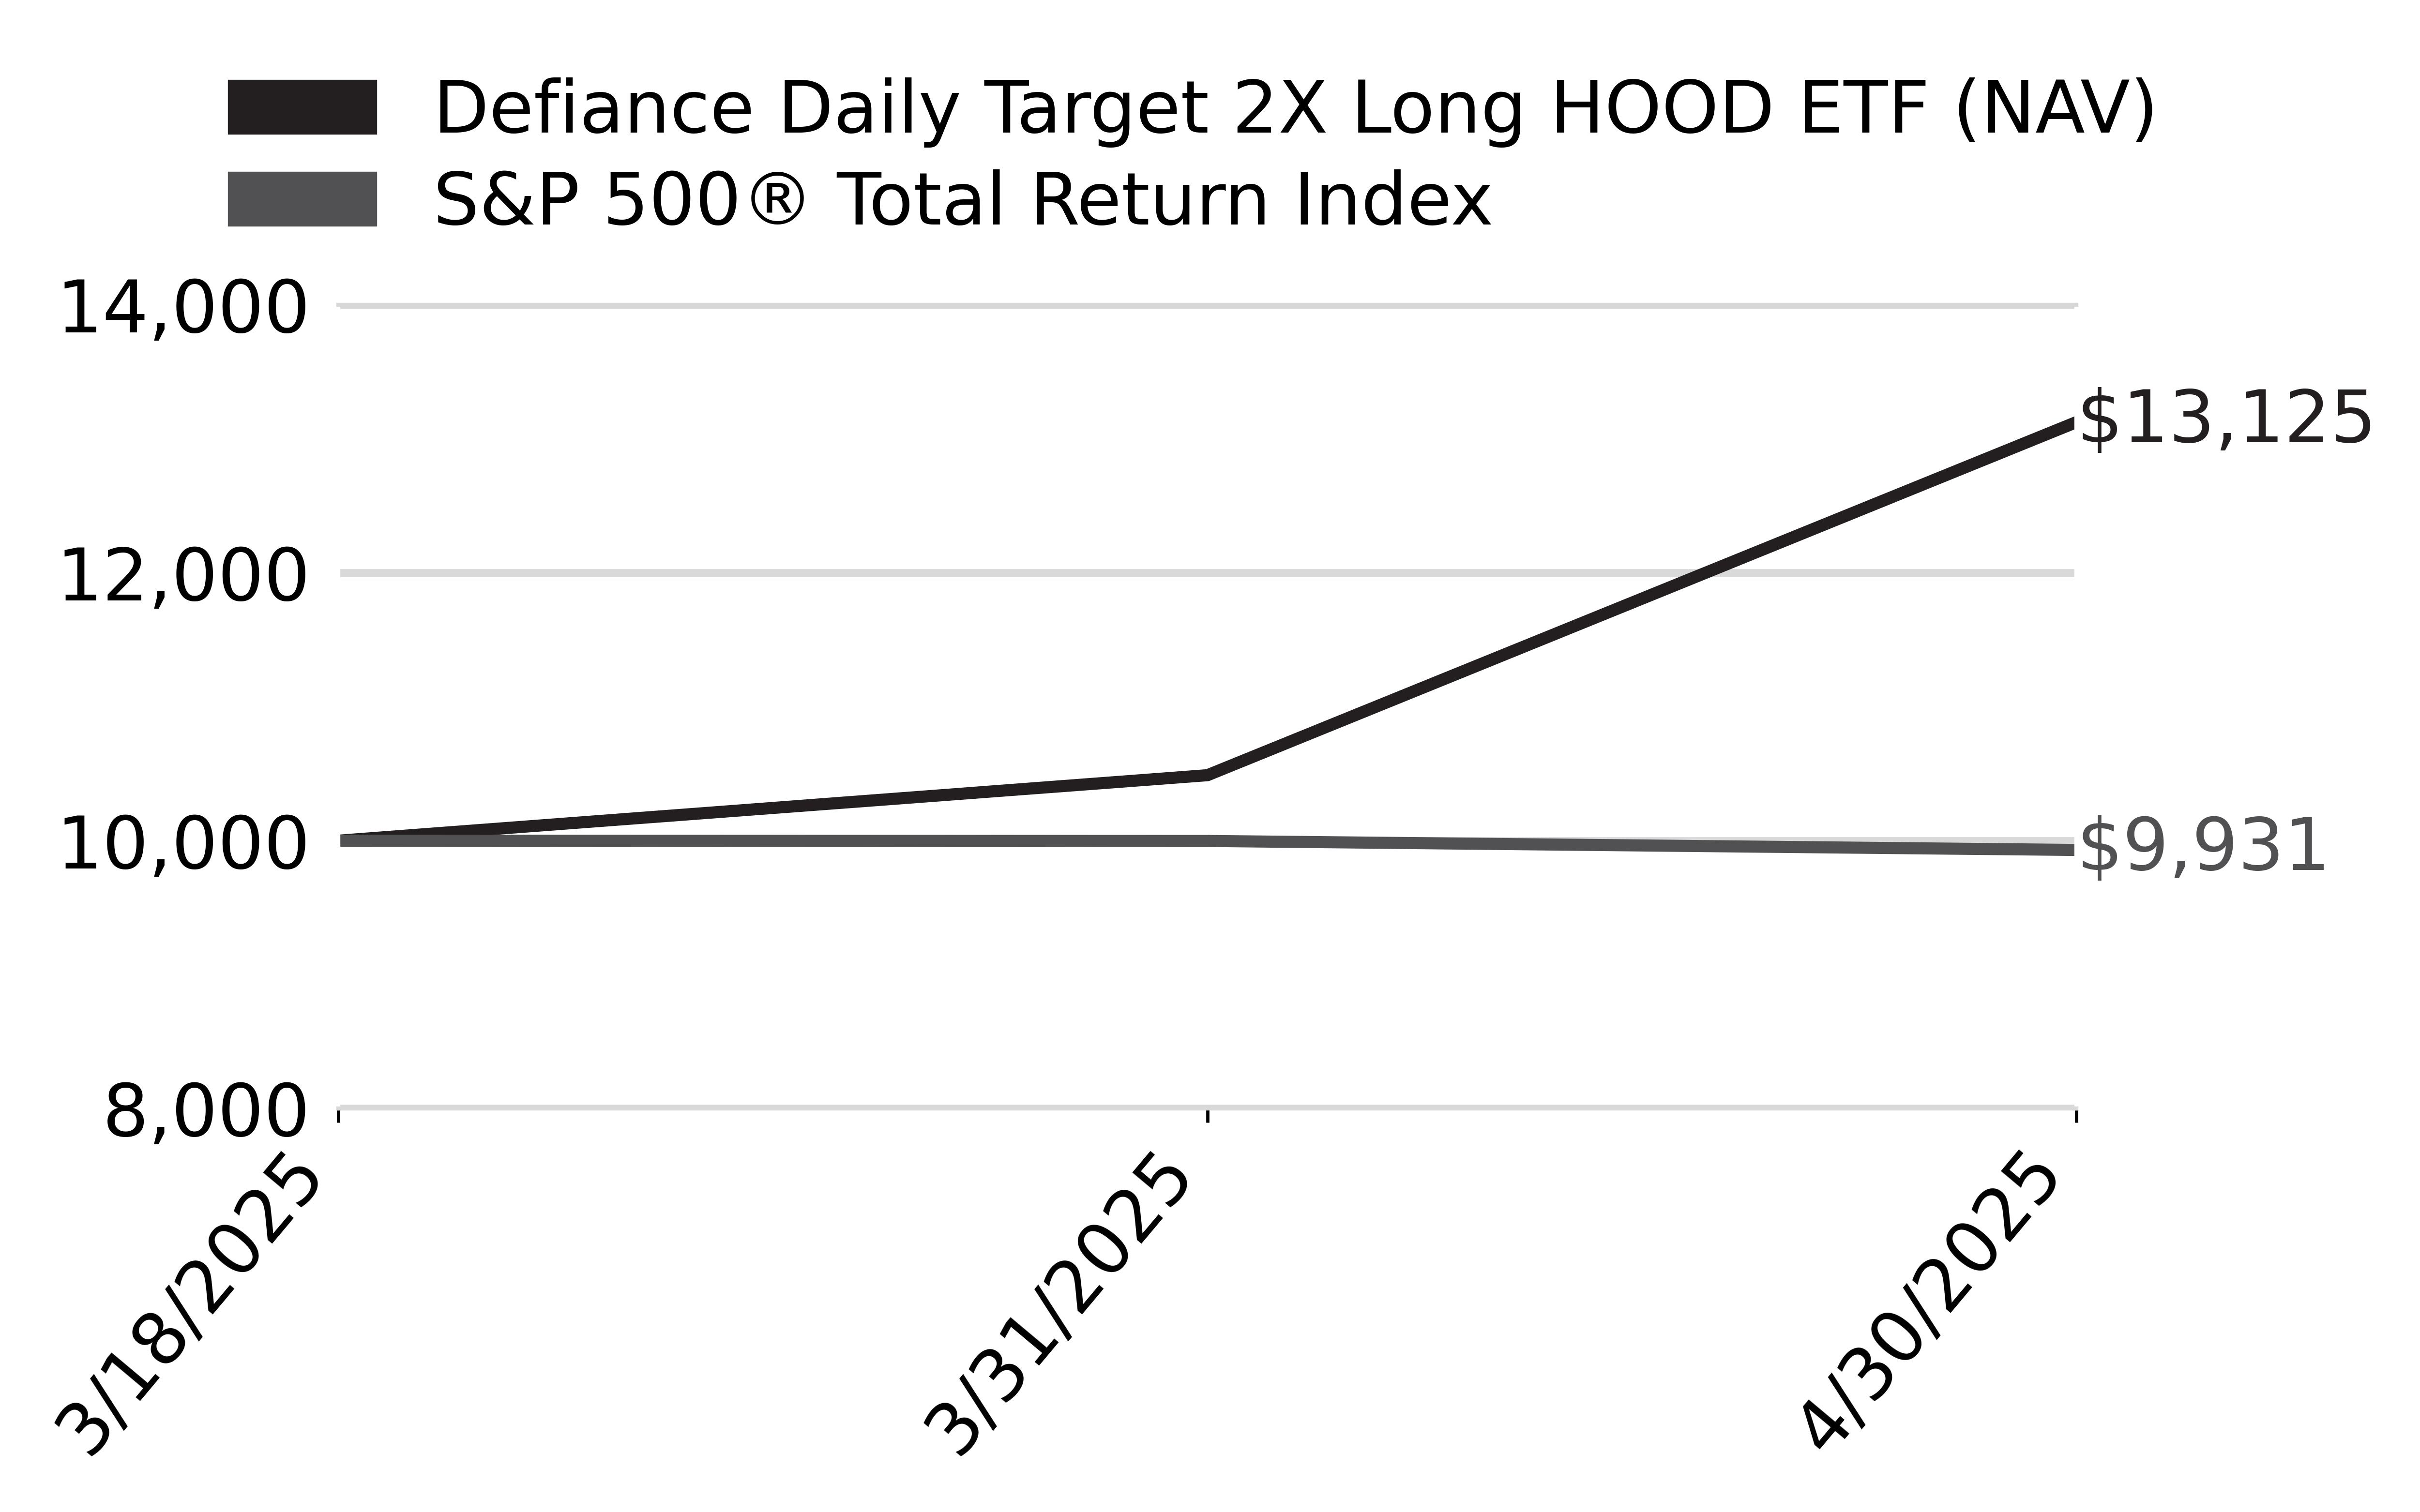
From inception through 4/30/25, HOOX had a NAV return of 31.25%. HOOX seeks to deliver twice the daily performance of HOOD. Therefore, any fluctuations in HOOD’s stock price are magnified in HOOX.
What Factors Influenced Performance
The Fund's 2x leverage means that over periods longer than a day, the effects of compounding can lead to returns that deviate significantly from the expected 2x multiple, especially in volatile markets.
High volatility in the underlying stock can exacerbate the compounding effects, leading to greater divergence from the expected performance over time.
HOOX's performance was driven by Robinhood's strong financial results, strategic expansions, favorable regulatory outlook, and positive market sentiment. Robinhood launched 24-hour/five days a week trading. This move aimed to cater to the growing demand for flexible trading hours, potentially increasing user engagement and trading volumes. This resulted in stronger trading volumes, and increased market volatility.
Cumulative Performance
(Initial Investment of $10,000)
Annual Performance
|
Returns for the Period ending April 30, 2025
|
Since Inception
3/18/25
|
|---|---|
|
Defiance Daily Target 2X Long HOOD ETF - at NAV
|
31.25
%
|
|
S&P 500
®
Total Return Index
|
-
0.69
%
|
Key Fund Statistics
(as of April 30, 2025 )
|
Fund Size (Thousands)
|
$
3,938
|
|
Number of Holdings
|
3
|
|
Total Advisory Fee
|
$
3,615
|
|
Portfolio Turnover
|
210
%
|
What did the Fund invest in?
(as of April 30, 2025 )
Security Type (% of net assets)
Security Type - Other Financial Instruments
(% of net assets)

Percentages are based on total net assets. Percentages for swap contracts are based unrealized appreciation (depreciation). Monthly reset swap values are not presented, as the unrealized appreciation (depreciation) resets at each month-end. Cash & Cash Equivalents represents short-term investments and other assets in excess of liabilities.
|
Top Holdings
|
% of Total Net Assets
|
|---|---|
|
First American Government Obligations Fund - Class X, 4.25%
|
|
|
Robinhood Markets, Inc. - Class A
|
|
|
Robinhood Markets, Inc. Swap; Maturity Date: 04/20/2026
|
| * | Percentages for swap contracts are based unrealized appreciation (depreciation). Monthly reset swap values are not presented, as the unrealized appreciation (depreciation) resets at each month-end. |
What were the Fund costs for the past year?
(based on a hypothetical $10,000 investment)
|
Fund Name
|
Costs of a $10,000 investment
|
Costs paid as a percentage of a $10,000 investment
|
|---|---|---|
|
Defiance Daily Target 2X Long IONQ ETF
|
$
24
|
1.29
%
|
Costs paid as a percentage of a $10,000 investment is an annualized figure. The Fund commenced operations March 11, 2025. Expenses for a full reporting period would be higher than the figures shown.
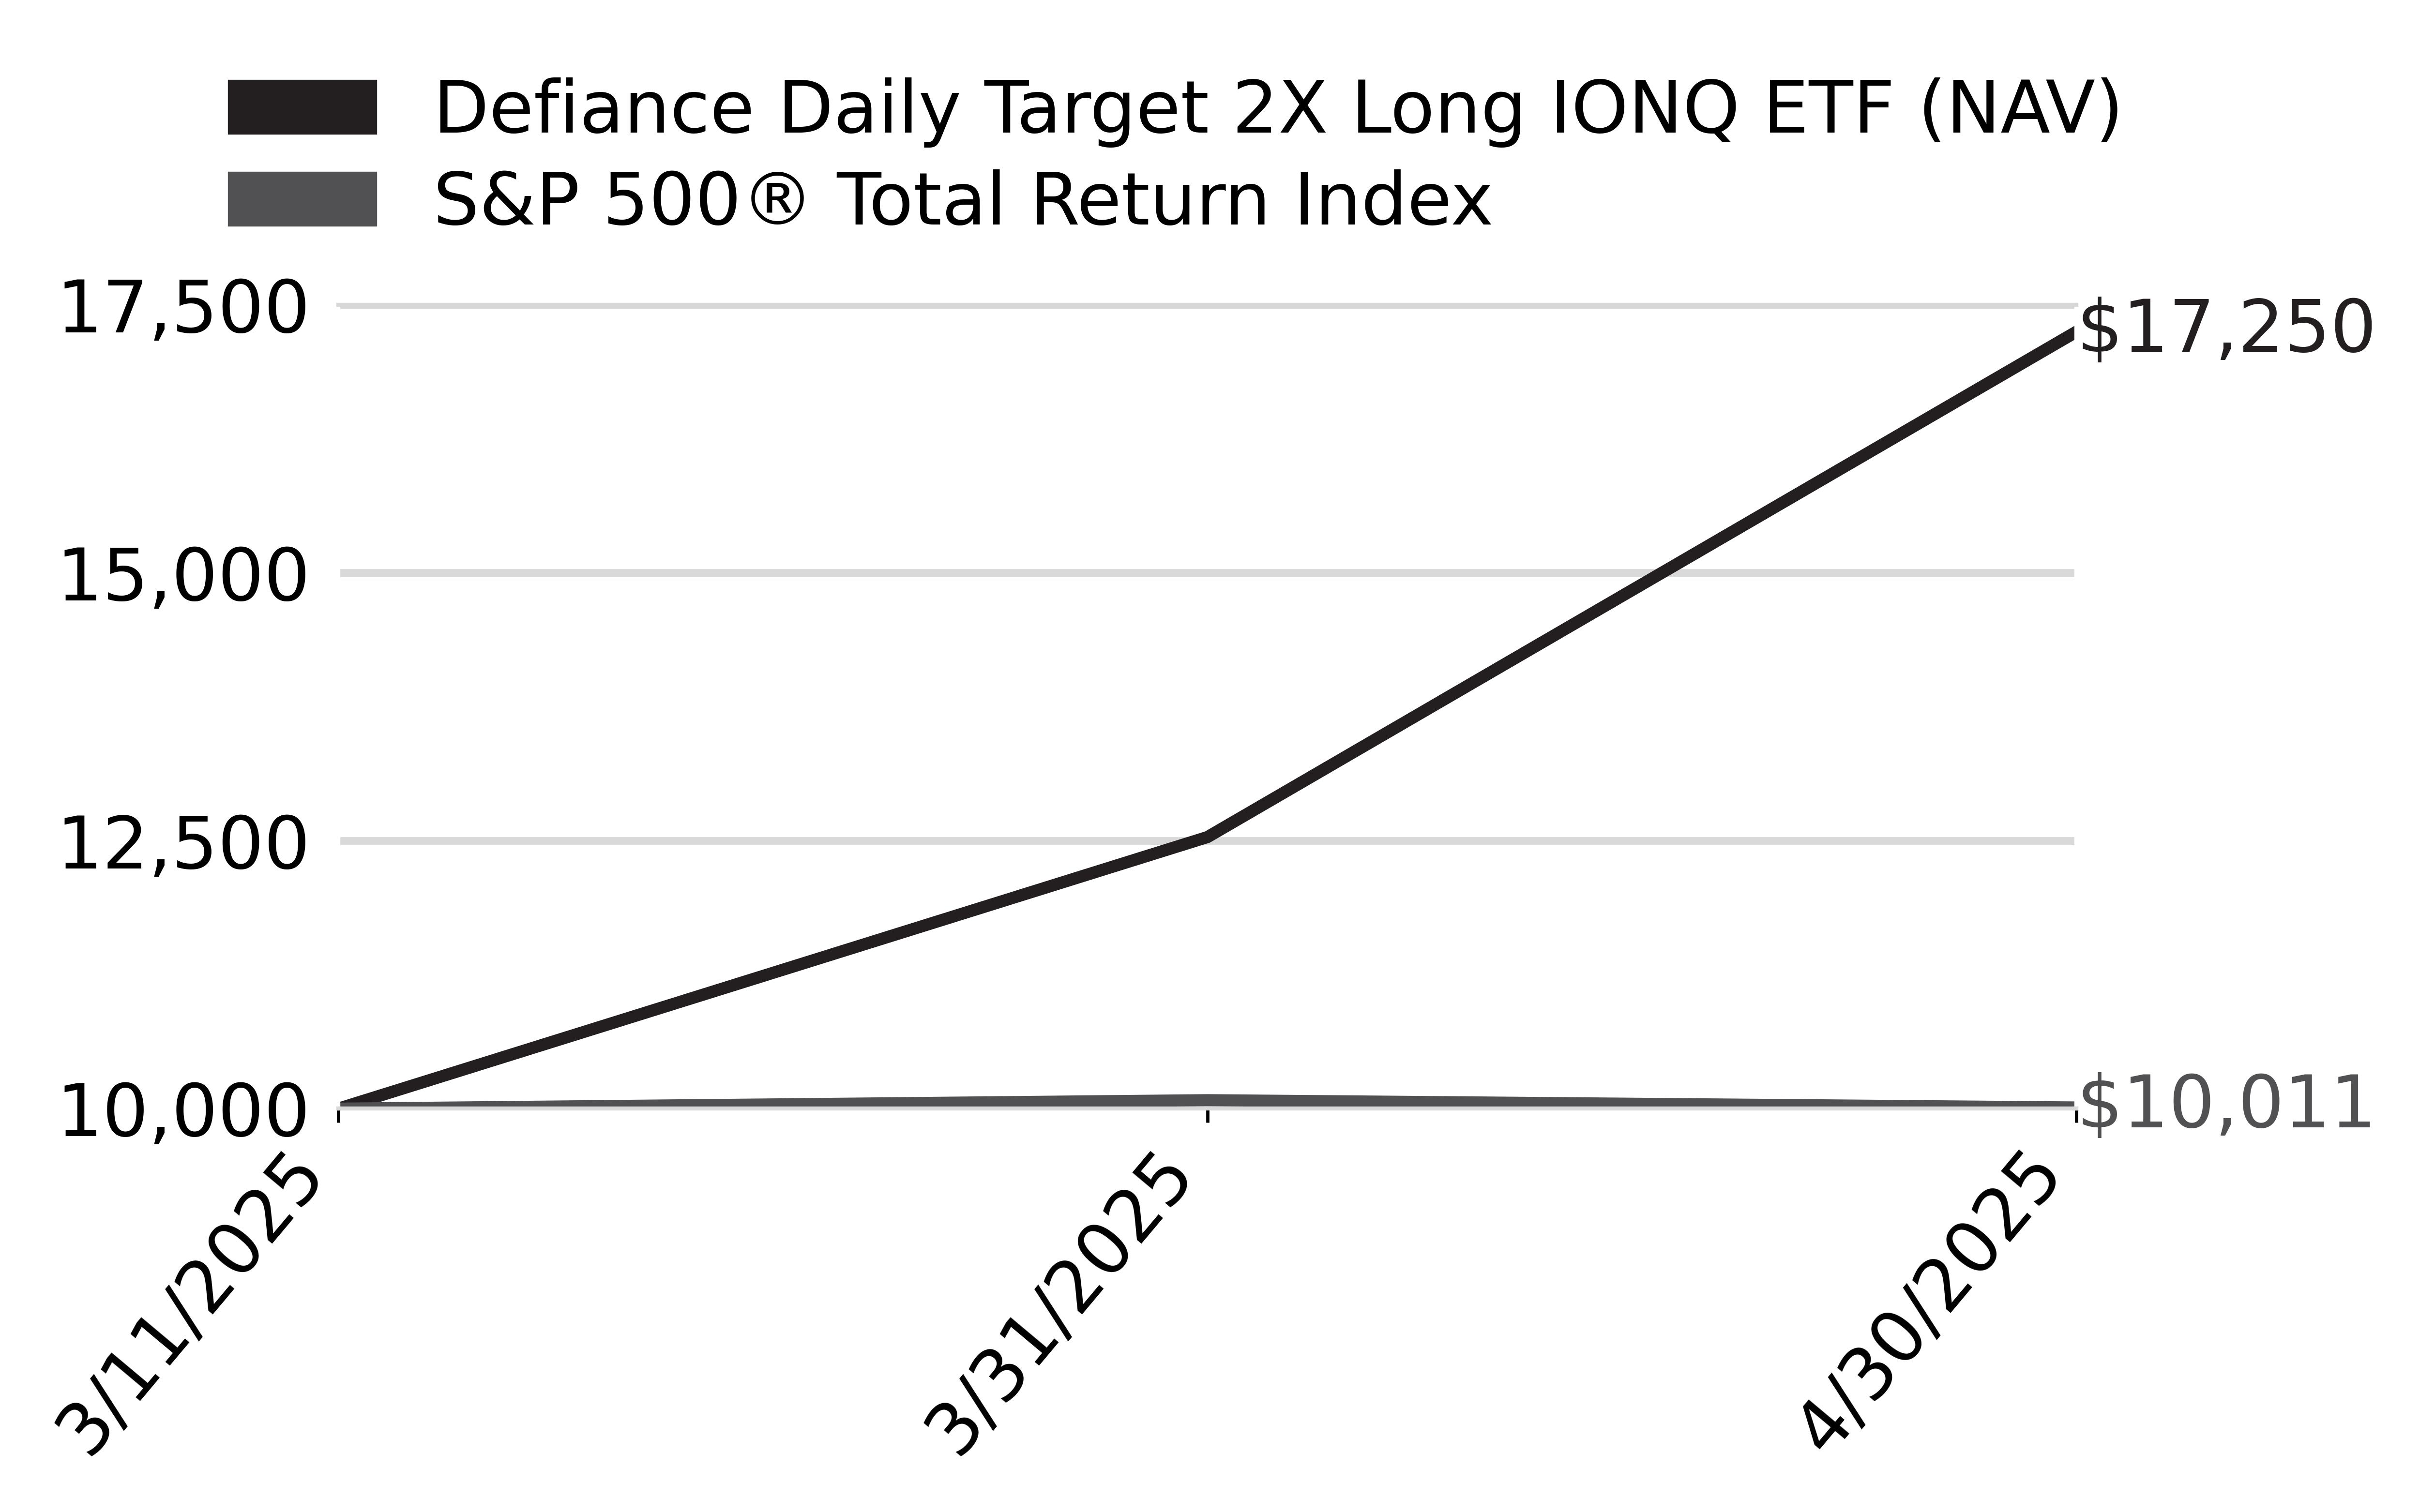
How did the Fund perform last year and what affected its performance?
From inception through 4/30/25, IONX had a NAV return of 72.50%. IONX seeks to deliver twice the daily performance of IONQ. Therefore, any fluctuations in IONQ's stock price are magnified in IONX.
What Factors Influenced Performance
The fund's 2x leverage means that over periods longer than a day, the effects of compounding can lead to returns that deviate significantly from the expected 2x multiple. High volatility in IONQ's stock can exacerbate the compounding effects, leading to greater divergence from the expected performance over time. IONQ’s performance was shaped by external skepticism from industry leaders, strategic financial maneuvers, and investor reactions to financial results. While early March saw declines due to doubts about quantum computing's near-term viability, mid-March strategic investments and insider purchases helped stabilize the stock. April's financial disclosures introduced volatility, but technical support levels and renewed investor interest contributed to a significant rally by month's end.
Cumulative Performance
(Initial Investment of $10,000)
Annual Performance
|
Returns for the Period ending April 30, 2025
|
Since Inception
3/11/25
|
|---|---|
|
Defiance Daily Target 2X Long IONQ ETF - at NAV
|
72.50
%
|
|
S&P 500
®
Total Return Index
|
0.11
%
|
Key Fund Statistics
(as of April 30, 2025 )
|
Fund Size (Thousands)
|
$
24,153
|
|
Number of Holdings
|
3
|
|
Total Advisory Fee
|
$
24,298
|
|
Portfolio Turnover
|
314
%
|
What did the Fund invest in?
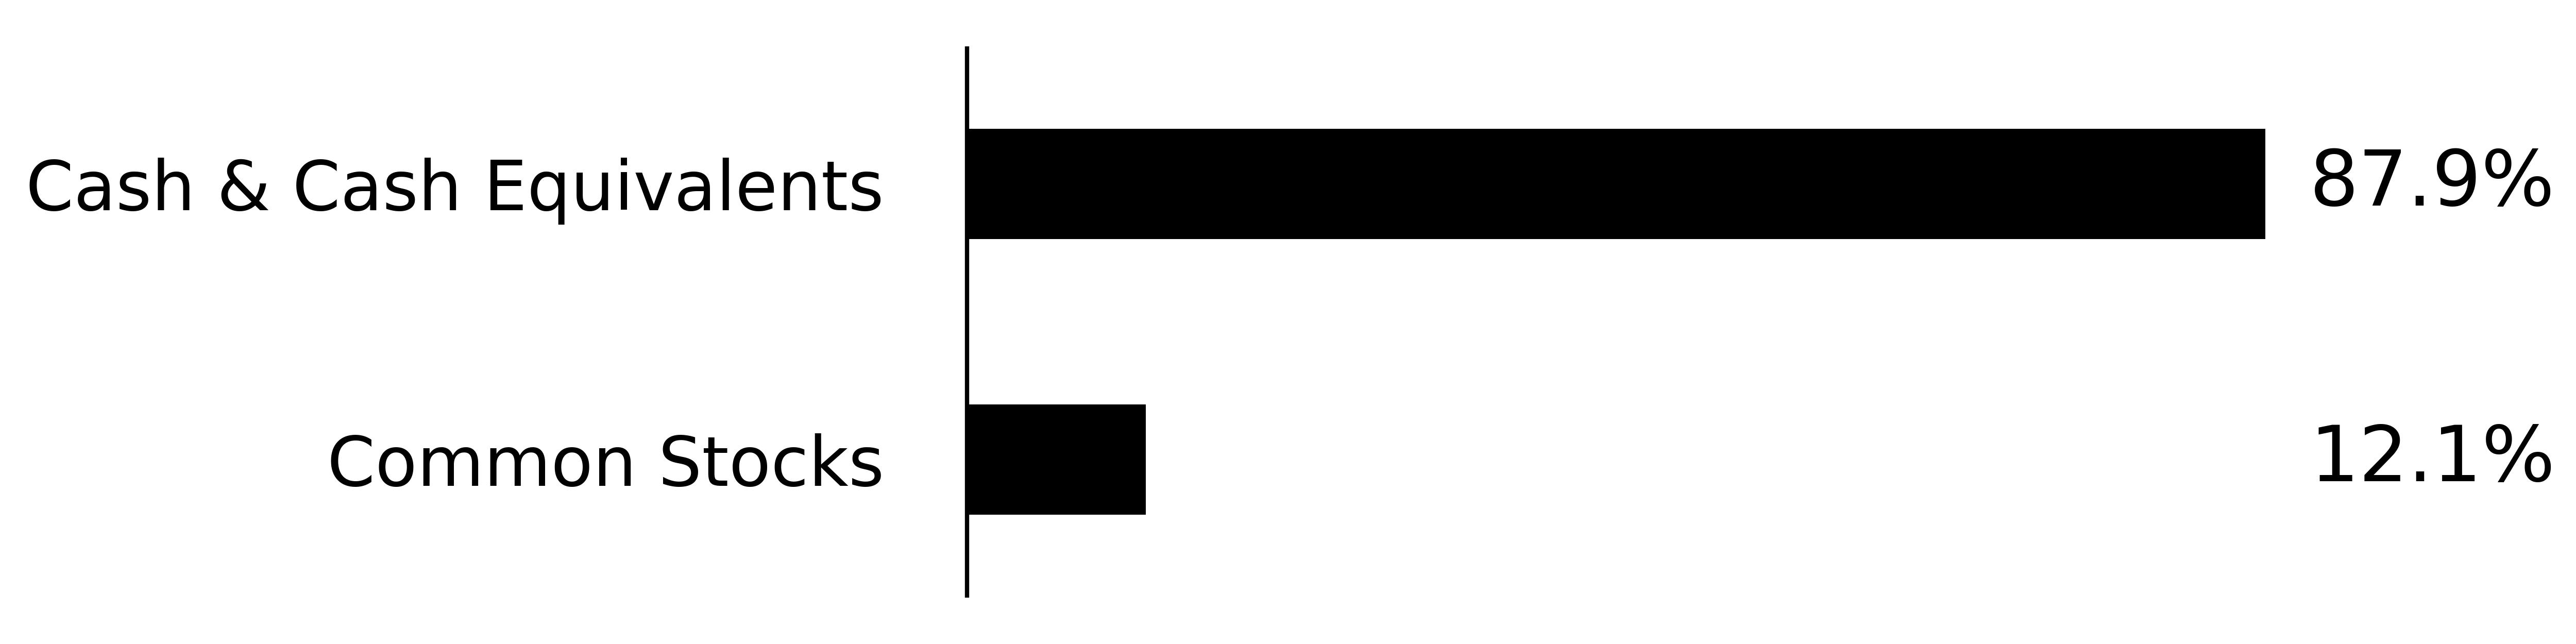
(as of April 30, 2025 )
Security Type (% of net assets)
Security Type - Other Financial Instruments
(% of net assets)

Percentages are based on total net assets. Percentages for swap contracts are based unrealized appreciation (depreciation). Monthly reset swap values are not presented, as the unrealized appreciation (depreciation) resets at each month-end. Cash & Cash Equivalents represents short-term investments and other assets in excess of liabilities.
|
Top Holdings
|
% of Total Net Assets
|
|---|---|
|
IonQ, Inc.
|
|
|
First American Government Obligations Fund - Class X, 4.25%
|
|
|
IonQ, Inc. Swap; Maturity Date: 04/02/2026
|
| * | Percentages for swap contracts are based unrealized appreciation (depreciation). Monthly reset swap values are not presented, as the unrealized appreciation (depreciation) resets at each month-end. |
What were the Fund costs for the past year?
(based on a hypothetical $10,000 investment)
|
Fund Name
|
Costs of a $10,000 investment
|
Costs paid as a percentage of a $10,000 investment
|
|---|---|---|
|
Defiance Daily Target 2X Long LLY ETF
|
$
101
|
1.31
%
|
Costs paid as a percentage of a $10,000 investment is an annualized figure. The Fund commenced operations August 7, 2024. Expenses for a full reporting period would be higher than the figures shown.
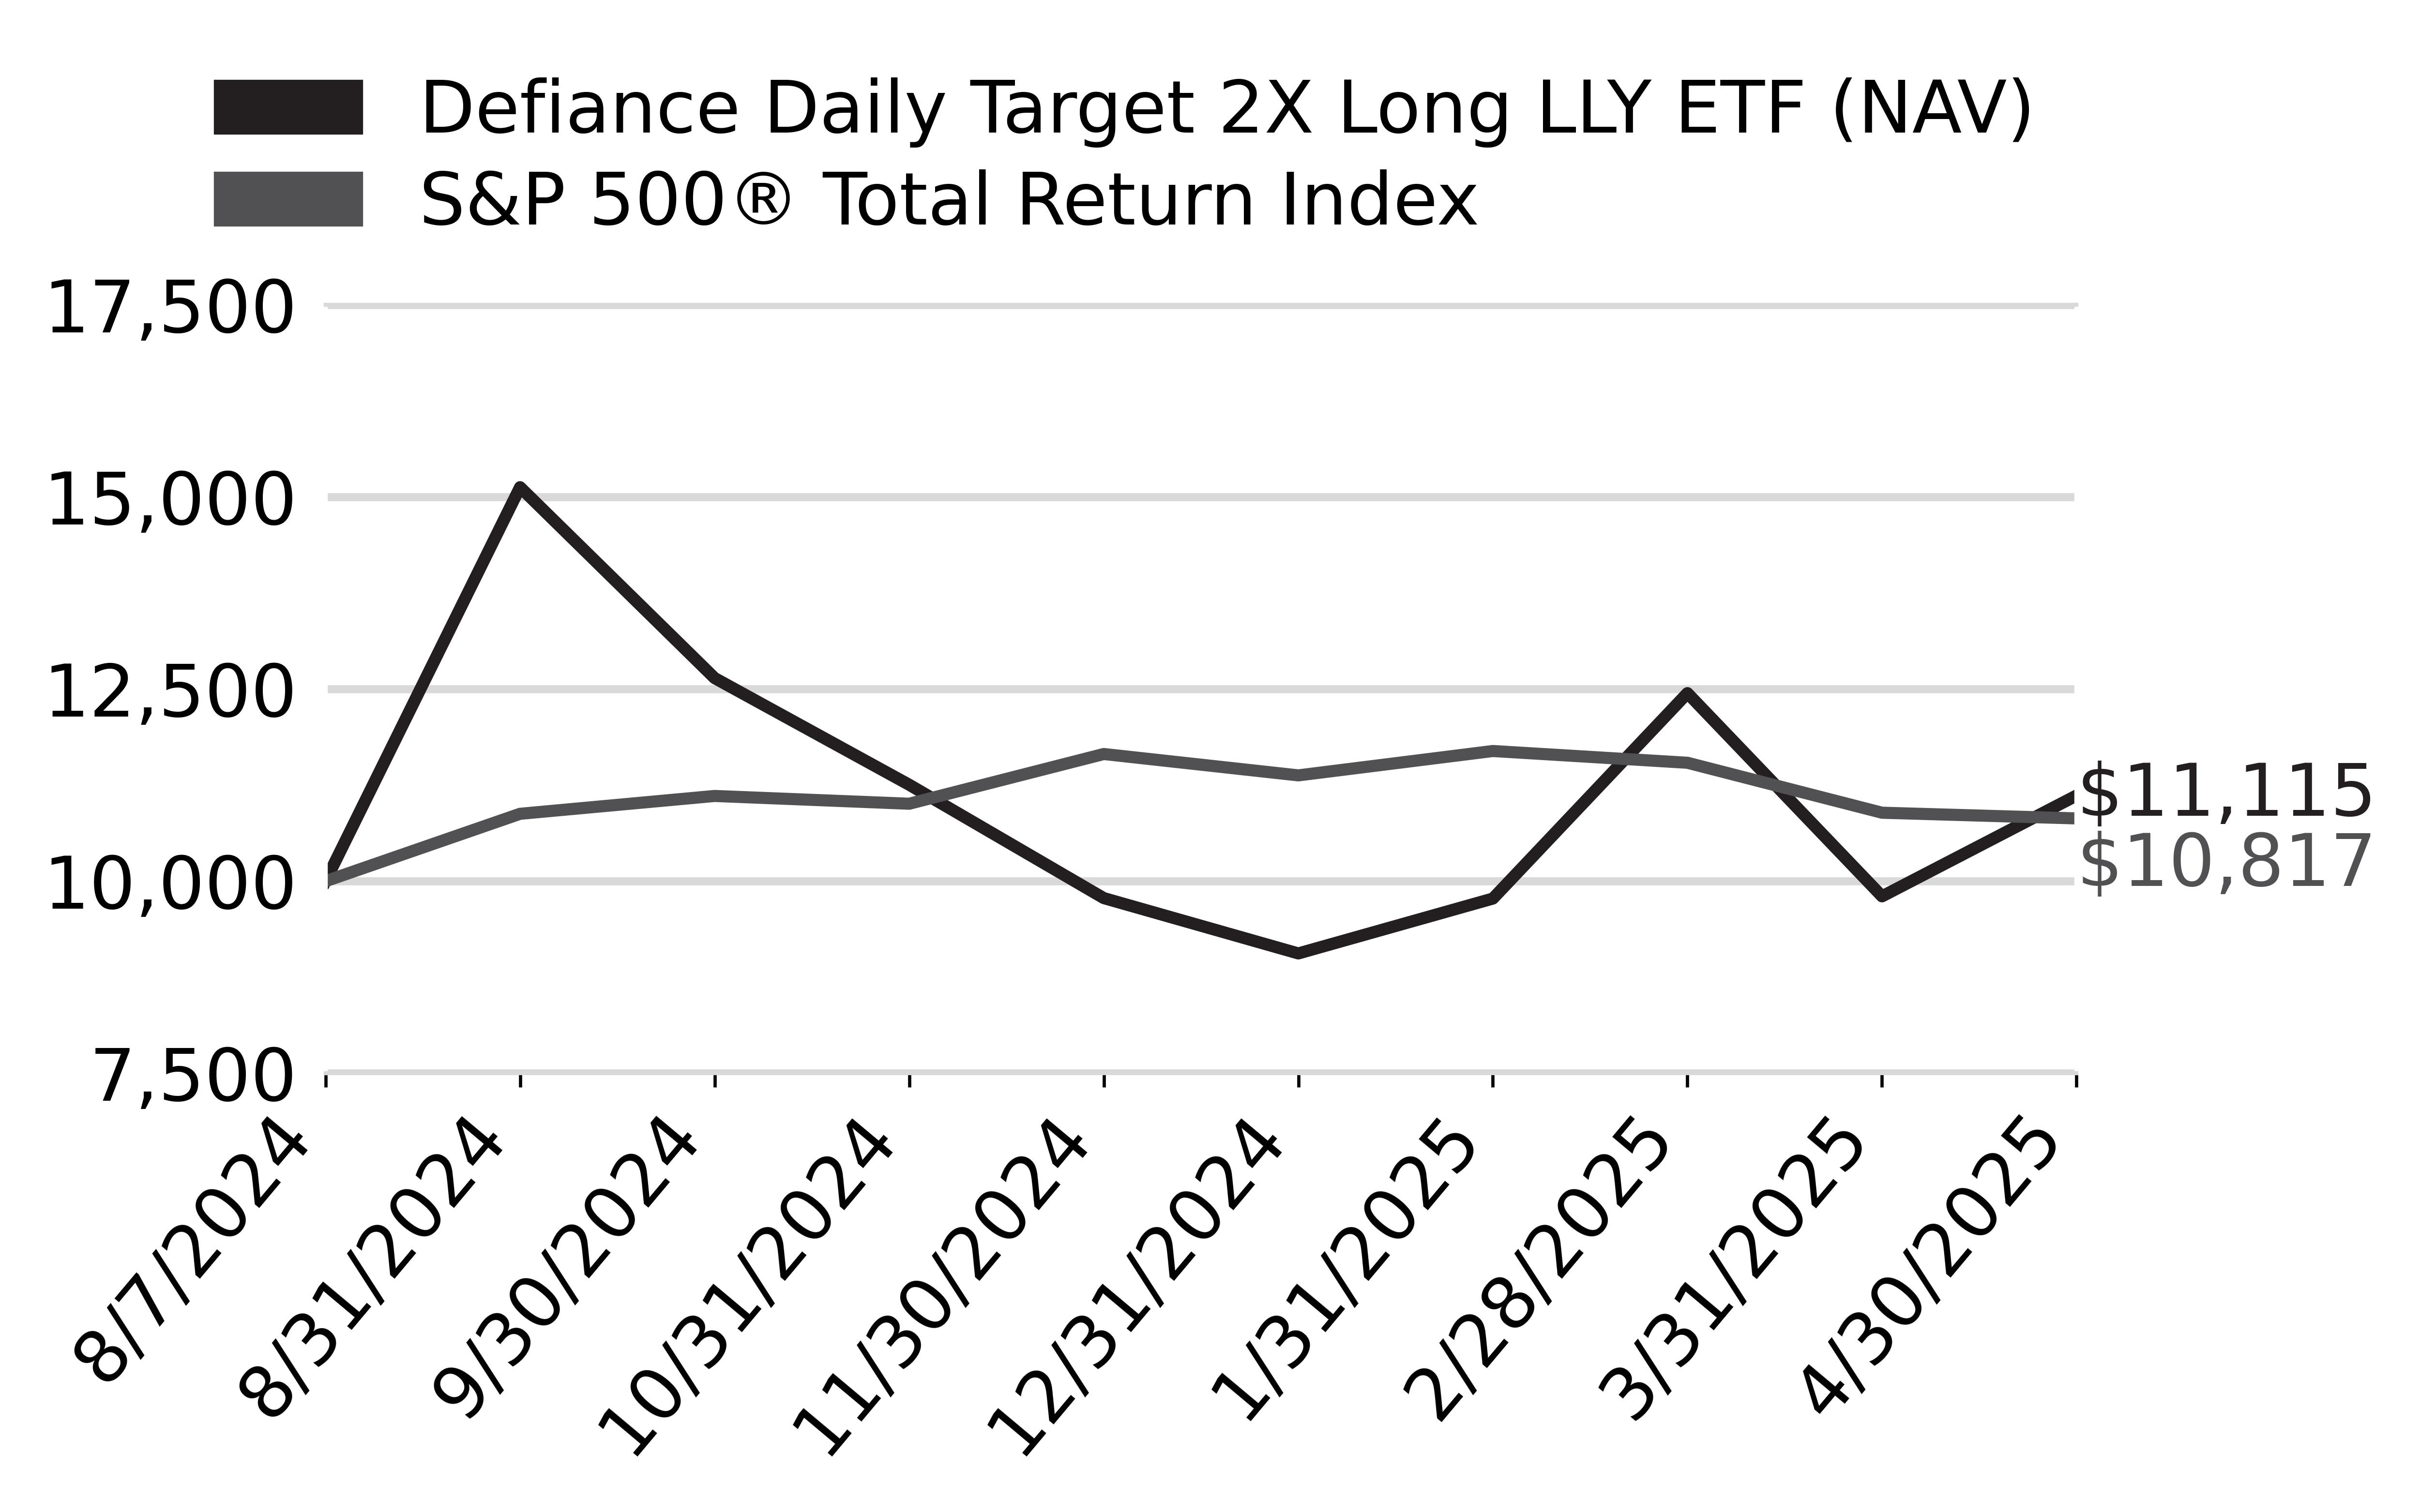
How did the Fund perform last year and what affected its performance?
From inception through 4/30/25, LLYX had a NAV return of 11.16%. LLYX seeks to deliver twice the daily performance of LLY. Therefore, any fluctuations in LLY’s stock price are magnified in LLYX.
What Factors Influenced Performance
The Fund's 2x leverage means that over periods longer than a day, the effects of compounding can lead to returns that deviate significantly from the expected 2x multiple, especially in volatile markets.
High volatility in the underlying stock can exacerbate the compounding effects, leading to greater divergence from the expected performance over time.
Eli Lilly's stock experienced notable highs and lows, driven by product innovations, financial results, and market conditions. Investors closely monitored developments in the company's pharmaceutical pipeline and market performance during this period. Eli Lilly's advancements in weight-loss and diabetes treatments significantly impacted investor sentiment. Additionally, promising results from the weight-loss pill orforglipron contributed to stock movements. The company's financial performance, including revenue and profit figures, influenced stock prices. For instance, a 45% increase in fourth-quarter revenue to $13.53 billion was a positive driver.
Cumulative Performance
(Initial Investment of $10,000)
Annual Performance
|
Returns for the Period ending April 30, 2025
|
Since Inception
8/7/24
|
|---|---|
|
Defiance Daily Target 2X Long LLY ETF - at NAV
|
11.16
%
|
|
S&P 500
®
Total Return Index
|
8.17
%
|
Key Fund Statistics
(as of April 30, 2025 )
|
Fund Size (Thousands)
|
$
19,230
|
|
Number of Holdings
|
5
|
|
Total Advisory Fee
|
$
104,767
|
|
Portfolio Turnover
|
1,232
%
|
What did the Fund invest in?
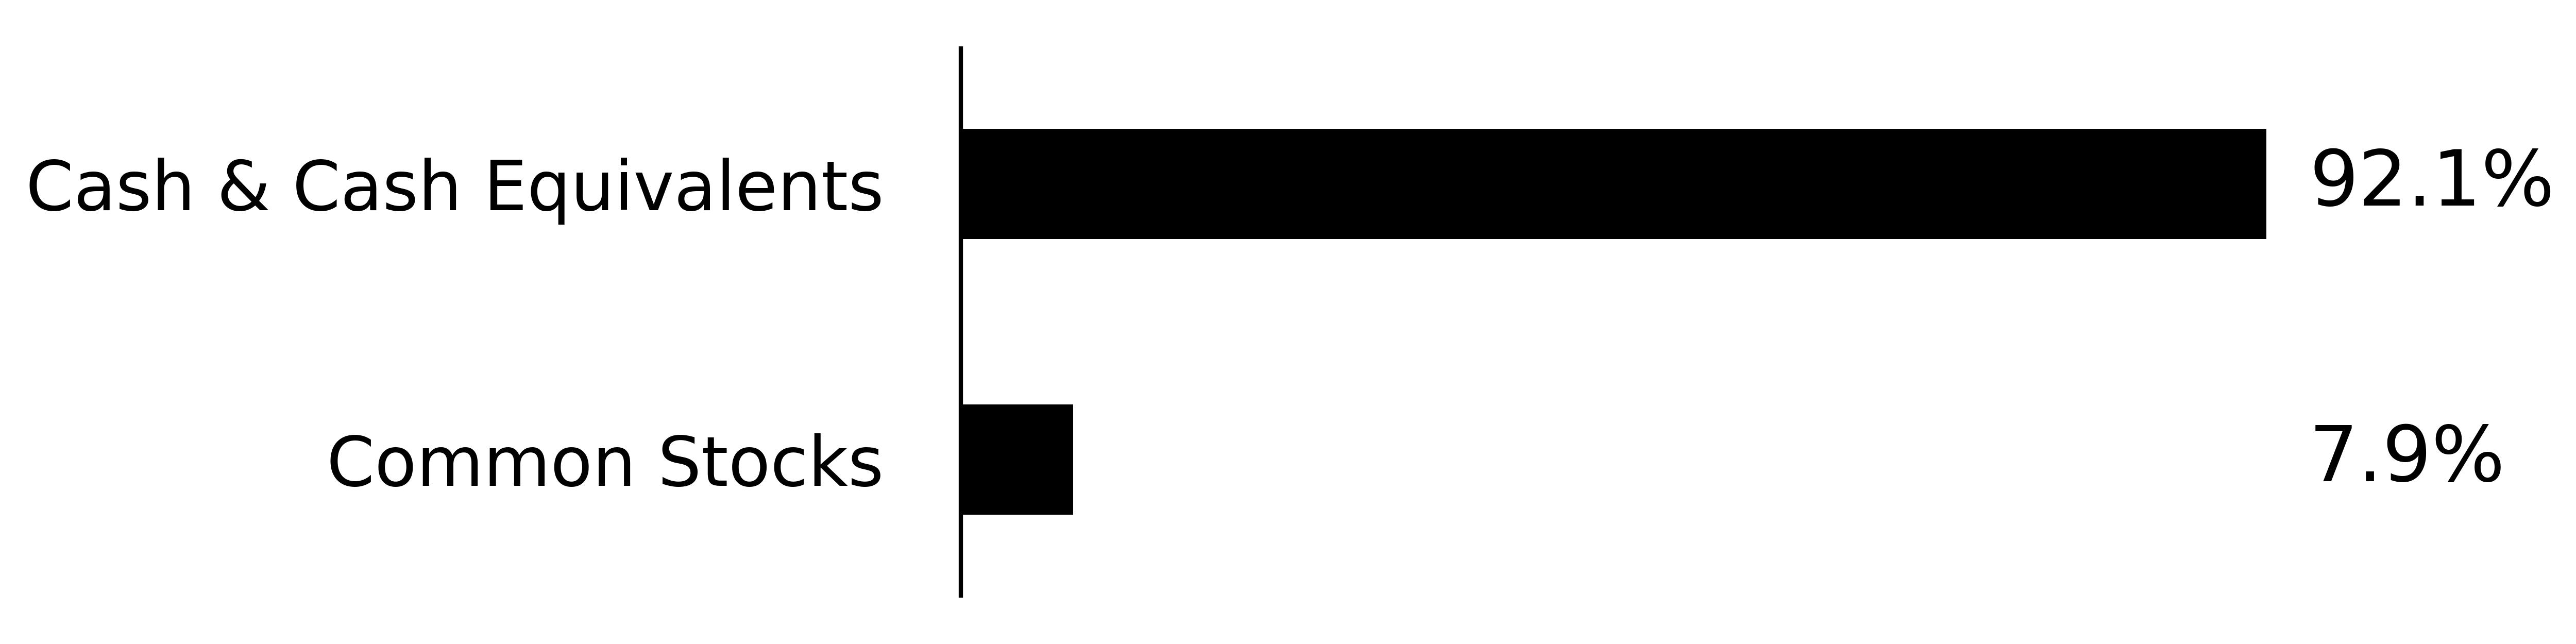
(as of April 30, 2025 )
Security Type (% of net assets)

Security Type - Other Financial Instruments
(% of net assets)
Percentages are based on total net assets. Percentages for swap contracts are based unrealized appreciation (depreciation). Monthly reset swap values are not presented, as the unrealized appreciation (depreciation) resets at each month-end. Cash & Cash Equivalents represents short-term investments and other assets in excess of liabilities.
|
Top Holdings
|
% of Total Net Assets
|
|---|---|
|
Eli Lilly & Co. Swap; Maturity Date: 09/08/2025
|
|
|
Eli Lilly & Co.
|
|
|
First American Government Obligations Fund - Class X, 4.25%
|
|
|
Eli Lilly & Co. Swap; Maturity Date: 05/19/2026
|
|
|
Eli Lilly & Co. Swap; Maturity Date: 11/10/2025
|
| * | Percentages for swap contracts are based unrealized appreciation (depreciation). Monthly reset swap values are not presented, as the unrealized appreciation (depreciation) resets at each month-end. |
What were the Fund costs for the past year?
(based on a hypothetical $10,000 investment)
|
Fund Name
|
Costs of a $10,000 investment
|
Costs paid as a percentage of a $10,000 investment
|
|---|---|---|
|
Defiance Daily Target 2X Long MSTR ETF
|
$
173
|
1.30
%
|
Costs paid as a percentage of a $10,000 investment is an annualized figure. The Fund commenced operations August 14, 2024. Expenses for a full reporting period would be higher than the figures shown.
How did the Fund perform last year and what affected its performance?
From inception through 4/30/25, MSTX had a NAV total return of 175.98%. These gains are primarily attributed to the strong performance of MSTR, which is closely tied to Bitcoin's price movements. Initially launched with 1.75x leverage, MSTX increased its leverage to 2x on October 29, 2024, to meet investor demand for higher exposure. The fund utilizes derivatives, such as swap agreements, to achieve its leverage. Limitations in the availability or pricing of these derivatives can affect the fund's ability to maintain its targeted exposure which resulted in the frequent utilization of options – both standard listed and flex. MSTX employs daily leverage, aiming for 2x the daily return of MSTR. In volatile markets, this can lead to 'volatility drag,' where the fund's performance diverges negatively from the expected multiple over longer periods.
What Factors Influenced Performance
The Fund's 2x leverage means that over periods longer than a day, the effects of compounding can lead to returns that deviate significantly from the expected 2x multiple, especially in volatile markets.
High volatility in the underlying stock can exacerbate the compounding effects, leading to greater divergence from the expected performance over time.
MicroStrategy's stock demonstrated significant volatility, largely driven by its Bitcoin investment strategy and the broader cryptocurrency market dynamics. The company's aggressive accumulation of Bitcoin, strategic capital raising, and market sentiment have all played pivotal roles in shaping its stock performance during this period. MicroStrategy's significant Bitcoin holdings made its stock highly sensitive to cryptocurrency market trends. The stock's rise to its November peak coincided with Bitcoin's rally, while subsequent declines mirrored Bitcoin's volatility. MicroStrategy's statements from its executives reaffirming their commitment to a Bitcoin-centric strategy impacted investor confidence and stock valuation.
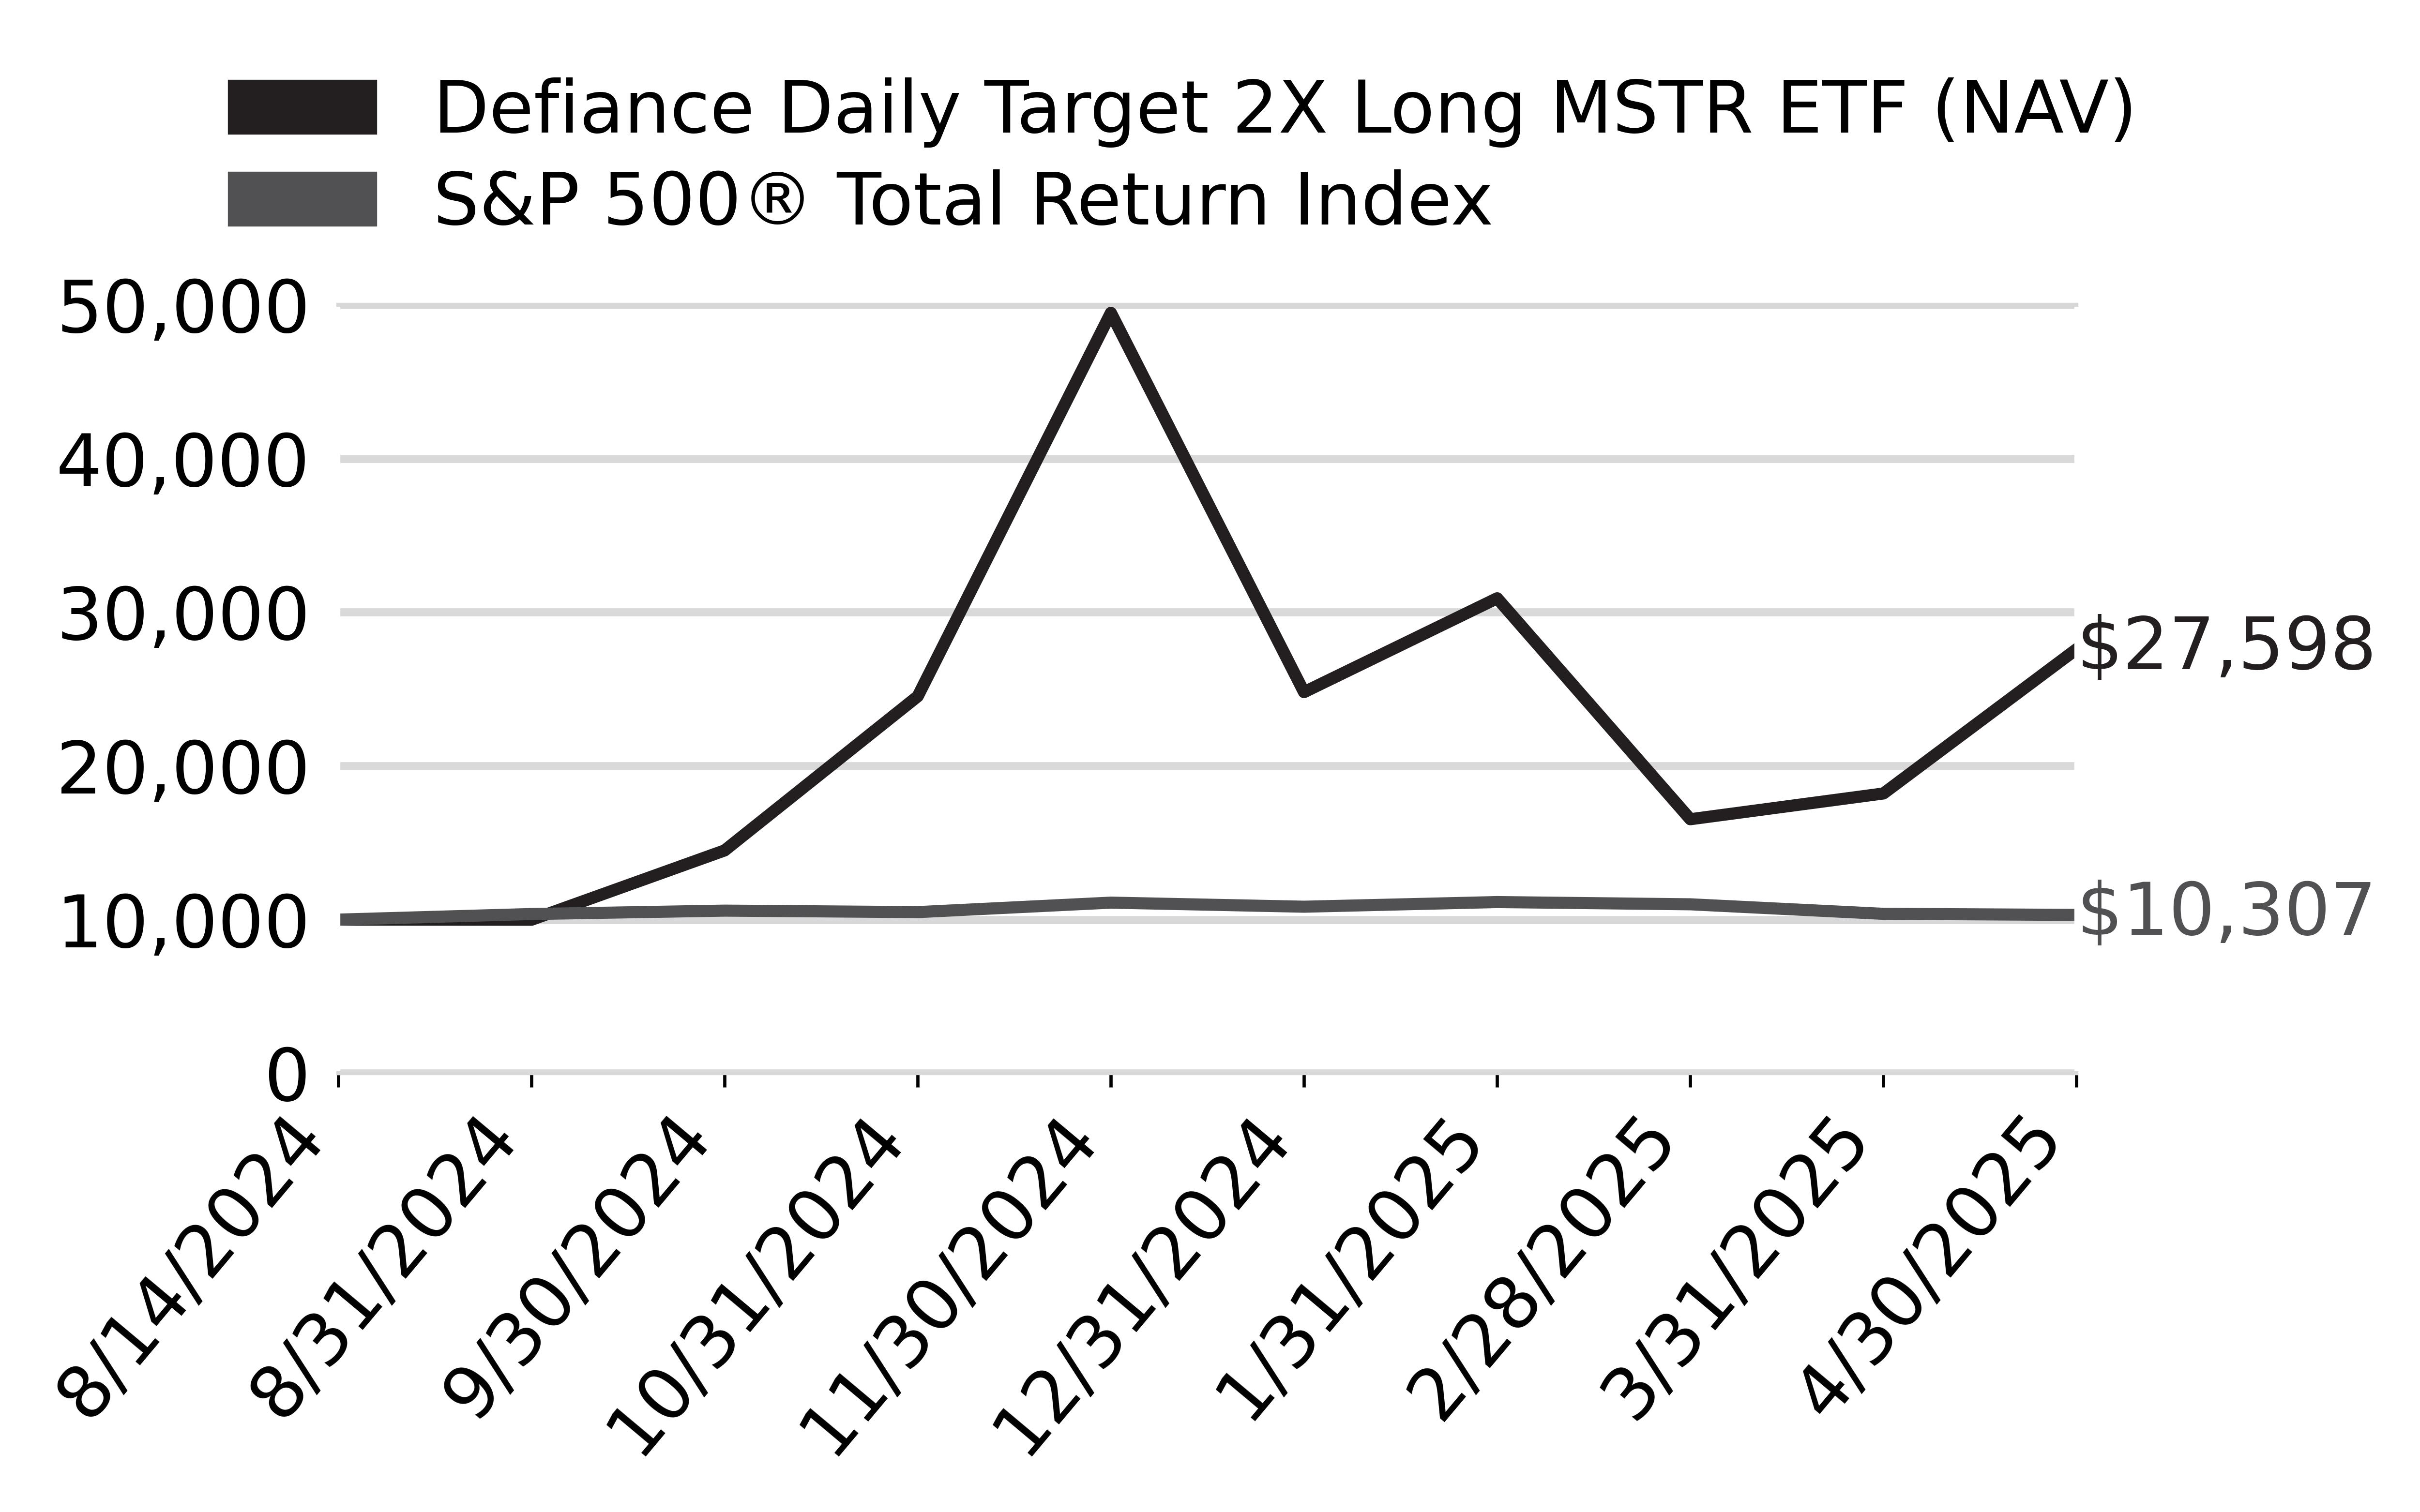
Cumulative Performance
(Initial Investment of $10,000)
Annual Performance
|
Returns for the Period ending April 30, 2025
|
Since Inception
8/14/24
|
|---|---|
|
Defiance Daily Target 2X Long MSTR ETF - at NAV
|
175.98
%
|
|
S&P 500
®
Total Return Index
|
3.07
%
|
Key Fund Statistics
(as of April 30, 2025 )
|
Fund Size (Thousands)
|
$
1,666,424
|
|
Number of Holdings
|
9
|
|
Total Advisory Fee
|
$
9,081,075
|
|
Portfolio Turnover
|
4,006
%
|
What did the Fund invest in?
(as of April 30, 2025 )
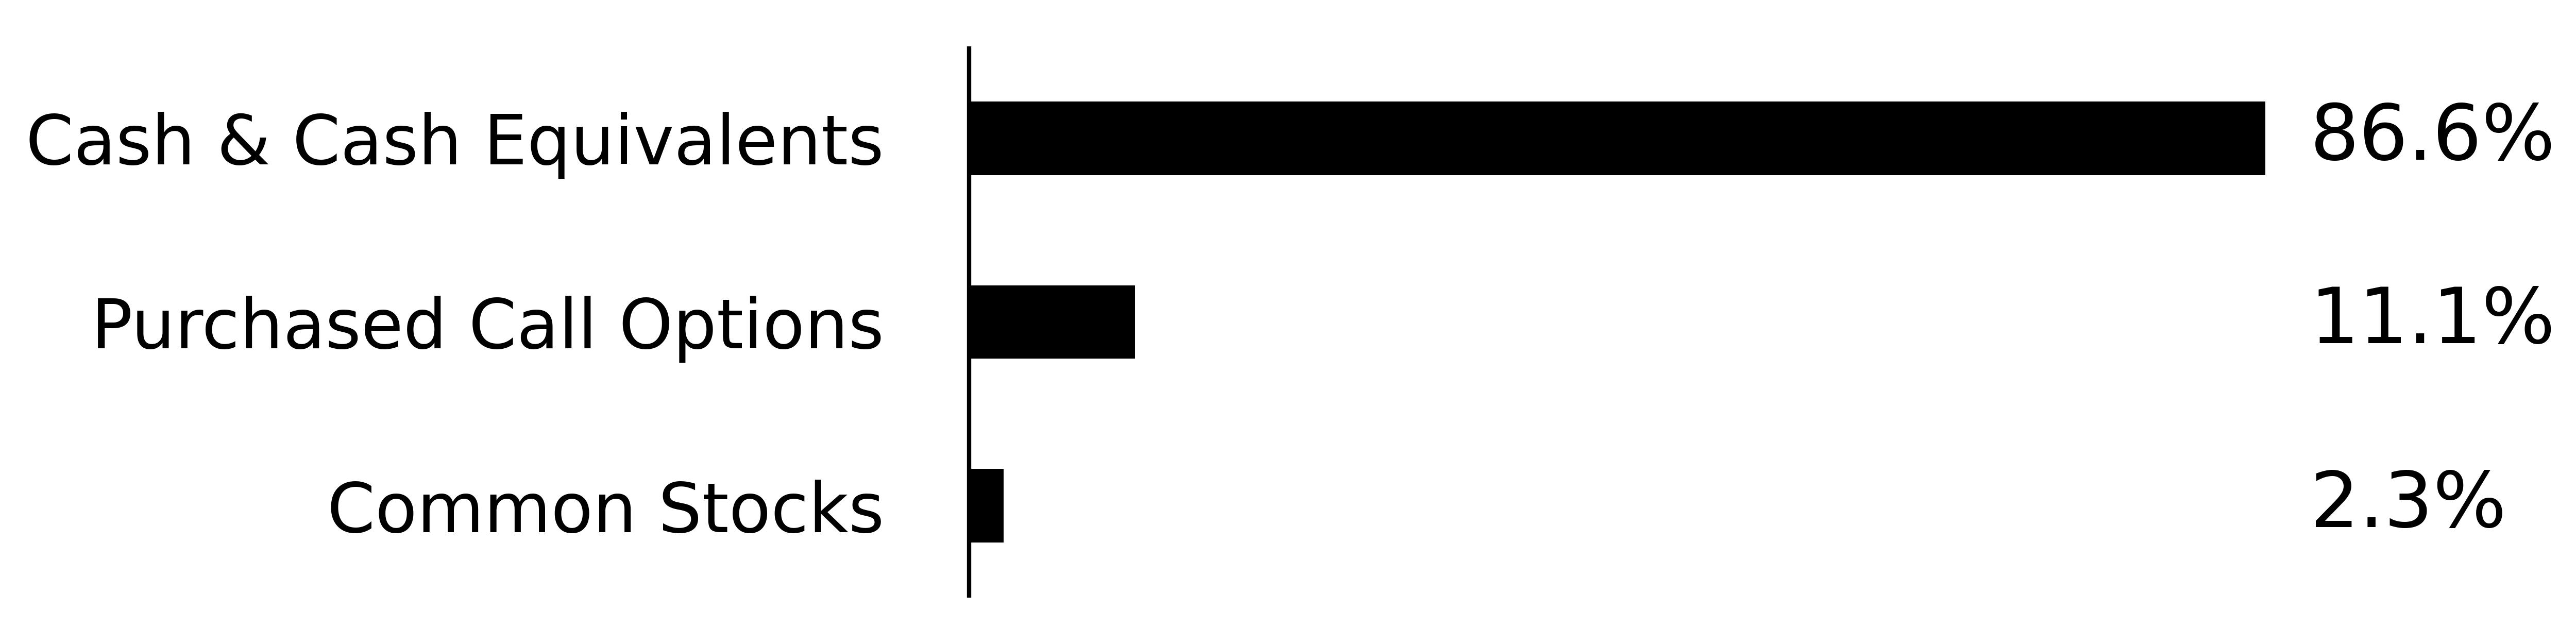
Security Type (% of net assets)
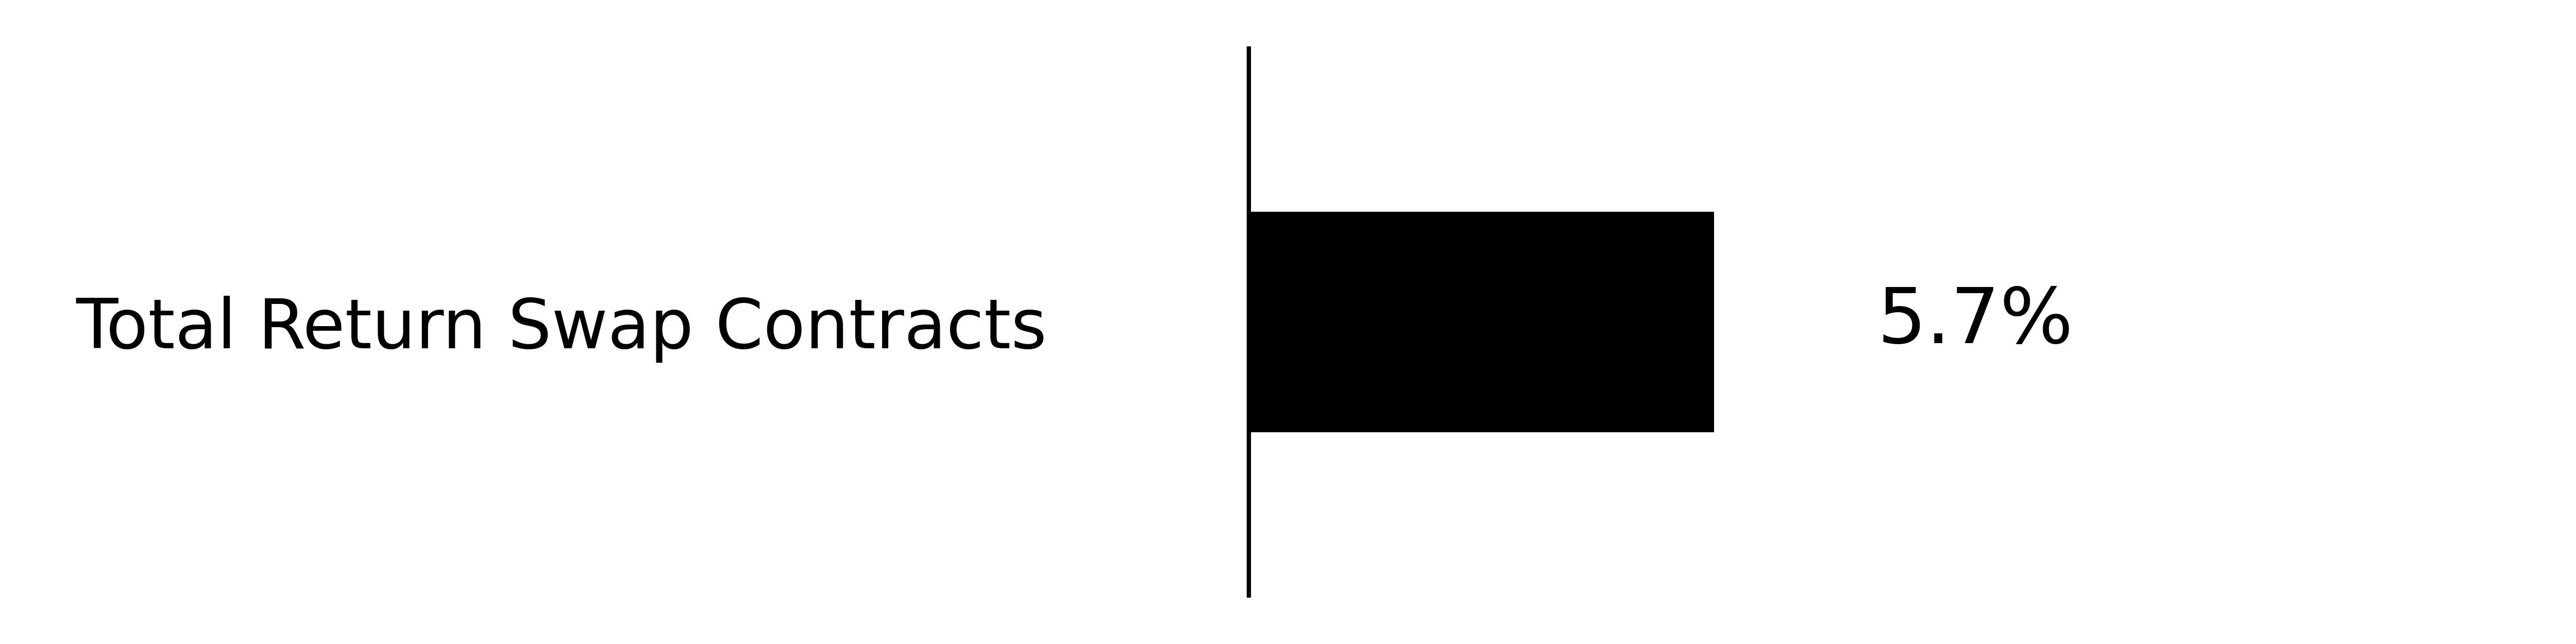
Security Type - Other Financial Instruments
(% of net assets)
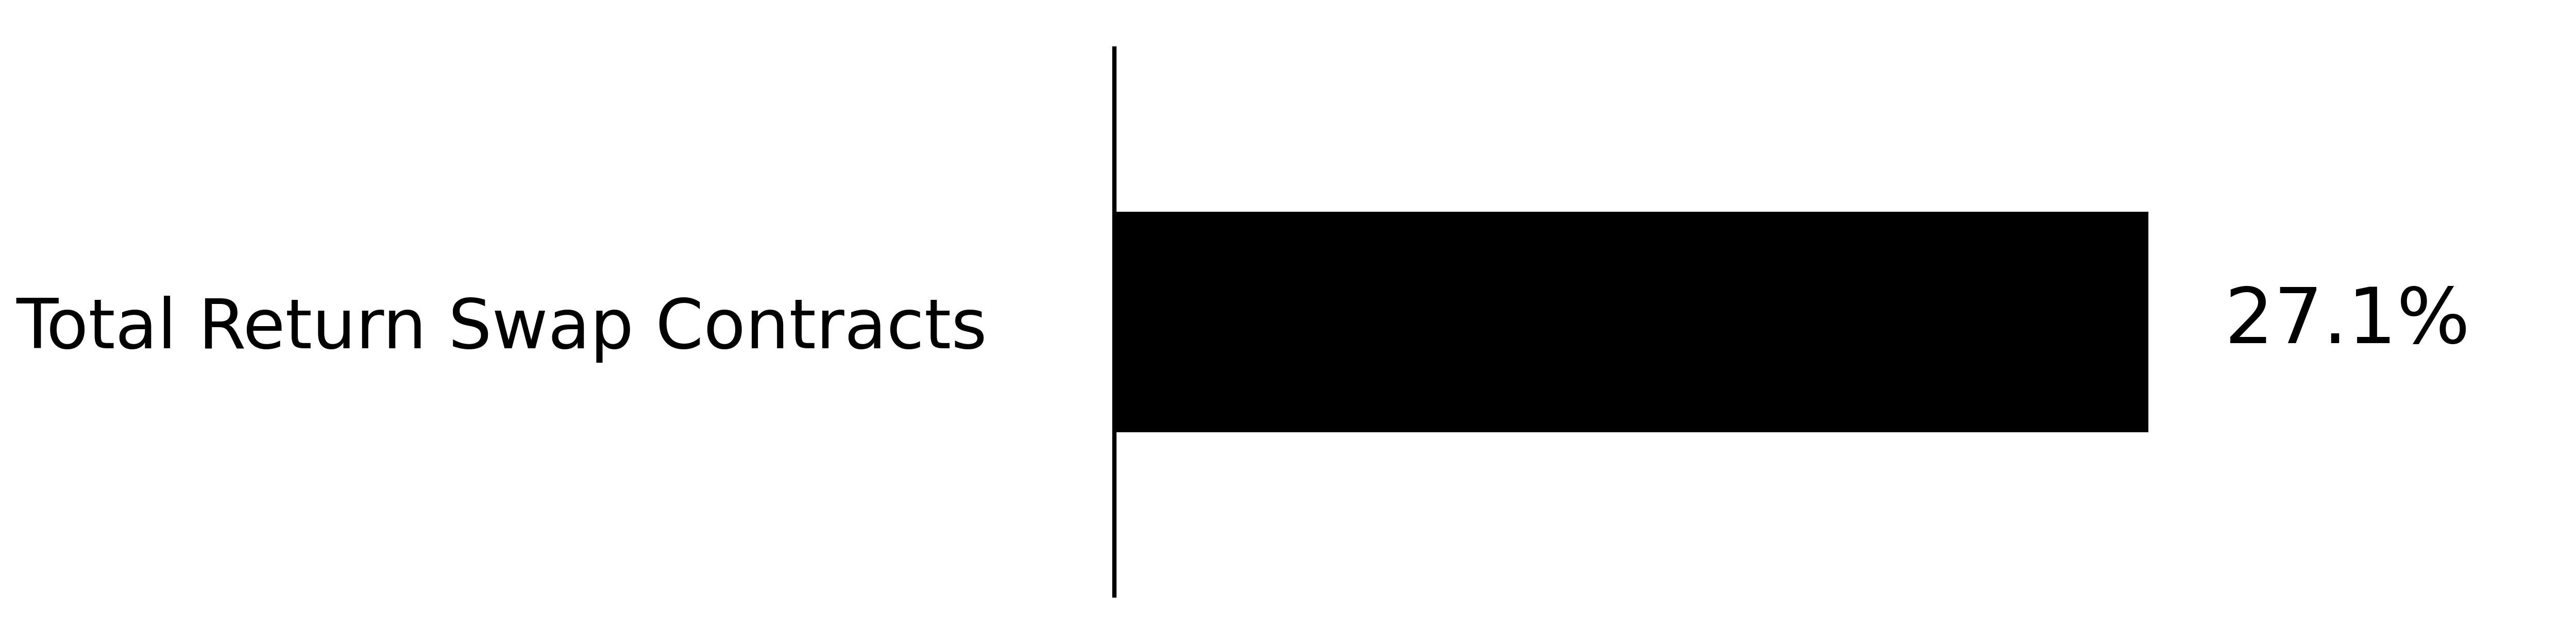
Percentages are based on total net assets. Percentages for swap contracts are based unrealized appreciation (depreciation). Monthly reset swap values are not presented, as the unrealized appreciation (depreciation) resets at each month-end. Cash & Cash Equivalents represents short-term investments and other assets in excess of liabilities.
|
Top Holdings
|
% of Total Net Assets
|
|---|---|
|
Microstrategy, Inc. Swap; Maturity Date: 10/22/2025
|
|
|
First American Government Obligations Fund - Class X, 4.25%
|
|
|
MicroStrategy Inc. Option, Expiration: 05/02/2025; Exercise Price: $300.01
|
|
|
Dreyfus Government Cash Management - Class Institutional, 4.21%
|
|
|
Microstrategy, Inc. Swap; Maturity Date: 03/06/2026
|
|
|
MicroStrategy, Inc. Option, Expiration: 05/05/2025; Exercise Price: $300.01
|
|
|
MicroStrategy, Inc. - Class A
|
|
|
Microstrategy, Inc. Swap; Maturity Date: 05/29/2026
|
|
|
Microstrategy, Inc. Swap; Maturity Date: 09/15/2025
|
| * | Percentages for swap contracts are based unrealized appreciation (depreciation). Monthly reset swap values are not presented, as the unrealized appreciation (depreciation) resets at each month-end. |
What were the Fund costs for the past year?
(based on a hypothetical $10,000 investment)
|
Fund Name
|
Costs of a $10,000 investment
|
Costs paid as a percentage of a $10,000 investment
|
|---|---|---|
|
Defiance Daily Target 2X Long NVO ETF
|
$
35
|
1.29
%
|
Costs paid as a percentage of a $10,000 investment is an annualized figure. The Fund commenced operations December 2, 2024. Expenses for a full reporting period would be higher than the figures shown.
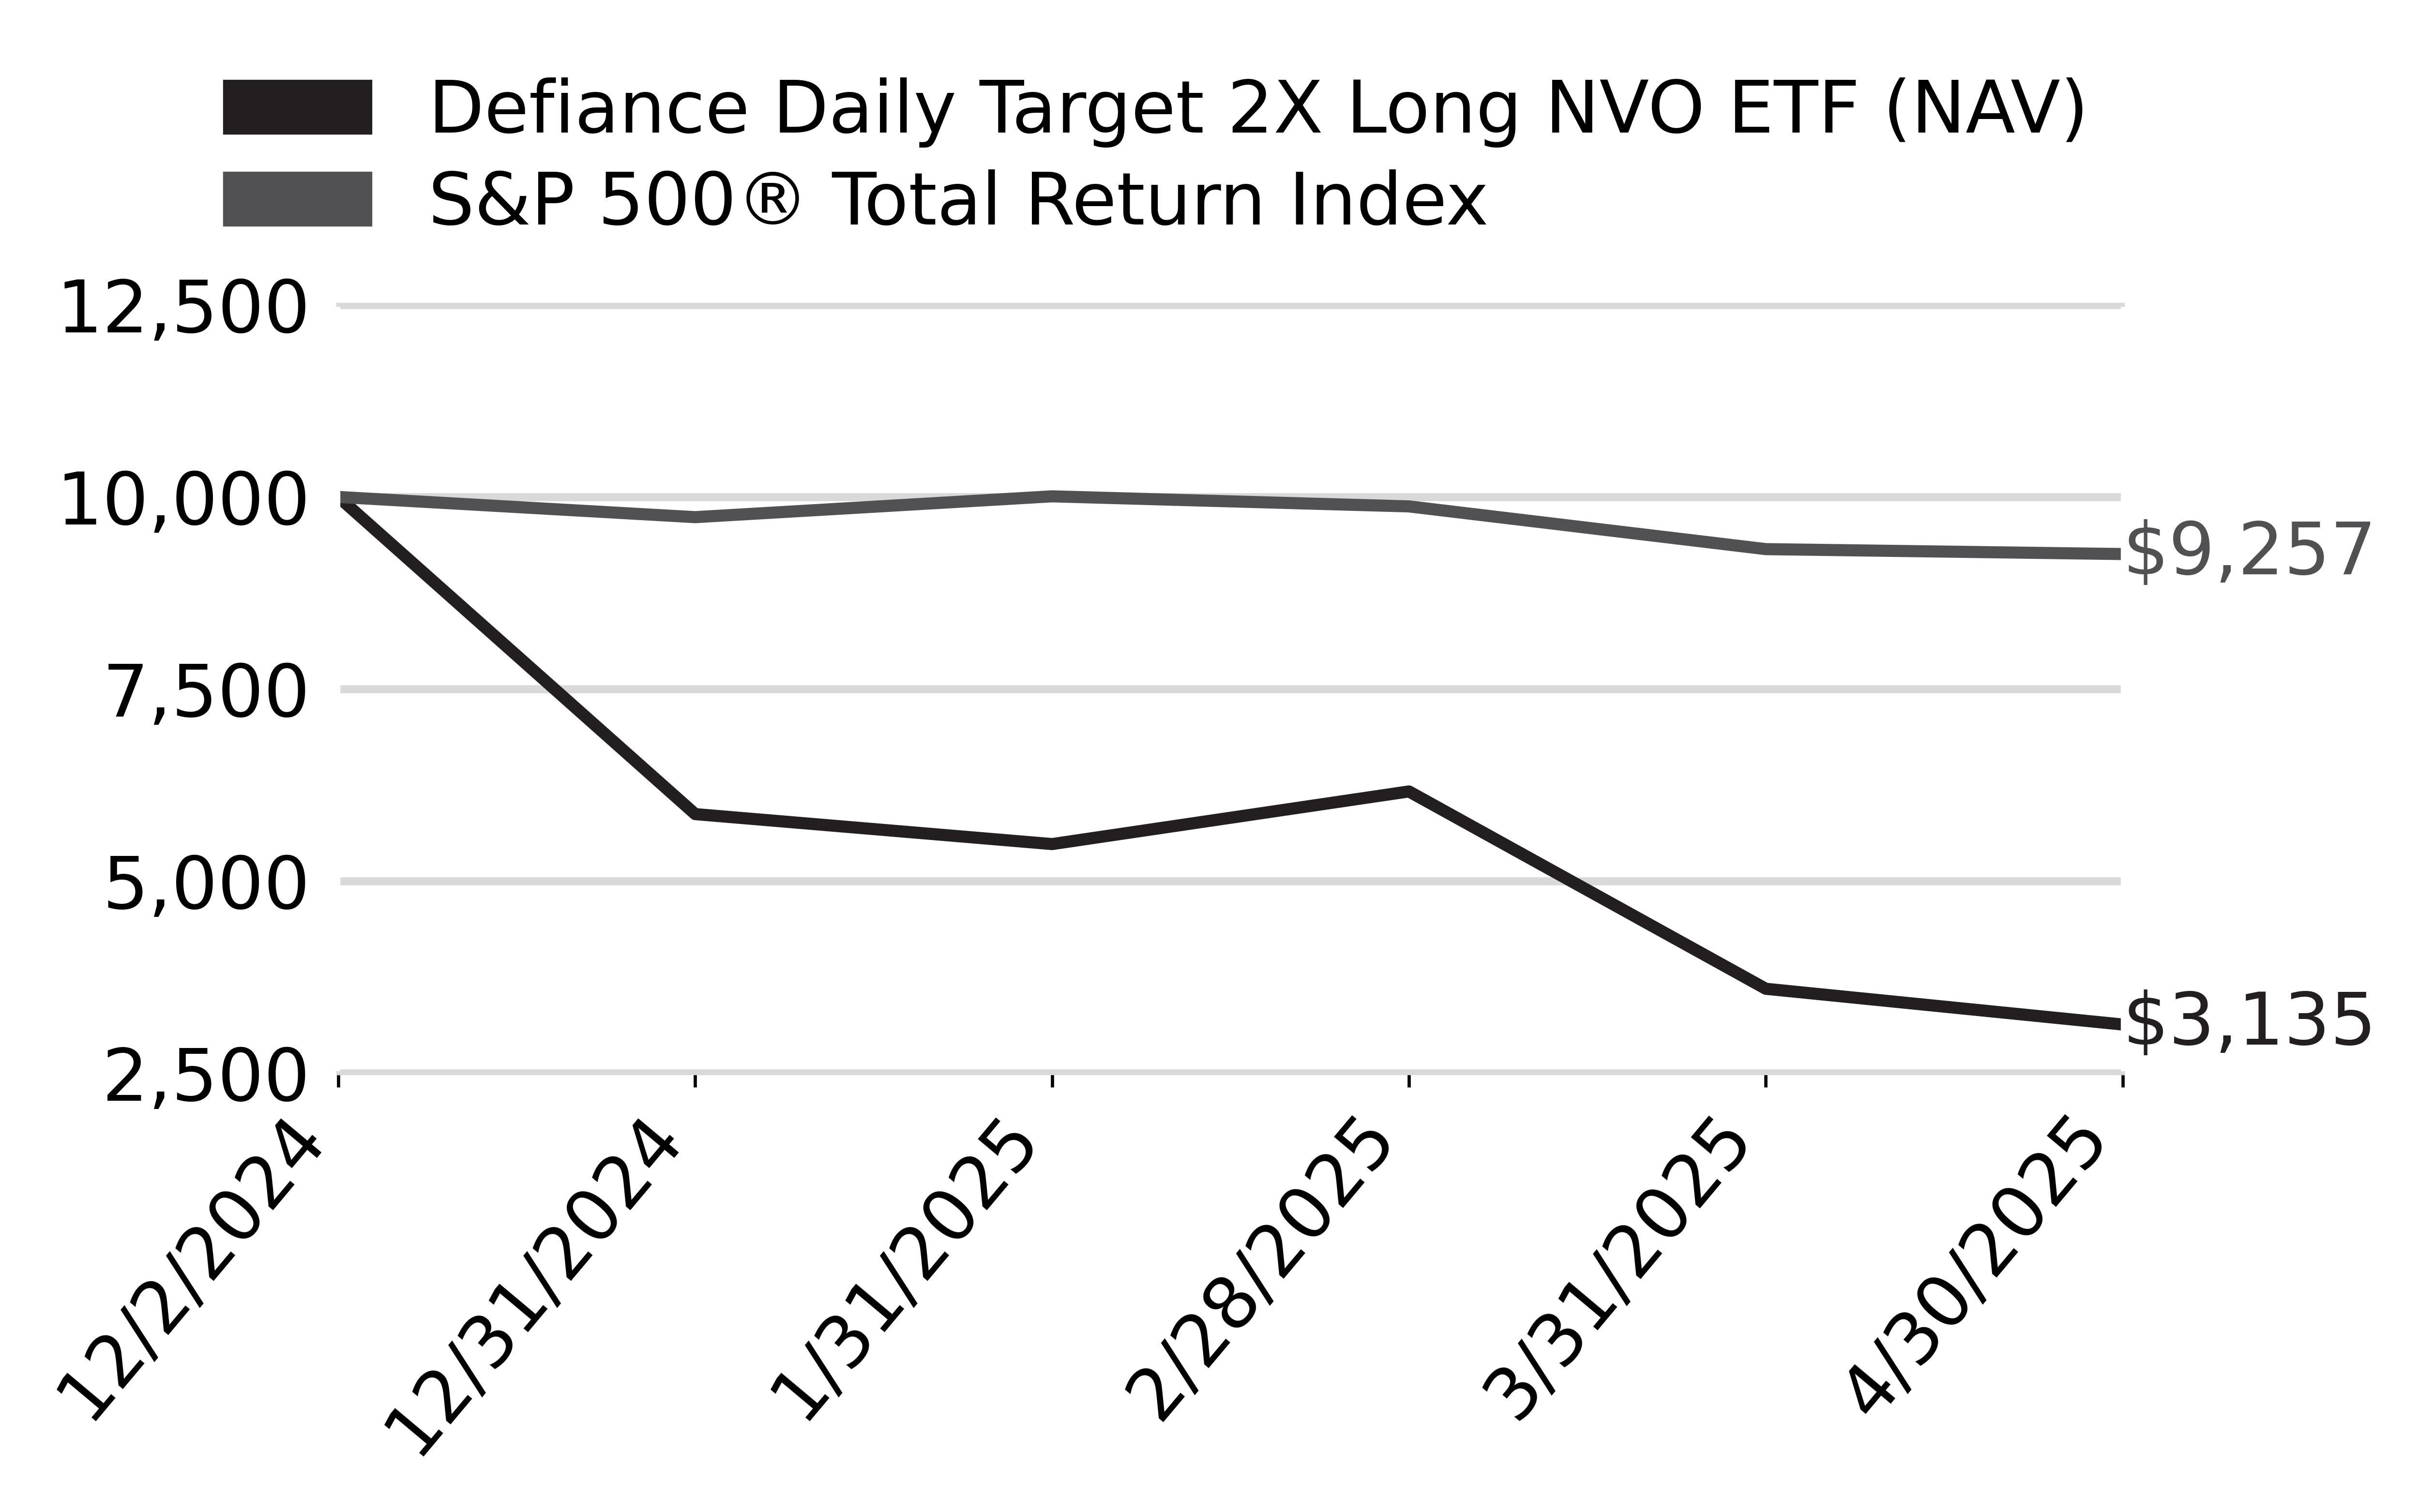
How did the Fund perform last year and what affected its performance?
From inception through 4/30/25, NVOX had a NAV return of -68.70%. NVOX seeks to deliver twice the daily performance of NVO. Therefore, any fluctuations in NVO’s stock price are magnified in NVOX. Leveraged ETFs like NVOX reset their exposure daily. In volatile or sideways markets, this daily rebalancing can lead to 'volatility drag,' where the ETF's performance diverges negatively from the expected multiple of the underlying asset's return.
What Factors Influenced Performance
The Fund's 2x leverage means that over periods longer than a day, the effects of compounding can lead to returns that deviate significantly from the expected 2x multiple, especially in volatile markets.
High volatility in the underlying stock can exacerbate the compounding effects, leading to greater divergence from the expected performance over time.
Novo Nordisk's performance was impacted by increased competition in the weight-loss drug market, regulatory challenges in the U.S., leadership changes, and setbacks in product development. While the company demonstrated strong financial results in Q1, these external factors contributed to investor caution and stock volatility during this period.
Cumulative Performance
(Initial Investment of $10,000)
Annual Performance
|
Returns for the Period ending April 30, 2025
|
Since Inception
12/2/24
|
|---|---|
|
Defiance Daily Target 2X Long NVO ETF - at NAV
|
-
68.70
%
|
|
S&P 500
®
Total Return Index
|
-
7.43
%
|
Key Fund Statistics
(as of April 30, 2025 )
|
Fund Size (Thousands)
|
$
3,415
|
|
Number of Holdings
|
4
|
|
Total Advisory Fee
|
$
11,876
|
|
Portfolio Turnover
|
508
%
|
What did the Fund invest in?
(as of April 30, 2025 )
Security Type (% of net assets)

Security Type - Other Financial Instruments
(% of net assets)
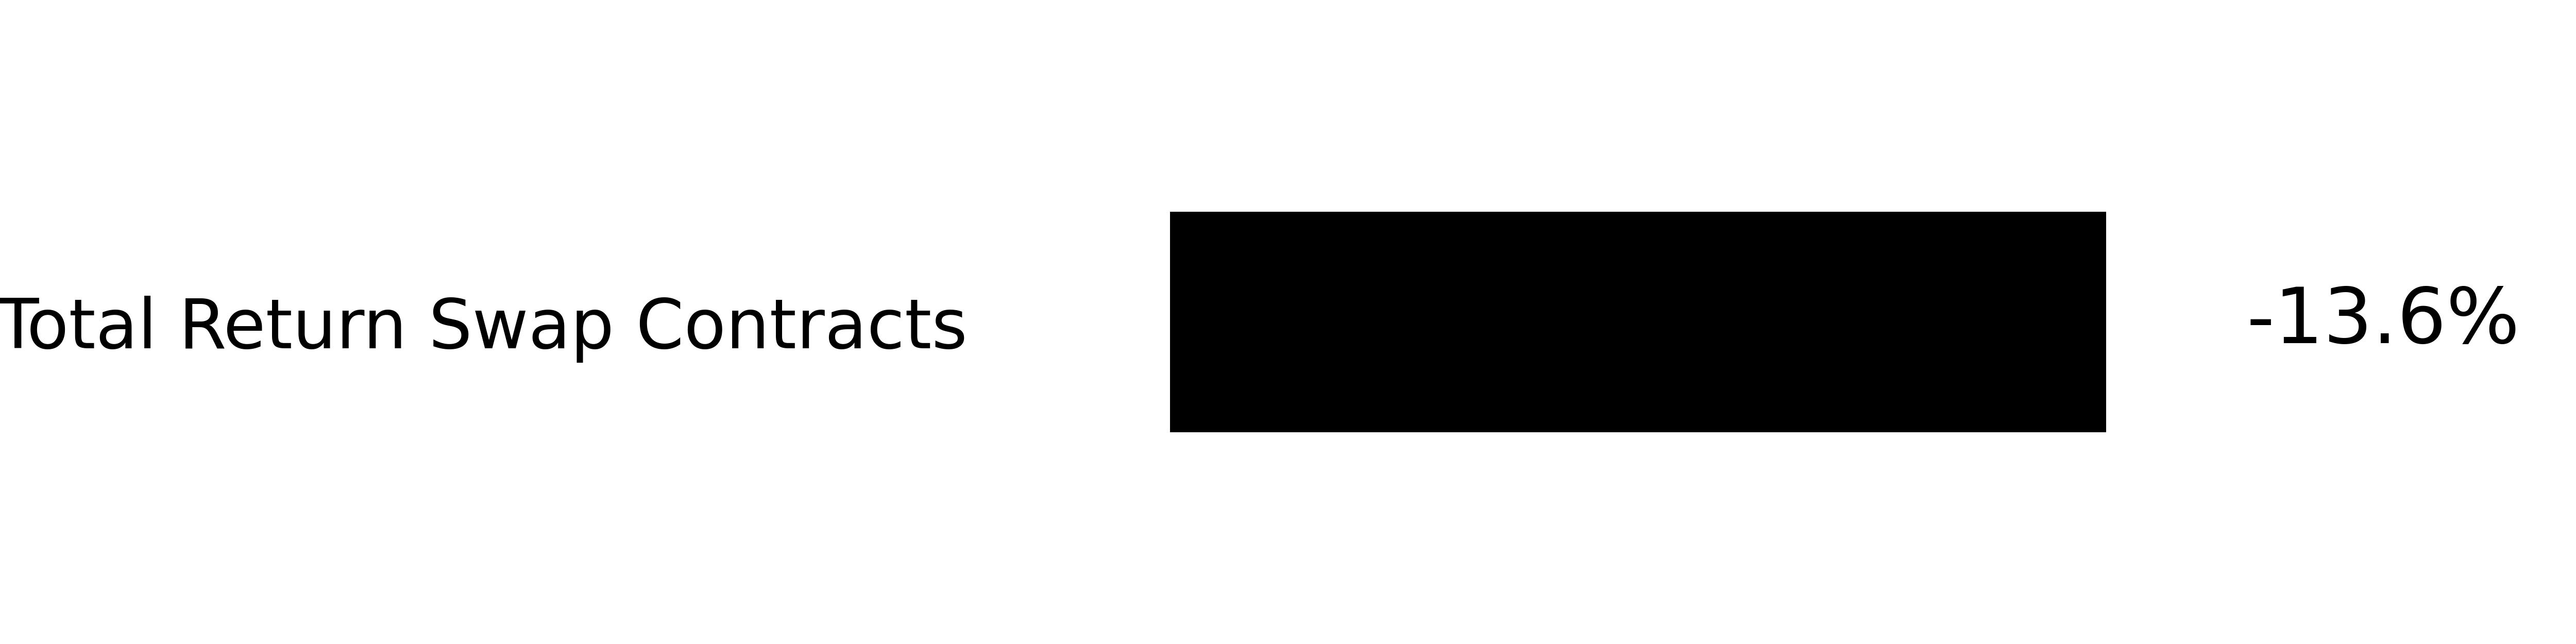
Percentages are based on total net assets. Percentages for swap contracts are based unrealized appreciation (depreciation). Monthly reset swap values are not presented, as the unrealized appreciation (depreciation) resets at each month-end. Cash & Cash Equivalents represents short-term investments and other assets in excess of liabilities.
|
Top Holdings
|
% of Total Net Assets
|
|---|---|
|
Novo Nordisk AS Swap; Maturity Date: 01/12/2026
|
|
|
First American Government Obligations Fund - Class X, 4.25%
|
|
|
Novo Nordisk AS - ADR
|
|
|
Novo Nordisk AS Swap; Maturity Date: 01/05/2026
|
| * | Percentages for swap contracts are based unrealized appreciation (depreciation). Monthly reset swap values are not presented, as the unrealized appreciation (depreciation) resets at each month-end. |
What were the Fund costs for the past year?
(based on a hypothetical $10,000 investment)
|
Fund Name
|
Costs of a $10,000 investment
|
Costs paid as a percentage of a $10,000 investment
|
|---|---|---|
|
Defiance Daily Target 2X Long ORCL ETF
|
$
25
|
1.36
%
|
Costs paid as a percentage of a $10,000 investment is an annualized figure. The Fund commenced operations February 6, 2025. Expenses for a full reporting period would be higher than the figures shown.
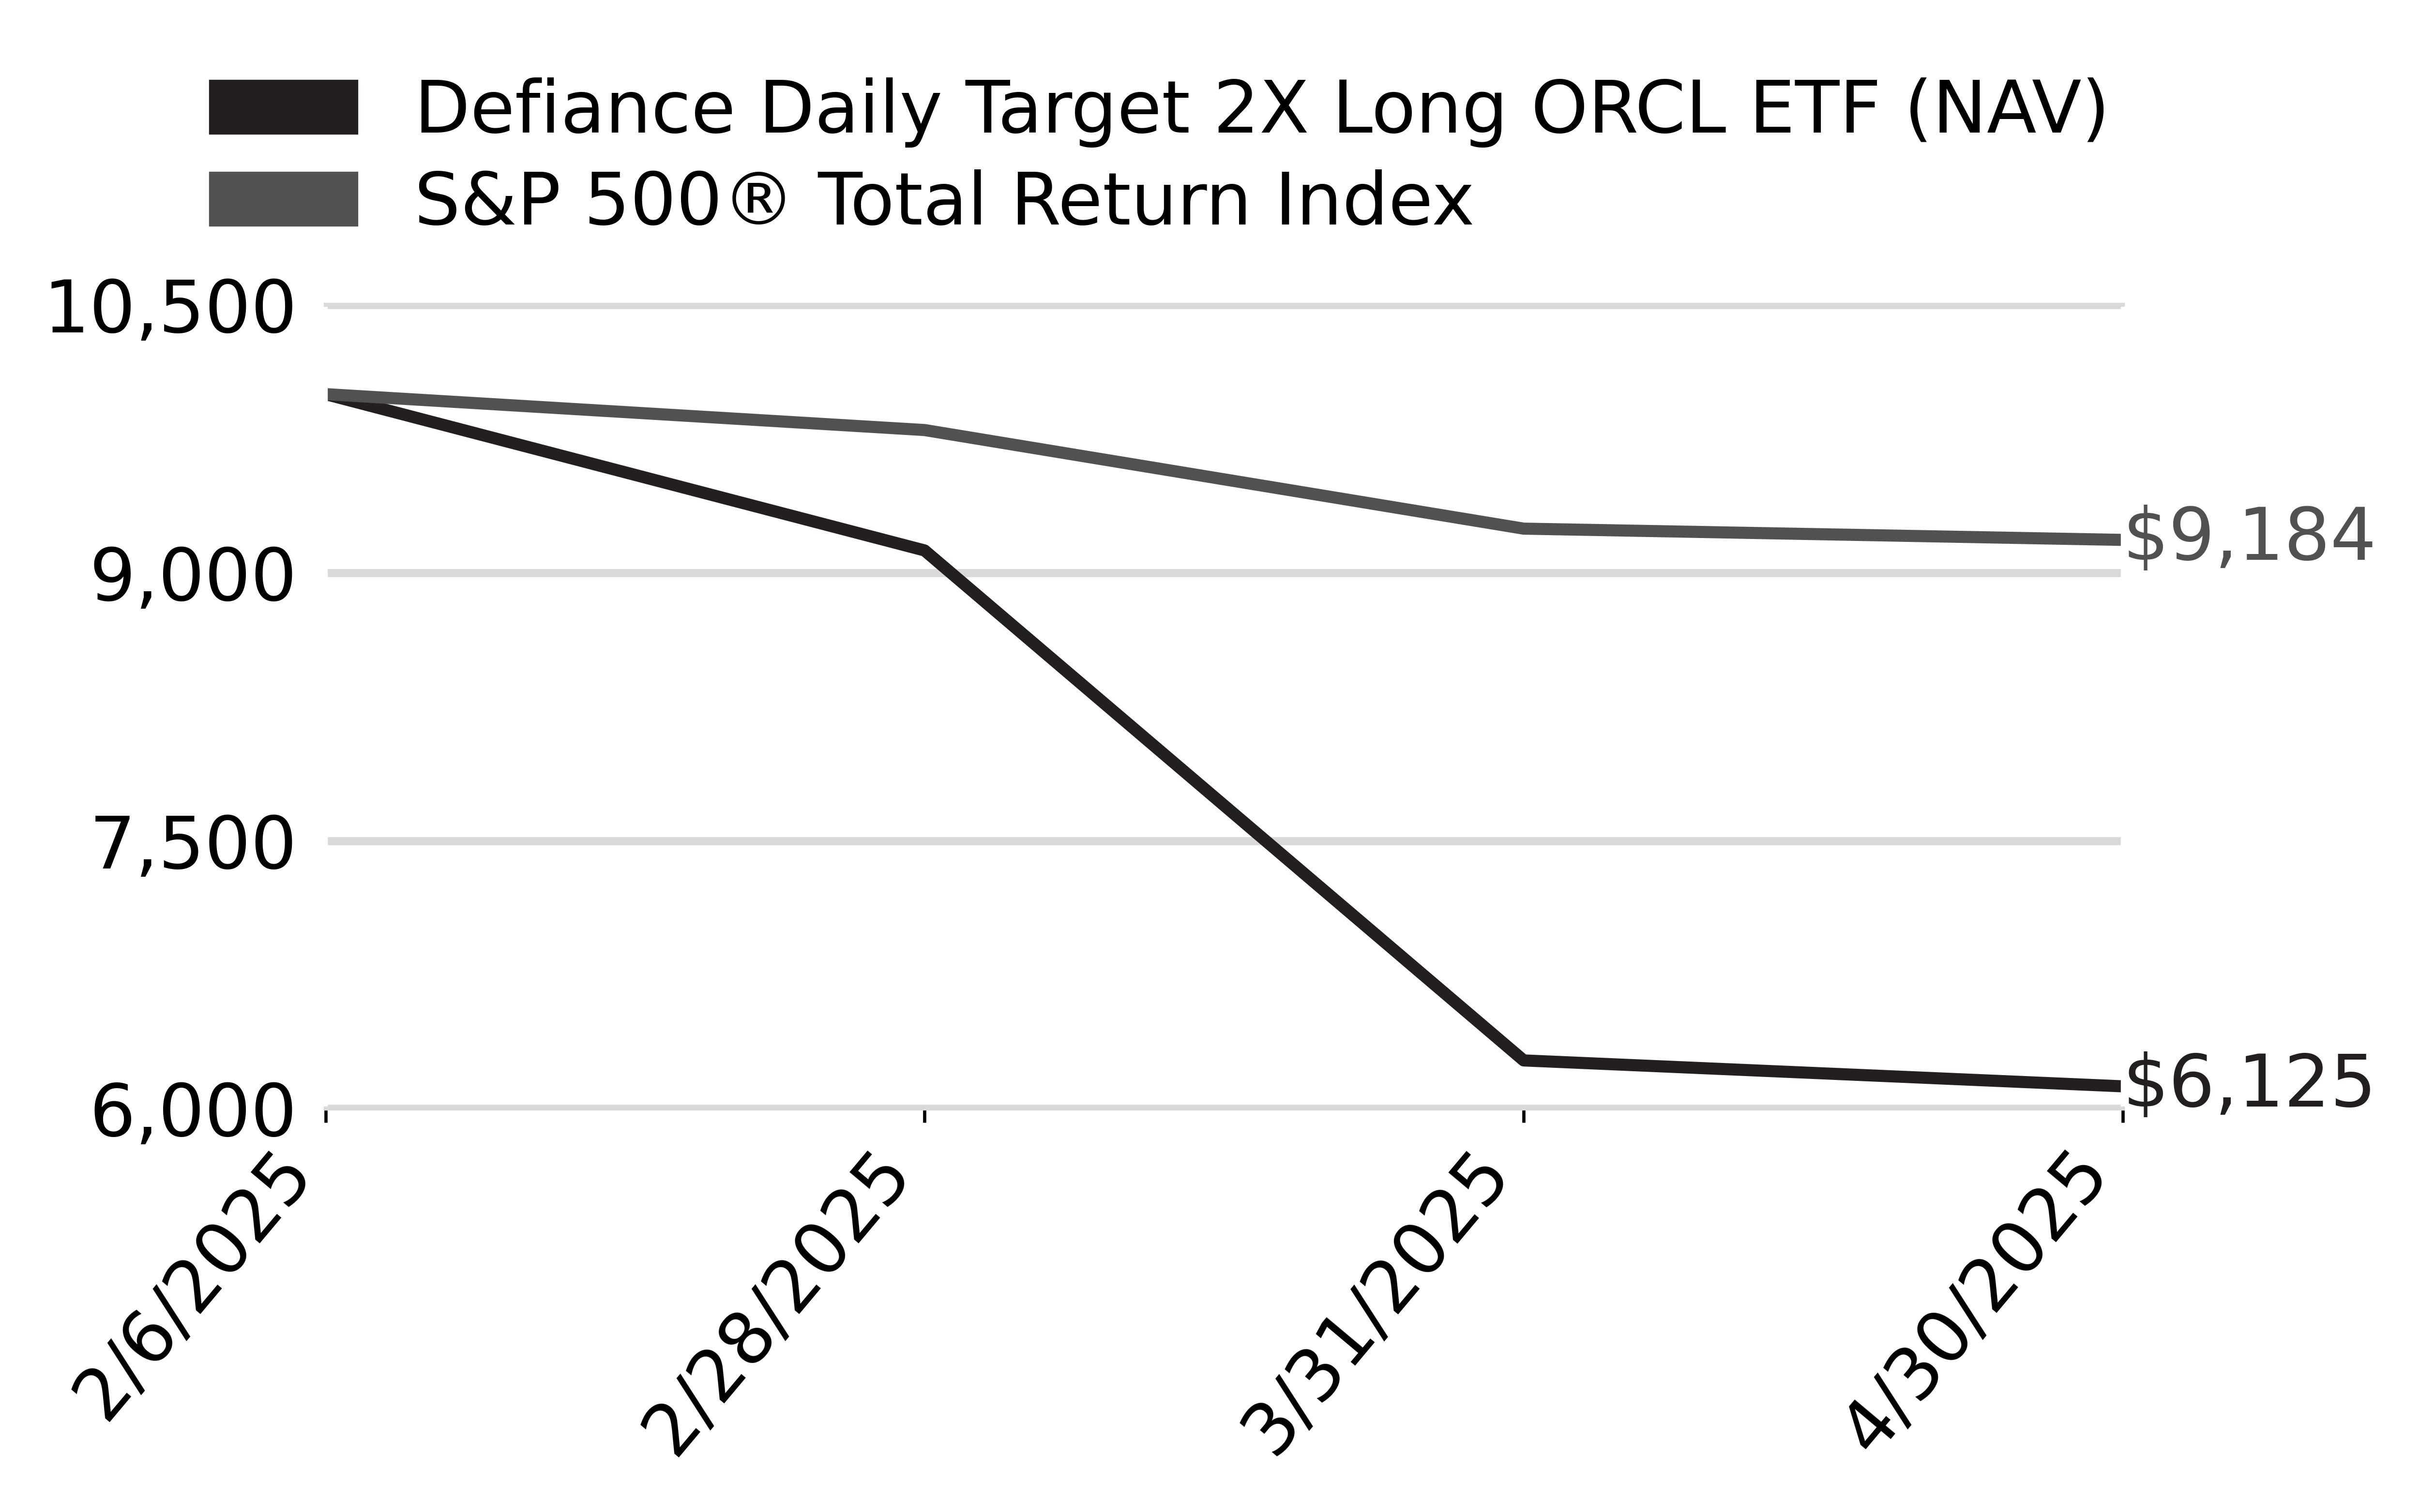
How did the Fund perform last year and what affected its performance?
From inception through 4/30/25, ORCX had a NAV return of -38.74%. ORCX's returns are directly linked to Oracle's daily stock performance. Any fluctuations in Oracle's stock price are magnified in ORCX due to its 2x leverage.
What Factors Influenced Performance
The Fund's 2x leverage means that over periods longer than a day, the effects of compounding can lead to returns that deviate significantly from the expected 2x multiple, especially in volatile markets.
High volatility in the underlying stock can exacerbate the compounding effects, leading to greater divergence from the expected performance over time.
Over periods longer than a day, the effects of compounding can lead to returns that deviate significantly from the expected 2x multiple, especially in volatile markets. Oracle's stock performance was influenced by its strategic investments in AI infrastructure, robust financial results, expansion of multi-cloud partnerships, and involvement in high-profile data management discussions. These developments underscore Oracle's evolving role in cloud computing and AI, positioning the company for potential long-term growth despite short-term stock volatility.
Cumulative Performance
(Initial Investment of $10,000)
Annual Performance
|
Returns for the Period ending April 30, 2025
|
Since Inception
2/6/25
|
|---|---|
|
Defiance Daily Target 2X Long ORCL ETF - at NAV
|
-
38.74
%
|
|
S&P 500
®
Total Return Index
|
-
8.16
%
|
Key Fund Statistics
(as of April 30, 2025 )
|
Fund Size (Thousands)
|
$
2,818
|
|
Number of Holdings
|
4
|
|
Total Advisory Fee
|
$
6,450
|
|
Portfolio Turnover
|
541
%
|
What did the Fund invest in?
(as of April 30, 2025 )
Security Type (% of net assets)

Security Type - Other Financial Instruments
(% of net assets)
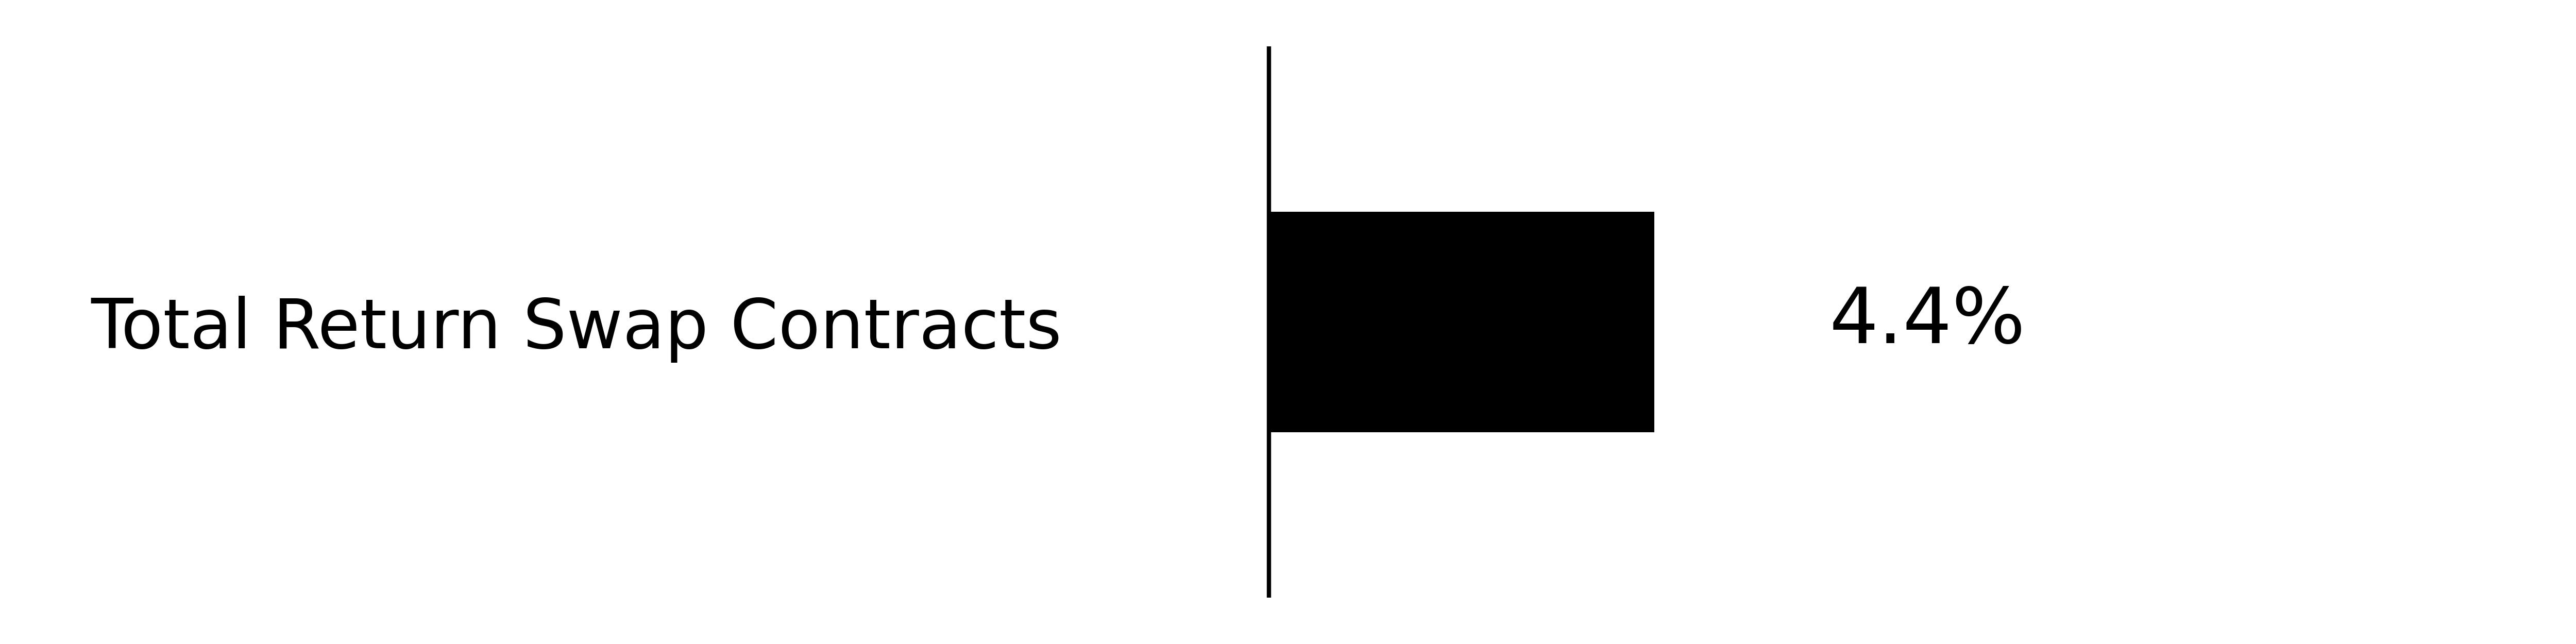
Percentages are based on total net assets. Percentages for swap contracts are based unrealized appreciation (depreciation). Monthly reset swap values are not presented, as the unrealized appreciation (depreciation) resets at each month-end. Cash & Cash Equivalents represents short-term investments and other assets in excess of liabilities.
|
Top Holdings
|
% of Total Net Assets
|
|---|---|
|
First American Government Obligations Fund - Class X, 4.25%
|
|
|
Oracle Corp.
|
|
|
Oracle Corp. Swap; Maturity Date: 03/09/2026
|
|
|
Oracle Corp. Swap; Maturity Date: 03/13/2026
|
| * | Percentages for swap contracts are based unrealized appreciation (depreciation). Monthly reset swap values are not presented, as the unrealized appreciation (depreciation) resets at each month-end. |
What were the Fund costs for the past year?
(based on a hypothetical $10,000 investment)
|
Fund Name
|
Costs of a $10,000 investment
|
Costs paid as a percentage of a $10,000 investment
|
|---|---|---|
|
Defiance Daily Target 2X Long RGTI ETF
|
$
11
|
1.29
%
|
Costs paid as a percentage of a $10,000 investment is an annualized figure. The Fund commenced operations March 31, 2025. Expenses for a full reporting period would be higher than the figures shown.
How did the Fund perform last year and what affected its performance?
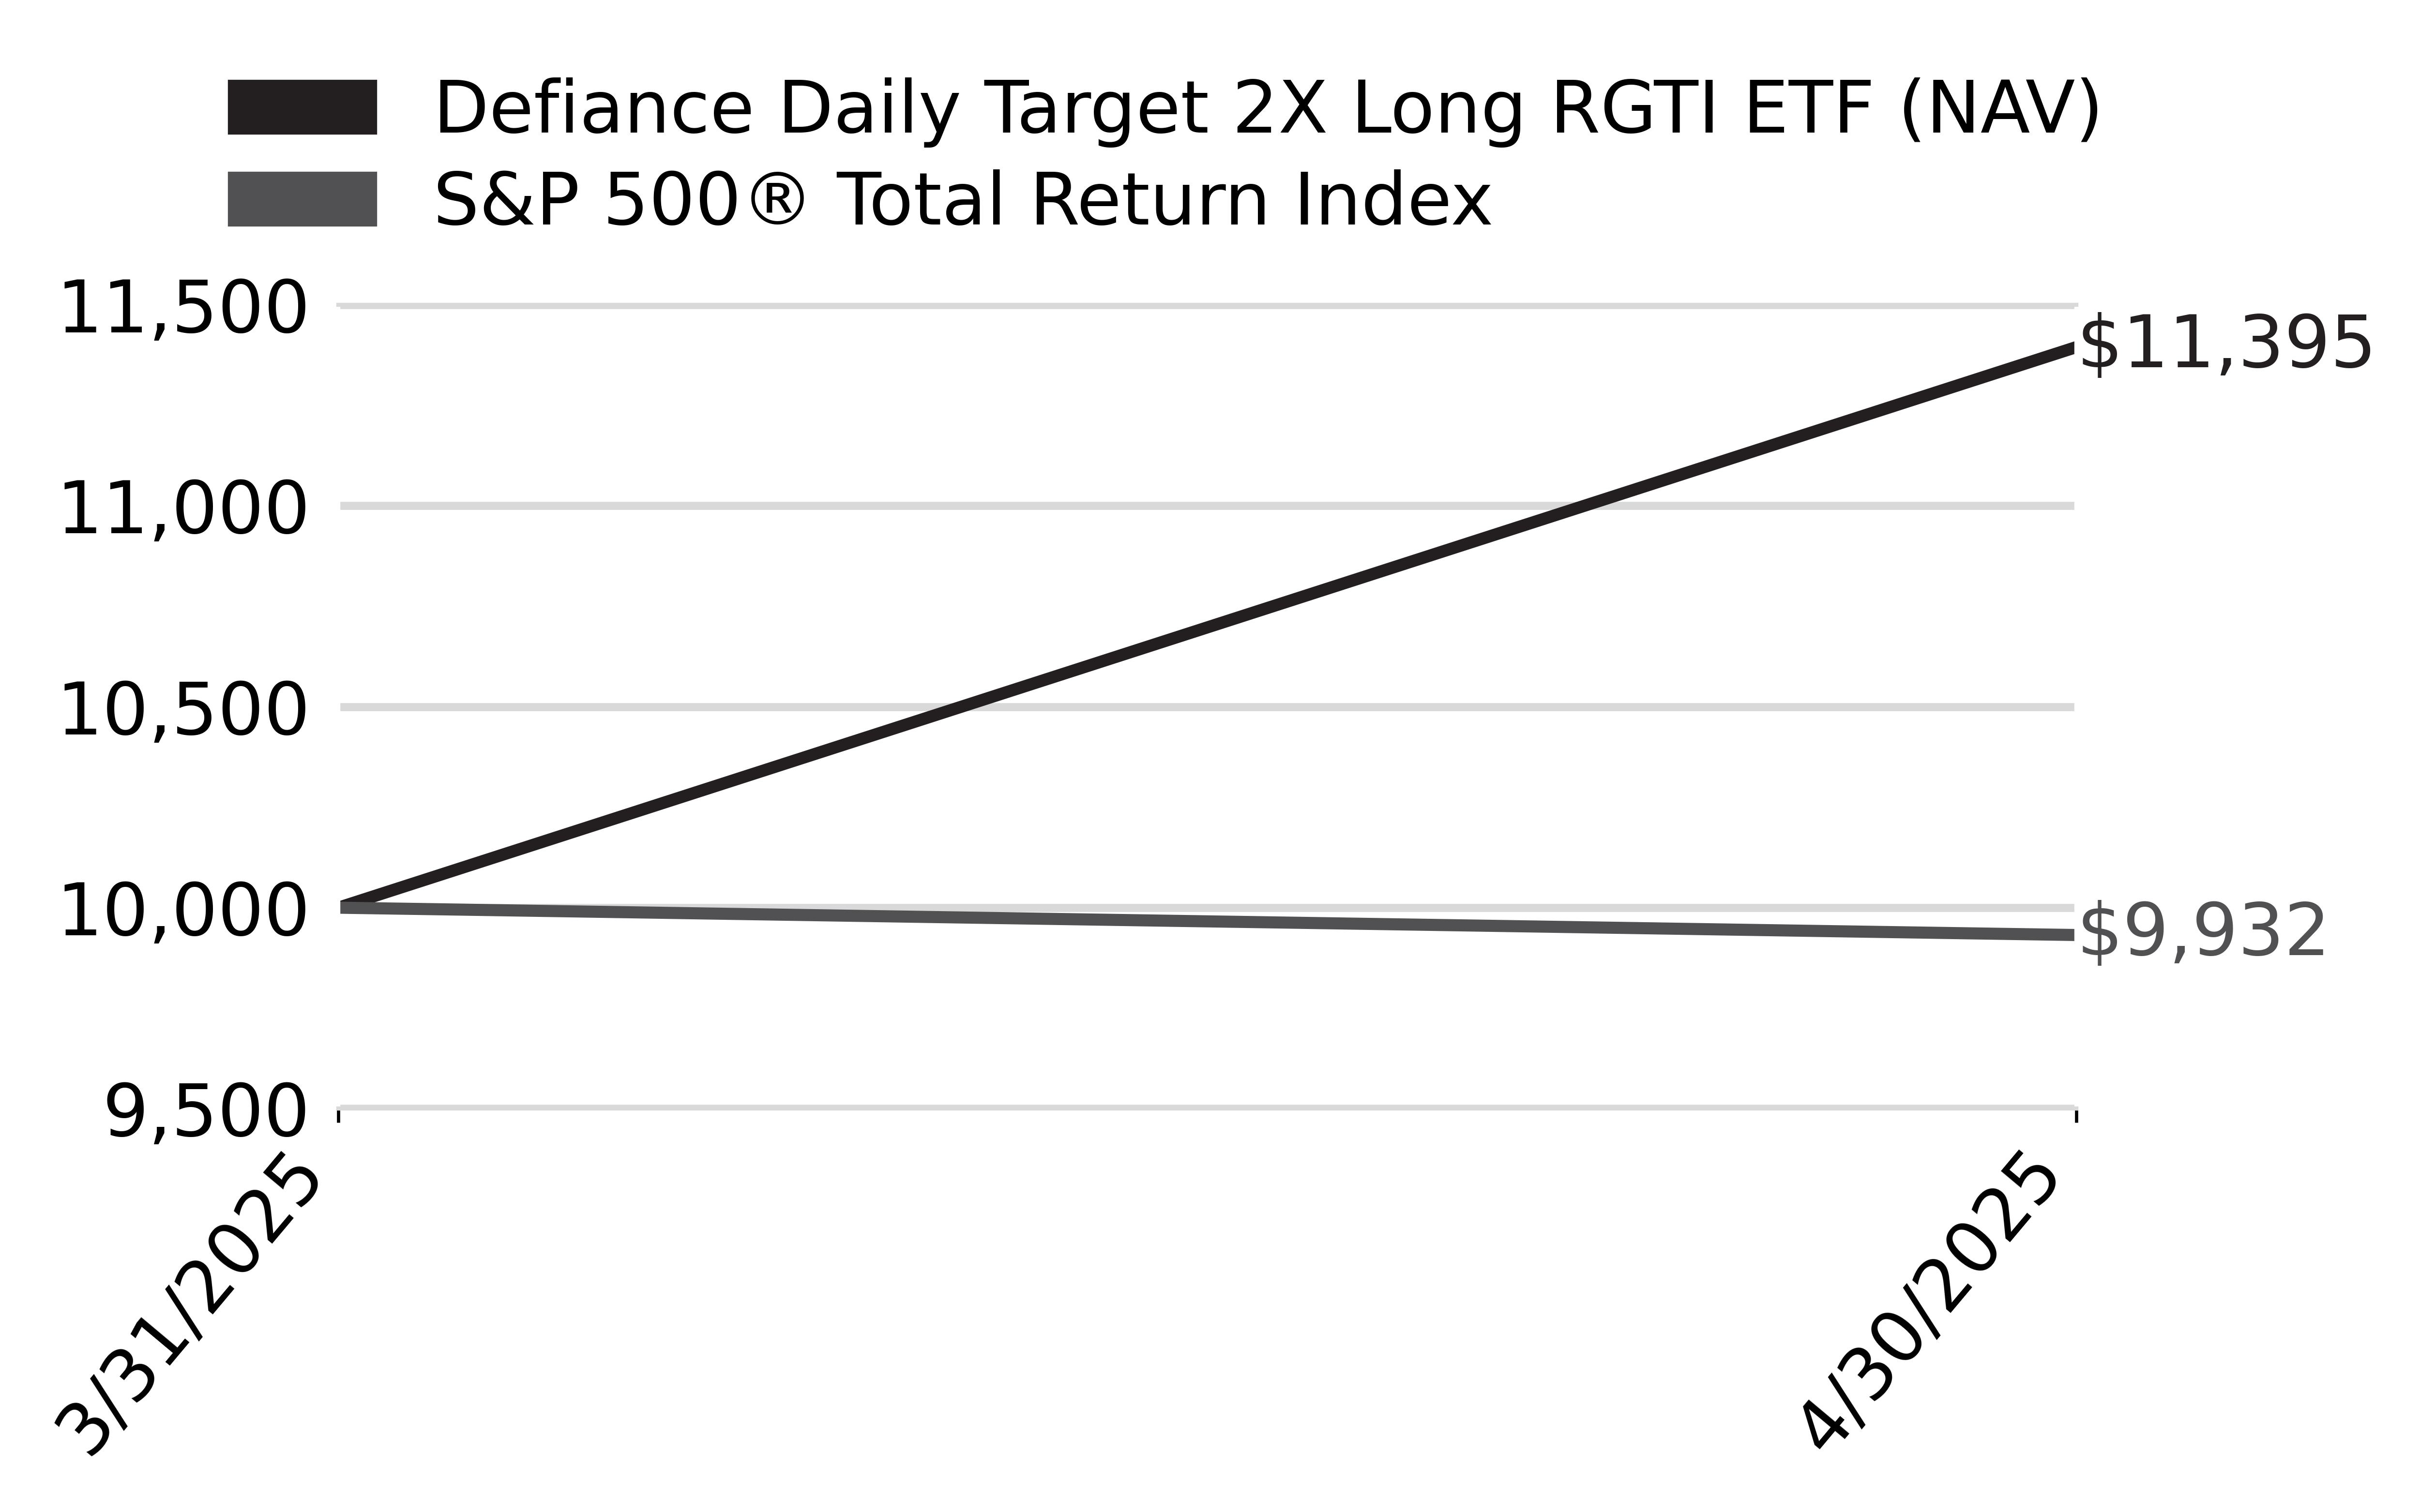
From inception through 4/30/25, RGTX had a NAV return of 13.95%. Since its inception, RGTX has experienced significant volatility. This volatility reflects the leveraged nature of the fund and the performance of its underlying asset, Rigetti Computing Inc.
What Factors Influenced Performance
The Fund's 2x leverage means that over periods longer than a day, the effects of compounding can lead to returns that deviate significantly from the expected 2x multiple, especially in volatile markets.
High volatility in the underlying stock can exacerbate the compounding effects, leading to greater divergence from the expected performance over time.
High volatility in RGTI's stock can exacerbate the compounding effects, leading to greater divergence from the expected performance over time. Rigetti's stock performance in April 2025 was driven by its selection for a significant government initiative, a substantial investment from a strategic partner, and advancements in its quantum computing technology. However, financial results highlighted challenges in revenue generation, leading to stock volatility. Investors remain optimistic about Rigetti's long-term prospects in the quantum computing sector, but short-term financial performance continues to be a focal point.
Cumulative Performance
(Initial Investment of $10,000)
Annual Performance
|
Returns for the Period ending April 30, 2025
|
Since Inception
3/31/25
|
|---|---|
|
Defiance Daily Target 2X Long RGTI ETF - at NAV
|
13.95
%
|
|
S&P 500
®
Total Return Index
|
-
0.68
%
|
Key Fund Statistics
(as of April 30, 2025 )
|
Fund Size (Thousands)
|
$
2,279
|
|
Number of Holdings
|
3
|
|
Total Advisory Fee
|
$
1,885
|
|
Portfolio Turnover
|
273
%
|
What did the Fund invest in?
(as of April 30, 2025 )
Security Type (% of net assets)

Security Type - Other Financial Instruments
(% of net assets)

Percentages are based on total net assets. Percentages for swap contracts are based unrealized appreciation (depreciation). Monthly reset swap values are not presented, as the unrealized appreciation (depreciation) resets at each month-end. Cash & Cash Equivalents represents short-term investments and other assets in excess of liabilities.
|
Top Holdings
|
% of Total Net Assets
|
|---|---|
|
First American Government Obligations Fund - Class X, 4.25%
|
|
|
Rigetti Computing, Inc.
|
|
|
Rigetti Computing, Inc. Swap; Maturity Date: 05/01/2026
|
| * | Percentages for swap contracts are based unrealized appreciation (depreciation). Monthly reset swap values are not presented, as the unrealized appreciation (depreciation) resets at each month-end. |
What were the Fund costs for the past year?
(based on a hypothetical $10,000 investment)
|
Fund Name
|
Costs of a $10,000 investment
|
Costs paid as a percentage of a $10,000 investment
|
|---|---|---|
|
Defiance Daily Target 2X Long RIOT ETF
|
$
21
|
0.95
%
|
Costs paid as a percentage of a $10,000 investment is an annualized figure. The Fund commenced operations January 2, 2025. Expenses for a full reporting period would be higher than the figures shown.
How did the Fund perform last year and what affected its performance?
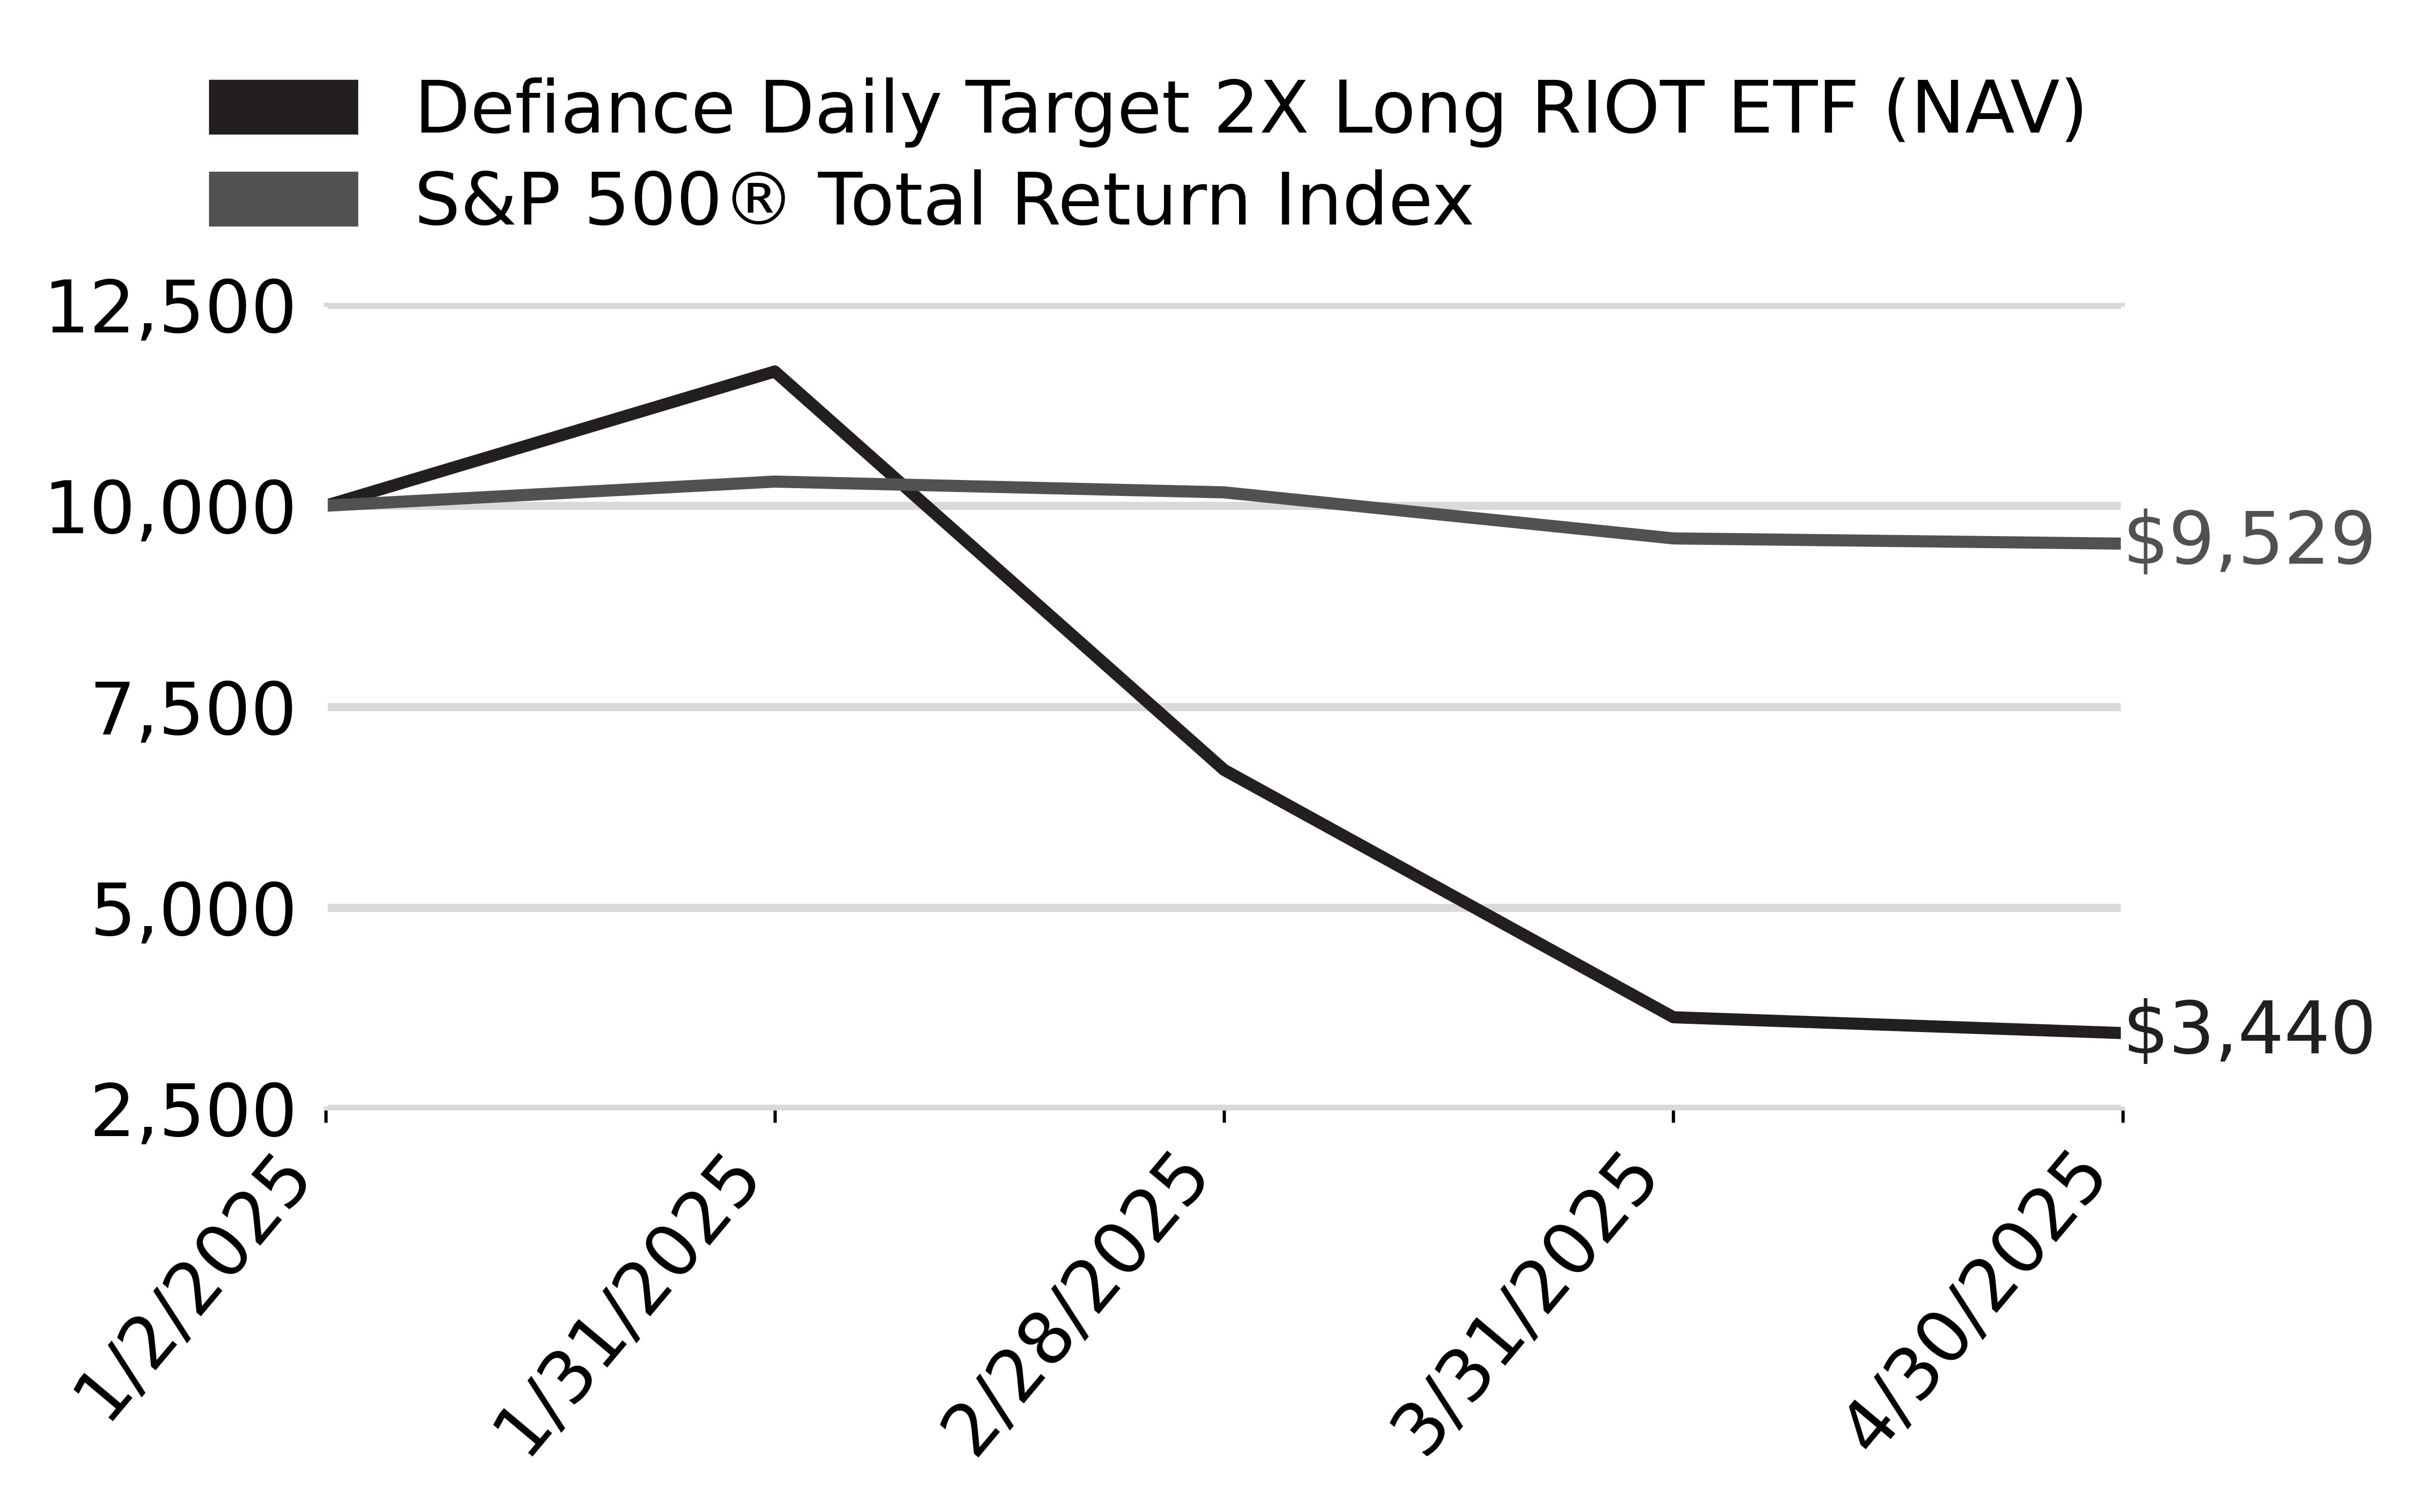
From inception through 4/30/25, RIOX had a NAV return of -65.65%. RIOX seeks to deliver twice the daily performance of RIOT. Therefore, any fluctuations in RIOT's stock price are magnified in RIOX. As RIOT's operations are closely tied to Bitcoin mining, fluctuations in Bitcoin's price directly affect RIOT's stock performance, and consequently, RIOX's returns. Broader market trends and investor sentiment towards cryptocurrencies and tech stocks, additionally, have influenced RIOT's stock price.
What Factors Influenced Performance
The Fund's 2x leverage means that over periods longer than a day, the effects of compounding can lead to returns that deviate significantly from the expected 2x multiple, especially in volatile markets.
High volatility in the underlying stock can exacerbate the compounding effects, leading to greater divergence from the expected performance over time.
Riot Platforms achieved notable operational milestones, including increased Bitcoin production and hash rate expansion. However, external factors such as Bitcoin price volatility, regulatory changes, and shifting investor sentiment towards alternative crypto investments impacted its stock performance during this period.
Cumulative Performance
(Initial Investment of $10,000)
Annual Performance
|
Returns for the Period ending April 30, 2025
|
Since Inception
1/2/25
|
|---|---|
|
Defiance Daily Target 2X Long RIOT ETF - at NAV
|
-
65.65
%
|
|
S&P 500
®
Total Return Index
|
-
4.71
%
|
Key Fund Statistics
(as of April 30, 2025 )
|
Fund Size (Thousands)
|
$
14,072
|
|
Number of Holdings
|
4
|
|
Total Advisory Fee
|
$
34,370
|
|
Portfolio Turnover
|
749
%
|
What did the Fund invest in?
(as of April 30, 2025 )
Security Type (% of net assets)
Security Type - Other Financial Instruments
(% of net assets)

Percentages are based on total net assets. Percentages for swap contracts are based unrealized appreciation (depreciation). Monthly reset swap values are not presented, as the unrealized appreciation (depreciation) resets at each month-end. Cash & Cash Equivalents represents short-term investments and other assets in excess of liabilities.
|
Top Holdings
|
% of Total Net Assets
|
|---|---|
|
Riot Platforms, Inc.
|
|
|
First American Government Obligations Fund - Class X, 4.25%
|
|
|
Riot Platforms, Inc. Swap; Maturity Date: 03/06/2026
|
|
|
Riot Platforms, Inc. Swap; Maturity Date: 02/03/2026
|
| * | Percentages for swap contracts are based unrealized appreciation (depreciation). Monthly reset swap values are not presented, as the unrealized appreciation (depreciation) resets at each month-end. |
What were the Fund costs for the past year?
(based on a hypothetical $10,000 investment)
|
Fund Name
|
Costs of a $10,000 investment
|
Costs paid as a percentage of a $10,000 investment
|
|---|---|---|
|
Defiance Daily Target 2X Long RKLB ETF
|
$
19
|
1.29
%
|
Costs paid as a percentage of a $10,000 investment is an annualized figure. The Fund commenced operations March 12, 2025. Expenses for a full reporting period would be higher than the figures shown.
How did the Fund perform last year and what affected its performance?
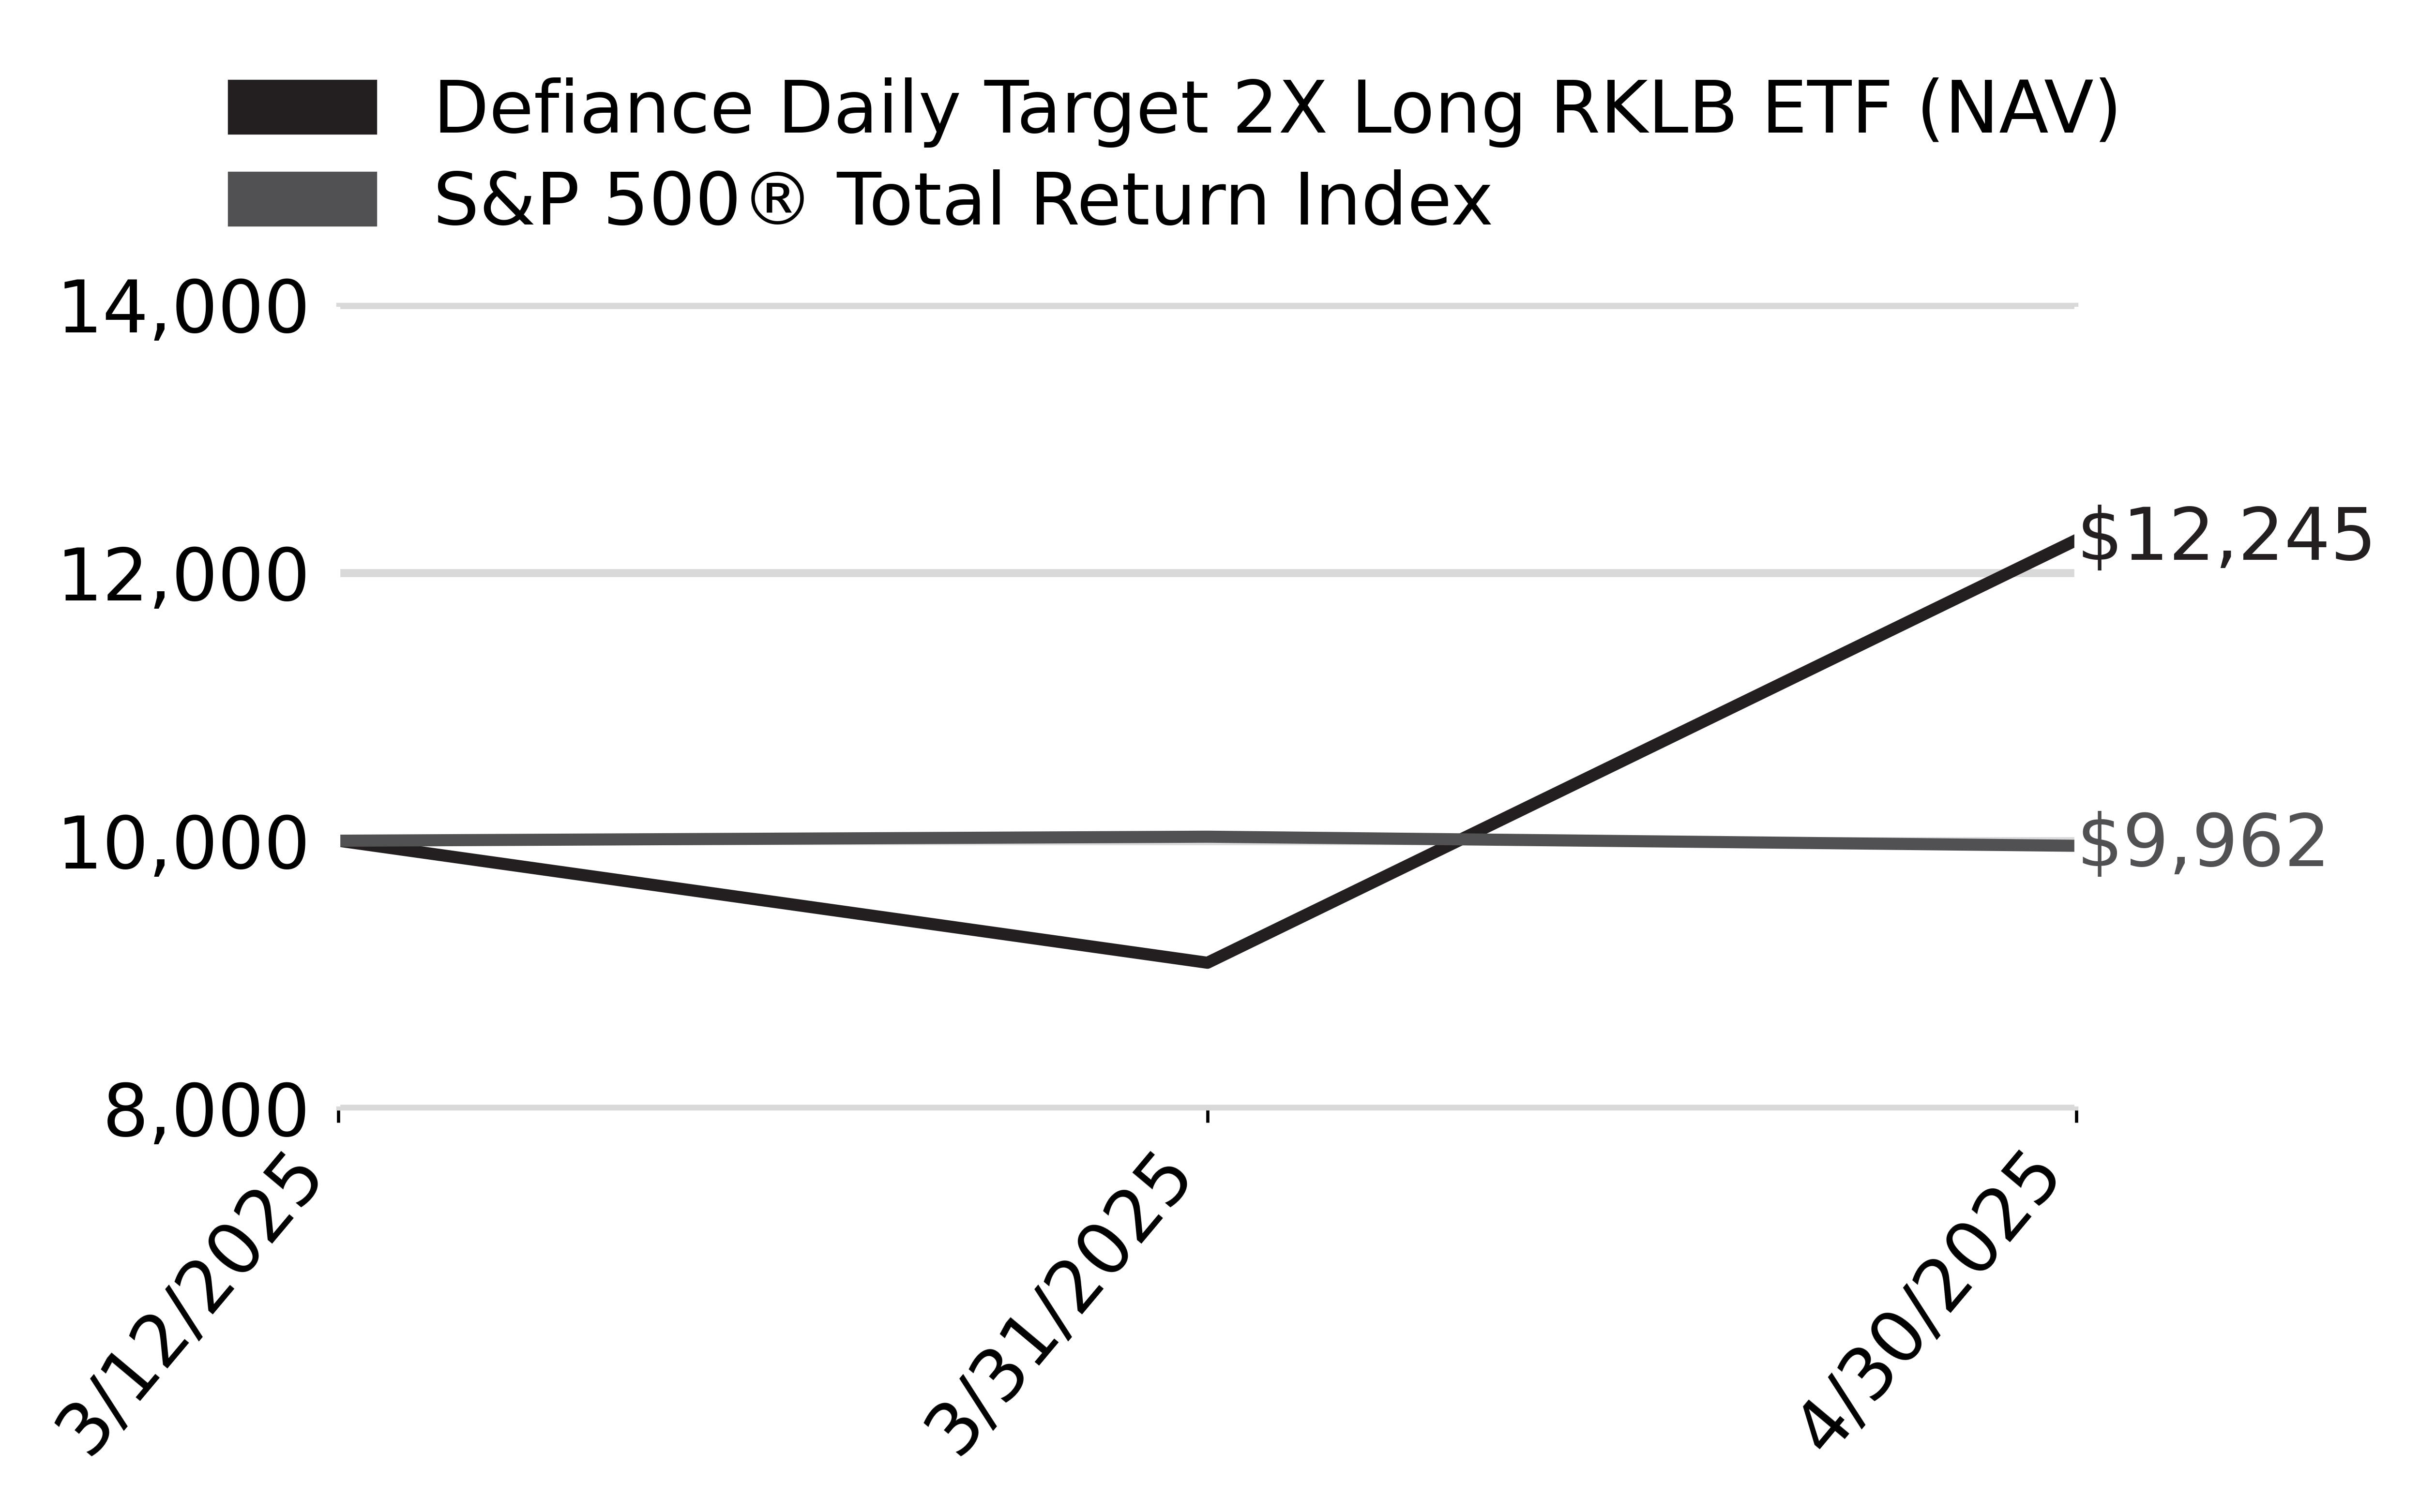
From inception through 4/30/25, RKLX had a NAV return of 22.50%. RKLX seeks to deliver twice the daily performance of RKLB. Any fluctuations in RKLB’s stock price are magnified in RKLX. The fund's 2x leverage means that over periods longer than a day, the effects of compounding can lead to returns that deviate significantly from the expected 2x multiple.
What Factors Influenced Performance
The Fund's 2x leverage means that over periods longer than a day, the effects of compounding can lead to returns that deviate significantly from the expected 2x multiple, especially in volatile markets.
High volatility in the underlying stock can exacerbate the compounding effects, leading to greater divergence from the expected performance over time.
Broader market trends and investor sentiment towards the aerospace and defense sector can influence RKLB's stock price, thereby affecting RKLX's performance. RKLB faced challenges in March 2025 due to disappointing earnings but rebounded in April, driven by strategic contracts and partnerships. These events underscore the company's resilience and its growing role in the aerospace and defense sectors.
Cumulative Performance
(Initial Investment of $10,000)
Annual Performance
|
Returns for the Period ending April 30, 2025
|
Since Inception
3/12/25
|
|---|---|
|
Defiance Daily Target 2X Long RKLB ETF - at NAV
|
22.50
%
|
|
S&P 500
®
Total Return Index
|
-
0.38
%
|
Key Fund Statistics
(as of April 30, 2025 )
|
Fund Size (Thousands)
|
$
7,348
|
|
Number of Holdings
|
3
|
|
Total Advisory Fee
|
$
5,372
|
|
Portfolio Turnover
|
416
%
|
What did the Fund invest in?
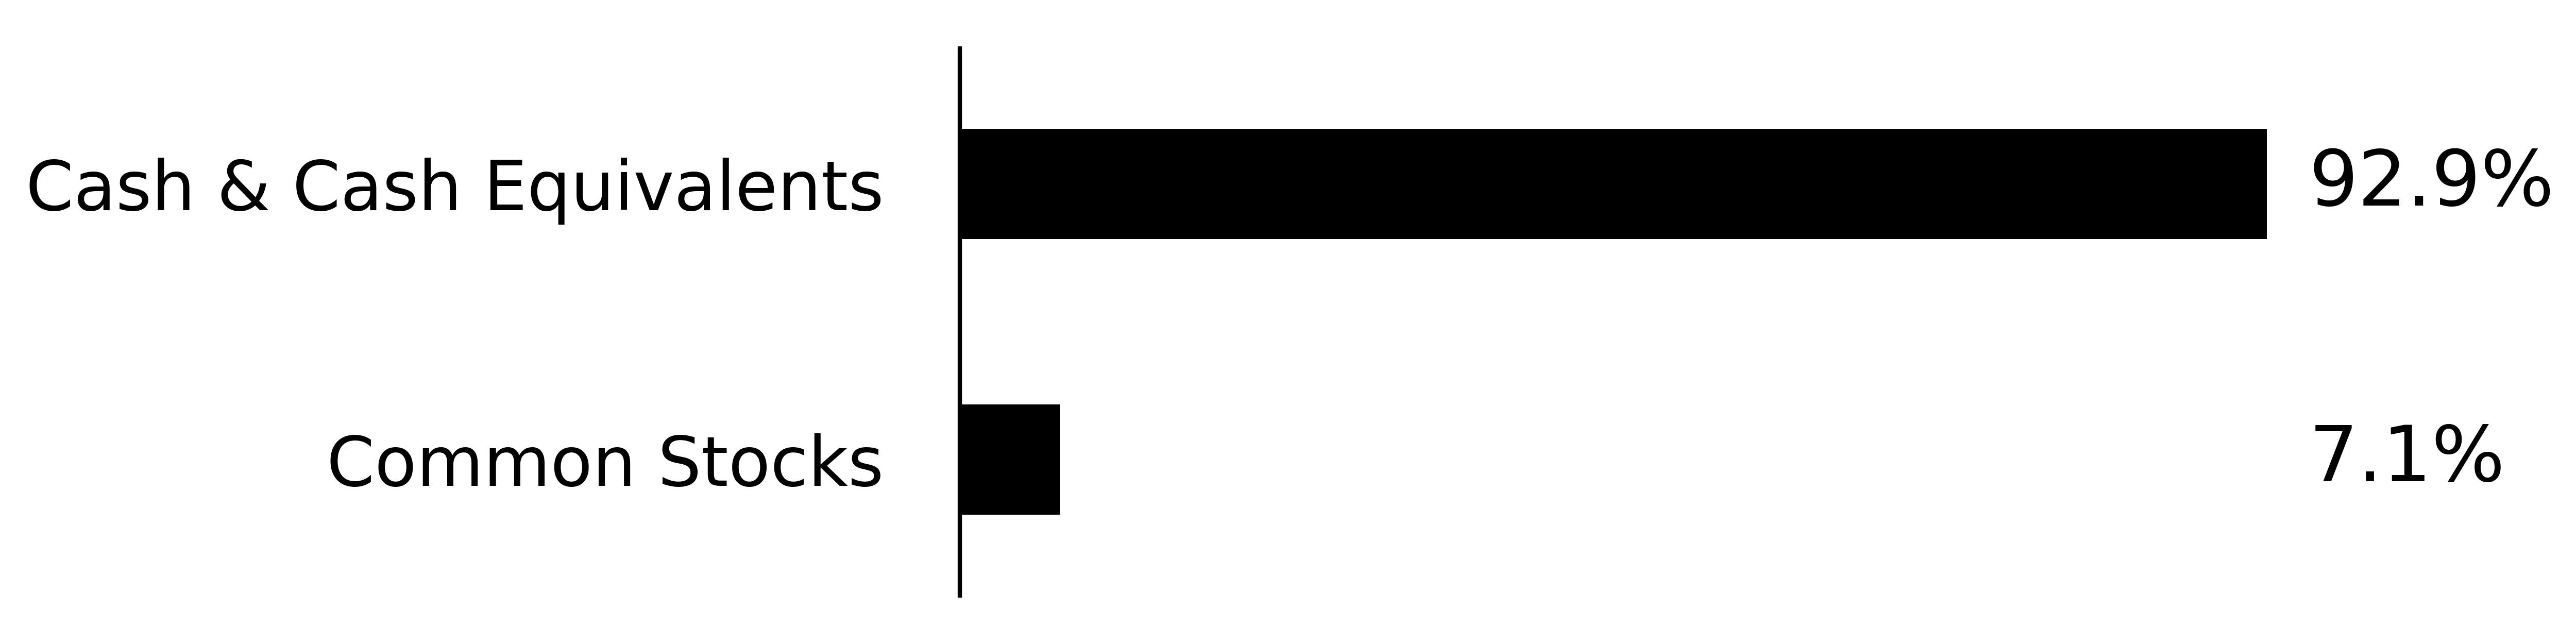
(as of April 30, 2025 )
Security Type (% of net assets)
Security Type - Other Financial Instruments
(% of net assets)

Percentages are based on total net assets. Percentages for swap contracts are based unrealized appreciation (depreciation). Monthly reset swap values are not presented, as the unrealized appreciation (depreciation) resets at each month-end. Cash & Cash Equivalents represents short-term investments and other assets in excess of liabilities.
|
Top Holdings
|
% of Total Net Assets
|
|---|---|
|
First American Government Obligations Fund - Class X, 4.25%
|
|
|
Rocket Lab USA, Inc.
|
|
|
Rocket Lab USA, Inc. Swap; Maturity Date: 04/13/2026
|
| * | Percentages for swap contracts are based unrealized appreciation (depreciation). Monthly reset swap values are not presented, as the unrealized appreciation (depreciation) resets at each month-end. |
What were the Fund costs for the past year?
(based on a hypothetical $10,000 investment)
|
Fund Name
|
Costs of a $10,000 investment
|
Costs paid as a percentage of a $10,000 investment
|
|---|---|---|
|
Defiance Daily Target 2X Long SMCI ETF
|
$
52
|
1.42
%
|
Costs paid as a percentage of a $10,000 investment is an annualized figure. The Fund commenced operations August 21, 2024. Expenses for a full reporting period would be higher than the figures shown.
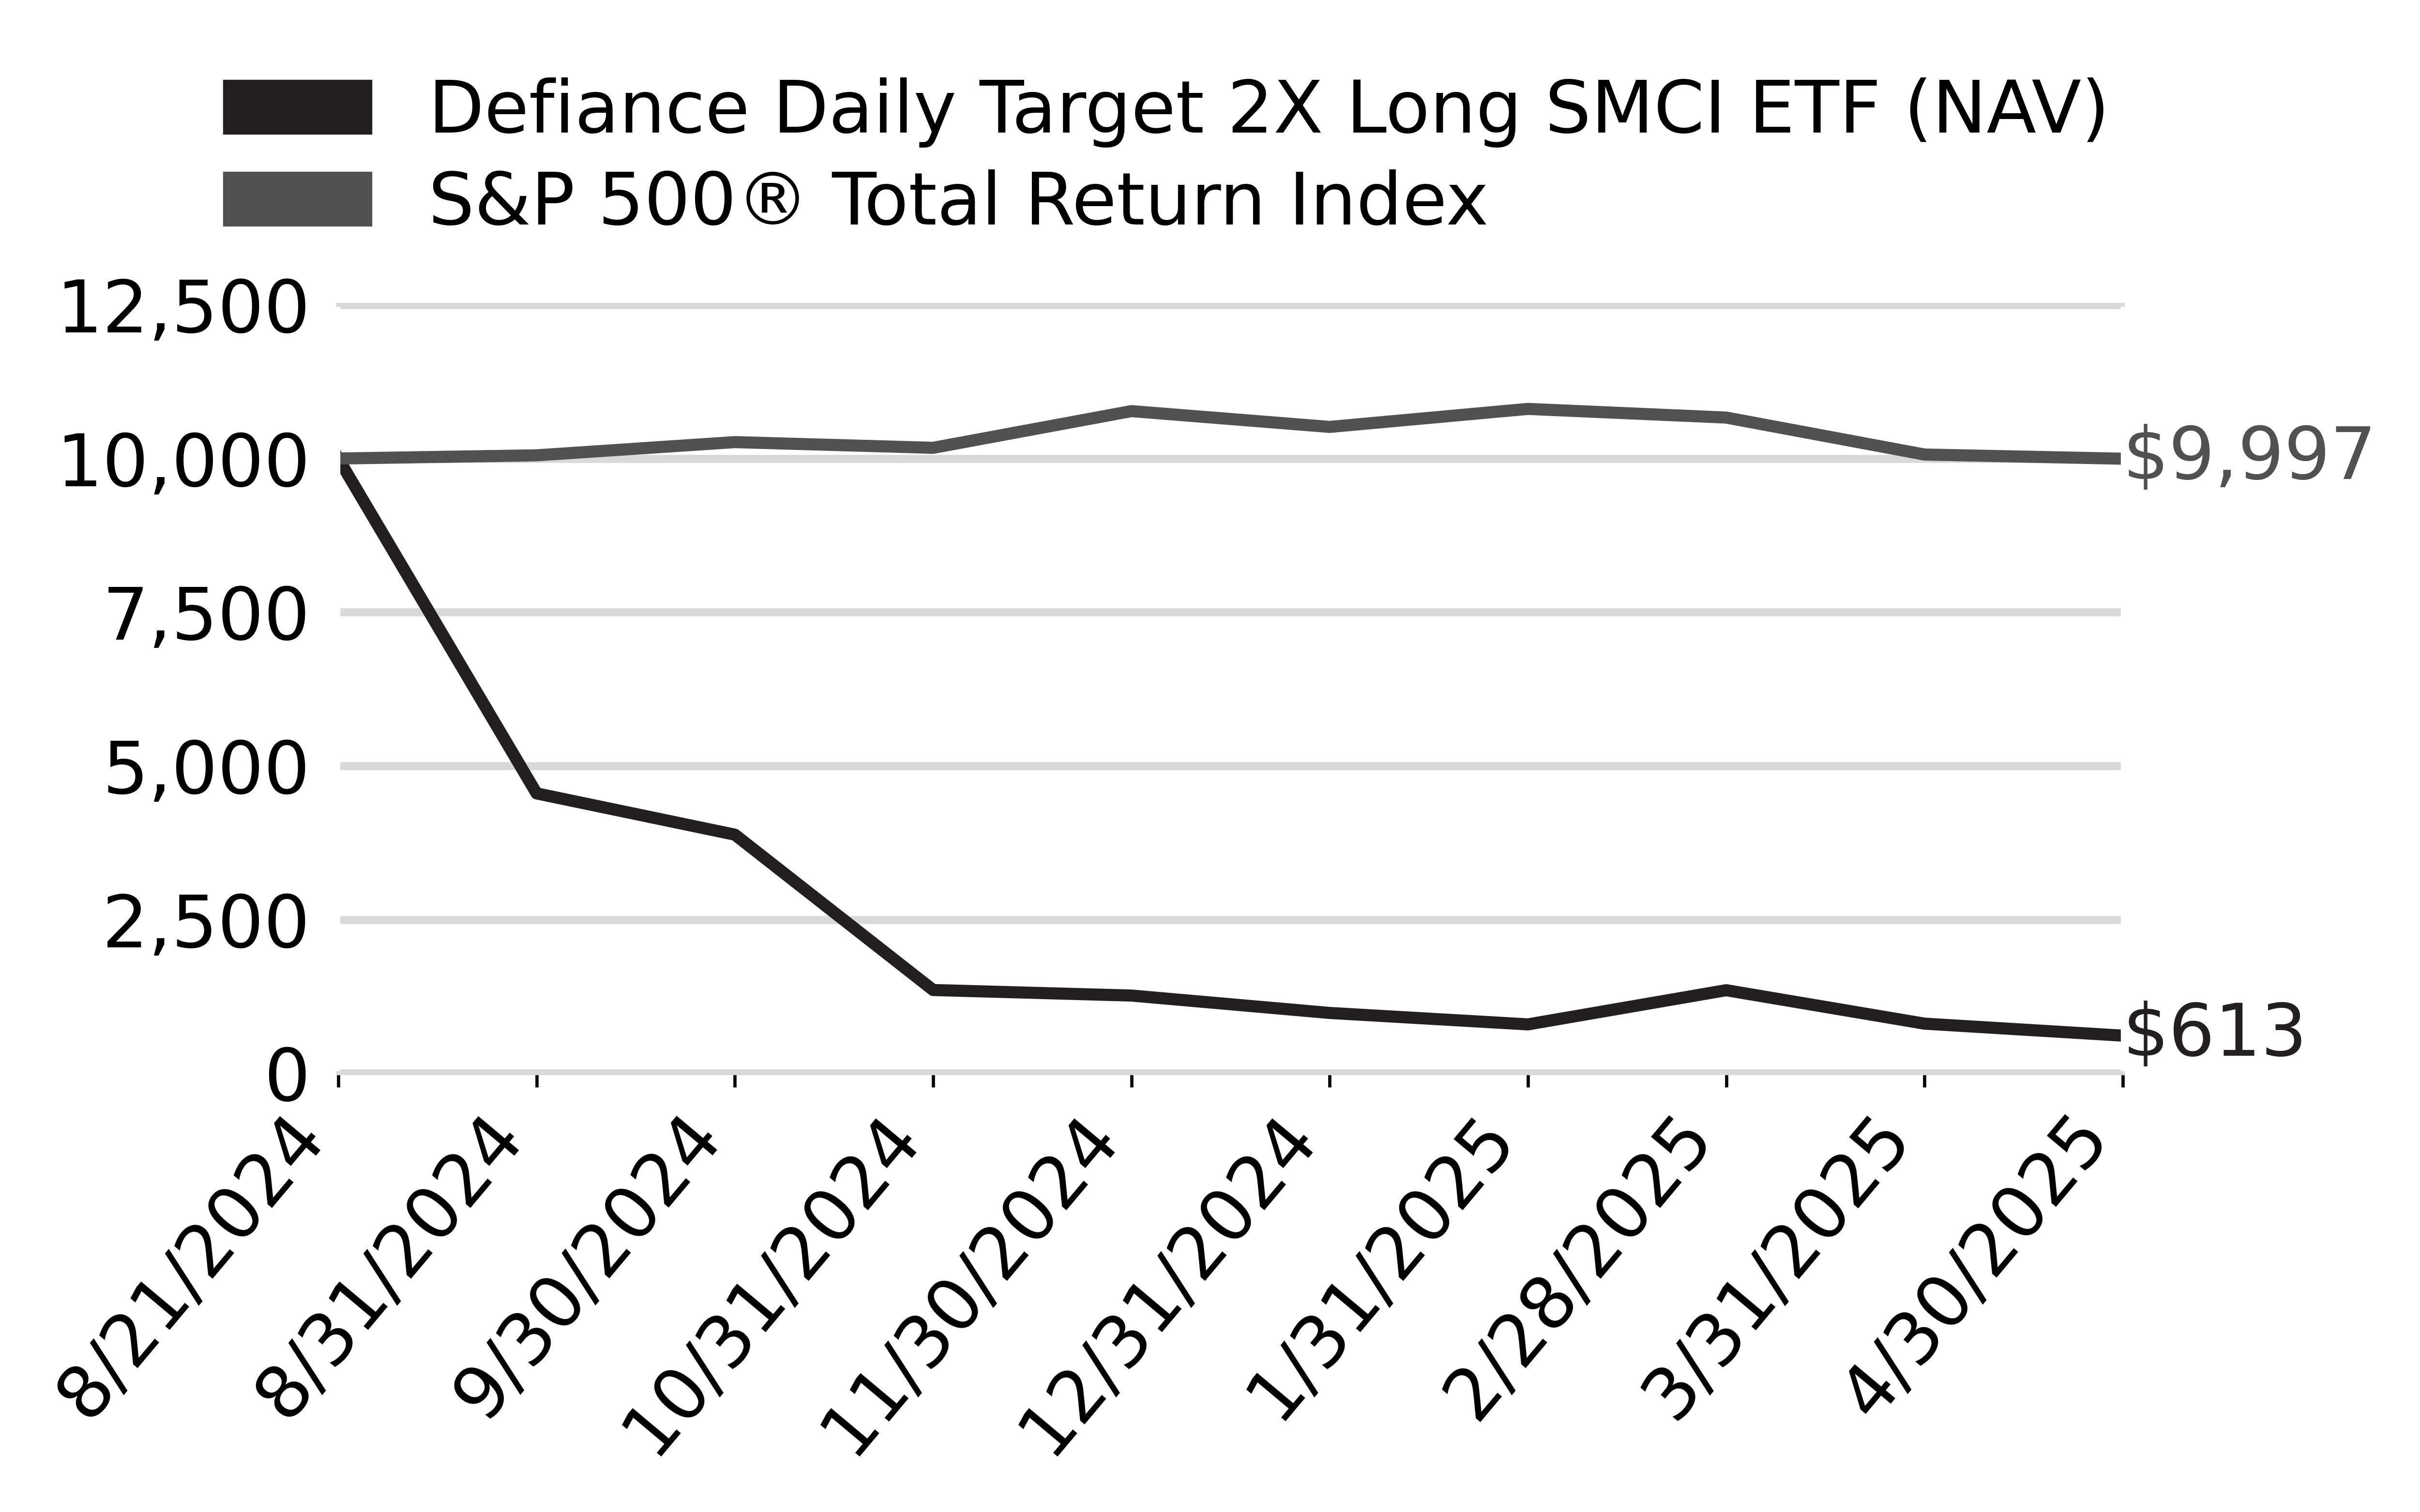
How did the Fund perform last year and what affected its performance?
From inception through 4/30/25, SMCX had a NAV return of -93.87%. SMCX seeks to deliver twice the daily performance of SMCI. Therefore, any fluctuations in SMCI’s stock price are magnified in SMCX. SMCX's performance was influenced by the underlying movements of SMCI's stock, the effects of leverage and compounding, market volatility, and the fund's derivative strategies. While offering the potential for amplified exposure to SMCI's daily performance, the fund's leveraged structure necessitates careful consideration and active management. The fund utilizes derivatives, such as swap agreements, to achieve its leverage. Limitations in the availability or pricing of these derivatives can affect the fund's ability to maintain its targeted exposure which resulted in the frequent utilization of options – both standard listed and flex.
What Factors Influenced Performance
The Fund's 2x leverage means that over periods longer than a day, the effects of compounding can lead to returns that deviate significantly from the expected 2x multiple, especially in volatile markets.
High volatility in the underlying stock can exacerbate the compounding effects, leading to greater divergence from the expected performance over time.
SMCI's stock demonstrated significant volatility, largely driven by internal challenges and broader market dynamics. The company faced scrutiny over accounting practices and corporate governance, raising concerns about a potential Nasdaq delisting.
Cumulative Performance
(Initial Investment of $10,000)
Annual Performance
|
Returns for the Period ending April 30, 2025
|
Since Inception
8/21/24
|
|---|---|
|
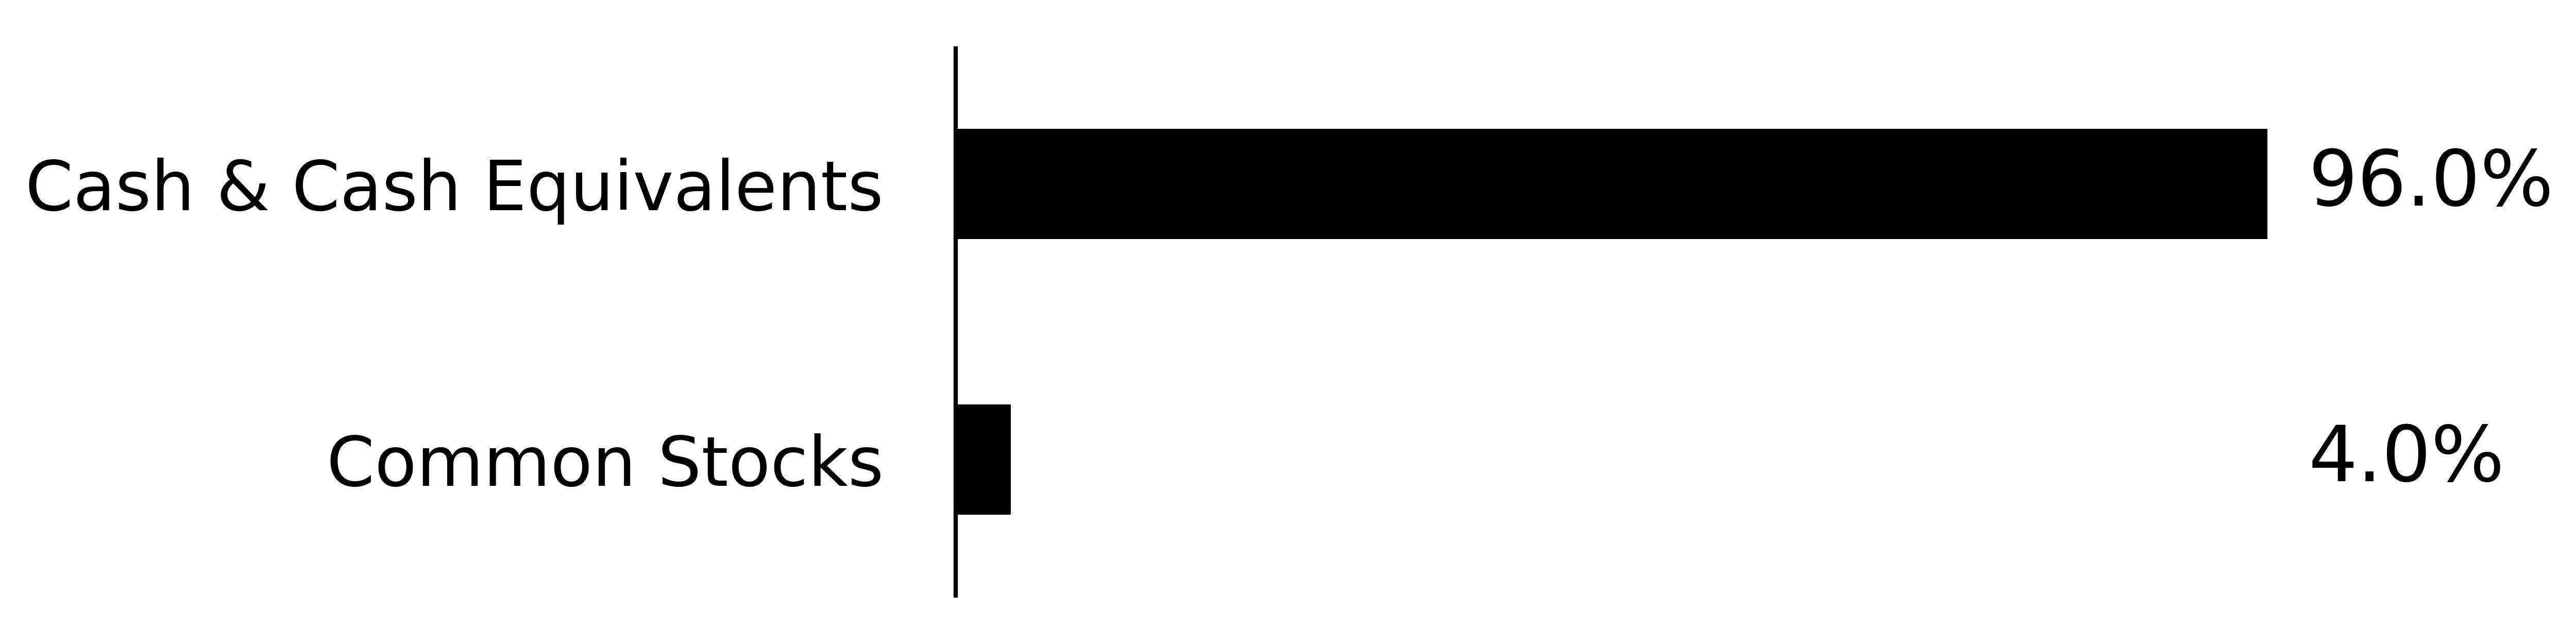
Defiance Daily Target 2X Long SMCI ETF - at NAV
|
-
93.87
%
|
|
S&P 500
®
Total Return Index
|
-
0.03
%
|
Key Fund Statistics
(as of April 30, 2025 )
|
Fund Size (Thousands)
|
$
233,301
|
|
Number of Holdings
|
7
|
|
Total Advisory Fee
|
$
1,287,052
|
|
Portfolio Turnover
|
2,869
%
|
What did the Fund invest in?
(as of April 30, 2025 )
Security Type (% of net assets)
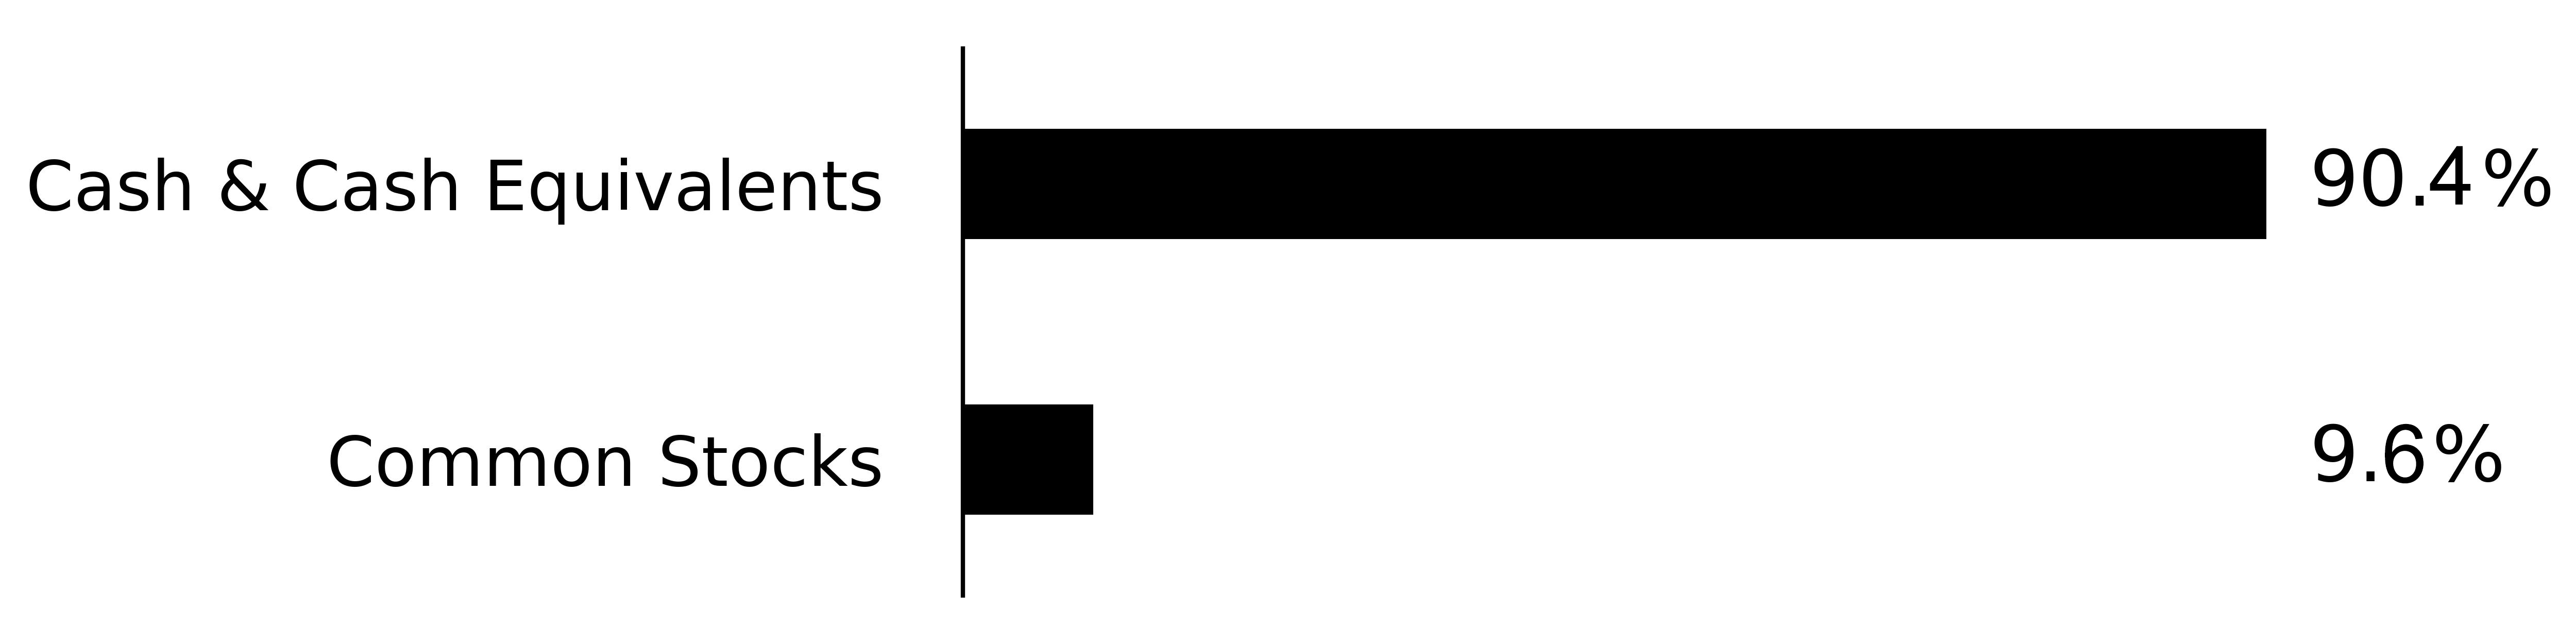
Security Type - Other Financial Instruments
(% of net assets)
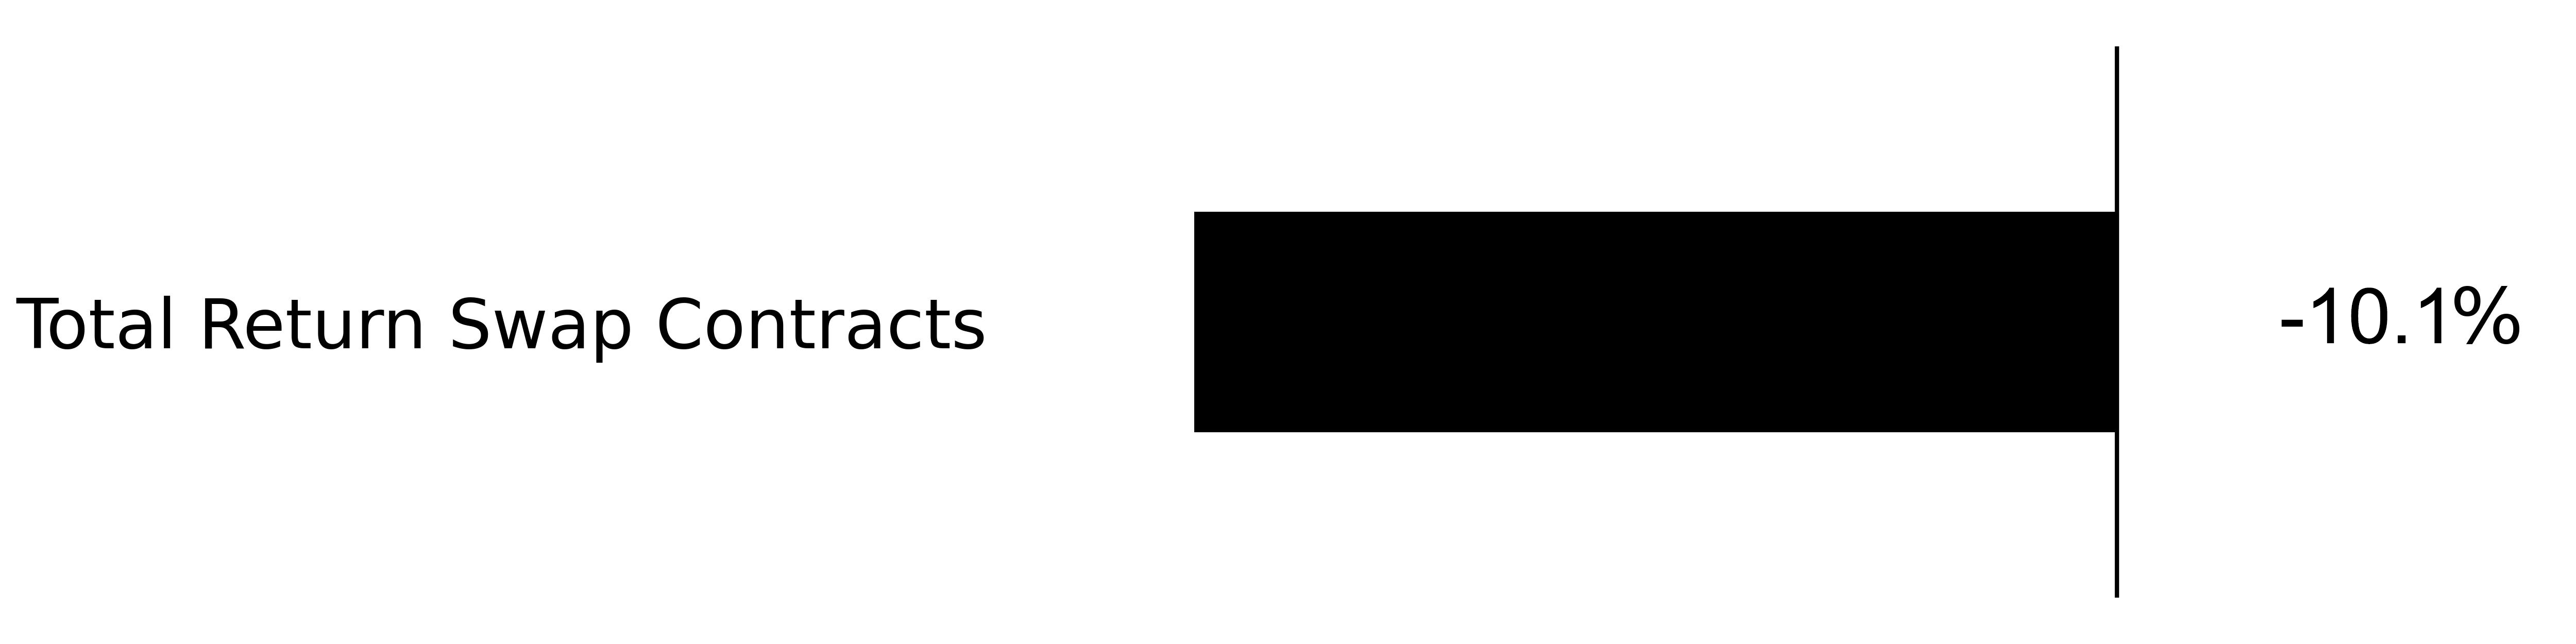
Percentages are based on total net assets. Percentages for swap contracts are based unrealized appreciation (depreciation). Monthly reset swap values are not presented, as the unrealized appreciation (depreciation) resets at each month-end. Cash & Cash Equivalents represents short-term investments and other assets in excess of liabilities.
|
Top Holdings
|
% of Total Net Assets
|
|---|---|
|
Super Micro Computer, Inc. Swap: Maturity Date: 03/10/2026
|
|
|
Super Micro Computer, Inc.
|
|
|
First American Government Obligations Fund - Class X, 4.25%
|
|
|
Dreyfus Government Cash Management - Class Institutional, 4.21%
|
|
|
Super Micro Computer, Inc. Swap: Maturity Date: 10/16/2025
|
|
|
Super Micro Computer, Inc. Swap: Maturity Date: 12/09/2025
|
|
|
Super Micro Computer, Inc. Swap: Maturity Date: 09/29/2025
|
* Less than 0.05% of net assets. ^ Less than -0.05% of net assets. ~ Percentages for swap contracts are based unrealized appreciation (depreciation). Monthly reset swap values are not presented, as the unrealized appreciation (depreciation) resets at each month-end.
Material Fund Changes: Effective November 18, 2024 , the Fund executed a 1:20 reverse stock split of its issued and outstanding shares.
What were the Fund costs for the past year?
(based on a hypothetical $10,000 investment)
|
Fund Name
|
Costs of a $10,000 investment
|
Costs paid as a percentage of a $10,000 investment
|
|---|---|---|
|
Defiance Daily Target 2X Short SMCI ETF
|
$
10
|
1.29
%
|
Costs paid as a percentage of a $10,000 investment is an annualized figure. The Fund commenced operations March 31, 2025. Expenses for a full reporting period would be higher than the figures shown.
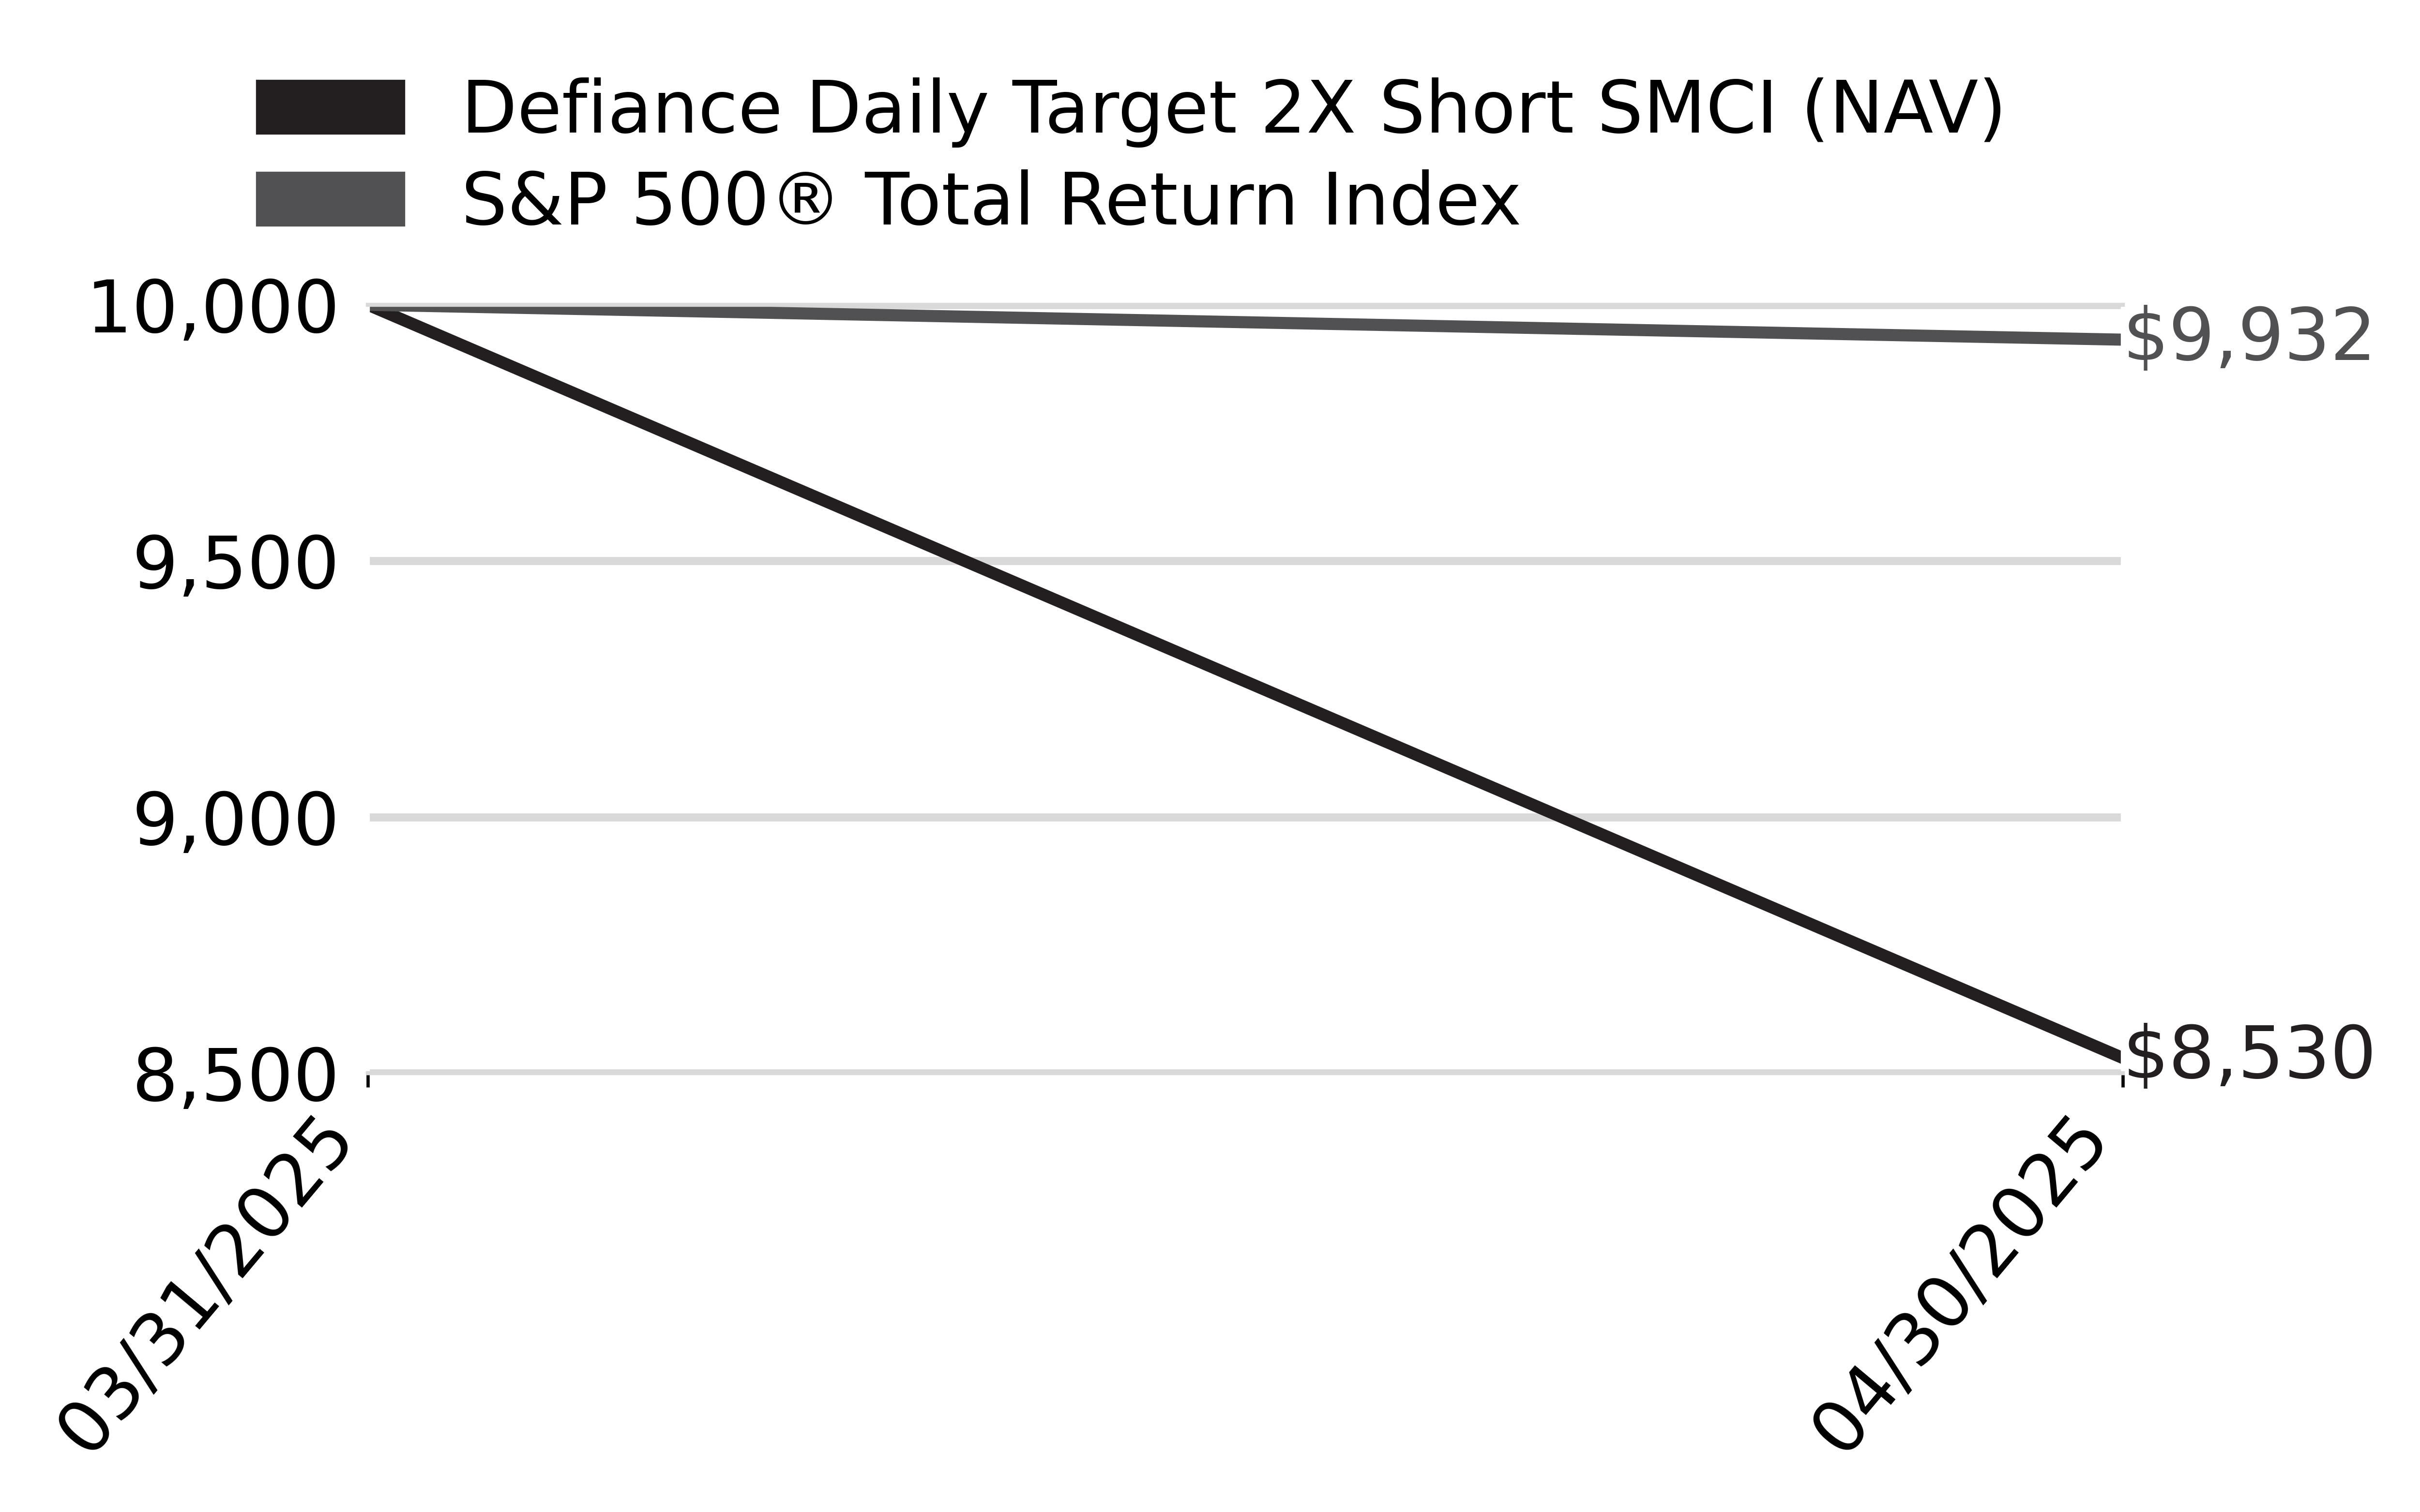
How did the Fund perform last year and what affected its performance?
From inception through 4/30/25, SMCZ had a NAV return of -14.70%. SMCZ seeks to deliver twice the daily inverse performance of SMCI. Therefore, any fluctuations in SMCI’s stock price are magnified in SMCZ. SMCZ's performance was influenced by the underlying movements of SMCI's stock, the effects of leverage and compounding, market volatility, and the fund's derivative strategies. While offering the potential for amplified inverse exposure to SMCI's daily performance, the fund's leveraged structure necessitates careful consideration and active management.
What Factors Influenced Performance
The Fund's 2x leverage means that over periods longer than a day, the effects of compounding can lead to returns that deviate significantly from the expected 2x multiple, especially in volatile markets. High volatility in the underlying stock can exacerbate the compounding effects, leading to greater divergence from the expected performance over time.
Cumulative Performance
(Initial Investment of $10,000)
Annual Performance
|
Returns for the Period ending April 30, 2025
|
Since Inception
3/31/25
|
|---|---|
|
Defiance Daily Target 2X Short SMCI ETF - at NAV
|
-14.70%
|
|
S&P 500
®
Total Return Index
|
-0.68%
|
Key Fund Statistics
(as of April 30, 2025 )
|
Fund Size (Thousands)
|
$
3,839
|
|
Number of Holdings
|
2
|
|
Total Advisory Fee
|
$
1,978
|
|
Portfolio Turnover
|
0
%
|
What did the Fund invest in?
(as of April 30, 2025 )
Security Type (% of net assets)

Security Type - Other Financial Instruments
(% of net assets)

Percentages are based on total net assets. Percentages for swap contracts are based unrealized appreciation (depreciation). Monthly reset swap values are not presented, as the unrealized appreciation (depreciation) resets at each month-end. Cash & Cash Equivalents represents short-term investments and other assets in excess of liabilities.
|
Top Holdings
|
% of Total Net Assets
|
|---|---|
|
First American Government Obligations Fund - Class X, 4.25%
|
|
|
Super Micro Computer, Inc. Swap; Maturity Date: 05/01/2026
|
| * | Percentages for swap contracts are based unrealized appreciation (depreciation). Monthly reset swap values are not presented, as the unrealized appreciation (depreciation) resets at each month-end. |
What were the Fund costs for the past year?
(based on a hypothetical $10,000 investment)
|
Fund Name
|
Costs of a $10,000 investment
|
Costs paid as a percentage of a $10,000 investment
|
|---|---|---|
|
Defiance Daily Target 2X Short MSTR ETF
|
$
45
|
1.29
%
|
Costs paid as a percentage of a $10,000 investment is an annualized figure. The Fund commenced operations August 20, 2024. Expenses for a full reporting period would be higher than the figures shown.
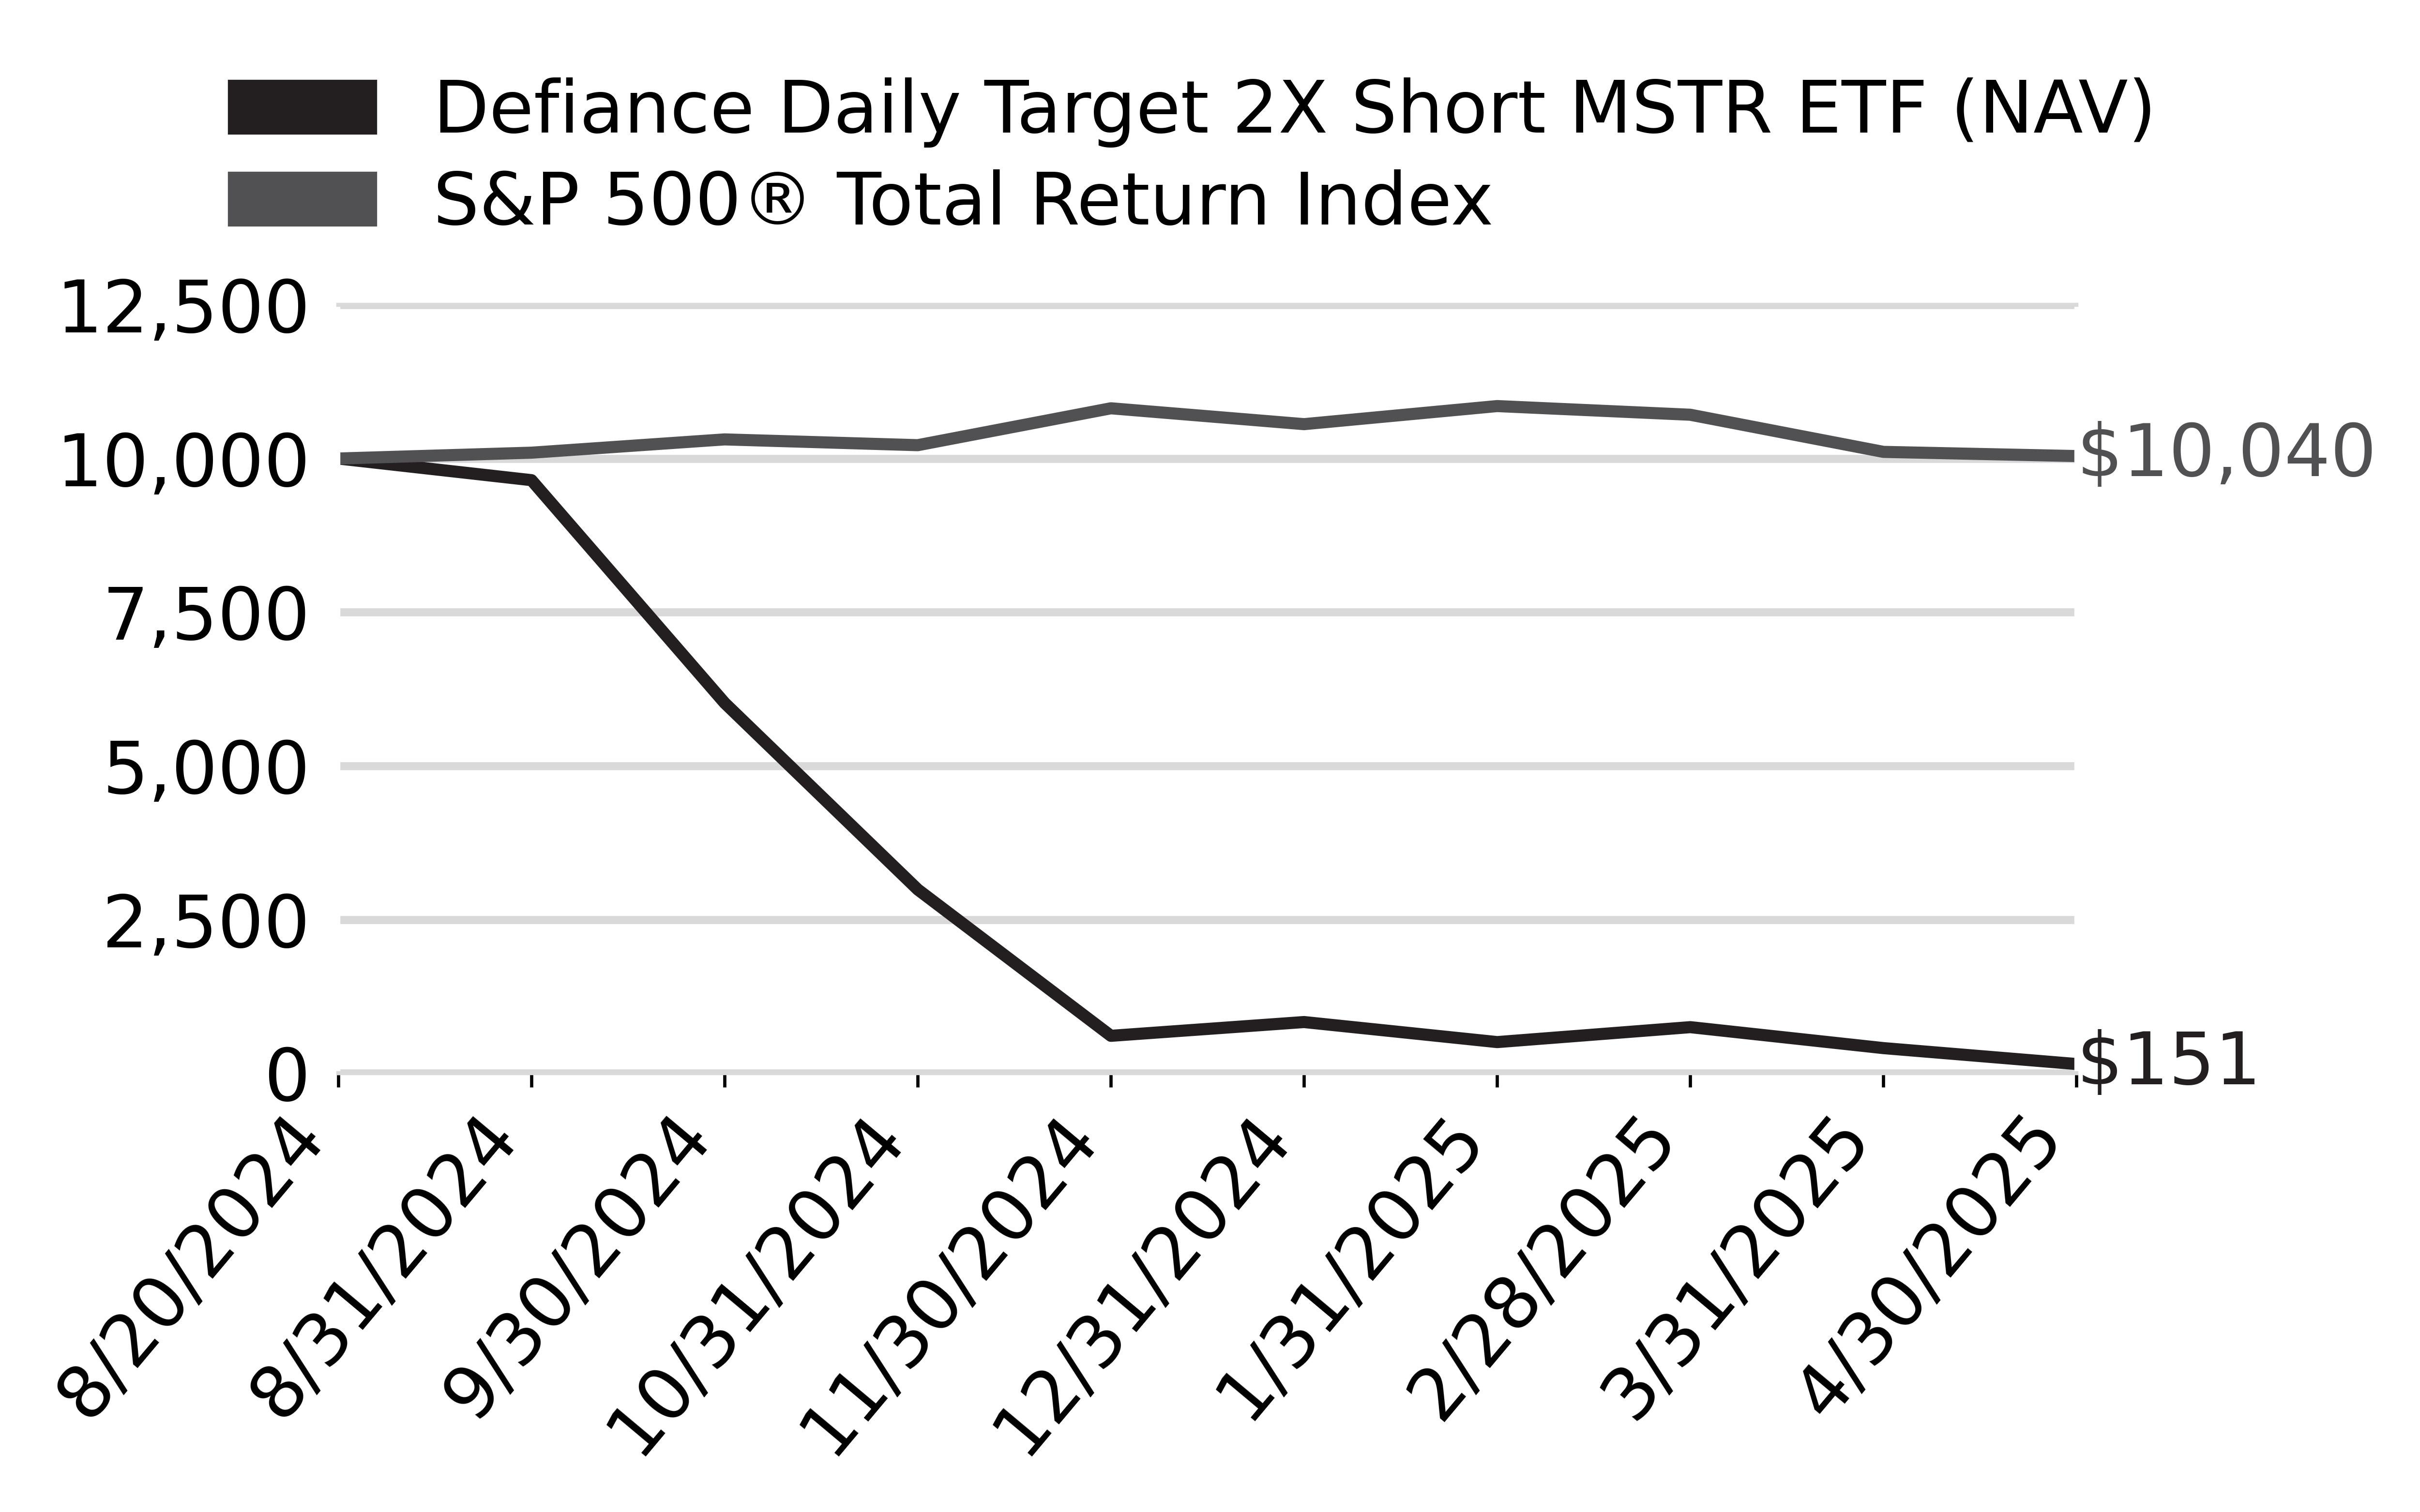
How did the Fund perform last year and what affected its performance?
From inception through 4/30/25, SMST had a NAV return of -98.48%. These losses are primarily attributed to the strong performance of MSTR, which is closely tied to Bitcoin's price movements. Initially launched with -1.5x leverage, SMST increased its leverage to -2x on October 29, 2024, to meet investor demand for higher exposure.
What Factors Influenced Performance
The Fund's 2x leverage means that over periods longer than a day, the effects of compounding can lead to returns that deviate significantly from the expected 2x multiple, especially in volatile markets.
High volatility in the underlying stock can exacerbate the compounding effects, leading to greater divergence from the expected performance over time.
MicroStrategy's significant Bitcoin holdings mean that its stock price is highly correlated with Bitcoin's performance. As Bitcoin rallied, MSTR's stock surged, leading to losses for SMST. SMST's 2x inverse leverage amplifies daily losses when MSTR's stock rises. The compounding effect of daily rebalancing in volatile markets can lead to returns that deviate significantly from the expected -2x multiple over longer periods.
Cumulative Performance
(Initial Investment of $10,000)
Annual Performance
|
Returns for the Period ending April 30, 2025
|
Since Inception
8/20/24
|
|---|---|
|
Defiance Daily Target 2X Short MSTR ETF - at NAV
|
-
98.48
%
|
|
S&P 500
®
Total Return Index
|
0.40
%
|
Key Fund Statistics
(as of April 30, 2025 )
|
Fund Size (Thousands)
|
$
41,744
|
|
Number of Holdings
|
4
|
|
Total Advisory Fee
|
$
271,234
|
|
Portfolio Turnover
|
0
%
|
What did the Fund invest in?
(as of April 30, 2025 )
Security Type (% of net assets)

Security Type - Other Financial Instruments
(% of net assets)
Percentages are based on total net assets. Percentages for swap contracts are based unrealized appreciation (depreciation). Monthly reset swap values are not presented, as the unrealized appreciation (depreciation) resets at each month-end. Cash & Cash Equivalents represents short-term investments and other assets in excess of liabilities.
|
Top Holdings
|
% of Total Net Assets
|
|---|---|
|
First American Government Obligations Fund - Class X, 4.25%
|
|
|
MicroStrategy, Inc. Swap; Maturity Date: 02/01/2026
|
|
|
MicroStrategy, Inc. Swap; Maturity Date: 11/25/2025
|
|
|
MicroStrategy, Inc. Swap; Maturity Date: 09/19/2025
|
| * | Percentages for swap contracts are based unrealized appreciation (depreciation). Monthly reset swap values are not presented, as the unrealized appreciation (depreciation) resets at each month-end. |
Material Fund Changes: Effective November 18, 2024 , the Fund executed a 1:5 reverse stock split on its issued and outstanding shares. Effective May 23, 2025, the Fund executed a 1:20 reverse stock split on its issued and outstanding shares.
What were the Fund costs for the past year?
(based on a hypothetical $10,000 investment)
|
Fund Name
|
Costs of a $10,000 investment
|
Costs paid as a percentage of a $10,000 investment
|
|---|---|---|
|
Defiance Daily Target 2X Long SOFI ETF
|
$
28
|
1.29
%
|
Costs paid as a percentage of a $10,000 investment is an annualized figure. The Fund commenced operations January 15, 2025. Expenses for a full reporting period would be higher than the figures shown.
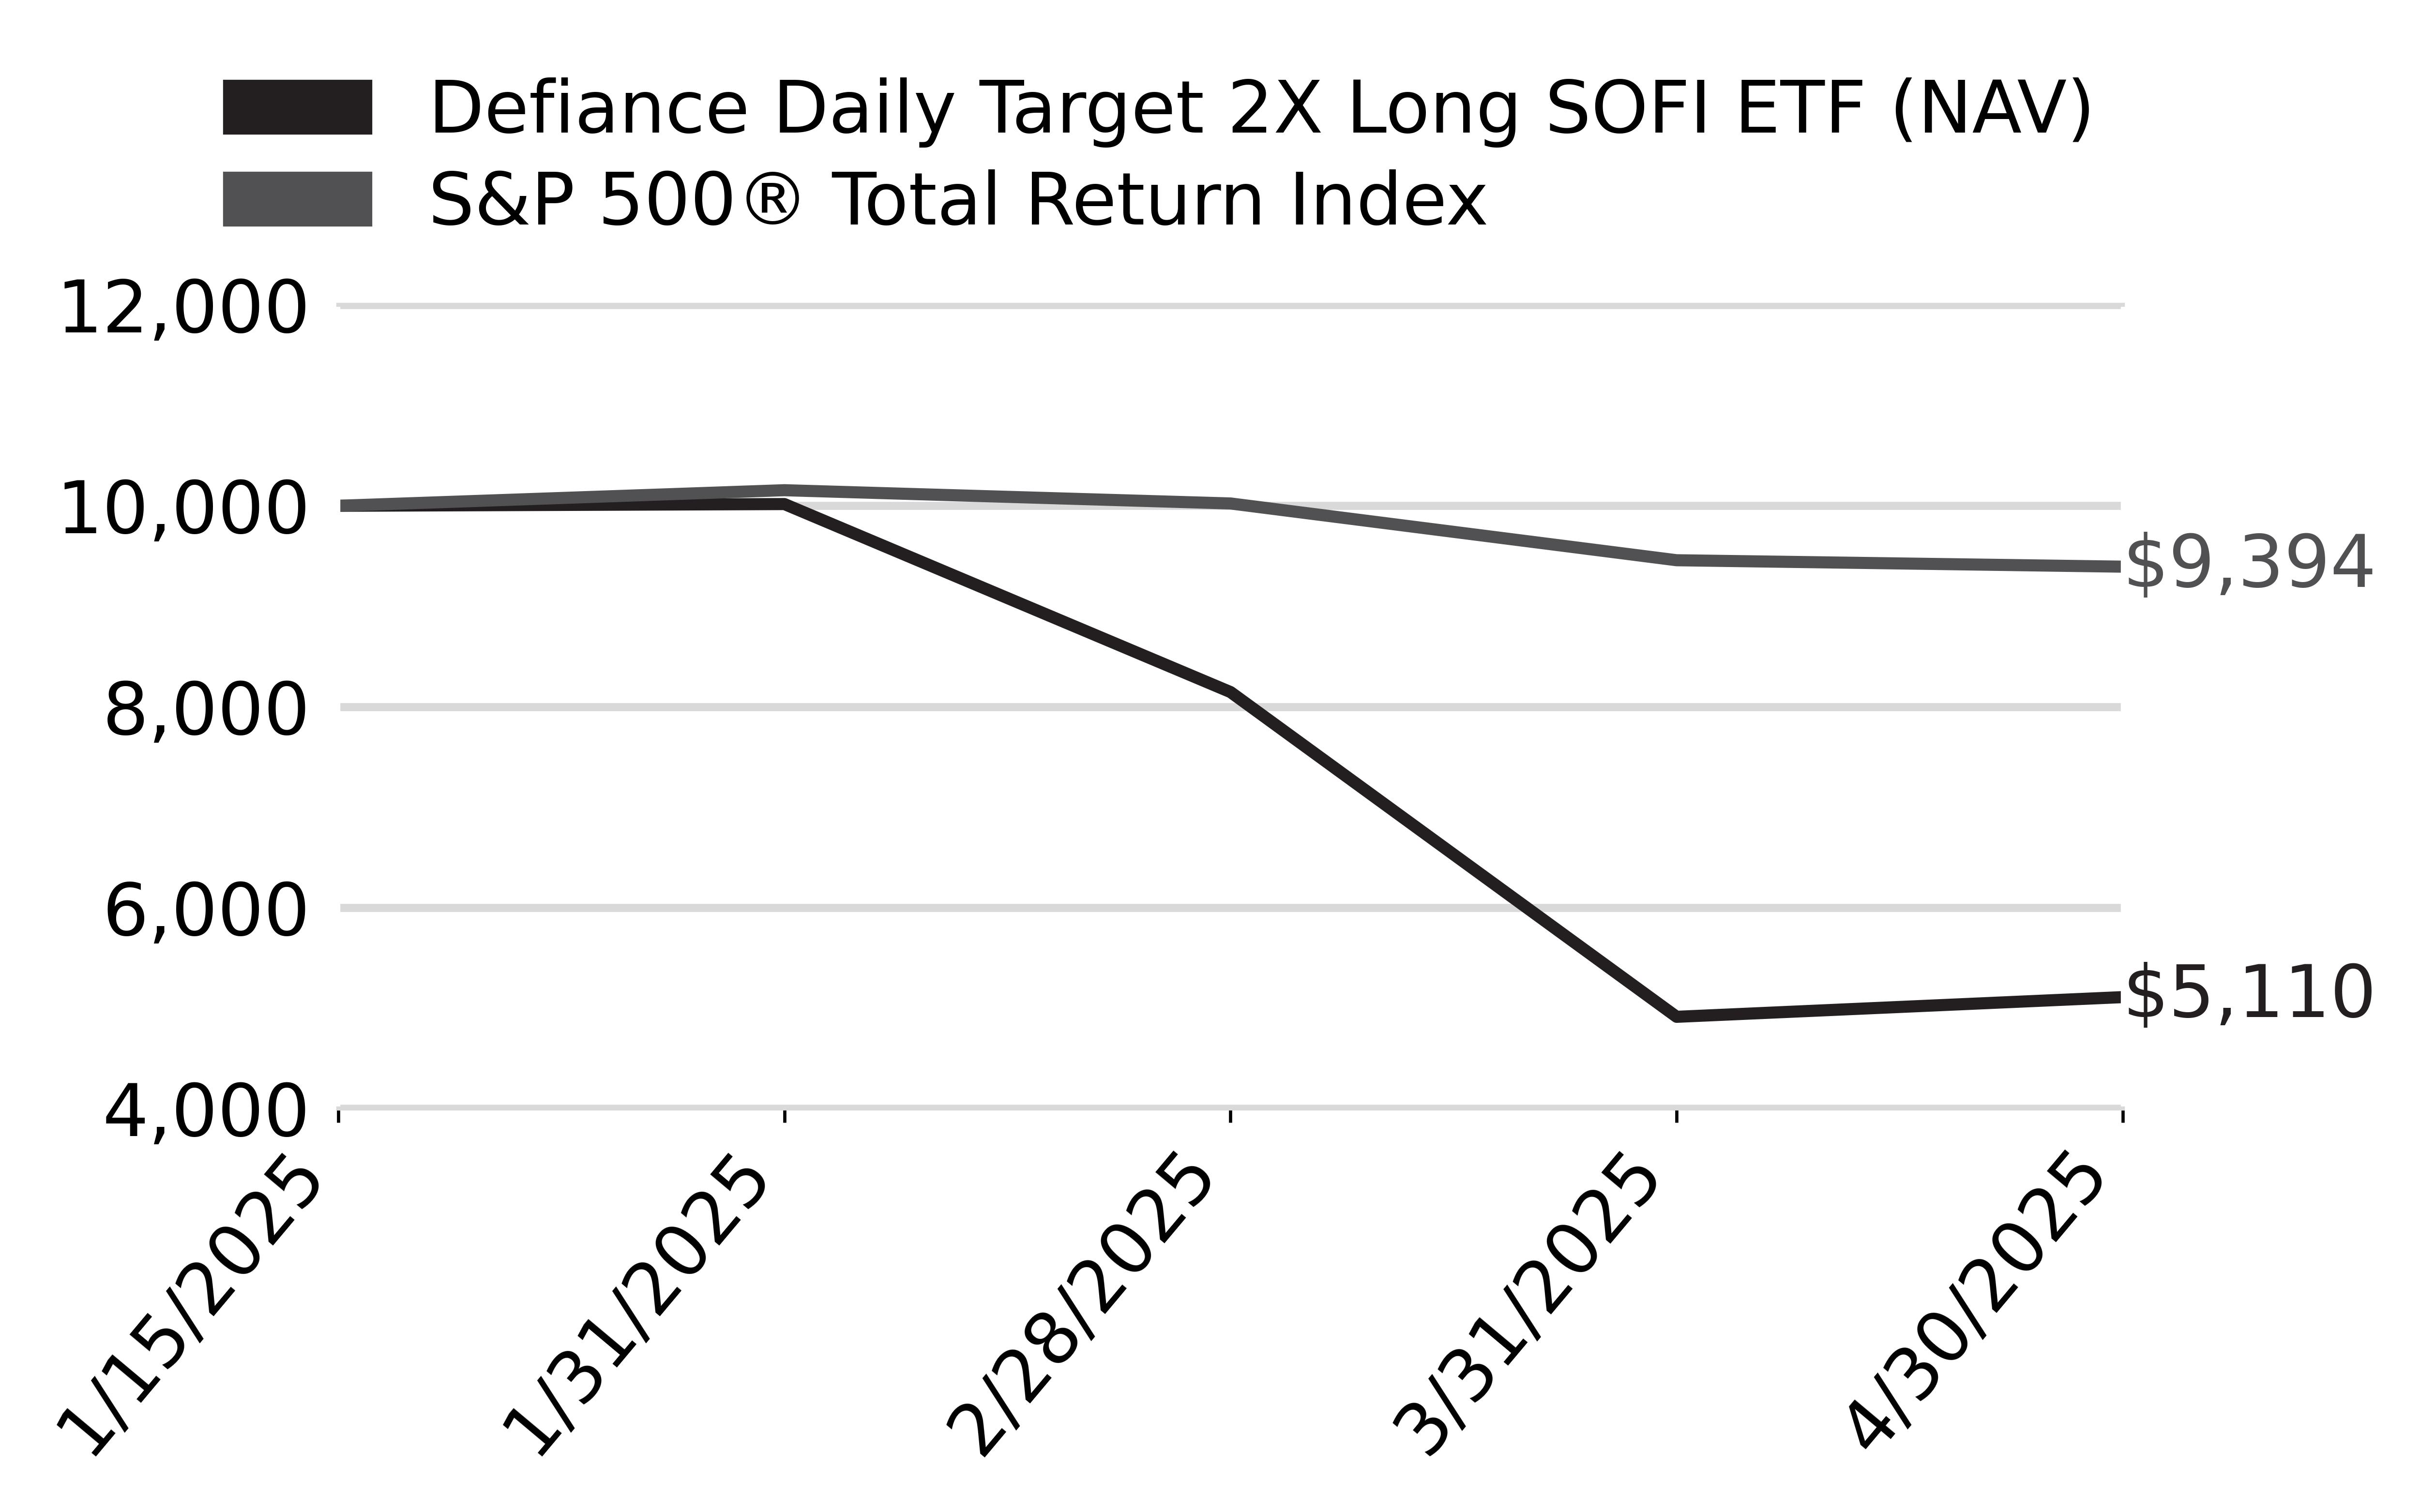
How did the Fund perform last year and what affected its performance?
From inception through 4/30/25, SOFX had a NAV return of -48.85%.%. SOFX's returns are directly tied to the daily performance of SOFI. Any decline in SOFI's stock price will be magnified in SOFX due to its 2x leverage. SOFI's stock performance was influenced by a combination of internal financial projections, strong quarterly results, macroeconomic factors, and analyst sentiments. While the company's conservative 2025 outlook initially led to a stock decline, subsequent positive developments, including raised guidance, helped restore investor confidence.
What Factors Influenced Performance
The Fund's 2x leverage means that over periods longer than a day, the effects of compounding can lead to returns that deviate significantly from the expected 2x multiple, especially in volatile markets.
High volatility in the underlying stock can exacerbate the compounding effects, leading to greater divergence from the expected performance over time.
Cumulative Performance
(Initial Investment of $10,000)
Annual Performance
|
Returns for the Period ending April 30, 2025
|
Since Inception
1/15/25
|
|---|---|
|
Defiance Daily Target 2X Long SOFI ETF - at NAV
|
-
48.85
%
|
|
S&P 500
®
Total Return Index
|
-
6.06
%
|
Key Fund Statistics
(as of April 30, 2025 )
|
Fund Size (Thousands)
|
$
19,325
|
|
Number of Holdings
|
4
|
|
Total Advisory Fee
|
$
37,877
|
|
Portfolio Turnover
|
458
%
|
What did the Fund invest in?
(as of April 30, 2025 )
Security Type (% of net assets)

Security Type - Other Financial Instruments
(% of net assets)
Percentages are based on total net assets. Percentages for swap contracts are based unrealized appreciation (depreciation). Monthly reset swap values are not presented, as the unrealized appreciation (depreciation) resets at each month-end. Cash & Cash Equivalents represents short-term investments and other assets in excess of liabilities.
|
Top Holdings
|
% of Total Net Assets
|
|---|---|
|
SoFi Technologies, Inc.
|
|
|
First American Government Obligations Fund - Class X, 4.25%
|
|
|
SoFi Technologies, Inc. Swap; Maturity Date: 03/06/2026
|
|
|
SoFi Technologies, Inc. Swap; Maturity Date: 02/16/2026
|
| * | Percentages for swap contracts are based unrealized appreciation (depreciation). Monthly reset swap values are not presented, as the unrealized appreciation (depreciation) resets at each month-end. |