Shareholder Report
Apr. 30, 2025
USD ($)
Holding
WHAT WERE THE FUND COSTS FOR THE LAST SIX MONTHS?
(Based on a hypothetical $10,000 investment)
| Fund | Costs of a $10,000 investment | Costs paid as a percentage of a $10,000 investment |
| First Trust Preferred Securities and Income Fund - Class A | $69 | 1.40%(1) |
| (1) |
Annualized.
|
KEY FUND STATISTICS (As of April 30, 2025)
| Fund net assets | $201,492,012 |
| Total number of portfolio holdings | 209 |
| Portfolio turnover rate | 25% |
WHAT DID THE FUND INVEST IN? (As of April 30, 2025)
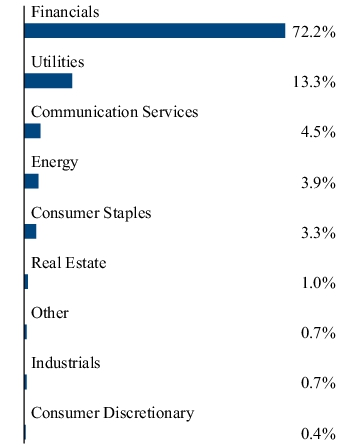
The tables below show the investment makeup of the Fund, representing the percentage of total investments of the Fund.
Top Ten Holdings
| Bank of America Corp., 6.63% | 2.5% |
| Wells Fargo & Co., Series L, 7.50% | 2.3% |
| Barclays PLC, 8.00% | 2.1% |
| JPMorgan Chase & Co., Series NN, 6.88% | 1.7% |
| Credit Agricole S.A., 6.70% | 1.5% |
| Land O'Lakes, Inc., 8.00% | 1.4% |
| BNP Paribas S.A., 8.50% | 1.4% |
| Hartford Financial Services Group (The), Inc., 6.71%, 02/12/47 | 1.3% |
| Charles Schwab (The) Corp., Series H, 4.00% | 1.3% |
| Lloyds Banking Group PLC, 8.00% | 1.3% |
Sector Allocation

Top Ten Holdings
| Bank of America Corp., 6.63% | 2.5% |
| Wells Fargo & Co., Series L, 7.50% | 2.3% |
| Barclays PLC, 8.00% | 2.1% |
| JPMorgan Chase & Co., Series NN, 6.88% | 1.7% |
| Credit Agricole S.A., 6.70% | 1.5% |
| Land O'Lakes, Inc., 8.00% | 1.4% |
| BNP Paribas S.A., 8.50% | 1.4% |
| Hartford Financial Services Group (The), Inc., 6.71%, 02/12/47 | 1.3% |
| Charles Schwab (The) Corp., Series H, 4.00% | 1.3% |
| Lloyds Banking Group PLC, 8.00% | 1.3% |
WHAT WERE THE FUND COSTS FOR THE LAST SIX MONTHS?
(Based on a hypothetical $10,000 investment)
| Fund | Costs of a $10,000 investment | Costs paid as a percentage of a $10,000 investment |
| First Trust Preferred Securities and Income Fund - Class C | $106 | 2.15%(1) |
| (1) |
Annualized.
|
KEY FUND STATISTICS (As of April 30, 2025)
| Fund net assets | $201,492,012 |
| Total number of portfolio holdings | 209 |
| Portfolio turnover rate | 25% |
WHAT DID THE FUND INVEST IN? (As of April 30, 2025)
The tables below show the investment makeup of the Fund, representing the percentage of total investments of the Fund.
Top Ten Holdings
| Bank of America Corp., 6.63% | 2.5% |
| Wells Fargo & Co., Series L, 7.50% | 2.3% |
| Barclays PLC, 8.00% | 2.1% |
| JPMorgan Chase & Co., Series NN, 6.88% | 1.7% |
| Credit Agricole S.A., 6.70% | 1.5% |
| Land O'Lakes, Inc., 8.00% | 1.4% |
| BNP Paribas S.A., 8.50% | 1.4% |
| Hartford Financial Services Group (The), Inc., 6.71%, 02/12/47 | 1.3% |
| Charles Schwab (The) Corp., Series H, 4.00% | 1.3% |
| Lloyds Banking Group PLC, 8.00% | 1.3% |
Sector Allocation

Top Ten Holdings
| Bank of America Corp., 6.63% | 2.5% |
| Wells Fargo & Co., Series L, 7.50% | 2.3% |
| Barclays PLC, 8.00% | 2.1% |
| JPMorgan Chase & Co., Series NN, 6.88% | 1.7% |
| Credit Agricole S.A., 6.70% | 1.5% |
| Land O'Lakes, Inc., 8.00% | 1.4% |
| BNP Paribas S.A., 8.50% | 1.4% |
| Hartford Financial Services Group (The), Inc., 6.71%, 02/12/47 | 1.3% |
| Charles Schwab (The) Corp., Series H, 4.00% | 1.3% |
| Lloyds Banking Group PLC, 8.00% | 1.3% |
WHAT WERE THE FUND COSTS FOR THE LAST SIX MONTHS?
(Based on a hypothetical $10,000 investment)
| Fund | Costs of a $10,000 investment | Costs paid as a percentage of a $10,000 investment |
| First Trust Preferred Securities and Income Fund - Class F | $64 | 1.30%(1) |
| (1) |
Annualized.
|
KEY FUND STATISTICS (As of April 30, 2025)
| Fund net assets | $201,492,012 |
| Total number of portfolio holdings | 209 |
| Portfolio turnover rate | 25% |
WHAT DID THE FUND INVEST IN? (As of April 30, 2025)
The tables below show the investment makeup of the Fund, representing the percentage of total investments of the Fund.
Top Ten Holdings
| Bank of America Corp., 6.63% | 2.5% |
| Wells Fargo & Co., Series L, 7.50% | 2.3% |
| Barclays PLC, 8.00% | 2.1% |
| JPMorgan Chase & Co., Series NN, 6.88% | 1.7% |
| Credit Agricole S.A., 6.70% | 1.5% |
| Land O'Lakes, Inc., 8.00% | 1.4% |
| BNP Paribas S.A., 8.50% | 1.4% |
| Hartford Financial Services Group (The), Inc., 6.71%, 02/12/47 | 1.3% |
| Charles Schwab (The) Corp., Series H, 4.00% | 1.3% |
| Lloyds Banking Group PLC, 8.00% | 1.3% |
Sector Allocation
Top Ten Holdings
| Bank of America Corp., 6.63% | 2.5% |
| Wells Fargo & Co., Series L, 7.50% | 2.3% |
| Barclays PLC, 8.00% | 2.1% |
| JPMorgan Chase & Co., Series NN, 6.88% | 1.7% |
| Credit Agricole S.A., 6.70% | 1.5% |
| Land O'Lakes, Inc., 8.00% | 1.4% |
| BNP Paribas S.A., 8.50% | 1.4% |
| Hartford Financial Services Group (The), Inc., 6.71%, 02/12/47 | 1.3% |
| Charles Schwab (The) Corp., Series H, 4.00% | 1.3% |
| Lloyds Banking Group PLC, 8.00% | 1.3% |
WHAT WERE THE FUND COSTS FOR THE LAST SIX MONTHS?
(Based on a hypothetical $10,000 investment)
| Fund | Costs of a $10,000 investment | Costs paid as a percentage of a $10,000 investment |
| First Trust Preferred Securities and Income Fund - Class I | $53 | 1.08%(1) |
| (1) |
Annualized.
|
KEY FUND STATISTICS (As of April 30, 2025)
| Fund net assets | $201,492,012 |
| Total number of portfolio holdings | 209 |
| Portfolio turnover rate | 25% |
WHAT DID THE FUND INVEST IN? (As of April 30, 2025)
The tables below show the investment makeup of the Fund, representing the percentage of total investments of the Fund.
Top Ten Holdings
| Bank of America Corp., 6.63% | 2.5% |
| Wells Fargo & Co., Series L, 7.50% | 2.3% |
| Barclays PLC, 8.00% | 2.1% |
| JPMorgan Chase & Co., Series NN, 6.88% | 1.7% |
| Credit Agricole S.A., 6.70% | 1.5% |
| Land O'Lakes, Inc., 8.00% | 1.4% |
| BNP Paribas S.A., 8.50% | 1.4% |
| Hartford Financial Services Group (The), Inc., 6.71%, 02/12/47 | 1.3% |
| Charles Schwab (The) Corp., Series H, 4.00% | 1.3% |
| Lloyds Banking Group PLC, 8.00% | 1.3% |
Sector Allocation

Top Ten Holdings
| Bank of America Corp., 6.63% | 2.5% |
| Wells Fargo & Co., Series L, 7.50% | 2.3% |
| Barclays PLC, 8.00% | 2.1% |
| JPMorgan Chase & Co., Series NN, 6.88% | 1.7% |
| Credit Agricole S.A., 6.70% | 1.5% |
| Land O'Lakes, Inc., 8.00% | 1.4% |
| BNP Paribas S.A., 8.50% | 1.4% |
| Hartford Financial Services Group (The), Inc., 6.71%, 02/12/47 | 1.3% |
| Charles Schwab (The) Corp., Series H, 4.00% | 1.3% |
| Lloyds Banking Group PLC, 8.00% | 1.3% |
WHAT WERE THE FUND COSTS FOR THE LAST SIX MONTHS?
(Based on a hypothetical $10,000 investment)
| Fund | Costs of a $10,000 investment | Costs paid as a percentage of a $10,000 investment |
| First Trust Preferred Securities and Income Fund - Class R3 | $82 | 1.65%(1) |
| (1) |
Annualized.
|
KEY FUND STATISTICS (As of April 30, 2025)
| Fund net assets | $201,492,012 |
| Total number of portfolio holdings | 209 |
| Portfolio turnover rate | 25% |
WHAT DID THE FUND INVEST IN? (As of April 30, 2025)
The tables below show the investment makeup of the Fund, representing the percentage of total investments of the Fund.
Top Ten Holdings
| Bank of America Corp., 6.63% | 2.5% |
| Wells Fargo & Co., Series L, 7.50% | 2.3% |
| Barclays PLC, 8.00% | 2.1% |
| JPMorgan Chase & Co., Series NN, 6.88% | 1.7% |
| Credit Agricole S.A., 6.70% | 1.5% |
| Land O'Lakes, Inc., 8.00% | 1.4% |
| BNP Paribas S.A., 8.50% | 1.4% |
| Hartford Financial Services Group (The), Inc., 6.71%, 02/12/47 | 1.3% |
| Charles Schwab (The) Corp., Series H, 4.00% | 1.3% |
| Lloyds Banking Group PLC, 8.00% | 1.3% |
Sector Allocation

Top Ten Holdings
| Bank of America Corp., 6.63% | 2.5% |
| Wells Fargo & Co., Series L, 7.50% | 2.3% |
| Barclays PLC, 8.00% | 2.1% |
| JPMorgan Chase & Co., Series NN, 6.88% | 1.7% |
| Credit Agricole S.A., 6.70% | 1.5% |
| Land O'Lakes, Inc., 8.00% | 1.4% |
| BNP Paribas S.A., 8.50% | 1.4% |
| Hartford Financial Services Group (The), Inc., 6.71%, 02/12/47 | 1.3% |
| Charles Schwab (The) Corp., Series H, 4.00% | 1.3% |
| Lloyds Banking Group PLC, 8.00% | 1.3% |
WHAT WERE THE FUND COSTS FOR THE LAST SIX MONTHS?
(Based on a hypothetical $10,000 investment)
| Fund | Costs of a $10,000 investment | Costs paid as a percentage of a $10,000 investment |
| First Trust/Confluence Small Cap Value Fund - Class A | $75 | 1.60%(1) |
| (1) |
Annualized.
|
KEY FUND STATISTICS (As of April 30, 2025)
| Fund net assets | $17,766,167 |
| Total number of portfolio holdings | 33 |
| Portfolio turnover rate | 13% |
WHAT DID THE FUND INVEST IN? (As of April 30, 2025)
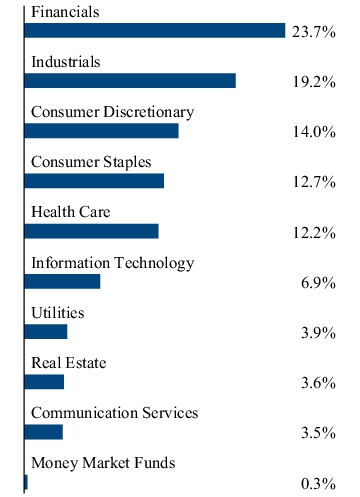
The tables below show the investment makeup of the Fund, representing the percentage of total investments of the Fund.
Top Ten Holdings
| SJW Group | 3.9% |
| Baldwin Insurance (The) Group, Inc. | 3.9% |
| JBT Marel Corp. | 3.8% |
| Hagerty, Inc., Class A | 3.8% |
| I3 Verticals, Inc., Class A | 3.8% |
| Altus Group Ltd. | 3.6% |
| Sapiens International Corp., N.V. | 3.5% |
| Cavco Industries, Inc. | 3.5% |
| TripAdvisor, Inc. | 3.5% |
| J&J Snack Foods Corp. | 3.5% |
Sector Allocation

Top Ten Holdings
| SJW Group | 3.9% |
| Baldwin Insurance (The) Group, Inc. | 3.9% |
| JBT Marel Corp. | 3.8% |
| Hagerty, Inc., Class A | 3.8% |
| I3 Verticals, Inc., Class A | 3.8% |
| Altus Group Ltd. | 3.6% |
| Sapiens International Corp., N.V. | 3.5% |
| Cavco Industries, Inc. | 3.5% |
| TripAdvisor, Inc. | 3.5% |
| J&J Snack Foods Corp. | 3.5% |
WHAT WERE THE FUND COSTS FOR THE LAST SIX MONTHS?
(Based on a hypothetical $10,000 investment)
| Fund | Costs of a $10,000 investment | Costs paid as a percentage of a $10,000 investment |
| First Trust/Confluence Small Cap Value Fund - Class C | $110 | 2.35%(1) |
| (1) |
Annualized.
|
KEY FUND STATISTICS (As of April 30, 2025)
| Fund net assets | $17,766,167 |
| Total number of portfolio holdings | 33 |
| Portfolio turnover rate | 13% |
WHAT DID THE FUND INVEST IN? (As of April 30, 2025)
The tables below show the investment makeup of the Fund, representing the percentage of total investments of the Fund.
Top Ten Holdings
| SJW Group | 3.9% |
| Baldwin Insurance (The) Group, Inc. | 3.9% |
| JBT Marel Corp. | 3.8% |
| Hagerty, Inc., Class A | 3.8% |
| I3 Verticals, Inc., Class A | 3.8% |
| Altus Group Ltd. | 3.6% |
| Sapiens International Corp., N.V. | 3.5% |
| Cavco Industries, Inc. | 3.5% |
| TripAdvisor, Inc. | 3.5% |
| J&J Snack Foods Corp. | 3.5% |
Sector Allocation
Top Ten Holdings
| SJW Group | 3.9% |
| Baldwin Insurance (The) Group, Inc. | 3.9% |
| JBT Marel Corp. | 3.8% |
| Hagerty, Inc., Class A | 3.8% |
| I3 Verticals, Inc., Class A | 3.8% |
| Altus Group Ltd. | 3.6% |
| Sapiens International Corp., N.V. | 3.5% |
| Cavco Industries, Inc. | 3.5% |
| TripAdvisor, Inc. | 3.5% |
| J&J Snack Foods Corp. | 3.5% |
WHAT WERE THE FUND COSTS FOR THE LAST SIX MONTHS?
(Based on a hypothetical $10,000 investment)
| Fund | Costs of a $10,000 investment | Costs paid as a percentage of a $10,000 investment |
| First Trust/Confluence Small Cap Value Fund - Class I | $63 | 1.35%(1) |
| (1) |
Annualized.
|
KEY FUND STATISTICS (As of April 30, 2025)
| Fund net assets | $17,766,167 |
| Total number of portfolio holdings | 33 |
| Portfolio turnover rate | 13% |
WHAT DID THE FUND INVEST IN? (As of April 30, 2025)
The tables below show the investment makeup of the Fund, representing the percentage of total investments of the Fund.
Top Ten Holdings
| SJW Group | 3.9% |
| Baldwin Insurance (The) Group, Inc. | 3.9% |
| JBT Marel Corp. | 3.8% |
| Hagerty, Inc., Class A | 3.8% |
| I3 Verticals, Inc., Class A | 3.8% |
| Altus Group Ltd. | 3.6% |
| Sapiens International Corp., N.V. | 3.5% |
| Cavco Industries, Inc. | 3.5% |
| TripAdvisor, Inc. | 3.5% |
| J&J Snack Foods Corp. | 3.5% |
Sector Allocation

Top Ten Holdings
| SJW Group | 3.9% |
| Baldwin Insurance (The) Group, Inc. | 3.9% |
| JBT Marel Corp. | 3.8% |
| Hagerty, Inc., Class A | 3.8% |
| I3 Verticals, Inc., Class A | 3.8% |
| Altus Group Ltd. | 3.6% |
| Sapiens International Corp., N.V. | 3.5% |
| Cavco Industries, Inc. | 3.5% |
| TripAdvisor, Inc. | 3.5% |
| J&J Snack Foods Corp. | 3.5% |
WHAT WERE THE FUND COSTS FOR THE LAST SIX MONTHS?
(Based on a hypothetical $10,000 investment)
| Fund | Costs of a $10,000 investment | Costs paid as a percentage of a $10,000 investment |
| First Trust Short Duration High Income Fund - Class A | $63 | 1.25%(1) |
| (1) |
Annualized.
|
KEY FUND STATISTICS (As of April 30, 2025)
| Fund net assets | $68,352,076 |
| Total number of portfolio holdings | 222 |
| Portfolio turnover rate | 45% |
WHAT DID THE FUND INVEST IN? (As of April 30, 2025)
The tables below show the investment makeup of the Fund, representing the percentage of net assets and total investments, respectively, of the Fund.
Fund Allocation
| Corporate Bonds and Notes | 47.4% |
| Senior Floating-Rate Loan Interests | 35.4% |
| Foreign Corporate Bonds and Notes | 9.1% |
| Money Market Funds | 8.5% |
| Common Stocks | 0.0% |
| Rights | 0.0% |
| Net Other Assets and Liabilities | (0.4)% |
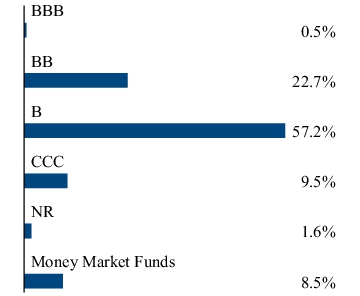
Credit Quality(2)

Any amount shown as 0.0% represents less than 0.1%.
(2) The ratings are by S&P Global Ratings. A credit rating is an assessment provided by a nationally recognized statistical rating organization (NRSRO) of the creditworthiness of an issuer with respect to debt obligations except for those debt obligations that are only privately rated. Ratings are measured on a scale that generally ranges from AAA (highest) to D (lowest). Investment grade is defined as those issuers that have a long-term credit rating of BBB- or higher. "NR" indicates no rating. The credit ratings shown relate to the creditworthiness of the issuers of the underlying securities in the Fund, and not to the Fund or its shares. Credit ratings are subject to change.
WHAT WERE THE FUND COSTS FOR THE LAST SIX MONTHS?
(Based on a hypothetical $10,000 investment)
| Fund | Costs of a $10,000 investment | Costs paid as a percentage of a $10,000 investment |
| First Trust Short Duration High Income Fund - Class C | $100 | 2.00%(1) |
| (1) |
Annualized.
|
KEY FUND STATISTICS (As of April 30, 2025)
| Fund net assets | $68,352,076 |
| Total number of portfolio holdings | 222 |
| Portfolio turnover rate | 45% |
WHAT DID THE FUND INVEST IN? (As of April 30, 2025)
The tables below show the investment makeup of the Fund, representing the percentage of net assets and total investments, respectively, of the Fund.
Fund Allocation
| Corporate Bonds and Notes | 47.4% |
| Senior Floating-Rate Loan Interests | 35.4% |
| Foreign Corporate Bonds and Notes | 9.1% |
| Money Market Funds | 8.5% |
| Common Stocks | 0.0% |
| Rights | 0.0% |
| Net Other Assets and Liabilities | (0.4)% |
Credit Quality(2)
Any amount shown as 0.0% represents less than 0.1%.
(2) The ratings are by S&P Global Ratings. A credit rating is an assessment provided by a nationally recognized statistical rating organization (NRSRO) of the creditworthiness of an issuer with respect to debt obligations except for those debt obligations that are only privately rated. Ratings are measured on a scale that generally ranges from AAA (highest) to D (lowest). Investment grade is defined as those issuers that have a long-term credit rating of BBB- or higher. "NR" indicates no rating. The credit ratings shown relate to the creditworthiness of the issuers of the underlying securities in the Fund, and not to the Fund or its shares. Credit ratings are subject to change.
WHAT WERE THE FUND COSTS FOR THE LAST SIX MONTHS?
(Based on a hypothetical $10,000 investment)
| Fund | Costs of a $10,000 investment | Costs paid as a percentage of a $10,000 investment |
| First Trust Short Duration High Income Fund - Class I | $50 | 1.00%(1) |
| (1) |
Annualized.
|
KEY FUND STATISTICS (As of April 30, 2025)
| Fund net assets | $68,352,076 |
| Total number of portfolio holdings | 222 |
| Portfolio turnover rate | 45% |
WHAT DID THE FUND INVEST IN? (As of April 30, 2025)
The tables below show the investment makeup of the Fund, representing the percentage of net assets and total investments, respectively, of the Fund.
Fund Allocation
| Corporate Bonds and Notes | 47.4% |
| Senior Floating-Rate Loan Interests | 35.4% |
| Foreign Corporate Bonds and Notes | 9.1% |
| Money Market Funds | 8.5% |
| Common Stocks | 0.0% |
| Rights | 0.0% |
| Net Other Assets and Liabilities | (0.4)% |
Credit Quality(2)

Any amount shown as 0.0% represents less than 0.1%.
(2) The ratings are by S&P Global Ratings. A credit rating is an assessment provided by a nationally recognized statistical rating organization (NRSRO) of the creditworthiness of an issuer with respect to debt obligations except for those debt obligations that are only privately rated. Ratings are measured on a scale that generally ranges from AAA (highest) to D (lowest). Investment grade is defined as those issuers that have a long-term credit rating of BBB- or higher. "NR" indicates no rating. The credit ratings shown relate to the creditworthiness of the issuers of the underlying securities in the Fund, and not to the Fund or its shares. Credit ratings are subject to change.
WHAT WERE THE FUND COSTS FOR THE LAST SIX MONTHS?
(Based on a hypothetical $10,000 investment)
| Fund | Costs of a $10,000 investment | Costs paid as a percentage of a $10,000 investment |
| First Trust Managed Municipal Fund - Class A | $14(1) | 0.90%(2) |
| (1) |
Class A Shares commenced investment operations on March 4, 2025. Had the class been in operation for a complete six months, the cost of a $10,000 investment would have been higher.
|
| (2) |
Annualized.
|
KEY FUND STATISTICS (As of April 30, 2025)
| Fund net assets | $70,078,815 |
| Total number of portfolio holdings | 134 |
| Portfolio turnover rate | 15% |
WHAT DID THE FUND INVEST IN? (As of April 30, 2025)
The tables below show the investment makeup of the Fund, representing the percentage of total investments of the Fund.
Credit Quality(1)
| AAA | 4.6 |
| AA | 35.5 |
| A | 32.8 |
| BBB | 12.5 |
| BB | 3.0 |
| Not Rated | 11.6 |
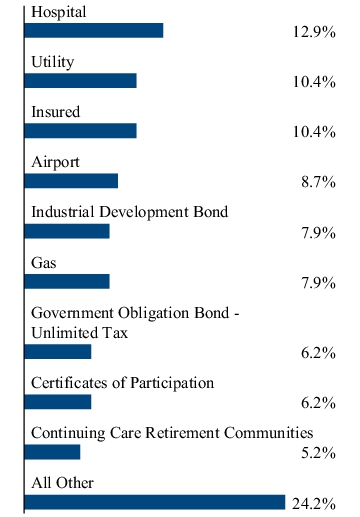
Sector Allocation

(1) The credit quality and ratings information presented above reflect the ratings assigned by one or more nationally recognized statistical rating organizations (NRSROs), including S&P Global Ratings, Moody’s Investors Service, Inc., Fitch Ratings or a comparably rated NRSRO. For situations in which a security is rated by more than one NRSRO and the ratings are not equivalent, the highest rating is used. Sub-investment grade ratings are those rated BB+/Ba1 or lower. Investment grade ratings are those rated BBB-/Baa3 or higher. The credit ratings shown relate to the creditworthiness of the issuers of the underlying securities in the Fund, and not to the Fund or its shares. Credit ratings are subject to change.
WHAT WERE THE FUND COSTS FOR THE LAST SIX MONTHS?
(Based on a hypothetical $10,000 investment)
| Fund | Costs of a $10,000 investment | Costs paid as a percentage of a $10,000 investment |
| First Trust Managed Municipal Fund - Class I | $32 | 0.65%(1) |
| (1) |
Annualized.
|
KEY FUND STATISTICS (As of April 30, 2025)
| Fund net assets | $70,078,815 |
| Total number of portfolio holdings | 134 |
| Portfolio turnover rate | 15% |
WHAT DID THE FUND INVEST IN? (As of April 30, 2025)
The tables below show the investment makeup of the Fund, representing the percentage of total investments of the Fund.
Top Ten Holdings
| AAA | 4.6 |
| AA | 35.5 |
| A | 32.8 |
| BBB | 12.5 |
| BB | 3.0 |
| Not Rated | 11.6 |
Sector Allocation
(1) The credit quality and ratings information presented above reflect the ratings assigned by one or more nationally recognized statistical rating organizations (NRSROs), including S&P Global Ratings, Moody’s Investors Service, Inc., Fitch Ratings or a comparably rated NRSRO. For situations in which a security is rated by more than one NRSRO and the ratings are not equivalent, the highest rating is used. Sub-investment grade ratings are those rated BB+/Ba1 or lower. Investment grade ratings are those rated BBB-/Baa3 or higher. The credit ratings shown relate to the creditworthiness of the issuers of the underlying securities in the Fund, and not to the Fund or its shares. Credit ratings are subject to change.
| [1] | Annualized. |
| [2] | Annualized. |
| [3] | Annualized. |
| [4] | Annualized. |
| [5] | Annualized. |
| [6] | Annualized. |
| [7] | Annualized. |
| [8] | Annualized. |
| [9] | Annualized. |
| [10] | Annualized. |
| [11] | Annualized. |
| [12] | Class A Shares commenced investment operations on March 4, 2025. Had the class been in operation for a complete six months, the cost of a $10,000 investment would have been higher. |
| [13] | Annualized. |
| [14] | Annualized. |