Shareholder Report
|
6 Months Ended |
|
Apr. 30, 2025
USD ($)
Holding
|
|---|
| Shareholder Report [Line Items] |
|
| Document Type |
N-CSRS
|
| Amendment Flag |
false
|
| Registrant Name |
Two Roads Shared Trust
|
| Entity Central Index Key |
0001552947
|
| Entity Investment Company Type |
N-1A
|
| Document Period End Date |
Apr. 30, 2025
|
| C000218403 |
|
| Shareholder Report [Line Items] |
|
| Fund Name |
LeaderShares Activist Leaders ETF
|
| Class Name |
Fund
|
| Trading Symbol |
ACTV
|
| Security Exchange Name |
NYSEArca
|
| Shareholder Report Annual or Semi-Annual |
Semi-Annual Shareholder Report
|
| Material Fund Change Notice [Text Block] |
This report describes changes to the Fund that occurred during the reporting period.
|
| Additional Information Phone Number |
1-888-617-1444
|
| Additional Information Website |
https://www.leadersharesetfs.com/funds/leadershares-activist-leaders-etf
|
| Expenses [Text Block] |
What were the Fund’s costs for the last six months?(based on a hypothetical $10,000 investment) Fund Name | Costs of a $10,000 investment | Costs paid as a percentage of a $10,000 investment |
|---|
LeaderShares Activist Leaders ETF | $36 | 0.75%Footnote Reference* |
|---|
|
| Expenses Paid, Amount |
$ 36
|
| Expense Ratio, Percent |
0.75%
|
| AssetsNet |
$ 16,363,282
|
| Holdings Count | Holding |
19
|
| Advisory Fees Paid, Amount |
$ 216,698
|
| InvestmentCompanyPortfolioTurnover |
97.00%
|
| Additional Fund Statistics [Text Block] |
- Net Assets$16,363,282
- Number of Portfolio Holdings19
- Advisory Fee $216,698
- Portfolio Turnover97%
|
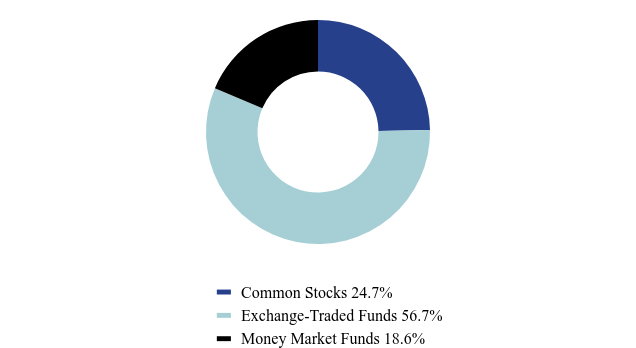
| Holdings [Text Block] |
Asset Weighting (% of total investments)Value | Value |
|---|
Common Stocks | 24.7% | Exchange-Traded Funds | 56.7% | Money Market Funds | 18.6% |
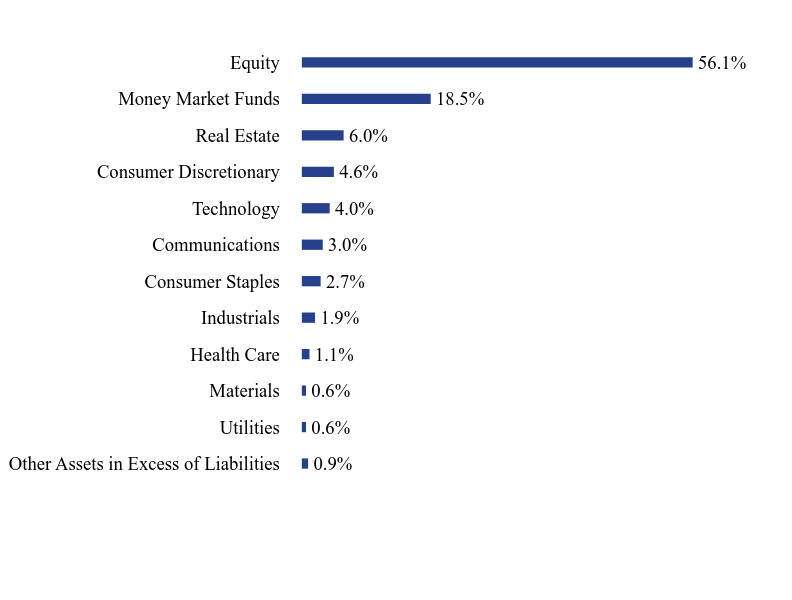
Sector Weighting (% of net assets)Value | Value |
|---|
Other Assets in Excess of Liabilities | 0.9% | Utilities | 0.6% | Materials | 0.6% | Health Care | 1.1% | Industrials | 1.9% | Consumer Staples | 2.7% | Communications | 3.0% | Technology | 4.0% | Consumer Discretionary | 4.6% | Real Estate | 6.0% | Money Market Funds | 18.5% | Equity | 56.1% |
Top 10 Holdings (% of net assets)Holding Name | % of Net Assets |
|---|
Vanguard S&P 500 ETF | 35.1% |
|---|
SPDR S&P 500 ETF Trust ETF | 21.0% |
|---|
Goldman Sachs Financial Square Government Fund, Administration Class | 18.5% |
|---|
Restaurant Brands International, Inc. | 3.4% |
|---|
Healthcare Realty Trust, Inc. | 3.1% |
|---|
Match Group, Inc. | 3.0% |
|---|
Howard Hughes Holdings, Inc. | 2.9% |
|---|
Lamb Weston Holdings, Inc. | 2.7% |
|---|
Vestis Corporation | 1.9% |
|---|
Rapid7, Inc. | 1.9% |
|---|
|
| C000218404 |
|
| Shareholder Report [Line Items] |
|
| Fund Name |
LeaderShares AlphaFactor Tactical Focused ETF
|
| Class Name |
Fund
|
| Trading Symbol |
LSAT
|
| Security Exchange Name |
NYSEArca
|
| Shareholder Report Annual or Semi-Annual |
Semi-Annual Shareholder Report
|
| Material Fund Change Notice [Text Block] |
This report describes changes to the Fund that occurred during the reporting period.
|
| Additional Information Phone Number |
1-888-617-1444
|
| Additional Information Website |
https://www.leadersharesetfs.com/funds/leadershares-tactical-focused-etf
|
| Expenses [Text Block] |
What were the Fund’s costs for the last six months?(based on a hypothetical $10,000 investment) Fund Name | Costs of a $10,000 investment | Costs paid as a percentage of a $10,000 investment |
|---|
LeaderShares AlphaFactor Tactical Focused ETF | $48 | 0.99%Footnote Reference* |
|---|
|
| Expenses Paid, Amount |
$ 48
|
| Expense Ratio, Percent |
0.99%
|
| AssetsNet |
$ 97,888,024
|
| Holdings Count | Holding |
34
|
| Advisory Fees Paid, Amount |
$ 552,870
|
| InvestmentCompanyPortfolioTurnover |
66.00%
|
| Additional Fund Statistics [Text Block] |
- Net Assets$97,888,024
- Number of Portfolio Holdings34
- Advisory Fee $552,870
- Portfolio Turnover66%
|
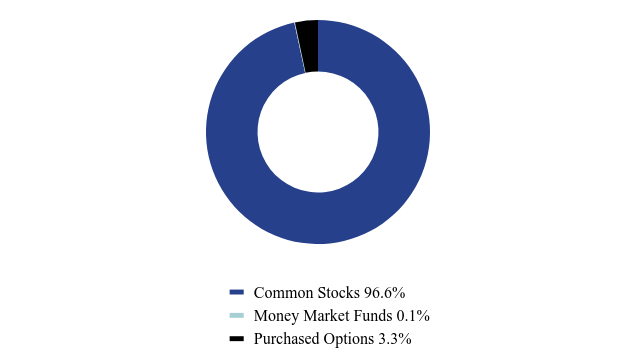
| Holdings [Text Block] |
Asset Weighting (% of total investments)Value | Value |
|---|
Common Stocks | 96.6% | Money Market Funds | 0.1% | Purchased Options | 3.3% |
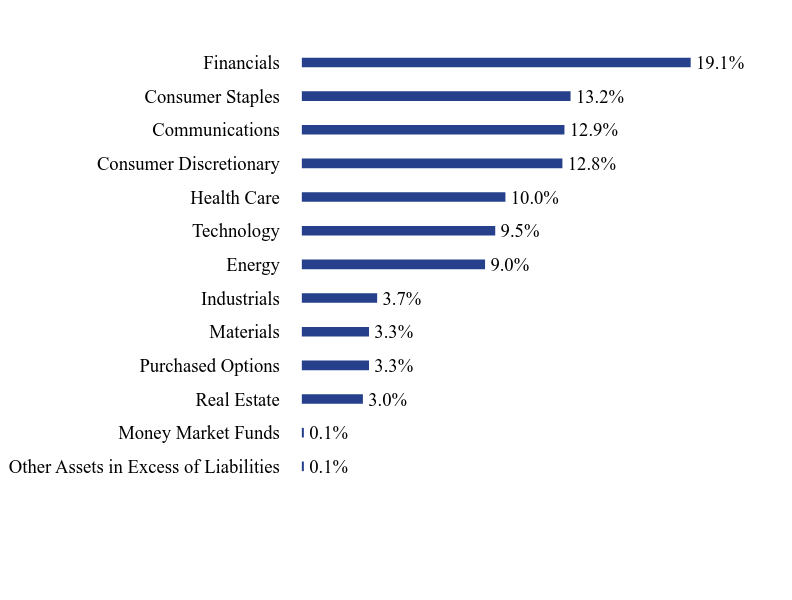
Sector Weighting (% of net assets)Value | Value |
|---|
Other Assets in Excess of Liabilities | 0.1% | Money Market Funds | 0.1% | Real Estate | 3.0% | Purchased Options | 3.3% | Materials | 3.3% | Industrials | 3.7% | Energy | 9.0% | Technology | 9.5% | Health Care | 10.0% | Consumer Discretionary | 12.8% | Communications | 12.9% | Consumer Staples | 13.2% | Financials | 19.1% |
Top 10 Holdings (% of net assets)Holding Name | % of Net Assets |
|---|
VeriSign, Inc. | 3.7% |
|---|
H&R Block, Inc. | 3.7% |
|---|
Premier, Inc., Class A | 3.5% |
|---|
Boyd Gaming Corporation | 3.5% |
|---|
Boston Beer Company, Inc. (The), Class A | 3.4% |
|---|
Monster Beverage Corporation | 3.4% |
|---|
US Foods Holding Corporation | 3.4% |
|---|
MGIC Investment Corporation | 3.4% |
|---|
CF Industries Holdings, Inc. | 3.3% |
|---|
HCA Healthcare, Inc. | 3.3% |
|---|
|
| C000200720 |
|
| Shareholder Report [Line Items] |
|
| Fund Name |
LeaderShares AlphaFactor US Core Equity ETF
|
| Class Name |
Fund
|
| Trading Symbol |
LSAF
|
| Security Exchange Name |
NYSEArca
|
| Shareholder Report Annual or Semi-Annual |
Semi-Annual Shareholder Report
|
| Material Fund Change Notice [Text Block] |
This report describes changes to the Fund that occurred during the reporting period.
|
| Additional Information Phone Number |
1-888-617-1444
|
| Additional Information Website |
https://www.leadersharesetfs.com/funds/leadershares-alphafactor-core-etf
|
| Expenses [Text Block] |
What were the Fund’s costs for the last six months?(based on a hypothetical $10,000 investment) Fund Name | Costs of a $10,000 investment | Costs paid as a percentage of a $10,000 investment |
|---|
LeaderShares AlphaFactor US Core Equity ETF | $36 | 0.75%Footnote Reference* |
|---|
|
| Expenses Paid, Amount |
$ 36
|
| Expense Ratio, Percent |
0.75%
|
| AssetsNet |
$ 131,050,755
|
| Holdings Count | Holding |
100
|
| Advisory Fees Paid, Amount |
$ 542,396
|
| InvestmentCompanyPortfolioTurnover |
80.00%
|
| Additional Fund Statistics [Text Block] |
- Net Assets$131,050,755
- Number of Portfolio Holdings100
- Advisory Fee $542,396
- Portfolio Turnover80%
|
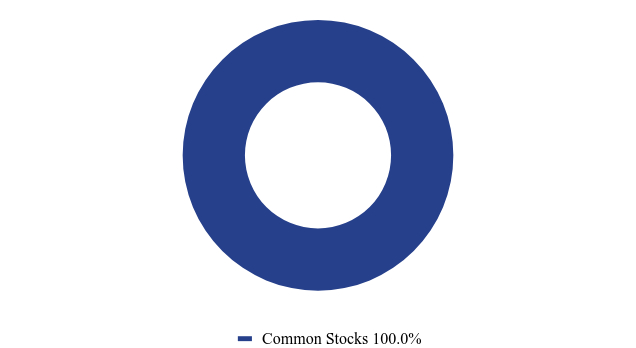
| Holdings [Text Block] |
Asset Weighting (% of total investments)Value | Value |
|---|
Common Stocks | 100.0% |
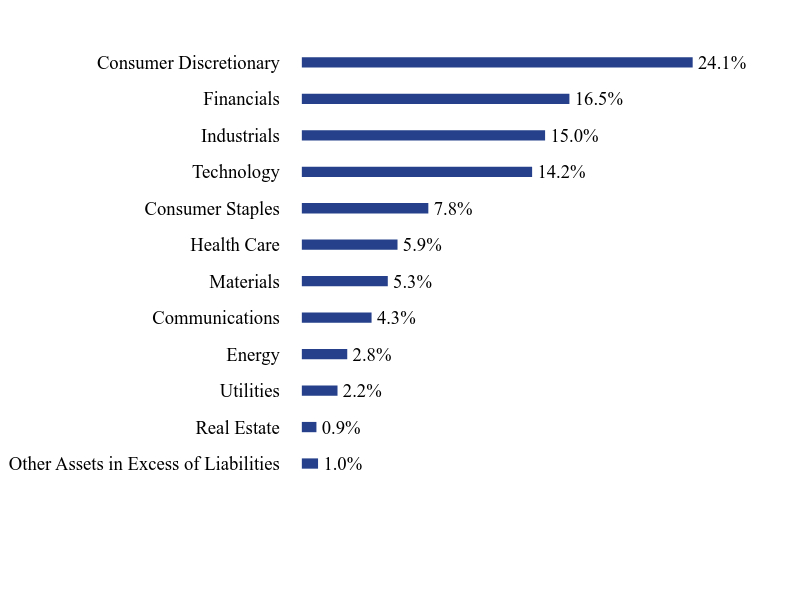
Sector Weighting (% of net assets)Value | Value |
|---|
Other Assets in Excess of Liabilities | 1.0% | Real Estate | 0.9% | Utilities | 2.2% | Energy | 2.8% | Communications | 4.3% | Materials | 5.3% | Health Care | 5.9% | Consumer Staples | 7.8% | Technology | 14.2% | Industrials | 15.0% | Financials | 16.5% | Consumer Discretionary | 24.1% |
Top 10 Holdings (% of net assets)Holding Name | % of Net Assets |
|---|
NRG Energy, Inc. | 1.2% |
|---|
Booking Holdings, Inc. | 1.2% |
|---|
Uber Technologies, Inc. | 1.1% |
|---|
VeriSign, Inc. | 1.1% |
|---|
Carlisle Companies, Inc. | 1.1% |
|---|
H&R Block, Inc. | 1.1% |
|---|
Core & Main, Inc., Class A | 1.1% |
|---|
Curtiss-Wright Corporation | 1.1% |
|---|
EMCOR Group, Inc. | 1.1% |
|---|
Newmont Corporation | 1.1% |
|---|
|
| C000228396 |
|
| Shareholder Report [Line Items] |
|
| Fund Name |
LeaderShares Dynamic Yield ETF
|
| Class Name |
Fund
|
| Trading Symbol |
DYLD
|
| Security Exchange Name |
NYSEArca
|
| Shareholder Report Annual or Semi-Annual |
Semi-Annual Shareholder Report
|
| Material Fund Change Notice [Text Block] |
This report describes changes to the Fund that occurred during the reporting period.
|
| Additional Information Phone Number |
1-888-617-1444
|
| Additional Information Website |
https://www.leadersharesetfs.com/funds/leadershares-dynamic-yield-etf
|
| Expenses [Text Block] |
What were the Fund’s costs for the last six months?(based on a hypothetical $10,000 investment) Fund Name | Costs of a $10,000 investment | Costs paid as a percentage of a $10,000 investment |
|---|
LeaderShares Dynamic Yield ETF | $37 | 0.75%Footnote Reference* |
|---|
|
| Expenses Paid, Amount |
$ 37
|
| Expense Ratio, Percent |
0.75%
|
| AssetsNet |
$ 55,207,963
|
| Holdings Count | Holding |
214
|
| Advisory Fees Paid, Amount |
$ 237,844
|
| InvestmentCompanyPortfolioTurnover |
1.00%
|
| Additional Fund Statistics [Text Block] |
- Net Assets$55,207,963
- Number of Portfolio Holdings214
- Advisory Fee $237,844
- Portfolio Turnover1%
|
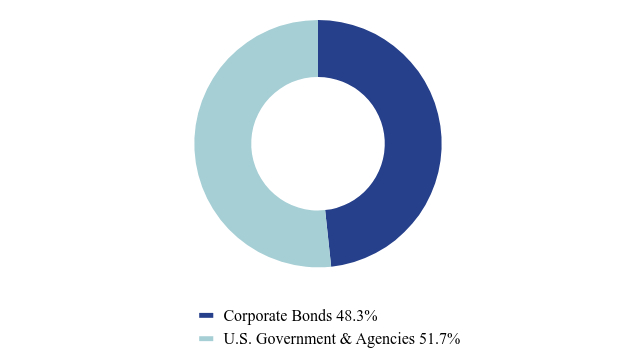
| Holdings [Text Block] |
Asset Weighting (% of total investments)Value | Value |
|---|
Corporate Bonds | 48.3% | U.S. Government & Agencies | 51.7% |
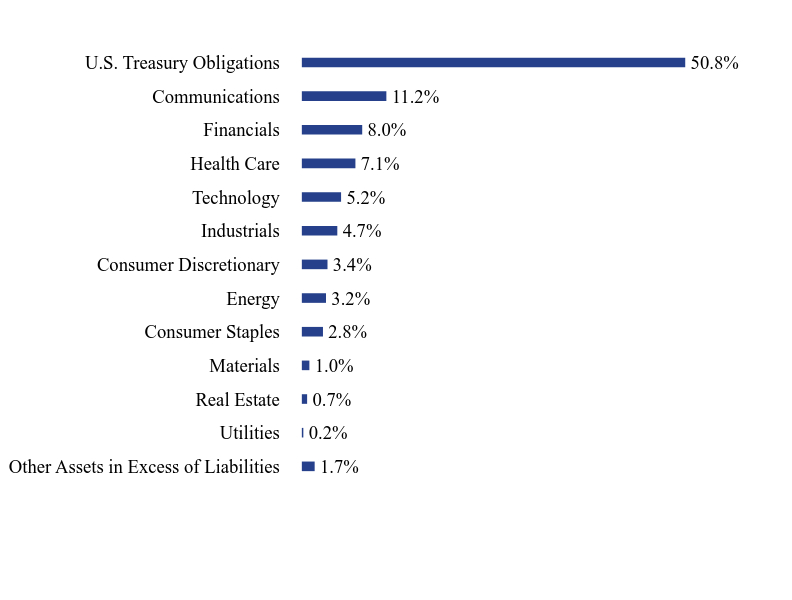
Sector Weighting (% of net assets)Value | Value |
|---|
Other Assets in Excess of Liabilities | 1.7% | Utilities | 0.2% | Real Estate | 0.7% | Materials | 1.0% | Consumer Staples | 2.8% | Energy | 3.2% | Consumer Discretionary | 3.4% | Industrials | 4.7% | Technology | 5.2% | Health Care | 7.1% | Financials | 8.0% | Communications | 11.2% | U.S. Treasury Obligations | 50.8% |
Top 10 Holdings (% of net assets)Holding Name | % of Net Assets |
|---|
United States Treasury Bill, 3.7300%, 05/08/25 | 45.2% |
|---|
United States Treasury Bill, 4.2400%, 08/14/25 | 5.4% |
|---|
DISH DBS Corporation, 5.2500%, 12/01/26 | 0.3% |
|---|
Tenneco, Inc., 8.0000%, 11/17/28 | 0.3% |
|---|
DISH DBS Corporation, 5.7500%, 12/01/28 | 0.3% |
|---|
CCO Holdings, LLC / CCO Holdings Capital, 4.2500%, 01/15/34 | 0.3% |
|---|
CCO Holdings, LLC / CCO Holdings Capital, 4.5000%, 06/01/33 | 0.3% |
|---|
Carnival Corporation, 6.0000%, 05/01/29 | 0.3% |
|---|
DaVita, Inc., 4.6250%, 06/01/30 | 0.3% |
|---|
CCO Holdings, LLC / CCO Holdings Capital, 4.5000%, 05/01/32 | 0.3% |
|---|
|
| C000218405 |
|
| Shareholder Report [Line Items] |
|
| Fund Name |
LeaderShares Equity Skew ETF
|
| Class Name |
Fund
|
| Trading Symbol |
SQEW
|
| Security Exchange Name |
NYSEArca
|
| Shareholder Report Annual or Semi-Annual |
Semi-Annual Shareholder Report
|
| Material Fund Change Notice [Text Block] |
This report describes changes to the Fund that occurred during the reporting period.
|
| Additional Information Phone Number |
1-888-617-1444
|
| Additional Information Website |
https://www.leadersharesetfs.com/funds/leadershares-equity-skew-etf
|
| Expenses [Text Block] |
What were the Fund’s costs for the last six months?(based on a hypothetical $10,000 investment) Fund Name | Costs of a $10,000 investment | Costs paid as a percentage of a $10,000 investment |
|---|
LeaderShares Equity Skew ETF | $36 | 0.75%Footnote Reference* |
|---|
|
| Expenses Paid, Amount |
$ 36
|
| Expense Ratio, Percent |
0.75%
|
| AssetsNet |
$ 60,128,858
|
| Holdings Count | Holding |
155
|
| Advisory Fees Paid, Amount |
$ 329,276
|
| InvestmentCompanyPortfolioTurnover |
101.00%
|
| Additional Fund Statistics [Text Block] |
- Net Assets$60,128,858
- Number of Portfolio Holdings155
- Advisory Fee $329,276
- Portfolio Turnover101%
|
| Holdings [Text Block] |
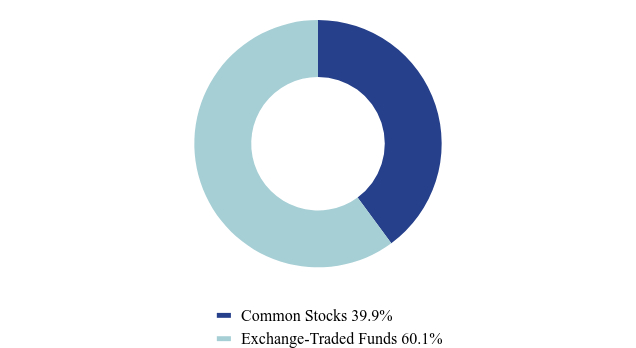
Asset Weighting (% of total investments)Value | Value |
|---|
Common Stocks | 39.9% | Exchange-Traded Funds | 60.1% |
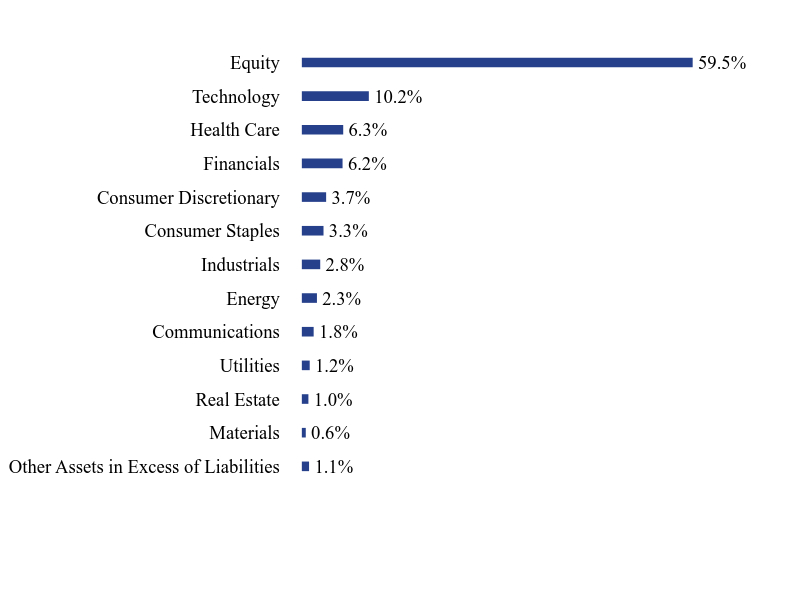
Sector Weighting (% of net assets)Value | Value |
|---|
Other Assets in Excess of Liabilities | 1.1% | Materials | 0.6% | Real Estate | 1.0% | Utilities | 1.2% | Communications | 1.8% | Energy | 2.3% | Industrials | 2.8% | Consumer Staples | 3.3% | Consumer Discretionary | 3.7% | Financials | 6.2% | Health Care | 6.3% | Technology | 10.2% | Equity | 59.5% |
Top 10 Holdings (% of net assets)Holding Name | % of Net Assets |
|---|
Vanguard FTSE Emerging Markets ETF | 28.4% |
|---|
SPDR S&P 600 Small Cap Value ETF | 21.0% |
|---|
iShares S&P Small-Cap 600 Growth ETF | 4.5% |
|---|
SPDR S&P 600 Small Cap Growth ETF | 4.5% |
|---|
Apple, Inc. | 3.7% |
|---|
Microsoft Corporation | 3.2% |
|---|
Amazon.com, Inc. | 1.7% |
|---|
Berkshire Hathaway, Inc., Class B | 1.1% |
|---|
SPDR Portfolio S&P 500 Growth ETF | 1.1% |
|---|
Exxon Mobil Corporation | 0.9% |
|---|
|