What were the Fund costs for the past year?
(based on a hypothetical $10,000 investment)
|
Class
Name |
Costs
of a $10,000 investment |
Costs
paid as a percentage of a $10,000 investment |
|---|---|---|
|
Applied
Finance Dividend Fund
- Institutional Class |
$99 |
0.97% |
How did the Fund perform?
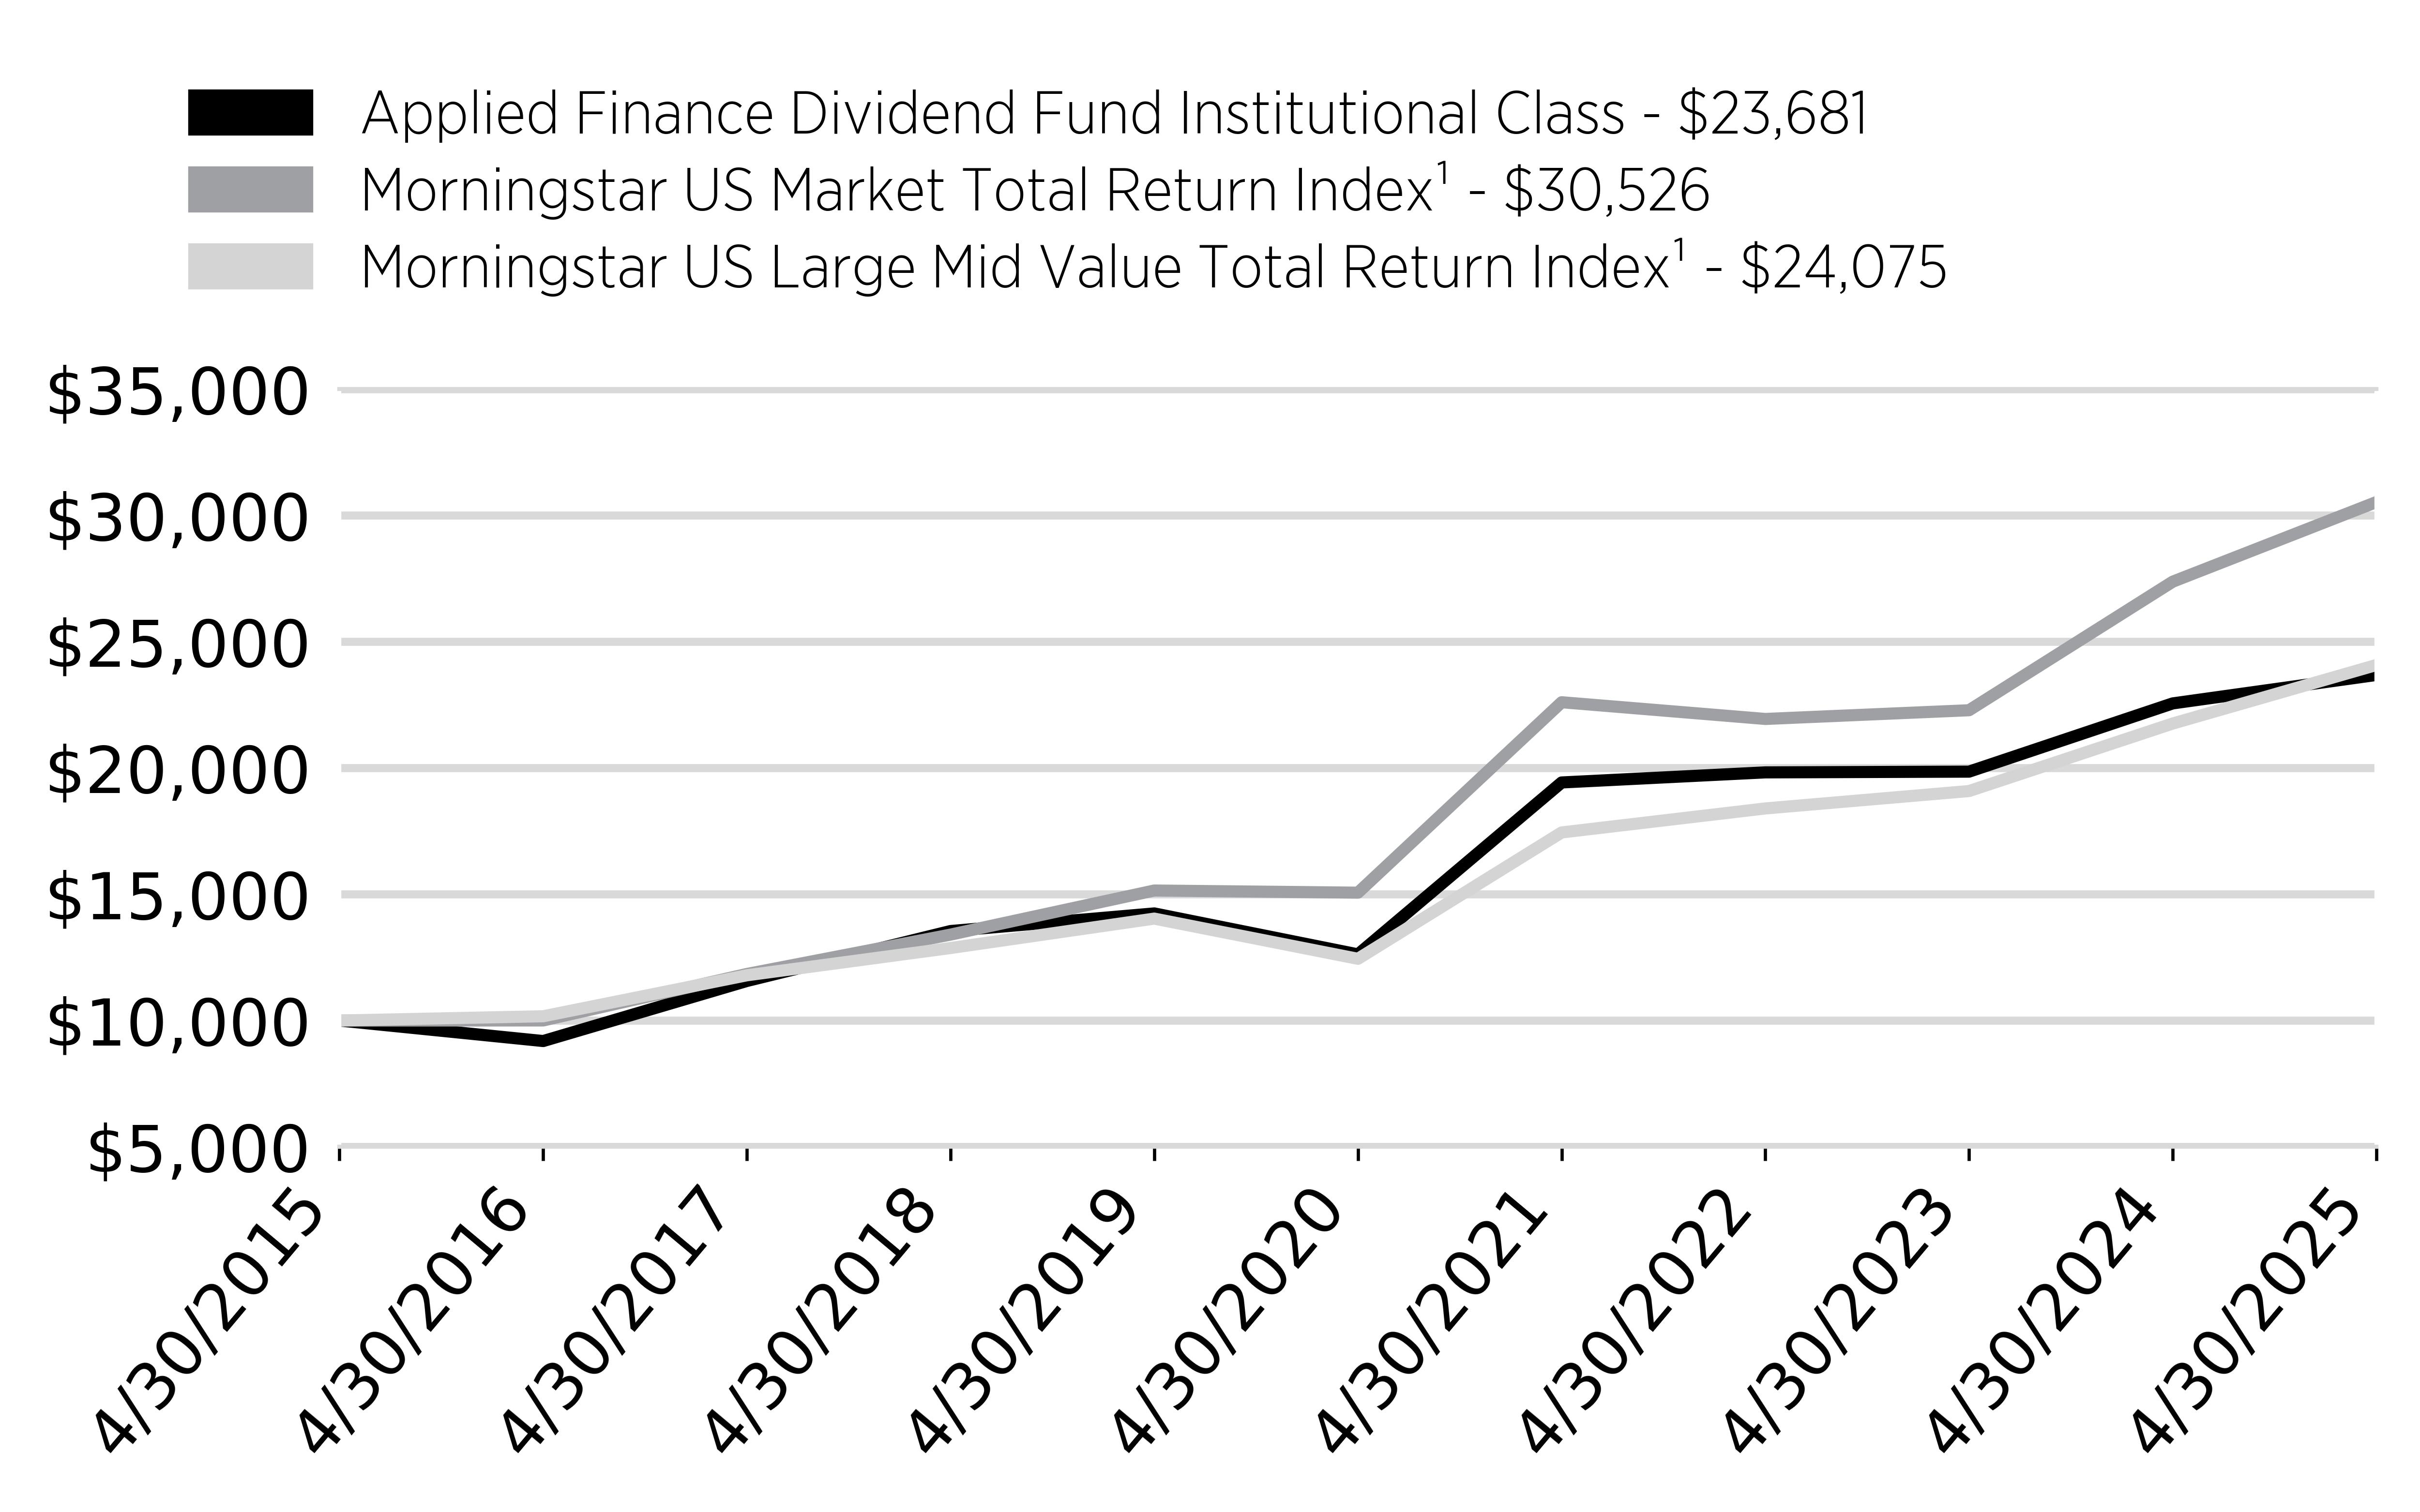
For the period of May 1, 2024 to April 30, 2025, the Applied Finance Dividend Fund Institutional Class Shares (the “Fund”) returned 4.99%.
In comparison, the Morningstar US Market Total Return Index returned 11.51% and the Morningstar US Large Mid Value Total Return Index returned 10.65% for the same period.
What key factors influenced performance?
US stocks rose gradually from May 2024 through January 2025 before peaking in mid-February. Uncertainty over tariffs and their effect on the economy pushed stocks lower in March and part of April, with indices rebounding by the end of the month.
The performance of the Morningstar US Market Total Return Index was strongest in the Financials and Information Technology sectors. During the 12 months ending April 30, 2025, Growth stocks outperformed Value stocks.
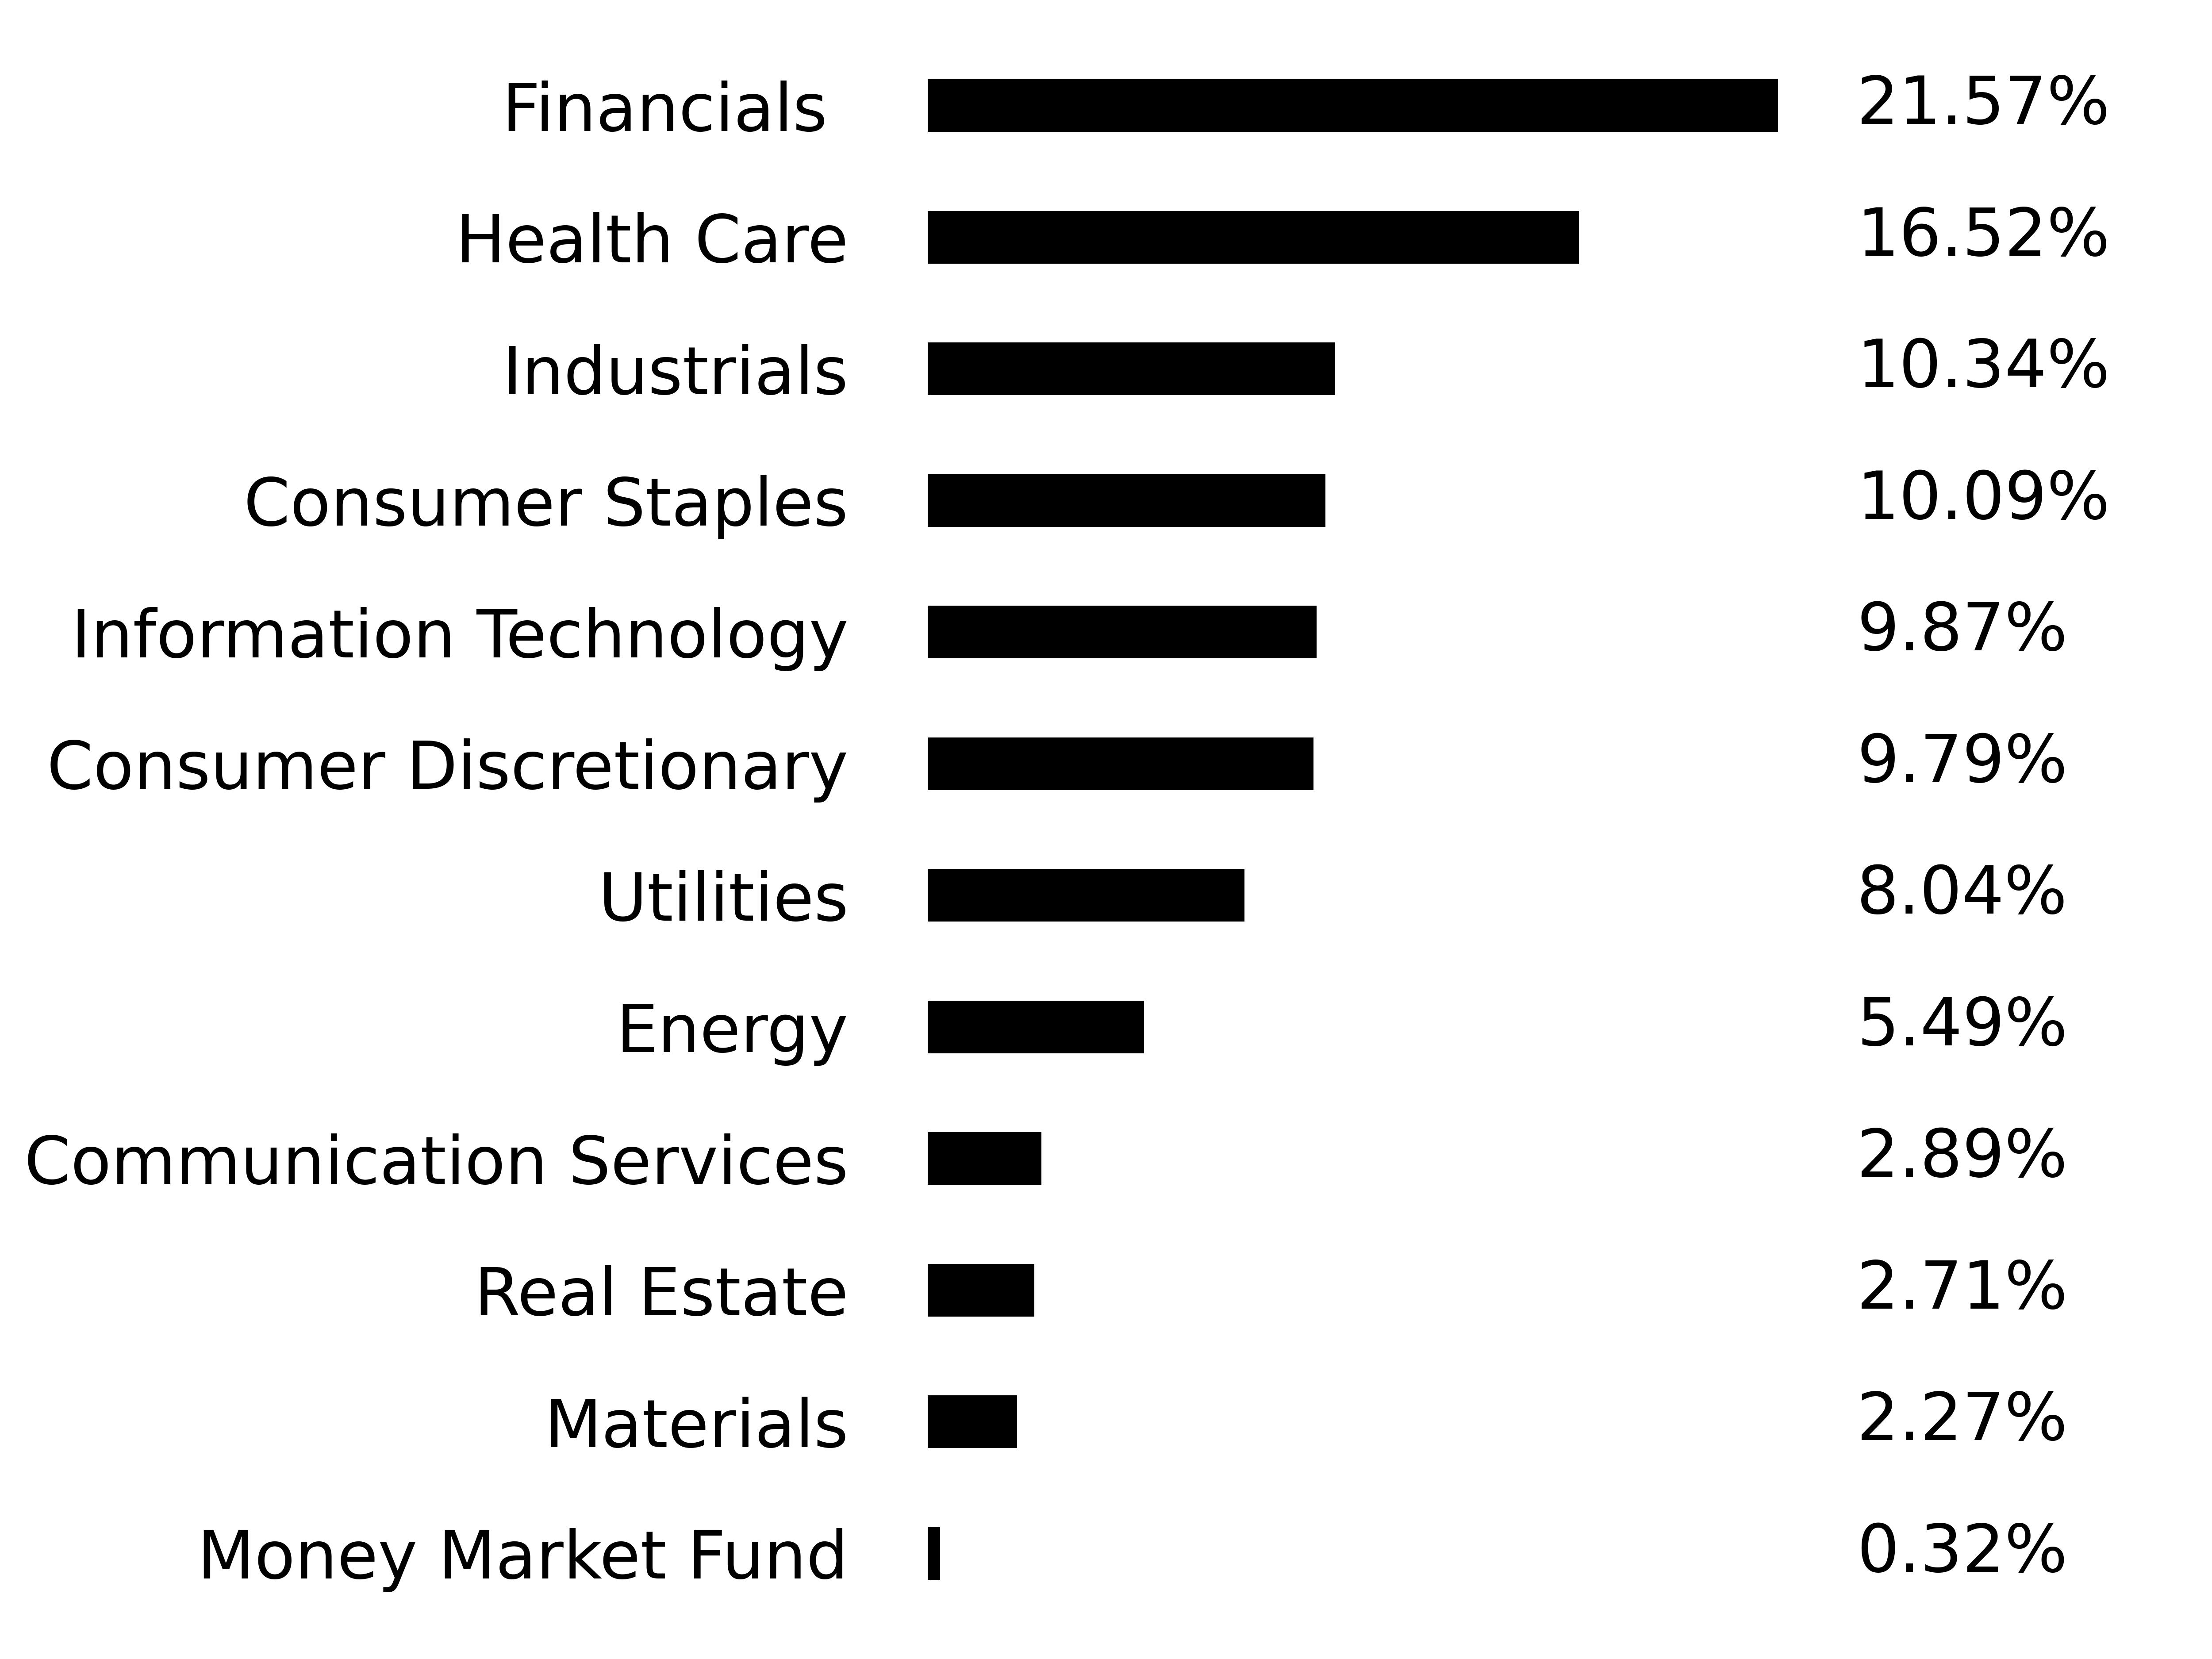
The Fund’s holdings focus on dividend income and capital appreciation. The Fund’s emphasis on dividend-paying stocks lowered performance relative to the Morningstar US Market Total Return Index. Health Care, Utilities and Financials sectors were leading contributors to the Fund’s performance, while Information Technology, Consumer Staples and Materials sectors were leading detractors relative to the Morningstar US Market Total Return Index. Underperformance was generally due to stock selection.
Cumulative Performance
(based on a hypothetical $10,000 investment)
Annual Performance
Average Annual Total Return
|
|
1
Year |
5
Year |
10
Year |
|---|---|---|---|
|
Applied
Finance Dividend Fund - Institutional Class |
4.99% |
13.42% |
9.00% |
|
Morningstar
US Market Total Return Index¹ |
11.51% |
15.18% |
11.81% |
|
Morningstar
US Large Mid Value Total Return Index¹ |
10.65% |
14.11% |
9.18% |
Key Fund Statistics
(as of April 30, 2025)
|
Fund
Net Assets |
$25,241,800 |
|
Number
of Holdings |
39 |
|
Total
Advisory Fee Paid |
$58,064 |
|
Portfolio
Turnover Rate |
12.78% |
Sector Breakdown
|
Top
Ten Holdings |
|
|---|---|
|
JPMorgan
Chase & Co. |
|
|
The
Travelers Companies, Inc |
|
|
Eli
Lilly & Co. |
|
|
Verizon
Communications, Inc. |
|
|
Abbvie,
Inc. |
|
|
Ingredion,
Inc. |
|
|
Hasbro,
Inc. |
|
|
UGI
Corp. |
|
|
Marathon
Petroleum Corp. |
|
|
Johnson
& Johnson |
What were the Fund costs for the past year?
(based on a hypothetical $10,000 investment)
|
Class
Name |
Costs
of a $10,000 investment |
Costs
paid as a percentage of a $10,000 investment |
|---|---|---|
|
Applied
Finance Dividend Fund
- Investor Class |
$125 |
1.22% |
How did the Fund perform?
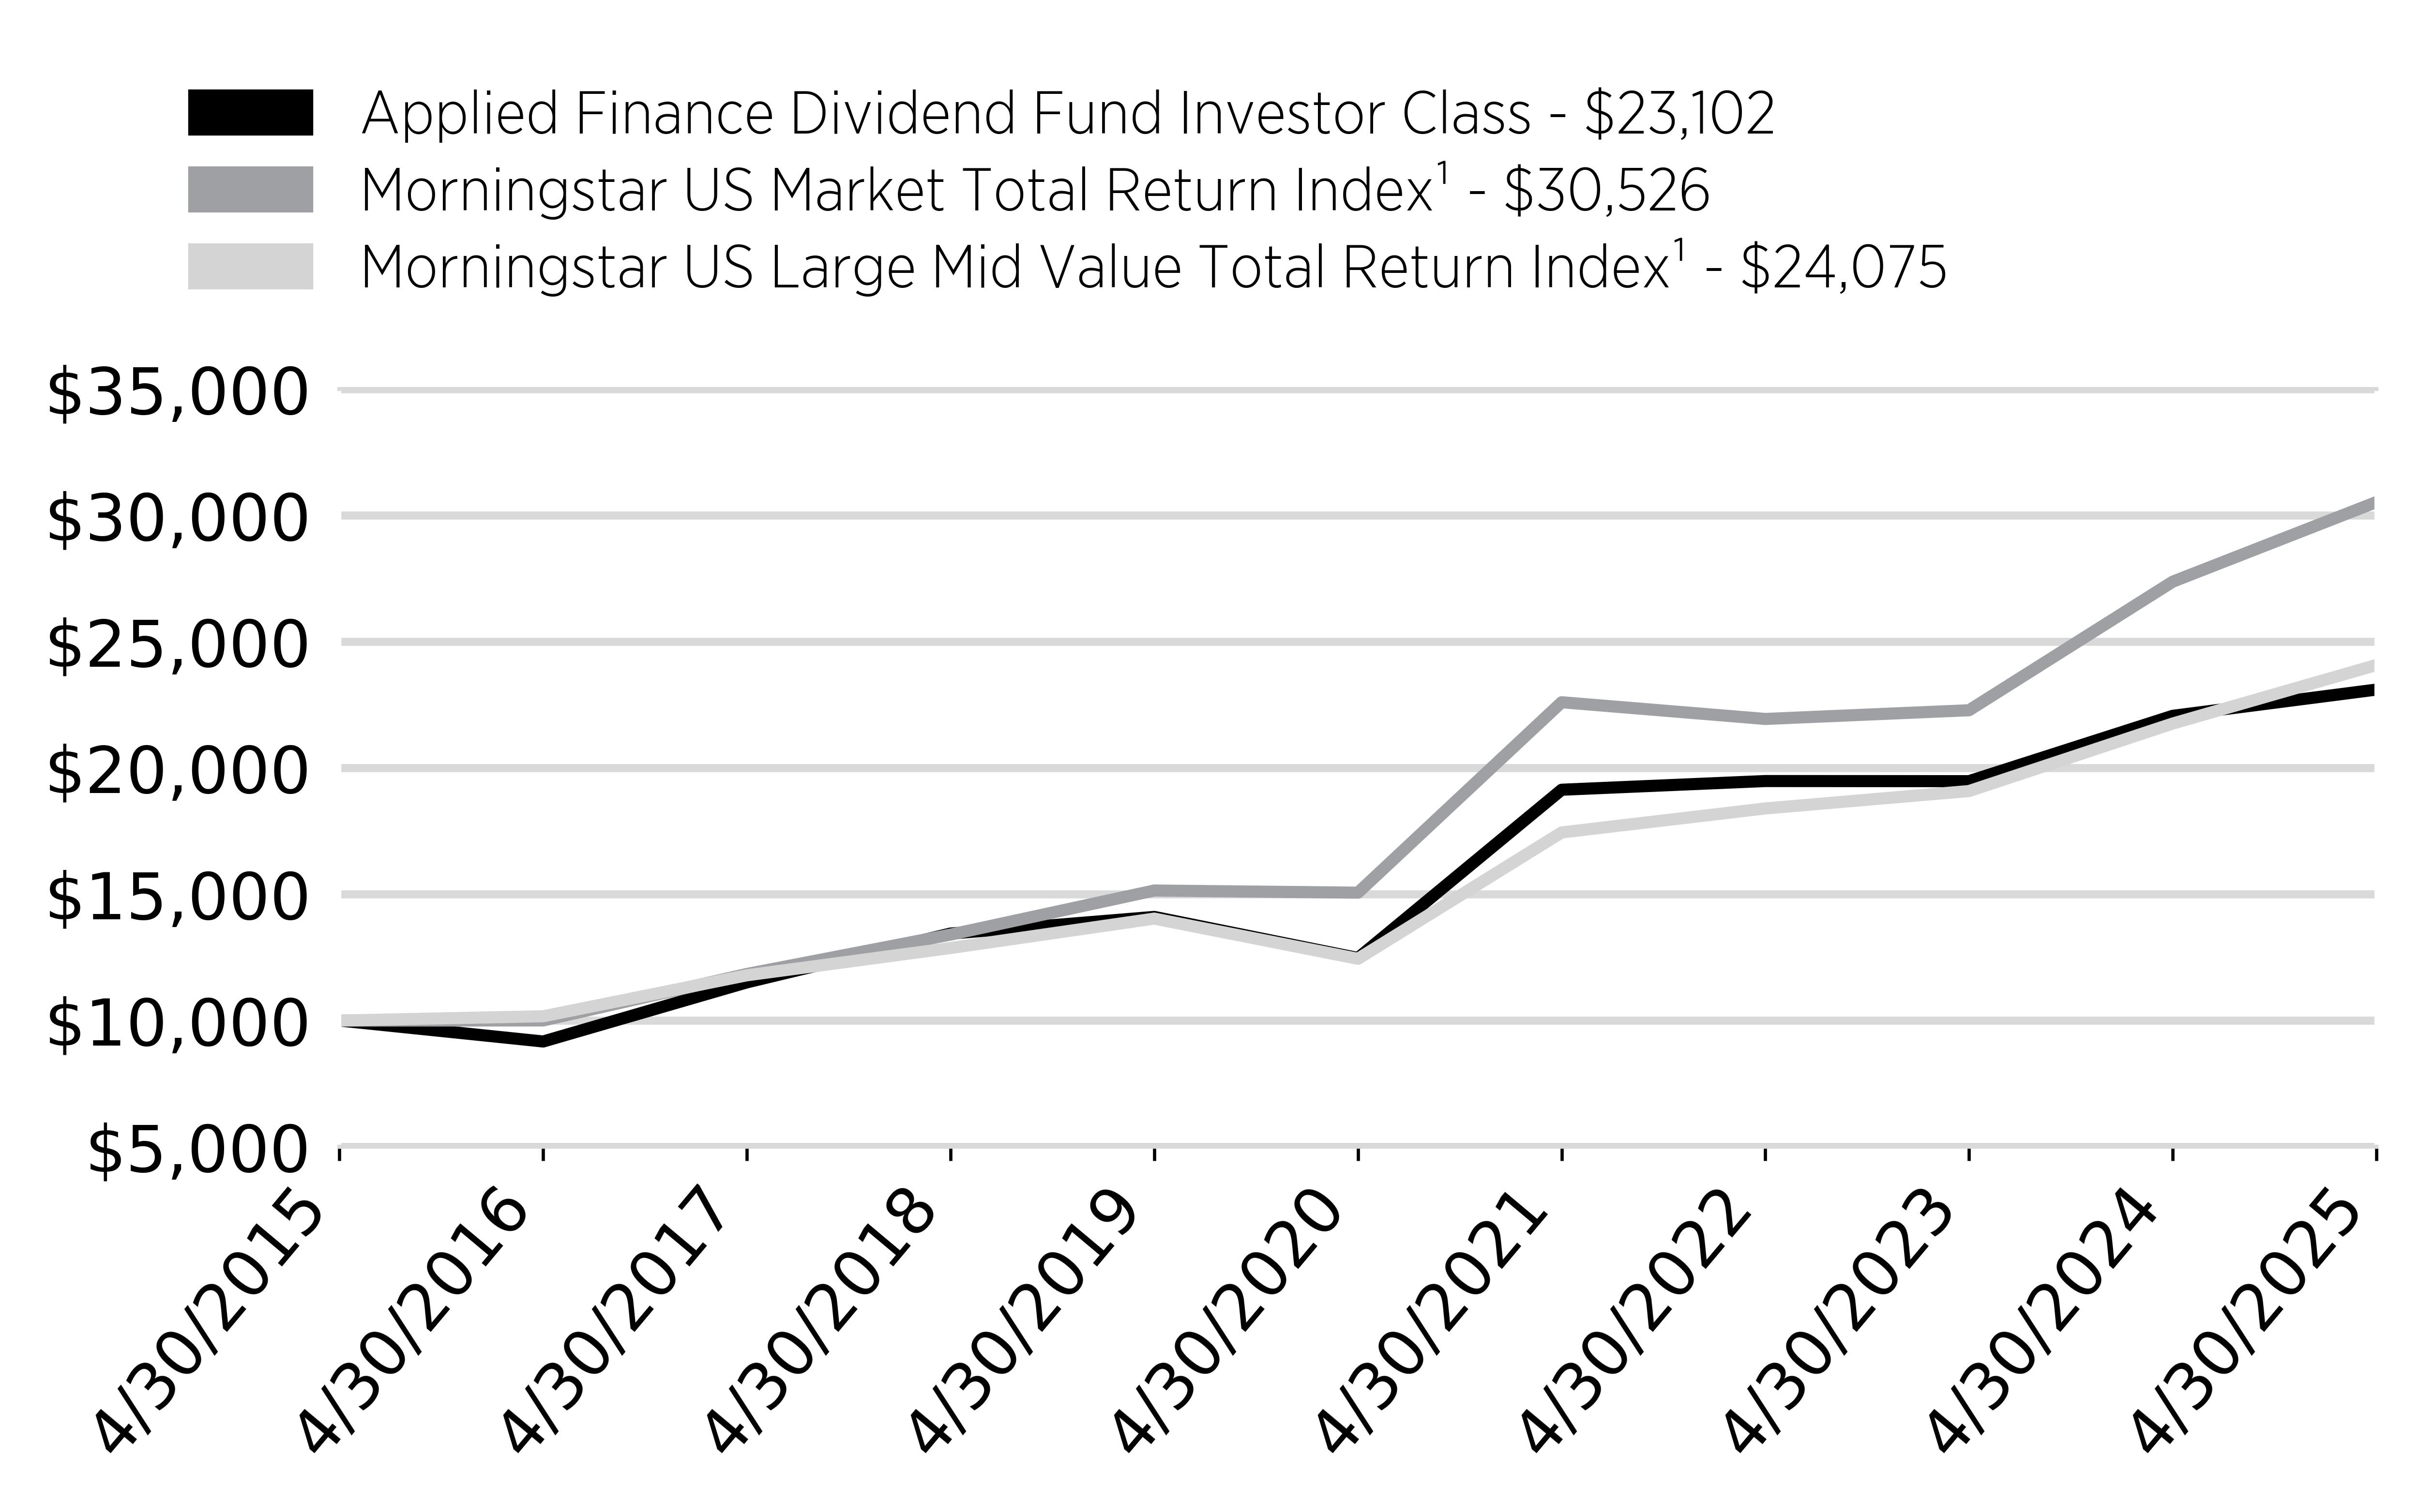
For the period of May 1, 2024 to April 30, 2025, the Applied Finance Dividend Fund Investor Class Shares (the “Fund”) returned 4.71%.
In comparison, the Morningstar US Market Total Return Index returned 11.51% and the Morningstar US Large Mid Value Total Return Index returned 10.65% for the same period.
What key factors influenced performance?
US stocks rose gradually from May 2024 through January 2025 before peaking in mid-February. Uncertainty over tariffs and their effect on the economy pushed stocks lower in March and part of April, with indices rebounding by the end of the month.
The performance of the Morningstar US Market Total Return Index was strongest in the Financials and Information Technology sectors. During the 12 months ending April 30, 2025, Growth stocks outperformed Value stocks.
The Fund’s holdings focus on dividend income and capital appreciation. The Fund’s emphasis on dividend-paying stocks lowered performance relative to the Morningstar US Market Total Return Index. Health Care, Utilities and Financials sectors were leading contributors to the Fund’s performance, while Information Technology, Consumer Staples and Materials sectors were leading detractors relative to the Morningstar US Market Total Return Index. Underperformance was generally due to stock selection.
Cumulative Performance
(based on a hypothetical $10,000 investment)
Annual Performance
Average Annual Total Return
|
|
1
Year |
5
Year |
10
Year |
|---|---|---|---|
|
Applied
Finance Dividend Fund - Investor Class |
4.71% |
13.11% |
8.73% |
|
Morningstar
US Market Total Return Index¹ |
11.51% |
15.18% |
11.81% |
|
Morningstar
US Large Mid Value Total Return Index¹ |
10.65% |
14.11% |
9.18% |
Key Fund Statistics
(as of April 30, 2025)
|
Fund
Net Assets |
$25,241,800 |
|
Number
of Holdings |
39 |
|
Total
Advisory Fee Paid |
$58,064 |
|
Portfolio
Turnover Rate |
12.78% |
Sector Breakdown
|
Top
Ten Holdings |
|
|---|---|
|
JPMorgan
Chase & Co. |
|
|
The
Travelers Companies, Inc |
|
|
Eli
Lilly & Co. |
|
|
Verizon
Communications, Inc. |
|
|
Abbvie,
Inc. |
|
|
Ingredion,
Inc. |
|
|
Hasbro,
Inc. |
|
|
UGI
Corp. |
|
|
Marathon
Petroleum Corp. |
|
|
Johnson
& Johnson |
What were the Fund costs for the past year?
(based on a hypothetical $10,000 investment)
|
Class
Name |
Costs
of a $10,000 investment |
Costs
paid as a percentage of a $10,000 investment |
|---|---|---|
|
Applied
Finance Explorer Fund
- Institutional Class |
$84 |
0.84% |
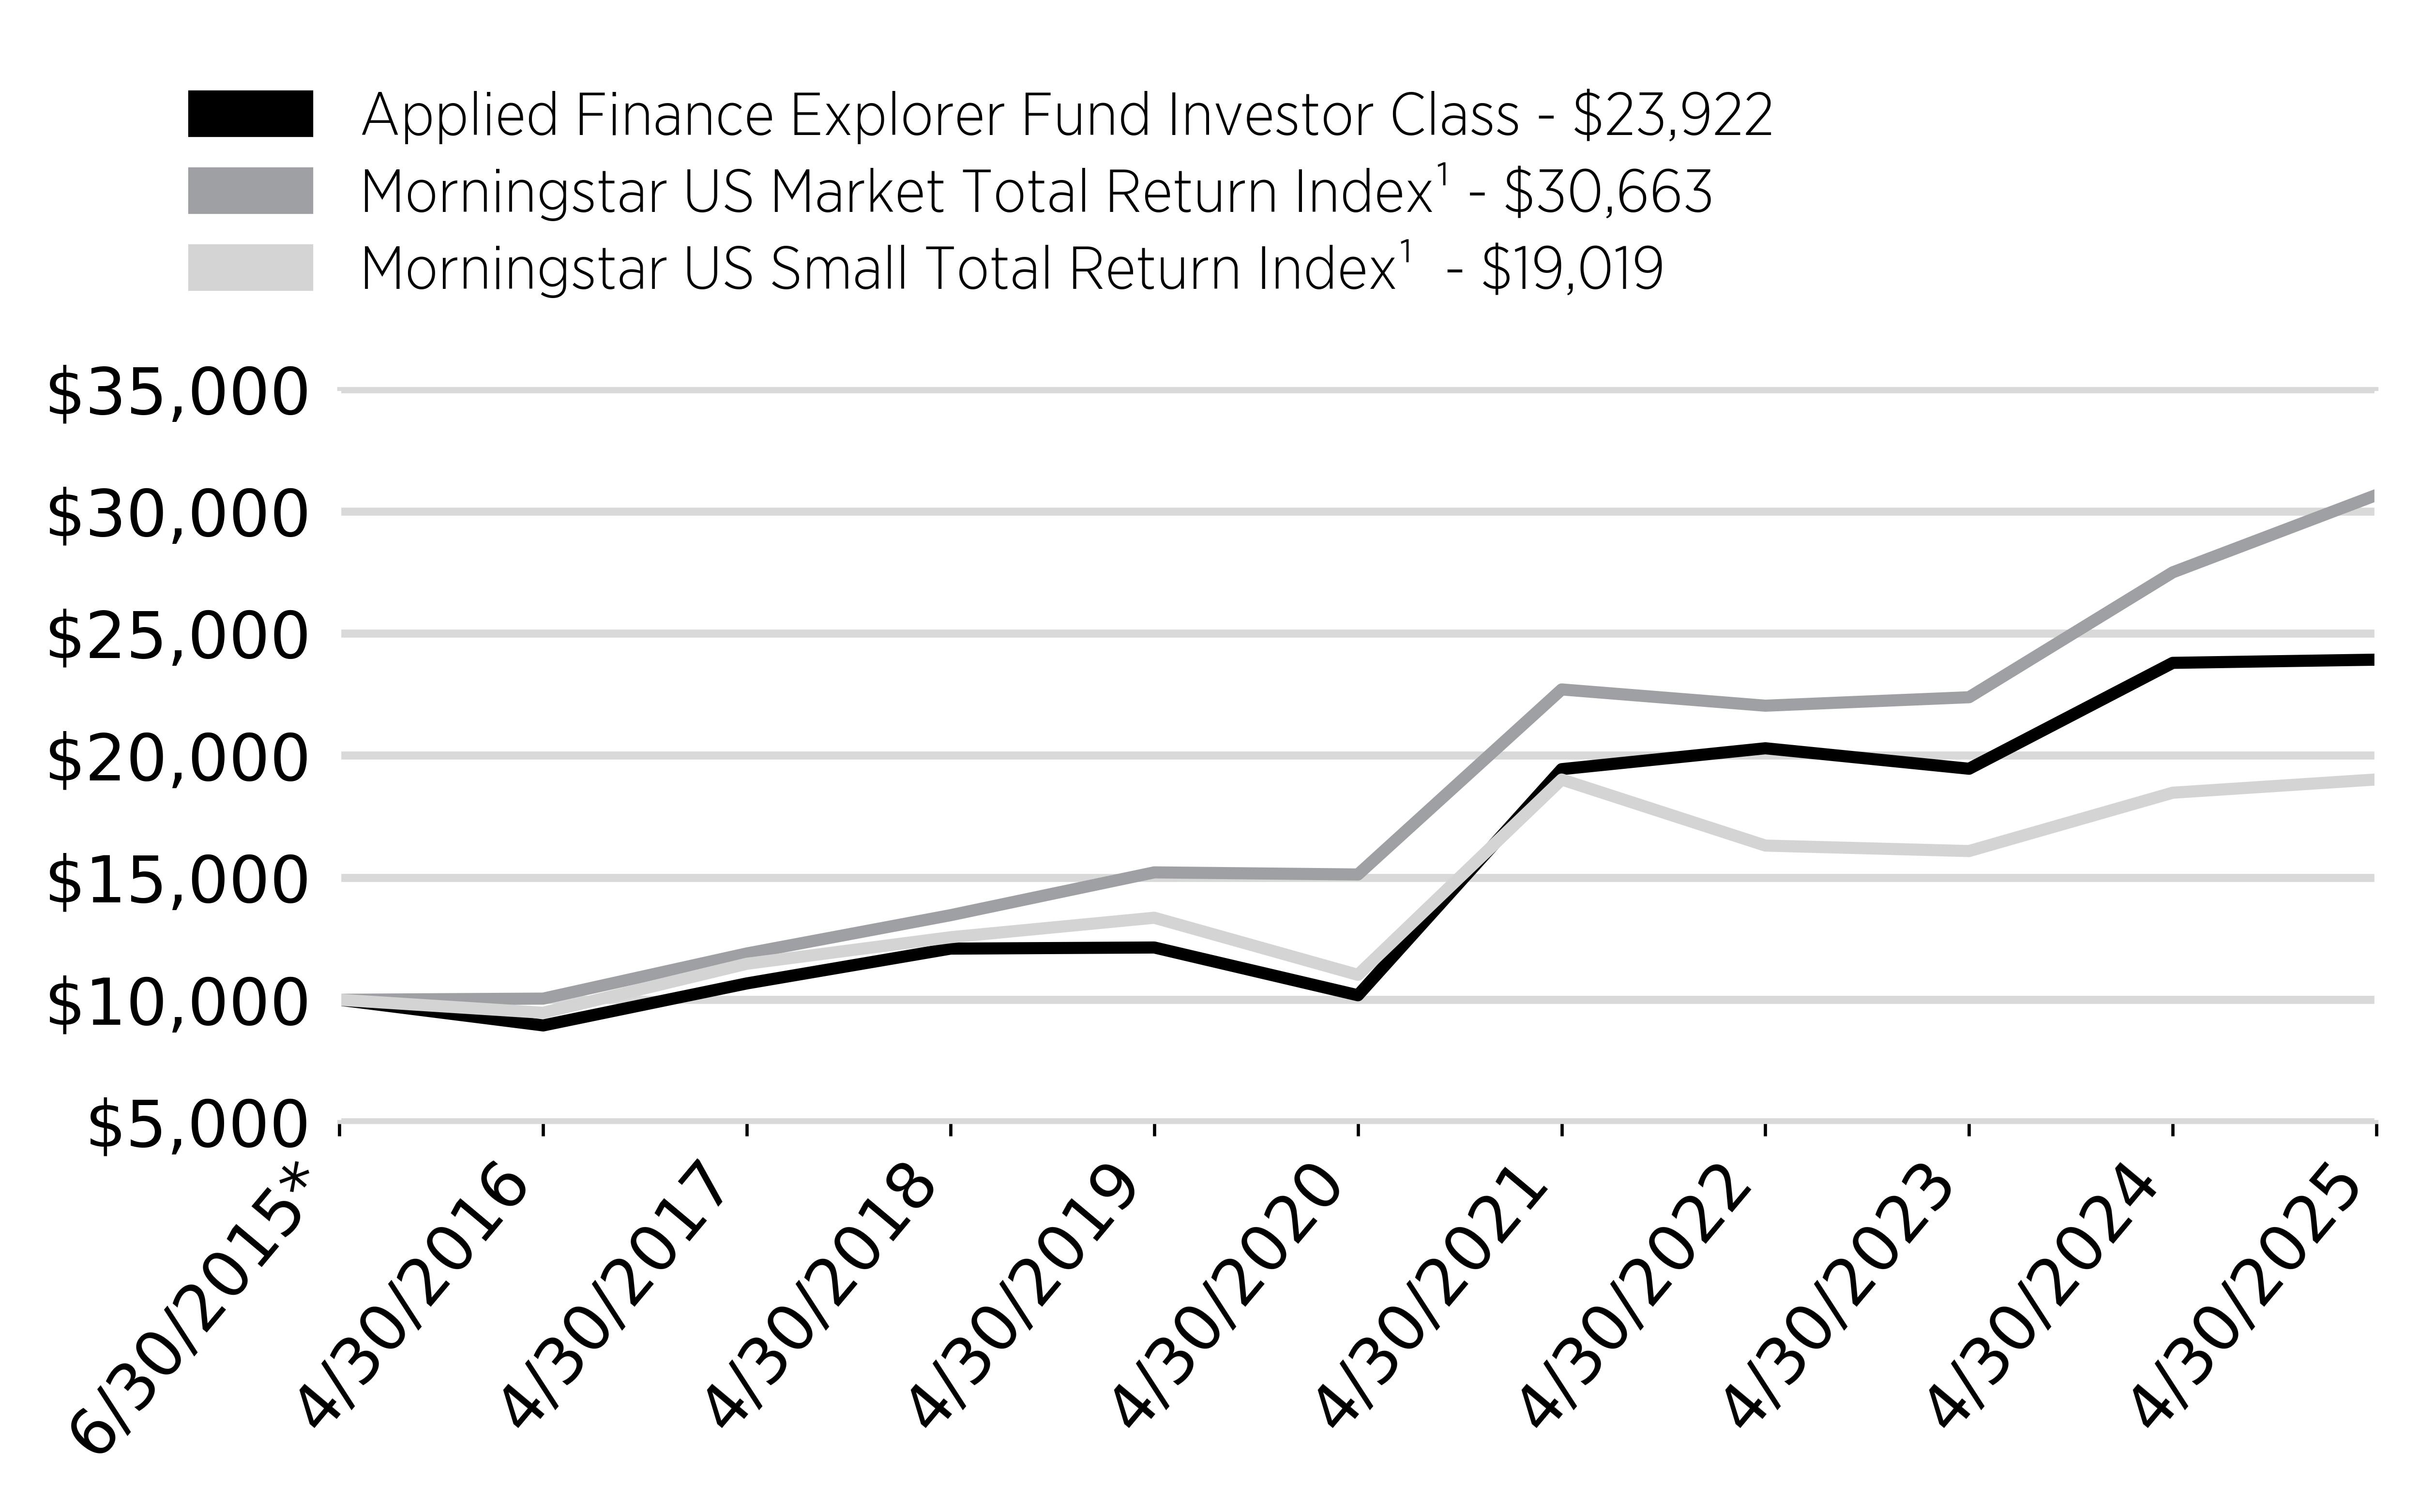
How did the Fund perform?
For the period of May 1, 2024 to April 30, 2025, the Applied Finance Explorer Fund Institutional Class Shares (the “Fund”) returned 0.83%.
In comparison, the Morningstar US Market Total Return Index returned 11.51% and the Morningstar US Small Total Return Index returned 2.94% for the same period.
What key factors influenced performance?
US stocks rose gradually from May 2024 through January 2025 before peaking in mid-February. Uncertainty over tariffs and their effect on the economy pushed stocks lower in March and part of April, with indices rebounding by the end of the month.
The performance of the Morningstar US Market Total Return Index was strongest in the Financials and Information Technology sectors. During the 12 months ending April 30, 2025, Growth stocks outperformed Value stocks.
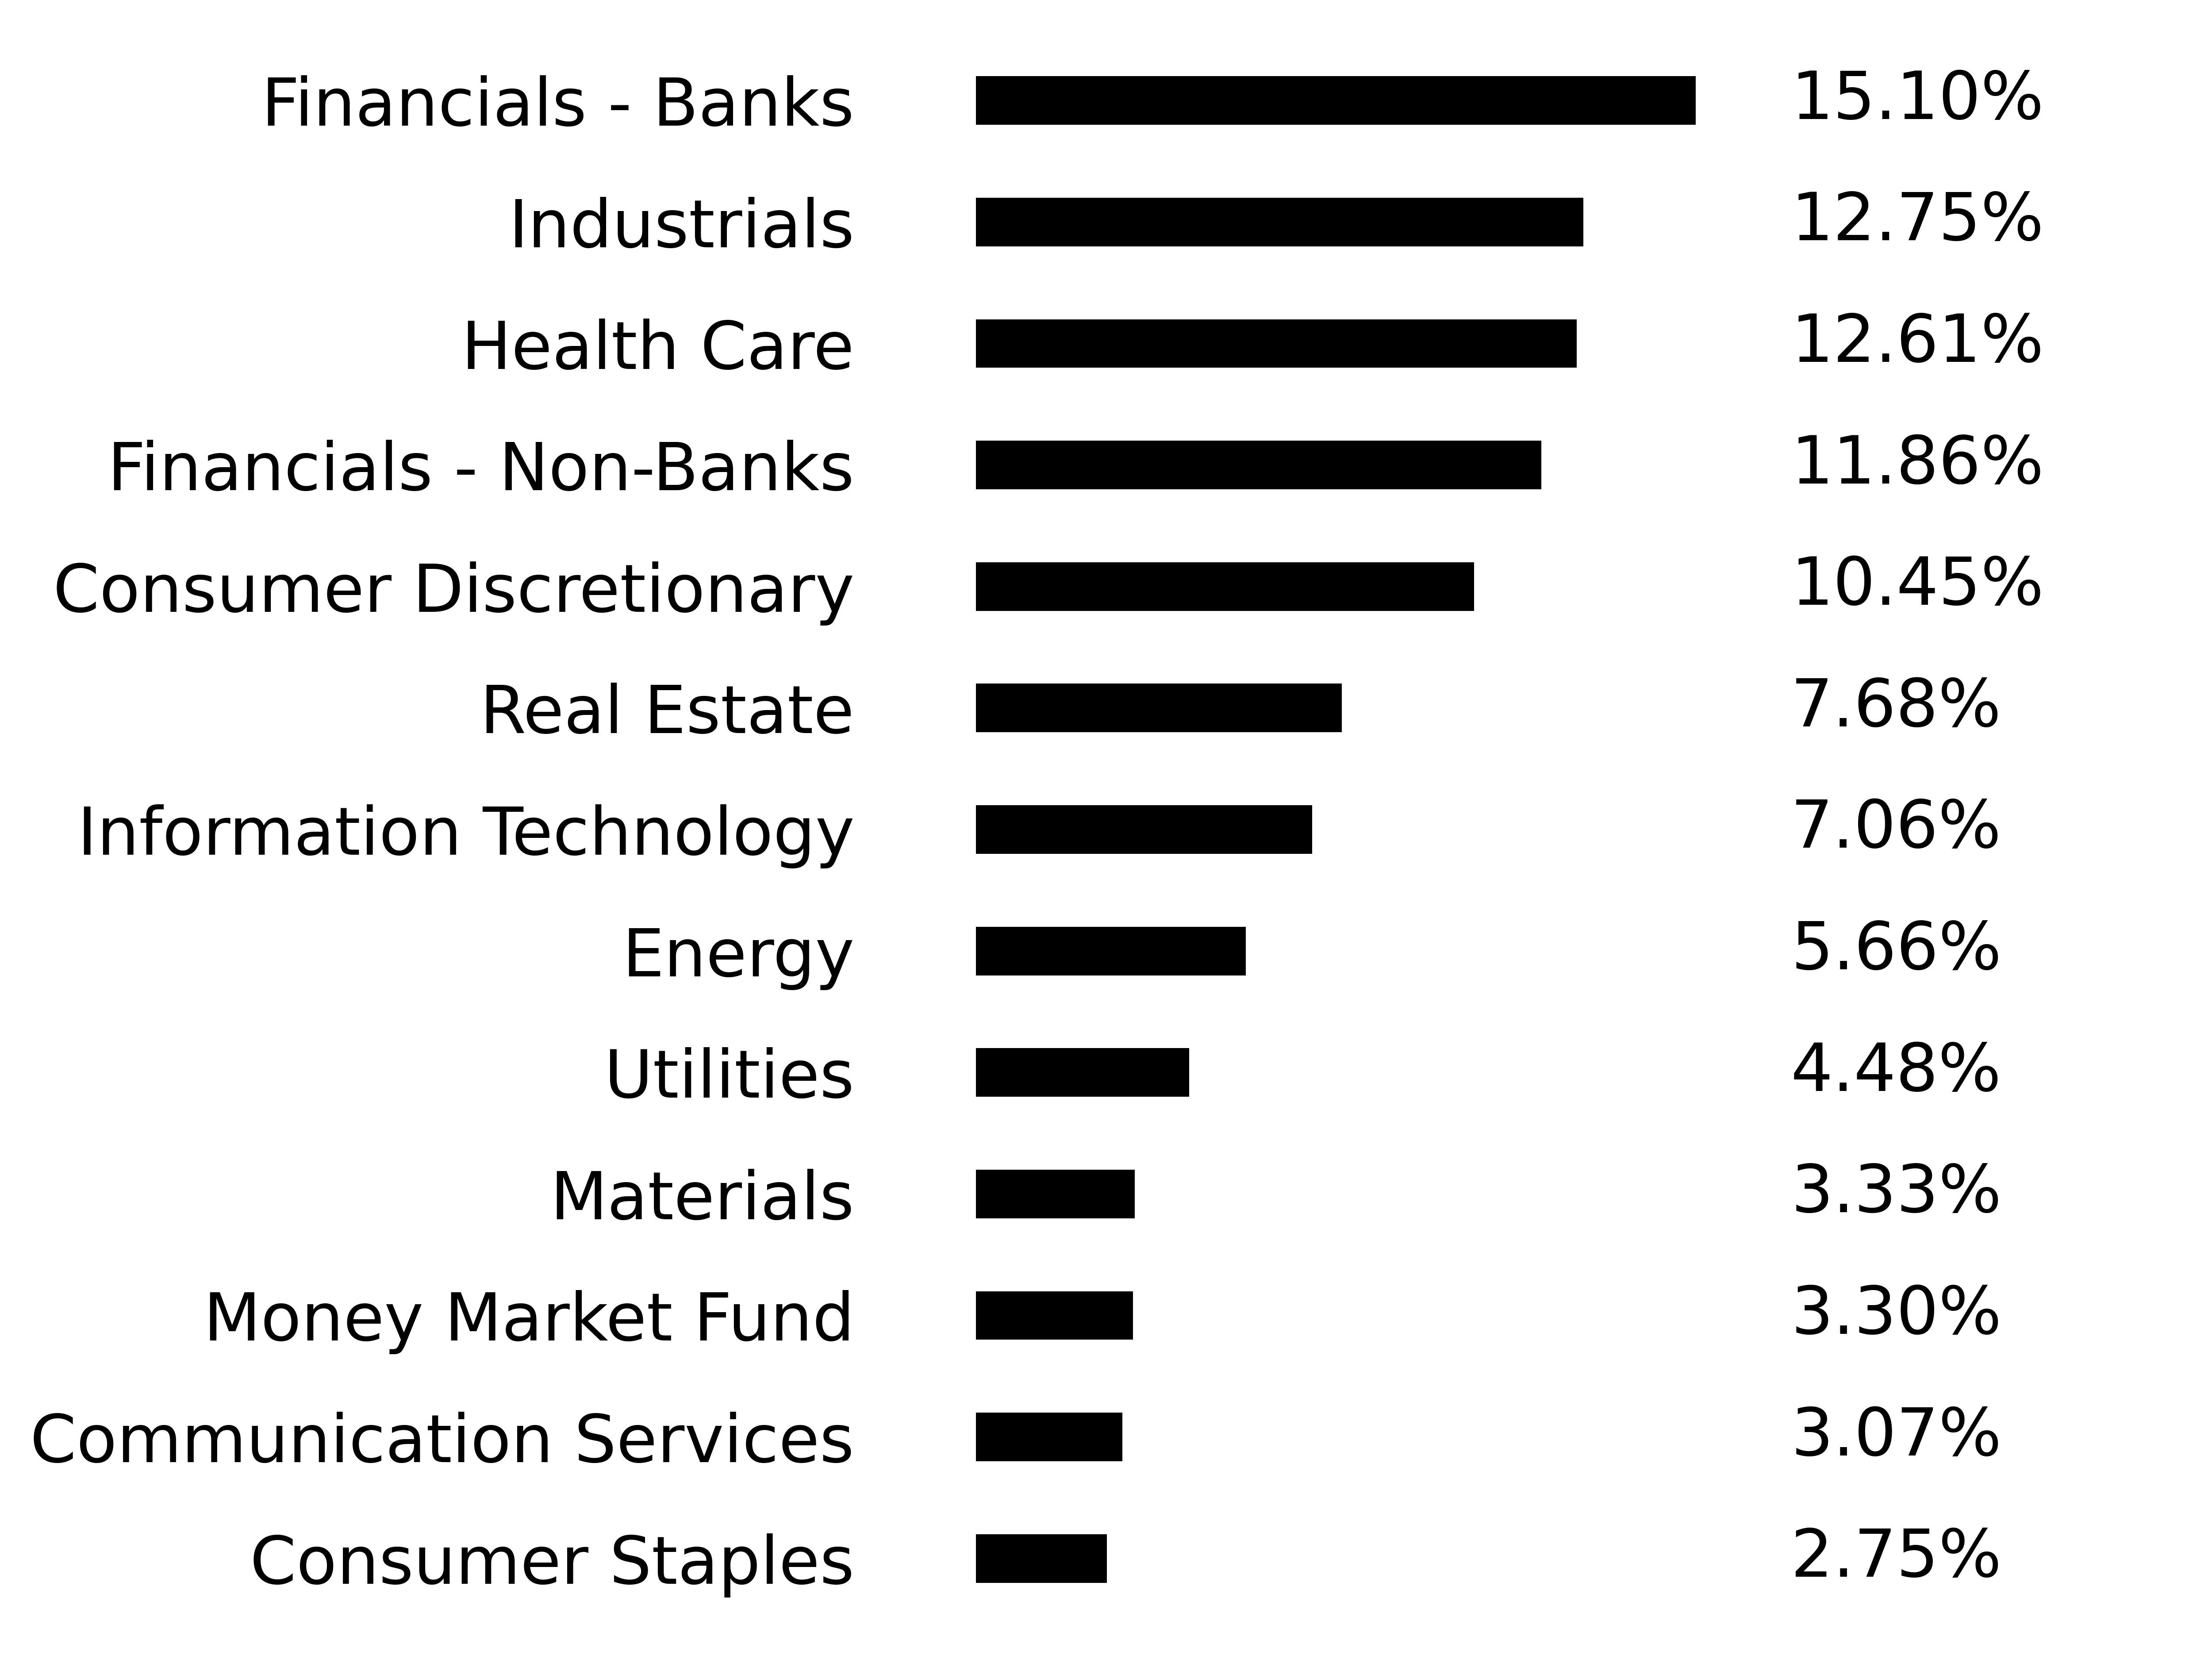
The Fund’s holdings consist of US small-cap stocks. The Fund’s emphasis on small-cap stocks lowered performance relative to the Morningstar US Market Total Return Index. Financials and Utilities sectors were leading contributors to the Fund’s performance, while Energy, Information Technology and Industrials sectors were leading detractors relative to the Morningstar US Market Total Return Index. Underperformance was generally due to stock selection.
Cumulative Performance
(based on a hypothetical $10,000 investment)
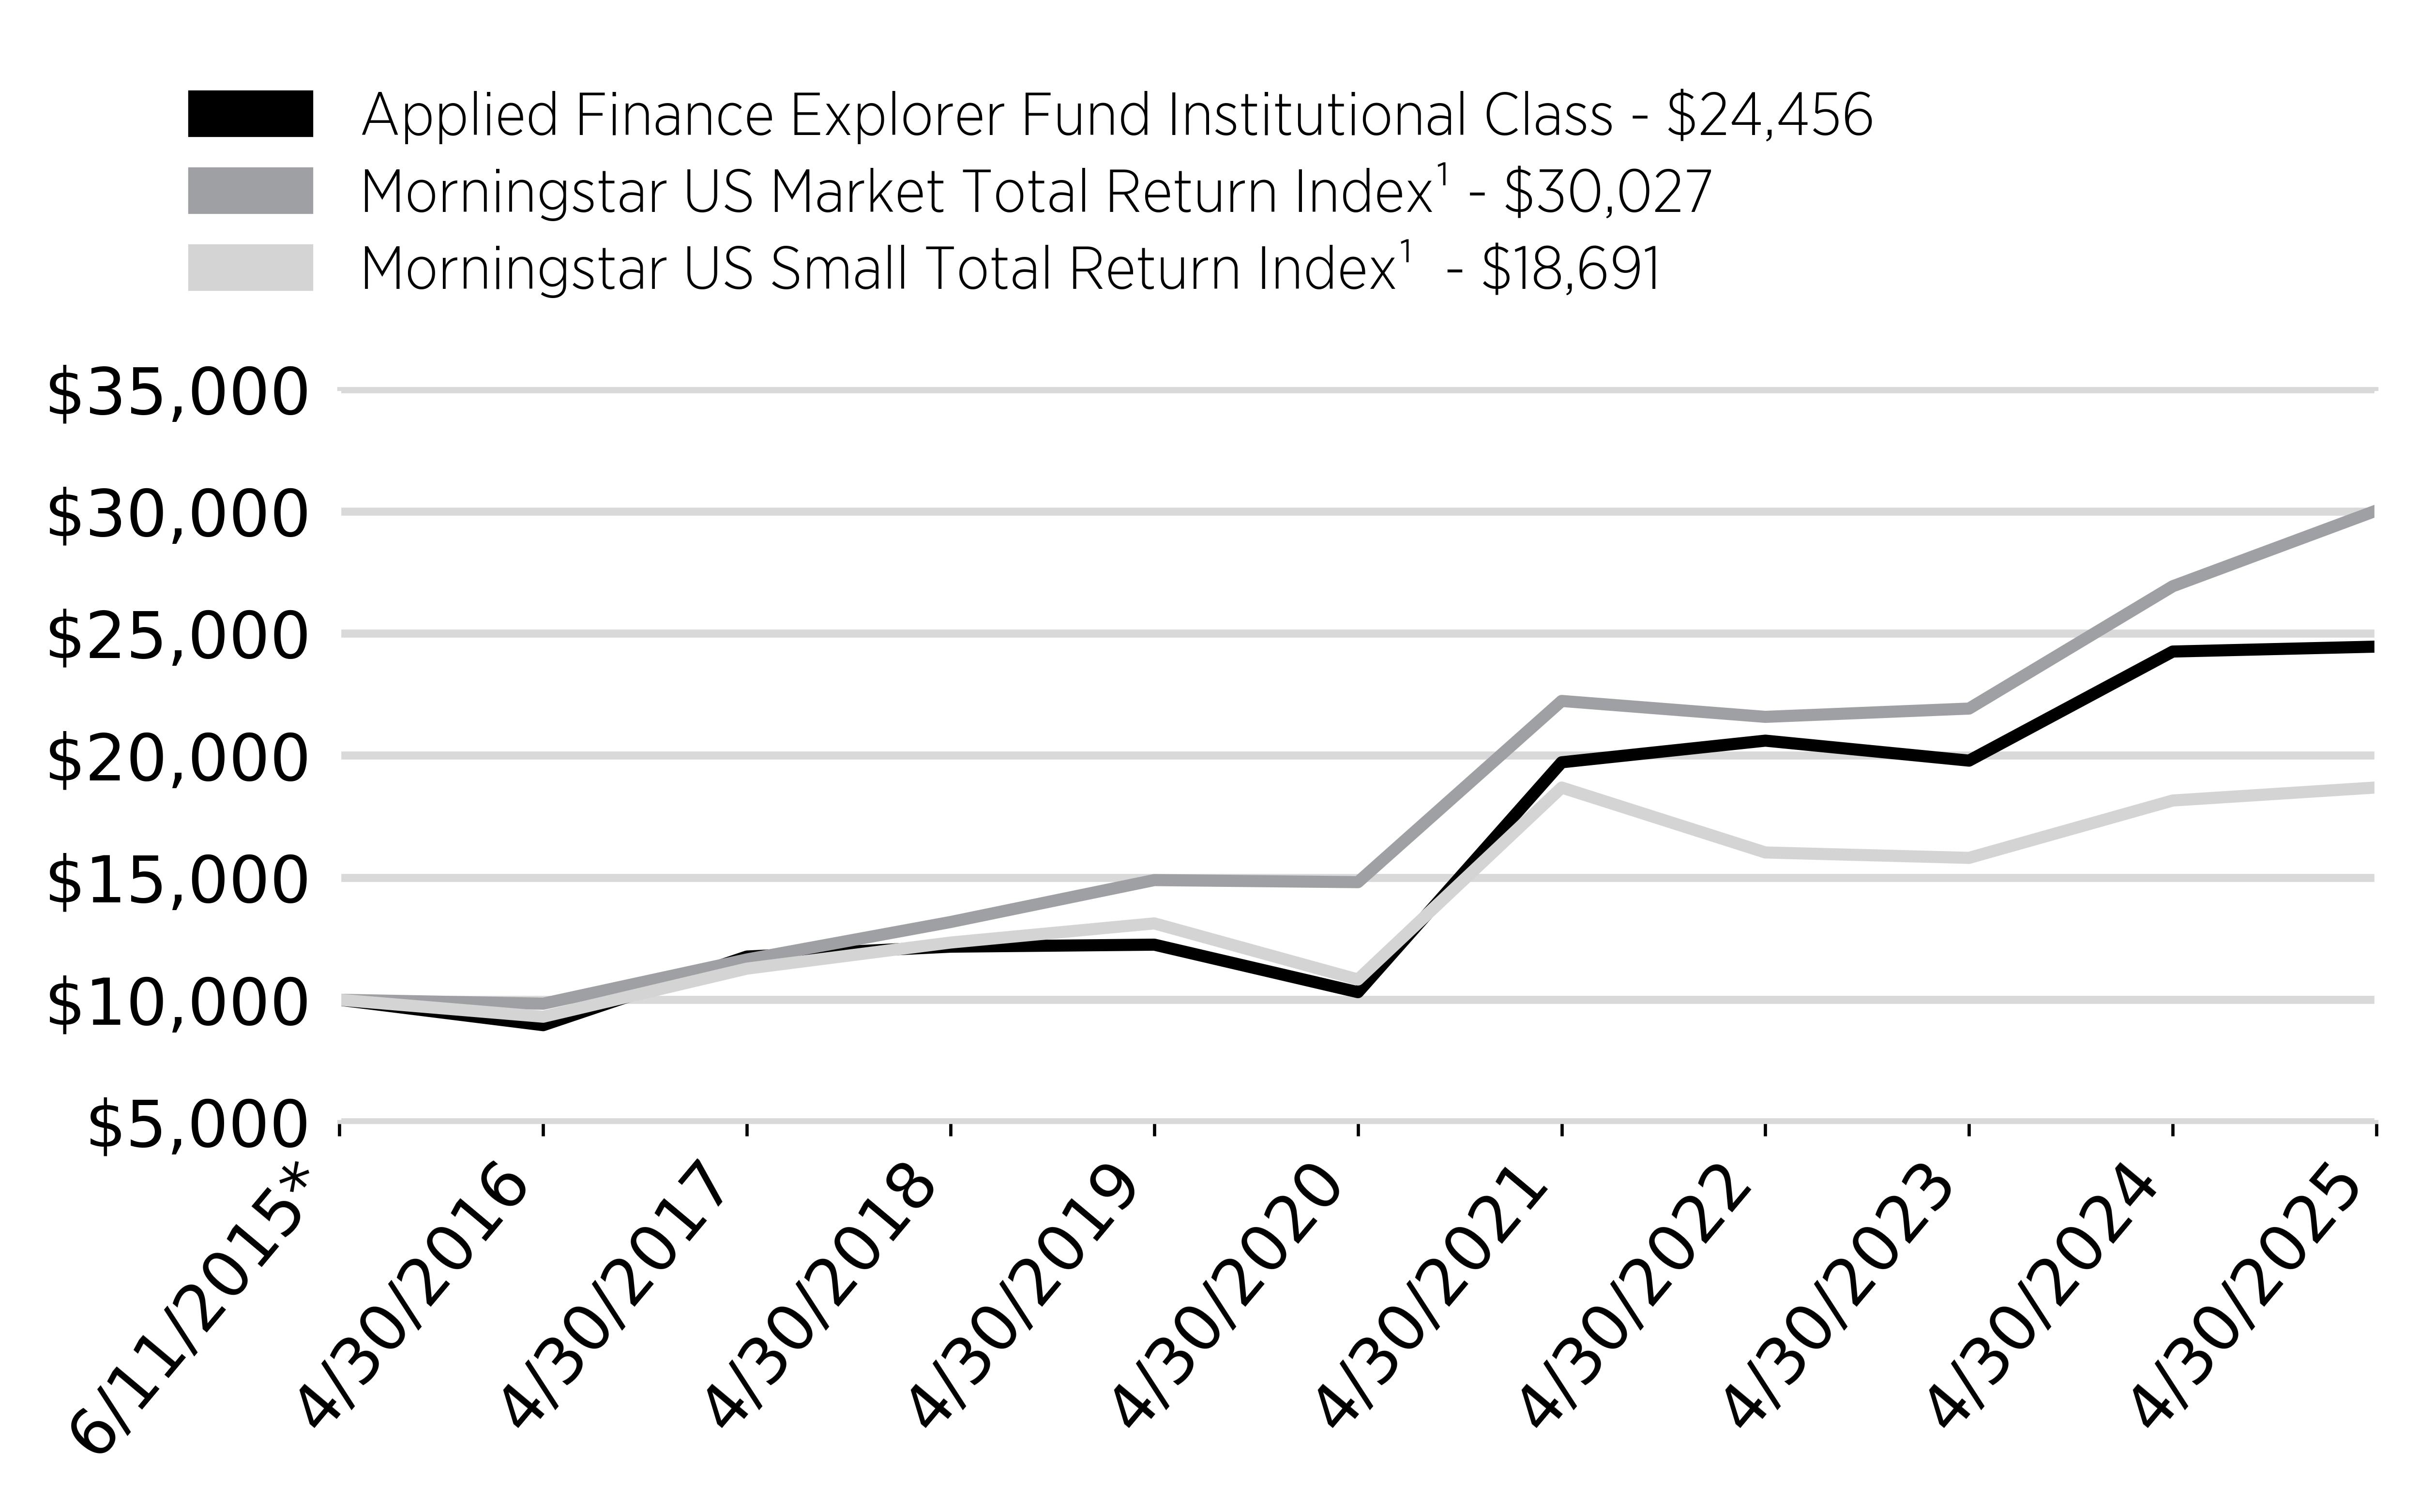
| * | Inception |
Annual Performance
Average Annual Total Return
|
|
1
Year |
5
Year |
Since
Inception |
|---|---|---|---|
|
Applied
Finance Explorer Fund - Institutional Class |
0.83% |
18.85% |
9.47% |
|
Morningstar
US Market Total Return Index¹ |
11.51% |
15.18% |
11.76% |
|
Morningstar
US Small Total Return Index¹ |
2.94% |
11.53% |
6.53% |
Key Fund Statistics
(as of April 30, 2025)
|
Fund
Net Assets |
$731,052,738 |
|
Number
of Holdings |
140 |
|
Total
Advisory Fee Paid |
$4,557,935 |
|
Portfolio
Turnover Rate |
37.29% |
Sector Breakdown
|
Top
Ten Holdings |
|
|---|---|
|
Federated
Treasury Obligations Fund - Institutional Class |
|
|
StoneX
Group, Inc. |
|
|
Stride,
Inc. |
|
|
Sterling
Infrastructure, Inc. |
|
|
Pathward
Financial, Inc. |
|
|
Comfort
Systems USA, Inc. |
|
|
Enova
International, Inc. |
|
|
SLM
Corp. |
|
|
OSI
Systems, Inc. |
|
|
Performance
Food Group Co. |
What were the Fund costs for the past year?
(based on a hypothetical $10,000 investment)
|
Class
Name |
Costs
of a $10,000 investment |
Costs
paid as a percentage of a $10,000 investment |
|---|---|---|
|
Applied
Finance Explorer Fund
- Investor Class |
$109 |
1.09% |
How did the Fund perform?
For the period of May 1, 2024 to April 30, 2025, the Applied Finance Explorer Fund Investor Class Shares (the “Fund”) returned 0.55%.
In comparison, the Morningstar US Market Total Return Index returned 11.51% and the Morningstar US Small Total Return Index returned 2.94% for the same period.
What key factors influenced performance?
US stocks rose gradually from May 2024 through January 2025 before peaking in mid-February. Uncertainty over tariffs and their effect on the economy pushed stocks lower in March and part of April, with indices rebounding by the end of the month.
The performance of the Morningstar US Market Total Return Index was strongest in the Financials and Information Technology sectors. During the 12 months ending April 30, 2025, Growth stocks outperformed Value stocks.
The Fund’s holdings consist of US small-cap stocks. The Fund’s emphasis on small-cap stocks lowered performance relative to the Morningstar US Market Total Return Index. Financials and Utilities sectors were leading contributors to the Fund’s performance, while Energy, Information Technology and Industrials sectors were leading detractors relative to the Morningstar US Market Total Return Index. Underperformance was generally due to stock selection.
Cumulative Performance
(based on a hypothetical $10,000 investment)
| * | Inception |
Annual Performance
Average Annual Total Return
|
|
1
Year |
5
Year |
Since
Inception |
|---|---|---|---|
|
Applied
Finance Explorer Fund - Investor Class |
0.55% |
18.62% |
9.27% |
|
Morningstar
US Market Total Return Index¹ |
11.51% |
15.18% |
12.07% |
|
Morningstar
US Small Total Return Index¹ |
2.94% |
11.53% |
6.76% |
Key Fund Statistics
(as of April 30, 2025)
|
Fund
Net Assets |
$731,052,738 |
|
Number
of Holdings |
140 |
|
Total
Advisory Fee Paid |
$4,557,935 |
|
Portfolio
Turnover Rate |
37.29% |
Sector Breakdown
|
Top
Ten Holdings |
|
|---|---|
|
Federated
Treasury Obligations Fund - Institutional Class |
|
|
StoneX
Group, Inc. |
|
|
Stride,
Inc. |
|
|
Sterling
Infrastructure, Inc. |
|
|
Pathward
Financial, Inc. |
|
|
Comfort
Systems USA, Inc. |
|
|
Enova
International, Inc. |
|
|
SLM
Corp. |
|
|
OSI
Systems, Inc. |
|
|
Performance
Food Group Co. |
What were the Fund costs for the past year?
(based on a hypothetical $10,000 investment)
|
Class
Name |
Costs
of a $10,000 investment |
Costs
paid as a percentage of a $10,000 investment |
|---|---|---|
|
Applied
Finance Select Fund
- Institutional Class |
$76 |
0.76% |
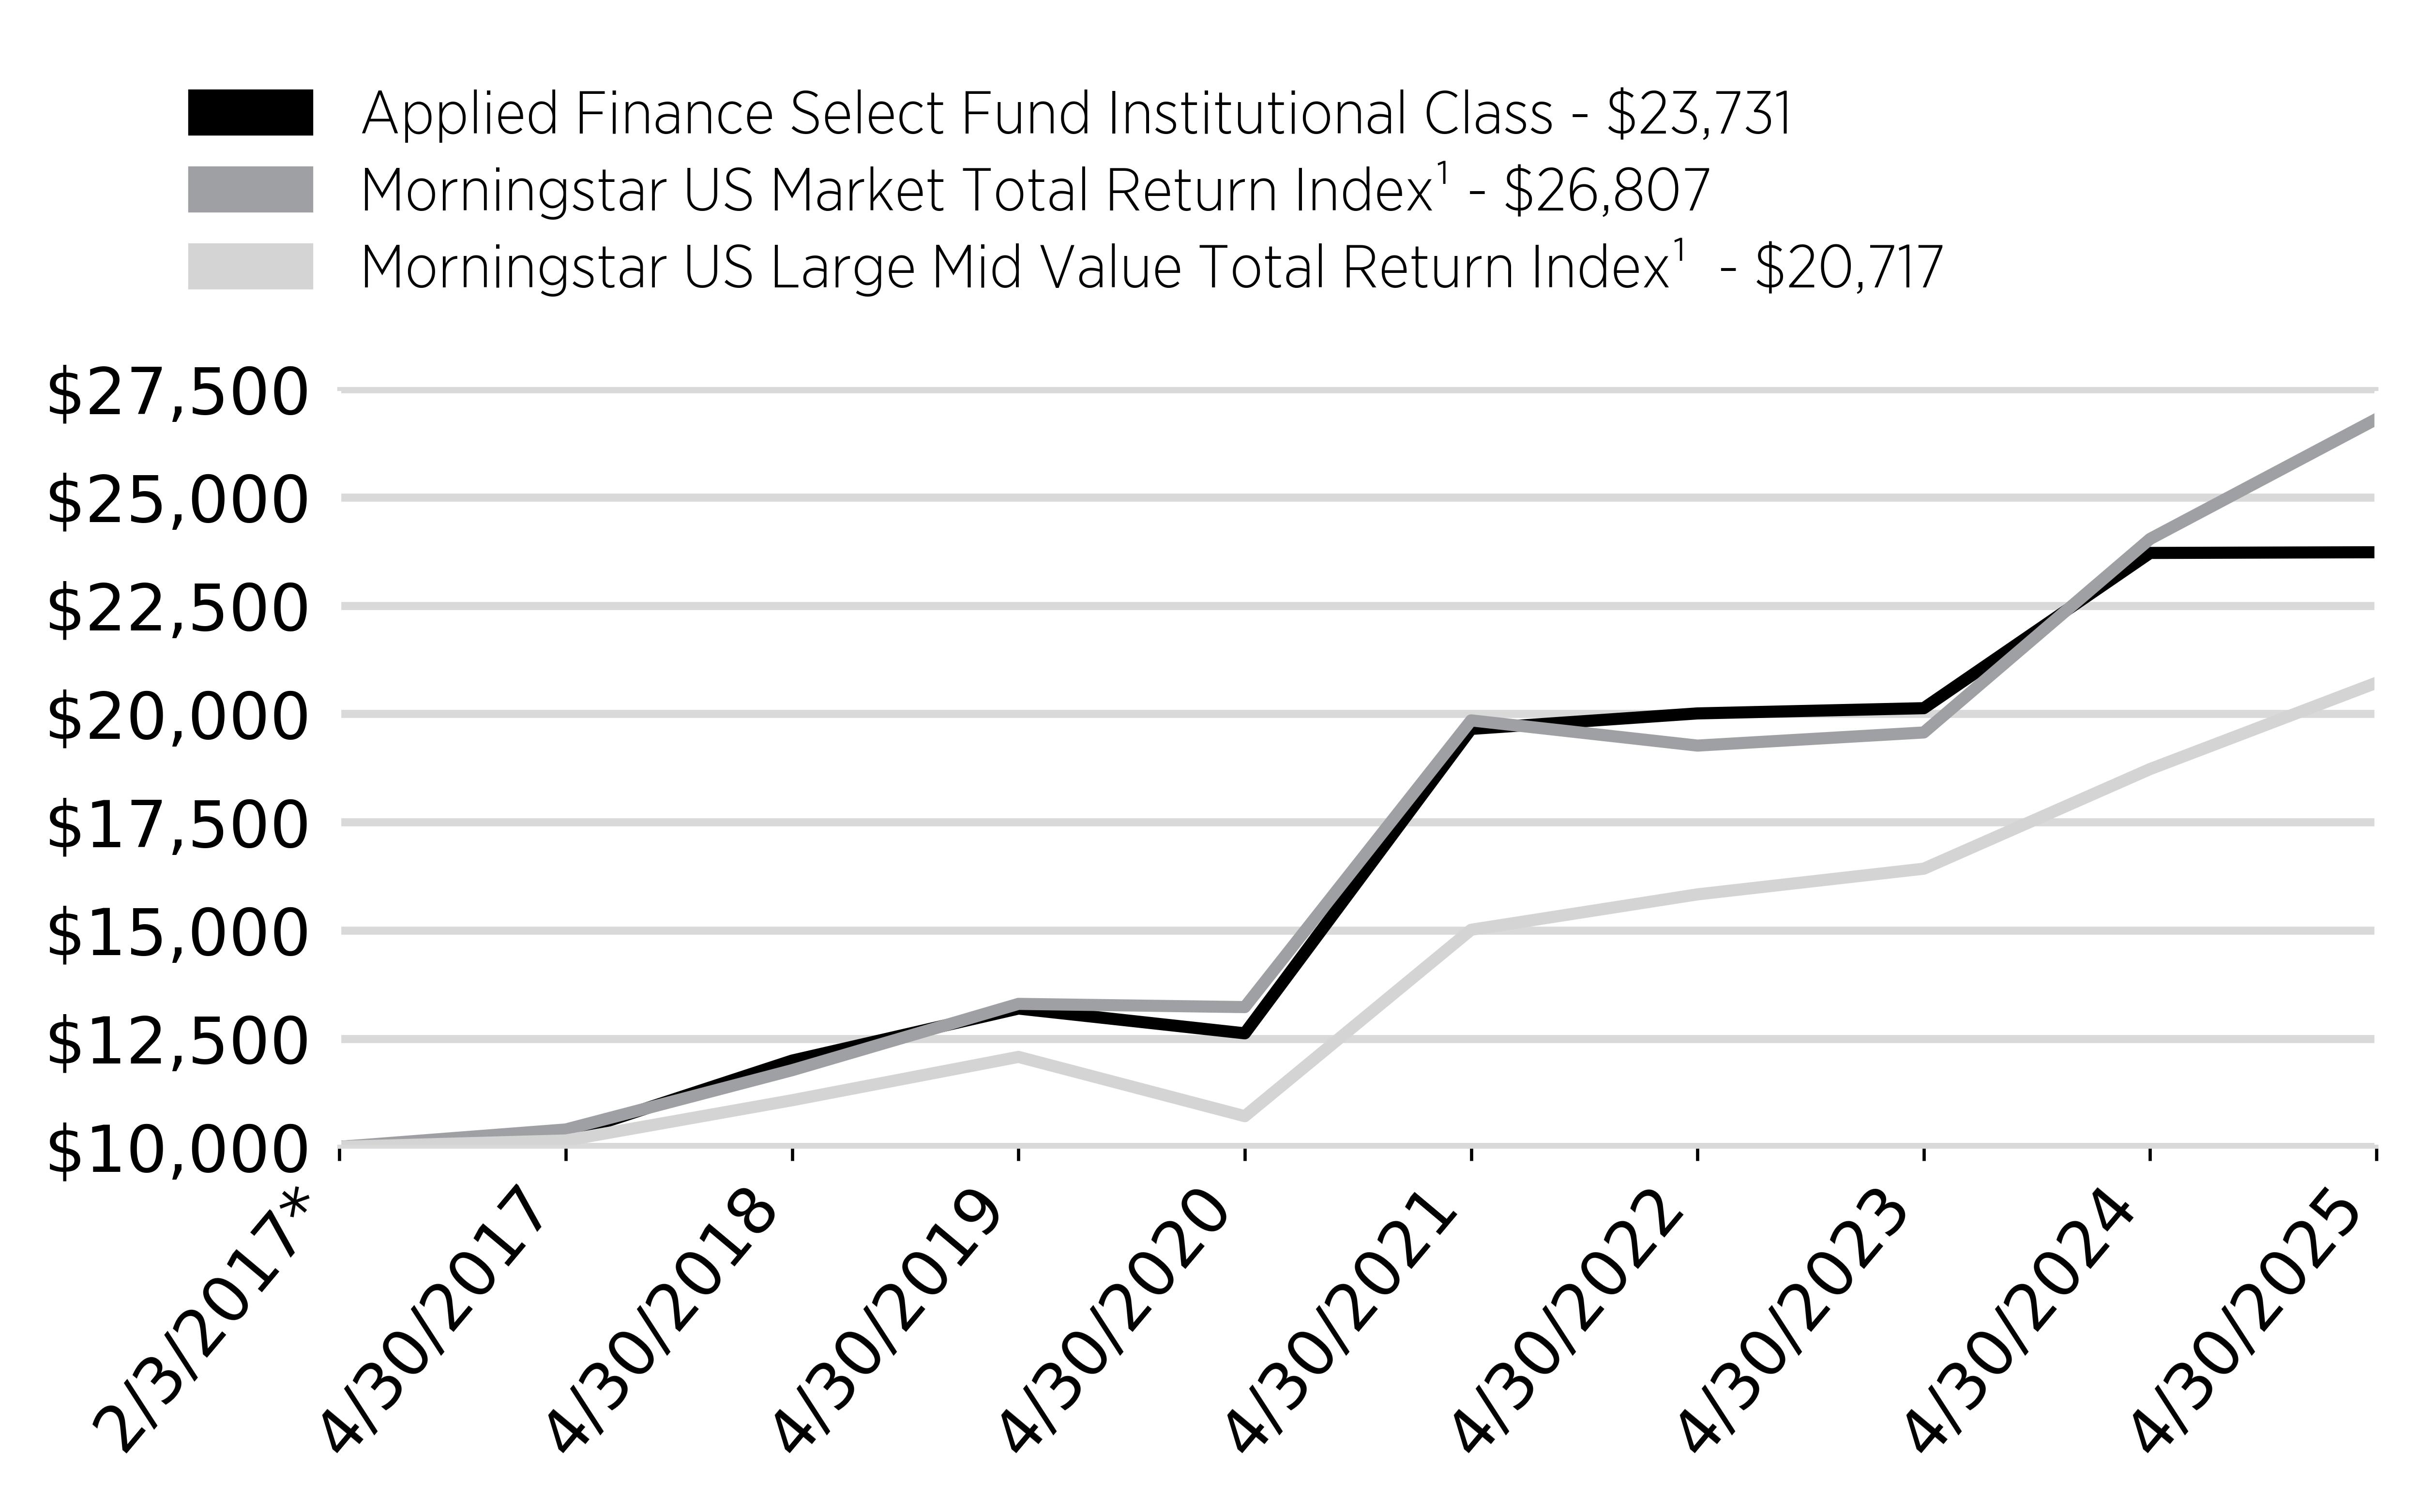
How did the Fund perform?
For the period of May 1, 2024 to April 30, 2025, the Applied Finance Select Fund Institutional Class Shares (the “Fund”) returned 0.07%.
In comparison, the Morningstar US Market Total Return Index returned 11.51% and the Morningstar US Large Mid Value Total Return Index returned 10.65% for the same period.
What key factors influenced performance?
US stocks rose gradually from May 2024 through January 2025 before peaking in mid-February. Uncertainty over tariffs and their effect on the economy pushed stocks lower in March and part of April, with indices rebounding by the end of the month.
The performance of the Morningstar US Market Total Return Index was strongest in the Financials and Information Technology sectors. During the 12 months ending April 30, 2025, Growth stocks outperformed Value stocks.
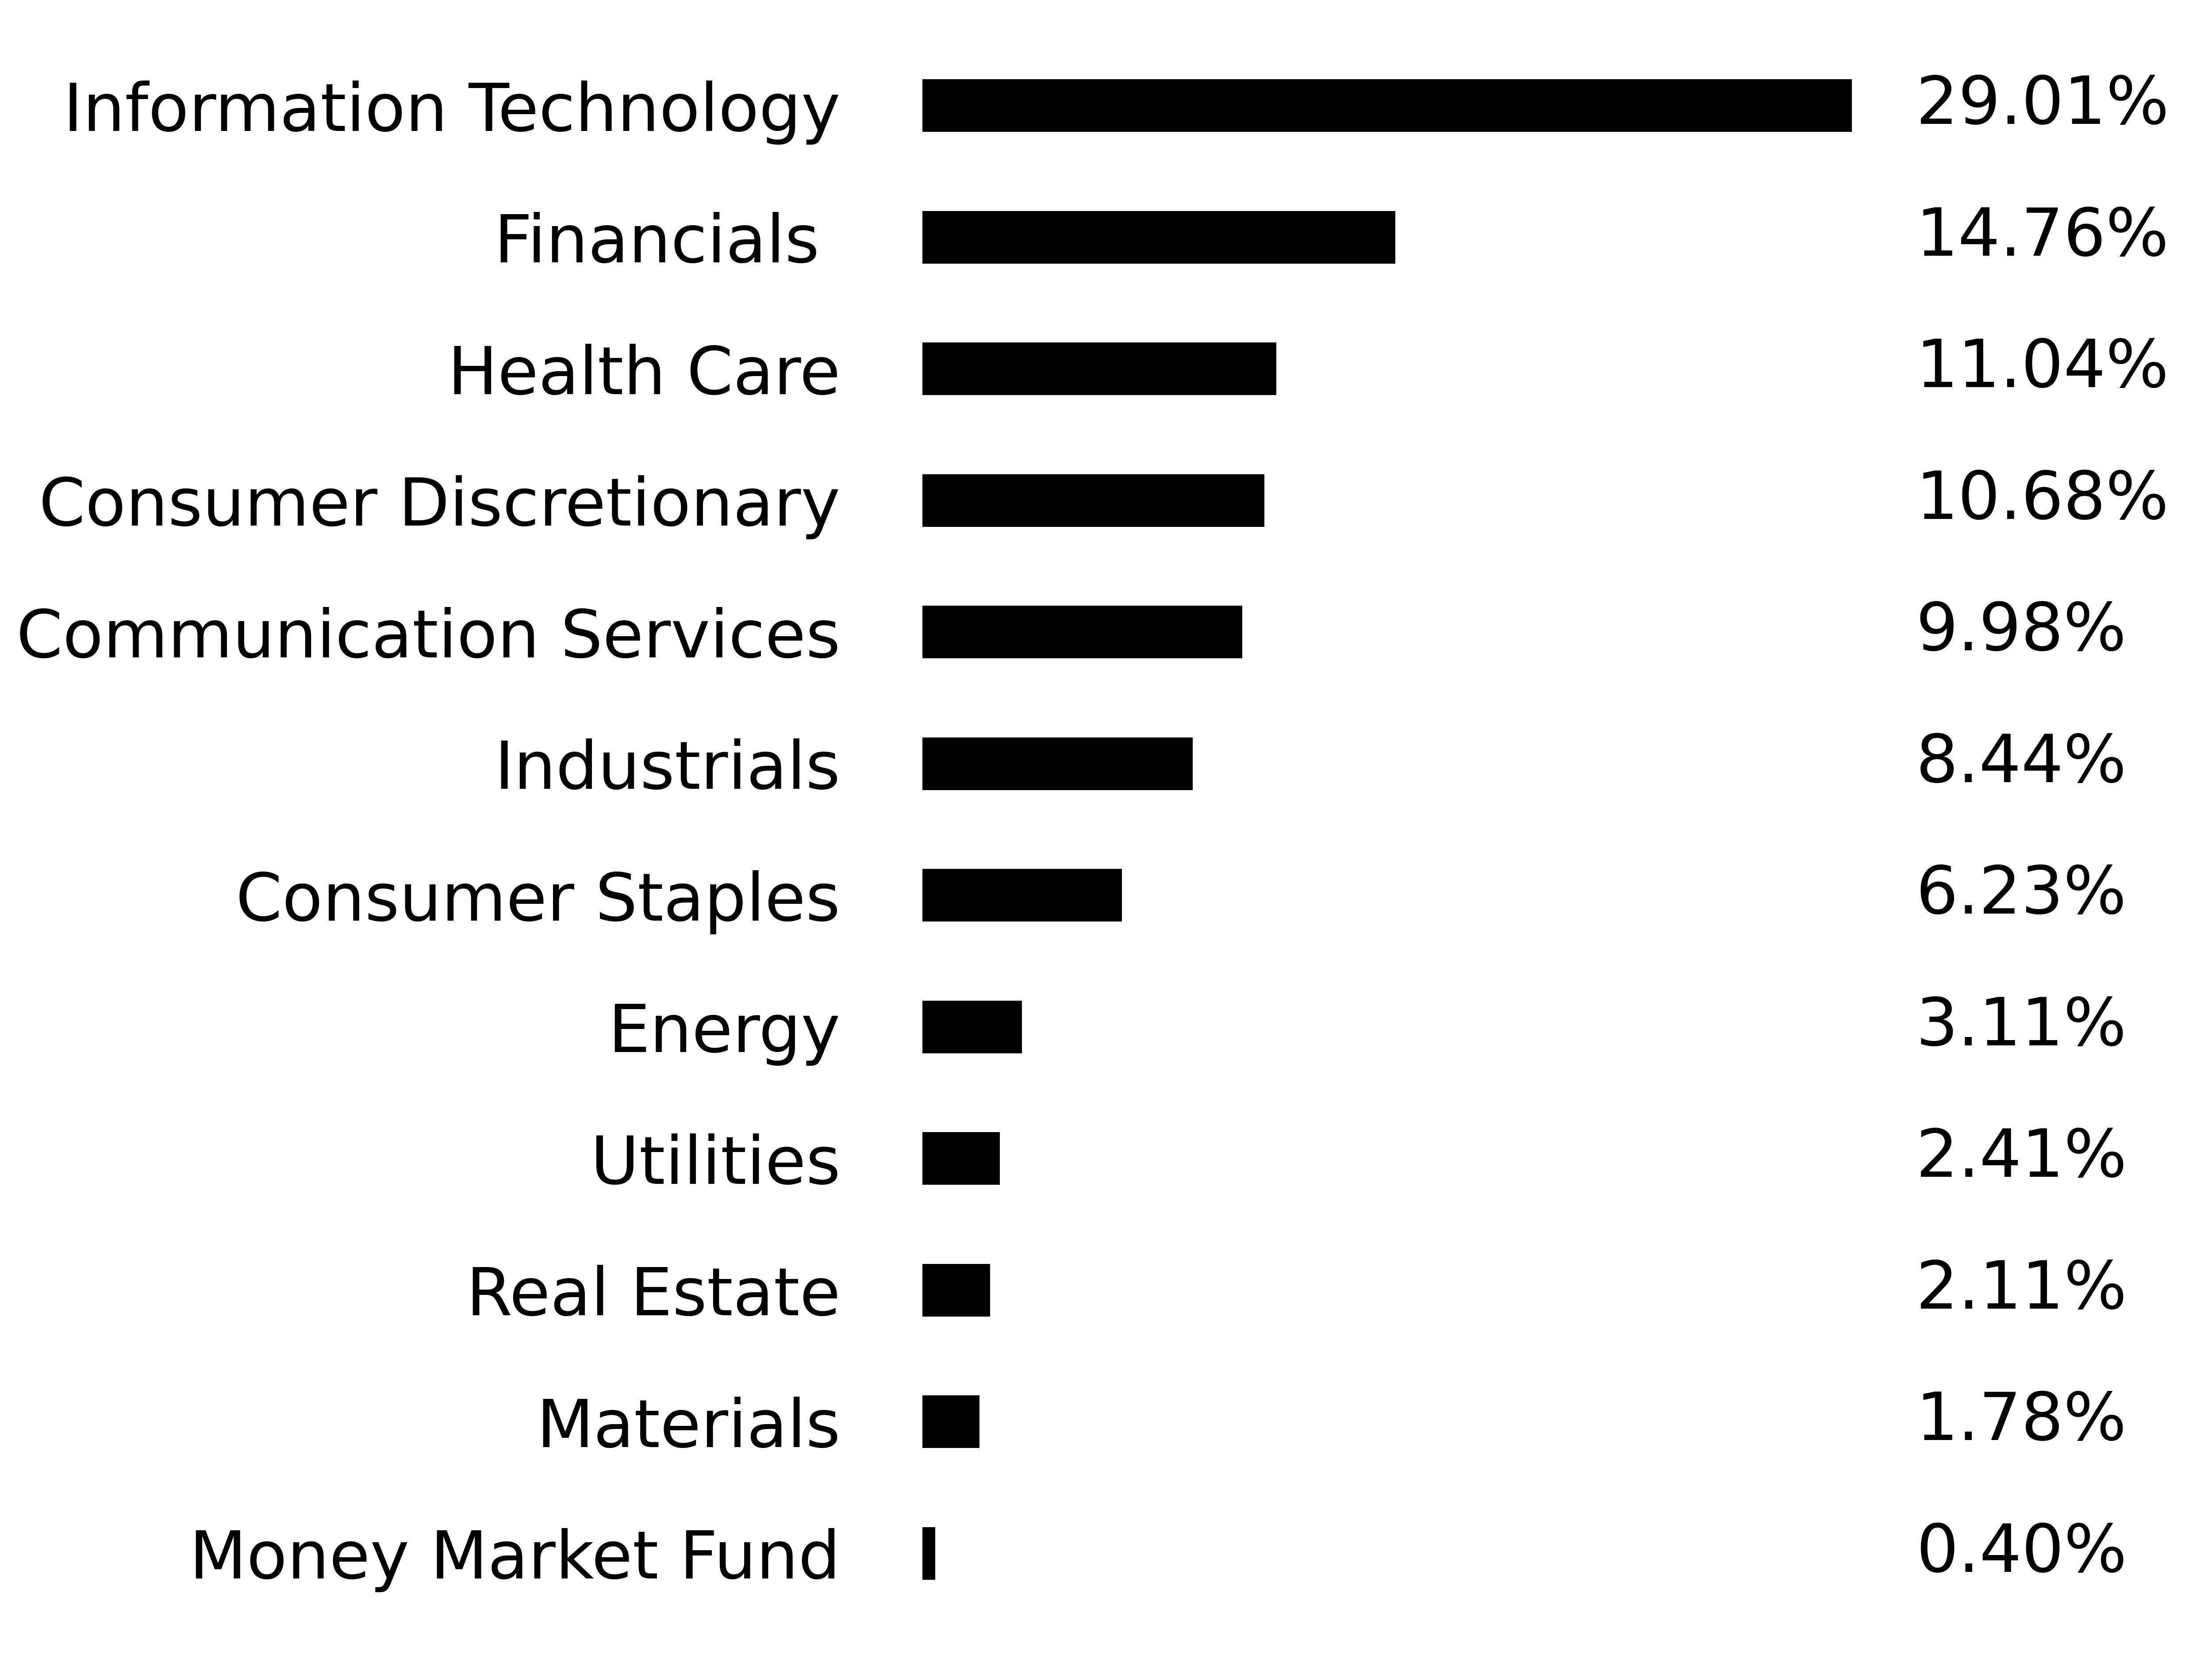
The Fund’s holdings focus on large-cap stocks in the US universe. The Fund’s emphasis on Value oriented stocks lowered performance relative to the Morningstar US Market Total Return Index. Information Technology, Consumer Staples and Consumer Discretionary sectors were leading detractors relative to the Morningstar US Market Total Return Index. Underperformance was generally due to stock selection.
Cumulative Performance
(based on a hypothetical $10,000 investment)
| * | Inception |
Annual Performance
Average Annual Total Return
|
|
1
Year |
5
Year |
Since
Inception |
|---|---|---|---|
|
Applied
Finance Select Fund - Institutional Class |
0.07% |
13.46% |
11.06% |
|
Morningstar
US Market Total Return Index¹ |
11.51% |
15.18% |
12.72% |
|
Morningstar
US Large Mid Value Total Return Index¹ |
10.65% |
14.11% |
9.25% |
Key Fund Statistics
(as of April 30, 2025)
|
Fund
Net Assets |
$570,963,822 |
|
Number
of Holdings |
51 |
|
Total
Advisory Fee Paid |
$2,998,846 |
|
Portfolio
Turnover Rate |
27.63% |
Sector Breakdown
|
Top
Ten Holdings |
|
|---|---|
|
KLA
Corp. |
|
|
Applied
Materials, Inc. |
|
|
Cisco
Systems, Inc. |
|
|
Roper
Technologies, Inc. |
|
|
International
Business Machines Corp. |
|
|
Adobe,
Inc. |
|
|
Apple,
Inc. |
|
|
Oracle
Corp. |
|
|
HP,
Inc. |
|
|
Verizon
Communications, Inc. |
What were the Fund costs for the past year?
(based on a hypothetical $10,000 investment)
|
Class
Name |
Costs
of a $10,000 investment |
Costs
paid as a percentage of a $10,000 investment |
|---|---|---|
|
Applied
Finance Select Fund
- Investor Class |
$101 |
1.01% |
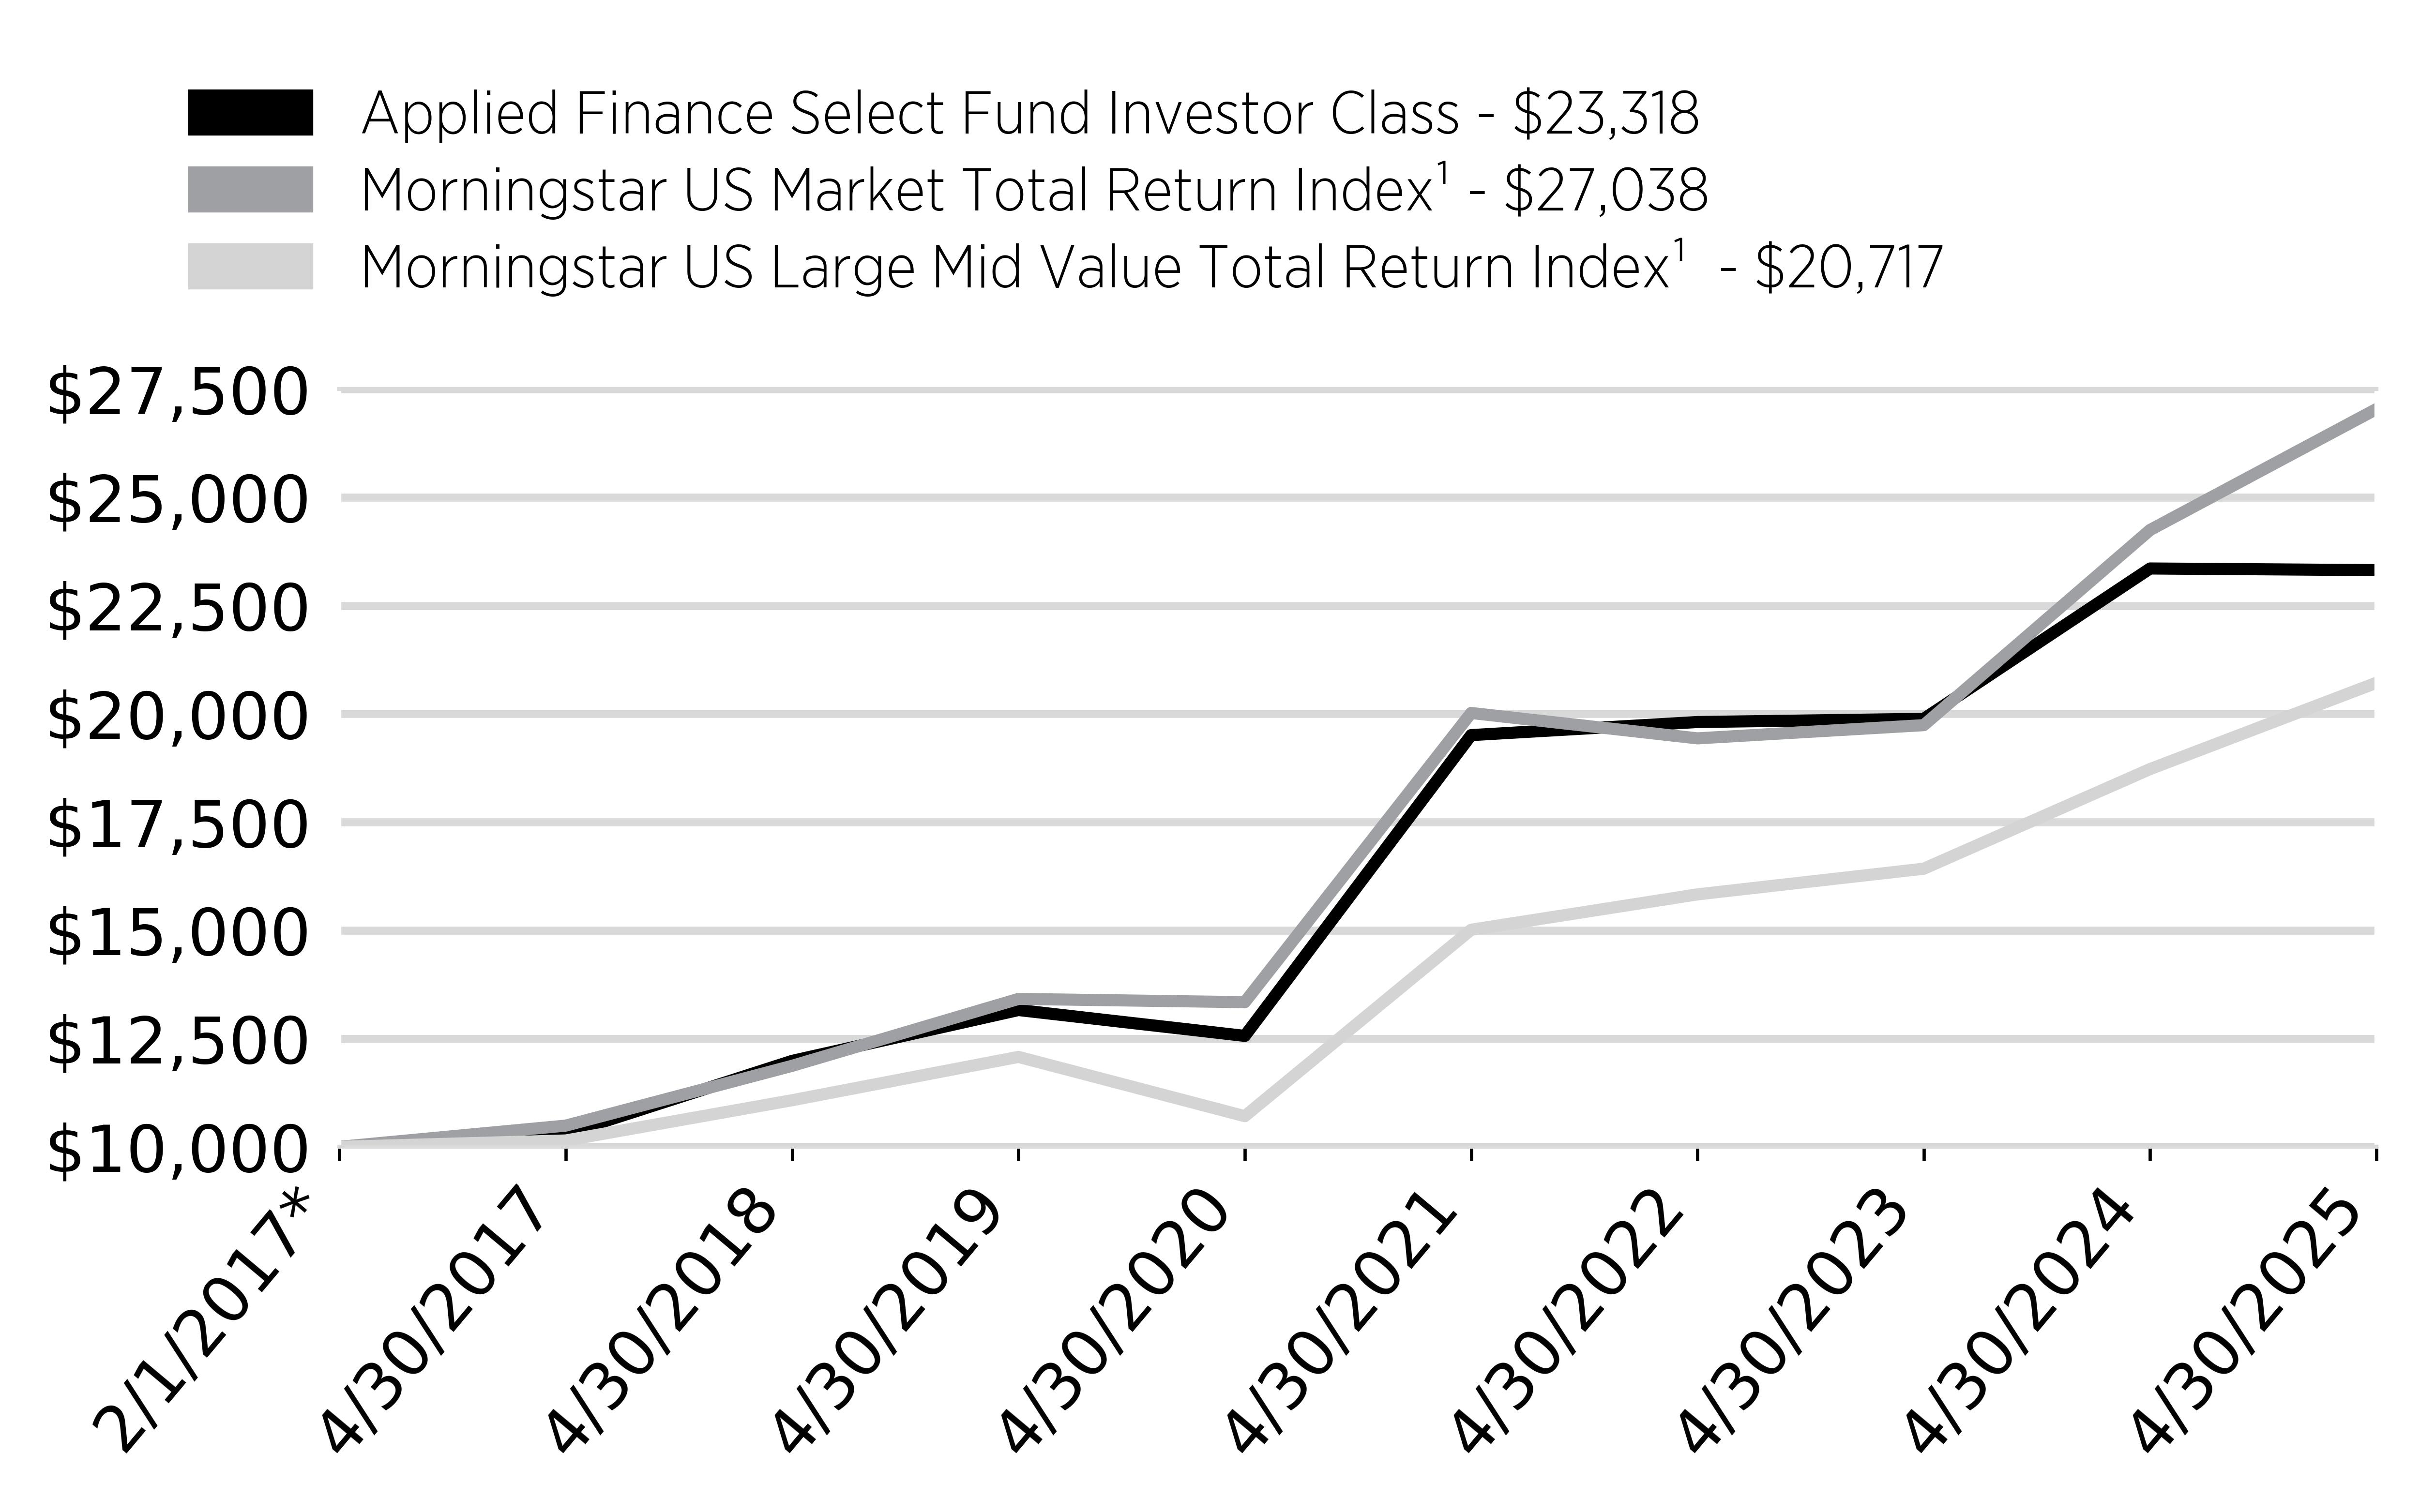
How did the Fund perform?
For the period of May 1, 2024 to April 30, 2025, the Applied Finance Select Fund Investor Class Shares (the “Fund”) returned -0.16%.
In comparison, the Morningstar US Market Total Return Index returned 11.51% and the Morningstar US Large Mid Value Total Return Index returned 10.65% for the same period.
What key factors influenced performance?
US stocks rose gradually from May 2024 through January 2025 before peaking in mid-February. Uncertainty over tariffs and their effect on the economy pushed stocks lower in March and part of April, with indices rebounding by the end of the month.
The performance of the Morningstar US Market Total Return Index was strongest in the Financials and Information Technology sectors. During the 12 months ending April 30, 2025, Growth stocks outperformed Value stocks.
The Fund’s holdings focus on large-cap stocks in the US universe. The Fund’s emphasis on Value oriented stocks lowered performance relative to the Morningstar US Market Total Return Index. Information Technology, Consumer Staples and Consumer Discretionary sectors were leading detractors relative to the Morningstar US Market Total Return Index. Underperformance was generally due to stock selection.
Cumulative Performance
(based on a hypothetical $10,000 investment)
| * | Inception |
Annual Performance
Average Annual Total Return
|
|
1
Year |
5
Year |
Since
Inception |
|---|---|---|---|
|
Applied
Finance Select Fund - Investor Class |
-0.16% |
13.17% |
10.82% |
|
Morningstar
US Market Total Return Index¹ |
11.51% |
15.18% |
12.83% |
|
Morningstar
US Large Mid Value Total Return Index¹ |
10.65% |
14.11% |
9.24% |
Key Fund Statistics
(as of April 30, 2025)
|
Fund
Net Assets |
$570,963,822 |
|
Number
of Holdings |
51 |
|
Total
Advisory Fee Paid |
$2,998,846 |
|
Portfolio
Turnover Rate |
27.63% |
Sector Breakdown
|
Top
Ten Holdings |
|
|---|---|
|
KLA
Corp. |
|
|
Applied
Materials, Inc. |
|
|
Cisco
Systems, Inc. |
|
|
Roper
Technologies, Inc. |
|
|
International
Business Machines Corp. |
|
|
Adobe,
Inc. |
|
|
Apple,
Inc. |
|
|
Oracle
Corp. |
|
|
HP,
Inc. |
|
|
Verizon
Communications, Inc. |