Pay vs Performance Disclosure - USD ($)
|
12 Months Ended |
Mar. 31, 2025 |
Mar. 31, 2024 |
Mar. 31, 2023 |
Mar. 31, 2022 |
| Pay vs Performance Disclosure |
|
|
|
|
| Pay vs Performance Disclosure, Table |
| | | | | | | | | | | | | | | | | | | | | | | | | | | | | | | | | | | | | | | | | | | | | | | | | | | | Value of Initial Fixed $100 Investment Based on: | | Year(1) | | Summary Compensation Table Total for PEO(2) | | Compensation Actually Paid to PEO(3) | | Average Summary Compensation Table Total for Non-PEO NEOs(4) | | Average Compensation Actually Paid to Non-PEO NEOs(3) | | IMVT TSR(5) | | Peer Group TSR(6) | Net Loss (in 000s)(7) | | 2025 | | $ | 10,732,127 | | | $ | (9,321,640) | | | $ | 4,885,984 | | | $ | 847,620 | | | $ | 107 | | | $ | 93 | | $ | (413,840) | | | 2024 | | 8,552,430 | | | 42,519,891 | | | 3,873,796 | | | 11,569,336 | | | 201 | | | 96 | | (259,336) | | | 2023 | | 5,819,818 | | | 28,186,331 | | | 1,994,501 | | | 9,250,459 | | | 97 | | | 89 | | (210,960) | | | 2022 | | 5,868,341 | | | (12,304,083) | | | 5,625,220 | | | 3,611,984 | | | 34 | | | 89 | | (156,730) | |
|
|
|
|
| Named Executive Officers, Footnote |
Peter Salzmann, our former Chief Executive Officer, was our PEO for the entirety of 2022 - 2025. The Non-PEO NEOs for 2025 were Eva Renee Barnett, Michael Geffner, Melanie Gloria and Christopher Van Tuyl. The Non-PEO NEOs for 2024 were Julia G. Butchko and Jay S. Stout. The Non-PEO NEOs for 2023 and 2022 were William L. Macias and Eva Renee Barnett.
|
|
|
|
| Peer Group Issuers, Footnote |
Peer Group TSR represents the weighted cumulative total return on $100 invested on March 31, 2021 through the last trading day of the applicable fiscal year reported in the table, weighted according to the respective companies’ stock market capitalization at the beginning of each period for which a return is indicated. The peer group used for this purpose is the Nasdaq Biotechnology Index for all four fiscal years disclosed, which aligns with the peer group used for the stock performance graph required by Item 201(e) of Regulation S-K included in our Annual Report on Form 10-K for the year ended March 31, 2025.
|
|
|
|
| PEO Total Compensation Amount |
$ 10,732,127
|
$ 8,552,430
|
$ 5,819,818
|
$ 5,868,341
|
| PEO Actually Paid Compensation Amount |
$ (9,321,640)
|
42,519,891
|
28,186,331
|
(12,304,083)
|
| Adjustment To PEO Compensation, Footnote |
The dollar amounts reported below represent the amount of “compensation actually paid” to our PEO and Non-PEO NEOs (as an average) as computed in accordance with Item 402(v) of Regulation S-K, for each covered fiscal year. The dollar amounts do not reflect the actual amount of compensation earned or received by or paid to the PEOs and Non-PEO NEOs during the applicable fiscal year. For purposes of the equity award adjustments shown below, no equity awards were cancelled due to a failure to meet vesting conditions and no dividends or other earnings paid on stock or option awards in the covered fiscal year prior to the vesting date were not otherwise included in the total compensation for the covered fiscal year. In calculating the “compensation actually paid” amounts reflected in these columns, the fair value or change in fair value, as applicable, of the equity award adjustments included in such calculations was computed in accordance with ASC Topic 718. The valuation assumptions used to calculate such fair values did not materially differ from those disclosed at the time of grant. The following table details the applicable adjustments that were made to the determine “compensation actually paid” for the fiscal year ended March 31, 2025 (all amounts are averages for Non-PEO NEOs): | | | | | | | | | | | | | | | | | PEO | | Non-PEO NEO Average | | Summary Compensation Table Total | | $ | 10,732,127 | | | $ | 4,885,984 | | | - Grant date fair value of awards granted during the covered fiscal year | | (9,481,127) | | | (4,384,418) | | | + Fair value as of the end of the covered fiscal year of all awards granted during the covered fiscal year that are outstanding and unvested at the end of the covered year | | 4,590,063 | | | 2,423,144 | | | +/- Change in fair value as of the end of the covered fiscal year (from the end of the prior fiscal year) of any awards granted in any prior fiscal year that are outstanding and unvested as of the end of the covered fiscal year | | (11,156,632) | | | (1,643,091) | | | + Fair value as of the vesting date of any awards that are granted and vest in the same fiscal year | | — | | | — | | | +/- Change in fair value as of the vesting date (from the end of the prior fiscal year) of any awards granted in any prior fiscal year for which all applicable vesting conditions were satisfied at the end of or during the covered fiscal year | | (4,006,071) | | | (433,999) | | | Compensation Actually Paid | | $ | (9,321,640) | | | $ | 847,620 | |
|
|
|
|
| Non-PEO NEO Average Total Compensation Amount |
$ 4,885,984
|
3,873,796
|
1,994,501
|
5,625,220
|
| Non-PEO NEO Average Compensation Actually Paid Amount |
$ 847,620
|
11,569,336
|
9,250,459
|
3,611,984
|
| Adjustment to Non-PEO NEO Compensation Footnote |
he dollar amounts reported below represent the amount of “compensation actually paid” to our PEO and Non-PEO NEOs (as an average) as computed in accordance with Item 402(v) of Regulation S-K, for each covered fiscal year. The dollar amounts do not reflect the actual amount of compensation earned or received by or paid to the PEOs and Non-PEO NEOs during the applicable fiscal year. For purposes of the equity award adjustments shown below, no equity awards were cancelled due to a failure to meet vesting conditions and no dividends or other earnings paid on stock or option awards in the covered fiscal year prior to the vesting date were not otherwise included in the total compensation for the covered fiscal year. In calculating the “compensation actually paid” amounts reflected in these columns, the fair value or change in fair value, as applicable, of the equity award adjustments included in such calculations was computed in accordance with ASC Topic 718. The valuation assumptions used to calculate such fair values did not materially differ from those disclosed at the time of grant. The following table details the applicable adjustments that were made to the determine “compensation actually paid” for the fiscal year ended March 31, 2025 (all amounts are averages for Non-PEO NEOs): | | | | | | | | | | | | | | | | | PEO | | Non-PEO NEO Average | | Summary Compensation Table Total | | $ | 10,732,127 | | | $ | 4,885,984 | | | - Grant date fair value of awards granted during the covered fiscal year | | (9,481,127) | | | (4,384,418) | | | + Fair value as of the end of the covered fiscal year of all awards granted during the covered fiscal year that are outstanding and unvested at the end of the covered year | | 4,590,063 | | | 2,423,144 | | | +/- Change in fair value as of the end of the covered fiscal year (from the end of the prior fiscal year) of any awards granted in any prior fiscal year that are outstanding and unvested as of the end of the covered fiscal year | | (11,156,632) | | | (1,643,091) | | | + Fair value as of the vesting date of any awards that are granted and vest in the same fiscal year | | — | | | — | | | +/- Change in fair value as of the vesting date (from the end of the prior fiscal year) of any awards granted in any prior fiscal year for which all applicable vesting conditions were satisfied at the end of or during the covered fiscal year | | (4,006,071) | | | (433,999) | | | Compensation Actually Paid | | $ | (9,321,640) | | | $ | 847,620 | |
|
|
|
|
| Compensation Actually Paid vs. Total Shareholder Return |
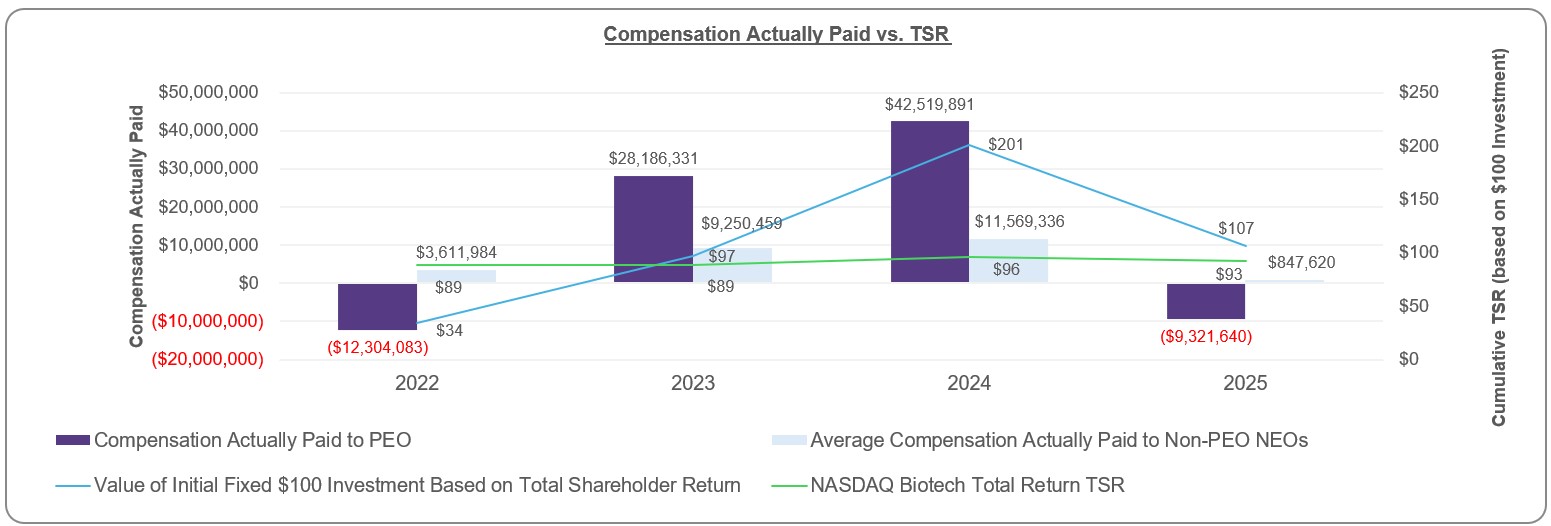
Compensation Actually Paid, Company TSR and Peer Group TSR
The chart below shows the relationship between the compensation actually paid to the PEO and the average compensation actually paid to our other Named Executive Officers, and our cumulative TSR (total shareholder return, based on an initial investment of $100 on March 31, 2021) and the Peer Group TSR over the four most recently completed fiscal years.
|
|
|
|
| Compensation Actually Paid vs. Net Income |
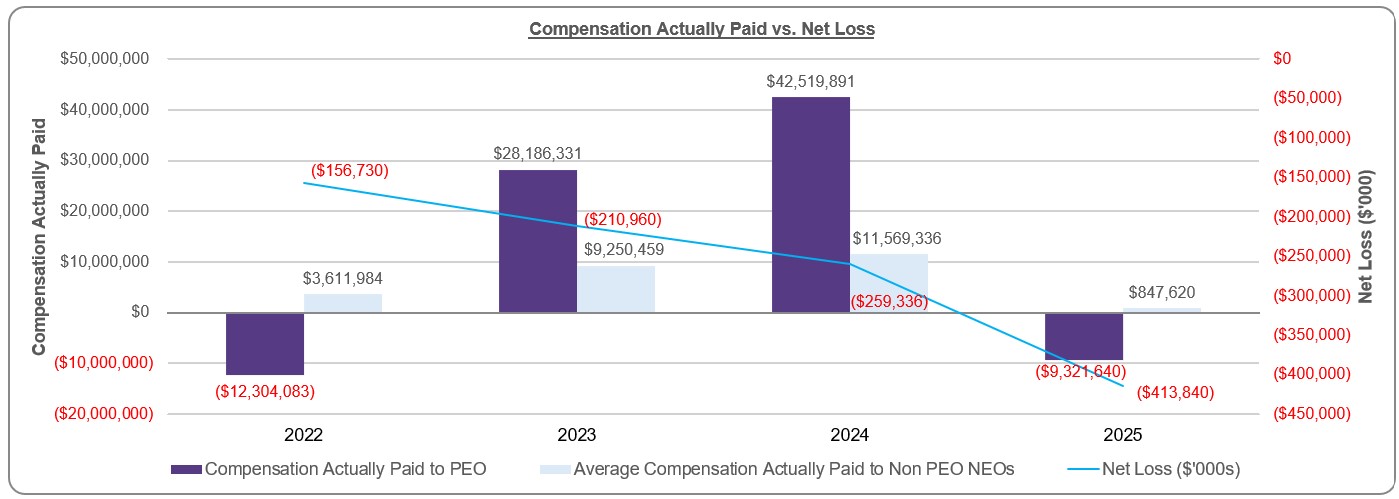
Compensation Actually Paid and Net Loss
The chart below shows the relationship between the compensation actually paid to the PEO and the average compensation actually paid to our other Named Executive Officers, and our net loss over the four most recently completed fiscal years.
|
|
|
|
| Total Shareholder Return Vs Peer Group |
Compensation Actually Paid, Company TSR and Peer Group TSR
The chart below shows the relationship between the compensation actually paid to the PEO and the average compensation actually paid to our other Named Executive Officers, and our cumulative TSR (total shareholder return, based on an initial investment of $100 on March 31, 2021) and the Peer Group TSR over the four most recently completed fiscal years.
|
|
|
|
| Total Shareholder Return Amount |
$ 107
|
201
|
97
|
34
|
| Peer Group Total Shareholder Return Amount |
93
|
96
|
89
|
89
|
| Net Income (Loss) |
$ (413,840,000)
|
$ (259,336,000)
|
$ (210,960,000)
|
$ (156,730,000)
|
| PEO Name |
Peter Salzmann
|
|
|
|
| Additional 402(v) Disclosure |
The dollar amounts reported herein represent the amount of total compensation reported for each covered fiscal year in the “Total” column of the Summary Compensation Table for each applicable year.The dollar amounts reported herein represent the average of the amounts of total compensation reported for our Non-PEO NEOs as a group for each covered fiscal year in the “Total” column of the Summary Compensation Table for each applicable year.Cumulative TSR assumes $100 was invested on March 31, 2021 and is calculated by dividing the sum of the cumulative amount of dividends for the measurement period, assuming dividend reinvestment, and the difference between our stock price at the end and the beginning of the measurement period (March 31, 2021) by our stock price at the beginning of the measurement period. At March 31, 2025, 2024, 2023, 2022 and 2021, the per share closing prices for our common stock were $17.09, $32.31, $15.51, $5.51 and $16.04, respectively. No dividends were paid on stock or option awards for all periods presented.Net loss is reflected as reported in our audited consolidated financial statements for the applicable fiscal year.
|
|
|
|
| PEO | Aggregate Grant Date Fair Value of Equity Award Amounts Reported in Summary Compensation Table |
|
|
|
|
| Pay vs Performance Disclosure |
|
|
|
|
| Adjustment to Compensation, Amount |
$ (9,481,127)
|
|
|
|
| PEO | Year-end Fair Value of Equity Awards Granted in Covered Year that are Outstanding and Unvested |
|
|
|
|
| Pay vs Performance Disclosure |
|
|
|
|
| Adjustment to Compensation, Amount |
4,590,063
|
|
|
|
| PEO | Year-over-Year Change in Fair Value of Equity Awards Granted in Prior Years That are Outstanding and Unvested |
|
|
|
|
| Pay vs Performance Disclosure |
|
|
|
|
| Adjustment to Compensation, Amount |
(11,156,632)
|
|
|
|
| PEO | Vesting Date Fair Value of Equity Awards Granted and Vested in Covered Year |
|
|
|
|
| Pay vs Performance Disclosure |
|
|
|
|
| Adjustment to Compensation, Amount |
0
|
|
|
|
| PEO | Change in Fair Value as of Vesting Date of Prior Year Equity Awards Vested in Covered Year |
|
|
|
|
| Pay vs Performance Disclosure |
|
|
|
|
| Adjustment to Compensation, Amount |
(4,006,071)
|
|
|
|
| Non-PEO NEO | Aggregate Grant Date Fair Value of Equity Award Amounts Reported in Summary Compensation Table |
|
|
|
|
| Pay vs Performance Disclosure |
|
|
|
|
| Adjustment to Compensation, Amount |
(4,384,418)
|
|
|
|
| Non-PEO NEO | Year-end Fair Value of Equity Awards Granted in Covered Year that are Outstanding and Unvested |
|
|
|
|
| Pay vs Performance Disclosure |
|
|
|
|
| Adjustment to Compensation, Amount |
2,423,144
|
|
|
|
| Non-PEO NEO | Year-over-Year Change in Fair Value of Equity Awards Granted in Prior Years That are Outstanding and Unvested |
|
|
|
|
| Pay vs Performance Disclosure |
|
|
|
|
| Adjustment to Compensation, Amount |
(1,643,091)
|
|
|
|
| Non-PEO NEO | Vesting Date Fair Value of Equity Awards Granted and Vested in Covered Year |
|
|
|
|
| Pay vs Performance Disclosure |
|
|
|
|
| Adjustment to Compensation, Amount |
0
|
|
|
|
| Non-PEO NEO | Change in Fair Value as of Vesting Date of Prior Year Equity Awards Vested in Covered Year |
|
|
|
|
| Pay vs Performance Disclosure |
|
|
|
|
| Adjustment to Compensation, Amount |
$ (433,999)
|
|
|
|