Shareholder Report
Apr. 30, 2025
USD ($)
Holding
Shareholder Report |
6 Months Ended |
|---|---|
|
Apr. 30, 2025
USD ($)
Holding
| |
| Shareholder Report [Line Items] | |
| Document Type | N-CSRS |
| Amendment Flag | false |
| Registrant Name | Northern Lights Fund Trust IV |
| Entity Central Index Key | 0001644419 |
| Entity Investment Company Type | N-1A |
| Document Period End Date | Apr. 30, 2025 |
| C000228990 | |
| Shareholder Report [Line Items] | |
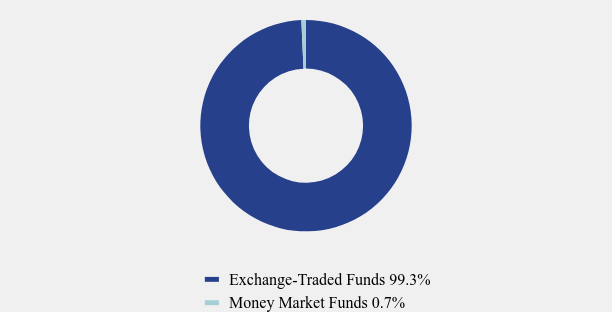
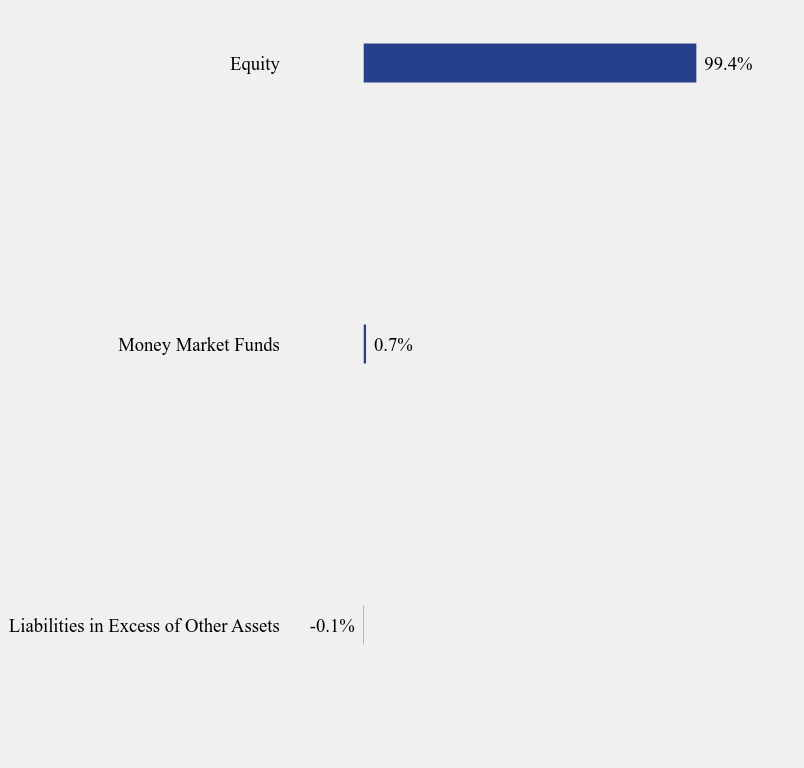
| Fund Name | Main International ETF |
| Trading Symbol | INTL |
| Security Exchange Name | CboeBZX |
| Annual or Semi-Annual Statement [Text Block] | This semi-annual shareholder report contains important information about Main International ETF for the period of November 1, 2024 to April 30, 2025. |
| Shareholder Report Annual or Semi-Annual | Semi-Annual Shareholder Report |
| Additional Information [Text Block] | You can find additional information about the Fund at https://www.mainmgtetfs.com/intl/. You can also request this information by contacting us at 1-866-383-9778 |
| Material Fund Change Notice [Text Block] | This report describes changes to the Fund that occurred during the reporting period. |
| Additional Information Phone Number | 1-866-383-9778 |
| Additional Information Website | https://www.mainmgtetfs.com/intl/ |
| Expenses [Text Block] | |
| Expenses Paid, Amount | $ 38 |
| Expense Ratio, Percent | 0.73% |
| AssetsNet | $ 123,215,790 |
| Holdings Count | Holding | 9 |
| Advisory Fees Paid, Amount | $ 314,916 |
| InvestmentCompanyPortfolioTurnover | 40.00% |
| Additional Fund Statistics [Text Block] | |
| Holdings [Text Block] | |
| C000190408 | |
| Shareholder Report [Line Items] | |
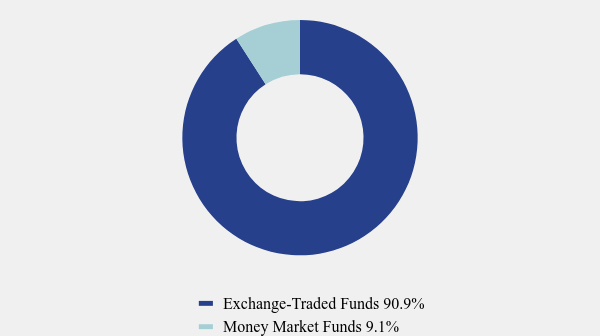
| Fund Name | Main Sector Rotation ETF |
| Trading Symbol | SECT |
| Security Exchange Name | CboeBZX |
| Annual or Semi-Annual Statement [Text Block] | This semi-annual shareholder report contains important information about Main Sector Rotation ETF for the period of November 1, 2024 to April 30, 2025. |
| Shareholder Report Annual or Semi-Annual | Semi-Annual Shareholder Report |
| Additional Information [Text Block] | You can find additional information about the Fund at https://www.mainmgtetfs.com/sect/. You can also request this information by contacting us at 1-866-383-9778 |
| Material Fund Change Notice [Text Block] | This report describes changes to the Fund that occurred during the reporting period. |
| Additional Information Phone Number | 1-866-383-9778 |
| Additional Information Website | https://www.mainmgtetfs.com/sect/ |
| Expenses [Text Block] | |
| Expenses Paid, Amount | $ 27 |
| Expense Ratio, Percent | 0.56% |
| AssetsNet | $ 1,845,859,526 |
| Holdings Count | Holding | 12 |
| Advisory Fees Paid, Amount | $ 4,822,721 |
| InvestmentCompanyPortfolioTurnover | 24.00% |
| Additional Fund Statistics [Text Block] | |
| Holdings [Text Block] | |
| C000223946 | |
| Shareholder Report [Line Items] | |
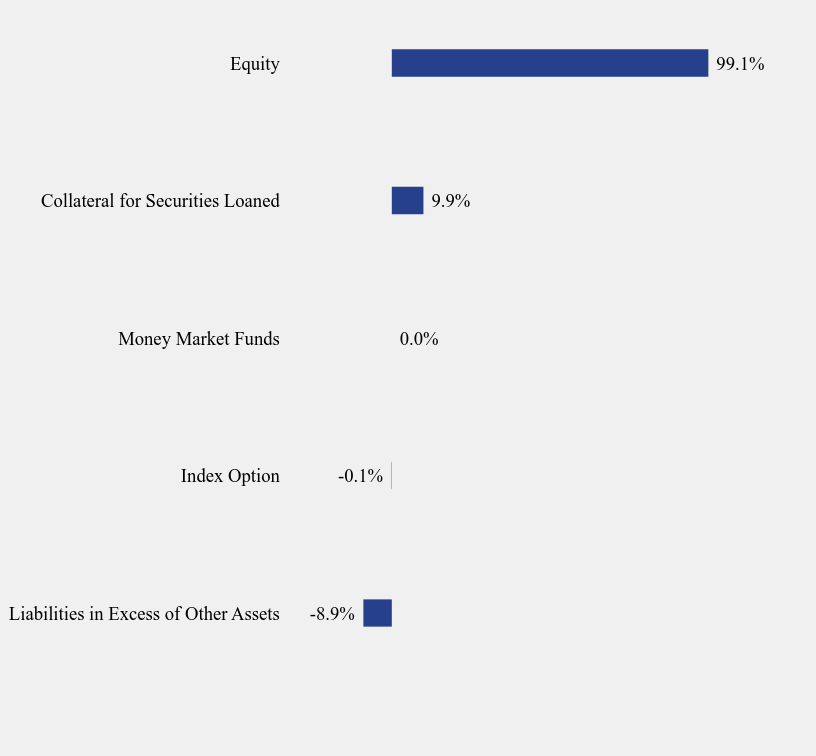
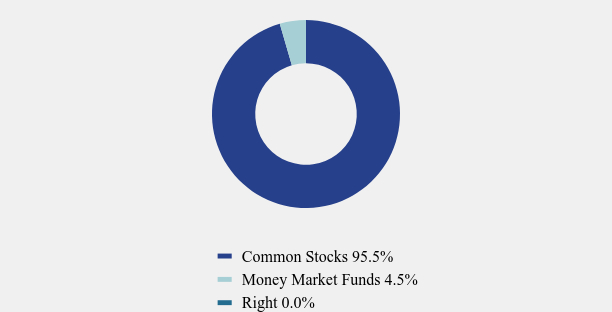
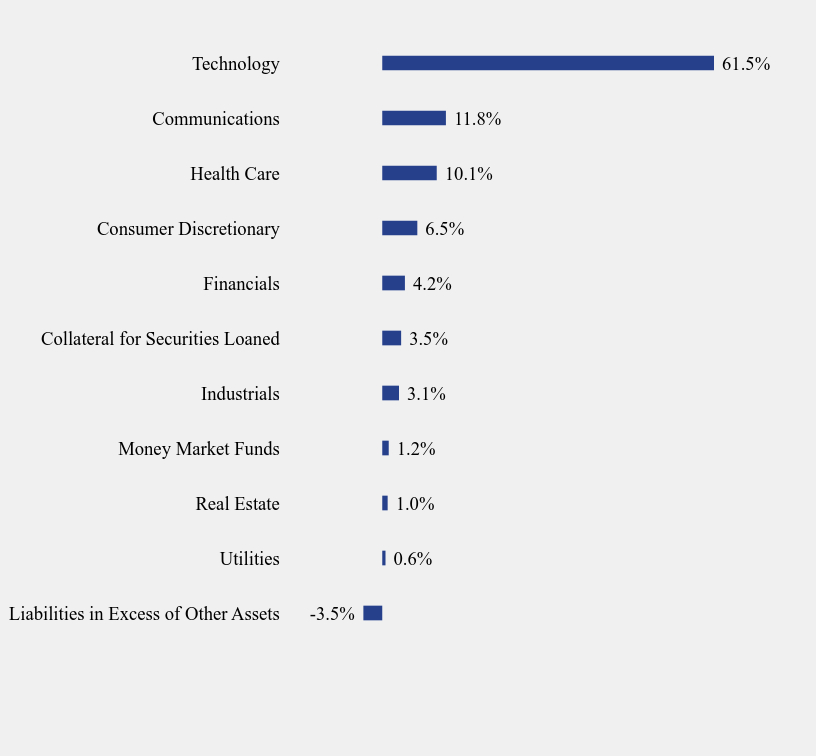
| Fund Name | Main Thematic Innovation ETF |
| Trading Symbol | TMAT |
| Security Exchange Name | CboeBZX |
| Annual or Semi-Annual Statement [Text Block] | This semi-annual shareholder report contains important information about Main Thematic Innovation ETF for the period of November 1, 2024 to April 30, 2025. |
| Shareholder Report Annual or Semi-Annual | Semi-Annual Shareholder Report |
| Additional Information [Text Block] | You can find additional information about the Fund at https://www.mainmgtetfs.com/tmat/. You can also request this information by contacting us at 1-866-383-9778 |
| Material Fund Change Notice [Text Block] | This report describes changes to the Fund that occurred during the reporting period. |
| Additional Information Phone Number | 1-866-383-9778 |
| Additional Information Website | https://www.mainmgtetfs.com/tmat/ |
| Expenses [Text Block] | |
| Expenses Paid, Amount | $ 41 |
| Expense Ratio, Percent | 0.82% |
| AssetsNet | $ 135,504,617 |
| Holdings Count | Holding | 121 |
| Advisory Fees Paid, Amount | $ 488,967 |
| InvestmentCompanyPortfolioTurnover | 3.00% |
| Additional Fund Statistics [Text Block] | |
| Holdings [Text Block] |