Shareholder Report
Apr. 30, 2025
USD ($)
Holding
What were the Fund costs for the last six months?
(Based on a hypothetical $10,000 investment)
| Share Class Name | Costs of a $10,000 investment | Costs paid as a percentage of a $10,000 investment1 |
| Class A | $49 | 0.98% |
| 1. | Annualized. |
Fund Performance
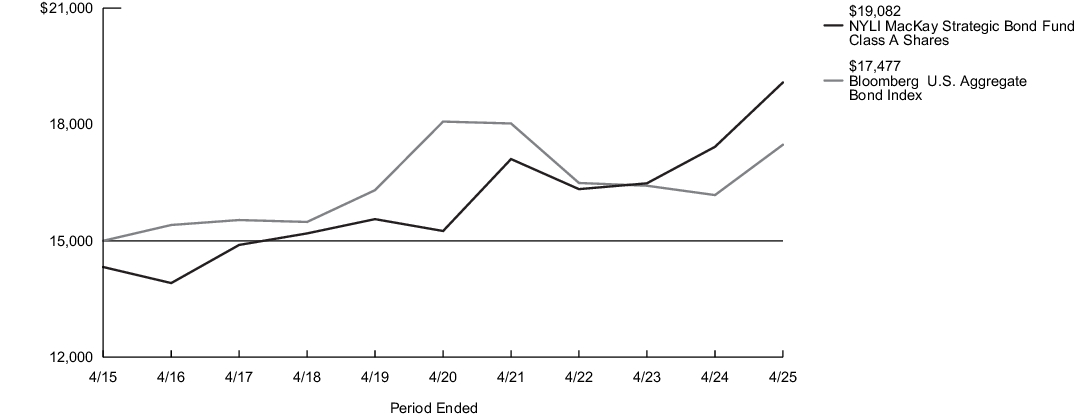
The following graph compares the initial and subsequent account values at the end of each of the most recently completed 10 semiannual reporting periods of the Fund (or for the life of the Fund, if shorter). It assumes a $15,000 initial investment at the beginning of the first fiscal period in an appropriate, broad-based securities market index and other additional indexes, if applicable, for the same period and reflects the deduction of all sales charges, where applicable.
| Average Annual Total Returns for the Period Ended April 30, 2025 | Inception Date |
Six Months1 |
One Year |
Five Years |
Ten Years |
| Class A Shares - Including sales charges | 2/28/1997 | (1.55)% | 4.59% | 3.62% | 2.44% |
| Class A Shares - Excluding sales charges | 3.09% | 9.52% | 4.58% | 2.91% | |
| Bloomberg U.S. Aggregate Bond Index2 | 2.57% | 8.02% | (0.67)% | 1.54% | |
| Morningstar Multisector Bond Category Average3 | 2.25% | 7.76% | 4.19% | 3.12% |
| 1. |
Not annualized. |
| 2. |
The Fund has selected the Bloomberg U.S. Aggregate Bond Index to represent a broad measure of market performance. The Bloomberg U.S. Aggregate Bond Index is a broad-based benchmark that measures the performance of the investment grade, U.S. dollar denominated, fixed-rate taxable bond market, including Treasuries, government-related and corporate securities, mortgage-backed securities (agency fixed-rate and hybrid adjustable rate mortgage pass-throughs), asset-backed securities and commercial mortgage-backed securities. |
| 3. |
The Morningstar Multisector Bond Category Average is representative of funds that seek income by diversifying their assets among several fixed-income sectors, usually U.S. government obligations, U.S. corporate bonds, foreign bonds, and high yield U.S. debt securities. These portfolios typically hold 35% to 65% of bond assets in securities that are not rated or are rated by a major agency such as Standard & Poor's or Moody's at the level of BB (considered speculative for taxable bonds) and below. Results are based on average total returns of similar funds with all dividends and capital gain distributions reinvested. |
Key Fund Statistics
| Fund's net assets | $995,196,754 |
| Total number of portfolio holdings | 548 |
| Portfolio turnover rate | 85% |
Graphical Representation of Holdings
The tables below show the investment makeup of the Fund; percentages indicated are based on the Fund's net assets.
Top Ten Holdings and/or Issuers*
| U.S. Treasury Notes, 3.75%-4.625%, due 4/30/27-2/15/35 | 22.3% |
| Connecticut Avenue Securities Trust, 6.053%-14.204%, due 9/25/31-1/25/45 | 3.9% |
| FHLMC STACR REMIC Trust, 6.004%-11.454%, due 8/25/33-1/25/51 | 3.5% |
| GNMA, (zero coupon)-4.50%, due 7/20/44-2/16/66 | 3.1% |
| UMBS, 30 Year, 2.00%-5.50%, due 3/1/52-5/1/54 | 2.5% |
| Flagship Credit Auto Trust, 1.59%-6.30%, due 3/16/26-4/15/30 | 2.0% |
| FHLMC, (zero coupon)-9.304%, due 5/25/44-8/15/56 | 1.5% |
| Exeter Automobile Receivables Trust, 3.04%-10.45%, due 12/15/28-9/15/32 | 1.4% |
| Wells Fargo Commercial Mortgage Trust, 2.70%-5.122%, due 12/15/39-1/15/60 | 1.3% |
| CF Hippolyta Issuer LLC, 1.69%-2.60%, due 7/15/60-3/15/61 | 1.0% |
| * Excluding short-term investments |
Portfolio Composition
| Corporate Bonds | 28.8% |
| Mortgage-Backed Securities | 26.9% |
| U.S. Government & Federal Agencies | 25.3% |
| Asset-Backed Securities | 11.8% |
| Foreign Government Bonds | 4.1% |
| Loan Assignments | 2.0% |
| Short-Term Investments | 1.4% |
| Common Stocks | 0.0%‡ |
| Other Assets, Less Liabilities | (0.3)% |
| ‡ Less than one-tenth of a percent. |
Top Ten Holdings and/or Issuers*
| U.S. Treasury Notes, 3.75%-4.625%, due 4/30/27-2/15/35 | 22.3% |
| Connecticut Avenue Securities Trust, 6.053%-14.204%, due 9/25/31-1/25/45 | 3.9% |
| FHLMC STACR REMIC Trust, 6.004%-11.454%, due 8/25/33-1/25/51 | 3.5% |
| GNMA, (zero coupon)-4.50%, due 7/20/44-2/16/66 | 3.1% |
| UMBS, 30 Year, 2.00%-5.50%, due 3/1/52-5/1/54 | 2.5% |
| Flagship Credit Auto Trust, 1.59%-6.30%, due 3/16/26-4/15/30 | 2.0% |
| FHLMC, (zero coupon)-9.304%, due 5/25/44-8/15/56 | 1.5% |
| Exeter Automobile Receivables Trust, 3.04%-10.45%, due 12/15/28-9/15/32 | 1.4% |
| Wells Fargo Commercial Mortgage Trust, 2.70%-5.122%, due 12/15/39-1/15/60 | 1.3% |
| CF Hippolyta Issuer LLC, 1.69%-2.60%, due 7/15/60-3/15/61 | 1.0% |
| * Excluding short-term investments |
What were the Fund costs for the last six months?
(Based on a hypothetical $10,000 investment)
| Share Class Name | Costs of a $10,000 investment | Costs paid as a percentage of a $10,000 investment1,2 |
| Class C | $99 | 1.97% |
| 1. | Reflects fee waivers and/or expense reimbursements, without which expenses would have been higher. |
| 2. | Annualized. |
Fund Performance
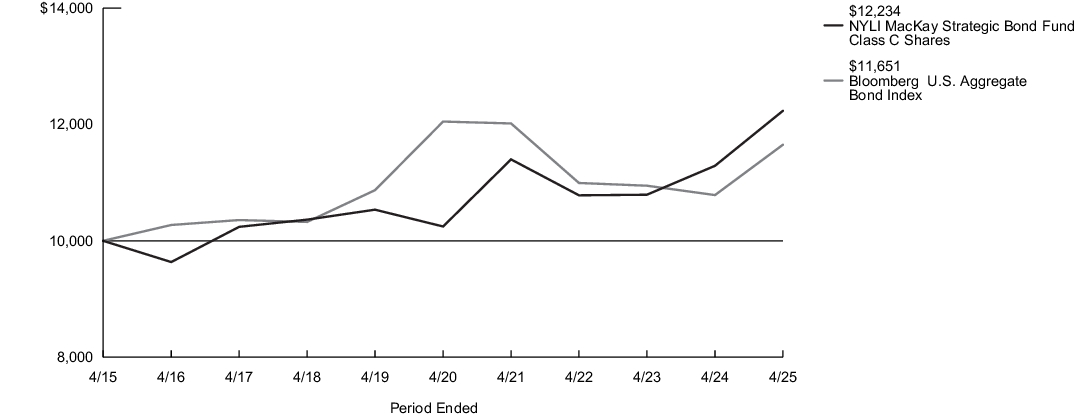
The following graph compares the initial and subsequent account values at the end of each of the most recently completed 10 semiannual reporting periods of the Fund (or for the life of the Fund, if shorter). It assumes a $10,000 initial investment at the beginning of the first fiscal period in an appropriate, broad-based securities market index and other additional indexes, if applicable, for the same period and reflects the deduction of all sales charges, where applicable.
| Average Annual Total Returns for the Period Ended April 30, 2025 | Inception Date |
Six Months1 |
One Year |
Five Years |
Ten Years |
| Class C Shares - Including sales charges | 9/1/1998 | 1.60% | 7.37% | 3.61% | 2.04% |
| Class C Shares - Excluding sales charges | 2.60% | 8.37% | 3.61% | 2.04% | |
| Bloomberg U.S. Aggregate Bond Index2 | 2.57% | 8.02% | (0.67)% | 1.54% | |
| Morningstar Multisector Bond Category Average3 | 2.25% | 7.76% | 4.19% | 3.12% |
| 1. |
Not annualized. |
| 2. |
The Fund has selected the Bloomberg U.S. Aggregate Bond Index to represent a broad measure of market performance. The Bloomberg U.S. Aggregate Bond Index is a broad-based benchmark that measures the performance of the investment grade, U.S. dollar denominated, fixed-rate taxable bond market, including Treasuries, government-related and corporate securities, mortgage-backed securities (agency fixed-rate and hybrid adjustable rate mortgage pass-throughs), asset-backed securities and commercial mortgage-backed securities. |
| 3. |
The Morningstar Multisector Bond Category Average is representative of funds that seek income by diversifying their assets among several fixed-income sectors, usually U.S. government obligations, U.S. corporate bonds, foreign bonds, and high yield U.S. debt securities. These portfolios typically hold 35% to 65% of bond assets in securities that are not rated or are rated by a major agency such as Standard & Poor's or Moody's at the level of BB (considered speculative for taxable bonds) and below. Results are based on average total returns of similar funds with all dividends and capital gain distributions reinvested. |
Key Fund Statistics
| Fund's net assets | $995,196,754 |
| Total number of portfolio holdings | 548 |
| Portfolio turnover rate | 85% |
Graphical Representation of Holdings
The tables below show the investment makeup of the Fund; percentages indicated are based on the Fund's net assets.
Top Ten Holdings and/or Issuers*
| U.S. Treasury Notes, 3.75%-4.625%, due 4/30/27-2/15/35 | 22.3% |
| Connecticut Avenue Securities Trust, 6.053%-14.204%, due 9/25/31-1/25/45 | 3.9% |
| FHLMC STACR REMIC Trust, 6.004%-11.454%, due 8/25/33-1/25/51 | 3.5% |
| GNMA, (zero coupon)-4.50%, due 7/20/44-2/16/66 | 3.1% |
| UMBS, 30 Year, 2.00%-5.50%, due 3/1/52-5/1/54 | 2.5% |
| Flagship Credit Auto Trust, 1.59%-6.30%, due 3/16/26-4/15/30 | 2.0% |
| FHLMC, (zero coupon)-9.304%, due 5/25/44-8/15/56 | 1.5% |
| Exeter Automobile Receivables Trust, 3.04%-10.45%, due 12/15/28-9/15/32 | 1.4% |
| Wells Fargo Commercial Mortgage Trust, 2.70%-5.122%, due 12/15/39-1/15/60 | 1.3% |
| CF Hippolyta Issuer LLC, 1.69%-2.60%, due 7/15/60-3/15/61 | 1.0% |
| * Excluding short-term investments |
Portfolio Composition
| Corporate Bonds | 28.8% |
| Mortgage-Backed Securities | 26.9% |
| U.S. Government & Federal Agencies | 25.3% |
| Asset-Backed Securities | 11.8% |
| Foreign Government Bonds | 4.1% |
| Loan Assignments | 2.0% |
| Short-Term Investments | 1.4% |
| Common Stocks | 0.0%‡ |
| Other Assets, Less Liabilities | (0.3)% |
| ‡ Less than one-tenth of a percent. |
Top Ten Holdings and/or Issuers*
| U.S. Treasury Notes, 3.75%-4.625%, due 4/30/27-2/15/35 | 22.3% |
| Connecticut Avenue Securities Trust, 6.053%-14.204%, due 9/25/31-1/25/45 | 3.9% |
| FHLMC STACR REMIC Trust, 6.004%-11.454%, due 8/25/33-1/25/51 | 3.5% |
| GNMA, (zero coupon)-4.50%, due 7/20/44-2/16/66 | 3.1% |
| UMBS, 30 Year, 2.00%-5.50%, due 3/1/52-5/1/54 | 2.5% |
| Flagship Credit Auto Trust, 1.59%-6.30%, due 3/16/26-4/15/30 | 2.0% |
| FHLMC, (zero coupon)-9.304%, due 5/25/44-8/15/56 | 1.5% |
| Exeter Automobile Receivables Trust, 3.04%-10.45%, due 12/15/28-9/15/32 | 1.4% |
| Wells Fargo Commercial Mortgage Trust, 2.70%-5.122%, due 12/15/39-1/15/60 | 1.3% |
| CF Hippolyta Issuer LLC, 1.69%-2.60%, due 7/15/60-3/15/61 | 1.0% |
| * Excluding short-term investments |
What were the Fund costs for the last six months?
(Based on a hypothetical $10,000 investment)
| Share Class Name | Costs of a $10,000 investment | Costs paid as a percentage of a $10,000 investment1,2 |
| Class I | $35 | 0.70% |
| 1. | Reflects fee waivers and/or expense reimbursements, without which expenses would have been higher. |
| 2. | Annualized. |
Fund Performance
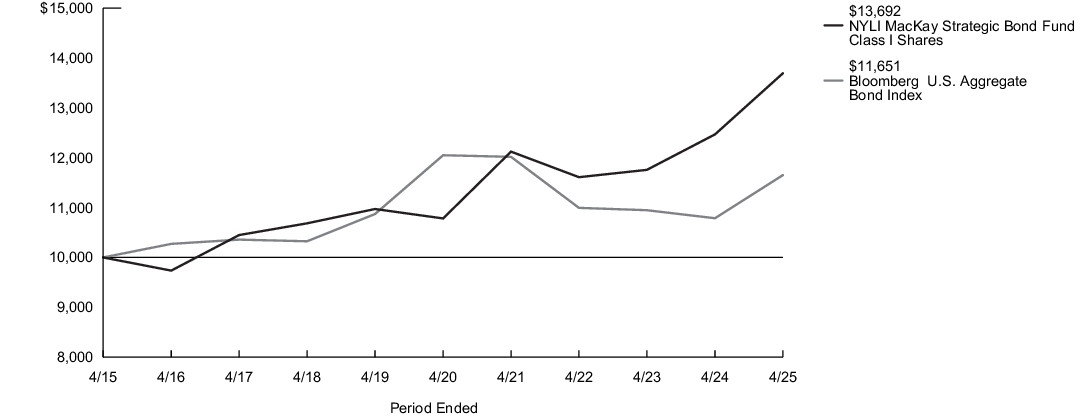
The following graph compares the initial and subsequent account values at the end of each of the most recently completed 10 semiannual reporting periods of the Fund (or for the life of the Fund, if shorter). It assumes a $10,000 initial investment at the beginning of the first fiscal period in an appropriate, broad-based securities market index and other additional indexes, if applicable, for the same period and reflects the deduction of all sales charges, where applicable.
| Average Annual Total Returns for the Period Ended April 30, 2025 | Inception Date |
Six Months1 |
One Year |
Five Years |
Ten Years |
| Class I Shares | 1/2/2004 | 3.22% | 9.82% | 4.89% | 3.19% |
| Bloomberg U.S. Aggregate Bond Index2 | 2.57% | 8.02% | (0.67)% | 1.54% | |
| Morningstar Multisector Bond Category Average3 | 2.25% | 7.76% | 4.19% | 3.12% |
| 1. |
Not annualized. |
| 2. |
The Fund has selected the Bloomberg U.S. Aggregate Bond Index to represent a broad measure of market performance. The Bloomberg U.S. Aggregate Bond Index is a broad-based benchmark that measures the performance of the investment grade, U.S. dollar denominated, fixed-rate taxable bond market, including Treasuries, government-related and corporate securities, mortgage-backed securities (agency fixed-rate and hybrid adjustable rate mortgage pass-throughs), asset-backed securities and commercial mortgage-backed securities. |
| 3. |
The Morningstar Multisector Bond Category Average is representative of funds that seek income by diversifying their assets among several fixed-income sectors, usually U.S. government obligations, U.S. corporate bonds, foreign bonds, and high yield U.S. debt securities. These portfolios typically hold 35% to 65% of bond assets in securities that are not rated or are rated by a major agency such as Standard & Poor's or Moody's at the level of BB (considered speculative for taxable bonds) and below. Results are based on average total returns of similar funds with all dividends and capital gain distributions reinvested. |
Key Fund Statistics
| Fund's net assets | $995,196,754 |
| Total number of portfolio holdings | 548 |
| Portfolio turnover rate | 85% |
Graphical Representation of Holdings
The tables below show the investment makeup of the Fund; percentages indicated are based on the Fund's net assets.
Top Ten Holdings and/or Issuers*
| U.S. Treasury Notes, 3.75%-4.625%, due 4/30/27-2/15/35 | 22.3% |
| Connecticut Avenue Securities Trust, 6.053%-14.204%, due 9/25/31-1/25/45 | 3.9% |
| FHLMC STACR REMIC Trust, 6.004%-11.454%, due 8/25/33-1/25/51 | 3.5% |
| GNMA, (zero coupon)-4.50%, due 7/20/44-2/16/66 | 3.1% |
| UMBS, 30 Year, 2.00%-5.50%, due 3/1/52-5/1/54 | 2.5% |
| Flagship Credit Auto Trust, 1.59%-6.30%, due 3/16/26-4/15/30 | 2.0% |
| FHLMC, (zero coupon)-9.304%, due 5/25/44-8/15/56 | 1.5% |
| Exeter Automobile Receivables Trust, 3.04%-10.45%, due 12/15/28-9/15/32 | 1.4% |
| Wells Fargo Commercial Mortgage Trust, 2.70%-5.122%, due 12/15/39-1/15/60 | 1.3% |
| CF Hippolyta Issuer LLC, 1.69%-2.60%, due 7/15/60-3/15/61 | 1.0% |
| * Excluding short-term investments |
Portfolio Composition
| Corporate Bonds | 28.8% |
| Mortgage-Backed Securities | 26.9% |
| U.S. Government & Federal Agencies | 25.3% |
| Asset-Backed Securities | 11.8% |
| Foreign Government Bonds | 4.1% |
| Loan Assignments | 2.0% |
| Short-Term Investments | 1.4% |
| Common Stocks | 0.0%‡ |
| Other Assets, Less Liabilities | (0.3)% |
| ‡ Less than one-tenth of a percent. |
Top Ten Holdings and/or Issuers*
| U.S. Treasury Notes, 3.75%-4.625%, due 4/30/27-2/15/35 | 22.3% |
| Connecticut Avenue Securities Trust, 6.053%-14.204%, due 9/25/31-1/25/45 | 3.9% |
| FHLMC STACR REMIC Trust, 6.004%-11.454%, due 8/25/33-1/25/51 | 3.5% |
| GNMA, (zero coupon)-4.50%, due 7/20/44-2/16/66 | 3.1% |
| UMBS, 30 Year, 2.00%-5.50%, due 3/1/52-5/1/54 | 2.5% |
| Flagship Credit Auto Trust, 1.59%-6.30%, due 3/16/26-4/15/30 | 2.0% |
| FHLMC, (zero coupon)-9.304%, due 5/25/44-8/15/56 | 1.5% |
| Exeter Automobile Receivables Trust, 3.04%-10.45%, due 12/15/28-9/15/32 | 1.4% |
| Wells Fargo Commercial Mortgage Trust, 2.70%-5.122%, due 12/15/39-1/15/60 | 1.3% |
| CF Hippolyta Issuer LLC, 1.69%-2.60%, due 7/15/60-3/15/61 | 1.0% |
| * Excluding short-term investments |
What were the Fund costs for the last six months?
(Based on a hypothetical $10,000 investment)
| Share Class Name | Costs of a $10,000 investment | Costs paid as a percentage of a $10,000 investment1 |
| Class R6 | $32 | 0.63% |
| 1. | Annualized. |
Fund Performance
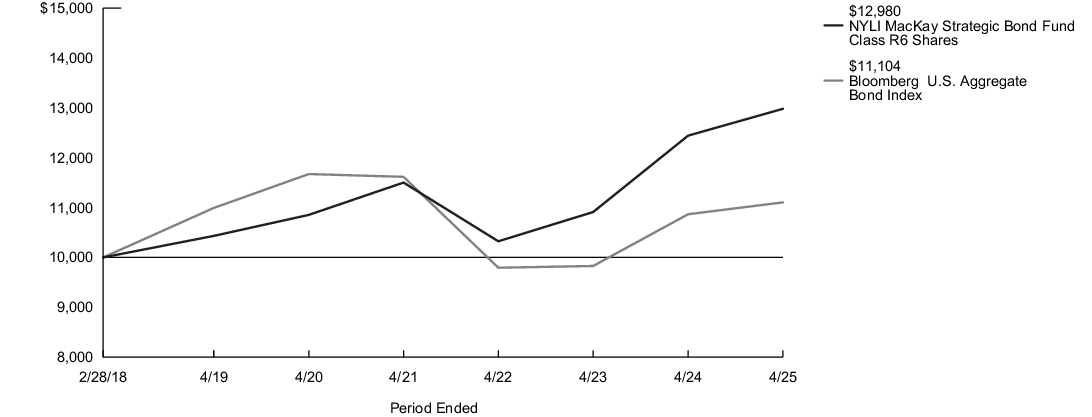
The following graph compares the initial and subsequent account values at the end of each of the most recently completed 10 semiannual reporting periods of the Fund (or for the life of the Fund, if shorter). It assumes a $10,000 initial investment at the beginning of the first fiscal period in an appropriate, broad-based securities market index and other additional indexes, if applicable, for the same period and reflects the deduction of all sales charges, where applicable.
| Average Annual Total Returns for the Period Ended April 30, 2025 | Inception Date |
Six Months1 |
One Year |
Five Years |
Since Inception |
| Class R6 Shares | 2/28/2018 | 3.25% | 9.85% | 5.05% | 3.65% |
| Bloomberg U.S. Aggregate Bond Index2 | 2.57% | 8.02% | (0.67)% | 1.69% | |
| Morningstar Multisector Bond Category Average3 | 2.25% | 7.76% | 4.19% | 2.94% |
| 1. |
Not annualized. |
| 2. |
The Fund has selected the Bloomberg U.S. Aggregate Bond Index to represent a broad measure of market performance. The Bloomberg U.S. Aggregate Bond Index is a broad-based benchmark that measures the performance of the investment grade, U.S. dollar denominated, fixed-rate taxable bond market, including Treasuries, government-related and corporate securities, mortgage-backed securities (agency fixed-rate and hybrid adjustable rate mortgage pass-throughs), asset-backed securities and commercial mortgage-backed securities. |
| 3. |
The Morningstar Multisector Bond Category Average is representative of funds that seek income by diversifying their assets among several fixed-income sectors, usually U.S. government obligations, U.S. corporate bonds, foreign bonds, and high yield U.S. debt securities. These portfolios typically hold 35% to 65% of bond assets in securities that are not rated or are rated by a major agency such as Standard & Poor's or Moody's at the level of BB (considered speculative for taxable bonds) and below. Results are based on average total returns of similar funds with all dividends and capital gain distributions reinvested. |
Key Fund Statistics
| Fund's net assets | $995,196,754 |
| Total number of portfolio holdings | 548 |
| Portfolio turnover rate | 85% |
Graphical Representation of Holdings
The tables below show the investment makeup of the Fund; percentages indicated are based on the Fund's net assets.
Top Ten Holdings and/or Issuers*
| U.S. Treasury Notes, 3.75%-4.625%, due 4/30/27-2/15/35 | 22.3% |
| Connecticut Avenue Securities Trust, 6.053%-14.204%, due 9/25/31-1/25/45 | 3.9% |
| FHLMC STACR REMIC Trust, 6.004%-11.454%, due 8/25/33-1/25/51 | 3.5% |
| GNMA, (zero coupon)-4.50%, due 7/20/44-2/16/66 | 3.1% |
| UMBS, 30 Year, 2.00%-5.50%, due 3/1/52-5/1/54 | 2.5% |
| Flagship Credit Auto Trust, 1.59%-6.30%, due 3/16/26-4/15/30 | 2.0% |
| FHLMC, (zero coupon)-9.304%, due 5/25/44-8/15/56 | 1.5% |
| Exeter Automobile Receivables Trust, 3.04%-10.45%, due 12/15/28-9/15/32 | 1.4% |
| Wells Fargo Commercial Mortgage Trust, 2.70%-5.122%, due 12/15/39-1/15/60 | 1.3% |
| CF Hippolyta Issuer LLC, 1.69%-2.60%, due 7/15/60-3/15/61 | 1.0% |
| * Excluding short-term investments |
Portfolio Composition
| Corporate Bonds | 28.8% |
| Mortgage-Backed Securities | 26.9% |
| U.S. Government & Federal Agencies | 25.3% |
| Asset-Backed Securities | 11.8% |
| Foreign Government Bonds | 4.1% |
| Loan Assignments | 2.0% |
| Short-Term Investments | 1.4% |
| Common Stocks | 0.0%‡ |
| Other Assets, Less Liabilities | (0.3)% |
| ‡ Less than one-tenth of a percent. |
Top Ten Holdings and/or Issuers*
| U.S. Treasury Notes, 3.75%-4.625%, due 4/30/27-2/15/35 | 22.3% |
| Connecticut Avenue Securities Trust, 6.053%-14.204%, due 9/25/31-1/25/45 | 3.9% |
| FHLMC STACR REMIC Trust, 6.004%-11.454%, due 8/25/33-1/25/51 | 3.5% |
| GNMA, (zero coupon)-4.50%, due 7/20/44-2/16/66 | 3.1% |
| UMBS, 30 Year, 2.00%-5.50%, due 3/1/52-5/1/54 | 2.5% |
| Flagship Credit Auto Trust, 1.59%-6.30%, due 3/16/26-4/15/30 | 2.0% |
| FHLMC, (zero coupon)-9.304%, due 5/25/44-8/15/56 | 1.5% |
| Exeter Automobile Receivables Trust, 3.04%-10.45%, due 12/15/28-9/15/32 | 1.4% |
| Wells Fargo Commercial Mortgage Trust, 2.70%-5.122%, due 12/15/39-1/15/60 | 1.3% |
| CF Hippolyta Issuer LLC, 1.69%-2.60%, due 7/15/60-3/15/61 | 1.0% |
| * Excluding short-term investments |
What were the Fund costs for the last six months?
(Based on a hypothetical $10,000 investment)
| Share Class Name | Costs of a $10,000 investment | Costs paid as a percentage of a $10,000 investment1,2 |
| Investor Class | $62 | 1.22% |
| 1. | Reflects fee waivers and/or expense reimbursements, without which expenses would have been higher. |
| 2. | Annualized. |
Fund Performance
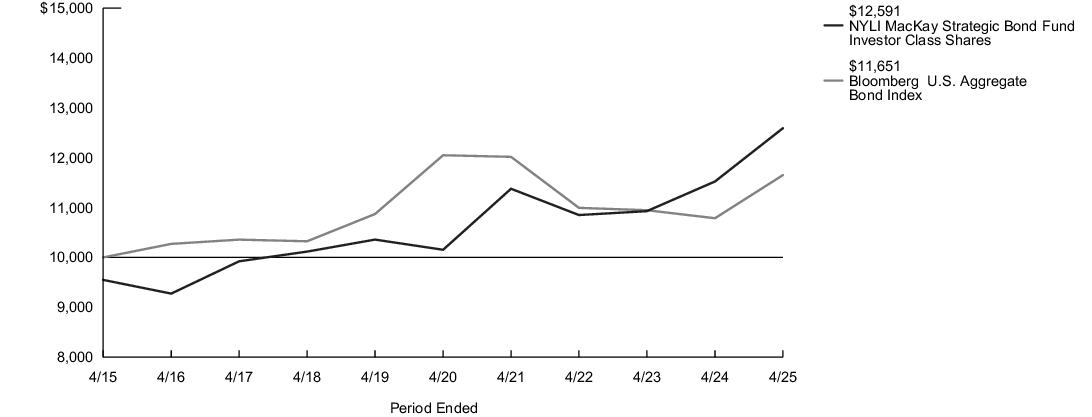
The following graph compares the initial and subsequent account values at the end of each of the most recently completed 10 semiannual reporting periods of the Fund (or for the life of the Fund, if shorter). It assumes a $10,000 initial investment at the beginning of the first fiscal period in an appropriate, broad-based securities market index and other additional indexes, if applicable, for the same period and reflects the deduction of all sales charges, where applicable.
| Average Annual Total Returns for the Period Ended April 30, 2025 | Inception Date |
Six Months1 |
One Year |
Five Years |
Ten Years |
| Investor Class Shares - Including sales charges | 2/28/2008 | (1.08)% | 4.90% | 3.44% | 2.33% |
| Investor Class Shares - Excluding sales charges | 3.04% | 9.27% | 4.40% | 2.80% | |
| Bloomberg U.S. Aggregate Bond Index2 | 2.57% | 8.02% | (0.67)% | 1.54% | |
| Morningstar Multisector Bond Category Average3 | 2.25% | 7.76% | 4.19% | 3.12% |
| 1. |
Not annualized. |
| 2. |
The Fund has selected the Bloomberg U.S. Aggregate Bond Index to represent a broad measure of market performance. The Bloomberg U.S. Aggregate Bond Index is a broad-based benchmark that measures the performance of the investment grade, U.S. dollar denominated, fixed-rate taxable bond market, including Treasuries, government-related and corporate securities, mortgage-backed securities (agency fixed-rate and hybrid adjustable rate mortgage pass-throughs), asset-backed securities and commercial mortgage-backed securities. |
| 3. |
The Morningstar Multisector Bond Category Average is representative of funds that seek income by diversifying their assets among several fixed-income sectors, usually U.S. government obligations, U.S. corporate bonds, foreign bonds, and high yield U.S. debt securities. These portfolios typically hold 35% to 65% of bond assets in securities that are not rated or are rated by a major agency such as Standard & Poor's or Moody's at the level of BB (considered speculative for taxable bonds) and below. Results are based on average total returns of similar funds with all dividends and capital gain distributions reinvested. |
Key Fund Statistics
| Fund's net assets | $995,196,754 |
| Total number of portfolio holdings | 548 |
| Portfolio turnover rate | 85% |
Graphical Representation of Holdings
The tables below show the investment makeup of the Fund; percentages indicated are based on the Fund's net assets.
Top Ten Holdings and/or Issuers*
| U.S. Treasury Notes, 3.75%-4.625%, due 4/30/27-2/15/35 | 22.3% |
| Connecticut Avenue Securities Trust, 6.053%-14.204%, due 9/25/31-1/25/45 | 3.9% |
| FHLMC STACR REMIC Trust, 6.004%-11.454%, due 8/25/33-1/25/51 | 3.5% |
| GNMA, (zero coupon)-4.50%, due 7/20/44-2/16/66 | 3.1% |
| UMBS, 30 Year, 2.00%-5.50%, due 3/1/52-5/1/54 | 2.5% |
| Flagship Credit Auto Trust, 1.59%-6.30%, due 3/16/26-4/15/30 | 2.0% |
| FHLMC, (zero coupon)-9.304%, due 5/25/44-8/15/56 | 1.5% |
| Exeter Automobile Receivables Trust, 3.04%-10.45%, due 12/15/28-9/15/32 | 1.4% |
| Wells Fargo Commercial Mortgage Trust, 2.70%-5.122%, due 12/15/39-1/15/60 | 1.3% |
| CF Hippolyta Issuer LLC, 1.69%-2.60%, due 7/15/60-3/15/61 | 1.0% |
| * Excluding short-term investments |
Portfolio Composition
| Corporate Bonds | 28.8% |
| Mortgage-Backed Securities | 26.9% |
| U.S. Government & Federal Agencies | 25.3% |
| Asset-Backed Securities | 11.8% |
| Foreign Government Bonds | 4.1% |
| Loan Assignments | 2.0% |
| Short-Term Investments | 1.4% |
| Common Stocks | 0.0%‡ |
| Other Assets, Less Liabilities | (0.3)% |
| ‡ Less than one-tenth of a percent. |
Top Ten Holdings and/or Issuers*
| U.S. Treasury Notes, 3.75%-4.625%, due 4/30/27-2/15/35 | 22.3% |
| Connecticut Avenue Securities Trust, 6.053%-14.204%, due 9/25/31-1/25/45 | 3.9% |
| FHLMC STACR REMIC Trust, 6.004%-11.454%, due 8/25/33-1/25/51 | 3.5% |
| GNMA, (zero coupon)-4.50%, due 7/20/44-2/16/66 | 3.1% |
| UMBS, 30 Year, 2.00%-5.50%, due 3/1/52-5/1/54 | 2.5% |
| Flagship Credit Auto Trust, 1.59%-6.30%, due 3/16/26-4/15/30 | 2.0% |
| FHLMC, (zero coupon)-9.304%, due 5/25/44-8/15/56 | 1.5% |
| Exeter Automobile Receivables Trust, 3.04%-10.45%, due 12/15/28-9/15/32 | 1.4% |
| Wells Fargo Commercial Mortgage Trust, 2.70%-5.122%, due 12/15/39-1/15/60 | 1.3% |
| CF Hippolyta Issuer LLC, 1.69%-2.60%, due 7/15/60-3/15/61 | 1.0% |
| * Excluding short-term investments |
What were the Fund costs for the last six months?
(Based on a hypothetical $10,000 investment)
| Share Class Name | Costs of a $10,000 investment | Costs paid as a percentage of a $10,000 investment1,2 |
| Class A | $43 | 0.85% |
| 1. | Reflects fee waivers and/or expense reimbursements, without which expenses would have been higher. |
| 2. | Annualized. |
Fund Performance
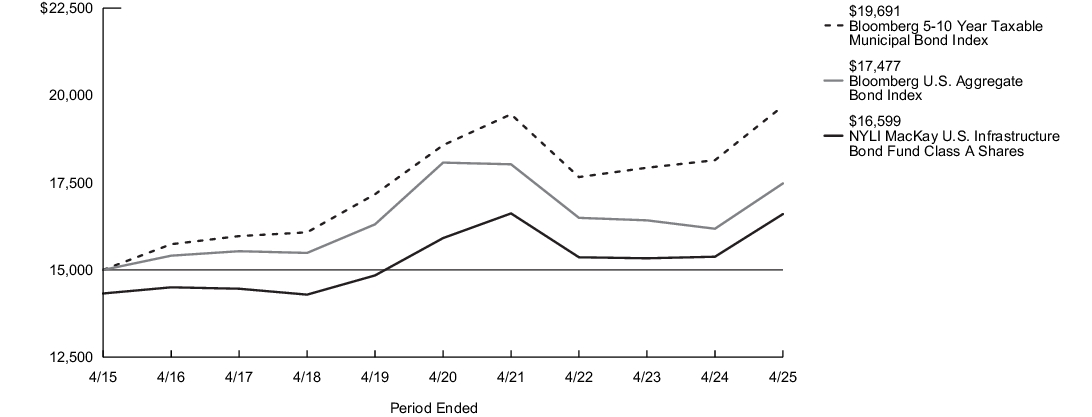
The following graph compares the initial and subsequent account values at the end of each of the most recently completed 10 semiannual reporting periods of the Fund (or for the life of the Fund, if shorter). It assumes a $15,000 initial investment at the beginning of the first fiscal period in an appropriate, broad-based securities market index and other additional indexes, if applicable, for the same period and reflects the deduction of all sales charges, where applicable.
| Average Annual Total Returns for the Period Ended April 30, 2025 | Inception Date |
Six Months1 |
One Year |
Five Years |
Ten Years |
| Class A Shares - Including sales charges | 1/3/1995 | (0.12)% | 4.70% | (0.08)% | 1.02% |
| Class A Shares - Excluding sales charges | 2.97% | 7.94% | 0.85% | 1.48% | |
| Bloomberg U.S. Aggregate Bond Index2 | 2.57% | 8.02% | (0.67)% | 1.54% | |
| Bloomberg 5-10 Year Taxable Municipal Bond Index3 | 3.44% | 8.53% | 1.18% | 2.76% | |
| Morningstar Intermediate Core Bond Category Average4 | 2.53% | 7.90% | (0.29)% | 1.48% |
| 1. |
Not annualized. |
| 2. |
The Fund has selected the Bloomberg U.S. Aggregate Bond Index to represent a broad measure of market performance. The Bloomberg U.S. Aggregate Bond Index is a broad-based benchmark that measures the performance of the investment grade, U.S. dollar-denominated, fixed-rate taxable bond market, including Treasuries, government-related and corporate securities, mortgage-backed securities (agency fixed-rate and hybrid adjustable rate mortgage pass-throughs), asset-backed securities, and commercial mortgage-backed securities. |
| 3. |
The Bloomberg 5-10 Year Taxable Municipal Bond Index, which is generally representative of the market sectors or types of investments in which the Fund invests, is the 5-10 year component of the Bloomberg Taxable Municipal Bond Index. |
| 4. |
The Morningstar Intermediate Core Bond Category Average is representative of funds that invest primarily in investment-grade U.S. fixed-income issues including government, corporate, and securitized debt, and hold less than 5% in below-investment-grade exposures. Their durations (a measure of interest-rate sensitivity) typically range between 75% and 125% of the three-year average of the effective duration of the Morningstar Core Bond Index. Results are based on average total returns of similar funds with all dividends and capital gain distributions reinvested. |
Key Fund Statistics
| Fund's net assets | $1,522,704,914 |
| Total number of portfolio holdings | 386 |
| Portfolio turnover rate | 45% |
Graphical Representation of Holdings
The tables below show the investment makeup of the Fund; percentages indicated are based on the Fund's net assets.
Top Ten Holdings and/or Issuers*
| State of Illinois, 3.45%-7.35%, due 6/15/29-12/1/38 | 3.5% |
| State of California, 4.875%-7.55%, due 9/1/29-10/1/41 | 3.1% |
| Commonwealth of Massachusetts, 2.663%-5.50%, due 7/15/29-9/1/39 | 2.8% |
| City of Los Angeles, 3.258%-5.50%, due 5/15/30-6/1/36 | 2.4% |
| New York City Transitional Finance Authority, 2.60%-5.65%, due 5/1/30-11/1/36 | 2.4% |
| State of Connecticut, 2.677%-5.099%, due 5/15/30-3/15/34 | 2.2% |
| District of Columbia, 5.153%-7.625%, due 5/1/31-10/1/35 | 2.0% |
| Alameda Corridor Transportation Authority, (zero coupon)-6.60%, due 10/1/29-10/1/33 | 1.9% |
| State of Hawaii, 1.718%-4.936%, due 10/1/30-10/1/38 | 1.9% |
| City of New York, 1.623%-5.75%, due 8/1/28-2/1/38 | 1.8% |
| * Excluding short-term investments |
Portfolio Composition
| Municipal Bonds | 91.2% |
| Corporate Bonds | 6.8% |
| Short-Term Investment | 4.5% |
| Closed-End Fund | 0.2% |
| U.S. Government & Federal Agencies | 0.0%‡ |
| Other Assets, Less Liabilities | (2.7)% |
| ‡ Less than one-tenth of a percent. |
Top Ten Holdings and/or Issuers*
| State of Illinois, 3.45%-7.35%, due 6/15/29-12/1/38 | 3.5% |
| State of California, 4.875%-7.55%, due 9/1/29-10/1/41 | 3.1% |
| Commonwealth of Massachusetts, 2.663%-5.50%, due 7/15/29-9/1/39 | 2.8% |
| City of Los Angeles, 3.258%-5.50%, due 5/15/30-6/1/36 | 2.4% |
| New York City Transitional Finance Authority, 2.60%-5.65%, due 5/1/30-11/1/36 | 2.4% |
| State of Connecticut, 2.677%-5.099%, due 5/15/30-3/15/34 | 2.2% |
| District of Columbia, 5.153%-7.625%, due 5/1/31-10/1/35 | 2.0% |
| Alameda Corridor Transportation Authority, (zero coupon)-6.60%, due 10/1/29-10/1/33 | 1.9% |
| State of Hawaii, 1.718%-4.936%, due 10/1/30-10/1/38 | 1.9% |
| City of New York, 1.623%-5.75%, due 8/1/28-2/1/38 | 1.8% |
| * Excluding short-term investments |
What were the Fund costs for the last six months?
(Based on a hypothetical $10,000 investment)
| Share Class Name | Costs of a $10,000 investment | Costs paid as a percentage of a $10,000 investment1,2 |
| Class C | $94 | 1.86% |
| 1. | Reflects fee waivers and/or expense reimbursements, without which expenses would have been higher. |
| 2. | Annualized. |
Fund Performance
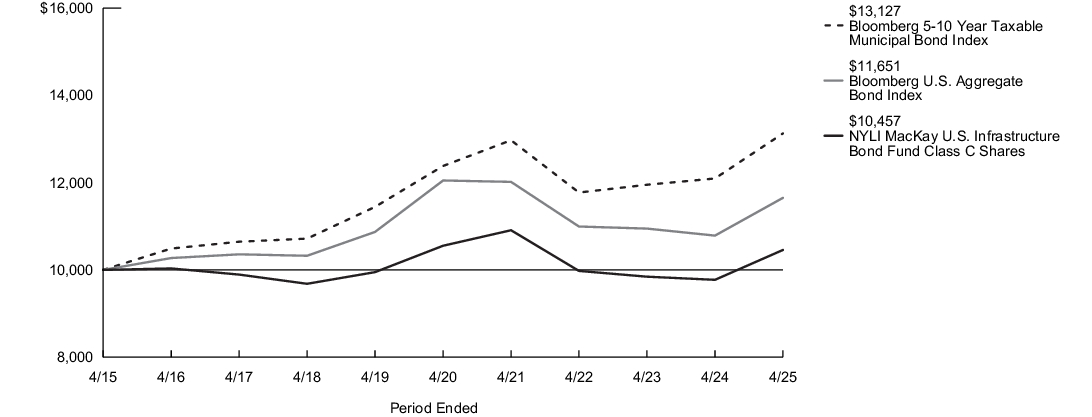
The following graph compares the initial and subsequent account values at the end of each of the most recently completed 10 semiannual reporting periods of the Fund (or for the life of the Fund, if shorter). It assumes a $10,000 initial investment at the beginning of the first fiscal period in an appropriate, broad-based securities market index and other additional indexes, if applicable, for the same period and reflects the deduction of all sales charges, where applicable.
| Average Annual Total Returns for the Period Ended April 30, 2025 | Inception Date |
Six Months1 |
One Year |
Five Years |
Ten Years |
| Class C Shares - Including sales charges | 9/1/1998 | 1.46% | 6.00% | (0.18)% | 0.45% |
| Class C Shares - Excluding sales charges | 2.46% | 7.00% | (0.18)% | 0.45% | |
| Bloomberg U.S. Aggregate Bond Index2 | 2.57% | 8.02% | (0.67)% | 1.54% | |
| Bloomberg 5-10 Year Taxable Municipal Bond Index3 | 3.44% | 8.53% | 1.18% | 2.76% | |
| Morningstar Intermediate Core Bond Category Average4 | 2.53% | 7.90% | (0.29)% | 1.48% |
| 1. |
Not annualized. |
| 2. |
The Fund has selected the Bloomberg U.S. Aggregate Bond Index to represent a broad measure of market performance. The Bloomberg U.S. Aggregate Bond Index is a broad-based benchmark that measures the performance of the investment grade, U.S. dollar-denominated, fixed-rate taxable bond market, including Treasuries, government-related and corporate securities, mortgage-backed securities (agency fixed-rate and hybrid adjustable rate mortgage pass-throughs), asset-backed securities, and commercial mortgage-backed securities. |
| 3. |
The Bloomberg 5-10 Year Taxable Municipal Bond Index, which is generally representative of the market sectors or types of investments in which the Fund invests, is the 5-10 year component of the Bloomberg Taxable Municipal Bond Index. |
| 4. |
The Morningstar Intermediate Core Bond Category Average is representative of funds that invest primarily in investment-grade U.S. fixed-income issues including government, corporate, and securitized debt, and hold less than 5% in below-investment-grade exposures. Their durations (a measure of interest-rate sensitivity) typically range between 75% and 125% of the three-year average of the effective duration of the Morningstar Core Bond Index. Results are based on average total returns of similar funds with all dividends and capital gain distributions reinvested. |
Key Fund Statistics
| Fund's net assets | $1,522,704,914 |
| Total number of portfolio holdings | 386 |
| Portfolio turnover rate | 45% |
Graphical Representation of Holdings
The tables below show the investment makeup of the Fund; percentages indicated are based on the Fund's net assets.
Top Ten Holdings and/or Issuers*
| State of Illinois, 3.45%-7.35%, due 6/15/29-12/1/38 | 3.5% |
| State of California, 4.875%-7.55%, due 9/1/29-10/1/41 | 3.1% |
| Commonwealth of Massachusetts, 2.663%-5.50%, due 7/15/29-9/1/39 | 2.8% |
| City of Los Angeles, 3.258%-5.50%, due 5/15/30-6/1/36 | 2.4% |
| New York City Transitional Finance Authority, 2.60%-5.65%, due 5/1/30-11/1/36 | 2.4% |
| State of Connecticut, 2.677%-5.099%, due 5/15/30-3/15/34 | 2.2% |
| District of Columbia, 5.153%-7.625%, due 5/1/31-10/1/35 | 2.0% |
| Alameda Corridor Transportation Authority, (zero coupon)-6.60%, due 10/1/29-10/1/33 | 1.9% |
| State of Hawaii, 1.718%-4.936%, due 10/1/30-10/1/38 | 1.9% |
| City of New York, 1.623%-5.75%, due 8/1/28-2/1/38 | 1.8% |
| * Excluding short-term investments |
Portfolio Composition
| Municipal Bonds | 91.2% |
| Corporate Bonds | 6.8% |
| Short-Term Investment | 4.5% |
| Closed-End Fund | 0.2% |
| U.S. Government & Federal Agencies | 0.0%‡ |
| Other Assets, Less Liabilities | (2.7)% |
| ‡ Less than one-tenth of a percent. |
Top Ten Holdings and/or Issuers*
| State of Illinois, 3.45%-7.35%, due 6/15/29-12/1/38 | 3.5% |
| State of California, 4.875%-7.55%, due 9/1/29-10/1/41 | 3.1% |
| Commonwealth of Massachusetts, 2.663%-5.50%, due 7/15/29-9/1/39 | 2.8% |
| City of Los Angeles, 3.258%-5.50%, due 5/15/30-6/1/36 | 2.4% |
| New York City Transitional Finance Authority, 2.60%-5.65%, due 5/1/30-11/1/36 | 2.4% |
| State of Connecticut, 2.677%-5.099%, due 5/15/30-3/15/34 | 2.2% |
| District of Columbia, 5.153%-7.625%, due 5/1/31-10/1/35 | 2.0% |
| Alameda Corridor Transportation Authority, (zero coupon)-6.60%, due 10/1/29-10/1/33 | 1.9% |
| State of Hawaii, 1.718%-4.936%, due 10/1/30-10/1/38 | 1.9% |
| City of New York, 1.623%-5.75%, due 8/1/28-2/1/38 | 1.8% |
| * Excluding short-term investments |
What were the Fund costs for the last six months?
(Based on a hypothetical $10,000 investment)
| Share Class Name | Costs of a $10,000 investment | Costs paid as a percentage of a $10,000 investment1,2 |
| Class I | $30 | 0.60% |
| 1. | Reflects fee waivers and/or expense reimbursements, without which expenses would have been higher. |
| 2. | Annualized. |
Fund Performance
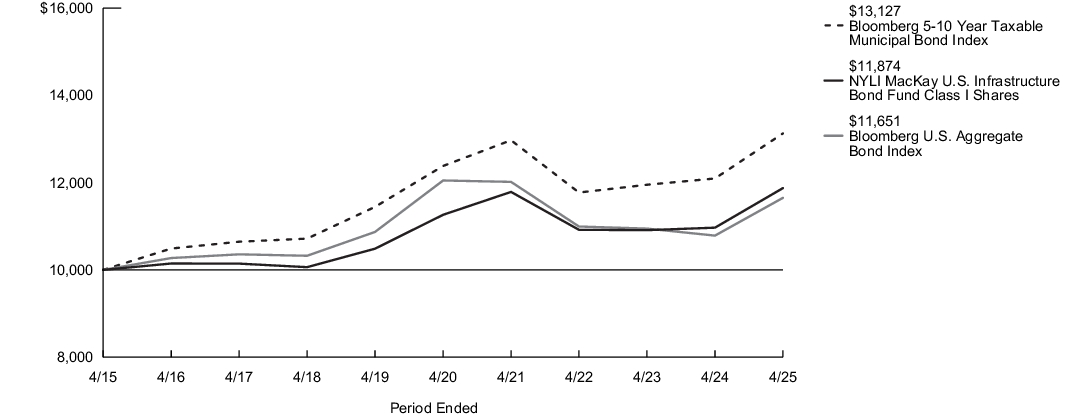
The following graph compares the initial and subsequent account values at the end of each of the most recently completed 10 semiannual reporting periods of the Fund (or for the life of the Fund, if shorter). It assumes a $10,000 initial investment at the beginning of the first fiscal period in an appropriate, broad-based securities market index and other additional indexes, if applicable, for the same period and reflects the deduction of all sales charges, where applicable.
| Average Annual Total Returns for the Period Ended April 30, 2025 | Inception Date |
Six Months1 |
One Year |
Five Years |
Ten Years |
| Class I Shares | 1/2/2004 | 3.06% | 8.26% | 1.06% | 1.73% |
| Bloomberg U.S. Aggregate Bond Index2 | 2.57% | 8.02% | (0.67)% | 1.54% | |
| Bloomberg 5-10 Year Taxable Municipal Bond Index3 | 3.44% | 8.53% | 1.18% | 2.76% | |
| Morningstar Intermediate Core Bond Category Average4 | 2.53% | 7.90% | (0.29)% | 1.48% |
| 1. |
Not annualized. |
| 2. |
The Fund has selected the Bloomberg U.S. Aggregate Bond Index to represent a broad measure of market performance. The Bloomberg U.S. Aggregate Bond Index is a broad-based benchmark that measures the performance of the investment grade, U.S. dollar-denominated, fixed-rate taxable bond market, including Treasuries, government-related and corporate securities, mortgage-backed securities (agency fixed-rate and hybrid adjustable rate mortgage pass-throughs), asset-backed securities, and commercial mortgage-backed securities. |
| 3. |
The Bloomberg 5-10 Year Taxable Municipal Bond Index, which is generally representative of the market sectors or types of investments in which the Fund invests, is the 5-10 year component of the Bloomberg Taxable Municipal Bond Index. |
| 4. |
The Morningstar Intermediate Core Bond Category Average is representative of funds that invest primarily in investment-grade U.S. fixed-income issues including government, corporate, and securitized debt, and hold less than 5% in below-investment-grade exposures. Their durations (a measure of interest-rate sensitivity) typically range between 75% and 125% of the three-year average of the effective duration of the Morningstar Core Bond Index. Results are based on average total returns of similar funds with all dividends and capital gain distributions reinvested. |
Key Fund Statistics
| Fund's net assets | $1,522,704,914 |
| Total number of portfolio holdings | 386 |
| Portfolio turnover rate | 45% |
Graphical Representation of Holdings
The tables below show the investment makeup of the Fund; percentages indicated are based on the Fund's net assets.
Top Ten Holdings and/or Issuers*
| State of Illinois, 3.45%-7.35%, due 6/15/29-12/1/38 | 3.5% |
| State of California, 4.875%-7.55%, due 9/1/29-10/1/41 | 3.1% |
| Commonwealth of Massachusetts, 2.663%-5.50%, due 7/15/29-9/1/39 | 2.8% |
| City of Los Angeles, 3.258%-5.50%, due 5/15/30-6/1/36 | 2.4% |
| New York City Transitional Finance Authority, 2.60%-5.65%, due 5/1/30-11/1/36 | 2.4% |
| State of Connecticut, 2.677%-5.099%, due 5/15/30-3/15/34 | 2.2% |
| District of Columbia, 5.153%-7.625%, due 5/1/31-10/1/35 | 2.0% |
| Alameda Corridor Transportation Authority, (zero coupon)-6.60%, due 10/1/29-10/1/33 | 1.9% |
| State of Hawaii, 1.718%-4.936%, due 10/1/30-10/1/38 | 1.9% |
| City of New York, 1.623%-5.75%, due 8/1/28-2/1/38 | 1.8% |
| * Excluding short-term investments |
Portfolio Composition
| Municipal Bonds | 91.2% |
| Corporate Bonds | 6.8% |
| Short-Term Investment | 4.5% |
| Closed-End Fund | 0.2% |
| U.S. Government & Federal Agencies | 0.0%‡ |
| Other Assets, Less Liabilities | (2.7)% |
| ‡ Less than one-tenth of a percent. |
Top Ten Holdings and/or Issuers*
| State of Illinois, 3.45%-7.35%, due 6/15/29-12/1/38 | 3.5% |
| State of California, 4.875%-7.55%, due 9/1/29-10/1/41 | 3.1% |
| Commonwealth of Massachusetts, 2.663%-5.50%, due 7/15/29-9/1/39 | 2.8% |
| City of Los Angeles, 3.258%-5.50%, due 5/15/30-6/1/36 | 2.4% |
| New York City Transitional Finance Authority, 2.60%-5.65%, due 5/1/30-11/1/36 | 2.4% |
| State of Connecticut, 2.677%-5.099%, due 5/15/30-3/15/34 | 2.2% |
| District of Columbia, 5.153%-7.625%, due 5/1/31-10/1/35 | 2.0% |
| Alameda Corridor Transportation Authority, (zero coupon)-6.60%, due 10/1/29-10/1/33 | 1.9% |
| State of Hawaii, 1.718%-4.936%, due 10/1/30-10/1/38 | 1.9% |
| City of New York, 1.623%-5.75%, due 8/1/28-2/1/38 | 1.8% |
| * Excluding short-term investments |
What were the Fund costs for the last six months?
(Based on a hypothetical $10,000 investment)
| Share Class Name | Costs of a $10,000 investment | Costs paid as a percentage of a $10,000 investment1 |
| Class R6 | $26 | 0.51% |
| 1. | Annualized. |
Fund Performance
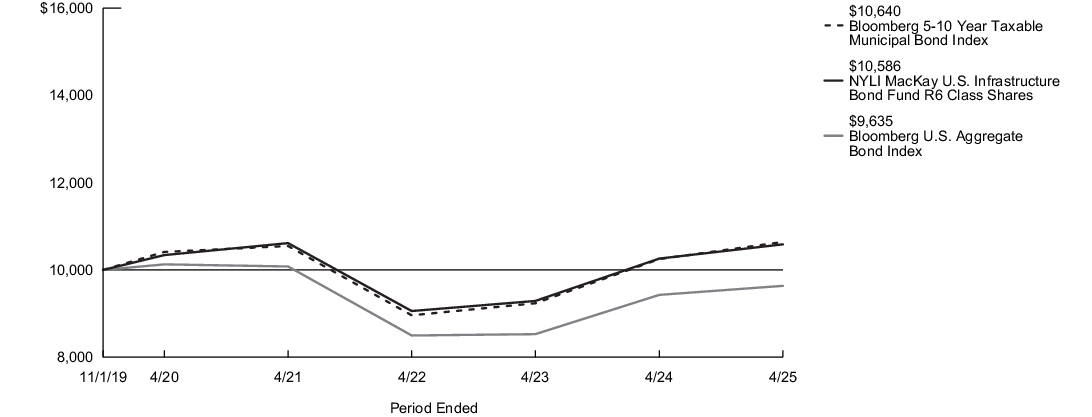
The following graph compares the initial and subsequent account values at the end of each of the most recently completed 10 semiannual reporting periods of the Fund (or for the life of the Fund, if shorter). It assumes a $10,000 initial investment at the beginning of the first fiscal period in an appropriate, broad-based securities market index and other additional indexes, if applicable, for the same period and reflects the deduction of all sales charges, where applicable.
| Average Annual Total Returns for the Period Ended April 30, 2025 | Inception Date |
Six Months1 |
One Year |
Five Years |
Since Inception |
| Class R6 Shares | 11/1/2019 | 3.11% | 8.34% | 1.13% | 1.11% |
| Bloomberg U.S. Aggregate Bond Index2 | 2.57% | 8.02% | (0.67)% | 0.25% | |
| Bloomberg 5-10 Year Taxable Municipal Bond Index3 | 3.44% | 8.53% | 1.18% | 1.53% | |
| Morningstar Intermediate Core Bond Category Average4 | 2.53% | 7.90% | (0.29)% | 0.23% |
| 1. |
Not annualized. |
| 2. |
The Fund has selected the Bloomberg U.S. Aggregate Bond Index to represent a broad measure of market performance. The Bloomberg U.S. Aggregate Bond Index is a broad-based benchmark that measures the performance of the investment grade, U.S. dollar-denominated, fixed-rate taxable bond market, including Treasuries, government-related and corporate securities, mortgage-backed securities (agency fixed-rate and hybrid adjustable rate mortgage pass-throughs), asset-backed securities, and commercial mortgage-backed securities. |
| 3. |
The Bloomberg 5-10 Year Taxable Municipal Bond Index, which is generally representative of the market sectors or types of investments in which the Fund invests, is the 5-10 year component of the Bloomberg Taxable Municipal Bond Index. |
| 4. |
The Morningstar Intermediate Core Bond Category Average is representative of funds that invest primarily in investment-grade U.S. fixed-income issues including government, corporate, and securitized debt, and hold less than 5% in below-investment-grade exposures. Their durations (a measure of interest-rate sensitivity) typically range between 75% and 125% of the three-year average of the effective duration of the Morningstar Core Bond Index. Results are based on average total returns of similar funds with all dividends and capital gain distributions reinvested. |
Key Fund Statistics
| Fund's net assets | $1,522,704,914 |
| Total number of portfolio holdings | 386 |
| Portfolio turnover rate | 45% |
Graphical Representation of Holdings
The tables below show the investment makeup of the Fund; percentages indicated are based on the Fund's net assets.
Top Ten Holdings and/or Issuers*
| State of Illinois, 3.45%-7.35%, due 6/15/29-12/1/38 | 3.5% |
| State of California, 4.875%-7.55%, due 9/1/29-10/1/41 | 3.1% |
| Commonwealth of Massachusetts, 2.663%-5.50%, due 7/15/29-9/1/39 | 2.8% |
| City of Los Angeles, 3.258%-5.50%, due 5/15/30-6/1/36 | 2.4% |
| New York City Transitional Finance Authority, 2.60%-5.65%, due 5/1/30-11/1/36 | 2.4% |
| State of Connecticut, 2.677%-5.099%, due 5/15/30-3/15/34 | 2.2% |
| District of Columbia, 5.153%-7.625%, due 5/1/31-10/1/35 | 2.0% |
| Alameda Corridor Transportation Authority, (zero coupon)-6.60%, due 10/1/29-10/1/33 | 1.9% |
| State of Hawaii, 1.718%-4.936%, due 10/1/30-10/1/38 | 1.9% |
| City of New York, 1.623%-5.75%, due 8/1/28-2/1/38 | 1.8% |
| * Excluding short-term investments |
Portfolio Composition
| Municipal Bonds | 91.2% |
| Corporate Bonds | 6.8% |
| Short-Term Investment | 4.5% |
| Closed-End Fund | 0.2% |
| U.S. Government & Federal Agencies | 0.0%‡ |
| Other Assets, Less Liabilities | (2.7)% |
| ‡ Less than one-tenth of a percent. |
Top Ten Holdings and/or Issuers*
| State of Illinois, 3.45%-7.35%, due 6/15/29-12/1/38 | 3.5% |
| State of California, 4.875%-7.55%, due 9/1/29-10/1/41 | 3.1% |
| Commonwealth of Massachusetts, 2.663%-5.50%, due 7/15/29-9/1/39 | 2.8% |
| City of Los Angeles, 3.258%-5.50%, due 5/15/30-6/1/36 | 2.4% |
| New York City Transitional Finance Authority, 2.60%-5.65%, due 5/1/30-11/1/36 | 2.4% |
| State of Connecticut, 2.677%-5.099%, due 5/15/30-3/15/34 | 2.2% |
| District of Columbia, 5.153%-7.625%, due 5/1/31-10/1/35 | 2.0% |
| Alameda Corridor Transportation Authority, (zero coupon)-6.60%, due 10/1/29-10/1/33 | 1.9% |
| State of Hawaii, 1.718%-4.936%, due 10/1/30-10/1/38 | 1.9% |
| City of New York, 1.623%-5.75%, due 8/1/28-2/1/38 | 1.8% |
| * Excluding short-term investments |
What were the Fund costs for the last six months?
(Based on a hypothetical $10,000 investment)
| Share Class Name | Costs of a $10,000 investment | Costs paid as a percentage of a $10,000 investment1,2 |
| Investor Class | $56 | 1.11% |
| 1. | Reflects fee waivers and/or expense reimbursements, without which expenses would have been higher. |
| 2. | Annualized. |
Fund Performance
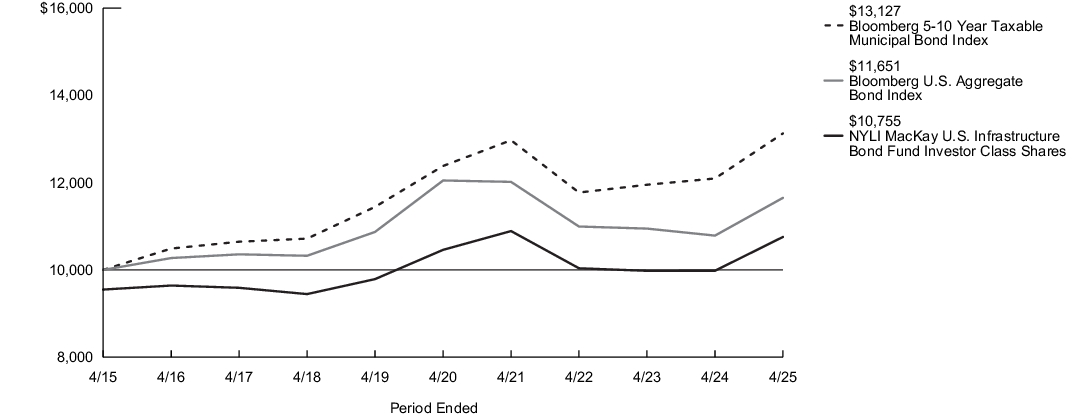
The following graph compares the initial and subsequent account values at the end of each of the most recently completed 10 semiannual reporting periods of the Fund (or for the life of the Fund, if shorter). It assumes a $10,000 initial investment at the beginning of the first fiscal period in an appropriate, broad-based securities market index and other additional indexes, if applicable, for the same period and reflects the deduction of all sales charges, where applicable.
| Average Annual Total Returns for the Period Ended April 30, 2025 | Inception Date |
Six Months1 |
One Year |
Five Years |
Ten Years |
| Investor Class Shares - Including sales charges | 2/28/2008 | 0.26% | 5.06% | (0.36)% | 0.73% |
| Investor Class Shares - Excluding sales charges | 2.83% | 7.75% | 0.56% | 1.20% | |
| Bloomberg U.S. Aggregate Bond Index2 | 2.57% | 8.02% | (0.67)% | 1.54% | |
| Bloomberg 5-10 Year Taxable Municipal Bond Index3 | 3.44% | 8.53% | 1.18% | 2.76% | |
| Morningstar Intermediate Core Bond Category Average4 | 2.53% | 7.90% | (0.29)% | 1.48% |
| 1. |
Not annualized. |
| 2. |
The Fund has selected the Bloomberg U.S. Aggregate Bond Index to represent a broad measure of market performance. The Bloomberg U.S. Aggregate Bond Index is a broad-based benchmark that measures the performance of the investment grade, U.S. dollar-denominated, fixed-rate taxable bond market, including Treasuries, government-related and corporate securities, mortgage-backed securities (agency fixed-rate and hybrid adjustable rate mortgage pass-throughs), asset-backed securities, and commercial mortgage-backed securities. |
| 3. |
The Bloomberg 5-10 Year Taxable Municipal Bond Index, which is generally representative of the market sectors or types of investments in which the Fund invests, is the 5-10 year component of the Bloomberg Taxable Municipal Bond Index. |
| 4. |
The Morningstar Intermediate Core Bond Category Average is representative of funds that invest primarily in investment-grade U.S. fixed-income issues including government, corporate, and securitized debt, and hold less than 5% in below-investment-grade exposures. Their durations (a measure of interest-rate sensitivity) typically range between 75% and 125% of the three-year average of the effective duration of the Morningstar Core Bond Index. Results are based on average total returns of similar funds with all dividends and capital gain distributions reinvested. |
Key Fund Statistics
| Fund's net assets | $1,522,704,914 |
| Total number of portfolio holdings | 386 |
| Portfolio turnover rate | 45% |
Graphical Representation of Holdings
The tables below show the investment makeup of the Fund; percentages indicated are based on the Fund's net assets.
Top Ten Holdings and/or Issuers*
| State of Illinois, 3.45%-7.35%, due 6/15/29-12/1/38 | 3.5% |
| State of California, 4.875%-7.55%, due 9/1/29-10/1/41 | 3.1% |
| Commonwealth of Massachusetts, 2.663%-5.50%, due 7/15/29-9/1/39 | 2.8% |
| City of Los Angeles, 3.258%-5.50%, due 5/15/30-6/1/36 | 2.4% |
| New York City Transitional Finance Authority, 2.60%-5.65%, due 5/1/30-11/1/36 | 2.4% |
| State of Connecticut, 2.677%-5.099%, due 5/15/30-3/15/34 | 2.2% |
| District of Columbia, 5.153%-7.625%, due 5/1/31-10/1/35 | 2.0% |
| Alameda Corridor Transportation Authority, (zero coupon)-6.60%, due 10/1/29-10/1/33 | 1.9% |
| State of Hawaii, 1.718%-4.936%, due 10/1/30-10/1/38 | 1.9% |
| City of New York, 1.623%-5.75%, due 8/1/28-2/1/38 | 1.8% |
| * Excluding short-term investments |
Portfolio Composition
| Municipal Bonds | 91.2% |
| Corporate Bonds | 6.8% |
| Short-Term Investment | 4.5% |
| Closed-End Fund | 0.2% |
| U.S. Government & Federal Agencies | 0.0%‡ |
| Other Assets, Less Liabilities | (2.7)% |
| ‡ Less than one-tenth of a percent. |
Top Ten Holdings and/or Issuers*
| State of Illinois, 3.45%-7.35%, due 6/15/29-12/1/38 | 3.5% |
| State of California, 4.875%-7.55%, due 9/1/29-10/1/41 | 3.1% |
| Commonwealth of Massachusetts, 2.663%-5.50%, due 7/15/29-9/1/39 | 2.8% |
| City of Los Angeles, 3.258%-5.50%, due 5/15/30-6/1/36 | 2.4% |
| New York City Transitional Finance Authority, 2.60%-5.65%, due 5/1/30-11/1/36 | 2.4% |
| State of Connecticut, 2.677%-5.099%, due 5/15/30-3/15/34 | 2.2% |
| District of Columbia, 5.153%-7.625%, due 5/1/31-10/1/35 | 2.0% |
| Alameda Corridor Transportation Authority, (zero coupon)-6.60%, due 10/1/29-10/1/33 | 1.9% |
| State of Hawaii, 1.718%-4.936%, due 10/1/30-10/1/38 | 1.9% |
| City of New York, 1.623%-5.75%, due 8/1/28-2/1/38 | 1.8% |
| * Excluding short-term investments |
What were the Fund costs for the last six months?
(Based on a hypothetical $10,000 investment)
| Share Class Name | Costs of a $10,000 investment | Costs paid as a percentage of a $10,000 investment1 |
| Class A | $49 | 0.98% |
| 1. | Annualized. |
Fund Performance
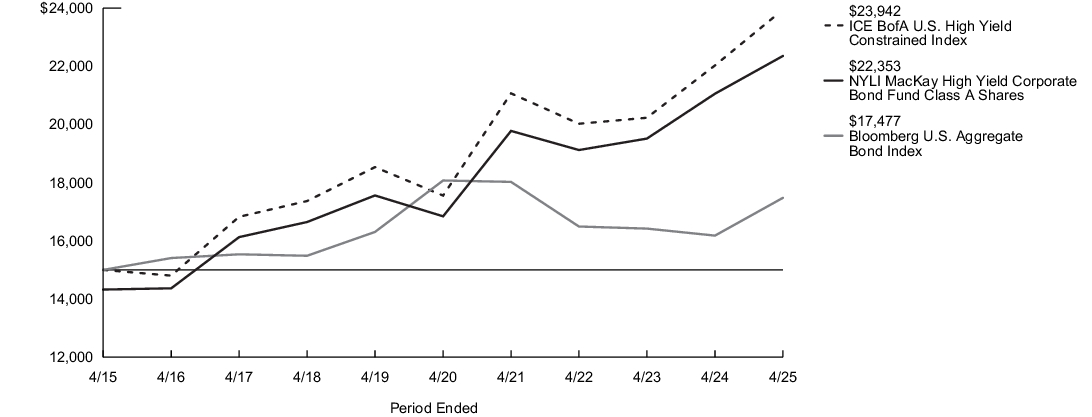
The following graph compares the initial and subsequent account values at the end of each of the most recently completed 10 semiannual reporting periods of the Fund (or for the life of the Fund, if shorter). It assumes a $15,000 initial investment at the beginning of the first fiscal period in an appropriate, broad-based securities market index and other additional indexes, if applicable, for the same period and reflects the deduction of all sales charges, where applicable.
| Average Annual Total Returns for the Period Ended April 30, 2025 | Inception Date |
Six Months1 |
One Year |
Five Years |
Ten Years |
| Class A Shares - Including sales charges | 1/3/1995 | (3.36)% | 1.38% | 4.86% | 4.07% |
| Class A Shares - Excluding sales charges | 1.20% | 6.16% | 5.83% | 4.55% | |
| Bloomberg U.S. Aggregate Bond Index2 | 2.57% | 8.02% | (0.67)% | 1.54% | |
| ICE BofA U.S. High Yield Constrained Index3 | 1.67% | 8.69% | 6.40% | 4.79% | |
| Morningstar High Yield Bond Category Average4 | 1.47% | 7.52% | 6.00% | 4.08% |
| 1. |
Not annualized. |
| 2. |
The Fund has selected the Bloomberg U.S. Aggregate Bond Index to represent a broad measure of market performance. The Bloomberg U.S. Aggregate Bond Index is a broad-based benchmark that measures the performance of the investment grade, U.S. dollar-denominated, fixed-rate taxable bond market, including Treasuries, government-related and corporate securities, mortgage-backed securities (agency fixed-rate and hybrid adjustable rate mortgage pass-throughs), asset-backed securities and commercial mortgage-backed securities. |
| 3. |
The ICE BofA U.S. High Yield Constrained Index, which is generally representative of the market sectors or types of investments in which the Fund invests, is a market value-weighted index of all domestic and Yankee high-yield bonds, including deferred interest bonds and payment-in-kind securities. Issuers included in the ICE BofA U.S. High Yield Constrained Index have maturities of one year or more and have a credit rating lower than BBB-/Baa3, but are not in default. No single issuer may constitute greater than 2% of the ICE BofA U.S. High Yield Constrained Index. |
| 4. |
The Morningstar High Yield Bond Category Average is representative of funds that concentrate on lower-quality bonds, which are riskier than those of higher-quality companies. These funds primarily invest in U.S. high-income debt securities where at least 65% or more of bond assets are not rated or are rated by a major agency such as Standard & Poor’s or Moody’s at the level of BB and below. Results are based on average total returns of similar funds with all dividends and capital gain distributions reinvested. |
Key Fund Statistics
| Fund's net assets | $11,114,470,812 |
| Total number of portfolio holdings | 633 |
| Portfolio turnover rate | 15% |
Graphical Representation of Holdings
The tables below show the investment makeup of the Fund; percentages indicated are based on the Fund's net assets.
Top Ten Holdings and/or Issuers*
| TransDigm, Inc., 4.625%-7.125%, due 11/15/27-1/15/33 | 2.3% |
| CCO Holdings LLC, 4.25%-5.375%, due 5/1/27-1/15/34 | 2.1% |
| Yum! Brands, Inc., 3.625%-5.375%, due 1/15/30-4/1/32 | 1.2% |
| Churchill Downs, Inc., 4.75%-6.75%, due 4/1/27-5/1/31 | 1.2% |
| Hilton Domestic Operating Co., Inc., 4.00%-5.875%, due 5/1/28-3/15/33 | 1.1% |
| Jane Street Group, 6.125%-7.125%, due 4/30/31-5/1/33 | 1.0% |
| LifePoint Health, Inc., 5.375%-11.00%, due 1/15/29-6/1/32 | 1.0% |
| Mineral Resources Ltd., 8.00%-9.25%, due 5/1/27-5/1/30 | 1.0% |
| 1011778 B.C. Unlimited Liability Co., 3.875%-6.125%, due 1/15/28-10/15/30 | 0.9% |
| Great Outdoors Group LLC, 7.572%, due 1/23/32 | 0.9% |
| * Excluding short-term investments |
Portfolio Composition
| Corporate Bonds | 85.2% |
| Loan Assignments | 7.7% |
| Common Stocks | 0.6% |
| Convertible Bonds | 0.5% |
| Exchange-Traded Funds | 0.4% |
| Preferred Stocks | 0.3% |
| Other Assets, Less Liabilities | 5.3% |
Top Ten Holdings and/or Issuers*
| TransDigm, Inc., 4.625%-7.125%, due 11/15/27-1/15/33 | 2.3% |
| CCO Holdings LLC, 4.25%-5.375%, due 5/1/27-1/15/34 | 2.1% |
| Yum! Brands, Inc., 3.625%-5.375%, due 1/15/30-4/1/32 | 1.2% |
| Churchill Downs, Inc., 4.75%-6.75%, due 4/1/27-5/1/31 | 1.2% |
| Hilton Domestic Operating Co., Inc., 4.00%-5.875%, due 5/1/28-3/15/33 | 1.1% |
| Jane Street Group, 6.125%-7.125%, due 4/30/31-5/1/33 | 1.0% |
| LifePoint Health, Inc., 5.375%-11.00%, due 1/15/29-6/1/32 | 1.0% |
| Mineral Resources Ltd., 8.00%-9.25%, due 5/1/27-5/1/30 | 1.0% |
| 1011778 B.C. Unlimited Liability Co., 3.875%-6.125%, due 1/15/28-10/15/30 | 0.9% |
| Great Outdoors Group LLC, 7.572%, due 1/23/32 | 0.9% |
| * Excluding short-term investments |
What were the Fund costs for the last six months?
(Based on a hypothetical $10,000 investment)
| Share Class Name | Costs of a $10,000 investment | Costs paid as a percentage of a $10,000 investment1 |
| Class C | $95 | 1.91% |
| 1. | Annualized. |
Fund Performance
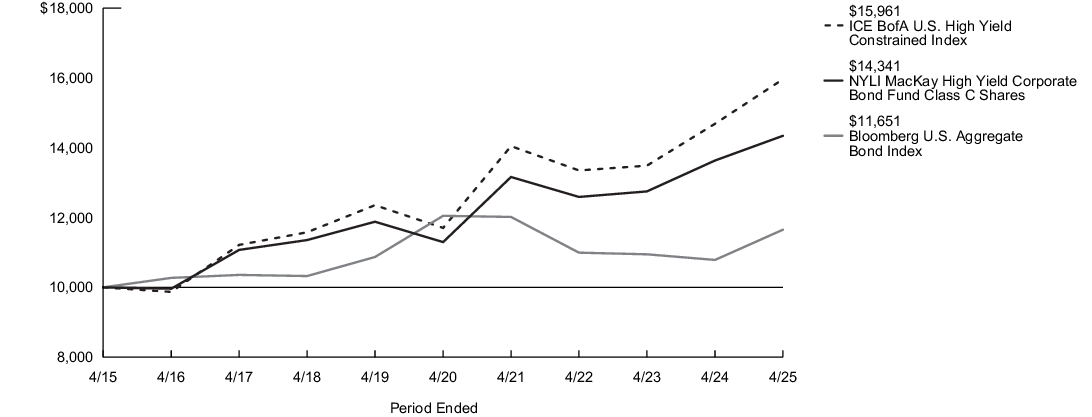
The following graph compares the initial and subsequent account values at the end of each of the most recently completed 10 semiannual reporting periods of the Fund (or for the life of the Fund, if shorter). It assumes a $10,000 initial investment at the beginning of the first fiscal period in an appropriate, broad-based securities market index and other additional indexes, if applicable, for the same period and reflects the deduction of all sales charges, where applicable.
| Average Annual Total Returns for the Period Ended April 30, 2025 | Inception Date |
Six Months1 |
One Year |
Five Years |
Ten Years |
| Class C Shares - Including sales charges | 9/1/1998 | (0.26)% | 4.19% | 4.89% | 3.67% |
| Class C Shares - Excluding sales charges | 0.73% | 5.19% | 4.89% | 3.67% | |
| Bloomberg U.S. Aggregate Bond Index2 | 2.57% | 8.02% | (0.67)% | 1.54% | |
| ICE BofA U.S. High Yield Constrained Index3 | 1.67% | 8.69% | 6.40% | 4.79% | |
| Morningstar High Yield Bond Category Average4 | 1.47% | 7.52% | 6.00% | 4.08% |
| 1. |
Not annualized. |
| 2. |
The Fund has selected the Bloomberg U.S. Aggregate Bond Index to represent a broad measure of market performance. The Bloomberg U.S. Aggregate Bond Index is a broad-based benchmark that measures the performance of the investment grade, U.S. dollar-denominated, fixed-rate taxable bond market, including Treasuries, government-related and corporate securities, mortgage-backed securities (agency fixed-rate and hybrid adjustable rate mortgage pass-throughs), asset-backed securities and commercial mortgage-backed securities. |
| 3. |
The ICE BofA U.S. High Yield Constrained Index, which is generally representative of the market sectors or types of investments in which the Fund invests, is a market value-weighted index of all domestic and Yankee high-yield bonds, including deferred interest bonds and payment-in-kind securities. Issuers included in the ICE BofA U.S. High Yield Constrained Index have maturities of one year or more and have a credit rating lower than BBB-/Baa3, but are not in default. No single issuer may constitute greater than 2% of the ICE BofA U.S. High Yield Constrained Index. |
| 4. |
The Morningstar High Yield Bond Category Average is representative of funds that concentrate on lower-quality bonds, which are riskier than those of higher-quality companies. These funds primarily invest in U.S. high-income debt securities where at least 65% or more of bond assets are not rated or are rated by a major agency such as Standard & Poor’s or Moody’s at the level of BB and below. Results are based on average total returns of similar funds with all dividends and capital gain distributions reinvested. |
Key Fund Statistics
| Fund's net assets | $11,114,470,812 |
| Total number of portfolio holdings | 633 |
| Portfolio turnover rate | 15% |
Graphical Representation of Holdings
The tables below show the investment makeup of the Fund; percentages indicated are based on the Fund's net assets.
Top Ten Holdings and/or Issuers*
| TransDigm, Inc., 4.625%-7.125%, due 11/15/27-1/15/33 | 2.3% |
| CCO Holdings LLC, 4.25%-5.375%, due 5/1/27-1/15/34 | 2.1% |
| Yum! Brands, Inc., 3.625%-5.375%, due 1/15/30-4/1/32 | 1.2% |
| Churchill Downs, Inc., 4.75%-6.75%, due 4/1/27-5/1/31 | 1.2% |
| Hilton Domestic Operating Co., Inc., 4.00%-5.875%, due 5/1/28-3/15/33 | 1.1% |
| Jane Street Group, 6.125%-7.125%, due 4/30/31-5/1/33 | 1.0% |
| LifePoint Health, Inc., 5.375%-11.00%, due 1/15/29-6/1/32 | 1.0% |
| Mineral Resources Ltd., 8.00%-9.25%, due 5/1/27-5/1/30 | 1.0% |
| 1011778 B.C. Unlimited Liability Co., 3.875%-6.125%, due 1/15/28-10/15/30 | 0.9% |
| Great Outdoors Group LLC, 7.572%, due 1/23/32 | 0.9% |
| * Excluding short-term investments |
Portfolio Composition
| Corporate Bonds | 85.2% |
| Loan Assignments | 7.7% |
| Common Stocks | 0.6% |
| Convertible Bonds | 0.5% |
| Exchange-Traded Funds | 0.4% |
| Preferred Stocks | 0.3% |
| Other Assets, Less Liabilities | 5.3% |
Top Ten Holdings and/or Issuers*
| TransDigm, Inc., 4.625%-7.125%, due 11/15/27-1/15/33 | 2.3% |
| CCO Holdings LLC, 4.25%-5.375%, due 5/1/27-1/15/34 | 2.1% |
| Yum! Brands, Inc., 3.625%-5.375%, due 1/15/30-4/1/32 | 1.2% |
| Churchill Downs, Inc., 4.75%-6.75%, due 4/1/27-5/1/31 | 1.2% |
| Hilton Domestic Operating Co., Inc., 4.00%-5.875%, due 5/1/28-3/15/33 | 1.1% |
| Jane Street Group, 6.125%-7.125%, due 4/30/31-5/1/33 | 1.0% |
| LifePoint Health, Inc., 5.375%-11.00%, due 1/15/29-6/1/32 | 1.0% |
| Mineral Resources Ltd., 8.00%-9.25%, due 5/1/27-5/1/30 | 1.0% |
| 1011778 B.C. Unlimited Liability Co., 3.875%-6.125%, due 1/15/28-10/15/30 | 0.9% |
| Great Outdoors Group LLC, 7.572%, due 1/23/32 | 0.9% |
| * Excluding short-term investments |
What were the Fund costs for the last six months?
(Based on a hypothetical $10,000 investment)
| Share Class Name | Costs of a $10,000 investment | Costs paid as a percentage of a $10,000 investment1 |
| Class I | $36 | 0.73% |
| 1. | Annualized. |
Fund Performance
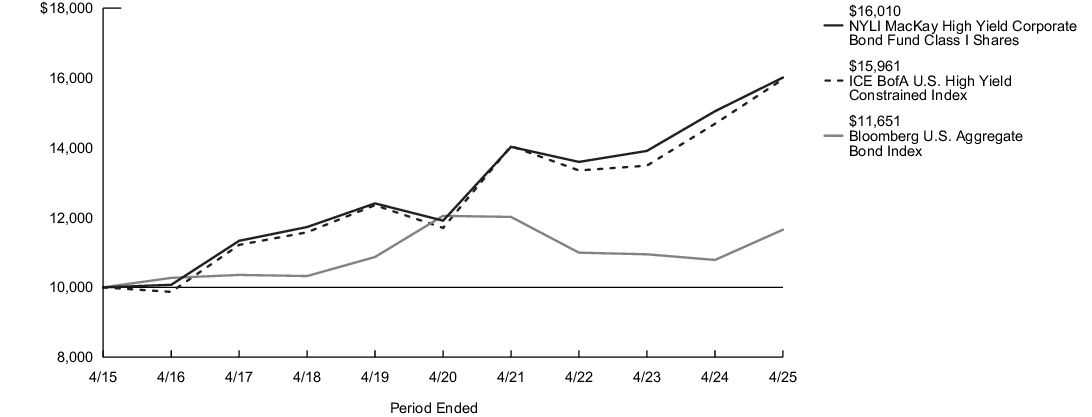
The following graph compares the initial and subsequent account values at the end of each of the most recently completed 10 semiannual reporting periods of the Fund (or for the life of the Fund, if shorter). It assumes a $10,000 initial investment at the beginning of the first fiscal period in an appropriate, broad-based securities market index and other additional indexes, if applicable, for the same period and reflects the deduction of all sales charges, where applicable.
| Average Annual Total Returns for the Period Ended April 30, 2025 | Inception Date |
Six Months1 |
One Year |
Five Years |
Ten Years |
| Class I Shares | 1/2/2004 | 1.32% | 6.42% | 6.09% | 4.82% |
| Bloomberg U.S. Aggregate Bond Index2 | 2.57% | 8.02% | (0.67)% | 1.54% | |
| ICE BofA U.S. High Yield Constrained Index3 | 1.67% | 8.69% | 6.40% | 4.79% | |
| Morningstar High Yield Bond Category Average4 | 1.47% | 7.52% | 6.00% | 4.08% |
| 1. |
Not annualized. |
| 2. |
The Fund has selected the Bloomberg U.S. Aggregate Bond Index to represent a broad measure of market performance. The Bloomberg U.S. Aggregate Bond Index is a broad-based benchmark that measures the performance of the investment grade, U.S. dollar-denominated, fixed-rate taxable bond market, including Treasuries, government-related and corporate securities, mortgage-backed securities (agency fixed-rate and hybrid adjustable rate mortgage pass-throughs), asset-backed securities and commercial mortgage-backed securities. |
| 3. |
The ICE BofA U.S. High Yield Constrained Index, which is generally representative of the market sectors or types of investments in which the Fund invests, is a market value-weighted index of all domestic and Yankee high-yield bonds, including deferred interest bonds and payment-in-kind securities. Issuers included in the ICE BofA U.S. High Yield Constrained Index have maturities of one year or more and have a credit rating lower than BBB-/Baa3, but are not in default. No single issuer may constitute greater than 2% of the ICE BofA U.S. High Yield Constrained Index. |
| 4. |
The Morningstar High Yield Bond Category Average is representative of funds that concentrate on lower-quality bonds, which are riskier than those of higher-quality companies. These funds primarily invest in U.S. high-income debt securities where at least 65% or more of bond assets are not rated or are rated by a major agency such as Standard & Poor’s or Moody’s at the level of BB and below. Results are based on average total returns of similar funds with all dividends and capital gain distributions reinvested. |
Key Fund Statistics
| Fund's net assets | $11,114,470,812 |
| Total number of portfolio holdings | 633 |
| Portfolio turnover rate | 15% |
Graphical Representation of Holdings
The tables below show the investment makeup of the Fund; percentages indicated are based on the Fund's net assets.
Top Ten Holdings and/or Issuers*
| TransDigm, Inc., 4.625%-7.125%, due 11/15/27-1/15/33 | 2.3% |
| CCO Holdings LLC, 4.25%-5.375%, due 5/1/27-1/15/34 | 2.1% |
| Yum! Brands, Inc., 3.625%-5.375%, due 1/15/30-4/1/32 | 1.2% |
| Churchill Downs, Inc., 4.75%-6.75%, due 4/1/27-5/1/31 | 1.2% |
| Hilton Domestic Operating Co., Inc., 4.00%-5.875%, due 5/1/28-3/15/33 | 1.1% |
| Jane Street Group, 6.125%-7.125%, due 4/30/31-5/1/33 | 1.0% |
| LifePoint Health, Inc., 5.375%-11.00%, due 1/15/29-6/1/32 | 1.0% |
| Mineral Resources Ltd., 8.00%-9.25%, due 5/1/27-5/1/30 | 1.0% |
| 1011778 B.C. Unlimited Liability Co., 3.875%-6.125%, due 1/15/28-10/15/30 | 0.9% |
| Great Outdoors Group LLC, 7.572%, due 1/23/32 | 0.9% |
| * Excluding short-term investments |
Portfolio Composition
| Corporate Bonds | 85.2% |
| Loan Assignments | 7.7% |
| Common Stocks | 0.6% |
| Convertible Bonds | 0.5% |
| Exchange-Traded Funds | 0.4% |
| Preferred Stocks | 0.3% |
| Other Assets, Less Liabilities | 5.3% |
Top Ten Holdings and/or Issuers*
| TransDigm, Inc., 4.625%-7.125%, due 11/15/27-1/15/33 | 2.3% |
| CCO Holdings LLC, 4.25%-5.375%, due 5/1/27-1/15/34 | 2.1% |
| Yum! Brands, Inc., 3.625%-5.375%, due 1/15/30-4/1/32 | 1.2% |
| Churchill Downs, Inc., 4.75%-6.75%, due 4/1/27-5/1/31 | 1.2% |
| Hilton Domestic Operating Co., Inc., 4.00%-5.875%, due 5/1/28-3/15/33 | 1.1% |
| Jane Street Group, 6.125%-7.125%, due 4/30/31-5/1/33 | 1.0% |
| LifePoint Health, Inc., 5.375%-11.00%, due 1/15/29-6/1/32 | 1.0% |
| Mineral Resources Ltd., 8.00%-9.25%, due 5/1/27-5/1/30 | 1.0% |
| 1011778 B.C. Unlimited Liability Co., 3.875%-6.125%, due 1/15/28-10/15/30 | 0.9% |
| Great Outdoors Group LLC, 7.572%, due 1/23/32 | 0.9% |
| * Excluding short-term investments |
What were the Fund costs for the last six months?
(Based on a hypothetical $10,000 investment)
| Share Class Name | Costs of a $10,000 investment | Costs paid as a percentage of a $10,000 investment1 |
| Class R2 | $54 | 1.08% |
| 1. | Annualized. |
Fund Performance
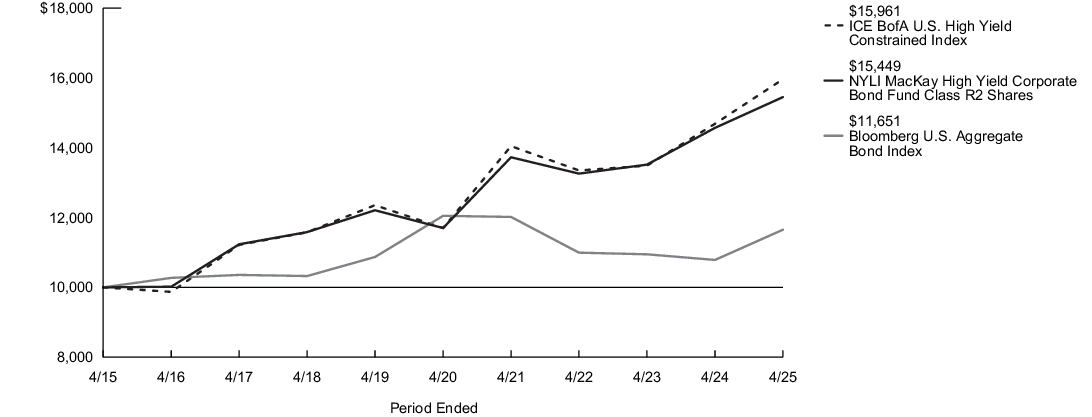
The following graph compares the initial and subsequent account values at the end of each of the most recently completed 10 semiannual reporting periods of the Fund (or for the life of the Fund, if shorter). It assumes a $10,000 initial investment at the beginning of the first fiscal period in an appropriate, broad-based securities market index and other additional indexes, if applicable, for the same period and reflects the deduction of all sales charges, where applicable.
| Average Annual Total Returns for the Period Ended April 30, 2025 | Inception Date |
Six Months1 |
One Year |
Five Years |
Ten Years |
| Class R2 Shares | 5/1/2008 | 1.14% | 6.05% | 5.72% | 4.45% |
| Bloomberg U.S. Aggregate Bond Index2 | 2.57% | 8.02% | (0.67)% | 1.54% | |
| ICE BofA U.S. High Yield Constrained Index3 | 1.67% | 8.69% | 6.40% | 4.79% | |
| Morningstar High Yield Bond Category Average4 | 1.47% | 7.52% | 6.00% | 4.08% |
| 1. |
Not annualized. |
| 2. |
The Fund has selected the Bloomberg U.S. Aggregate Bond Index to represent a broad measure of market performance. The Bloomberg U.S. Aggregate Bond Index is a broad-based benchmark that measures the performance of the investment grade, U.S. dollar-denominated, fixed-rate taxable bond market, including Treasuries, government-related and corporate securities, mortgage-backed securities (agency fixed-rate and hybrid adjustable rate mortgage pass-throughs), asset-backed securities and commercial mortgage-backed securities. |
| 3. |
The ICE BofA U.S. High Yield Constrained Index, which is generally representative of the market sectors or types of investments in which the Fund invests, is a market value-weighted index of all domestic and Yankee high-yield bonds, including deferred interest bonds and payment-in-kind securities. Issuers included in the ICE BofA U.S. High Yield Constrained Index have maturities of one year or more and have a credit rating lower than BBB-/Baa3, but are not in default. No single issuer may constitute greater than 2% of the ICE BofA U.S. High Yield Constrained Index. |
| 4. |
The Morningstar High Yield Bond Category Average is representative of funds that concentrate on lower-quality bonds, which are riskier than those of higher-quality companies. These funds primarily invest in U.S. high-income debt securities where at least 65% or more of bond assets are not rated or are rated by a major agency such as Standard & Poor’s or Moody’s at the level of BB and below. Results are based on average total returns of similar funds with all dividends and capital gain distributions reinvested. |
Key Fund Statistics
| Fund's net assets | $11,114,470,812 |
| Total number of portfolio holdings | 633 |
| Portfolio turnover rate | 15% |
Graphical Representation of Holdings
The tables below show the investment makeup of the Fund; percentages indicated are based on the Fund's net assets.
Top Ten Holdings and/or Issuers*
| TransDigm, Inc., 4.625%-7.125%, due 11/15/27-1/15/33 | 2.3% |
| CCO Holdings LLC, 4.25%-5.375%, due 5/1/27-1/15/34 | 2.1% |
| Yum! Brands, Inc., 3.625%-5.375%, due 1/15/30-4/1/32 | 1.2% |
| Churchill Downs, Inc., 4.75%-6.75%, due 4/1/27-5/1/31 | 1.2% |
| Hilton Domestic Operating Co., Inc., 4.00%-5.875%, due 5/1/28-3/15/33 | 1.1% |
| Jane Street Group, 6.125%-7.125%, due 4/30/31-5/1/33 | 1.0% |
| LifePoint Health, Inc., 5.375%-11.00%, due 1/15/29-6/1/32 | 1.0% |
| Mineral Resources Ltd., 8.00%-9.25%, due 5/1/27-5/1/30 | 1.0% |
| 1011778 B.C. Unlimited Liability Co., 3.875%-6.125%, due 1/15/28-10/15/30 | 0.9% |
| Great Outdoors Group LLC, 7.572%, due 1/23/32 | 0.9% |
| * Excluding short-term investments |
Portfolio Composition
| Corporate Bonds | 85.2% |
| Loan Assignments | 7.7% |
| Common Stocks | 0.6% |
| Convertible Bonds | 0.5% |
| Exchange-Traded Funds | 0.4% |
| Preferred Stocks | 0.3% |
| Other Assets, Less Liabilities | 5.3% |
Top Ten Holdings and/or Issuers*
| TransDigm, Inc., 4.625%-7.125%, due 11/15/27-1/15/33 | 2.3% |
| CCO Holdings LLC, 4.25%-5.375%, due 5/1/27-1/15/34 | 2.1% |
| Yum! Brands, Inc., 3.625%-5.375%, due 1/15/30-4/1/32 | 1.2% |
| Churchill Downs, Inc., 4.75%-6.75%, due 4/1/27-5/1/31 | 1.2% |
| Hilton Domestic Operating Co., Inc., 4.00%-5.875%, due 5/1/28-3/15/33 | 1.1% |
| Jane Street Group, 6.125%-7.125%, due 4/30/31-5/1/33 | 1.0% |
| LifePoint Health, Inc., 5.375%-11.00%, due 1/15/29-6/1/32 | 1.0% |
| Mineral Resources Ltd., 8.00%-9.25%, due 5/1/27-5/1/30 | 1.0% |
| 1011778 B.C. Unlimited Liability Co., 3.875%-6.125%, due 1/15/28-10/15/30 | 0.9% |
| Great Outdoors Group LLC, 7.572%, due 1/23/32 | 0.9% |
| * Excluding short-term investments |
What were the Fund costs for the last six months?
(Based on a hypothetical $10,000 investment)
| Share Class Name | Costs of a $10,000 investment | Costs paid as a percentage of a $10,000 investment1 |
| Class R3 | $66 | 1.33% |
| 1. | Annualized. |
Fund Performance
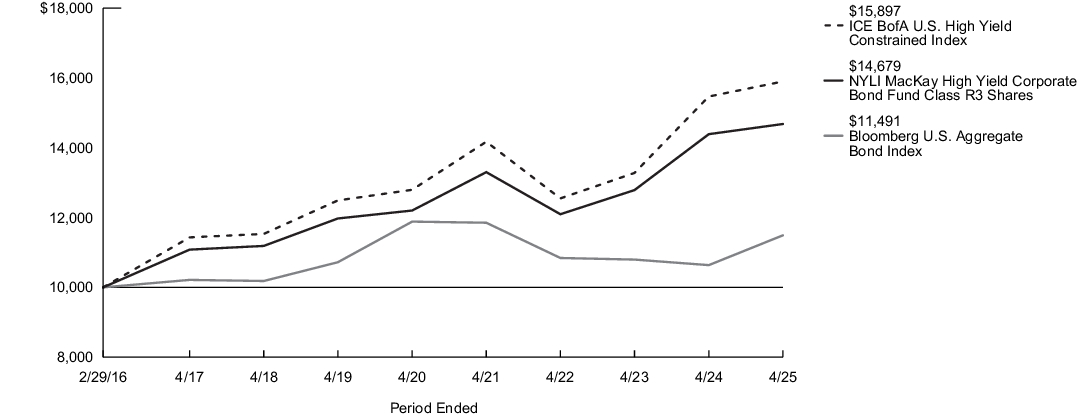
The following graph compares the initial and subsequent account values at the end of each of the most recently completed 10 semiannual reporting periods of the Fund (or for the life of the Fund, if shorter). It assumes a $10,000 initial investment at the beginning of the first fiscal period in an appropriate, broad-based securities market index and other additional indexes, if applicable, for the same period and reflects the deduction of all sales charges, where applicable.
| Average Annual Total Returns for the Period Ended April 30, 2025 | Inception Date |
Six Months1 |
One Year |
Five Years |
Since Inception |
| Class R3 Shares | 2/29/2016 | 1.02% | 5.80% | 5.42% | 5.37% |
| Bloomberg U.S. Aggregate Bond Index2 | 2.57% | 8.02% | (0.67)% | 1.53% | |
| ICE BofA U.S. High Yield Constrained Index3 | 1.67% | 8.69% | 6.40% | 6.34% | |
| Morningstar High Yield Bond Category Average4 | 1.47% | 7.52% | 6.00% | 5.19% |
| 1. |
Not annualized. |
| 2. |
The Fund has selected the Bloomberg U.S. Aggregate Bond Index to represent a broad measure of market performance. The Bloomberg U.S. Aggregate Bond Index is a broad-based benchmark that measures the performance of the investment grade, U.S. dollar-denominated, fixed-rate taxable bond market, including Treasuries, government-related and corporate securities, mortgage-backed securities (agency fixed-rate and hybrid adjustable rate mortgage pass-throughs), asset-backed securities and commercial mortgage-backed securities. |
| 3. |
The ICE BofA U.S. High Yield Constrained Index, which is generally representative of the market sectors or types of investments in which the Fund invests, is a market value-weighted index of all domestic and Yankee high-yield bonds, including deferred interest bonds and payment-in-kind securities. Issuers included in the ICE BofA U.S. High Yield Constrained Index have maturities of one year or more and have a credit rating lower than BBB-/Baa3, but are not in default. No single issuer may constitute greater than 2% of the ICE BofA U.S. High Yield Constrained Index. |
| 4. |
The Morningstar High Yield Bond Category Average is representative of funds that concentrate on lower-quality bonds, which are riskier than those of higher-quality companies. These funds primarily invest in U.S. high-income debt securities where at least 65% or more of bond assets are not rated or are rated by a major agency such as Standard & Poor’s or Moody’s at the level of BB and below. Results are based on average total returns of similar funds with all dividends and capital gain distributions reinvested. |
Key Fund Statistics
| Fund's net assets | $11,114,470,812 |
| Total number of portfolio holdings | 633 |
| Portfolio turnover rate | 15% |
Graphical Representation of Holdings
The tables below show the investment makeup of the Fund; percentages indicated are based on the Fund's net assets.
Top Ten Holdings and/or Issuers*
| TransDigm, Inc., 4.625%-7.125%, due 11/15/27-1/15/33 | 2.3% |
| CCO Holdings LLC, 4.25%-5.375%, due 5/1/27-1/15/34 | 2.1% |
| Yum! Brands, Inc., 3.625%-5.375%, due 1/15/30-4/1/32 | 1.2% |
| Churchill Downs, Inc., 4.75%-6.75%, due 4/1/27-5/1/31 | 1.2% |
| Hilton Domestic Operating Co., Inc., 4.00%-5.875%, due 5/1/28-3/15/33 | 1.1% |
| Jane Street Group, 6.125%-7.125%, due 4/30/31-5/1/33 | 1.0% |
| LifePoint Health, Inc., 5.375%-11.00%, due 1/15/29-6/1/32 | 1.0% |
| Mineral Resources Ltd., 8.00%-9.25%, due 5/1/27-5/1/30 | 1.0% |
| 1011778 B.C. Unlimited Liability Co., 3.875%-6.125%, due 1/15/28-10/15/30 | 0.9% |
| Great Outdoors Group LLC, 7.572%, due 1/23/32 | 0.9% |
| * Excluding short-term investments |
Portfolio Composition
| Corporate Bonds | 85.2% |
| Loan Assignments | 7.7% |
| Common Stocks | 0.6% |
| Convertible Bonds | 0.5% |
| Exchange-Traded Funds | 0.4% |
| Preferred Stocks | 0.3% |
| Other Assets, Less Liabilities | 5.3% |
Top Ten Holdings and/or Issuers*
| TransDigm, Inc., 4.625%-7.125%, due 11/15/27-1/15/33 | 2.3% |
| CCO Holdings LLC, 4.25%-5.375%, due 5/1/27-1/15/34 | 2.1% |
| Yum! Brands, Inc., 3.625%-5.375%, due 1/15/30-4/1/32 | 1.2% |
| Churchill Downs, Inc., 4.75%-6.75%, due 4/1/27-5/1/31 | 1.2% |
| Hilton Domestic Operating Co., Inc., 4.00%-5.875%, due 5/1/28-3/15/33 | 1.1% |
| Jane Street Group, 6.125%-7.125%, due 4/30/31-5/1/33 | 1.0% |
| LifePoint Health, Inc., 5.375%-11.00%, due 1/15/29-6/1/32 | 1.0% |
| Mineral Resources Ltd., 8.00%-9.25%, due 5/1/27-5/1/30 | 1.0% |
| 1011778 B.C. Unlimited Liability Co., 3.875%-6.125%, due 1/15/28-10/15/30 | 0.9% |
| Great Outdoors Group LLC, 7.572%, due 1/23/32 | 0.9% |
| * Excluding short-term investments |
What were the Fund costs for the last six months?
(Based on a hypothetical $10,000 investment)
| Share Class Name | Costs of a $10,000 investment | Costs paid as a percentage of a $10,000 investment1 |
| Class R6 | $28 | 0.56% |
| 1. | Annualized. |
Fund Performance
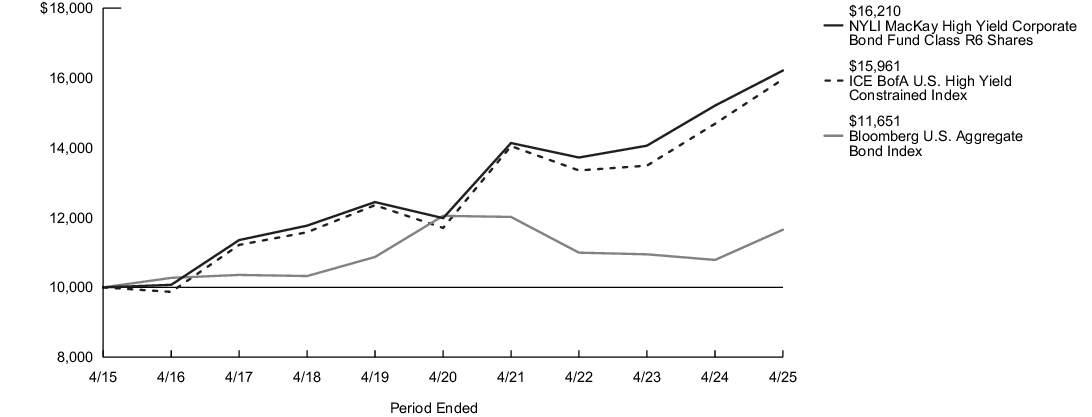
The following graph compares the initial and subsequent account values at the end of each of the most recently completed 10 semiannual reporting periods of the Fund (or for the life of the Fund, if shorter). It assumes a $10,000 initial investment at the beginning of the first fiscal period in an appropriate, broad-based securities market index and other additional indexes, if applicable, for the same period and reflects the deduction of all sales charges, where applicable.
| Average Annual Total Returns for the Period Ended April 30, 2025 | Inception Date |
Six Months1 |
One Year |
Five Years |
Ten Years |
| Class R6 Shares | 6/17/2013 | 1.40% | 6.61% | 6.23% | 4.95% |
| Bloomberg U.S. Aggregate Bond Index2 | 2.57% | 8.02% | (0.67)% | 1.54% | |
| ICE BofA U.S. High Yield Constrained Index3 | 1.67% | 8.69% | 6.40% | 4.79% | |
| Morningstar High Yield Bond Category Average4 | 1.47% | 7.52% | 6.00% | 4.08% |
| 1. |
Not annualized. |
| 2. |
The Fund has selected the Bloomberg U.S. Aggregate Bond Index to represent a broad measure of market performance. The Bloomberg U.S. Aggregate Bond Index is a broad-based benchmark that measures the performance of the investment grade, U.S. dollar-denominated, fixed-rate taxable bond market, including Treasuries, government-related and corporate securities, mortgage-backed securities (agency fixed-rate and hybrid adjustable rate mortgage pass-throughs), asset-backed securities and commercial mortgage-backed securities. |
| 3. |
The ICE BofA U.S. High Yield Constrained Index, which is generally representative of the market sectors or types of investments in which the Fund invests, is a market value-weighted index of all domestic and Yankee high-yield bonds, including deferred interest bonds and payment-in-kind securities. Issuers included in the ICE BofA U.S. High Yield Constrained Index have maturities of one year or more and have a credit rating lower than BBB-/Baa3, but are not in default. No single issuer may constitute greater than 2% of the ICE BofA U.S. High Yield Constrained Index. |
| 4. |
The Morningstar High Yield Bond Category Average is representative of funds that concentrate on lower-quality bonds, which are riskier than those of higher-quality companies. These funds primarily invest in U.S. high-income debt securities where at least 65% or more of bond assets are not rated or are rated by a major agency such as Standard & Poor’s or Moody’s at the level of BB and below. Results are based on average total returns of similar funds with all dividends and capital gain distributions reinvested. |
Key Fund Statistics
| Fund's net assets | $11,114,470,812 |
| Total number of portfolio holdings | 633 |
| Portfolio turnover rate | 15% |
Graphical Representation of Holdings
The tables below show the investment makeup of the Fund; percentages indicated are based on the Fund's net assets.
Top Ten Holdings and/or Issuers*
| TransDigm, Inc., 4.625%-7.125%, due 11/15/27-1/15/33 | 2.3% |
| CCO Holdings LLC, 4.25%-5.375%, due 5/1/27-1/15/34 | 2.1% |
| Yum! Brands, Inc., 3.625%-5.375%, due 1/15/30-4/1/32 | 1.2% |
| Churchill Downs, Inc., 4.75%-6.75%, due 4/1/27-5/1/31 | 1.2% |
| Hilton Domestic Operating Co., Inc., 4.00%-5.875%, due 5/1/28-3/15/33 | 1.1% |
| Jane Street Group, 6.125%-7.125%, due 4/30/31-5/1/33 | 1.0% |
| LifePoint Health, Inc., 5.375%-11.00%, due 1/15/29-6/1/32 | 1.0% |
| Mineral Resources Ltd., 8.00%-9.25%, due 5/1/27-5/1/30 | 1.0% |
| 1011778 B.C. Unlimited Liability Co., 3.875%-6.125%, due 1/15/28-10/15/30 | 0.9% |
| Great Outdoors Group LLC, 7.572%, due 1/23/32 | 0.9% |
| * Excluding short-term investments |
Portfolio Composition
| Corporate Bonds | 85.2% |
| Loan Assignments | 7.7% |
| Common Stocks | 0.6% |
| Convertible Bonds | 0.5% |
| Exchange-Traded Funds | 0.4% |
| Preferred Stocks | 0.3% |
| Other Assets, Less Liabilities | 5.3% |
Top Ten Holdings and/or Issuers*
| TransDigm, Inc., 4.625%-7.125%, due 11/15/27-1/15/33 | 2.3% |
| CCO Holdings LLC, 4.25%-5.375%, due 5/1/27-1/15/34 | 2.1% |
| Yum! Brands, Inc., 3.625%-5.375%, due 1/15/30-4/1/32 | 1.2% |
| Churchill Downs, Inc., 4.75%-6.75%, due 4/1/27-5/1/31 | 1.2% |
| Hilton Domestic Operating Co., Inc., 4.00%-5.875%, due 5/1/28-3/15/33 | 1.1% |
| Jane Street Group, 6.125%-7.125%, due 4/30/31-5/1/33 | 1.0% |
| LifePoint Health, Inc., 5.375%-11.00%, due 1/15/29-6/1/32 | 1.0% |
| Mineral Resources Ltd., 8.00%-9.25%, due 5/1/27-5/1/30 | 1.0% |
| 1011778 B.C. Unlimited Liability Co., 3.875%-6.125%, due 1/15/28-10/15/30 | 0.9% |
| Great Outdoors Group LLC, 7.572%, due 1/23/32 | 0.9% |
| * Excluding short-term investments |
What were the Fund costs for the last six months?
(Based on a hypothetical $10,000 investment)
| Share Class Name | Costs of a $10,000 investment | Costs paid as a percentage of a $10,000 investment1 |
| Investor Class | $58 | 1.16% |
| 1. | Annualized. |
Fund Performance
The following graph compares the initial and subsequent account values at the end of each of the most recently completed 10 semiannual reporting periods of the Fund (or for the life of the Fund, if shorter). It assumes a $10,000 initial investment at the beginning of the first fiscal period in an appropriate, broad-based securities market index and other additional indexes, if applicable, for the same period and reflects the deduction of all sales charges, where applicable.
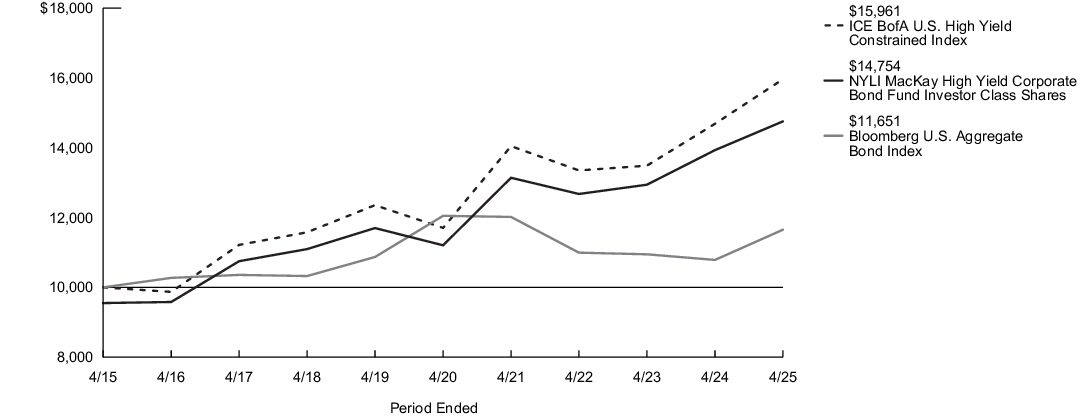
| Average Annual Total Returns for the Period Ended April 30, 2025 | Inception Date |
Six Months1 |
One Year |
Five Years |
Ten Years |
| Investor Class Shares - Including sales charges | 2/28/2008 | (2.95)% | 1.68% | 4.69% | 3.97% |
| Investor Class Shares - Excluding sales charges | 1.09% | 5.91% | 5.66% | 4.45% | |
| Bloomberg U.S. Aggregate Bond Index2 | 2.57% | 8.02% | (0.67)% | 1.54% | |
| ICE BofA U.S. High Yield Constrained Index3 | 1.67% | 8.69% | 6.40% | 4.79% | |
| Morningstar High Yield Bond Category Average4 | 1.47% | 7.52% | 6.00% | 4.08% |
| 1. |
Not annualized. |
| 2. |
The Fund has selected the Bloomberg U.S. Aggregate Bond Index to represent a broad measure of market performance. The Bloomberg U.S. Aggregate Bond Index is a broad-based benchmark that measures the performance of the investment grade, U.S. dollar-denominated, fixed-rate taxable bond market, including Treasuries, government-related and corporate securities, mortgage-backed securities (agency fixed-rate and hybrid adjustable rate mortgage pass-throughs), asset-backed securities and commercial mortgage-backed securities. |
| 3. |
The ICE BofA U.S. High Yield Constrained Index, which is generally representative of the market sectors or types of investments in which the Fund invests, is a market value-weighted index of all domestic and Yankee high-yield bonds, including deferred interest bonds and payment-in-kind securities. Issuers included in the ICE BofA U.S. High Yield Constrained Index have maturities of one year or more and have a credit rating lower than BBB-/Baa3, but are not in default. No single issuer may constitute greater than 2% of the ICE BofA U.S. High Yield Constrained Index. |
| 4. |
The Morningstar High Yield Bond Category Average is representative of funds that concentrate on lower-quality bonds, which are riskier than those of higher-quality companies. These funds primarily invest in U.S. high-income debt securities where at least 65% or more of bond assets are not rated or are rated by a major agency such as Standard & Poor’s or Moody’s at the level of BB and below. Results are based on average total returns of similar funds with all dividends and capital gain distributions reinvested. |
Key Fund Statistics
| Fund's net assets | $11,114,470,812 |
| Total number of portfolio holdings | 633 |
| Portfolio turnover rate | 15% |
Graphical Representation of Holdings
The tables below show the investment makeup of the Fund; percentages indicated are based on the Fund's net assets.
Top Ten Holdings and/or Issuers*
| TransDigm, Inc., 4.625%-7.125%, due 11/15/27-1/15/33 | 2.3% |
| CCO Holdings LLC, 4.25%-5.375%, due 5/1/27-1/15/34 | 2.1% |
| Yum! Brands, Inc., 3.625%-5.375%, due 1/15/30-4/1/32 | 1.2% |
| Churchill Downs, Inc., 4.75%-6.75%, due 4/1/27-5/1/31 | 1.2% |
| Hilton Domestic Operating Co., Inc., 4.00%-5.875%, due 5/1/28-3/15/33 | 1.1% |
| Jane Street Group, 6.125%-7.125%, due 4/30/31-5/1/33 | 1.0% |
| LifePoint Health, Inc., 5.375%-11.00%, due 1/15/29-6/1/32 | 1.0% |
| Mineral Resources Ltd., 8.00%-9.25%, due 5/1/27-5/1/30 | 1.0% |
| 1011778 B.C. Unlimited Liability Co., 3.875%-6.125%, due 1/15/28-10/15/30 | 0.9% |
| Great Outdoors Group LLC, 7.572%, due 1/23/32 | 0.9% |
| * Excluding short-term investments |
Portfolio Composition
| Corporate Bonds | 85.2% |
| Loan Assignments | 7.7% |
| Common Stocks | 0.6% |
| Convertible Bonds | 0.5% |
| Exchange-Traded Funds | 0.4% |
| Preferred Stocks | 0.3% |
| Other Assets, Less Liabilities | 5.3% |
Top Ten Holdings and/or Issuers*
| TransDigm, Inc., 4.625%-7.125%, due 11/15/27-1/15/33 | 2.3% |
| CCO Holdings LLC, 4.25%-5.375%, due 5/1/27-1/15/34 | 2.1% |
| Yum! Brands, Inc., 3.625%-5.375%, due 1/15/30-4/1/32 | 1.2% |
| Churchill Downs, Inc., 4.75%-6.75%, due 4/1/27-5/1/31 | 1.2% |
| Hilton Domestic Operating Co., Inc., 4.00%-5.875%, due 5/1/28-3/15/33 | 1.1% |
| Jane Street Group, 6.125%-7.125%, due 4/30/31-5/1/33 | 1.0% |
| LifePoint Health, Inc., 5.375%-11.00%, due 1/15/29-6/1/32 | 1.0% |
| Mineral Resources Ltd., 8.00%-9.25%, due 5/1/27-5/1/30 | 1.0% |
| 1011778 B.C. Unlimited Liability Co., 3.875%-6.125%, due 1/15/28-10/15/30 | 0.9% |
| Great Outdoors Group LLC, 7.572%, due 1/23/32 | 0.9% |
| * Excluding short-term investments |
What were the Fund costs for the last six months?
(Based on a hypothetical $10,000 investment)
| Share Class Name | Costs of a $10,000 investment | Costs paid as a percentage of a $10,000 investment1 |
| SIMPLE Class | $59 | 1.18% |
| 1. | Annualized. |
Fund Performance
The following graph compares the initial and subsequent account values at the end of each of the most recently completed 10 semiannual reporting periods of the Fund (or for the life of the Fund, if shorter). It assumes a $10,000 initial investment at the beginning of the first fiscal period in an appropriate, broad-based securities market index and other additional indexes, if applicable, for the same period and reflects the deduction of all sales charges, where applicable.
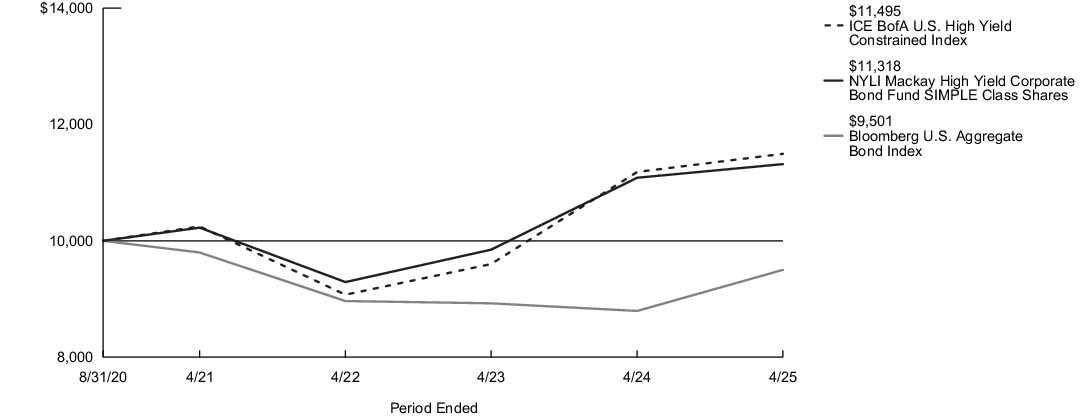
| Average Annual Total Returns for the Period Ended April 30, 2025 | Inception Date |
Six Months1 |
One Year |
Since Inception |
| SIMPLE Class Shares | 8/31/2020 | 1.07% | 5.85% | 3.71% |
| Bloomberg U.S. Aggregate Bond Index2 | 2.57% | 8.02% | (1.09)% | |
| ICE BofA U.S. High Yield Constrained Index3 | 1.67% | 8.69% | 4.38% | |
| Morningstar High Yield Bond Category Average4 | 1.47% | 7.52% | 3.88% |
| 1. |
Not annualized. |
| 2. |
The Fund has selected the Bloomberg U.S. Aggregate Bond Index to represent a broad measure of market performance. The Bloomberg U.S. Aggregate Bond Index is a broad-based benchmark that measures the performance of the investment grade, U.S. dollar-denominated, fixed-rate taxable bond market, including Treasuries, government-related and corporate securities, mortgage-backed securities (agency fixed-rate and hybrid adjustable rate mortgage pass-throughs), asset-backed securities and commercial mortgage-backed securities. |
| 3. |
The ICE BofA U.S. High Yield Constrained Index, which is generally representative of the market sectors or types of investments in which the Fund invests, is a market value-weighted index of all domestic and Yankee high-yield bonds, including deferred interest bonds and payment-in-kind securities. Issuers included in the ICE BofA U.S. High Yield Constrained Index have maturities of one year or more and have a credit rating lower than BBB-/Baa3, but are not in default. No single issuer may constitute greater than 2% of the ICE BofA U.S. High Yield Constrained Index. |
| 4. |
The Morningstar High Yield Bond Category Average is representative of funds that concentrate on lower-quality bonds, which are riskier than those of higher-quality companies. These funds primarily invest in U.S. high-income debt securities where at least 65% or more of bond assets are not rated or are rated by a major agency such as Standard & Poor’s or Moody’s at the level of BB and below. Results are based on average total returns of similar funds with all dividends and capital gain distributions reinvested. |
Key Fund Statistics
| Fund's net assets | $11,114,470,812 |
| Total number of portfolio holdings | 633 |
| Portfolio turnover rate | 15% |
Graphical Representation of Holdings
The tables below show the investment makeup of the Fund; percentages indicated are based on the Fund's net assets.
Top Ten Holdings and/or Issuers*
| TransDigm, Inc., 4.625%-7.125%, due 11/15/27-1/15/33 | 2.3% |
| CCO Holdings LLC, 4.25%-5.375%, due 5/1/27-1/15/34 | 2.1% |
| Yum! Brands, Inc., 3.625%-5.375%, due 1/15/30-4/1/32 | 1.2% |
| Churchill Downs, Inc., 4.75%-6.75%, due 4/1/27-5/1/31 | 1.2% |
| Hilton Domestic Operating Co., Inc., 4.00%-5.875%, due 5/1/28-3/15/33 | 1.1% |
| Jane Street Group, 6.125%-7.125%, due 4/30/31-5/1/33 | 1.0% |
| LifePoint Health, Inc., 5.375%-11.00%, due 1/15/29-6/1/32 | 1.0% |
| Mineral Resources Ltd., 8.00%-9.25%, due 5/1/27-5/1/30 | 1.0% |
| 1011778 B.C. Unlimited Liability Co., 3.875%-6.125%, due 1/15/28-10/15/30 | 0.9% |
| Great Outdoors Group LLC, 7.572%, due 1/23/32 | 0.9% |
| * Excluding short-term investments |
Portfolio Composition
| Corporate Bonds | 85.2% |
| Loan Assignments | 7.7% |
| Common Stocks | 0.6% |
| Convertible Bonds | 0.5% |
| Exchange-Traded Funds | 0.4% |
| Preferred Stocks | 0.3% |
| Other Assets, Less Liabilities | 5.3% |
Top Ten Holdings and/or Issuers*
| TransDigm, Inc., 4.625%-7.125%, due 11/15/27-1/15/33 | 2.3% |
| CCO Holdings LLC, 4.25%-5.375%, due 5/1/27-1/15/34 | 2.1% |
| Yum! Brands, Inc., 3.625%-5.375%, due 1/15/30-4/1/32 | 1.2% |
| Churchill Downs, Inc., 4.75%-6.75%, due 4/1/27-5/1/31 | 1.2% |
| Hilton Domestic Operating Co., Inc., 4.00%-5.875%, due 5/1/28-3/15/33 | 1.1% |
| Jane Street Group, 6.125%-7.125%, due 4/30/31-5/1/33 | 1.0% |
| LifePoint Health, Inc., 5.375%-11.00%, due 1/15/29-6/1/32 | 1.0% |
| Mineral Resources Ltd., 8.00%-9.25%, due 5/1/27-5/1/30 | 1.0% |
| 1011778 B.C. Unlimited Liability Co., 3.875%-6.125%, due 1/15/28-10/15/30 | 0.9% |
| Great Outdoors Group LLC, 7.572%, due 1/23/32 | 0.9% |
| * Excluding short-term investments |
What were the Fund costs for the last six months?
(Based on a hypothetical $10,000 investment)
| Share Class Name | Costs of a $10,000 investment | Costs paid as a percentage of a $10,000 investment1 |
| Class A | $26 | 0.51% |
| 1. | Annualized. |
Fund Performance
The following graph compares the initial and subsequent account values at the end of each of the most recently completed 10 semiannual reporting periods of the Fund (or for the life of the Fund, if shorter). It assumes a $15,000 initial investment at the beginning of the first fiscal period in an equally weighted performance average of money market funds and other additional indexes, if applicable, for the same period and reflects the deduction of all sales charges, where applicable.
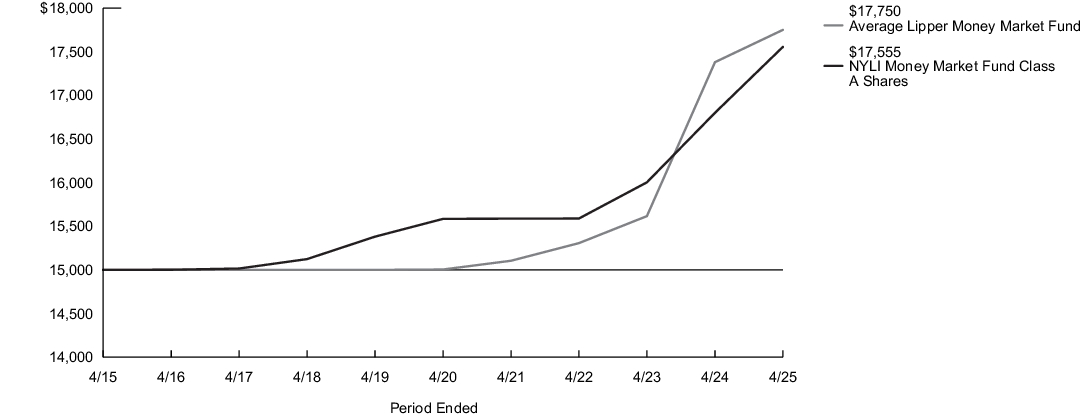
| Average Annual Total Returns for the Period Ended April 30, 2025 | Inception Date |
Six Months1 |
One Year |
Five Years |
Ten Years |
| Class A Shares | 1/3/1995 | 2.00% | 4.49% | 2.41% | 1.59% |
| Average Lipper Money Market Fund2 | 2.05% | 4.57% | 2.48% | 1.70% |
| 1. |
Not annualized. |
| 2. |
The Average Lipper Money Market Fund is an equally weighted performance average adjusted for capital gains distributions and income dividends of all of the money market funds in the Lipper Universe. Lipper Inc., a wholly-owned subsidiary of Reuters Group PLC, is an independent monitor of mutual fund performance. Lipper averages are not class specific. Lipper returns are unaudited. Results are based on average total returns of similar funds with all dividend and capital gain distributions reinvested. |
Key Fund Statistics
| Fund's net assets | $575,375,870 |
| Total number of portfolio holdings | 23 |
Graphical Representation of Holdings
The tables below show the investment makeup of the Fund; percentages indicated are based on the Fund's net assets.
Portfolio Composition
| Commercial Paper | 43.7% |
| Repurchase Agreements | 32.2% |
| U.S. Treasury Debt | 24.1% |
| Other Assets, Less Liabilities | 0.0%‡ |
| ‡ Less than one-tenth of a percent. |
What were the Fund costs for the last six months?
(Based on a hypothetical $10,000 investment)
| Share Class Name | Costs of a $10,000 investment | Costs paid as a percentage of a $10,000 investment1,2 |
| Class C | $40 | 0.79% |
| 1. | Reflects fee waivers and/or expense reimbursements, without which expenses would have been higher. |
| 2. | Annualized. |
Fund Performance
The following graph compares the initial and subsequent account values at the end of each of the most recently completed 10 semiannual reporting periods of the Fund (or for the life of the Fund, if shorter). It assumes a $10,000 initial investment at the beginning of the first fiscal period in an equally weighted performance average of money market funds and other additional indexes, if applicable, for the same period and reflects the deduction of all sales charges, where applicable.
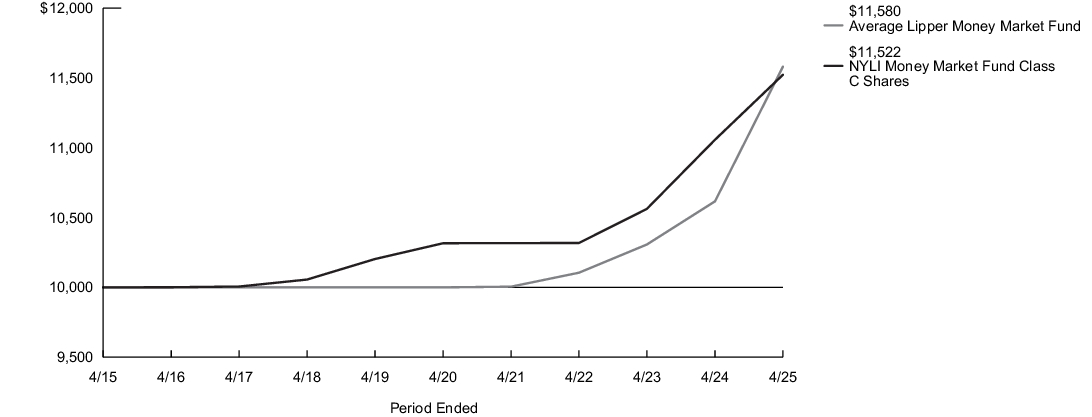
| Average Annual Total Returns for the Period Ended April 30, 2025 | Inception Date |
Six Months1 |
One Year |
Five Years |
Ten Years |
| Class C Shares | 9/1/1998 | 1.86% | 4.20% | 2.24% | 1.43% |
| Average Lipper Money Market Fund2 | 2.05% | 4.57% | 2.48% | 1.70% |
| 1. |
Not annualized. |
| 2. |
The Average Lipper Money Market Fund is an equally weighted performance average adjusted for capital gains distributions and income dividends of all of the money market funds in the Lipper Universe. Lipper Inc., a wholly-owned subsidiary of Reuters Group PLC, is an independent monitor of mutual fund performance. Lipper averages are not class specific. Lipper returns are unaudited. Results are based on average total returns of similar funds with all dividend and capital gain distributions reinvested. |
Key Fund Statistics
| Fund's net assets | $575,375,870 |
| Total number of portfolio holdings | 23 |
Graphical Representation of Holdings
The tables below show the investment makeup of the Fund; percentages indicated are based on the Fund's net assets.
Portfolio Composition
| Commercial Paper | 43.7% |
| Repurchase Agreements | 32.2% |
| U.S. Treasury Debt | 24.1% |
| Other Assets, Less Liabilities | 0.0%‡ |
| ‡ Less than one-tenth of a percent. |
What were the Fund costs for the last six months?
(Based on a hypothetical $10,000 investment)
| Share Class Name | Costs of a $10,000 investment | Costs paid as a percentage of a $10,000 investment1,2 |
| Investor Class | $40 | 0.79% |
| 1. | Reflects fee waivers and/or expense reimbursements, without which expenses would have been higher. |
| 2. | Annualized. |
Fund Performance
The following graph compares the initial and subsequent account values at the end of each of the most recently completed 10 semiannual reporting periods of the Fund (or for the life of the Fund, if shorter). It assumes a $10,000 initial investment at the beginning of the first fiscal period in an equally weighted performance average of money market funds and other additional indexes, if applicable, for the same period and reflects the deduction of all sales charges, where applicable.
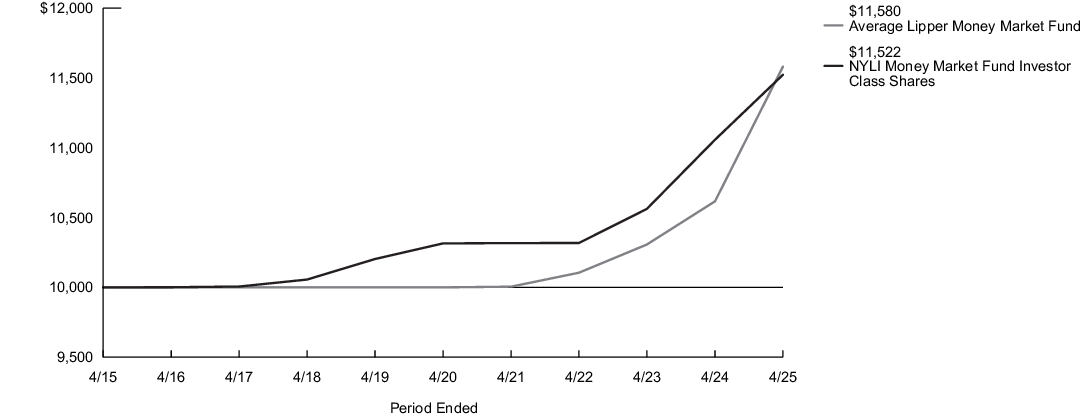
| Average Annual Total Returns for the Period Ended April 30, 2025 | Inception Date |
Six Months1 |
One Year |
Five Years |
Ten Years |
| Investor Class Shares | 2/28/2008 | 1.86% | 4.20% | 2.24% | 1.43% |
| Average Lipper Money Market Fund2 | 2.05% | 4.57% | 2.48% | 1.70% |
| 1. |
Not annualized. |
| 2. |
The Average Lipper Money Market Fund is an equally weighted performance average adjusted for capital gains distributions and income dividends of all of the money market funds in the Lipper Universe. Lipper Inc., a wholly-owned subsidiary of Reuters Group PLC, is an independent monitor of mutual fund performance. Lipper averages are not class specific. Lipper returns are unaudited. Results are based on average total returns of similar funds with all dividend and capital gain distributions reinvested. |
Key Fund Statistics
| Fund's net assets | $575,375,870 |
| Total number of portfolio holdings | 23 |
Graphical Representation of Holdings
The tables below show the investment makeup of the Fund; percentages indicated are based on the Fund's net assets.
Portfolio Composition
| Commercial Paper | 43.7% |
| Repurchase Agreements | 32.2% |
| U.S. Treasury Debt | 24.1% |
| Other Assets, Less Liabilities | 0.0%‡ |
| ‡ Less than one-tenth of a percent. |
What were the Fund costs for the last six months?
(Based on a hypothetical $10,000 investment)
| Share Class Name | Costs of a $10,000 investment | Costs paid as a percentage of a $10,000 investment1 |
| SIMPLE Class | $25 | 0.49% |
| 1. | Annualized. |
Fund Performance
The following graph compares the initial and subsequent account values at the end of each of the most recently completed 10 semiannual reporting periods of the Fund (or for the life of the Fund, if shorter). It assumes a $10,000 initial investment at the beginning of the first fiscal period in an equally weighted performance average of money market funds and other additional indexes, if applicable, for the same period and reflects the deduction of all sales charges, where applicable.
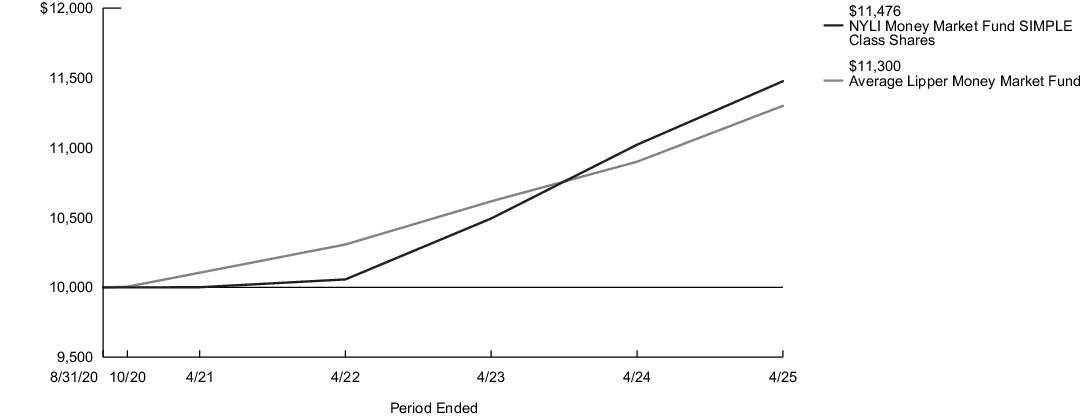
| Average Annual Total Returns for the Period Ended April 30, 2025 | Inception Date |
Six Months1 |
One Year |
Since Inception |
| SIMPLE Class Shares | 8/31/2020 | 2.01% | 4.53% | 2.55% |
| Average Lipper Money Market Fund2 | 2.05% | 4.57% | 2.65% |
| 1. |
Not annualized. |
| 2. |
The Average Lipper Money Market Fund is an equally weighted performance average adjusted for capital gains distributions and income dividends of all of the money market funds in the Lipper Universe. Lipper Inc., a wholly-owned subsidiary of Reuters Group PLC, is an independent monitor of mutual fund performance. Lipper averages are not class specific. Lipper returns are unaudited. Results are based on average total returns of similar funds with all dividend and capital gain distributions reinvested. |
Key Fund Statistics
| Fund's net assets | $575,375,870 |
| Total number of portfolio holdings | 23 |
Graphical Representation of Holdings
The tables below show the investment makeup of the Fund; percentages indicated are based on the Fund's net assets.
Portfolio Composition
| Commercial Paper | 43.7% |
| Repurchase Agreements | 32.2% |
| U.S. Treasury Debt | 24.1% |
| Other Assets, Less Liabilities | 0.0%‡ |
| ‡ Less than one-tenth of a percent. |
What were the Fund costs for the last six months?
(Based on a hypothetical $10,000 investment)
| Share Class Name | Costs of a $10,000 investment | Costs paid as a percentage of a $10,000 investment1 |
| Class A | $36 | 0.73% |
| 1. | Annualized. |
Fund Performance
The following graph compares the initial and subsequent account values at the end of each of the most recently completed 10 semiannual reporting periods of the Fund (or for the life of the Fund, if shorter). It assumes a $15,000 initial investment at the beginning of the first fiscal period in an appropriate, broad-based securities market index and other additional indexes, if applicable, for the same period and reflects the deduction of all sales charges, where applicable.
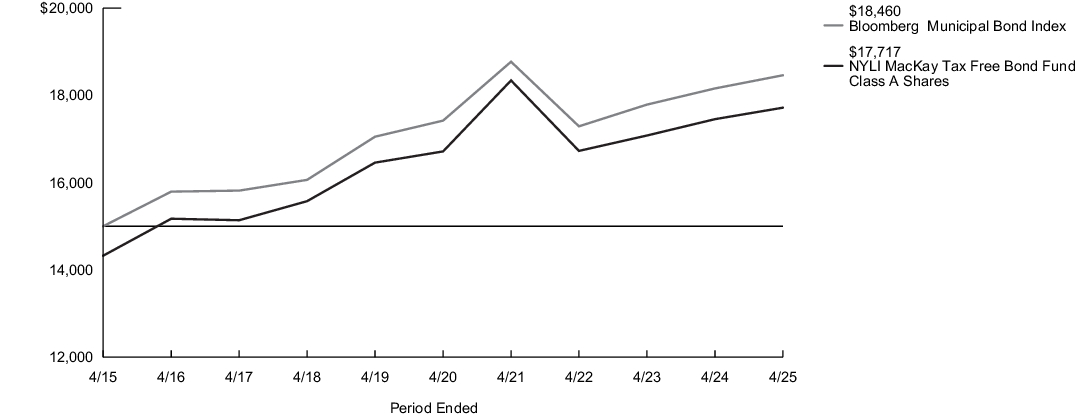
| Average Annual Total Returns for the Period Ended April 30, 2025 | Inception Date |
Six Months1 |
One Year |
Five Years |
Ten Years |
| Class A Shares - Including sales charges | 1/3/1995 | (3.91)% | (1.54)% | 0.24% | 1.68% |
| Class A Shares - Excluding sales charges | (0.94)% | 1.51% | 1.17% | 2.15% | |
| Bloomberg Municipal Bond Index2 | (0.78)% | 1.66% | 1.17% | 2.10% | |
| Morningstar Muni National Long Category Average3 | (1.35)% | 2.00% | 1.43% | 1.99% |
| 1. |
Not annualized. |
| 2. |
The Fund has selected the Bloomberg Municipal Bond Index to represent a broad measure of market performance. The Bloomberg Municipal Bond Index is considered representative of the broad market for investment-grade, tax-exempt bonds with a maturity of at least one year. Bonds subject to the alternative minimum tax or with floating or zero coupons are excluded. |
| 3. |
The Morningstar Muni National Long Category Average is representative of funds that invest in bonds issued by various state and local governments to fund public projects. The income from these bonds is generally free from federal taxes. These funds have durations of more than 7 years. Results are based on average total returns of similar funds with all dividends and capital gain distributions reinvested. |
Key Fund Statistics
| Fund's net assets | $8,898,665,906 |
| Total number of portfolio holdings | 1,067 |
| Portfolio turnover rate | 37% |
Graphical Representation of Holdings
The tables below show the investment makeup of the Fund; percentages indicated are based on the Fund's net assets.
Top Ten Holdings and/or Issuers*
| Los Angeles Department of Water & Power, 3.65%-6.603%, due 7/1/28-7/1/55 | 3.5% |
| San Francisco City & County Airport Commission, 5.00%-5.50%, due 5/1/30-5/1/55 | 2.5% |
| New York City Transitional Finance Authority, 3.00%-5.50%, due 11/1/36-5/1/53 | 2.4% |
| California Community Choice Financing Authority, 4.00%-5.25%, due 2/1/52-11/1/55 | 2.2% |
| Black Belt Energy Gas District, 4.00%-5.50%, due 6/1/49-5/1/55 | 1.9% |
| New York State Dormitory Authority, 3.00%-5.75%, due 7/1/27-7/1/54 | 1.9% |
| Main Street Natural Gas, Inc., 4.00%-5.50%, due 9/15/27-5/1/55 | 1.5% |
| Triborough Bridge & Tunnel Authority, 3.00%-5.50%, due 3/15/27-5/15/63 | 1.5% |
| New Hampshire Business Finance Authority, 3.00%-6.89%, due 4/1/34-7/1/54 | 1.5% |
| Southeast Energy Authority A Cooperative District, 4.00%-5.25%, due 11/1/35-1/1/56 | 1.4% |
| * Excluding short-term investments |
Top States
| California | 15.1% |
| New York | 13.9% |
| Texas | 9.9% |
| Illinois | 6.7% |
| Florida | 5.6% |
| Alabama | 4.9% |
| Georgia | 3.8% |
| Pennsylvania | 2.6% |
| Colorado | 2.5% |
| Utah | 2.4% |
Top Ten Holdings and/or Issuers*
| Los Angeles Department of Water & Power, 3.65%-6.603%, due 7/1/28-7/1/55 | 3.5% |
| San Francisco City & County Airport Commission, 5.00%-5.50%, due 5/1/30-5/1/55 | 2.5% |
| New York City Transitional Finance Authority, 3.00%-5.50%, due 11/1/36-5/1/53 | 2.4% |
| California Community Choice Financing Authority, 4.00%-5.25%, due 2/1/52-11/1/55 | 2.2% |
| Black Belt Energy Gas District, 4.00%-5.50%, due 6/1/49-5/1/55 | 1.9% |
| New York State Dormitory Authority, 3.00%-5.75%, due 7/1/27-7/1/54 | 1.9% |
| Main Street Natural Gas, Inc., 4.00%-5.50%, due 9/15/27-5/1/55 | 1.5% |
| Triborough Bridge & Tunnel Authority, 3.00%-5.50%, due 3/15/27-5/15/63 | 1.5% |
| New Hampshire Business Finance Authority, 3.00%-6.89%, due 4/1/34-7/1/54 | 1.5% |
| Southeast Energy Authority A Cooperative District, 4.00%-5.25%, due 11/1/35-1/1/56 | 1.4% |
| * Excluding short-term investments |
What were the Fund costs for the last six months?
(Based on a hypothetical $10,000 investment)
| Share Class Name | Costs of a $10,000 investment | Costs paid as a percentage of a $10,000 investment1 |
| Class C | $51 | 1.03% |
| 1. | Annualized. |
Fund Performance
The following graph compares the initial and subsequent account values at the end of each of the most recently completed 10 semiannual reporting periods of the Fund (or for the life of the Fund, if shorter). It assumes a $10,000 initial investment at the beginning of the first fiscal period in an appropriate, broad-based securities market index and other additional indexes, if applicable, for the same period and reflects the deduction of all sales charges, where applicable.
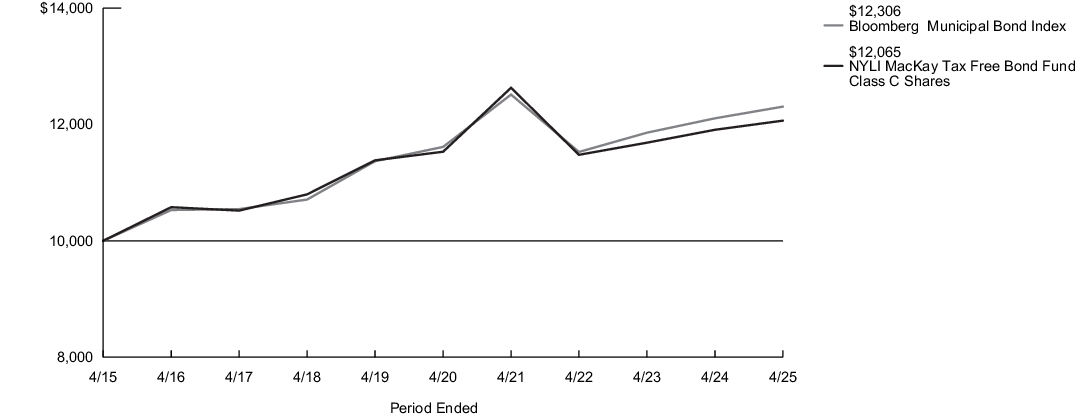
| Average Annual Total Returns for the Period Ended April 30, 2025 | Inception Date |
Six Months1 |
One Year |
Five Years |
Ten Years |
| Class C Shares - Including sales charges | 9/1/1998 | (1.95)% | 0.34% | 0.91% | 1.90% |
| Class C Shares - Excluding sales charges | (0.97)% | 1.32% | 0.91% | 1.90% | |
| Bloomberg Municipal Bond Index2 | (0.78)% | 1.66% | 1.17% | 2.10% | |
| Morningstar Muni National Long Category Average3 | (1.35)% | 2.00% | 1.43% | 1.99% |
| 1. |
Not annualized. |
| 2. |
The Fund has selected the Bloomberg Municipal Bond Index to represent a broad measure of market performance. The Bloomberg Municipal Bond Index is considered representative of the broad market for investment-grade, tax-exempt bonds with a maturity of at least one year. Bonds subject to the alternative minimum tax or with floating or zero coupons are excluded. |
| 3. |
The Morningstar Muni National Long Category Average is representative of funds that invest in bonds issued by various state and local governments to fund public projects. The income from these bonds is generally free from federal taxes. These funds have durations of more than 7 years. Results are based on average total returns of similar funds with all dividends and capital gain distributions reinvested. |
Key Fund Statistics
| Fund's net assets | $8,898,665,906 |
| Total number of portfolio holdings | 1,067 |
| Portfolio turnover rate | 37% |
Graphical Representation of Holdings
The tables below show the investment makeup of the Fund; percentages indicated are based on the Fund's net assets.
Top Ten Holdings and/or Issuers*
| Los Angeles Department of Water & Power, 3.65%-6.603%, due 7/1/28-7/1/55 | 3.5% |
| San Francisco City & County Airport Commission, 5.00%-5.50%, due 5/1/30-5/1/55 | 2.5% |
| New York City Transitional Finance Authority, 3.00%-5.50%, due 11/1/36-5/1/53 | 2.4% |
| California Community Choice Financing Authority, 4.00%-5.25%, due 2/1/52-11/1/55 | 2.2% |
| Black Belt Energy Gas District, 4.00%-5.50%, due 6/1/49-5/1/55 | 1.9% |
| New York State Dormitory Authority, 3.00%-5.75%, due 7/1/27-7/1/54 | 1.9% |
| Main Street Natural Gas, Inc., 4.00%-5.50%, due 9/15/27-5/1/55 | 1.5% |
| Triborough Bridge & Tunnel Authority, 3.00%-5.50%, due 3/15/27-5/15/63 | 1.5% |
| New Hampshire Business Finance Authority, 3.00%-6.89%, due 4/1/34-7/1/54 | 1.5% |
| Southeast Energy Authority A Cooperative District, 4.00%-5.25%, due 11/1/35-1/1/56 | 1.4% |
| * Excluding short-term investments |
Top States
| California | 15.1% |
| New York | 13.9% |
| Texas | 9.9% |
| Illinois | 6.7% |
| Florida | 5.6% |
| Alabama | 4.9% |
| Georgia | 3.8% |
| Pennsylvania | 2.6% |
| Colorado | 2.5% |
| Utah | 2.4% |
Top Ten Holdings and/or Issuers*
| Los Angeles Department of Water & Power, 3.65%-6.603%, due 7/1/28-7/1/55 | 3.5% |
| San Francisco City & County Airport Commission, 5.00%-5.50%, due 5/1/30-5/1/55 | 2.5% |
| New York City Transitional Finance Authority, 3.00%-5.50%, due 11/1/36-5/1/53 | 2.4% |
| California Community Choice Financing Authority, 4.00%-5.25%, due 2/1/52-11/1/55 | 2.2% |
| Black Belt Energy Gas District, 4.00%-5.50%, due 6/1/49-5/1/55 | 1.9% |
| New York State Dormitory Authority, 3.00%-5.75%, due 7/1/27-7/1/54 | 1.9% |
| Main Street Natural Gas, Inc., 4.00%-5.50%, due 9/15/27-5/1/55 | 1.5% |
| Triborough Bridge & Tunnel Authority, 3.00%-5.50%, due 3/15/27-5/15/63 | 1.5% |
| New Hampshire Business Finance Authority, 3.00%-6.89%, due 4/1/34-7/1/54 | 1.5% |
| Southeast Energy Authority A Cooperative District, 4.00%-5.25%, due 11/1/35-1/1/56 | 1.4% |
| * Excluding short-term investments |
What were the Fund costs for the last six months?
(Based on a hypothetical $10,000 investment)
| Share Class Name | Costs of a $10,000 investment | Costs paid as a percentage of a $10,000 investment1 |
| Class C2 | $58 | 1.18% |
| 1. | Annualized. |
Fund Performance
The following graph compares the initial and subsequent account values at the end of each of the most recently completed 10 semiannual reporting periods of the Fund (or for the life of the Fund, if shorter). It assumes a $10,000 initial investment at the beginning of the first fiscal period in an appropriate, broad-based securities market index and other additional indexes, if applicable, for the same period and reflects the deduction of all sales charges, where applicable.
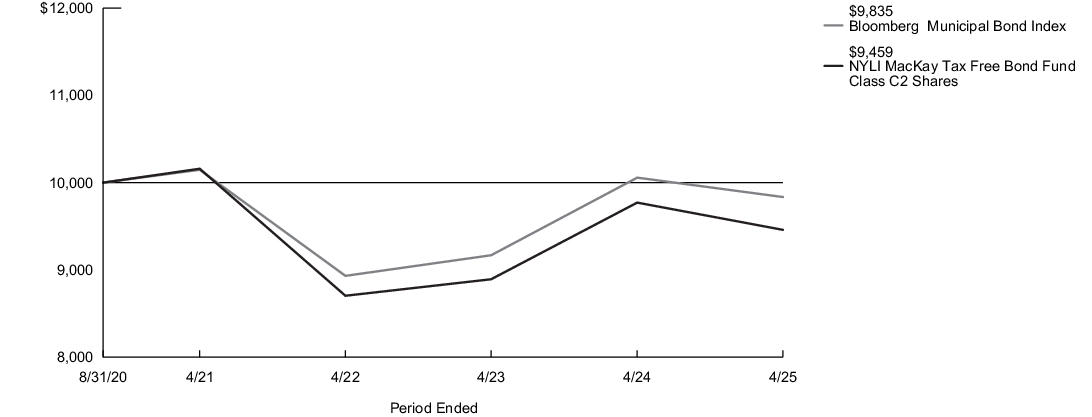
| Average Annual Total Returns for the Period Ended April 30, 2025 | Inception Date |
Six Months1 |
One Year |
Since Inception |
| Class C2 Shares - Including sales charges | 8/31/2020 | (2.13)% | 0.19% | (0.48)% |
| Class C2 Shares - Excluding sales charges | (1.15)% | 1.17% | (0.48)% | |
| Bloomberg Municipal Bond Index2 | (0.78)% | 1.66% | 0.14% | |
| Morningstar Muni National Long Category Average3 | (1.35)% | 2.00% | (0.01)% |
| 1. |
Not annualized. |
| 2. |
The Fund has selected the Bloomberg Municipal Bond Index to represent a broad measure of market performance. The Bloomberg Municipal Bond Index is considered representative of the broad market for investment-grade, tax-exempt bonds with a maturity of at least one year. Bonds subject to the alternative minimum tax or with floating or zero coupons are excluded. |
| 3. |
The Morningstar Muni National Long Category Average is representative of funds that invest in bonds issued by various state and local governments to fund public projects. The income from these bonds is generally free from federal taxes. These funds have durations of more than 7 years. Results are based on average total returns of similar funds with all dividends and capital gain distributions reinvested. |
Key Fund Statistics
| Fund's net assets | $8,898,665,906 |
| Total number of portfolio holdings | 1,067 |
| Portfolio turnover rate | 37% |
Graphical Representation of Holdings
The tables below show the investment makeup of the Fund; percentages indicated are based on the Fund's net assets.
Top Ten Holdings and/or Issuers*
| Los Angeles Department of Water & Power, 3.65%-6.603%, due 7/1/28-7/1/55 | 3.5% |
| San Francisco City & County Airport Commission, 5.00%-5.50%, due 5/1/30-5/1/55 | 2.5% |
| New York City Transitional Finance Authority, 3.00%-5.50%, due 11/1/36-5/1/53 | 2.4% |
| California Community Choice Financing Authority, 4.00%-5.25%, due 2/1/52-11/1/55 | 2.2% |
| Black Belt Energy Gas District, 4.00%-5.50%, due 6/1/49-5/1/55 | 1.9% |
| New York State Dormitory Authority, 3.00%-5.75%, due 7/1/27-7/1/54 | 1.9% |
| Main Street Natural Gas, Inc., 4.00%-5.50%, due 9/15/27-5/1/55 | 1.5% |
| Triborough Bridge & Tunnel Authority, 3.00%-5.50%, due 3/15/27-5/15/63 | 1.5% |
| New Hampshire Business Finance Authority, 3.00%-6.89%, due 4/1/34-7/1/54 | 1.5% |
| Southeast Energy Authority A Cooperative District, 4.00%-5.25%, due 11/1/35-1/1/56 | 1.4% |
| * Excluding short-term investments |
Top States
| California | 15.1% |
| New York | 13.9% |
| Texas | 9.9% |
| Illinois | 6.7% |
| Florida | 5.6% |
| Alabama | 4.9% |
| Georgia | 3.8% |
| Pennsylvania | 2.6% |
| Colorado | 2.5% |
| Utah | 2.4% |
Top Ten Holdings and/or Issuers*
| Los Angeles Department of Water & Power, 3.65%-6.603%, due 7/1/28-7/1/55 | 3.5% |
| San Francisco City & County Airport Commission, 5.00%-5.50%, due 5/1/30-5/1/55 | 2.5% |
| New York City Transitional Finance Authority, 3.00%-5.50%, due 11/1/36-5/1/53 | 2.4% |
| California Community Choice Financing Authority, 4.00%-5.25%, due 2/1/52-11/1/55 | 2.2% |
| Black Belt Energy Gas District, 4.00%-5.50%, due 6/1/49-5/1/55 | 1.9% |
| New York State Dormitory Authority, 3.00%-5.75%, due 7/1/27-7/1/54 | 1.9% |
| Main Street Natural Gas, Inc., 4.00%-5.50%, due 9/15/27-5/1/55 | 1.5% |
| Triborough Bridge & Tunnel Authority, 3.00%-5.50%, due 3/15/27-5/15/63 | 1.5% |
| New Hampshire Business Finance Authority, 3.00%-6.89%, due 4/1/34-7/1/54 | 1.5% |
| Southeast Energy Authority A Cooperative District, 4.00%-5.25%, due 11/1/35-1/1/56 | 1.4% |
| * Excluding short-term investments |
What were the Fund costs for the last six months?
(Based on a hypothetical $10,000 investment)
| Share Class Name | Costs of a $10,000 investment | Costs paid as a percentage of a $10,000 investment1 |
| Class I | $24 | 0.48% |
| 1. | Annualized. |
Fund Performance
The following graph compares the initial and subsequent account values at the end of each of the most recently completed 10 semiannual reporting periods of the Fund (or for the life of the Fund, if shorter). It assumes a $10,000 initial investment at the beginning of the first fiscal period in an appropriate, broad-based securities market index and other additional indexes, if applicable, for the same period and reflects the deduction of all sales charges, where applicable.
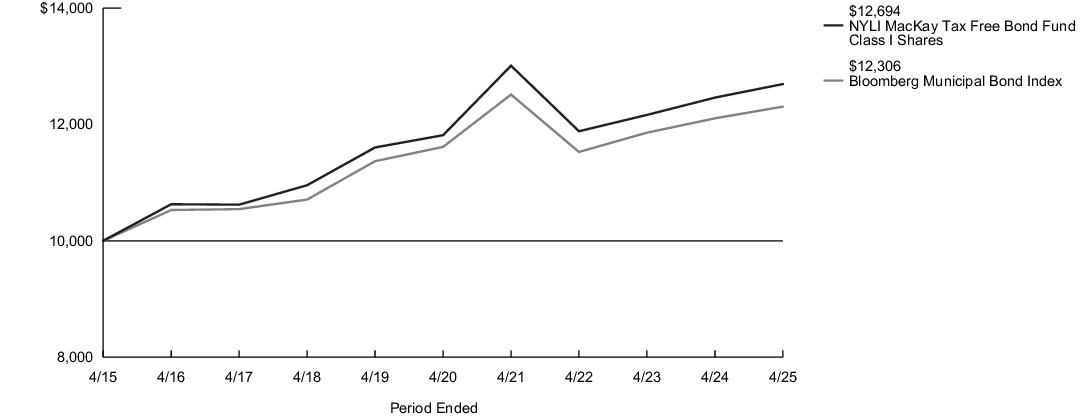
| Average Annual Total Returns for the Period Ended April 30, 2025 | Inception Date |
Six Months1 |
One Year |
Five Years |
Ten Years |
| Class I Shares | 12/21/2009 | (0.70)% | 1.87% | 1.45% | 2.41% |
| Bloomberg Municipal Bond Index2 | (0.78)% | 1.66% | 1.17% | 2.10% | |
| Morningstar Muni National Long Category Average3 | (1.35)% | 2.00% | 1.43% | 1.99% |
| 1. |
Not annualized. |
| 2. |
The Fund has selected the Bloomberg Municipal Bond Index to represent a broad measure of market performance. The Bloomberg Municipal Bond Index is considered representative of the broad market for investment-grade, tax-exempt bonds with a maturity of at least one year. Bonds subject to the alternative minimum tax or with floating or zero coupons are excluded. |
| 3. |
The Morningstar Muni National Long Category Average is representative of funds that invest in bonds issued by various state and local governments to fund public projects. The income from these bonds is generally free from federal taxes. These funds have durations of more than 7 years. Results are based on average total returns of similar funds with all dividends and capital gain distributions reinvested. |
Key Fund Statistics
| Fund's net assets | $8,898,665,906 |
| Total number of portfolio holdings | 1,067 |
| Portfolio turnover rate | 37% |
Graphical Representation of Holdings
The tables below show the investment makeup of the Fund; percentages indicated are based on the Fund's net assets.
Top Ten Holdings and/or Issuers*
| Los Angeles Department of Water & Power, 3.65%-6.603%, due 7/1/28-7/1/55 | 3.5% |
| San Francisco City & County Airport Commission, 5.00%-5.50%, due 5/1/30-5/1/55 | 2.5% |
| New York City Transitional Finance Authority, 3.00%-5.50%, due 11/1/36-5/1/53 | 2.4% |
| California Community Choice Financing Authority, 4.00%-5.25%, due 2/1/52-11/1/55 | 2.2% |
| Black Belt Energy Gas District, 4.00%-5.50%, due 6/1/49-5/1/55 | 1.9% |
| New York State Dormitory Authority, 3.00%-5.75%, due 7/1/27-7/1/54 | 1.9% |
| Main Street Natural Gas, Inc., 4.00%-5.50%, due 9/15/27-5/1/55 | 1.5% |
| Triborough Bridge & Tunnel Authority, 3.00%-5.50%, due 3/15/27-5/15/63 | 1.5% |
| New Hampshire Business Finance Authority, 3.00%-6.89%, due 4/1/34-7/1/54 | 1.5% |
| Southeast Energy Authority A Cooperative District, 4.00%-5.25%, due 11/1/35-1/1/56 | 1.4% |
| * Excluding short-term investments |
Top States
| California | 15.1% |
| New York | 13.9% |
| Texas | 9.9% |
| Illinois | 6.7% |
| Florida | 5.6% |
| Alabama | 4.9% |
| Georgia | 3.8% |
| Pennsylvania | 2.6% |
| Colorado | 2.5% |
| Utah | 2.4% |
Top Ten Holdings and/or Issuers*
| Los Angeles Department of Water & Power, 3.65%-6.603%, due 7/1/28-7/1/55 | 3.5% |
| San Francisco City & County Airport Commission, 5.00%-5.50%, due 5/1/30-5/1/55 | 2.5% |
| New York City Transitional Finance Authority, 3.00%-5.50%, due 11/1/36-5/1/53 | 2.4% |
| California Community Choice Financing Authority, 4.00%-5.25%, due 2/1/52-11/1/55 | 2.2% |
| Black Belt Energy Gas District, 4.00%-5.50%, due 6/1/49-5/1/55 | 1.9% |
| New York State Dormitory Authority, 3.00%-5.75%, due 7/1/27-7/1/54 | 1.9% |
| Main Street Natural Gas, Inc., 4.00%-5.50%, due 9/15/27-5/1/55 | 1.5% |
| Triborough Bridge & Tunnel Authority, 3.00%-5.50%, due 3/15/27-5/15/63 | 1.5% |
| New Hampshire Business Finance Authority, 3.00%-6.89%, due 4/1/34-7/1/54 | 1.5% |
| Southeast Energy Authority A Cooperative District, 4.00%-5.25%, due 11/1/35-1/1/56 | 1.4% |
| * Excluding short-term investments |
What were the Fund costs for the last six months?
(Based on a hypothetical $10,000 investment)
| Share Class Name | Costs of a $10,000 investment | Costs paid as a percentage of a $10,000 investment1 |
| Class R6 | $21 | 0.43% |
| 1. | Annualized. |
Fund Performance
The following graph compares the initial and subsequent account values at the end of each of the most recently completed 10 semiannual reporting periods of the Fund (or for the life of the Fund, if shorter). It assumes a $10,000 initial investment at the beginning of the first fiscal period in an appropriate, broad-based securities market index and other additional indexes, if applicable, for the same period and reflects the deduction of all sales charges, where applicable.
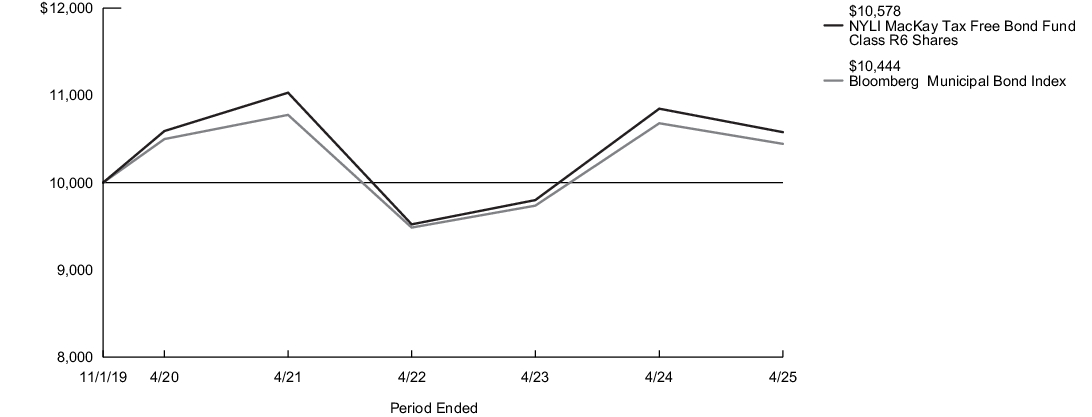
| Average Annual Total Returns for the Period Ended April 30, 2025 | Inception Date |
Six Months1 |
One Year |
Five Years |
Since Inception |
| Class R6 Shares | 11/1/2019 | (0.79)% | 1.92% | 1.48% | 1.00% |
| Bloomberg Municipal Bond Index2 | (0.78)% | 1.66% | 1.17% | 0.81% | |
| Morningstar Muni National Long Category Average3 | (1.35)% | 2.00% | 1.43% | 0.52% |
| 1. |
Not annualized. |
| 2. |
The Fund has selected the Bloomberg Municipal Bond Index to represent a broad measure of market performance. The Bloomberg Municipal Bond Index is considered representative of the broad market for investment-grade, tax-exempt bonds with a maturity of at least one year. Bonds subject to the alternative minimum tax or with floating or zero coupons are excluded. |
| 3. |
The Morningstar Muni National Long Category Average is representative of funds that invest in bonds issued by various state and local governments to fund public projects. The income from these bonds is generally free from federal taxes. These funds have durations of more than 7 years. Results are based on average total returns of similar funds with all dividends and capital gain distributions reinvested. |
Key Fund Statistics
| Fund's net assets | $8,898,665,906 |
| Total number of portfolio holdings | 1,067 |
| Portfolio turnover rate | 37% |
Graphical Representation of Holdings
The tables below show the investment makeup of the Fund; percentages indicated are based on the Fund's net assets.
Top Ten Holdings and/or Issuers*
| Los Angeles Department of Water & Power, 3.65%-6.603%, due 7/1/28-7/1/55 | 3.5% |
| San Francisco City & County Airport Commission, 5.00%-5.50%, due 5/1/30-5/1/55 | 2.5% |
| New York City Transitional Finance Authority, 3.00%-5.50%, due 11/1/36-5/1/53 | 2.4% |
| California Community Choice Financing Authority, 4.00%-5.25%, due 2/1/52-11/1/55 | 2.2% |
| Black Belt Energy Gas District, 4.00%-5.50%, due 6/1/49-5/1/55 | 1.9% |
| New York State Dormitory Authority, 3.00%-5.75%, due 7/1/27-7/1/54 | 1.9% |
| Main Street Natural Gas, Inc., 4.00%-5.50%, due 9/15/27-5/1/55 | 1.5% |
| Triborough Bridge & Tunnel Authority, 3.00%-5.50%, due 3/15/27-5/15/63 | 1.5% |
| New Hampshire Business Finance Authority, 3.00%-6.89%, due 4/1/34-7/1/54 | 1.5% |
| Southeast Energy Authority A Cooperative District, 4.00%-5.25%, due 11/1/35-1/1/56 | 1.4% |
| * Excluding short-term investments |
Top States
| California | 15.1% |
| New York | 13.9% |
| Texas | 9.9% |
| Illinois | 6.7% |
| Florida | 5.6% |
| Alabama | 4.9% |
| Georgia | 3.8% |
| Pennsylvania | 2.6% |
| Colorado | 2.5% |
| Utah | 2.4% |
Top Ten Holdings and/or Issuers*
| Los Angeles Department of Water & Power, 3.65%-6.603%, due 7/1/28-7/1/55 | 3.5% |
| San Francisco City & County Airport Commission, 5.00%-5.50%, due 5/1/30-5/1/55 | 2.5% |
| New York City Transitional Finance Authority, 3.00%-5.50%, due 11/1/36-5/1/53 | 2.4% |
| California Community Choice Financing Authority, 4.00%-5.25%, due 2/1/52-11/1/55 | 2.2% |
| Black Belt Energy Gas District, 4.00%-5.50%, due 6/1/49-5/1/55 | 1.9% |
| New York State Dormitory Authority, 3.00%-5.75%, due 7/1/27-7/1/54 | 1.9% |
| Main Street Natural Gas, Inc., 4.00%-5.50%, due 9/15/27-5/1/55 | 1.5% |
| Triborough Bridge & Tunnel Authority, 3.00%-5.50%, due 3/15/27-5/15/63 | 1.5% |
| New Hampshire Business Finance Authority, 3.00%-6.89%, due 4/1/34-7/1/54 | 1.5% |
| Southeast Energy Authority A Cooperative District, 4.00%-5.25%, due 11/1/35-1/1/56 | 1.4% |
| * Excluding short-term investments |
What were the Fund costs for the last six months?
(Based on a hypothetical $10,000 investment)
| Share Class Name | Costs of a $10,000 investment | Costs paid as a percentage of a $10,000 investment1 |
| Investor Class | $38 | 0.78% |
| 1. | Annualized. |
Fund Performance
The following graph compares the initial and subsequent account values at the end of each of the most recently completed 10 semiannual reporting periods of the Fund (or for the life of the Fund, if shorter). It assumes a $10,000 initial investment at the beginning of the first fiscal period in an appropriate, broad-based securities market index and other additional indexes, if applicable, for the same period and reflects the deduction of all sales charges, where applicable.
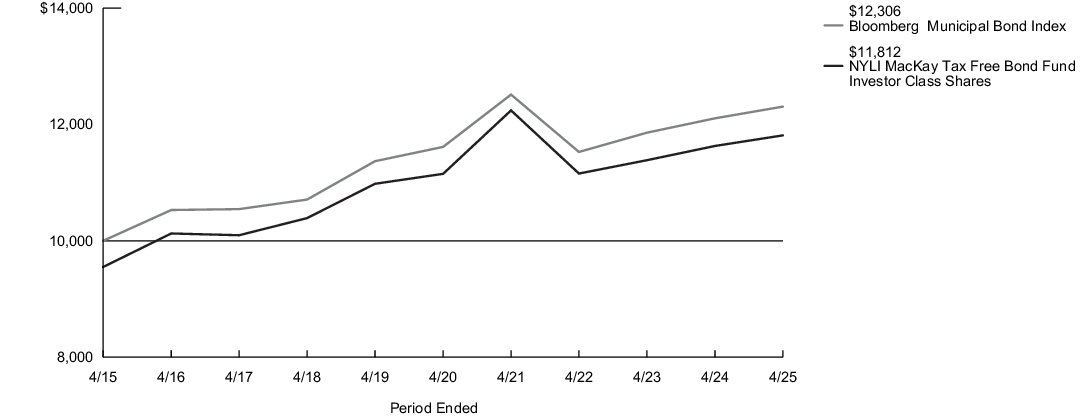
| Average Annual Total Returns for the Period Ended April 30, 2025 | Inception Date |
Six Months1 |
One Year |
Five Years |
Ten Years |
| Investor Class Shares - Including sales charges | 2/28/2008 | (3.33)% | (0.97)% | 0.23% | 1.68% |
| Investor Class Shares - Excluding sales charges | (0.85)% | 1.57% | 1.16% | 2.15% | |
| Bloomberg Municipal Bond Index2 | (0.78)% | 1.66% | 1.17% | 2.10% | |
| Morningstar Muni National Long Category Average3 | (1.35)% | 2.00% | 1.43% | 1.99% |
| 1. |
Not annualized. |
| 2. |
The Fund has selected the Bloomberg Municipal Bond Index to represent a broad measure of market performance. The Bloomberg Municipal Bond Index is considered representative of the broad market for investment-grade, tax-exempt bonds with a maturity of at least one year. Bonds subject to the alternative minimum tax or with floating or zero coupons are excluded. |
| 3. |
The Morningstar Muni National Long Category Average is representative of funds that invest in bonds issued by various state and local governments to fund public projects. The income from these bonds is generally free from federal taxes. These funds have durations of more than 7 years. Results are based on average total returns of similar funds with all dividends and capital gain distributions reinvested. |
Key Fund Statistics
| Fund's net assets | $8,898,665,906 |
| Total number of portfolio holdings | 1,067 |
| Portfolio turnover rate | 37% |
Graphical Representation of Holdings
The tables below show the investment makeup of the Fund; percentages indicated are based on the Fund's net assets.
Top Ten Holdings and/or Issuers*
| Los Angeles Department of Water & Power, 3.65%-6.603%, due 7/1/28-7/1/55 | 3.5% |
| San Francisco City & County Airport Commission, 5.00%-5.50%, due 5/1/30-5/1/55 | 2.5% |
| New York City Transitional Finance Authority, 3.00%-5.50%, due 11/1/36-5/1/53 | 2.4% |
| California Community Choice Financing Authority, 4.00%-5.25%, due 2/1/52-11/1/55 | 2.2% |
| Black Belt Energy Gas District, 4.00%-5.50%, due 6/1/49-5/1/55 | 1.9% |
| New York State Dormitory Authority, 3.00%-5.75%, due 7/1/27-7/1/54 | 1.9% |
| Main Street Natural Gas, Inc., 4.00%-5.50%, due 9/15/27-5/1/55 | 1.5% |
| Triborough Bridge & Tunnel Authority, 3.00%-5.50%, due 3/15/27-5/15/63 | 1.5% |
| New Hampshire Business Finance Authority, 3.00%-6.89%, due 4/1/34-7/1/54 | 1.5% |
| Southeast Energy Authority A Cooperative District, 4.00%-5.25%, due 11/1/35-1/1/56 | 1.4% |
| * Excluding short-term investments |
Top States
| California | 15.1% |
| New York | 13.9% |
| Texas | 9.9% |
| Illinois | 6.7% |
| Florida | 5.6% |
| Alabama | 4.9% |
| Georgia | 3.8% |
| Pennsylvania | 2.6% |
| Colorado | 2.5% |
| Utah | 2.4% |
Top Ten Holdings and/or Issuers*
| Los Angeles Department of Water & Power, 3.65%-6.603%, due 7/1/28-7/1/55 | 3.5% |
| San Francisco City & County Airport Commission, 5.00%-5.50%, due 5/1/30-5/1/55 | 2.5% |
| New York City Transitional Finance Authority, 3.00%-5.50%, due 11/1/36-5/1/53 | 2.4% |
| California Community Choice Financing Authority, 4.00%-5.25%, due 2/1/52-11/1/55 | 2.2% |
| Black Belt Energy Gas District, 4.00%-5.50%, due 6/1/49-5/1/55 | 1.9% |
| New York State Dormitory Authority, 3.00%-5.75%, due 7/1/27-7/1/54 | 1.9% |
| Main Street Natural Gas, Inc., 4.00%-5.50%, due 9/15/27-5/1/55 | 1.5% |
| Triborough Bridge & Tunnel Authority, 3.00%-5.50%, due 3/15/27-5/15/63 | 1.5% |
| New Hampshire Business Finance Authority, 3.00%-6.89%, due 4/1/34-7/1/54 | 1.5% |
| Southeast Energy Authority A Cooperative District, 4.00%-5.25%, due 11/1/35-1/1/56 | 1.4% |
| * Excluding short-term investments |
What were the Fund costs for the last six months?
(Based on a hypothetical $10,000 investment)
| Share Class Name | Costs of a $10,000 investment | Costs paid as a percentage of a $10,000 investment1 |
| Class A | $46 | 0.93% |
| 1. | Annualized. |
Fund Performance
The following graph compares the initial and subsequent account values at the end of each of the most recently completed 10 semiannual reporting periods of the Fund (or for the life of the Fund, if shorter). It assumes a $15,000 initial investment at the beginning of the first fiscal period in an appropriate, broad-based securities market index and other additional indexes, if applicable, for the same period and reflects the deduction of all sales charges, where applicable.
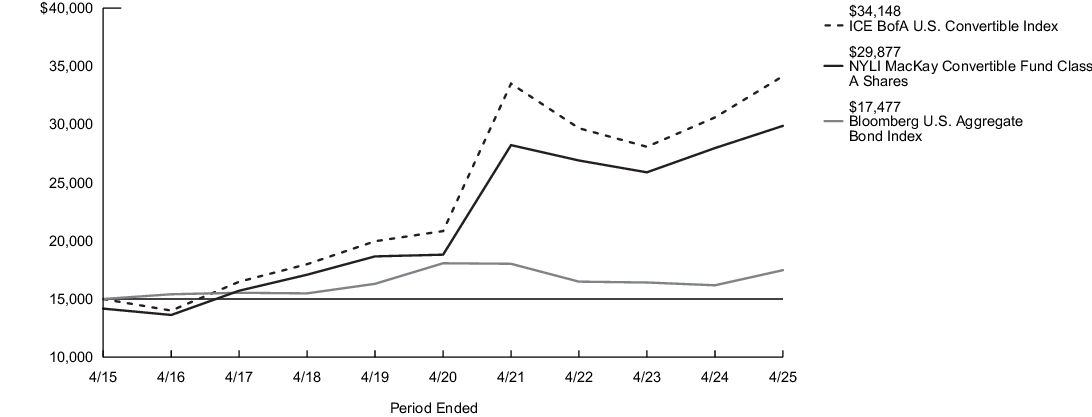
| Average Annual Total Returns for the Period Ended April 30, 2025 | Inception Date |
Six Months1 |
One Year |
Five Years |
Ten Years |
| Class A Shares - Including sales charges | 1/3/1995 | (6.13)% | 0.95% | 8.46% | 7.13% |
| Class A Shares - Excluding sales charges | (0.67)% | 6.82% | 9.70% | 7.74% | |
| Bloomberg U.S. Aggregate Bond Index2 | 2.57% | 8.02% | (0.67)% | 1.54% | |
| ICE BofA U.S. Convertible Index3 | 1.67% | 11.59% | 10.38% | 8.57% | |
| Morningstar Convertibles Category Average4 | 1.08% | 9.86% | 8.32% | 7.10% |
| 1. |
Not annualized. |
| 2. |
The Fund has selected the Bloomberg U.S. Aggregate Bond Index to represent a broad measure of market performance. The Bloomberg U.S. Aggregate Bond Index is a broad-based benchmark that measures the investment grade, U.S. dollar-denominated, fixed-rate taxable bond market, including Treasuries, government-related and corporate securities, mortgage-backed securities (agency fixed-rate and hybrid adjustable rate mortgage pass-throughs), asset-backed securities and commercial mortgage-backed securities. |
| 3. |
The ICE BofA U.S. Convertible Index, which is generally representative of the market sectors or types of investments in which the Fund invests, is a market-capitalization weighted index of domestic corporate convertible securities. In order to be included in the ICE BofA U.S. Convertible Index, bonds and preferred stocks must be convertible only to common stock. |
| 4. |
The Morningstar Convertibles Category Average is representative of funds that are designed to offer some of the capital-appreciation potential of stock funds while also supplying some of the safety and yield of bond funds. Results are based on average total returns of similar funds with all dividends and capital gain distributions reinvested. |
Key Fund Statistics
| Fund's net assets | $1,453,869,493 |
| Total number of portfolio holdings | 105 |
| Portfolio turnover rate | 17% |
Graphical Representation of Holdings
The tables below show the investment makeup of the Fund; percentages indicated are based on the Fund's net assets.
Top Ten Holdings and/or Issuers*
| NRG Energy, Inc., 2.75%, due 6/1/48 | 2.6% |
| Lantheus Holdings, Inc., 2.625%, due 12/15/27 | 2.4% |
| Merit Medical Systems, Inc., 3.00%, due 2/1/29 | 2.1% |
| Tetra Tech, Inc., 2.25%, due 8/15/28 | 2.0% |
| Post Holdings, Inc., 2.50%, due 8/15/27 | 1.9% |
| Southwest Airlines Co., 1.25%, due 5/1/25 | 1.9% |
| Integer Holdings Corp., 1.875%, due 3/15/30 | 1.9% |
| Booking Holdings, Inc., 0.75%, due 5/1/25 | 1.8% |
| PG&E Corp., 4.25%, due 12/1/27 | 1.8% |
| Welltower OP LLC, 3.125%, due 7/15/29 | 1.6% |
| * Excluding short-term investments |
Portfolio Composition
| Convertible Bonds | 86.9% |
| Convertible Preferred Stocks | 8.4% |
| Short-Term Investments | 3.7% |
| Common Stock | 0.5% |
| Other Assets, Less Liabilities | 0.5% |
Top Ten Holdings and/or Issuers*
| NRG Energy, Inc., 2.75%, due 6/1/48 | 2.6% |
| Lantheus Holdings, Inc., 2.625%, due 12/15/27 | 2.4% |
| Merit Medical Systems, Inc., 3.00%, due 2/1/29 | 2.1% |
| Tetra Tech, Inc., 2.25%, due 8/15/28 | 2.0% |
| Post Holdings, Inc., 2.50%, due 8/15/27 | 1.9% |
| Southwest Airlines Co., 1.25%, due 5/1/25 | 1.9% |
| Integer Holdings Corp., 1.875%, due 3/15/30 | 1.9% |
| Booking Holdings, Inc., 0.75%, due 5/1/25 | 1.8% |
| PG&E Corp., 4.25%, due 12/1/27 | 1.8% |
| Welltower OP LLC, 3.125%, due 7/15/29 | 1.6% |
| * Excluding short-term investments |
What were the Fund costs for the last six months?
(Based on a hypothetical $10,000 investment)
| Share Class Name | Costs of a $10,000 investment | Costs paid as a percentage of a $10,000 investment1 |
| Class C | $95 | 1.93% |
| 1. | Annualized. |
Fund Performance
The following graph compares the initial and subsequent account values at the end of each of the most recently completed 10 semiannual reporting periods of the Fund (or for the life of the Fund, if shorter). It assumes a $10,000 initial investment at the beginning of the first fiscal period in an appropriate, broad-based securities market index and other additional indexes, if applicable, for the same period and reflects the deduction of all sales charges, where applicable.
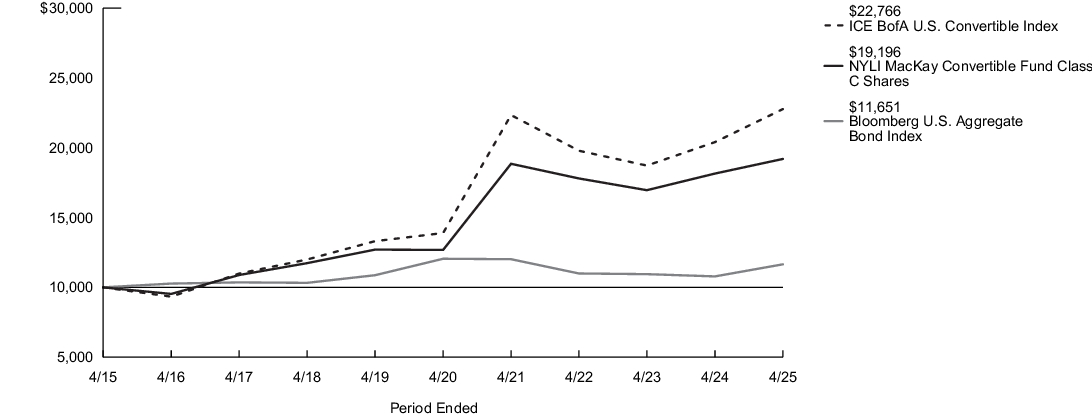
| Average Annual Total Returns for the Period Ended April 30, 2025 | Inception Date |
Six Months1 |
One Year |
Five Years |
Ten Years |
| Class C Shares - Including sales charges | 9/1/1998 | (2.11)% | 4.77% | 8.65% | 6.74% |
| Class C Shares - Excluding sales charges | (1.16)% | 5.77% | 8.65% | 6.74% | |
| Bloomberg U.S. Aggregate Bond Index2 | 2.57% | 8.02% | (0.67)% | 1.54% | |
| ICE BofA U.S. Convertible Index3 | 1.67% | 11.59% | 10.38% | 8.57% | |
| Morningstar Convertibles Category Average4 | 1.08% | 9.86% | 8.32% | 7.10% |
| 1. |
Not annualized. |
| 2. |
The Fund has selected the Bloomberg U.S. Aggregate Bond Index to represent a broad measure of market performance. The Bloomberg U.S. Aggregate Bond Index is a broad-based benchmark that measures the investment grade, U.S. dollar-denominated, fixed-rate taxable bond market, including Treasuries, government-related and corporate securities, mortgage-backed securities (agency fixed-rate and hybrid adjustable rate mortgage pass-throughs), asset-backed securities and commercial mortgage-backed securities. |
| 3. |
The ICE BofA U.S. Convertible Index, which is generally representative of the market sectors or types of investments in which the Fund invests, is a market-capitalization weighted index of domestic corporate convertible securities. In order to be included in the ICE BofA U.S. Convertible Index, bonds and preferred stocks must be convertible only to common stock. |
| 4. |
The Morningstar Convertibles Category Average is representative of funds that are designed to offer some of the capital-appreciation potential of stock funds while also supplying some of the safety and yield of bond funds. Results are based on average total returns of similar funds with all dividends and capital gain distributions reinvested. |
Key Fund Statistics
| Fund's net assets | $1,453,869,493 |
| Total number of portfolio holdings | 105 |
| Portfolio turnover rate | 17% |
Graphical Representation of Holdings
The tables below show the investment makeup of the Fund; percentages indicated are based on the Fund's net assets.
Top Ten Holdings and/or Issuers*
| NRG Energy, Inc., 2.75%, due 6/1/48 | 2.6% |
| Lantheus Holdings, Inc., 2.625%, due 12/15/27 | 2.4% |
| Merit Medical Systems, Inc., 3.00%, due 2/1/29 | 2.1% |
| Tetra Tech, Inc., 2.25%, due 8/15/28 | 2.0% |
| Post Holdings, Inc., 2.50%, due 8/15/27 | 1.9% |
| Southwest Airlines Co., 1.25%, due 5/1/25 | 1.9% |
| Integer Holdings Corp., 1.875%, due 3/15/30 | 1.9% |
| Booking Holdings, Inc., 0.75%, due 5/1/25 | 1.8% |
| PG&E Corp., 4.25%, due 12/1/27 | 1.8% |
| Welltower OP LLC, 3.125%, due 7/15/29 | 1.6% |
| * Excluding short-term investments |
Portfolio Composition
| Convertible Bonds | 86.9% |
| Convertible Preferred Stocks | 8.4% |
| Short-Term Investments | 3.7% |
| Common Stock | 0.5% |
| Other Assets, Less Liabilities | 0.5% |
Top Ten Holdings and/or Issuers*
| NRG Energy, Inc., 2.75%, due 6/1/48 | 2.6% |
| Lantheus Holdings, Inc., 2.625%, due 12/15/27 | 2.4% |
| Merit Medical Systems, Inc., 3.00%, due 2/1/29 | 2.1% |
| Tetra Tech, Inc., 2.25%, due 8/15/28 | 2.0% |
| Post Holdings, Inc., 2.50%, due 8/15/27 | 1.9% |
| Southwest Airlines Co., 1.25%, due 5/1/25 | 1.9% |
| Integer Holdings Corp., 1.875%, due 3/15/30 | 1.9% |
| Booking Holdings, Inc., 0.75%, due 5/1/25 | 1.8% |
| PG&E Corp., 4.25%, due 12/1/27 | 1.8% |
| Welltower OP LLC, 3.125%, due 7/15/29 | 1.6% |
| * Excluding short-term investments |
What were the Fund costs for the last six months?
(Based on a hypothetical $10,000 investment)
| Share Class Name | Costs of a $10,000 investment | Costs paid as a percentage of a $10,000 investment1,2 |
| Class I | $30 | 0.61% |
| 1. | Reflects fee waivers and/or expense reimbursements, without which expenses would have been higher. |
| 2. | Annualized. |
Fund Performance
The following graph compares the initial and subsequent account values at the end of each of the most recently completed 10 semiannual reporting periods of the Fund (or for the life of the Fund, if shorter). It assumes a $10,000 initial investment at the beginning of the first fiscal period in an appropriate, broad-based securities market index and other additional indexes, if applicable, for the same period and reflects the deduction of all sales charges, where applicable.
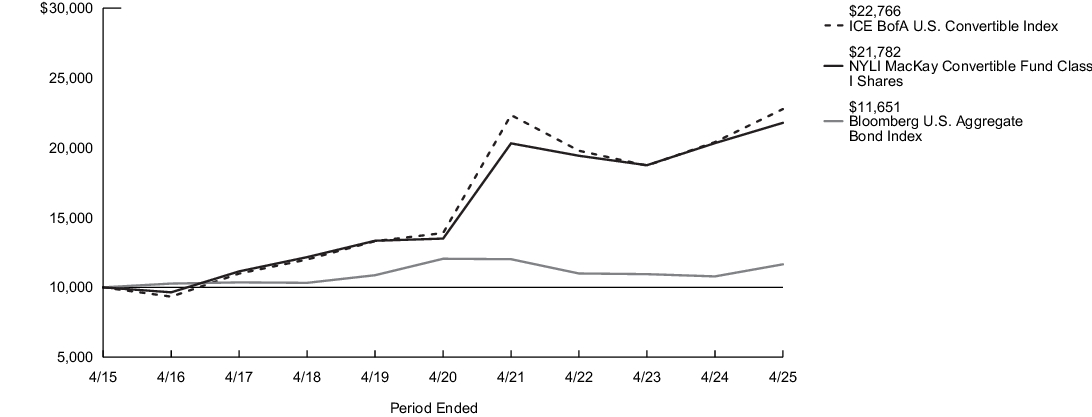
| Average Annual Total Returns for the Period Ended April 30, 2025 | Inception Date |
Six Months1 |
One Year |
Five Years |
Ten Years |
| Class I Shares | 11/28/2008 | (0.50)% | 7.14% | 10.05% | 8.10% |
| Bloomberg U.S. Aggregate Bond Index2 | 2.57% | 8.02% | (0.67)% | 1.54% | |
| ICE BofA U.S. Convertible Index3 | 1.67% | 11.59% | 10.38% | 8.57% | |
| Morningstar Convertibles Category Average4 | 1.08% | 9.86% | 8.32% | 7.10% |
| 1. |
Not annualized. |
| 2. |
The Fund has selected the Bloomberg U.S. Aggregate Bond Index to represent a broad measure of market performance. The Bloomberg U.S. Aggregate Bond Index is a broad-based benchmark that measures the investment grade, U.S. dollar-denominated, fixed-rate taxable bond market, including Treasuries, government-related and corporate securities, mortgage-backed securities (agency fixed-rate and hybrid adjustable rate mortgage pass-throughs), asset-backed securities and commercial mortgage-backed securities. |
| 3. |
The ICE BofA U.S. Convertible Index, which is generally representative of the market sectors or types of investments in which the Fund invests, is a market-capitalization weighted index of domestic corporate convertible securities. In order to be included in the ICE BofA U.S. Convertible Index, bonds and preferred stocks must be convertible only to common stock. |
| 4. |
The Morningstar Convertibles Category Average is representative of funds that are designed to offer some of the capital-appreciation potential of stock funds while also supplying some of the safety and yield of bond funds. Results are based on average total returns of similar funds with all dividends and capital gain distributions reinvested. |
Key Fund Statistics
| Fund's net assets | $1,453,869,493 |
| Total number of portfolio holdings | 105 |
| Portfolio turnover rate | 17% |
Graphical Representation of Holdings
The tables below show the investment makeup of the Fund; percentages indicated are based on the Fund's net assets.
Top Ten Holdings and/or Issuers*
| NRG Energy, Inc., 2.75%, due 6/1/48 | 2.6% |
| Lantheus Holdings, Inc., 2.625%, due 12/15/27 | 2.4% |
| Merit Medical Systems, Inc., 3.00%, due 2/1/29 | 2.1% |
| Tetra Tech, Inc., 2.25%, due 8/15/28 | 2.0% |
| Post Holdings, Inc., 2.50%, due 8/15/27 | 1.9% |
| Southwest Airlines Co., 1.25%, due 5/1/25 | 1.9% |
| Integer Holdings Corp., 1.875%, due 3/15/30 | 1.9% |
| Booking Holdings, Inc., 0.75%, due 5/1/25 | 1.8% |
| PG&E Corp., 4.25%, due 12/1/27 | 1.8% |
| Welltower OP LLC, 3.125%, due 7/15/29 | 1.6% |
| * Excluding short-term investments |
Portfolio Composition
| Convertible Bonds | 86.9% |
| Convertible Preferred Stocks | 8.4% |
| Short-Term Investments | 3.7% |
| Common Stock | 0.5% |
| Other Assets, Less Liabilities | 0.5% |
Top Ten Holdings and/or Issuers*
| NRG Energy, Inc., 2.75%, due 6/1/48 | 2.6% |
| Lantheus Holdings, Inc., 2.625%, due 12/15/27 | 2.4% |
| Merit Medical Systems, Inc., 3.00%, due 2/1/29 | 2.1% |
| Tetra Tech, Inc., 2.25%, due 8/15/28 | 2.0% |
| Post Holdings, Inc., 2.50%, due 8/15/27 | 1.9% |
| Southwest Airlines Co., 1.25%, due 5/1/25 | 1.9% |
| Integer Holdings Corp., 1.875%, due 3/15/30 | 1.9% |
| Booking Holdings, Inc., 0.75%, due 5/1/25 | 1.8% |
| PG&E Corp., 4.25%, due 12/1/27 | 1.8% |
| Welltower OP LLC, 3.125%, due 7/15/29 | 1.6% |
| * Excluding short-term investments |
What were the Fund costs for the last six months?
(Based on a hypothetical $10,000 investment)
| Share Class Name | Costs of a $10,000 investment | Costs paid as a percentage of a $10,000 investment1 |
| Investor Class | $58 | 1.18% |
| 1. | Annualized. |
Fund Performance
The following graph compares the initial and subsequent account values at the end of each of the most recently completed 10 semiannual reporting periods of the Fund (or for the life of the Fund, if shorter). It assumes a $10,000 initial investment at the beginning of the first fiscal period in an appropriate, broad-based securities market index and other additional indexes, if applicable, for the same period and reflects the deduction of all sales charges, where applicable.
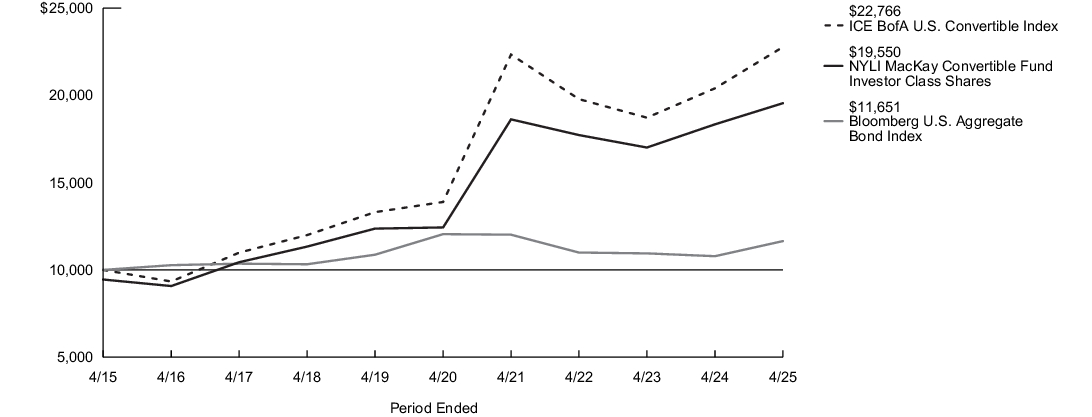
| Average Annual Total Returns for the Period Ended April 30, 2025 | Inception Date |
Six Months1 |
One Year |
Five Years |
Ten Years |
| Investor Class Shares - Including sales charges | 2/28/2008 | (5.70)% | 1.27% | 8.24% | 6.93% |
| Investor Class Shares - Excluding sales charges | (0.74)% | 6.60% | 9.47% | 7.54% | |
| Bloomberg U.S. Aggregate Bond Index2 | 2.57% | 8.02% | (0.67)% | 1.54% | |
| ICE BofA U.S. Convertible Index3 | 1.67% | 11.59% | 10.38% | 8.57% | |
| Morningstar Convertibles Category Average4 | 1.08% | 9.86% | 8.32% | 7.10% |
| 1. |
Not annualized. |
| 2. |
The Fund has selected the Bloomberg U.S. Aggregate Bond Index to represent a broad measure of market performance. The Bloomberg U.S. Aggregate Bond Index is a broad-based benchmark that measures the investment grade, U.S. dollar-denominated, fixed-rate taxable bond market, including Treasuries, government-related and corporate securities, mortgage-backed securities (agency fixed-rate and hybrid adjustable rate mortgage pass-throughs), asset-backed securities and commercial mortgage-backed securities. |
| 3. |
The ICE BofA U.S. Convertible Index, which is generally representative of the market sectors or types of investments in which the Fund invests, is a market-capitalization weighted index of domestic corporate convertible securities. In order to be included in the ICE BofA U.S. Convertible Index, bonds and preferred stocks must be convertible only to common stock. |
| 4. |
The Morningstar Convertibles Category Average is representative of funds that are designed to offer some of the capital-appreciation potential of stock funds while also supplying some of the safety and yield of bond funds. Results are based on average total returns of similar funds with all dividends and capital gain distributions reinvested. |
Key Fund Statistics
| Fund's net assets | $1,453,869,493 |
| Total number of portfolio holdings | 105 |
| Portfolio turnover rate | 17% |
Graphical Representation of Holdings
The tables below show the investment makeup of the Fund; percentages indicated are based on the Fund's net assets.
Top Ten Holdings and/or Issuers*
| NRG Energy, Inc., 2.75%, due 6/1/48 | 2.6% |
| Lantheus Holdings, Inc., 2.625%, due 12/15/27 | 2.4% |
| Merit Medical Systems, Inc., 3.00%, due 2/1/29 | 2.1% |
| Tetra Tech, Inc., 2.25%, due 8/15/28 | 2.0% |
| Post Holdings, Inc., 2.50%, due 8/15/27 | 1.9% |
| Southwest Airlines Co., 1.25%, due 5/1/25 | 1.9% |
| Integer Holdings Corp., 1.875%, due 3/15/30 | 1.9% |
| Booking Holdings, Inc., 0.75%, due 5/1/25 | 1.8% |
| PG&E Corp., 4.25%, due 12/1/27 | 1.8% |
| Welltower OP LLC, 3.125%, due 7/15/29 | 1.6% |
| * Excluding short-term investments |
Portfolio Composition
| Convertible Bonds | 86.9% |
| Convertible Preferred Stocks | 8.4% |
| Short-Term Investments | 3.7% |
| Common Stock | 0.5% |
| Other Assets, Less Liabilities | 0.5% |
Top Ten Holdings and/or Issuers*
| NRG Energy, Inc., 2.75%, due 6/1/48 | 2.6% |
| Lantheus Holdings, Inc., 2.625%, due 12/15/27 | 2.4% |
| Merit Medical Systems, Inc., 3.00%, due 2/1/29 | 2.1% |
| Tetra Tech, Inc., 2.25%, due 8/15/28 | 2.0% |
| Post Holdings, Inc., 2.50%, due 8/15/27 | 1.9% |
| Southwest Airlines Co., 1.25%, due 5/1/25 | 1.9% |
| Integer Holdings Corp., 1.875%, due 3/15/30 | 1.9% |
| Booking Holdings, Inc., 0.75%, due 5/1/25 | 1.8% |
| PG&E Corp., 4.25%, due 12/1/27 | 1.8% |
| Welltower OP LLC, 3.125%, due 7/15/29 | 1.6% |
| * Excluding short-term investments |
What were the Fund costs for the last six months?
(Based on a hypothetical $10,000 investment)
| Share Class Name | Costs of a $10,000 investment | Costs paid as a percentage of a $10,000 investment1 |
| Class A | $51 | 1.02% |
| 1. | Annualized. |
Fund Performance
The following graph compares the initial and subsequent account values at the end of each of the most recently completed 10 semiannual reporting periods of the Fund (or for the life of the Fund, if shorter). It assumes a $15,000 initial investment at the beginning of the first fiscal period in an appropriate, broad-based securities market index and other additional indexes, if applicable, for the same period and reflects the deduction of all sales charges, where applicable.
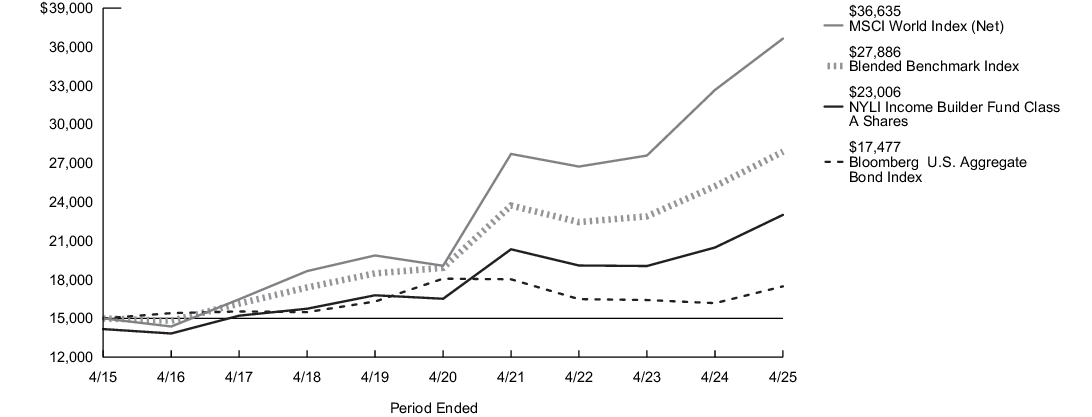
| Average Annual Total Returns for the Period Ended April 30, 2025 | Inception Date |
Six Months1 |
One Year |
Five Years |
Ten Years |
| Class A Shares - Including sales charges | 1/3/1995 | (1.99)% | 8.96% | 6.20% | 4.37% |
| Class A Shares - Excluding sales charges | 1.05% | 12.33% | 6.85% | 4.96% | |
| MSCI World Index (Net)2 | 0.93% | 12.16% | 13.95% | 9.34% | |
| Bloomberg U.S. Aggregate Bond Index3 | 2.57% | 8.02% | (0.67)% | 1.54% | |
| Blended Benchmark Index4 | 1.64% | 10.56% | 8.08% | 6.40% | |
| Morningstar Global Moderate Allocation Category Average5 | (1.07)% | 8.64% | 7.97% | 4.90% |
| 1. |
Not annualized. |
| 2. |
The Fund has selected the MSCI World Index (Net) to represent a broad measure of market performance. The MSCI World Index (Net) is a free float-adjusted market capitalization weighted index that is designed to measure the equity market performance of developed markets. |
| 3. |
The Bloomberg U.S. Aggregate Bond Index is a broad-based benchmark that measures performance of the investment-grade, U.S. dollar-denominated, fixed-rate taxable bond market, including Treasuries, government-related and corporate securities, mortgage-backed securities (agency fixed-rate and hybrid adjustable-rate mortgage pass-throughs), asset-backed securities and commercial mortgage-backed securities. |
| 4. |
The Blended Benchmark Index is comprised of the MSCI World Index (Net) and the Bloomberg U.S. Aggregate Bond Index weighted 60%/40%. |
| 5. |
Morningstar Global Moderate Allocation Category Average funds seek to provide both income and capital appreciation by primarily investing in multiple asset classes, including stocks, bonds, and cash. These moderate strategies seek to balance preservation of capital with appreciation. They typically expect volatility similar to a strategic equity exposure between 50% and 70%. Results are based on average total returns of similar funds with all dividends and capital gain distributions reinvested. |
Key Fund Statistics
| Fund's net assets | $1,001,362,966 |
| Total number of portfolio holdings | 561 |
| Portfolio turnover rate | 19% |
Graphical Representation of Holdings
The tables below show the investment makeup of the Fund; percentages indicated are based on the Fund's net assets.
Top Ten Holdings and/or Issuers*
| GNMA, (zero coupon)-7.764%, due 7/20/44-2/16/66 | 3.1% |
| UMBS, 30 Year, 2.00%-6.50%, due 8/1/48-9/1/54 | 2.0% |
| Broadcom, Inc. | 1.4% |
| Microsoft Corp. | 1.4% |
| Connecticut Avenue Securities Trust, 6.053%-14.204%, due 11/25/39-2/25/45 | 1.4% |
| AbbVie, Inc. | 1.3% |
| International Business Machines Corp. | 1.3% |
| FHLMC STACR REMIC Trust, 6.004%-11.454%, due 9/25/41-1/25/50 | 1.3% |
| Cisco Systems, Inc. | 1.2% |
| Philip Morris International, Inc. | 1.2% |
| * Excluding short-term investments |
Portfolio Composition
| Common Stocks | 62.0% |
| Mortgage-Backed Securities | 13.2% |
| Corporate Bonds | 12.3% |
| U.S. Government & Federal Agencies | 4.5% |
| Asset-Backed Securities | 3.6% |
| Short-Term Investments | 2.4% |
| Foreign Government Bonds | 0.6% |
| Loan Assignments | 0.4% |
| Other Assets, Less Liabilities | 1.0% |
Top Ten Holdings and/or Issuers*
| GNMA, (zero coupon)-7.764%, due 7/20/44-2/16/66 | 3.1% |
| UMBS, 30 Year, 2.00%-6.50%, due 8/1/48-9/1/54 | 2.0% |
| Broadcom, Inc. | 1.4% |
| Microsoft Corp. | 1.4% |
| Connecticut Avenue Securities Trust, 6.053%-14.204%, due 11/25/39-2/25/45 | 1.4% |
| AbbVie, Inc. | 1.3% |
| International Business Machines Corp. | 1.3% |
| FHLMC STACR REMIC Trust, 6.004%-11.454%, due 9/25/41-1/25/50 | 1.3% |
| Cisco Systems, Inc. | 1.2% |
| Philip Morris International, Inc. | 1.2% |
| * Excluding short-term investments |
What were the Fund costs for the last six months?
(Based on a hypothetical $10,000 investment)
| Share Class Name | Costs of a $10,000 investment | Costs paid as a percentage of a $10,000 investment1,2 |
| Class C | $101 | 2.03% |
| 1. | Reflects fee waivers and/or expense reimbursements, without which expenses would have been higher. |
| 2. | Annualized. |
Fund Performance
The following graph compares the initial and subsequent account values at the end of each of the most recently completed 10 semiannual reporting periods of the Fund (or for the life of the Fund, if shorter). It assumes a $10,000 initial investment at the beginning of the first fiscal period in an appropriate, broad-based securities market index and other additional indexes, if applicable, for the same period and reflects the deduction of all sales charges, where applicable.
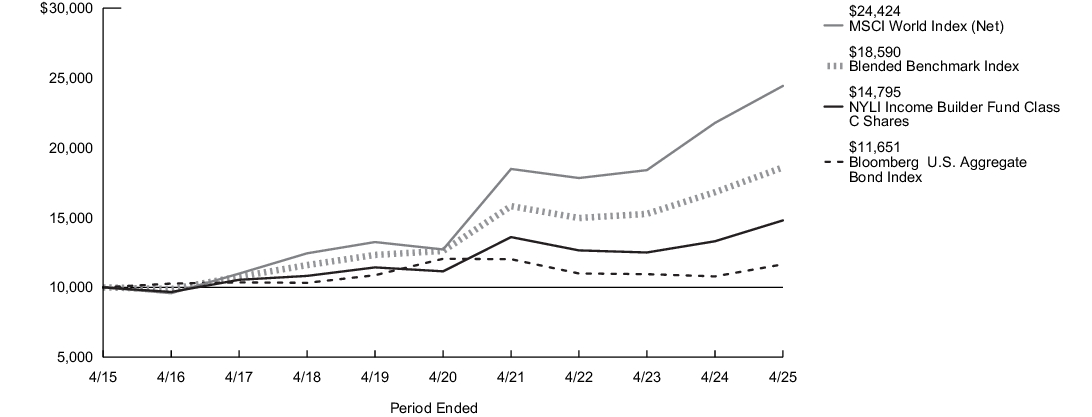
| Average Annual Total Returns for the Period Ended April 30, 2025 | Inception Date |
Six Months1 |
One Year |
Five Years |
Ten Years |
| Class C Shares - Including sales charges | 9/1/1998 | (0.44)% | 10.23% | 5.82% | 3.99% |
| Class C Shares - Excluding sales charges | 0.56% | 11.23% | 5.82% | 3.99% | |
| MSCI World Index (Net)2 | 0.93% | 12.16% | 13.95% | 9.34% | |
| Bloomberg U.S. Aggregate Bond Index3 | 2.57% | 8.02% | (0.67)% | 1.54% | |
| Blended Benchmark Index4 | 1.64% | 10.56% | 8.08% | 6.40% | |
| Morningstar Global Moderate Allocation Category Average5 | (1.07)% | 8.64% | 7.97% | 4.90% |
| 1. |
Not annualized. |
| 2. |
The Fund has selected the MSCI World Index (Net) to represent a broad measure of market performance. The MSCI World Index (Net) is a free float-adjusted market capitalization weighted index that is designed to measure the equity market performance of developed markets. |
| 3. |
The Bloomberg U.S. Aggregate Bond Index is a broad-based benchmark that measures performance of the investment-grade, U.S. dollar-denominated, fixed-rate taxable bond market, including Treasuries, government-related and corporate securities, mortgage-backed securities (agency fixed-rate and hybrid adjustable-rate mortgage pass-throughs), asset-backed securities and commercial mortgage-backed securities. |
| 4. |
The Blended Benchmark Index is comprised of the MSCI World Index (Net) and the Bloomberg U.S. Aggregate Bond Index weighted 60%/40%. |
| 5. |
Morningstar Global Moderate Allocation Category Average funds seek to provide both income and capital appreciation by primarily investing in multiple asset classes, including stocks, bonds, and cash. These moderate strategies seek to balance preservation of capital with appreciation. They typically expect volatility similar to a strategic equity exposure between 50% and 70%. Results are based on average total returns of similar funds with all dividends and capital gain distributions reinvested. |
Key Fund Statistics
| Fund's net assets | $1,001,362,966 |
| Total number of portfolio holdings | 561 |
| Portfolio turnover rate | 19% |
Graphical Representation of Holdings
The tables below show the investment makeup of the Fund; percentages indicated are based on the Fund's net assets.
Top Ten Holdings and/or Issuers*
| GNMA, (zero coupon)-7.764%, due 7/20/44-2/16/66 | 3.1% |
| UMBS, 30 Year, 2.00%-6.50%, due 8/1/48-9/1/54 | 2.0% |
| Broadcom, Inc. | 1.4% |
| Microsoft Corp. | 1.4% |
| Connecticut Avenue Securities Trust, 6.053%-14.204%, due 11/25/39-2/25/45 | 1.4% |
| AbbVie, Inc. | 1.3% |
| International Business Machines Corp. | 1.3% |
| FHLMC STACR REMIC Trust, 6.004%-11.454%, due 9/25/41-1/25/50 | 1.3% |
| Cisco Systems, Inc. | 1.2% |
| Philip Morris International, Inc. | 1.2% |
| * Excluding short-term investments |
Portfolio Composition
| Common Stocks | 62.0% |
| Mortgage-Backed Securities | 13.2% |
| Corporate Bonds | 12.3% |
| U.S. Government & Federal Agencies | 4.5% |
| Asset-Backed Securities | 3.6% |
| Short-Term Investments | 2.4% |
| Foreign Government Bonds | 0.6% |
| Loan Assignments | 0.4% |
| Other Assets, Less Liabilities | 1.0% |
Top Ten Holdings and/or Issuers*
| GNMA, (zero coupon)-7.764%, due 7/20/44-2/16/66 | 3.1% |
| UMBS, 30 Year, 2.00%-6.50%, due 8/1/48-9/1/54 | 2.0% |
| Broadcom, Inc. | 1.4% |
| Microsoft Corp. | 1.4% |
| Connecticut Avenue Securities Trust, 6.053%-14.204%, due 11/25/39-2/25/45 | 1.4% |
| AbbVie, Inc. | 1.3% |
| International Business Machines Corp. | 1.3% |
| FHLMC STACR REMIC Trust, 6.004%-11.454%, due 9/25/41-1/25/50 | 1.3% |
| Cisco Systems, Inc. | 1.2% |
| Philip Morris International, Inc. | 1.2% |
| * Excluding short-term investments |
What were the Fund costs for the last six months?
(Based on a hypothetical $10,000 investment)
| Share Class Name | Costs of a $10,000 investment | Costs paid as a percentage of a $10,000 investment1 |
| Class I | $38 | 0.77% |
| 1. | Annualized. |
Fund Performance
The following graph compares the initial and subsequent account values at the end of each of the most recently completed 10 semiannual reporting periods of the Fund (or for the life of the Fund, if shorter). It assumes a $10,000 initial investment at the beginning of the first fiscal period in an appropriate, broad-based securities market index and other additional indexes, if applicable, for the same period and reflects the deduction of all sales charges, where applicable.
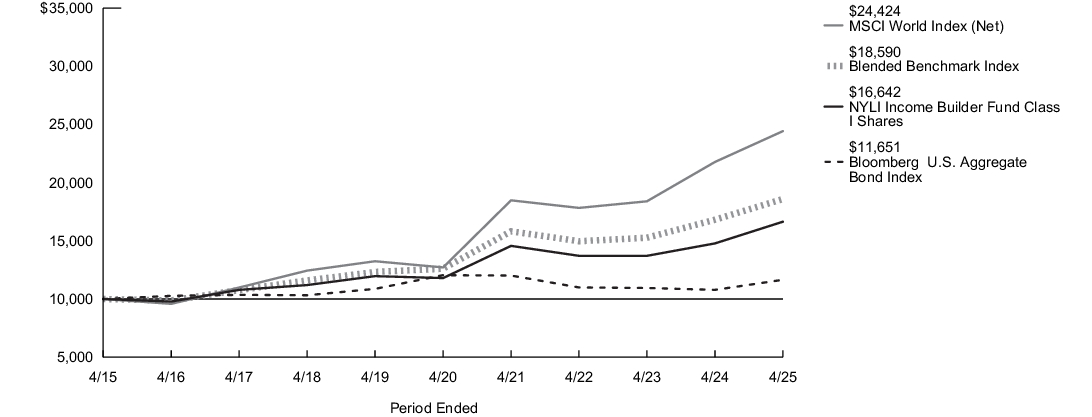
| Average Annual Total Returns for the Period Ended April 30, 2025 | Inception Date |
Six Months1 |
One Year |
Five Years |
Ten Years |
| Class I Shares | 1/2/2004 | 1.21% | 12.61% | 7.12% | 5.23% |
| MSCI World Index (Net)2 | 0.93% | 12.16% | 13.95% | 9.34% | |
| Bloomberg U.S. Aggregate Bond Index3 | 2.57% | 8.02% | (0.67)% | 1.54% | |
| Blended Benchmark Index4 | 1.64% | 10.56% | 8.08% | 6.40% | |
| Morningstar Global Moderate Allocation Category Average5 | (1.07)% | 8.64% | 7.97% | 4.90% |
| 1. |
Not annualized. |
| 2. |
The Fund has selected the MSCI World Index (Net) to represent a broad measure of market performance. The MSCI World Index (Net) is a free float-adjusted market capitalization weighted index that is designed to measure the equity market performance of developed markets. |
| 3. |
The Bloomberg U.S. Aggregate Bond Index is a broad-based benchmark that measures performance of the investment-grade, U.S. dollar-denominated, fixed-rate taxable bond market, including Treasuries, government-related and corporate securities, mortgage-backed securities (agency fixed-rate and hybrid adjustable-rate mortgage pass-throughs), asset-backed securities and commercial mortgage-backed securities. |
| 4. |
The Blended Benchmark Index is comprised of the MSCI World Index (Net) and the Bloomberg U.S. Aggregate Bond Index weighted 60%/40%. |
| 5. |
Morningstar Global Moderate Allocation Category Average funds seek to provide both income and capital appreciation by primarily investing in multiple asset classes, including stocks, bonds, and cash. These moderate strategies seek to balance preservation of capital with appreciation. They typically expect volatility similar to a strategic equity exposure between 50% and 70%. Results are based on average total returns of similar funds with all dividends and capital gain distributions reinvested. |
Key Fund Statistics
| Fund's net assets | $1,001,362,966 |
| Total number of portfolio holdings | 561 |
| Portfolio turnover rate | 19% |
Graphical Representation of Holdings
The tables below show the investment makeup of the Fund; percentages indicated are based on the Fund's net assets.
Top Ten Holdings and/or Issuers*
| GNMA, (zero coupon)-7.764%, due 7/20/44-2/16/66 | 3.1% |
| UMBS, 30 Year, 2.00%-6.50%, due 8/1/48-9/1/54 | 2.0% |
| Broadcom, Inc. | 1.4% |
| Microsoft Corp. | 1.4% |
| Connecticut Avenue Securities Trust, 6.053%-14.204%, due 11/25/39-2/25/45 | 1.4% |
| AbbVie, Inc. | 1.3% |
| International Business Machines Corp. | 1.3% |
| FHLMC STACR REMIC Trust, 6.004%-11.454%, due 9/25/41-1/25/50 | 1.3% |
| Cisco Systems, Inc. | 1.2% |
| Philip Morris International, Inc. | 1.2% |
| * Excluding short-term investments |
Portfolio Composition
| Common Stocks | 62.0% |
| Mortgage-Backed Securities | 13.2% |
| Corporate Bonds | 12.3% |
| U.S. Government & Federal Agencies | 4.5% |
| Asset-Backed Securities | 3.6% |
| Short-Term Investments | 2.4% |
| Foreign Government Bonds | 0.6% |
| Loan Assignments | 0.4% |
| Other Assets, Less Liabilities | 1.0% |
Top Ten Holdings and/or Issuers*
| GNMA, (zero coupon)-7.764%, due 7/20/44-2/16/66 | 3.1% |
| UMBS, 30 Year, 2.00%-6.50%, due 8/1/48-9/1/54 | 2.0% |
| Broadcom, Inc. | 1.4% |
| Microsoft Corp. | 1.4% |
| Connecticut Avenue Securities Trust, 6.053%-14.204%, due 11/25/39-2/25/45 | 1.4% |
| AbbVie, Inc. | 1.3% |
| International Business Machines Corp. | 1.3% |
| FHLMC STACR REMIC Trust, 6.004%-11.454%, due 9/25/41-1/25/50 | 1.3% |
| Cisco Systems, Inc. | 1.2% |
| Philip Morris International, Inc. | 1.2% |
| * Excluding short-term investments |
What were the Fund costs for the last six months?
(Based on a hypothetical $10,000 investment)
| Share Class Name | Costs of a $10,000 investment | Costs paid as a percentage of a $10,000 investment1 |
| Class R6 | $34 | 0.68% |
| 1. | Annualized. |
Fund Performance
The following graph compares the initial and subsequent account values at the end of each of the most recently completed 10 semiannual reporting periods of the Fund (or for the life of the Fund, if shorter). It assumes a $10,000 initial investment at the beginning of the first fiscal period in an appropriate, broad-based securities market index and other additional indexes, if applicable, for the same period and reflects the deduction of all sales charges, where applicable.
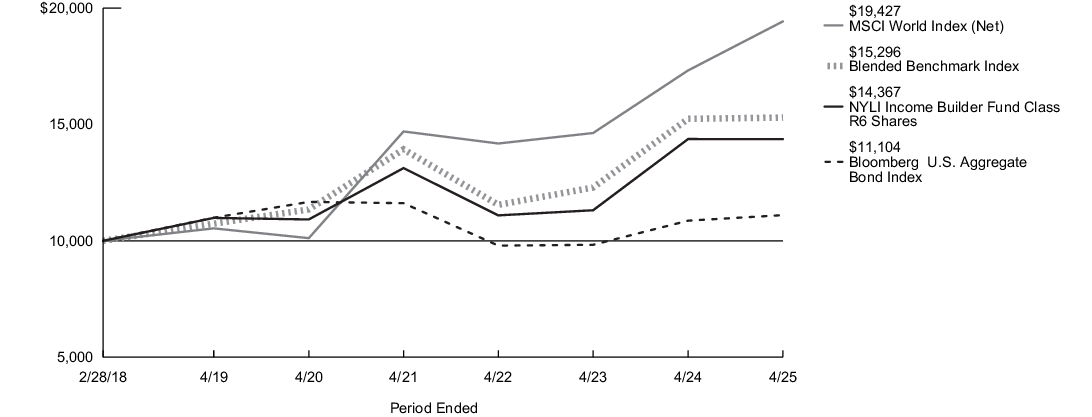
| Average Annual Total Returns for the Period Ended April 30, 2025 | Inception Date |
Six Months1 |
One Year |
Five Years |
Since Inception |
| Class R6 Shares | 2/28/2018 | 1.20% | 12.64% | 7.21% | 5.76% |
| MSCI World Index (Net)2 | 0.93% | 12.16% | 13.95% | 9.71% | |
| Bloomberg U.S. Aggregate Bond Index3 | 2.57% | 8.02% | (0.67)% | 1.69% | |
| Blended Benchmark Index4 | 1.64% | 10.56% | 8.08% | 6.71% | |
| Morningstar Global Moderate Allocation Category Average5 | (1.07)% | 8.64% | 7.97% | 5.21% |
| 1. |
Not annualized. |
| 2. |
The Fund has selected the MSCI World Index (Net) to represent a broad measure of market performance. The MSCI World Index (Net) is a free float-adjusted market capitalization weighted index that is designed to measure the equity market performance of developed markets. |
| 3. |
The Bloomberg U.S. Aggregate Bond Index is a broad-based benchmark that measures performance of the investment-grade, U.S. dollar-denominated, fixed-rate taxable bond market, including Treasuries, government-related and corporate securities, mortgage-backed securities (agency fixed-rate and hybrid adjustable-rate mortgage pass-throughs), asset-backed securities and commercial mortgage-backed securities. |
| 4. |
The Blended Benchmark Index is comprised of the MSCI World Index (Net) and the Bloomberg U.S. Aggregate Bond Index weighted 60%/40%. |
| 5. |
Morningstar Global Moderate Allocation Category Average funds seek to provide both income and capital appreciation by primarily investing in multiple asset classes, including stocks, bonds, and cash. These moderate strategies seek to balance preservation of capital with appreciation. They typically expect volatility similar to a strategic equity exposure between 50% and 70%. Results are based on average total returns of similar funds with all dividends and capital gain distributions reinvested. |
Key Fund Statistics
| Fund's net assets | $1,001,362,966 |
| Total number of portfolio holdings | 561 |
| Portfolio turnover rate | 19% |
Graphical Representation of Holdings
The tables below show the investment makeup of the Fund; percentages indicated are based on the Fund's net assets.
Top Ten Holdings and/or Issuers*
| GNMA, (zero coupon)-7.764%, due 7/20/44-2/16/66 | 3.1% |
| UMBS, 30 Year, 2.00%-6.50%, due 8/1/48-9/1/54 | 2.0% |
| Broadcom, Inc. | 1.4% |
| Microsoft Corp. | 1.4% |
| Connecticut Avenue Securities Trust, 6.053%-14.204%, due 11/25/39-2/25/45 | 1.4% |
| AbbVie, Inc. | 1.3% |
| International Business Machines Corp. | 1.3% |
| FHLMC STACR REMIC Trust, 6.004%-11.454%, due 9/25/41-1/25/50 | 1.3% |
| Cisco Systems, Inc. | 1.2% |
| Philip Morris International, Inc. | 1.2% |
| * Excluding short-term investments |
Portfolio Composition
| Common Stocks | 62.0% |
| Mortgage-Backed Securities | 13.2% |
| Corporate Bonds | 12.3% |
| U.S. Government & Federal Agencies | 4.5% |
| Asset-Backed Securities | 3.6% |
| Short-Term Investments | 2.4% |
| Foreign Government Bonds | 0.6% |
| Loan Assignments | 0.4% |
| Other Assets, Less Liabilities | 1.0% |
Top Ten Holdings and/or Issuers*
| GNMA, (zero coupon)-7.764%, due 7/20/44-2/16/66 | 3.1% |
| UMBS, 30 Year, 2.00%-6.50%, due 8/1/48-9/1/54 | 2.0% |
| Broadcom, Inc. | 1.4% |
| Microsoft Corp. | 1.4% |
| Connecticut Avenue Securities Trust, 6.053%-14.204%, due 11/25/39-2/25/45 | 1.4% |
| AbbVie, Inc. | 1.3% |
| International Business Machines Corp. | 1.3% |
| FHLMC STACR REMIC Trust, 6.004%-11.454%, due 9/25/41-1/25/50 | 1.3% |
| Cisco Systems, Inc. | 1.2% |
| Philip Morris International, Inc. | 1.2% |
| * Excluding short-term investments |
What were the Fund costs for the last six months?
(Based on a hypothetical $10,000 investment)
| Share Class Name | Costs of a $10,000 investment | Costs paid as a percentage of a $10,000 investment1,2 |
| Investor Class | $64 | 1.28% |
| 1. | Reflects fee waivers and/or expense reimbursements, without which expenses would have been higher. |
| 2. | Annualized. |
Fund Performance
The following graph compares the initial and subsequent account values at the end of each of the most recently completed 10 semiannual reporting periods of the Fund (or for the life of the Fund, if shorter). It assumes a $10,000 initial investment at the beginning of the first fiscal period in an appropriate, broad-based securities market index and other additional indexes, if applicable, for the same period and reflects the deduction of all sales charges, where applicable.
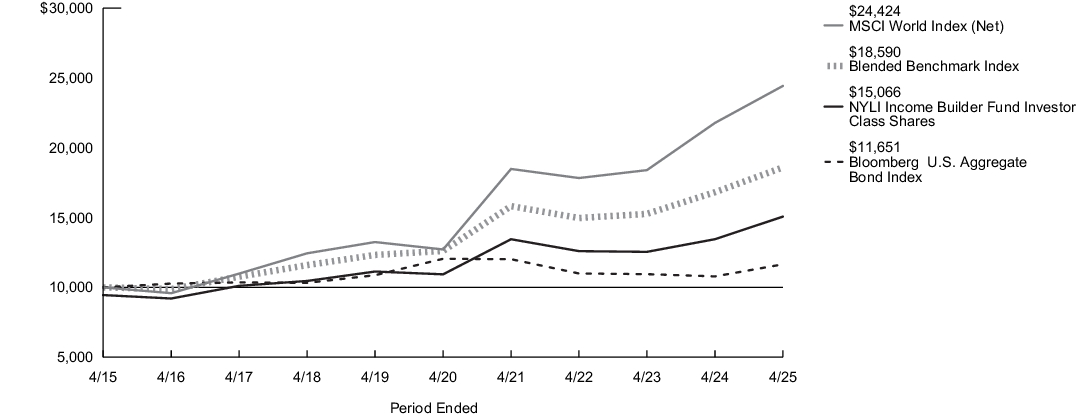
| Average Annual Total Returns for the Period Ended April 30, 2025 | Inception Date |
Six Months1 |
One Year |
Five Years |
Ten Years |
| Investor Class Shares - Including sales charges | 2/28/2008 | (1.61)% | 9.22% | 5.97% | 4.18% |
| Investor Class Shares - Excluding sales charges | 0.91% | 12.02% | 6.62% | 4.77% | |
| MSCI World Index (Net)2 | 0.93% | 12.16% | 13.95% | 9.34% | |
| Bloomberg U.S. Aggregate Bond Index3 | 2.57% | 8.02% | (0.67)% | 1.54% | |
| Blended Benchmark Index4 | 1.64% | 10.56% | 8.08% | 6.40% | |
| Morningstar Global Moderate Allocation Category Average5 | (1.07)% | 8.64% | 7.97% | 4.90% |
| 1. |
Not annualized. |
| 2. |
The Fund has selected the MSCI World Index (Net) to represent a broad measure of market performance. The MSCI World Index (Net) is a free float-adjusted market capitalization weighted index that is designed to measure the equity market performance of developed markets. |
| 3. |
The Bloomberg U.S. Aggregate Bond Index is a broad-based benchmark that measures performance of the investment-grade, U.S. dollar-denominated, fixed-rate taxable bond market, including Treasuries, government-related and corporate securities, mortgage-backed securities (agency fixed-rate and hybrid adjustable-rate mortgage pass-throughs), asset-backed securities and commercial mortgage-backed securities. |
| 4. |
The Blended Benchmark Index is comprised of the MSCI World Index (Net) and the Bloomberg U.S. Aggregate Bond Index weighted 60%/40%. |
| 5. |
Morningstar Global Moderate Allocation Category Average funds seek to provide both income and capital appreciation by primarily investing in multiple asset classes, including stocks, bonds, and cash. These moderate strategies seek to balance preservation of capital with appreciation. They typically expect volatility similar to a strategic equity exposure between 50% and 70%. Results are based on average total returns of similar funds with all dividends and capital gain distributions reinvested. |
Key Fund Statistics
| Fund's net assets | $1,001,362,966 |
| Total number of portfolio holdings | 561 |
| Portfolio turnover rate | 19% |
Graphical Representation of Holdings
The tables below show the investment makeup of the Fund; percentages indicated are based on the Fund's net assets.
Top Ten Holdings and/or Issuers*
| GNMA, (zero coupon)-7.764%, due 7/20/44-2/16/66 | 3.1% |
| UMBS, 30 Year, 2.00%-6.50%, due 8/1/48-9/1/54 | 2.0% |
| Broadcom, Inc. | 1.4% |
| Microsoft Corp. | 1.4% |
| Connecticut Avenue Securities Trust, 6.053%-14.204%, due 11/25/39-2/25/45 | 1.4% |
| AbbVie, Inc. | 1.3% |
| International Business Machines Corp. | 1.3% |
| FHLMC STACR REMIC Trust, 6.004%-11.454%, due 9/25/41-1/25/50 | 1.3% |
| Cisco Systems, Inc. | 1.2% |
| Philip Morris International, Inc. | 1.2% |
| * Excluding short-term investments |
Portfolio Composition
| Common Stocks | 62.0% |
| Mortgage-Backed Securities | 13.2% |
| Corporate Bonds | 12.3% |
| U.S. Government & Federal Agencies | 4.5% |
| Asset-Backed Securities | 3.6% |
| Short-Term Investments | 2.4% |
| Foreign Government Bonds | 0.6% |
| Loan Assignments | 0.4% |
| Other Assets, Less Liabilities | 1.0% |
Top Ten Holdings and/or Issuers*
| GNMA, (zero coupon)-7.764%, due 7/20/44-2/16/66 | 3.1% |
| UMBS, 30 Year, 2.00%-6.50%, due 8/1/48-9/1/54 | 2.0% |
| Broadcom, Inc. | 1.4% |
| Microsoft Corp. | 1.4% |
| Connecticut Avenue Securities Trust, 6.053%-14.204%, due 11/25/39-2/25/45 | 1.4% |
| AbbVie, Inc. | 1.3% |
| International Business Machines Corp. | 1.3% |
| FHLMC STACR REMIC Trust, 6.004%-11.454%, due 9/25/41-1/25/50 | 1.3% |
| Cisco Systems, Inc. | 1.2% |
| Philip Morris International, Inc. | 1.2% |
| * Excluding short-term investments |
What were the Fund costs for the last six months?
(Based on a hypothetical $10,000 investment)
| Share Class Name | Costs of a $10,000 investment | Costs paid as a percentage of a $10,000 investment1 |
| SIMPLE Class | $63 | 1.26% |
| 1. | Annualized. |
Fund Performance
The following graph compares the initial and subsequent account values at the end of each of the most recently completed 10 semiannual reporting periods of the Fund (or for the life of the Fund, if shorter). It assumes a $10,000 initial investment at the beginning of the first fiscal period in an appropriate, broad-based securities market index and other additional indexes, if applicable, for the same period and reflects the deduction of all sales charges, where applicable.
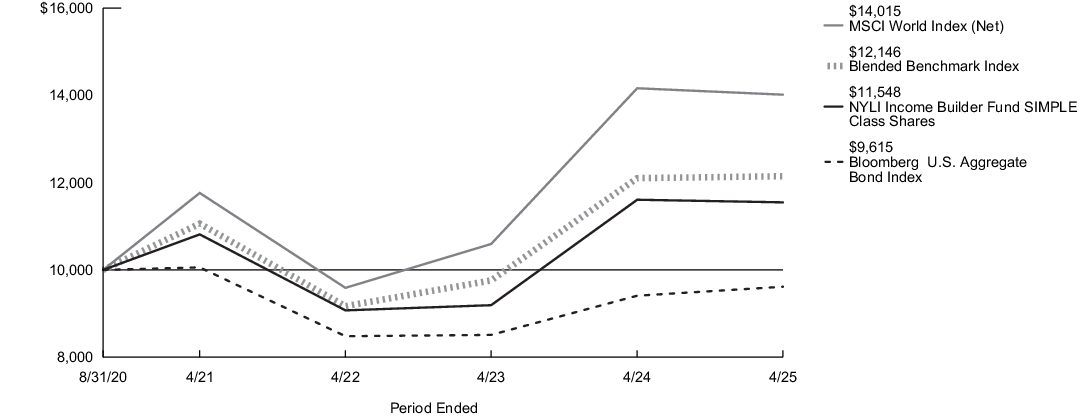
| Average Annual Total Returns for the Period Ended April 30, 2025 | Inception Date |
Six Months1 |
One Year |
Since Inception |
| SIMPLE Class Shares | 8/31/2020 | 0.97% | 12.02% | 4.88% |
| MSCI World Index (Net)2 | 0.93% | 12.16% | 10.55% | |
| Bloomberg U.S. Aggregate Bond Index3 | 2.57% | 8.02% | (1.09)% | |
| Blended Benchmark Index4 | 1.64% | 10.56% | 5.94% | |
| Morningstar Global Moderate Allocation Category Average5 | (1.07)% | 8.64% | 5.83% |
| 1. |
Not annualized. |
| 2. |
The Fund has selected the MSCI World Index (Net) to represent a broad measure of market performance. The MSCI World Index (Net) is a free float-adjusted market capitalization weighted index that is designed to measure the equity market performance of developed markets. |
| 3. |
The Bloomberg U.S. Aggregate Bond Index is a broad-based benchmark that measures performance of the investment-grade, U.S. dollar-denominated, fixed-rate taxable bond market, including Treasuries, government-related and corporate securities, mortgage-backed securities (agency fixed-rate and hybrid adjustable-rate mortgage pass-throughs), asset-backed securities and commercial mortgage-backed securities. |
| 4. |
The Blended Benchmark Index is comprised of the MSCI World Index (Net) and the Bloomberg U.S. Aggregate Bond Index weighted 60%/40%. |
| 5. |
Morningstar Global Moderate Allocation Category Average funds seek to provide both income and capital appreciation by primarily investing in multiple asset classes, including stocks, bonds, and cash. These moderate strategies seek to balance preservation of capital with appreciation. They typically expect volatility similar to a strategic equity exposure between 50% and 70%. Results are based on average total returns of similar funds with all dividends and capital gain distributions reinvested. |
Key Fund Statistics
| Fund's net assets | $1,001,362,966 |
| Total number of portfolio holdings | 561 |
| Portfolio turnover rate | 19% |
Graphical Representation of Holdings
The tables below show the investment makeup of the Fund; percentages indicated are based on the Fund's net assets.
Top Ten Holdings and/or Issuers*
| GNMA, (zero coupon)-7.764%, due 7/20/44-2/16/66 | 3.1% |
| UMBS, 30 Year, 2.00%-6.50%, due 8/1/48-9/1/54 | 2.0% |
| Broadcom, Inc. | 1.4% |
| Microsoft Corp. | 1.4% |
| Connecticut Avenue Securities Trust, 6.053%-14.204%, due 11/25/39-2/25/45 | 1.4% |
| AbbVie, Inc. | 1.3% |
| International Business Machines Corp. | 1.3% |
| FHLMC STACR REMIC Trust, 6.004%-11.454%, due 9/25/41-1/25/50 | 1.3% |
| Cisco Systems, Inc. | 1.2% |
| Philip Morris International, Inc. | 1.2% |
| * Excluding short-term investments |
Portfolio Composition
| Common Stocks | 62.0% |
| Mortgage-Backed Securities | 13.2% |
| Corporate Bonds | 12.3% |
| U.S. Government & Federal Agencies | 4.5% |
| Asset-Backed Securities | 3.6% |
| Short-Term Investments | 2.4% |
| Foreign Government Bonds | 0.6% |
| Loan Assignments | 0.4% |
| Other Assets, Less Liabilities | 1.0% |
Top Ten Holdings and/or Issuers*
| GNMA, (zero coupon)-7.764%, due 7/20/44-2/16/66 | 3.1% |
| UMBS, 30 Year, 2.00%-6.50%, due 8/1/48-9/1/54 | 2.0% |
| Broadcom, Inc. | 1.4% |
| Microsoft Corp. | 1.4% |
| Connecticut Avenue Securities Trust, 6.053%-14.204%, due 11/25/39-2/25/45 | 1.4% |
| AbbVie, Inc. | 1.3% |
| International Business Machines Corp. | 1.3% |
| FHLMC STACR REMIC Trust, 6.004%-11.454%, due 9/25/41-1/25/50 | 1.3% |
| Cisco Systems, Inc. | 1.2% |
| Philip Morris International, Inc. | 1.2% |
| * Excluding short-term investments |
What were the Fund costs for the last six months?
(Based on a hypothetical $10,000 investment)
| Share Class Name | Costs of a $10,000 investment | Costs paid as a percentage of a $10,000 investment1,2 |
| Class A | $57 | 1.15% |
| 1. | Reflects fee waivers and/or expense reimbursements, without which expenses would have been higher. |
| 2. | Annualized. |
Fund Performance
The following graph compares the initial and subsequent account values at the end of each of the most recently completed 10 semiannual reporting periods of the Fund (or for the life of the Fund, if shorter). It assumes a $15,000 initial investment at the beginning of the first fiscal period in an appropriate, broad-based securities market index and other additional indexes, if applicable, for the same period and reflects the deduction of all sales charges, where applicable. Effective February 28, 2017, the Fund's principal investment strategies changed. Effective June 21, 2019, the Fund's subadvisor, investment objective and principal investment strategies changed. The performance in the graph and table prior to those dates reflects the Fund’s prior subadvisor, investment objective and principal investment strategies.
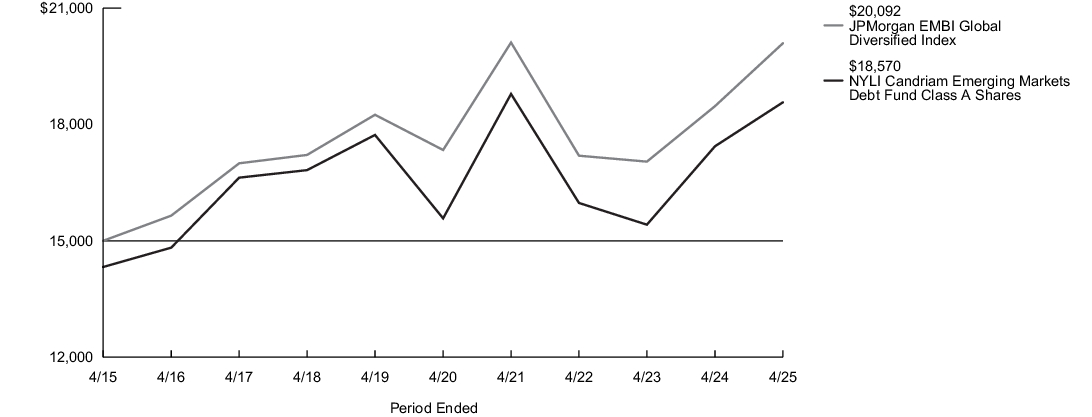
| Average Annual Total Returns for the Period Ended April 30, 2025 | Inception Date |
Six Months1 |
One Year |
Five Years |
Ten Years |
| Class A Shares - Including sales charges | 6/1/1998 | (4.23)% | 1.71% | 2.63% | 2.16% |
| Class A Shares - Excluding sales charges | 0.29% | 6.50% | 3.58% | 2.63% | |
| JPMorgan EMBI Global Diversified Index2 | 1.79% | 8.77% | 2.99% | 2.97% | |
| Morningstar Emerging Markets Bond Category Average3 | 1.94% | 8.43% | 3.97% | 2.82% |
| 1. |
Not annualized. |
| 2. |
The Fund has selected the JPMorgan EMBI Global Diversified Index to represent a broad measure of market performance. The JPMorgan EMBI Global Diversified Index is a market-capitalization weighted, total return index tracking the traded market for U.S. dollar-denominated Brady Bonds, Eurobonds, traded loans and local market debt instruments issued by sovereign and quasi-sovereign entities. |
| 3. |
The Morningstar Emerging Markets Bond Category Average is representative of funds that invest more than 65% of their assets in foreign bonds from developing countries. The largest portion of the emerging-markets bond market comes from Latin America, followed by Eastern Europe. Africa, the Middle East, and Asia make up the rest. Results are based on average total returns of similar funds with all dividends and capital gain distributions reinvested. |
Key Fund Statistics
| Fund's net assets | $128,391,878 |
| Total number of portfolio holdings | 141 |
| Portfolio turnover rate | 46% |
Graphical Representation of Holdings
The tables below show the investment makeup of the Fund; percentages indicated are based on the Fund's net assets.
Top Ten Holdings and/or Issuers*
| Brazil Government Bond, 3.875%-7.125%, due 6/12/30-5/13/54 | 5.7% |
| Colombia Government Bond, 5.00%-8.75%, due 4/20/33-11/14/53 | 5.1% |
| Mexico Government Bond, 3.50%-6.00%, due 5/19/33-10/12/2110 | 4.7% |
| Dominican Republic Government Bond, 4.875%-7.05%, due 2/22/29-1/30/60 | 4.4% |
| Hungary Government Bond, 2.125%-7.625%, due 6/16/29-3/29/41 | 4.3% |
| Poland Government Bond, 5.375%-5.50%, due 2/12/35-3/18/54 | 3.7% |
| Turkey Government Bond, 4.875%-5.75%, due 3/13/30-5/11/47 | 3.1% |
| Egypt Government Bond, 7.625%-8.875%, due 5/29/32-5/29/50 | 3.1% |
| Argentina Government Bond, 0.75%-3.50%, due 7/9/29-7/9/41 | 2.9% |
| Oman Government Bond, 6.00%-6.75%, due 8/1/29-1/17/48 | 2.8% |
| * Excluding short-term investments |
Top Countries
| Colombia | 6.8% |
| Brazil | 5.7% |
| Turkey | 5.3% |
| Hungary | 5.0% |
| Poland | 5.0% |
| Mexico | 4.7% |
| Dominican Republic | 4.4% |
| Egypt | 3.1% |
| United States | 3.0% |
| Argentina | 2.9% |
Top Ten Holdings and/or Issuers*
| Brazil Government Bond, 3.875%-7.125%, due 6/12/30-5/13/54 | 5.7% |
| Colombia Government Bond, 5.00%-8.75%, due 4/20/33-11/14/53 | 5.1% |
| Mexico Government Bond, 3.50%-6.00%, due 5/19/33-10/12/2110 | 4.7% |
| Dominican Republic Government Bond, 4.875%-7.05%, due 2/22/29-1/30/60 | 4.4% |
| Hungary Government Bond, 2.125%-7.625%, due 6/16/29-3/29/41 | 4.3% |
| Poland Government Bond, 5.375%-5.50%, due 2/12/35-3/18/54 | 3.7% |
| Turkey Government Bond, 4.875%-5.75%, due 3/13/30-5/11/47 | 3.1% |
| Egypt Government Bond, 7.625%-8.875%, due 5/29/32-5/29/50 | 3.1% |
| Argentina Government Bond, 0.75%-3.50%, due 7/9/29-7/9/41 | 2.9% |
| Oman Government Bond, 6.00%-6.75%, due 8/1/29-1/17/48 | 2.8% |
| * Excluding short-term investments |
What were the Fund costs for the last six months?
(Based on a hypothetical $10,000 investment)
| Share Class Name | Costs of a $10,000 investment | Costs paid as a percentage of a $10,000 investment1,2 |
| Class C | $114 | 2.29% |
| 1. | Reflects fee waivers and/or expense reimbursements, without which expenses would have been higher. |
| 2. | Annualized. |
Fund Performance
The following graph compares the initial and subsequent account values at the end of each of the most recently completed 10 semiannual reporting periods of the Fund (or for the life of the Fund, if shorter). It assumes a $10,000 initial investment at the beginning of the first fiscal period in an appropriate, broad-based securities market index and other additional indexes, if applicable, for the same period and reflects the deduction of all sales charges, where applicable. Effective February 28, 2017, the Fund's principal investment strategies changed. Effective June 21, 2019, the Fund's subadvisor, investment objective and principal investment strategies changed. The performance in the graph and table prior to those dates reflects the Fund’s prior subadvisor, investment objective and principal investment strategies.
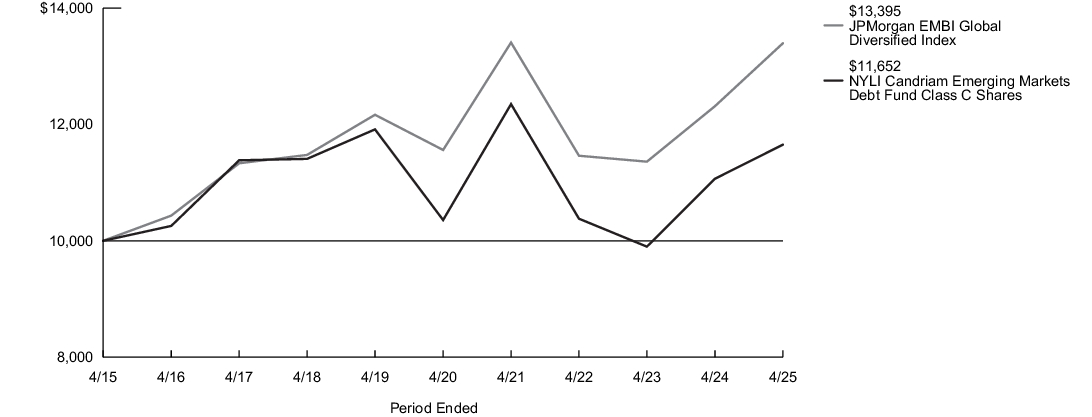
| Average Annual Total Returns for the Period Ended April 30, 2025 | Inception Date |
Six Months1 |
One Year |
Five Years |
Ten Years |
| Class C Shares - Including sales charges | 9/1/1998 | (1.11)% | 4.29% | 2.38% | 1.54% |
| Class C Shares - Excluding sales charges | (0.15)% | 5.28% | 2.38% | 1.54% | |
| JPMorgan EMBI Global Diversified Index2 | 1.79% | 8.77% | 2.99% | 2.97% | |
| Morningstar Emerging Markets Bond Category Average3 | 1.94% | 8.43% | 3.97% | 2.82% |
| 1. |
Not annualized. |
| 2. |
The Fund has selected the JPMorgan EMBI Global Diversified Index to represent a broad measure of market performance. The JPMorgan EMBI Global Diversified Index is a market-capitalization weighted, total return index tracking the traded market for U.S. dollar-denominated Brady Bonds, Eurobonds, traded loans and local market debt instruments issued by sovereign and quasi-sovereign entities. |
| 3. |
The Morningstar Emerging Markets Bond Category Average is representative of funds that invest more than 65% of their assets in foreign bonds from developing countries. The largest portion of the emerging-markets bond market comes from Latin America, followed by Eastern Europe. Africa, the Middle East, and Asia make up the rest. Results are based on average total returns of similar funds with all dividends and capital gain distributions reinvested. |
Key Fund Statistics
| Fund's net assets | $128,391,878 |
| Total number of portfolio holdings | 141 |
| Portfolio turnover rate | 46% |
Graphical Representation of Holdings
The tables below show the investment makeup of the Fund; percentages indicated are based on the Fund's net assets.
Top Ten Holdings and/or Issuers*
| Brazil Government Bond, 3.875%-7.125%, due 6/12/30-5/13/54 | 5.7% |
| Colombia Government Bond, 5.00%-8.75%, due 4/20/33-11/14/53 | 5.1% |
| Mexico Government Bond, 3.50%-6.00%, due 5/19/33-10/12/2110 | 4.7% |
| Dominican Republic Government Bond, 4.875%-7.05%, due 2/22/29-1/30/60 | 4.4% |
| Hungary Government Bond, 2.125%-7.625%, due 6/16/29-3/29/41 | 4.3% |
| Poland Government Bond, 5.375%-5.50%, due 2/12/35-3/18/54 | 3.7% |
| Turkey Government Bond, 4.875%-5.75%, due 3/13/30-5/11/47 | 3.1% |
| Egypt Government Bond, 7.625%-8.875%, due 5/29/32-5/29/50 | 3.1% |
| Argentina Government Bond, 0.75%-3.50%, due 7/9/29-7/9/41 | 2.9% |
| Oman Government Bond, 6.00%-6.75%, due 8/1/29-1/17/48 | 2.8% |
| * Excluding short-term investments |
Top Countries
| Colombia | 6.8% |
| Brazil | 5.7% |
| Turkey | 5.3% |
| Hungary | 5.0% |
| Poland | 5.0% |
| Mexico | 4.7% |
| Dominican Republic | 4.4% |
| Egypt | 3.1% |
| United States | 3.0% |
| Argentina | 2.9% |
Top Ten Holdings and/or Issuers*
| Brazil Government Bond, 3.875%-7.125%, due 6/12/30-5/13/54 | 5.7% |
| Colombia Government Bond, 5.00%-8.75%, due 4/20/33-11/14/53 | 5.1% |
| Mexico Government Bond, 3.50%-6.00%, due 5/19/33-10/12/2110 | 4.7% |
| Dominican Republic Government Bond, 4.875%-7.05%, due 2/22/29-1/30/60 | 4.4% |
| Hungary Government Bond, 2.125%-7.625%, due 6/16/29-3/29/41 | 4.3% |
| Poland Government Bond, 5.375%-5.50%, due 2/12/35-3/18/54 | 3.7% |
| Turkey Government Bond, 4.875%-5.75%, due 3/13/30-5/11/47 | 3.1% |
| Egypt Government Bond, 7.625%-8.875%, due 5/29/32-5/29/50 | 3.1% |
| Argentina Government Bond, 0.75%-3.50%, due 7/9/29-7/9/41 | 2.9% |
| Oman Government Bond, 6.00%-6.75%, due 8/1/29-1/17/48 | 2.8% |
| * Excluding short-term investments |
What were the Fund costs for the last six months?
(Based on a hypothetical $10,000 investment)
| Share Class Name | Costs of a $10,000 investment | Costs paid as a percentage of a $10,000 investment1,2 |
| Class I | $42 | 0.85% |
| 1. | Reflects fee waivers and/or expense reimbursements, without which expenses would have been higher. |
| 2. | Annualized. |
Fund Performance
The following graph compares the initial and subsequent account values at the end of each of the most recently completed 10 semiannual reporting periods of the Fund (or for the life of the Fund, if shorter). It assumes a $10,000 initial investment at the beginning of the first fiscal period in an appropriate, broad-based securities market index and other additional indexes, if applicable, for the same period and reflects the deduction of all sales charges, where applicable. Effective February 28, 2017, the Fund's principal investment strategies changed. Effective June 21, 2019, the Fund's subadvisor, investment objective and principal investment strategies changed. The performance in the graph and table prior to those dates reflects the Fund’s prior subadvisor, investment objective and principal investment strategies.
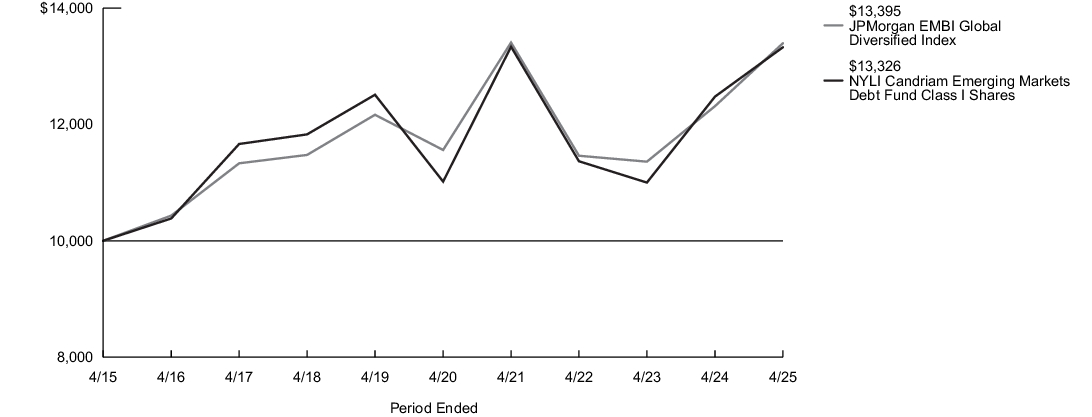
| Average Annual Total Returns for the Period Ended April 30, 2025 | Inception Date |
Six Months1 |
One Year |
Five Years |
Ten Years |
| Class I Shares | 8/31/2007 | 0.43% | 6.80% | 3.88% | 2.91% |
| JPMorgan EMBI Global Diversified Index2 | 1.79% | 8.77% | 2.99% | 2.97% | |
| Morningstar Emerging Markets Bond Category Average3 | 1.94% | 8.43% | 3.97% | 2.82% |
| 1. |
Not annualized. |
| 2. |
The Fund has selected the JPMorgan EMBI Global Diversified Index to represent a broad measure of market performance. The JPMorgan EMBI Global Diversified Index is a market-capitalization weighted, total return index tracking the traded market for U.S. dollar-denominated Brady Bonds, Eurobonds, traded loans and local market debt instruments issued by sovereign and quasi-sovereign entities. |
| 3. |
The Morningstar Emerging Markets Bond Category Average is representative of funds that invest more than 65% of their assets in foreign bonds from developing countries. The largest portion of the emerging-markets bond market comes from Latin America, followed by Eastern Europe. Africa, the Middle East, and Asia make up the rest. Results are based on average total returns of similar funds with all dividends and capital gain distributions reinvested. |
Key Fund Statistics
| Fund's net assets | $128,391,878 |
| Total number of portfolio holdings | 141 |
| Portfolio turnover rate | 46% |
Graphical Representation of Holdings
The tables below show the investment makeup of the Fund; percentages indicated are based on the Fund's net assets.
Top Ten Holdings and/or Issuers*
| Brazil Government Bond, 3.875%-7.125%, due 6/12/30-5/13/54 | 5.7% |
| Colombia Government Bond, 5.00%-8.75%, due 4/20/33-11/14/53 | 5.1% |
| Mexico Government Bond, 3.50%-6.00%, due 5/19/33-10/12/2110 | 4.7% |
| Dominican Republic Government Bond, 4.875%-7.05%, due 2/22/29-1/30/60 | 4.4% |
| Hungary Government Bond, 2.125%-7.625%, due 6/16/29-3/29/41 | 4.3% |
| Poland Government Bond, 5.375%-5.50%, due 2/12/35-3/18/54 | 3.7% |
| Turkey Government Bond, 4.875%-5.75%, due 3/13/30-5/11/47 | 3.1% |
| Egypt Government Bond, 7.625%-8.875%, due 5/29/32-5/29/50 | 3.1% |
| Argentina Government Bond, 0.75%-3.50%, due 7/9/29-7/9/41 | 2.9% |
| Oman Government Bond, 6.00%-6.75%, due 8/1/29-1/17/48 | 2.8% |
| * Excluding short-term investments |
Top Countries
| Colombia | 6.8% |
| Brazil | 5.7% |
| Turkey | 5.3% |
| Hungary | 5.0% |
| Poland | 5.0% |
| Mexico | 4.7% |
| Dominican Republic | 4.4% |
| Egypt | 3.1% |
| United States | 3.0% |
| Argentina | 2.9% |
Top Ten Holdings and/or Issuers*
| Brazil Government Bond, 3.875%-7.125%, due 6/12/30-5/13/54 | 5.7% |
| Colombia Government Bond, 5.00%-8.75%, due 4/20/33-11/14/53 | 5.1% |
| Mexico Government Bond, 3.50%-6.00%, due 5/19/33-10/12/2110 | 4.7% |
| Dominican Republic Government Bond, 4.875%-7.05%, due 2/22/29-1/30/60 | 4.4% |
| Hungary Government Bond, 2.125%-7.625%, due 6/16/29-3/29/41 | 4.3% |
| Poland Government Bond, 5.375%-5.50%, due 2/12/35-3/18/54 | 3.7% |
| Turkey Government Bond, 4.875%-5.75%, due 3/13/30-5/11/47 | 3.1% |
| Egypt Government Bond, 7.625%-8.875%, due 5/29/32-5/29/50 | 3.1% |
| Argentina Government Bond, 0.75%-3.50%, due 7/9/29-7/9/41 | 2.9% |
| Oman Government Bond, 6.00%-6.75%, due 8/1/29-1/17/48 | 2.8% |
| * Excluding short-term investments |
What were the Fund costs for the last six months?
(Based on a hypothetical $10,000 investment)
| Share Class Name | Costs of a $10,000 investment | Costs paid as a percentage of a $10,000 investment1,2 |
| Investor Class | $76 | 1.54% |
| 1. | Reflects fee waivers and/or expense reimbursements, without which expenses would have been higher. |
| 2. | Annualized. |
Fund Performance
The following graph compares the initial and subsequent account values at the end of each of the most recently completed 10 semiannual reporting periods of the Fund (or for the life of the Fund, if shorter). It assumes a $10,000 initial investment at the beginning of the first fiscal period in an appropriate, broad-based securities market index and other additional indexes, if applicable, for the same period and reflects the deduction of all sales charges, where applicable. Effective February 28, 2017, the Fund's principal investment strategies changed. Effective June 21, 2019, the Fund's subadvisor, investment objective and principal investment strategies changed. The performance in the graph and table prior to those dates reflects the Fund’s prior subadvisor, investment objective and principal investment strategies.
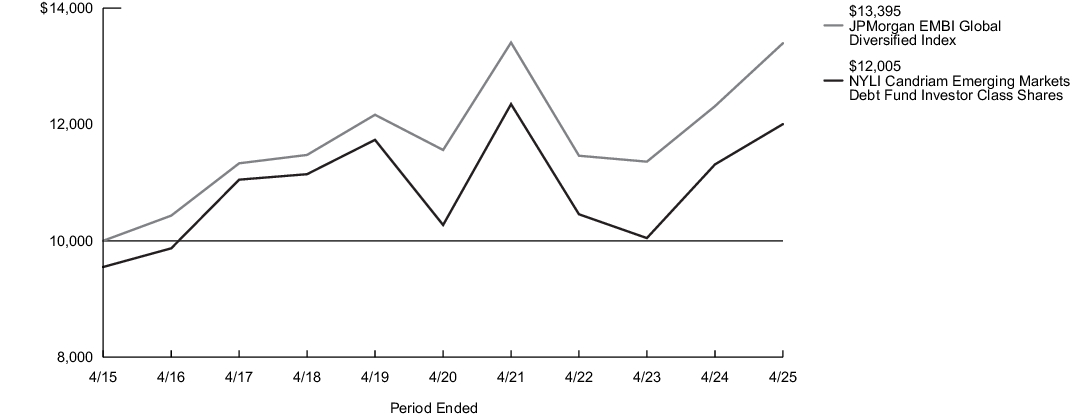
| Average Annual Total Returns for the Period Ended April 30, 2025 | Inception Date |
Six Months1 |
One Year |
Five Years |
Ten Years |
| Investor Class Shares - Including sales charges | 2/28/2008 | (3.79)% | 1.87% | 2.22% | 1.84% |
| Investor Class Shares - Excluding sales charges | 0.21% | 6.11% | 3.17% | 2.31% | |
| JPMorgan EMBI Global Diversified Index2 | 1.79% | 8.77% | 2.99% | 2.97% | |
| Morningstar Emerging Markets Bond Category Average3 | 1.94% | 8.43% | 3.97% | 2.82% |
| 1. |
Not annualized. |
| 2. |
The Fund has selected the JPMorgan EMBI Global Diversified Index to represent a broad measure of market performance. The JPMorgan EMBI Global Diversified Index is a market-capitalization weighted, total return index tracking the traded market for U.S. dollar-denominated Brady Bonds, Eurobonds, traded loans and local market debt instruments issued by sovereign and quasi-sovereign entities. |
| 3. |
The Morningstar Emerging Markets Bond Category Average is representative of funds that invest more than 65% of their assets in foreign bonds from developing countries. The largest portion of the emerging-markets bond market comes from Latin America, followed by Eastern Europe. Africa, the Middle East, and Asia make up the rest. Results are based on average total returns of similar funds with all dividends and capital gain distributions reinvested. |
Key Fund Statistics
| Fund's net assets | $128,391,878 |
| Total number of portfolio holdings | 141 |
| Portfolio turnover rate | 46% |
Graphical Representation of Holdings
The tables below show the investment makeup of the Fund; percentages indicated are based on the Fund's net assets.
Top Ten Holdings and/or Issuers*
| Brazil Government Bond, 3.875%-7.125%, due 6/12/30-5/13/54 | 5.7% |
| Colombia Government Bond, 5.00%-8.75%, due 4/20/33-11/14/53 | 5.1% |
| Mexico Government Bond, 3.50%-6.00%, due 5/19/33-10/12/2110 | 4.7% |
| Dominican Republic Government Bond, 4.875%-7.05%, due 2/22/29-1/30/60 | 4.4% |
| Hungary Government Bond, 2.125%-7.625%, due 6/16/29-3/29/41 | 4.3% |
| Poland Government Bond, 5.375%-5.50%, due 2/12/35-3/18/54 | 3.7% |
| Turkey Government Bond, 4.875%-5.75%, due 3/13/30-5/11/47 | 3.1% |
| Egypt Government Bond, 7.625%-8.875%, due 5/29/32-5/29/50 | 3.1% |
| Argentina Government Bond, 0.75%-3.50%, due 7/9/29-7/9/41 | 2.9% |
| Oman Government Bond, 6.00%-6.75%, due 8/1/29-1/17/48 | 2.8% |
| * Excluding short-term investments |
Top Countries
| Colombia | 6.8% |
| Brazil | 5.7% |
| Turkey | 5.3% |
| Hungary | 5.0% |
| Poland | 5.0% |
| Mexico | 4.7% |
| Dominican Republic | 4.4% |
| Egypt | 3.1% |
| United States | 3.0% |
| Argentina | 2.9% |
Top Ten Holdings and/or Issuers*
| Brazil Government Bond, 3.875%-7.125%, due 6/12/30-5/13/54 | 5.7% |
| Colombia Government Bond, 5.00%-8.75%, due 4/20/33-11/14/53 | 5.1% |
| Mexico Government Bond, 3.50%-6.00%, due 5/19/33-10/12/2110 | 4.7% |
| Dominican Republic Government Bond, 4.875%-7.05%, due 2/22/29-1/30/60 | 4.4% |
| Hungary Government Bond, 2.125%-7.625%, due 6/16/29-3/29/41 | 4.3% |
| Poland Government Bond, 5.375%-5.50%, due 2/12/35-3/18/54 | 3.7% |
| Turkey Government Bond, 4.875%-5.75%, due 3/13/30-5/11/47 | 3.1% |
| Egypt Government Bond, 7.625%-8.875%, due 5/29/32-5/29/50 | 3.1% |
| Argentina Government Bond, 0.75%-3.50%, due 7/9/29-7/9/41 | 2.9% |
| Oman Government Bond, 6.00%-6.75%, due 8/1/29-1/17/48 | 2.8% |
| * Excluding short-term investments |
What were the Fund costs for the last six months?
(Based on a hypothetical $10,000 investment)
| Share Class Name | Costs of a $10,000 investment | Costs paid as a percentage of a $10,000 investment1 |
| Class A | $46 | 0.92% |
| 1. | Annualized. |
Fund Performance
The following graph compares the initial and subsequent account values at the end of each of the most recently completed 10 semiannual reporting periods of the Fund (or for the life of the Fund, if shorter). It assumes a $15,000 initial investment at the beginning of the first fiscal period in an appropriate, broad-based securities market index and other additional indexes, if applicable, for the same period and reflects the deduction of all sales charges, where applicable.
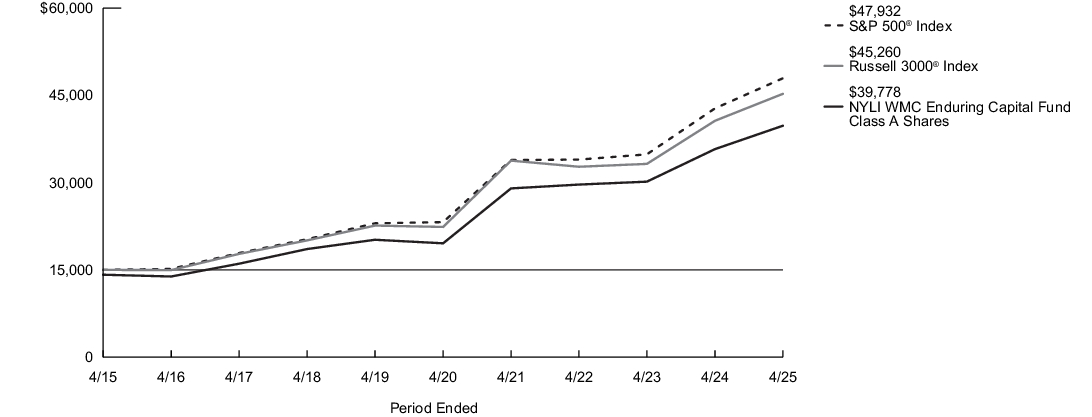
| Average Annual Total Returns for the Period Ended April 30, 2025 | Inception Date |
Six Months1 |
One Year |
Five Years |
Ten Years |
| Class A Shares - Including sales charges | 6/1/1998 | (3.38)% | 5.12% | 13.94% | 10.24% |
| Class A Shares - Excluding sales charges | 2.24% | 11.24% | 15.24% | 10.87% | |
| Russell 3000®Index2 | (2.15)% | 11.40% | 15.12% | 11.68% | |
| S&P 500®Index3 | (1.74)% | 12.10% | 15.61% | 12.32% | |
| Morningstar Large Blend Category Average4 | (2.35)% | 9.59% | 14.37% | 10.85% |
| 1. |
Not annualized. |
| 2. |
The Fund has selected the Russell 3000® Index to represent a broad measure of market performance. The Russell 3000® Index measures the performance of the largest 3,000 U.S. companies representing approximately 98% of the investable U.S. equity market. |
| 3. |
The S&P 500® Index, which represents a broad measure of market performance, is generally representative of the market sectors or types of investments in which the Fund invests. S&P® and S&P 500® are registered trademarks of Standard & Poor’s Financial Services LLC. The S&P 500® Index is widely regarded as the standard index for measuring large-cap U.S. stock market performance. |
| 4. |
The Morningstar Large Blend Category Average is representative of funds that represent the overall U.S. stock market in size, growth rates and price. Stocks in the top 70% of the capitalization of the U.S. equity market are defined as large cap. The blend style is assigned to funds where neither growth nor value characteristics predominate. These funds tend to invest across the spectrum of U.S. industries, and owing to their broad exposure, the funds' returns are often similar to those of the S&P 500® Index. Results are based on average total returns of similar funds with all dividends and capital gain distributions reinvested. |
Key Fund Statistics
| Fund's net assets | $516,187,803 |
| Total number of portfolio holdings | 34 |
| Portfolio turnover rate | 7% |
Graphical Representation of Holdings
The tables below show the investment makeup of the Fund; percentages indicated are based on the Fund's net assets.
Top Ten Holdings and/or Issuers*
| Constellation Software, Inc. | 9.2% |
| Progressive Corp. (The) | 6.7% |
| NVR, Inc. | 5.4% |
| Copart, Inc. | 4.9% |
| Markel Group, Inc. | 4.8% |
| Berkshire Hathaway, Inc., Class B | 4.3% |
| Linde plc | 4.1% |
| Cintas Corp. | 4.0% |
| PACCAR, Inc. | 3.8% |
| O'Reilly Automotive, Inc. | 3.8% |
| * Excluding short-term investments |
Top Industries
| Commercial Services & Supplies | 12.1% |
| Insurance | 11.5% |
| Software | 9.5% |
| Machinery | 7.6% |
| Chemicals | 7.4% |
| Electronic Equipment, Instruments & Components | 5.7% |
| Household Durables | 5.4% |
| Financial Services | 4.3% |
| Specialty Retail | 3.8% |
| Specialized REITs | 3.4% |
Top Ten Holdings and/or Issuers*
| Constellation Software, Inc. | 9.2% |
| Progressive Corp. (The) | 6.7% |
| NVR, Inc. | 5.4% |
| Copart, Inc. | 4.9% |
| Markel Group, Inc. | 4.8% |
| Berkshire Hathaway, Inc., Class B | 4.3% |
| Linde plc | 4.1% |
| Cintas Corp. | 4.0% |
| PACCAR, Inc. | 3.8% |
| O'Reilly Automotive, Inc. | 3.8% |
| * Excluding short-term investments |
What were the Fund costs for the last six months?
(Based on a hypothetical $10,000 investment)
| Share Class Name | Costs of a $10,000 investment | Costs paid as a percentage of a $10,000 investment1 |
| Class C | $95 | 1.90% |
| 1. | Annualized. |
Fund Performance
The following graph compares the initial and subsequent account values at the end of each of the most recently completed 10 semiannual reporting periods of the Fund (or for the life of the Fund, if shorter). It assumes a $10,000 initial investment at the beginning of the first fiscal period in an appropriate, broad-based securities market index and other additional indexes, if applicable, for the same period and reflects the deduction of all sales charges, where applicable.
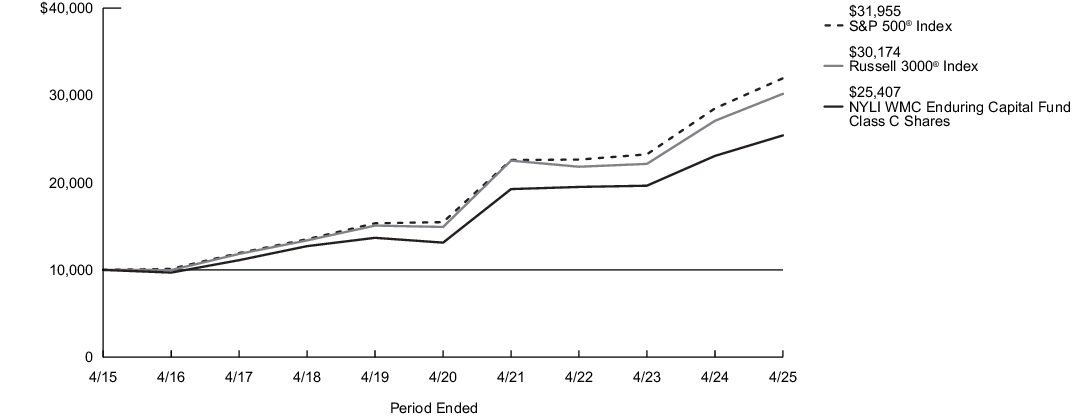
| Average Annual Total Returns for the Period Ended April 30, 2025 | Inception Date |
Six Months1 |
One Year |
Five Years |
Ten Years |
| Class C Shares - Including sales charges | 9/1/1998 | 0.73% | 9.17% | 14.12% | 9.77% |
| Class C Shares - Excluding sales charges | 1.73% | 10.17% | 14.12% | 9.77% | |
| Russell 3000®Index2 | (2.15)% | 11.40% | 15.12% | 11.68% | |
| S&P 500®Index3 | (1.74)% | 12.10% | 15.61% | 12.32% | |
| Morningstar Large Blend Category Average4 | (2.35)% | 9.59% | 14.37% | 10.85% |
| 1. |
Not annualized. |
| 2. |
The Fund has selected the Russell 3000® Index to represent a broad measure of market performance. The Russell 3000® Index measures the performance of the largest 3,000 U.S. companies representing approximately 98% of the investable U.S. equity market. |
| 3. |
The S&P 500® Index, which represents a broad measure of market performance, is generally representative of the market sectors or types of investments in which the Fund invests. S&P® and S&P 500® are registered trademarks of Standard & Poor’s Financial Services LLC. The S&P 500® Index is widely regarded as the standard index for measuring large-cap U.S. stock market performance. |
| 4. |
The Morningstar Large Blend Category Average is representative of funds that represent the overall U.S. stock market in size, growth rates and price. Stocks in the top 70% of the capitalization of the U.S. equity market are defined as large cap. The blend style is assigned to funds where neither growth nor value characteristics predominate. These funds tend to invest across the spectrum of U.S. industries, and owing to their broad exposure, the funds' returns are often similar to those of the S&P 500® Index. Results are based on average total returns of similar funds with all dividends and capital gain distributions reinvested. |
Key Fund Statistics
| Fund's net assets | $516,187,803 |
| Total number of portfolio holdings | 34 |
| Portfolio turnover rate | 7% |
Graphical Representation of Holdings
The tables below show the investment makeup of the Fund; percentages indicated are based on the Fund's net assets.
Top Ten Holdings and/or Issuers*
| Constellation Software, Inc. | 9.2% |
| Progressive Corp. (The) | 6.7% |
| NVR, Inc. | 5.4% |
| Copart, Inc. | 4.9% |
| Markel Group, Inc. | 4.8% |
| Berkshire Hathaway, Inc., Class B | 4.3% |
| Linde plc | 4.1% |
| Cintas Corp. | 4.0% |
| PACCAR, Inc. | 3.8% |
| O'Reilly Automotive, Inc. | 3.8% |
| * Excluding short-term investments |
Top Industries
| Commercial Services & Supplies | 12.1% |
| Insurance | 11.5% |
| Software | 9.5% |
| Machinery | 7.6% |
| Chemicals | 7.4% |
| Electronic Equipment, Instruments & Components | 5.7% |
| Household Durables | 5.4% |
| Financial Services | 4.3% |
| Specialty Retail | 3.8% |
| Specialized REITs | 3.4% |
Top Ten Holdings and/or Issuers*
| Constellation Software, Inc. | 9.2% |
| Progressive Corp. (The) | 6.7% |
| NVR, Inc. | 5.4% |
| Copart, Inc. | 4.9% |
| Markel Group, Inc. | 4.8% |
| Berkshire Hathaway, Inc., Class B | 4.3% |
| Linde plc | 4.1% |
| Cintas Corp. | 4.0% |
| PACCAR, Inc. | 3.8% |
| O'Reilly Automotive, Inc. | 3.8% |
| * Excluding short-term investments |
What were the Fund costs for the last six months?
(Based on a hypothetical $10,000 investment)
| Share Class Name | Costs of a $10,000 investment | Costs paid as a percentage of a $10,000 investment1 |
| Class I | $33 | 0.67% |
| 1. | Annualized. |
Fund Performance
The following graph compares the initial and subsequent account values at the end of each of the most recently completed 10 semiannual reporting periods of the Fund (or for the life of the Fund, if shorter). It assumes a $10,000 initial investment at the beginning of the first fiscal period in an appropriate, broad-based securities market index and other additional indexes, if applicable, for the same period and reflects the deduction of all sales charges, where applicable.
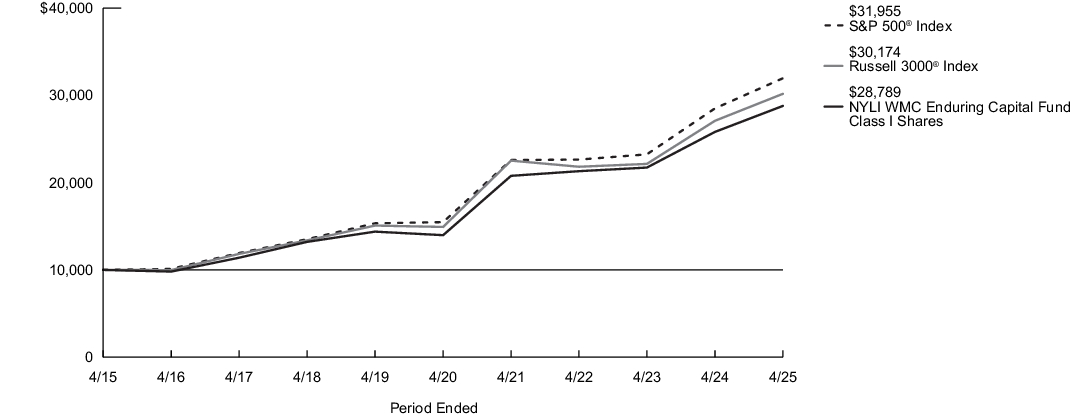
| Average Annual Total Returns for the Period Ended April 30, 2025 | Inception Date |
Six Months1 |
One Year |
Five Years |
Ten Years |
| Class I Shares | 12/28/2004 | 2.36% | 11.54% | 15.54% | 11.15% |
| Russell 3000®Index2 | (2.15)% | 11.40% | 15.12% | 11.68% | |
| S&P 500®Index3 | (1.74)% | 12.10% | 15.61% | 12.32% | |
| Morningstar Large Blend Category Average4 | (2.35)% | 9.59% | 14.37% | 10.85% |
| 1. |
Not annualized. |
| 2. |
The Fund has selected the Russell 3000® Index to represent a broad measure of market performance. The Russell 3000® Index measures the performance of the largest 3,000 U.S. companies representing approximately 98% of the investable U.S. equity market. |
| 3. |
The S&P 500® Index, which represents a broad measure of market performance, is generally representative of the market sectors or types of investments in which the Fund invests. S&P® and S&P 500® are registered trademarks of Standard & Poor’s Financial Services LLC. The S&P 500® Index is widely regarded as the standard index for measuring large-cap U.S. stock market performance. |
| 4. |
The Morningstar Large Blend Category Average is representative of funds that represent the overall U.S. stock market in size, growth rates and price. Stocks in the top 70% of the capitalization of the U.S. equity market are defined as large cap. The blend style is assigned to funds where neither growth nor value characteristics predominate. These funds tend to invest across the spectrum of U.S. industries, and owing to their broad exposure, the funds' returns are often similar to those of the S&P 500® Index. Results are based on average total returns of similar funds with all dividends and capital gain distributions reinvested. |
Key Fund Statistics
| Fund's net assets | $516,187,803 |
| Total number of portfolio holdings | 34 |
| Portfolio turnover rate | 7% |
Graphical Representation of Holdings
The tables below show the investment makeup of the Fund; percentages indicated are based on the Fund's net assets.
Top Ten Holdings and/or Issuers*
| Constellation Software, Inc. | 9.2% |
| Progressive Corp. (The) | 6.7% |
| NVR, Inc. | 5.4% |
| Copart, Inc. | 4.9% |
| Markel Group, Inc. | 4.8% |
| Berkshire Hathaway, Inc., Class B | 4.3% |
| Linde plc | 4.1% |
| Cintas Corp. | 4.0% |
| PACCAR, Inc. | 3.8% |
| O'Reilly Automotive, Inc. | 3.8% |
| * Excluding short-term investments |
Top Industries
| Commercial Services & Supplies | 12.1% |
| Insurance | 11.5% |
| Software | 9.5% |
| Machinery | 7.6% |
| Chemicals | 7.4% |
| Electronic Equipment, Instruments & Components | 5.7% |
| Household Durables | 5.4% |
| Financial Services | 4.3% |
| Specialty Retail | 3.8% |
| Specialized REITs | 3.4% |
Top Ten Holdings and/or Issuers*
| Constellation Software, Inc. | 9.2% |
| Progressive Corp. (The) | 6.7% |
| NVR, Inc. | 5.4% |
| Copart, Inc. | 4.9% |
| Markel Group, Inc. | 4.8% |
| Berkshire Hathaway, Inc., Class B | 4.3% |
| Linde plc | 4.1% |
| Cintas Corp. | 4.0% |
| PACCAR, Inc. | 3.8% |
| O'Reilly Automotive, Inc. | 3.8% |
| * Excluding short-term investments |
What were the Fund costs for the last six months?
(Based on a hypothetical $10,000 investment)
| Share Class Name | Costs of a $10,000 investment | Costs paid as a percentage of a $10,000 investment1 |
| Class R6 | $30 | 0.60% |
| 1. | Annualized. |
Fund Performance
The following graph compares the initial and subsequent account values at the end of each of the most recently completed 10 semiannual reporting periods of the Fund (or for the life of the Fund, if shorter). It assumes a $10,000 initial investment at the beginning of the first fiscal period in an appropriate, broad-based securities market index and other additional indexes, if applicable, for the same period and reflects the deduction of all sales charges, where applicable.
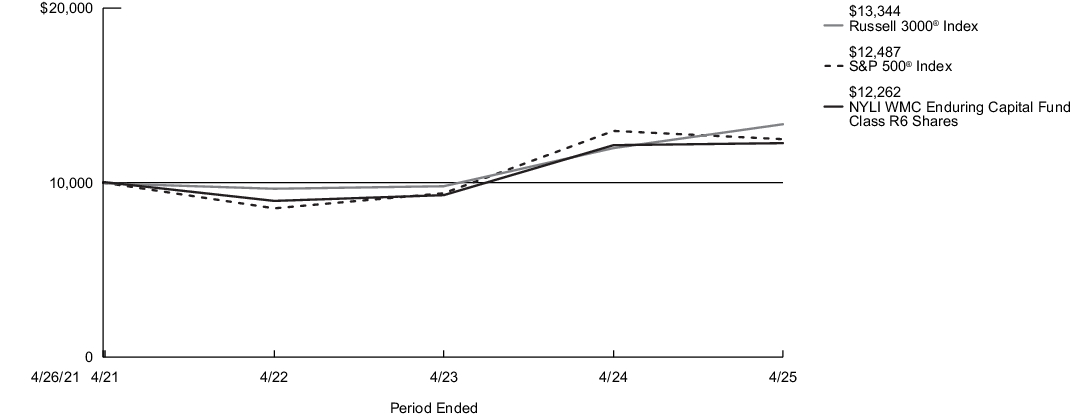
| Average Annual Total Returns for the Period Ended April 30, 2025 | Inception Date |
Six Months1 |
One Year |
Since Inception |
| Class R6 Shares | 4/26/2021 | 2.37% | 11.58% | 8.59% |
| Russell 3000®Index2 | (2.15)% | 11.40% | 7.46% | |
| S&P 500®Index3 | (1.74)% | 12.10% | 8.99% | |
| Morningstar Large Blend Category Average4 | (2.35)% | 9.59% | 6.90% |
| 1. |
Not annualized. |
| 2. |
The Fund has selected the Russell 3000® Index to represent a broad measure of market performance. The Russell 3000® Index measures the performance of the largest 3,000 U.S. companies representing approximately 98% of the investable U.S. equity market. |
| 3. |
The S&P 500® Index, which represents a broad measure of market performance, is generally representative of the market sectors or types of investments in which the Fund invests. S&P® and S&P 500® are registered trademarks of Standard & Poor’s Financial Services LLC. The S&P 500® Index is widely regarded as the standard index for measuring large-cap U.S. stock market performance. |
| 4. |
The Morningstar Large Blend Category Average is representative of funds that represent the overall U.S. stock market in size, growth rates and price. Stocks in the top 70% of the capitalization of the U.S. equity market are defined as large cap. The blend style is assigned to funds where neither growth nor value characteristics predominate. These funds tend to invest across the spectrum of U.S. industries, and owing to their broad exposure, the funds' returns are often similar to those of the S&P 500® Index. Results are based on average total returns of similar funds with all dividends and capital gain distributions reinvested. |
Key Fund Statistics
| Fund's net assets | $516,187,803 |
| Total number of portfolio holdings | 34 |
| Portfolio turnover rate | 7% |
Graphical Representation of Holdings
The tables below show the investment makeup of the Fund; percentages indicated are based on the Fund's net assets.
Top Ten Holdings and/or Issuers*
| Constellation Software, Inc. | 9.2% |
| Progressive Corp. (The) | 6.7% |
| NVR, Inc. | 5.4% |
| Copart, Inc. | 4.9% |
| Markel Group, Inc. | 4.8% |
| Berkshire Hathaway, Inc., Class B | 4.3% |
| Linde plc | 4.1% |
| Cintas Corp. | 4.0% |
| PACCAR, Inc. | 3.8% |
| O'Reilly Automotive, Inc. | 3.8% |
| * Excluding short-term investments |
Top Industries
| Commercial Services & Supplies | 12.1% |
| Insurance | 11.5% |
| Software | 9.5% |
| Machinery | 7.6% |
| Chemicals | 7.4% |
| Electronic Equipment, Instruments & Components | 5.7% |
| Household Durables | 5.4% |
| Financial Services | 4.3% |
| Specialty Retail | 3.8% |
| Specialized REITs | 3.4% |
Top Ten Holdings and/or Issuers*
| Constellation Software, Inc. | 9.2% |
| Progressive Corp. (The) | 6.7% |
| NVR, Inc. | 5.4% |
| Copart, Inc. | 4.9% |
| Markel Group, Inc. | 4.8% |
| Berkshire Hathaway, Inc., Class B | 4.3% |
| Linde plc | 4.1% |
| Cintas Corp. | 4.0% |
| PACCAR, Inc. | 3.8% |
| O'Reilly Automotive, Inc. | 3.8% |
| * Excluding short-term investments |
What were the Fund costs for the last six months?
(Based on a hypothetical $10,000 investment)
| Share Class Name | Costs of a $10,000 investment | Costs paid as a percentage of a $10,000 investment1 |
| Investor Class | $58 | 1.15% |
| 1. | Annualized. |
Fund Performance
The following graph compares the initial and subsequent account values at the end of each of the most recently completed 10 semiannual reporting periods of the Fund (or for the life of the Fund, if shorter). It assumes a $10,000 initial investment at the beginning of the first fiscal period in an appropriate, broad-based securities market index and other additional indexes, if applicable, for the same period and reflects the deduction of all sales charges, where applicable.
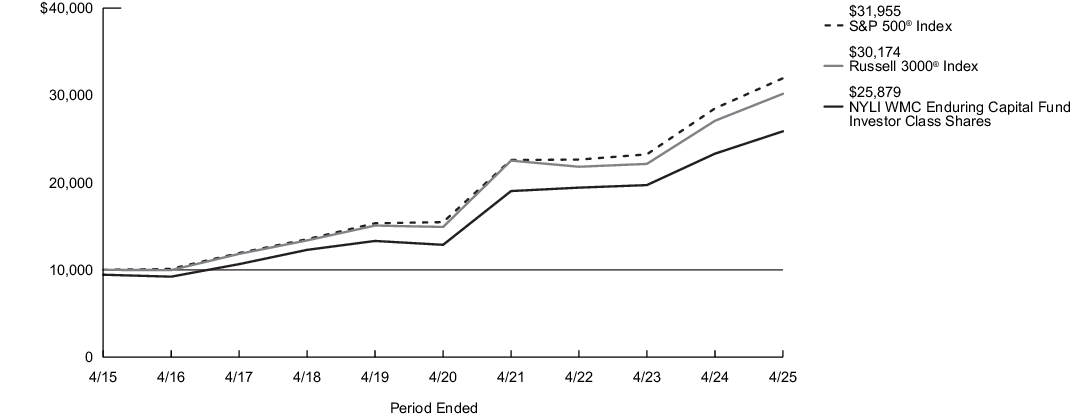
| Average Annual Total Returns for the Period Ended April 30, 2025 | Inception Date |
Six Months1 |
One Year |
Five Years |
Ten Years |
| Investor Class Shares - Including sales charges | 2/28/2008 | (3.01)% | 5.43% | 13.69% | 9.98% |
| Investor Class Shares - Excluding sales charges | 2.10% | 10.98% | 14.99% | 10.60% | |
| Russell 3000®Index2 | (2.15)% | 11.40% | 15.12% | 11.68% | |
| S&P 500®Index3 | (1.74)% | 12.10% | 15.61% | 12.32% | |
| Morningstar Large Blend Category Average4 | (2.35)% | 9.59% | 14.37% | 10.85% |
| 1. |
Not annualized. |
| 2. |
The Fund has selected the Russell 3000® Index to represent a broad measure of market performance. The Russell 3000® Index measures the performance of the largest 3,000 U.S. companies representing approximately 98% of the investable U.S. equity market. |
| 3. |
The S&P 500® Index, which represents a broad measure of market performance, is generally representative of the market sectors or types of investments in which the Fund invests. S&P® and S&P 500® are registered trademarks of Standard & Poor’s Financial Services LLC. The S&P 500® Index is widely regarded as the standard index for measuring large-cap U.S. stock market performance. |
| 4. |
The Morningstar Large Blend Category Average is representative of funds that represent the overall U.S. stock market in size, growth rates and price. Stocks in the top 70% of the capitalization of the U.S. equity market are defined as large cap. The blend style is assigned to funds where neither growth nor value characteristics predominate. These funds tend to invest across the spectrum of U.S. industries, and owing to their broad exposure, the funds' returns are often similar to those of the S&P 500® Index. Results are based on average total returns of similar funds with all dividends and capital gain distributions reinvested. |
Key Fund Statistics
| Fund's net assets | $516,187,803 |
| Total number of portfolio holdings | 34 |
| Portfolio turnover rate | 7% |
Graphical Representation of Holdings
The tables below show the investment makeup of the Fund; percentages indicated are based on the Fund's net assets.
Top Ten Holdings and/or Issuers*
| Constellation Software, Inc. | 9.2% |
| Progressive Corp. (The) | 6.7% |
| NVR, Inc. | 5.4% |
| Copart, Inc. | 4.9% |
| Markel Group, Inc. | 4.8% |
| Berkshire Hathaway, Inc., Class B | 4.3% |
| Linde plc | 4.1% |
| Cintas Corp. | 4.0% |
| PACCAR, Inc. | 3.8% |
| O'Reilly Automotive, Inc. | 3.8% |
| * Excluding short-term investments |
Top Industries
| Commercial Services & Supplies | 12.1% |
| Insurance | 11.5% |
| Software | 9.5% |
| Machinery | 7.6% |
| Chemicals | 7.4% |
| Electronic Equipment, Instruments & Components | 5.7% |
| Household Durables | 5.4% |
| Financial Services | 4.3% |
| Specialty Retail | 3.8% |
| Specialized REITs | 3.4% |
Top Ten Holdings and/or Issuers*
| Constellation Software, Inc. | 9.2% |
| Progressive Corp. (The) | 6.7% |
| NVR, Inc. | 5.4% |
| Copart, Inc. | 4.9% |
| Markel Group, Inc. | 4.8% |
| Berkshire Hathaway, Inc., Class B | 4.3% |
| Linde plc | 4.1% |
| Cintas Corp. | 4.0% |
| PACCAR, Inc. | 3.8% |
| O'Reilly Automotive, Inc. | 3.8% |
| * Excluding short-term investments |
What were the Fund costs for the last six months?
(Based on a hypothetical $10,000 investment)
| Share Class Name | Costs of a $10,000 investment | Costs paid as a percentage of a $10,000 investment1,2 |
| Class A | $47 | 0.94% |
| 1. | Reflects fee waivers and/or expense reimbursements, without which expenses would have been higher. |
| 2. | Annualized. |
Fund Performance
The following graph compares the initial and subsequent account values at the end of each of the most recently completed 10 semiannual reporting periods of the Fund (or for the life of the Fund, if shorter). It assumes a $15,000 initial investment at the beginning of the first fiscal period in an appropriate, broad-based securities market index and other additional indexes, if applicable, for the same period and reflects the deduction of all sales charges, where applicable.
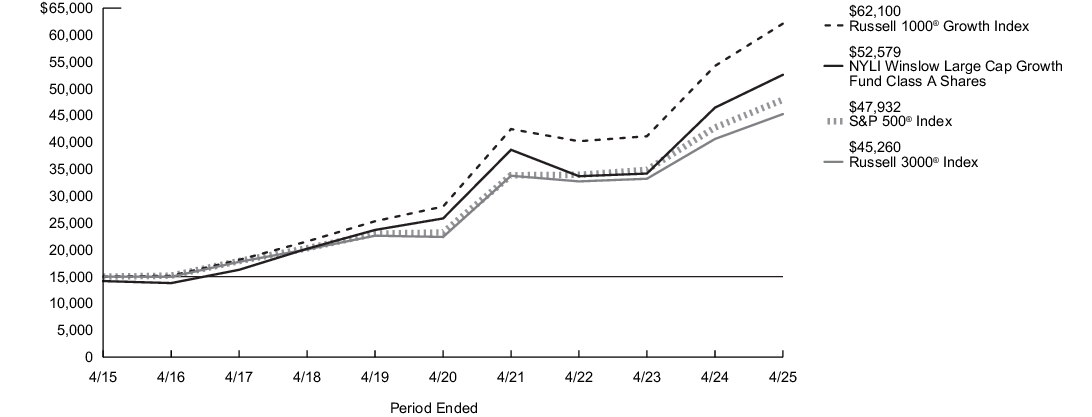
| Average Annual Total Returns for the Period Ended April 30, 2025 | Inception Date |
Six Months1 |
One Year |
Five Years |
Ten Years |
| Class A Shares - Including sales charges | 7/1/1995 | (6.28)% | 6.95% | 13.98% | 13.36% |
| Class A Shares - Excluding sales charges | (0.82)% | 13.17% | 15.27% | 14.01% | |
| Russell 3000®Index2 | (2.15)% | 11.40% | 15.12% | 11.68% | |
| Russell 1000® Growth Index3 | (1.57)% | 14.53% | 17.23% | 15.27% | |
| S&P 500®Index4 | (1.74)% | 12.10% | 15.61% | 12.32% | |
| Morningstar Large Growth Category Average5 | (1.64)% | 12.32% | 14.18% | 12.78% |
| 1. |
Not annualized. |
| 2. |
The Fund has selected the Russell 3000® Index to represent a broad measure of market performance. The Russell 3000® Index measures the performance of the largest 3,000 U.S. companies representing approximately 98% of the investable U.S. equity market. |
| 3. |
The Russell 1000® Growth Index, which is generally representative of the market sectors or types of investments in which the Fund invests, measures the performance of the large-cap growth segment of the U.S. equity universe. It includes those Russell 1000® Index companies with higher price-to-book ratios and higher forecasted growth values. |
| 4. |
The S&P 500® Index, which represents a broad measure of market performance, is generally representative of the market sectors or types of investments in which the Fund invests. S&P® and S&P 500® are registered trademarks of Standard & Poor’s Financial Services LLC. The S&P 500® Index is widely regarded as the standard index for measuring large-cap U.S. stock market performance. |
| 5. |
The Morningstar Large Growth Category Average is representative of funds that invest primarily in big U.S. companies that are projected to grow faster than other large-cap stocks. Stocks in the top 70% of the capitalization of the U.S. equity market are defined as large cap. Growth is defined based on fast growth and high valuations. Most of these funds focus on companies in rapidly expanding industries. Results are based on average total returns of similar funds with all dividends and capital gain distributions reinvested. |
Key Fund Statistics
| Fund's net assets | $12,360,651,183 |
| Total number of portfolio holdings | 44 |
| Portfolio turnover rate | 42% |
Graphical Representation of Holdings
The tables below show the investment makeup of the Fund; percentages indicated are based on the Fund's net assets.
Top Ten Holdings and/or Issuers*
| Microsoft Corp. | 9.4% |
| Amazon.com, Inc. | 6.8% |
| NVIDIA Corp. | 6.4% |
| Apple, Inc. | 5.6% |
| Meta Platforms, Inc., Class A | 5.0% |
| Broadcom, Inc. | 4.2% |
| Eli Lilly & Co. | 4.1% |
| Visa, Inc., Class A | 3.2% |
| Netflix, Inc. | 3.0% |
| Spotify Technology SA | 2.9% |
| * Excluding short-term investments |
Top Industries
| Software | 17.3% |
| Semiconductors & Semiconductor Equipment | 13.9% |
| Interactive Media & Services | 7.6% |
| Financial Services | 7.2% |
| Broadline Retail | 6.8% |
| Hotels, Restaurants & Leisure | 6.3% |
| Entertainment | 5.9% |
| Technology Hardware, Storage & Peripherals | 5.6% |
| Health Care Equipment & Supplies | 5.4% |
| Aerospace & Defense | 4.6% |
Top Ten Holdings and/or Issuers*
| Microsoft Corp. | 9.4% |
| Amazon.com, Inc. | 6.8% |
| NVIDIA Corp. | 6.4% |
| Apple, Inc. | 5.6% |
| Meta Platforms, Inc., Class A | 5.0% |
| Broadcom, Inc. | 4.2% |
| Eli Lilly & Co. | 4.1% |
| Visa, Inc., Class A | 3.2% |
| Netflix, Inc. | 3.0% |
| Spotify Technology SA | 2.9% |
| * Excluding short-term investments |
What were the Fund costs for the last six months?
(Based on a hypothetical $10,000 investment)
| Share Class Name | Costs of a $10,000 investment | Costs paid as a percentage of a $10,000 investment1,2 |
| Class C | $92 | 1.87% |
| 1. | Reflects fee waivers and/or expense reimbursements, without which expenses would have been higher. |
| 2. | Annualized. |
Fund Performance
The following graph compares the initial and subsequent account values at the end of each of the most recently completed 10 semiannual reporting periods of the Fund (or for the life of the Fund, if shorter). It assumes a $10,000 initial investment at the beginning of the first fiscal period in an appropriate, broad-based securities market index and other additional indexes, if applicable, for the same period and reflects the deduction of all sales charges, where applicable.
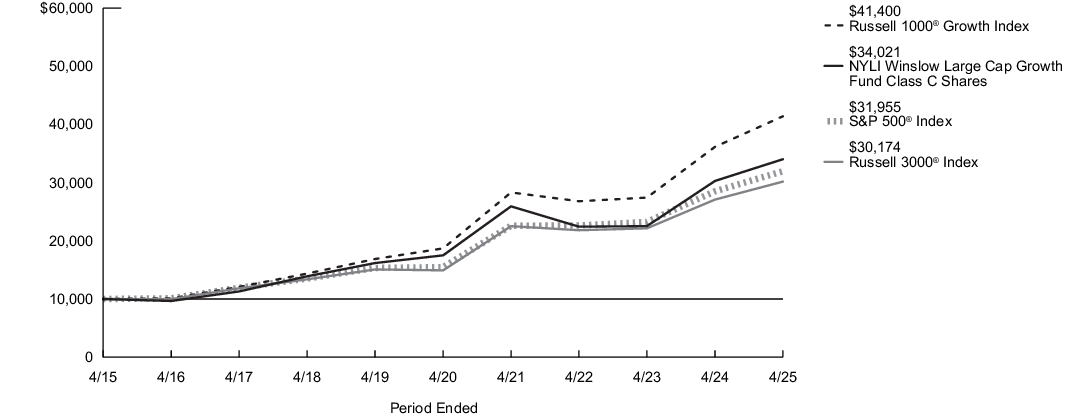
| Average Annual Total Returns for the Period Ended April 30, 2025 | Inception Date |
Six Months1 |
One Year |
Five Years |
Ten Years |
| Class C Shares - Including sales charges | 4/1/2005 | (1.92)% | 11.56% | 14.22% | 13.03% |
| Class C Shares - Excluding sales charges | (1.26)% | 12.32% | 14.22% | 13.03% | |
| Russell 3000®Index2 | (2.15)% | 11.40% | 15.12% | 11.68% | |
| Russell 1000® Growth Index3 | (1.57)% | 14.53% | 17.23% | 15.27% | |
| S&P 500®Index4 | (1.74)% | 12.10% | 15.61% | 12.32% | |
| Morningstar Large Growth Category Average5 | (1.64)% | 12.32% | 14.18% | 12.78% |
| 1. |
Not annualized. |
| 2. |
The Fund has selected the Russell 3000® Index to represent a broad measure of market performance. The Russell 3000® Index measures the performance of the largest 3,000 U.S. companies representing approximately 98% of the investable U.S. equity market. |
| 3. |
The Russell 1000® Growth Index, which is generally representative of the market sectors or types of investments in which the Fund invests, measures the performance of the large-cap growth segment of the U.S. equity universe. It includes those Russell 1000® Index companies with higher price-to-book ratios and higher forecasted growth values. |
| 4. |
The S&P 500® Index, which represents a broad measure of market performance, is generally representative of the market sectors or types of investments in which the Fund invests. S&P® and S&P 500® are registered trademarks of Standard & Poor’s Financial Services LLC. The S&P 500® Index is widely regarded as the standard index for measuring large-cap U.S. stock market performance. |
| 5. |
The Morningstar Large Growth Category Average is representative of funds that invest primarily in big U.S. companies that are projected to grow faster than other large-cap stocks. Stocks in the top 70% of the capitalization of the U.S. equity market are defined as large cap. Growth is defined based on fast growth and high valuations. Most of these funds focus on companies in rapidly expanding industries. Results are based on average total returns of similar funds with all dividends and capital gain distributions reinvested. |
Key Fund Statistics
| Fund's net assets | $12,360,651,183 |
| Total number of portfolio holdings | 44 |
| Portfolio turnover rate | 42% |
Graphical Representation of Holdings
The tables below show the investment makeup of the Fund; percentages indicated are based on the Fund's net assets.
Top Ten Holdings and/or Issuers*
| Microsoft Corp. | 9.4% |
| Amazon.com, Inc. | 6.8% |
| NVIDIA Corp. | 6.4% |
| Apple, Inc. | 5.6% |
| Meta Platforms, Inc., Class A | 5.0% |
| Broadcom, Inc. | 4.2% |
| Eli Lilly & Co. | 4.1% |
| Visa, Inc., Class A | 3.2% |
| Netflix, Inc. | 3.0% |
| Spotify Technology SA | 2.9% |
| * Excluding short-term investments |
Top Industries
| Software | 17.3% |
| Semiconductors & Semiconductor Equipment | 13.9% |
| Interactive Media & Services | 7.6% |
| Financial Services | 7.2% |
| Broadline Retail | 6.8% |
| Hotels, Restaurants & Leisure | 6.3% |
| Entertainment | 5.9% |
| Technology Hardware, Storage & Peripherals | 5.6% |
| Health Care Equipment & Supplies | 5.4% |
| Aerospace & Defense | 4.6% |
Top Ten Holdings and/or Issuers*
| Microsoft Corp. | 9.4% |
| Amazon.com, Inc. | 6.8% |
| NVIDIA Corp. | 6.4% |
| Apple, Inc. | 5.6% |
| Meta Platforms, Inc., Class A | 5.0% |
| Broadcom, Inc. | 4.2% |
| Eli Lilly & Co. | 4.1% |
| Visa, Inc., Class A | 3.2% |
| Netflix, Inc. | 3.0% |
| Spotify Technology SA | 2.9% |
| * Excluding short-term investments |
What were the Fund costs for the last six months?
(Based on a hypothetical $10,000 investment)
| Share Class Name | Costs of a $10,000 investment | Costs paid as a percentage of a $10,000 investment1,2 |
| Class I | $34 | 0.69% |
| 1. | Reflects fee waivers and/or expense reimbursements, without which expenses would have been higher. |
| 2. | Annualized. |
Fund Performance
The following graph compares the initial and subsequent account values at the end of each of the most recently completed 10 semiannual reporting periods of the Fund (or for the life of the Fund, if shorter). It assumes a $10,000 initial investment at the beginning of the first fiscal period in an appropriate, broad-based securities market index and other additional indexes, if applicable, for the same period and reflects the deduction of all sales charges, where applicable.
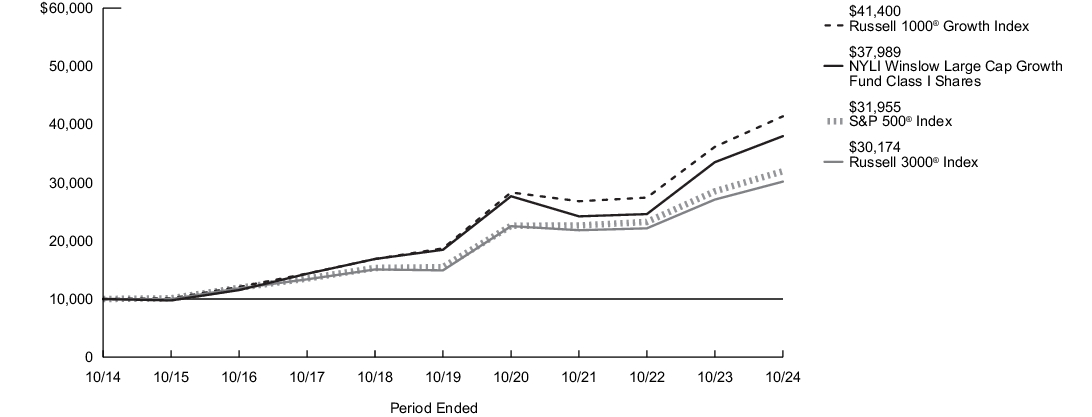
| Average Annual Total Returns for the Period Ended April 30, 2025 | Inception Date |
Six Months1 |
One Year |
Five Years |
Ten Years |
| Class I Shares | 4/1/2005 | (0.76)% | 13.37% | 15.53% | 14.28% |
| Russell 3000®Index2 | (2.15)% | 11.40% | 15.12% | 11.68% | |
| Russell 1000® Growth Index3 | (1.57)% | 14.53% | 17.23% | 15.27% | |
| S&P 500®Index4 | (1.74)% | 12.10% | 15.61% | 12.32% | |
| Morningstar Large Growth Category Average5 | (1.64)% | 12.32% | 14.18% | 12.78% |
| 1. |
Not annualized. |
| 2. |
The Fund has selected the Russell 3000® Index to represent a broad measure of market performance. The Russell 3000® Index measures the performance of the largest 3,000 U.S. companies representing approximately 98% of the investable U.S. equity market. |
| 3. |
The Russell 1000® Growth Index, which is generally representative of the market sectors or types of investments in which the Fund invests, measures the performance of the large-cap growth segment of the U.S. equity universe. It includes those Russell 1000® Index companies with higher price-to-book ratios and higher forecasted growth values. |
| 4. |
The S&P 500® Index, which represents a broad measure of market performance, is generally representative of the market sectors or types of investments in which the Fund invests. S&P® and S&P 500® are registered trademarks of Standard & Poor’s Financial Services LLC. The S&P 500® Index is widely regarded as the standard index for measuring large-cap U.S. stock market performance. |
| 5. |
The Morningstar Large Growth Category Average is representative of funds that invest primarily in big U.S. companies that are projected to grow faster than other large-cap stocks. Stocks in the top 70% of the capitalization of the U.S. equity market are defined as large cap. Growth is defined based on fast growth and high valuations. Most of these funds focus on companies in rapidly expanding industries. Results are based on average total returns of similar funds with all dividends and capital gain distributions reinvested. |
Key Fund Statistics
| Fund's net assets | $12,360,651,183 |
| Total number of portfolio holdings | 44 |
| Portfolio turnover rate | 42% |
Graphical Representation of Holdings
The tables below show the investment makeup of the Fund; percentages indicated are based on the Fund's net assets.
Top Ten Holdings and/or Issuers*
| Microsoft Corp. | 9.4% |
| Amazon.com, Inc. | 6.8% |
| NVIDIA Corp. | 6.4% |
| Apple, Inc. | 5.6% |
| Meta Platforms, Inc., Class A | 5.0% |
| Broadcom, Inc. | 4.2% |
| Eli Lilly & Co. | 4.1% |
| Visa, Inc., Class A | 3.2% |
| Netflix, Inc. | 3.0% |
| Spotify Technology SA | 2.9% |
| * Excluding short-term investments |
Top Industries
| Software | 17.3% |
| Semiconductors & Semiconductor Equipment | 13.9% |
| Interactive Media & Services | 7.6% |
| Financial Services | 7.2% |
| Broadline Retail | 6.8% |
| Hotels, Restaurants & Leisure | 6.3% |
| Entertainment | 5.9% |
| Technology Hardware, Storage & Peripherals | 5.6% |
| Health Care Equipment & Supplies | 5.4% |
| Aerospace & Defense | 4.6% |
Top Ten Holdings and/or Issuers*
| Microsoft Corp. | 9.4% |
| Amazon.com, Inc. | 6.8% |
| NVIDIA Corp. | 6.4% |
| Apple, Inc. | 5.6% |
| Meta Platforms, Inc., Class A | 5.0% |
| Broadcom, Inc. | 4.2% |
| Eli Lilly & Co. | 4.1% |
| Visa, Inc., Class A | 3.2% |
| Netflix, Inc. | 3.0% |
| Spotify Technology SA | 2.9% |
| * Excluding short-term investments |
What were the Fund costs for the last six months?
(Based on a hypothetical $10,000 investment)
| Share Class Name | Costs of a $10,000 investment | Costs paid as a percentage of a $10,000 investment1,2 |
| Class R1 | $39 | 0.79% |
| 1. | Reflects fee waivers and/or expense reimbursements, without which expenses would have been higher. |
| 2. | Annualized. |
Fund Performance
The following graph compares the initial and subsequent account values at the end of each of the most recently completed 10 semiannual reporting periods of the Fund (or for the life of the Fund, if shorter). It assumes a $10,000 initial investment at the beginning of the first fiscal period in an appropriate, broad-based securities market index and other additional indexes, if applicable, for the same period and reflects the deduction of all sales charges, where applicable.
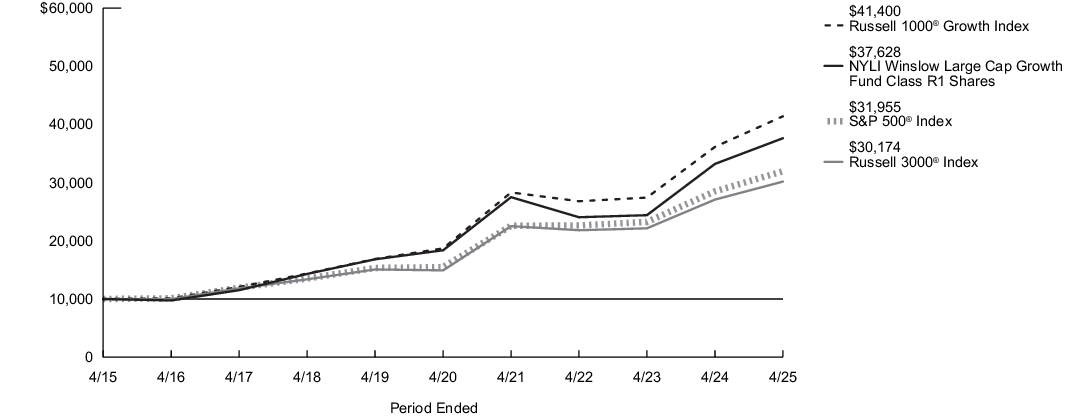
| Average Annual Total Returns for the Period Ended April 30, 2025 | Inception Date |
Six Months1 |
One Year |
Five Years |
Ten Years |
| Class R1 Shares | 4/1/2005 | (0.81)% | 13.29% | 15.41% | 14.17% |
| Russell 3000®Index2 | (2.15)% | 11.40% | 15.12% | 11.68% | |
| Russell 1000® Growth Index3 | (1.57)% | 14.53% | 17.23% | 15.27% | |
| S&P 500®Index4 | (1.74)% | 12.10% | 15.61% | 12.32% | |
| Morningstar Large Growth Category Average5 | (1.64)% | 12.32% | 14.18% | 12.78% |
| 1. |
Not annualized. |
| 2. |
The Fund has selected the Russell 3000® Index to represent a broad measure of market performance. The Russell 3000® Index measures the performance of the largest 3,000 U.S. companies representing approximately 98% of the investable U.S. equity market. |
| 3. |
The Russell 1000® Growth Index, which is generally representative of the market sectors or types of investments in which the Fund invests, measures the performance of the large-cap growth segment of the U.S. equity universe. It includes those Russell 1000® Index companies with higher price-to-book ratios and higher forecasted growth values. |
| 4. |
The S&P 500® Index, which represents a broad measure of market performance, is generally representative of the market sectors or types of investments in which the Fund invests. S&P® and S&P 500® are registered trademarks of Standard & Poor’s Financial Services LLC. The S&P 500® Index is widely regarded as the standard index for measuring large-cap U.S. stock market performance. |
| 5. |
The Morningstar Large Growth Category Average is representative of funds that invest primarily in big U.S. companies that are projected to grow faster than other large-cap stocks. Stocks in the top 70% of the capitalization of the U.S. equity market are defined as large cap. Growth is defined based on fast growth and high valuations. Most of these funds focus on companies in rapidly expanding industries. Results are based on average total returns of similar funds with all dividends and capital gain distributions reinvested. |
Key Fund Statistics
| Fund's net assets | $12,360,651,183 |
| Total number of portfolio holdings | 44 |
| Portfolio turnover rate | 42% |
Graphical Representation of Holdings
The tables below show the investment makeup of the Fund; percentages indicated are based on the Fund's net assets.
Top Ten Holdings and/or Issuers*
| Microsoft Corp. | 9.4% |
| Amazon.com, Inc. | 6.8% |
| NVIDIA Corp. | 6.4% |
| Apple, Inc. | 5.6% |
| Meta Platforms, Inc., Class A | 5.0% |
| Broadcom, Inc. | 4.2% |
| Eli Lilly & Co. | 4.1% |
| Visa, Inc., Class A | 3.2% |
| Netflix, Inc. | 3.0% |
| Spotify Technology SA | 2.9% |
| * Excluding short-term investments |
Top Industries
| Software | 17.3% |
| Semiconductors & Semiconductor Equipment | 13.9% |
| Interactive Media & Services | 7.6% |
| Financial Services | 7.2% |
| Broadline Retail | 6.8% |
| Hotels, Restaurants & Leisure | 6.3% |
| Entertainment | 5.9% |
| Technology Hardware, Storage & Peripherals | 5.6% |
| Health Care Equipment & Supplies | 5.4% |
| Aerospace & Defense | 4.6% |
Top Ten Holdings and/or Issuers*
| Microsoft Corp. | 9.4% |
| Amazon.com, Inc. | 6.8% |
| NVIDIA Corp. | 6.4% |
| Apple, Inc. | 5.6% |
| Meta Platforms, Inc., Class A | 5.0% |
| Broadcom, Inc. | 4.2% |
| Eli Lilly & Co. | 4.1% |
| Visa, Inc., Class A | 3.2% |
| Netflix, Inc. | 3.0% |
| Spotify Technology SA | 2.9% |
| * Excluding short-term investments |
What were the Fund costs for the last six months?
(Based on a hypothetical $10,000 investment)
| Share Class Name | Costs of a $10,000 investment | Costs paid as a percentage of a $10,000 investment1,2 |
| Class R2 | $51 | 1.04% |
| 1. | Reflects fee waivers and/or expense reimbursements, without which expenses would have been higher. |
| 2. | Annualized. |
Fund Performance
The following graph compares the initial and subsequent account values at the end of each of the most recently completed 10 semiannual reporting periods of the Fund (or for the life of the Fund, if shorter). It assumes a $10,000 initial investment at the beginning of the first fiscal period in an appropriate, broad-based securities market index and other additional indexes, if applicable, for the same period and reflects the deduction of all sales charges, where applicable.

| Average Annual Total Returns for the Period Ended April 30, 2025 | Inception Date |
Six Months1 |
One Year |
Five Years |
Ten Years |
| Class R2 Shares | 4/1/2005 | (0.84)% | 13.10% | 15.16% | 13.89% |
| Russell 3000®Index2 | (2.15)% | 11.40% | 15.12% | 11.68% | |
| Russell 1000® Growth Index3 | (1.57)% | 14.53% | 17.23% | 15.27% | |
| S&P 500®Index4 | (1.74)% | 12.10% | 15.61% | 12.32% | |
| Morningstar Large Growth Category Average5 | (1.64)% | 12.32% | 14.18% | 12.78% |
| 1. |
Not annualized. |
| 2. |
The Fund has selected the Russell 3000® Index to represent a broad measure of market performance. The Russell 3000® Index measures the performance of the largest 3,000 U.S. companies representing approximately 98% of the investable U.S. equity market. |
| 3. |
The Russell 1000® Growth Index, which is generally representative of the market sectors or types of investments in which the Fund invests, measures the performance of the large-cap growth segment of the U.S. equity universe. It includes those Russell 1000® Index companies with higher price-to-book ratios and higher forecasted growth values. |
| 4. |
The S&P 500® Index, which represents a broad measure of market performance, is generally representative of the market sectors or types of investments in which the Fund invests. S&P® and S&P 500® are registered trademarks of Standard & Poor’s Financial Services LLC. The S&P 500® Index is widely regarded as the standard index for measuring large-cap U.S. stock market performance. |
| 5. |
The Morningstar Large Growth Category Average is representative of funds that invest primarily in big U.S. companies that are projected to grow faster than other large-cap stocks. Stocks in the top 70% of the capitalization of the U.S. equity market are defined as large cap. Growth is defined based on fast growth and high valuations. Most of these funds focus on companies in rapidly expanding industries. Results are based on average total returns of similar funds with all dividends and capital gain distributions reinvested. |
Key Fund Statistics
| Fund's net assets | $12,360,651,183 |
| Total number of portfolio holdings | 44 |
| Portfolio turnover rate | 42% |
Graphical Representation of Holdings
The tables below show the investment makeup of the Fund; percentages indicated are based on the Fund's net assets.
Top Ten Holdings and/or Issuers*
| Microsoft Corp. | 9.4% |
| Amazon.com, Inc. | 6.8% |
| NVIDIA Corp. | 6.4% |
| Apple, Inc. | 5.6% |
| Meta Platforms, Inc., Class A | 5.0% |
| Broadcom, Inc. | 4.2% |
| Eli Lilly & Co. | 4.1% |
| Visa, Inc., Class A | 3.2% |
| Netflix, Inc. | 3.0% |
| Spotify Technology SA | 2.9% |
| * Excluding short-term investments |
Top Industries
| Software | 17.3% |
| Semiconductors & Semiconductor Equipment | 13.9% |
| Interactive Media & Services | 7.6% |
| Financial Services | 7.2% |
| Broadline Retail | 6.8% |
| Hotels, Restaurants & Leisure | 6.3% |
| Entertainment | 5.9% |
| Technology Hardware, Storage & Peripherals | 5.6% |
| Health Care Equipment & Supplies | 5.4% |
| Aerospace & Defense | 4.6% |
Top Ten Holdings and/or Issuers*
| Microsoft Corp. | 9.4% |
| Amazon.com, Inc. | 6.8% |
| NVIDIA Corp. | 6.4% |
| Apple, Inc. | 5.6% |
| Meta Platforms, Inc., Class A | 5.0% |
| Broadcom, Inc. | 4.2% |
| Eli Lilly & Co. | 4.1% |
| Visa, Inc., Class A | 3.2% |
| Netflix, Inc. | 3.0% |
| Spotify Technology SA | 2.9% |
| * Excluding short-term investments |
What were the Fund costs for the last six months?
(Based on a hypothetical $10,000 investment)
| Share Class Name | Costs of a $10,000 investment | Costs paid as a percentage of a $10,000 investment1,2 |
| Class R3 | $64 | 1.29% |
| 1. | Reflects fee waivers and/or expense reimbursements, without which expenses would have been higher. |
| 2. | Annualized. |
Fund Performance
The following graph compares the initial and subsequent account values at the end of each of the most recently completed 10 semiannual reporting periods of the Fund (or for the life of the Fund, if shorter). It assumes a $10,000 initial investment at the beginning of the first fiscal period in an appropriate, broad-based securities market index and other additional indexes, if applicable, for the same period and reflects the deduction of all sales charges, where applicable.
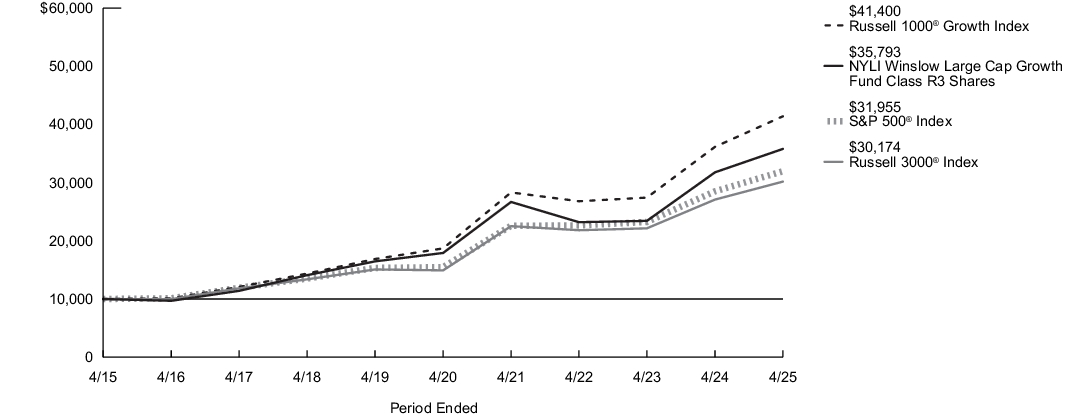
| Average Annual Total Returns for the Period Ended April 30, 2025 | Inception Date |
Six Months1 |
One Year |
Five Years |
Ten Years |
| Class R3 Shares | 4/28/2006 | (1.01)% | 12.67% | 14.85% | 13.60% |
| Russell 3000®Index2 | (2.15)% | 11.40% | 15.12% | 11.68% | |
| Russell 1000® Growth Index3 | (1.57)% | 14.53% | 17.23% | 15.27% | |
| S&P 500®Index4 | (1.74)% | 12.10% | 15.61% | 12.32% | |
| Morningstar Large Growth Category Average5 | (1.64)% | 12.32% | 14.18% | 12.78% |
| 1. |
Not annualized. |
| 2. |
The Fund has selected the Russell 3000® Index to represent a broad measure of market performance. The Russell 3000® Index measures the performance of the largest 3,000 U.S. companies representing approximately 98% of the investable U.S. equity market. |
| 3. |
The Russell 1000® Growth Index, which is generally representative of the market sectors or types of investments in which the Fund invests, measures the performance of the large-cap growth segment of the U.S. equity universe. It includes those Russell 1000® Index companies with higher price-to-book ratios and higher forecasted growth values. |
| 4. |
The S&P 500® Index, which represents a broad measure of market performance, is generally representative of the market sectors or types of investments in which the Fund invests. S&P® and S&P 500® are registered trademarks of Standard & Poor’s Financial Services LLC. The S&P 500® Index is widely regarded as the standard index for measuring large-cap U.S. stock market performance. |
| 5. |
The Morningstar Large Growth Category Average is representative of funds that invest primarily in big U.S. companies that are projected to grow faster than other large-cap stocks. Stocks in the top 70% of the capitalization of the U.S. equity market are defined as large cap. Growth is defined based on fast growth and high valuations. Most of these funds focus on companies in rapidly expanding industries. Results are based on average total returns of similar funds with all dividends and capital gain distributions reinvested. |
Key Fund Statistics
| Fund's net assets | $12,360,651,183 |
| Total number of portfolio holdings | 44 |
| Portfolio turnover rate | 42% |
Graphical Representation of Holdings
The tables below show the investment makeup of the Fund; percentages indicated are based on the Fund's net assets.
Top Ten Holdings and/or Issuers*
| Microsoft Corp. | 9.4% |
| Amazon.com, Inc. | 6.8% |
| NVIDIA Corp. | 6.4% |
| Apple, Inc. | 5.6% |
| Meta Platforms, Inc., Class A | 5.0% |
| Broadcom, Inc. | 4.2% |
| Eli Lilly & Co. | 4.1% |
| Visa, Inc., Class A | 3.2% |
| Netflix, Inc. | 3.0% |
| Spotify Technology SA | 2.9% |
| * Excluding short-term investments |
Top Industries
| Software | 17.3% |
| Semiconductors & Semiconductor Equipment | 13.9% |
| Interactive Media & Services | 7.6% |
| Financial Services | 7.2% |
| Broadline Retail | 6.8% |
| Hotels, Restaurants & Leisure | 6.3% |
| Entertainment | 5.9% |
| Technology Hardware, Storage & Peripherals | 5.6% |
| Health Care Equipment & Supplies | 5.4% |
| Aerospace & Defense | 4.6% |
Top Ten Holdings and/or Issuers*
| Microsoft Corp. | 9.4% |
| Amazon.com, Inc. | 6.8% |
| NVIDIA Corp. | 6.4% |
| Apple, Inc. | 5.6% |
| Meta Platforms, Inc., Class A | 5.0% |
| Broadcom, Inc. | 4.2% |
| Eli Lilly & Co. | 4.1% |
| Visa, Inc., Class A | 3.2% |
| Netflix, Inc. | 3.0% |
| Spotify Technology SA | 2.9% |
| * Excluding short-term investments |
What were the Fund costs for the last six months?
(Based on a hypothetical $10,000 investment)
| Share Class Name | Costs of a $10,000 investment | Costs paid as a percentage of a $10,000 investment1,2 |
| Class R6 | $31 | 0.63% |
| 1. | Reflects fee waivers and/or expense reimbursements, without which expenses would have been higher. |
| 2. | Annualized. |
Fund Performance
The following graph compares the initial and subsequent account values at the end of each of the most recently completed 10 semiannual reporting periods of the Fund (or for the life of the Fund, if shorter). It assumes a $10,000 initial investment at the beginning of the first fiscal period in an appropriate, broad-based securities market index and other additional indexes, if applicable, for the same period and reflects the deduction of all sales charges, where applicable.
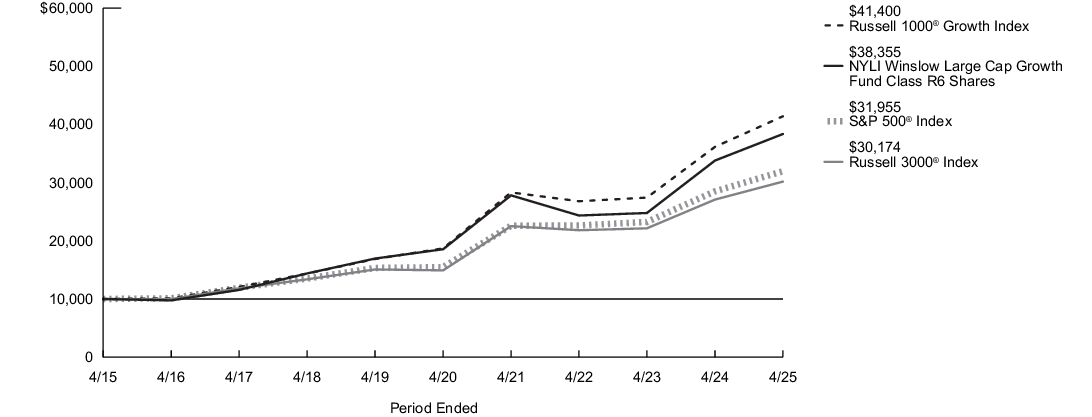
| Average Annual Total Returns for the Period Ended April 30, 2025 | Inception Date |
Six Months1 |
One Year |
Five Years |
Ten Years |
| Class R6 Shares | 6/17/2013 | (0.65)% | 13.50% | 15.63% | 14.39% |
| Russell 3000®Index2 | (2.15)% | 11.40% | 15.12% | 11.68% | |
| Russell 1000® Growth Index3 | (1.57)% | 14.53% | 17.23% | 15.27% | |
| S&P 500®Index4 | (1.74)% | 12.10% | 15.61% | 12.32% | |
| Morningstar Large Growth Category Average5 | (1.64)% | 12.32% | 14.18% | 12.78% |
| 1. |
Not annualized. |
| 2. |
The Fund has selected the Russell 3000® Index to represent a broad measure of market performance. The Russell 3000® Index measures the performance of the largest 3,000 U.S. companies representing approximately 98% of the investable U.S. equity market. |
| 3. |
The Russell 1000® Growth Index, which is generally representative of the market sectors or types of investments in which the Fund invests, measures the performance of the large-cap growth segment of the U.S. equity universe. It includes those Russell 1000® Index companies with higher price-to-book ratios and higher forecasted growth values. |
| 4. |
The S&P 500® Index, which represents a broad measure of market performance, is generally representative of the market sectors or types of investments in which the Fund invests. S&P® and S&P 500® are registered trademarks of Standard & Poor’s Financial Services LLC. The S&P 500® Index is widely regarded as the standard index for measuring large-cap U.S. stock market performance. |
| 5. |
The Morningstar Large Growth Category Average is representative of funds that invest primarily in big U.S. companies that are projected to grow faster than other large-cap stocks. Stocks in the top 70% of the capitalization of the U.S. equity market are defined as large cap. Growth is defined based on fast growth and high valuations. Most of these funds focus on companies in rapidly expanding industries. Results are based on average total returns of similar funds with all dividends and capital gain distributions reinvested. |
Key Fund Statistics
| Fund's net assets | $12,360,651,183 |
| Total number of portfolio holdings | 44 |
| Portfolio turnover rate | 42% |
Graphical Representation of Holdings
The tables below show the investment makeup of the Fund; percentages indicated are based on the Fund's net assets.
Top Ten Holdings and/or Issuers*
| Microsoft Corp. | 9.4% |
| Amazon.com, Inc. | 6.8% |
| NVIDIA Corp. | 6.4% |
| Apple, Inc. | 5.6% |
| Meta Platforms, Inc., Class A | 5.0% |
| Broadcom, Inc. | 4.2% |
| Eli Lilly & Co. | 4.1% |
| Visa, Inc., Class A | 3.2% |
| Netflix, Inc. | 3.0% |
| Spotify Technology SA | 2.9% |
| * Excluding short-term investments |
Top Industries
| Software | 17.3% |
| Semiconductors & Semiconductor Equipment | 13.9% |
| Interactive Media & Services | 7.6% |
| Financial Services | 7.2% |
| Broadline Retail | 6.8% |
| Hotels, Restaurants & Leisure | 6.3% |
| Entertainment | 5.9% |
| Technology Hardware, Storage & Peripherals | 5.6% |
| Health Care Equipment & Supplies | 5.4% |
| Aerospace & Defense | 4.6% |
Top Ten Holdings and/or Issuers*
| Microsoft Corp. | 9.4% |
| Amazon.com, Inc. | 6.8% |
| NVIDIA Corp. | 6.4% |
| Apple, Inc. | 5.6% |
| Meta Platforms, Inc., Class A | 5.0% |
| Broadcom, Inc. | 4.2% |
| Eli Lilly & Co. | 4.1% |
| Visa, Inc., Class A | 3.2% |
| Netflix, Inc. | 3.0% |
| Spotify Technology SA | 2.9% |
| * Excluding short-term investments |
What were the Fund costs for the last six months?
(Based on a hypothetical $10,000 investment)
| Share Class Name | Costs of a $10,000 investment | Costs paid as a percentage of a $10,000 investment1,2 |
| Investor Class | $55 | 1.12% |
| 1. | Reflects fee waivers and/or expense reimbursements, without which expenses would have been higher. |
| 2. | Annualized. |
Fund Performance
The following graph compares the initial and subsequent account values at the end of each of the most recently completed 10 semiannual reporting periods of the Fund (or for the life of the Fund, if shorter). It assumes a $10,000 initial investment at the beginning of the first fiscal period in an appropriate, broad-based securities market index and other additional indexes, if applicable, for the same period and reflects the deduction of all sales charges, where applicable.
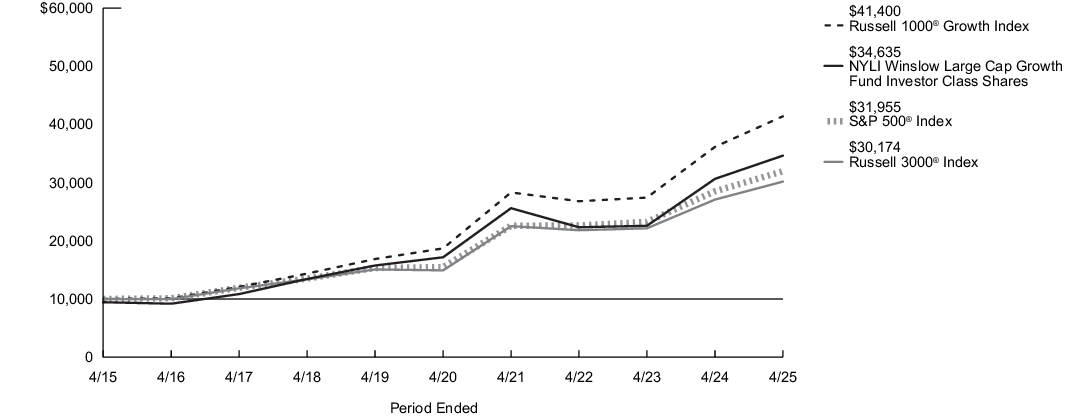
| Average Annual Total Returns for the Period Ended April 30, 2025 | Inception Date |
Six Months1 |
One Year |
Five Years |
Ten Years |
| Investor Class Shares - Including sales charges | 2/28/2008 | (5.82)% | 7.36% | 13.77% | 13.23% |
| Investor Class Shares - Excluding sales charges | (0.86)% | 13.01% | 15.06% | 13.87% | |
| Russell 3000®Index2 | (2.15)% | 11.40% | 15.12% | 11.68% | |
| Russell 1000® Growth Index3 | (1.57)% | 14.53% | 17.23% | 15.27% | |
| S&P 500®Index4 | (1.74)% | 12.10% | 15.61% | 12.32% | |
| Morningstar Large Growth Category Average5 | (1.64)% | 12.32% | 14.18% | 12.78% |
| 1. |
Not annualized. |
| 2. |
The Fund has selected the Russell 3000® Index to represent a broad measure of market performance. The Russell 3000® Index measures the performance of the largest 3,000 U.S. companies representing approximately 98% of the investable U.S. equity market. |
| 3. |
The Russell 1000® Growth Index, which is generally representative of the market sectors or types of investments in which the Fund invests, measures the performance of the large-cap growth segment of the U.S. equity universe. It includes those Russell 1000® Index companies with higher price-to-book ratios and higher forecasted growth values. |
| 4. |
The S&P 500® Index, which represents a broad measure of market performance, is generally representative of the market sectors or types of investments in which the Fund invests. S&P® and S&P 500® are registered trademarks of Standard & Poor’s Financial Services LLC. The S&P 500® Index is widely regarded as the standard index for measuring large-cap U.S. stock market performance. |
| 5. |
The Morningstar Large Growth Category Average is representative of funds that invest primarily in big U.S. companies that are projected to grow faster than other large-cap stocks. Stocks in the top 70% of the capitalization of the U.S. equity market are defined as large cap. Growth is defined based on fast growth and high valuations. Most of these funds focus on companies in rapidly expanding industries. Results are based on average total returns of similar funds with all dividends and capital gain distributions reinvested. |
Key Fund Statistics
| Fund's net assets | $12,360,651,183 |
| Total number of portfolio holdings | 44 |
| Portfolio turnover rate | 42% |
Graphical Representation of Holdings
The tables below show the investment makeup of the Fund; percentages indicated are based on the Fund's net assets.
Top Ten Holdings and/or Issuers*
| Microsoft Corp. | 9.4% |
| Amazon.com, Inc. | 6.8% |
| NVIDIA Corp. | 6.4% |
| Apple, Inc. | 5.6% |
| Meta Platforms, Inc., Class A | 5.0% |
| Broadcom, Inc. | 4.2% |
| Eli Lilly & Co. | 4.1% |
| Visa, Inc., Class A | 3.2% |
| Netflix, Inc. | 3.0% |
| Spotify Technology SA | 2.9% |
| * Excluding short-term investments |
Top Industries
| Software | 17.3% |
| Semiconductors & Semiconductor Equipment | 13.9% |
| Interactive Media & Services | 7.6% |
| Financial Services | 7.2% |
| Broadline Retail | 6.8% |
| Hotels, Restaurants & Leisure | 6.3% |
| Entertainment | 5.9% |
| Technology Hardware, Storage & Peripherals | 5.6% |
| Health Care Equipment & Supplies | 5.4% |
| Aerospace & Defense | 4.6% |
Top Ten Holdings and/or Issuers*
| Microsoft Corp. | 9.4% |
| Amazon.com, Inc. | 6.8% |
| NVIDIA Corp. | 6.4% |
| Apple, Inc. | 5.6% |
| Meta Platforms, Inc., Class A | 5.0% |
| Broadcom, Inc. | 4.2% |
| Eli Lilly & Co. | 4.1% |
| Visa, Inc., Class A | 3.2% |
| Netflix, Inc. | 3.0% |
| Spotify Technology SA | 2.9% |
| * Excluding short-term investments |
What were the Fund costs for the last six months?
(Based on a hypothetical $10,000 investment)
| Share Class Name | Costs of a $10,000 investment | Costs paid as a percentage of a $10,000 investment1,2 |
| SIMPLE Class | $58 | 1.18% |
| 1. | Reflects fee waivers and/or expense reimbursements, without which expenses would have been higher. |
| 2. | Annualized. |
Fund Performance
The following graph compares the initial and subsequent account values at the end of each of the most recently completed 10 semiannual reporting periods of the Fund (or for the life of the Fund, if shorter). It assumes a $10,000 initial investment at the beginning of the first fiscal period in an appropriate, broad-based securities market index and other additional indexes, if applicable, for the same period and reflects the deduction of all sales charges, where applicable.
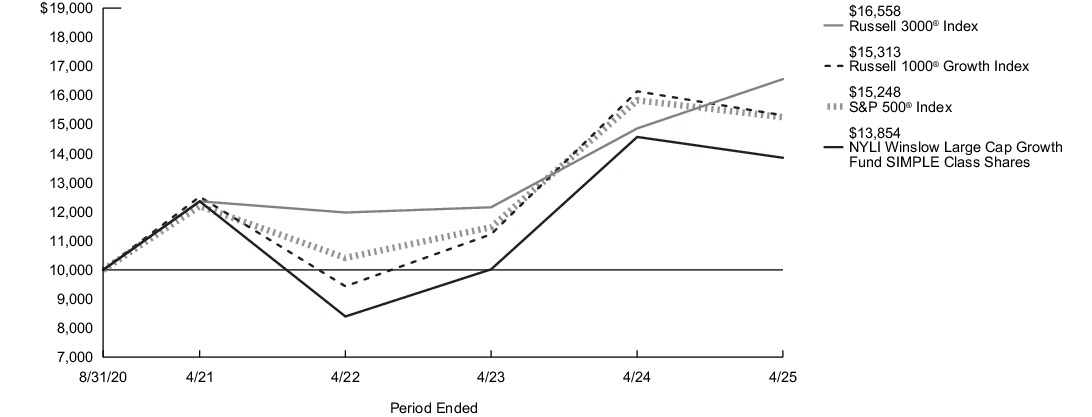
| Average Annual Total Returns for the Period Ended April 30, 2025 | Inception Date |
Six Months1 |
One Year |
Since Inception |
| SIMPLE Class Shares | 8/31/2020 | (0.99)% | 12.78% | 9.28% |
| Russell 3000®Index2 | (2.15)% | 11.40% | 11.41% | |
| Russell 1000® Growth Index3 | (1.57)% | 14.53% | 11.66% | |
| S&P 500®Index4 | (1.74)% | 12.10% | 12.14% | |
| Morningstar Large Growth Category Average5 | (1.64)% | 12.32% | 8.71% |
| 1. |
Not annualized. |
| 2. |
The Fund has selected the Russell 3000® Index to represent a broad measure of market performance. The Russell 3000® Index measures the performance of the largest 3,000 U.S. companies representing approximately 98% of the investable U.S. equity market. |
| 3. |
The Russell 1000® Growth Index, which is generally representative of the market sectors or types of investments in which the Fund invests, measures the performance of the large-cap growth segment of the U.S. equity universe. It includes those Russell 1000® Index companies with higher price-to-book ratios and higher forecasted growth values. |
| 4. |
The S&P 500® Index, which represents a broad measure of market performance, is generally representative of the market sectors or types of investments in which the Fund invests. S&P® and S&P 500® are registered trademarks of Standard & Poor’s Financial Services LLC. The S&P 500® Index is widely regarded as the standard index for measuring large-cap U.S. stock market performance. |
| 5. |
The Morningstar Large Growth Category Average is representative of funds that invest primarily in big U.S. companies that are projected to grow faster than other large-cap stocks. Stocks in the top 70% of the capitalization of the U.S. equity market are defined as large cap. Growth is defined based on fast growth and high valuations. Most of these funds focus on companies in rapidly expanding industries. Results are based on average total returns of similar funds with all dividends and capital gain distributions reinvested. |
Key Fund Statistics
| Fund's net assets | $12,360,651,183 |
| Total number of portfolio holdings | 44 |
| Portfolio turnover rate | 42% |
Graphical Representation of Holdings
The tables below show the investment makeup of the Fund; percentages indicated are based on the Fund's net assets.
Top Ten Holdings and/or Issuers*
| Microsoft Corp. | 9.4% |
| Amazon.com, Inc. | 6.8% |
| NVIDIA Corp. | 6.4% |
| Apple, Inc. | 5.6% |
| Meta Platforms, Inc., Class A | 5.0% |
| Broadcom, Inc. | 4.2% |
| Eli Lilly & Co. | 4.1% |
| Visa, Inc., Class A | 3.2% |
| Netflix, Inc. | 3.0% |
| Spotify Technology SA | 2.9% |
| * Excluding short-term investments |
Top Industries
| Software | 17.3% |
| Semiconductors & Semiconductor Equipment | 13.9% |
| Interactive Media & Services | 7.6% |
| Financial Services | 7.2% |
| Broadline Retail | 6.8% |
| Hotels, Restaurants & Leisure | 6.3% |
| Entertainment | 5.9% |
| Technology Hardware, Storage & Peripherals | 5.6% |
| Health Care Equipment & Supplies | 5.4% |
| Aerospace & Defense | 4.6% |
Top Ten Holdings and/or Issuers*
| Microsoft Corp. | 9.4% |
| Amazon.com, Inc. | 6.8% |
| NVIDIA Corp. | 6.4% |
| Apple, Inc. | 5.6% |
| Meta Platforms, Inc., Class A | 5.0% |
| Broadcom, Inc. | 4.2% |
| Eli Lilly & Co. | 4.1% |
| Visa, Inc., Class A | 3.2% |
| Netflix, Inc. | 3.0% |
| Spotify Technology SA | 2.9% |
| * Excluding short-term investments |
What were the Fund costs for the last six months?
(Based on a hypothetical $10,000 investment)
| Share Class Name | Costs of a $10,000 investment | Costs paid as a percentage of a $10,000 investment1 |
| Class A | $50 | 1.01% |
| 1. | Annualized. |
Fund Performance
The following graph compares the initial and subsequent account values at the end of each of the most recently completed 10 semiannual reporting periods of the Fund (or for the life of the Fund, if shorter). It assumes a $15,000 initial investment at the beginning of the first fiscal period in an appropriate, broad-based securities market index and other additional indexes, if applicable, for the same period and reflects the deduction of all sales charges, where applicable. One of the Fund's subadvisors changed effective January 9, 2017, and the Fund's principal investment strategies changed effective February 28, 2017 and March 13, 2017. Effective April 26, 2021, the Fund replaced both of its subadvisors and modified its principal investment strategies. The past performance in the graph and table prior to that date reflects the Fund’s prior subadvisors and principal investment strategies.
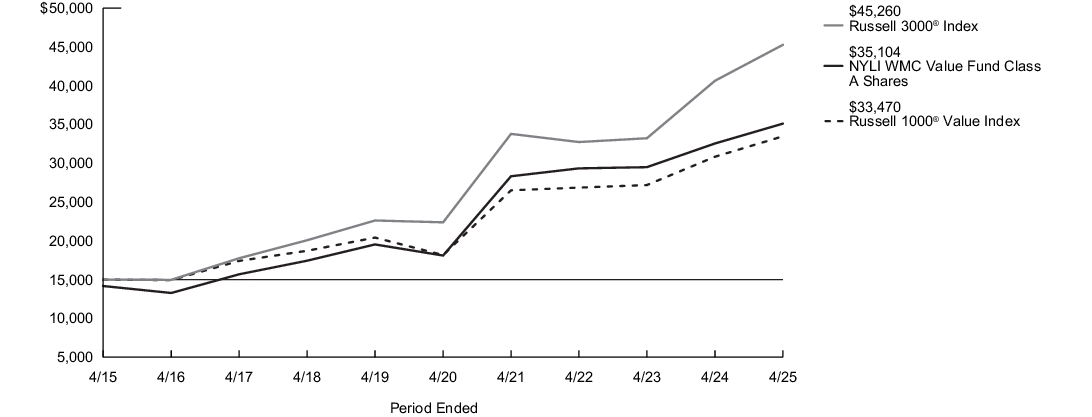
| Average Annual Total Returns for the Period Ended April 30, 2025 | Inception Date |
Six Months1 |
One Year |
Five Years |
Ten Years |
| Class A Shares - Including sales charges | 6/9/1999 | (7.94)% | 1.93% | 12.88% | 8.87% |
| Class A Shares - Excluding sales charges | (2.58)% | 7.86% | 14.16% | 9.49% | |
| Russell 3000®Index2 | (2.15)% | 11.40% | 15.12% | 11.68% | |
| Russell 1000® Value Index3 | (1.86)% | 8.55% | 13.00% | 8.36% | |
| Morningstar Large Value Category Average4 | (2.27)% | 7.57% | 13.36% | 8.45% |
| 1. |
Not annualized. |
| 2. |
The Fund has selected the Russell 3000® Index to represent a broad measure of market performance. The Russell 3000® Index measures the performance of the largest 3,000 U.S. companies representing approximately 98% of the investable U.S. equity market. |
| 3. |
The Russell 1000® Value Index, which is generally representative of the market sectors or types of investments in which the Fund invests, measures the performance of the large-cap value segment of the U.S. equity universe. It includes those Russell 1000® Index companies with lower price-to-book ratios and lower expected growth values. |
| 4. |
The Morningstar Large Value Category Average is representative of funds that invest primarily in big U.S. companies that are less expensive or growing more slowly than other large-cap stocks. Results are based on average total returns of similar funds with all dividends and capital gain distributions reinvested. |
Key Fund Statistics
| Fund's net assets | $920,939,860 |
| Total number of portfolio holdings | 68 |
| Portfolio turnover rate | 21% |
Graphical Representation of Holdings
The tables below show the investment makeup of the Fund; percentages indicated are based on the Fund's net assets.
Top Ten Holdings and/or Issuers*
| JPMorgan Chase & Co. | 3.9% |
| Johnson & Johnson | 3.2% |
| UnitedHealth Group, Inc. | 2.7% |
| Cisco Systems, Inc. | 2.4% |
| Gilead Sciences, Inc. | 2.1% |
| American International Group, Inc. | 2.1% |
| Pfizer, Inc. | 1.9% |
| Johnson Controls International plc | 1.9% |
| Elevance Health, Inc. | 1.9% |
| Marsh & McLennan Cos., Inc. | 1.8% |
| * Excluding short-term investments |
Top Industries
| Pharmaceuticals | 9.2% |
| Oil, Gas & Consumable Fuels | 9.1% |
| Capital Markets | 8.2% |
| Banks | 7.9% |
| Insurance | 6.8% |
| Health Care Providers & Services | 6.3% |
| Communications Equipment | 3.6% |
| Multi–Utilities | 3.3% |
| Specialized REITs | 3.1% |
| Machinery | 2.8% |
Top Ten Holdings and/or Issuers*
| JPMorgan Chase & Co. | 3.9% |
| Johnson & Johnson | 3.2% |
| UnitedHealth Group, Inc. | 2.7% |
| Cisco Systems, Inc. | 2.4% |
| Gilead Sciences, Inc. | 2.1% |
| American International Group, Inc. | 2.1% |
| Pfizer, Inc. | 1.9% |
| Johnson Controls International plc | 1.9% |
| Elevance Health, Inc. | 1.9% |
| Marsh & McLennan Cos., Inc. | 1.8% |
| * Excluding short-term investments |
What were the Fund costs for the last six months?
(Based on a hypothetical $10,000 investment)
| Share Class Name | Costs of a $10,000 investment | Costs paid as a percentage of a $10,000 investment1 |
| Class C | $98 | 2.00% |
| 1. | Annualized. |
Fund Performance
The following graph compares the initial and subsequent account values at the end of each of the most recently completed 10 semiannual reporting periods of the Fund (or for the life of the Fund, if shorter). It assumes a $10,000 initial investment at the beginning of the first fiscal period in an appropriate, broad-based securities market index and other additional indexes, if applicable, for the same period and reflects the deduction of all sales charges, where applicable. One of the Fund's subadvisors changed effective January 9, 2017, and the Fund's principal investment strategies changed effective February 28, 2017 and March 13, 2017. Effective April 26, 2021, the Fund replaced both of its subadvisors and modified its principal investment strategies. The past performance in the graph and table prior to that date reflects the Fund’s prior subadvisors and principal investment strategies.
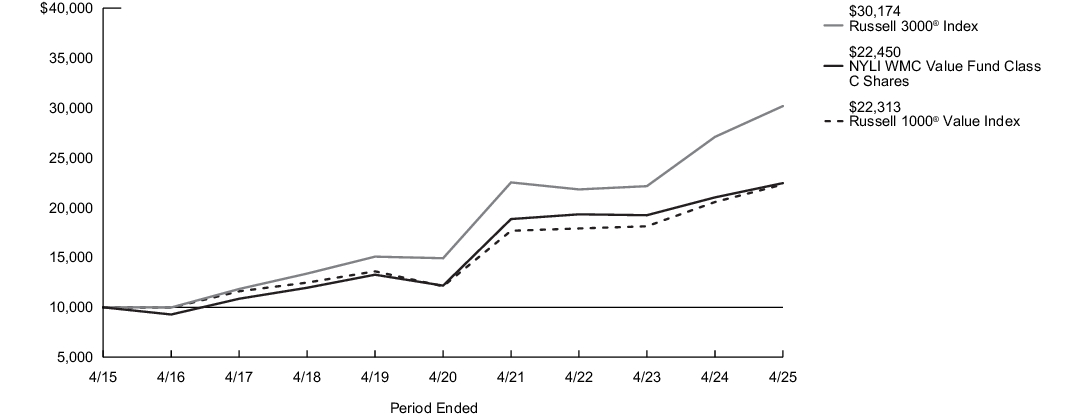
| Average Annual Total Returns for the Period Ended April 30, 2025 | Inception Date |
Six Months1 |
One Year |
Five Years |
Ten Years |
| Class C Shares - Including sales charges | 6/9/1999 | (3.95)% | 5.80% | 13.02% | 8.42% |
| Class C Shares - Excluding sales charges | (3.05)% | 6.80% | 13.02% | 8.42% | |
| Russell 3000®Index2 | (2.15)% | 11.40% | 15.12% | 11.68% | |
| Russell 1000® Value Index3 | (1.86)% | 8.55% | 13.00% | 8.36% | |
| Morningstar Large Value Category Average4 | (2.27)% | 7.57% | 13.36% | 8.45% |
| 1. |
Not annualized. |
| 2. |
The Fund has selected the Russell 3000® Index to represent a broad measure of market performance. The Russell 3000® Index measures the performance of the largest 3,000 U.S. companies representing approximately 98% of the investable U.S. equity market. |
| 3. |
The Russell 1000® Value Index, which is generally representative of the market sectors or types of investments in which the Fund invests, measures the performance of the large-cap value segment of the U.S. equity universe. It includes those Russell 1000® Index companies with lower price-to-book ratios and lower expected growth values. |
| 4. |
The Morningstar Large Value Category Average is representative of funds that invest primarily in big U.S. companies that are less expensive or growing more slowly than other large-cap stocks. Results are based on average total returns of similar funds with all dividends and capital gain distributions reinvested. |
Key Fund Statistics
| Fund's net assets | $920,939,860 |
| Total number of portfolio holdings | 68 |
| Portfolio turnover rate | 21% |
Graphical Representation of Holdings
The tables below show the investment makeup of the Fund; percentages indicated are based on the Fund's net assets.
Top Ten Holdings and/or Issuers*
| JPMorgan Chase & Co. | 3.9% |
| Johnson & Johnson | 3.2% |
| UnitedHealth Group, Inc. | 2.7% |
| Cisco Systems, Inc. | 2.4% |
| Gilead Sciences, Inc. | 2.1% |
| American International Group, Inc. | 2.1% |
| Pfizer, Inc. | 1.9% |
| Johnson Controls International plc | 1.9% |
| Elevance Health, Inc. | 1.9% |
| Marsh & McLennan Cos., Inc. | 1.8% |
| * Excluding short-term investments |
Top Industries
| Pharmaceuticals | 9.2% |
| Oil, Gas & Consumable Fuels | 9.1% |
| Capital Markets | 8.2% |
| Banks | 7.9% |
| Insurance | 6.8% |
| Health Care Providers & Services | 6.3% |
| Communications Equipment | 3.6% |
| Multi–Utilities | 3.3% |
| Specialized REITs | 3.1% |
| Machinery | 2.8% |
Top Ten Holdings and/or Issuers*
| JPMorgan Chase & Co. | 3.9% |
| Johnson & Johnson | 3.2% |
| UnitedHealth Group, Inc. | 2.7% |
| Cisco Systems, Inc. | 2.4% |
| Gilead Sciences, Inc. | 2.1% |
| American International Group, Inc. | 2.1% |
| Pfizer, Inc. | 1.9% |
| Johnson Controls International plc | 1.9% |
| Elevance Health, Inc. | 1.9% |
| Marsh & McLennan Cos., Inc. | 1.8% |
| * Excluding short-term investments |
What were the Fund costs for the last six months?
(Based on a hypothetical $10,000 investment)
| Share Class Name | Costs of a $10,000 investment | Costs paid as a percentage of a $10,000 investment1,2 |
| Class I | $34 | 0.70% |
| 1. | Reflects fee waivers and/or expense reimbursements, without which expenses would have been higher. |
| 2. | Annualized. |
Fund Performance
The following graph compares the initial and subsequent account values at the end of each of the most recently completed 10 semiannual reporting periods of the Fund (or for the life of the Fund, if shorter). It assumes a $10,000 initial investment at the beginning of the first fiscal period in an appropriate, broad-based securities market index and other additional indexes, if applicable, for the same period and reflects the deduction of all sales charges, where applicable. One of the Fund's subadvisors changed effective January 9, 2017, and the Fund's principal investment strategies changed effective February 28, 2017 and March 13, 2017. Effective April 26, 2021, the Fund replaced both of its subadvisors and modified its principal investment strategies. The past performance in the graph and table prior to that date reflects the Fund’s prior subadvisors and principal investment strategies.
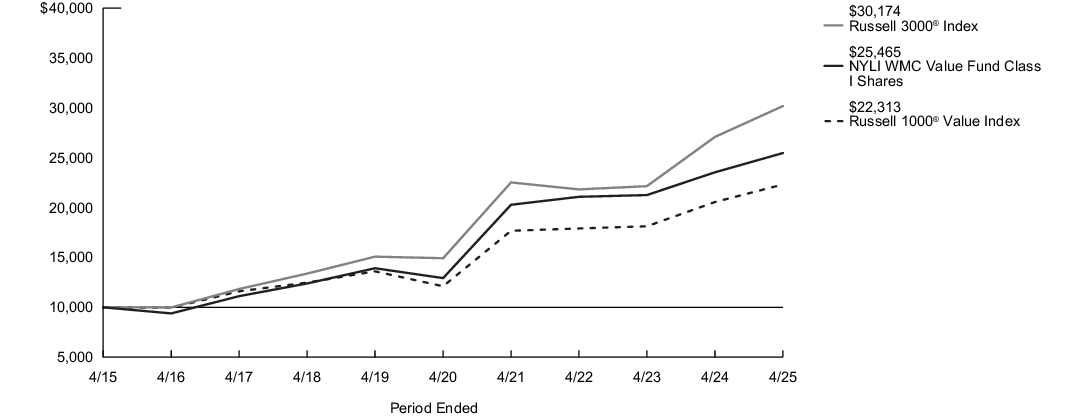
| Average Annual Total Returns for the Period Ended April 30, 2025 | Inception Date |
Six Months1 |
One Year |
Five Years |
Ten Years |
| Class I Shares | 1/21/1971 | (2.46)% | 8.19% | 14.52% | 9.80% |
| Russell 3000®Index2 | (2.15)% | 11.40% | 15.12% | 11.68% | |
| Russell 1000® Value Index3 | (1.86)% | 8.55% | 13.00% | 8.36% | |
| Morningstar Large Value Category Average4 | (2.27)% | 7.57% | 13.36% | 8.45% |
| 1. |
Not annualized. |
| 2. |
The Fund has selected the Russell 3000® Index to represent a broad measure of market performance. The Russell 3000® Index measures the performance of the largest 3,000 U.S. companies representing approximately 98% of the investable U.S. equity market. |
| 3. |
The Russell 1000® Value Index, which is generally representative of the market sectors or types of investments in which the Fund invests, measures the performance of the large-cap value segment of the U.S. equity universe. It includes those Russell 1000® Index companies with lower price-to-book ratios and lower expected growth values. |
| 4. |
The Morningstar Large Value Category Average is representative of funds that invest primarily in big U.S. companies that are less expensive or growing more slowly than other large-cap stocks. Results are based on average total returns of similar funds with all dividends and capital gain distributions reinvested. |
Key Fund Statistics
| Fund's net assets | $920,939,860 |
| Total number of portfolio holdings | 68 |
| Portfolio turnover rate | 21% |
Graphical Representation of Holdings
The tables below show the investment makeup of the Fund; percentages indicated are based on the Fund's net assets.
Top Ten Holdings and/or Issuers*
| JPMorgan Chase & Co. | 3.9% |
| Johnson & Johnson | 3.2% |
| UnitedHealth Group, Inc. | 2.7% |
| Cisco Systems, Inc. | 2.4% |
| Gilead Sciences, Inc. | 2.1% |
| American International Group, Inc. | 2.1% |
| Pfizer, Inc. | 1.9% |
| Johnson Controls International plc | 1.9% |
| Elevance Health, Inc. | 1.9% |
| Marsh & McLennan Cos., Inc. | 1.8% |
| * Excluding short-term investments |
Top Industries
| Pharmaceuticals | 9.2% |
| Oil, Gas & Consumable Fuels | 9.1% |
| Capital Markets | 8.2% |
| Banks | 7.9% |
| Insurance | 6.8% |
| Health Care Providers & Services | 6.3% |
| Communications Equipment | 3.6% |
| Multi–Utilities | 3.3% |
| Specialized REITs | 3.1% |
| Machinery | 2.8% |
Top Ten Holdings and/or Issuers*
| JPMorgan Chase & Co. | 3.9% |
| Johnson & Johnson | 3.2% |
| UnitedHealth Group, Inc. | 2.7% |
| Cisco Systems, Inc. | 2.4% |
| Gilead Sciences, Inc. | 2.1% |
| American International Group, Inc. | 2.1% |
| Pfizer, Inc. | 1.9% |
| Johnson Controls International plc | 1.9% |
| Elevance Health, Inc. | 1.9% |
| Marsh & McLennan Cos., Inc. | 1.8% |
| * Excluding short-term investments |
What were the Fund costs for the last six months?
(Based on a hypothetical $10,000 investment)
| Share Class Name | Costs of a $10,000 investment | Costs paid as a percentage of a $10,000 investment1 |
| Class R6 | $34 | 0.70% |
| 1. | Annualized. |
Fund Performance
The following graph compares the initial and subsequent account values at the end of each of the most recently completed 10 semiannual reporting periods of the Fund (or for the life of the Fund, if shorter). It assumes a $10,000 initial investment at the beginning of the first fiscal period in an appropriate, broad-based securities market index and other additional indexes, if applicable, for the same period and reflects the deduction of all sales charges, where applicable.
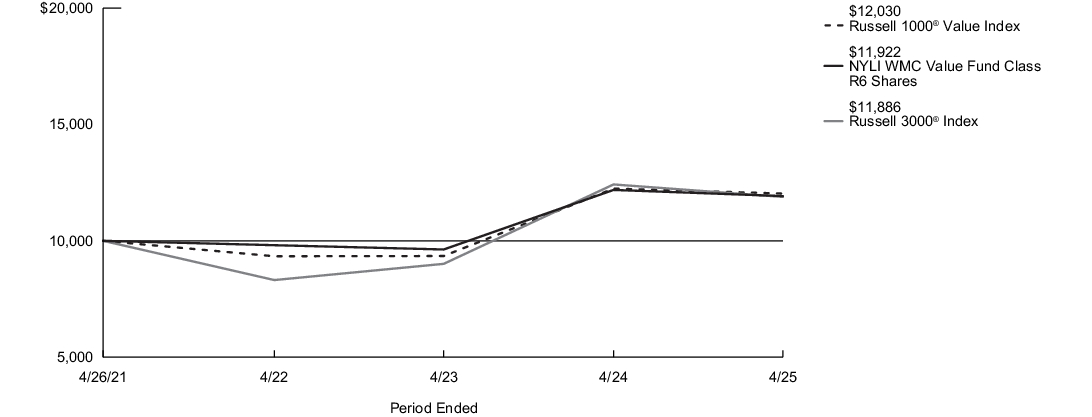
| Average Annual Total Returns for the Period Ended April 30, 2025 | Inception Date |
Six Months1 |
One Year |
Since Inception |
| Class R6 Shares | 4/26/2021 | (2.43)% | 8.21% | 5.97% |
| Russell 3000®Index2 | (2.15)% | 11.40% | 7.46% | |
| Russell 1000® Value Index3 | (1.86)% | 8.55% | 6.08% | |
| Morningstar Large Value Category Average4 | (2.27)% | 7.57% | 6.57% |
| 1. |
Not annualized. |
| 2. |
The Fund has selected the Russell 3000® Index to represent a broad measure of market performance. The Russell 3000® Index measures the performance of the largest 3,000 U.S. companies representing approximately 98% of the investable U.S. equity market. |
| 3. |
The Russell 1000® Value Index, which is generally representative of the market sectors or types of investments in which the Fund invests, measures the performance of the large-cap value segment of the U.S. equity universe. It includes those Russell 1000® Index companies with lower price-to-book ratios and lower expected growth values. |
| 4. |
The Morningstar Large Value Category Average is representative of funds that invest primarily in big U.S. companies that are less expensive or growing more slowly than other large-cap stocks. Results are based on average total returns of similar funds with all dividends and capital gain distributions reinvested. |
Key Fund Statistics
| Fund's net assets | $920,939,860 |
| Total number of portfolio holdings | 68 |
| Portfolio turnover rate | 21% |
Graphical Representation of Holdings
The tables below show the investment makeup of the Fund; percentages indicated are based on the Fund's net assets.
Top Ten Holdings and/or Issuers*
| JPMorgan Chase & Co. | 3.9% |
| Johnson & Johnson | 3.2% |
| UnitedHealth Group, Inc. | 2.7% |
| Cisco Systems, Inc. | 2.4% |
| Gilead Sciences, Inc. | 2.1% |
| American International Group, Inc. | 2.1% |
| Pfizer, Inc. | 1.9% |
| Johnson Controls International plc | 1.9% |
| Elevance Health, Inc. | 1.9% |
| Marsh & McLennan Cos., Inc. | 1.8% |
| * Excluding short-term investments |
Top Industries
| Pharmaceuticals | 9.2% |
| Oil, Gas & Consumable Fuels | 9.1% |
| Capital Markets | 8.2% |
| Banks | 7.9% |
| Insurance | 6.8% |
| Health Care Providers & Services | 6.3% |
| Communications Equipment | 3.6% |
| Multi–Utilities | 3.3% |
| Specialized REITs | 3.1% |
| Machinery | 2.8% |
Top Ten Holdings and/or Issuers*
| JPMorgan Chase & Co. | 3.9% |
| Johnson & Johnson | 3.2% |
| UnitedHealth Group, Inc. | 2.7% |
| Cisco Systems, Inc. | 2.4% |
| Gilead Sciences, Inc. | 2.1% |
| American International Group, Inc. | 2.1% |
| Pfizer, Inc. | 1.9% |
| Johnson Controls International plc | 1.9% |
| Elevance Health, Inc. | 1.9% |
| Marsh & McLennan Cos., Inc. | 1.8% |
| * Excluding short-term investments |
What were the Fund costs for the last six months?
(Based on a hypothetical $10,000 investment)
| Share Class Name | Costs of a $10,000 investment | Costs paid as a percentage of a $10,000 investment1 |
| Investor Class | $61 | 1.25% |
| 1. | Annualized. |
Fund Performance
The following graph compares the initial and subsequent account values at the end of each of the most recently completed 10 semiannual reporting periods of the Fund (or for the life of the Fund, if shorter). It assumes a $10,000 initial investment at the beginning of the first fiscal period in an appropriate, broad-based securities market index and other additional indexes, if applicable, for the same period and reflects the deduction of all sales charges, where applicable. One of the Fund's subadvisors changed effective January 9, 2017, and the Fund's principal investment strategies changed effective February 28, 2017 and March 13, 2017. Effective April 26, 2021, the Fund replaced both of its subadvisors and modified its principal investment strategies. The past performance in the graph and table prior to that date reflects the Fund’s prior subadvisors and principal investment strategies.
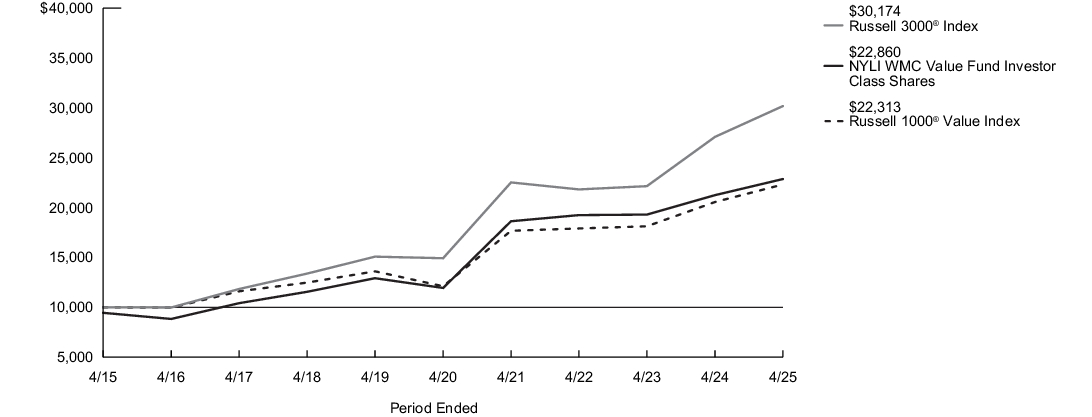
| Average Annual Total Returns for the Period Ended April 30, 2025 | Inception Date |
Six Months1 |
One Year |
Five Years |
Ten Years |
| Investor Class Shares - Including sales charges | 2/28/2008 | (7.55)% | 2.23% | 12.59% | 8.62% |
| Investor Class Shares - Excluding sales charges | (2.68)% | 7.61% | 13.87% | 9.24% | |
| Russell 3000®Index2 | (2.15)% | 11.40% | 15.12% | 11.68% | |
| Russell 1000® Value Index3 | (1.86)% | 8.55% | 13.00% | 8.36% | |
| Morningstar Large Value Category Average4 | (2.27)% | 7.57% | 13.36% | 8.45% |
| 1. |
Not annualized. |
| 2. |
The Fund has selected the Russell 3000® Index to represent a broad measure of market performance. The Russell 3000® Index measures the performance of the largest 3,000 U.S. companies representing approximately 98% of the investable U.S. equity market. |
| 3. |
The Russell 1000® Value Index, which is generally representative of the market sectors or types of investments in which the Fund invests, measures the performance of the large-cap value segment of the U.S. equity universe. It includes those Russell 1000® Index companies with lower price-to-book ratios and lower expected growth values. |
| 4. |
The Morningstar Large Value Category Average is representative of funds that invest primarily in big U.S. companies that are less expensive or growing more slowly than other large-cap stocks. Results are based on average total returns of similar funds with all dividends and capital gain distributions reinvested. |
Key Fund Statistics
| Fund's net assets | $920,939,860 |
| Total number of portfolio holdings | 68 |
| Portfolio turnover rate | 21% |
Graphical Representation of Holdings
The tables below show the investment makeup of the Fund; percentages indicated are based on the Fund's net assets.
Top Ten Holdings and/or Issuers*
| JPMorgan Chase & Co. | 3.9% |
| Johnson & Johnson | 3.2% |
| UnitedHealth Group, Inc. | 2.7% |
| Cisco Systems, Inc. | 2.4% |
| Gilead Sciences, Inc. | 2.1% |
| American International Group, Inc. | 2.1% |
| Pfizer, Inc. | 1.9% |
| Johnson Controls International plc | 1.9% |
| Elevance Health, Inc. | 1.9% |
| Marsh & McLennan Cos., Inc. | 1.8% |
| * Excluding short-term investments |
Top Industries
| Pharmaceuticals | 9.2% |
| Oil, Gas & Consumable Fuels | 9.1% |
| Capital Markets | 8.2% |
| Banks | 7.9% |
| Insurance | 6.8% |
| Health Care Providers & Services | 6.3% |
| Communications Equipment | 3.6% |
| Multi–Utilities | 3.3% |
| Specialized REITs | 3.1% |
| Machinery | 2.8% |
Top Ten Holdings and/or Issuers*
| JPMorgan Chase & Co. | 3.9% |
| Johnson & Johnson | 3.2% |
| UnitedHealth Group, Inc. | 2.7% |
| Cisco Systems, Inc. | 2.4% |
| Gilead Sciences, Inc. | 2.1% |
| American International Group, Inc. | 2.1% |
| Pfizer, Inc. | 1.9% |
| Johnson Controls International plc | 1.9% |
| Elevance Health, Inc. | 1.9% |
| Marsh & McLennan Cos., Inc. | 1.8% |
| * Excluding short-term investments |
| [1] | Annualized. |
| [2] | Annualized. |
| [3] | Reflects fee waivers and/or expense reimbursements, without which expenses would have been higher. |
| [4] | Annualized. |
| [5] | Reflects fee waivers and/or expense reimbursements, without which expenses would have been higher. |
| [6] | Annualized. |
| [7] | Annualized. |
| [8] | Reflects fee waivers and/or expense reimbursements, without which expenses would have been higher. |
| [9] | Annualized. |
| [10] | Reflects fee waivers and/or expense reimbursements, without which expenses would have been higher. |
| [11] | Annualized. |
| [12] | Reflects fee waivers and/or expense reimbursements, without which expenses would have been higher. |
| [13] | Annualized. |
| [14] | Reflects fee waivers and/or expense reimbursements, without which expenses would have been higher. |
| [15] | Annualized. |
| [16] | Annualized. |
| [17] | Reflects fee waivers and/or expense reimbursements, without which expenses would have been higher. |
| [18] | Annualized. |
| [19] | Annualized. |
| [20] | Annualized. |
| [21] | Annualized. |
| [22] | Annualized. |
| [23] | Annualized. |
| [24] | Annualized. |
| [25] | Annualized. |
| [26] | Annualized. |
| [27] | Annualized. |
| [28] | Reflects fee waivers and/or expense reimbursements, without which expenses would have been higher. |
| [29] | Annualized. |
| [30] | Reflects fee waivers and/or expense reimbursements, without which expenses would have been higher. |
| [31] | Annualized. |
| [32] | Annualized. |
| [33] | Annualized. |
| [34] | Annualized. |
| [35] | Annualized. |
| [36] | Annualized. |
| [37] | Annualized. |
| [38] | Annualized. |
| [39] | Annualized. |
| [40] | Annualized. |
| [41] | Reflects fee waivers and/or expense reimbursements, without which expenses would have been higher. |
| [42] | Annualized. |
| [43] | Annualized. |
| [44] | Annualized. |
| [45] | Reflects fee waivers and/or expense reimbursements, without which expenses would have been higher. |
| [46] | Annualized. |
| [47] | Annualized. |
| [48] | Annualized. |
| [49] | Reflects fee waivers and/or expense reimbursements, without which expenses would have been higher. |
| [50] | Annualized. |
| [51] | Annualized. |
| [52] | Reflects fee waivers and/or expense reimbursements, without which expenses would have been higher. |
| [53] | Annualized. |
| [54] | Reflects fee waivers and/or expense reimbursements, without which expenses would have been higher. |
| [55] | Annualized. |
| [56] | Reflects fee waivers and/or expense reimbursements, without which expenses would have been higher. |
| [57] | Annualized. |
| [58] | Reflects fee waivers and/or expense reimbursements, without which expenses would have been higher. |
| [59] | Annualized. |
| [60] | Annualized. |
| [61] | Annualized. |
| [62] | Annualized. |
| [63] | Annualized. |
| [64] | Annualized. |
| [65] | Reflects fee waivers and/or expense reimbursements, without which expenses would have been higher. |
| [66] | Annualized. |
| [67] | Reflects fee waivers and/or expense reimbursements, without which expenses would have been higher. |
| [68] | Annualized. |
| [69] | Reflects fee waivers and/or expense reimbursements, without which expenses would have been higher. |
| [70] | Annualized. |
| [71] | Reflects fee waivers and/or expense reimbursements, without which expenses would have been higher. |
| [72] | Annualized. |
| [73] | Reflects fee waivers and/or expense reimbursements, without which expenses would have been higher. |
| [74] | Annualized. |
| [75] | Reflects fee waivers and/or expense reimbursements, without which expenses would have been higher. |
| [76] | Annualized. |
| [77] | Reflects fee waivers and/or expense reimbursements, without which expenses would have been higher. |
| [78] | Annualized. |
| [79] | Reflects fee waivers and/or expense reimbursements, without which expenses would have been higher. |
| [80] | Annualized. |
| [81] | Reflects fee waivers and/or expense reimbursements, without which expenses would have been higher. |
| [82] | Annualized. |
| [83] | Annualized. |
| [84] | Annualized. |
| [85] | Reflects fee waivers and/or expense reimbursements, without which expenses would have been higher. |
| [86] | Annualized. |
| [87] | Annualized. |