Shareholder Report
|
12 Months Ended |
|
Apr. 30, 2025
USD ($)
Holding
|
|---|
| Shareholder Report [Line Items] |
|
| Document Type |
N-CSR
|
| Amendment Flag |
false
|
| Registrant Name |
Northern Lights Fund Trust
|
| Entity Central Index Key |
0001314414
|
| Entity Investment Company Type |
N-1A
|
| Document Period End Date |
Apr. 30, 2025
|
| C000112720 |
|
| Shareholder Report [Line Items] |
|
| Fund Name |
Eagle Energy Infrastructure Fund
|
| Class Name |
Class A Shares
|
| Trading Symbol |
EGLAX
|
| Shareholder Report Annual or Semi-Annual |
Annual Shareholder Report
|
| Additional Information Phone Number |
1-888-868-9501
|
| Additional Information Website |
www.eaglemlpfund.com
|
| Expenses [Text Block] |
What were the Fund’s costs for the last year?(based on a hypothetical $10,000 investment) Class Name | Costs of a $10,000 investment | Costs paid as a percentage of a $10,000 investment |
|---|
Class A Shares | $186 | 1.65% |
|---|
|
| Expenses Paid, Amount |
$ 186
|
| Expense Ratio, Percent |
1.65%
|
| Performance Past Does Not Indicate Future [Text] |
The Fund's past performance is not a good predictor of how the Fund will perform in the future.
|
| No Deduction of Taxes [Text Block] |
The graph and table do not reflect the deduction of taxes that a shareholder would pay on fund distributions or redemption of fund shares.
|
| AssetsNet |
$ 226,818,248
|
| Holdings Count | Holding |
21
|
| Advisory Fees Paid, Amount |
$ 1,538,227
|
| InvestmentCompanyPortfolioTurnover |
32.00%
|
| Additional Fund Statistics [Text Block] |
Net Assets | $226,818,248 |
|---|
Number of Portfolio Holdings | 21 |
|---|
Advisory Fee (net of waivers) | $1,538,227 |
|---|
Portfolio Turnover | 32% |
|---|
|
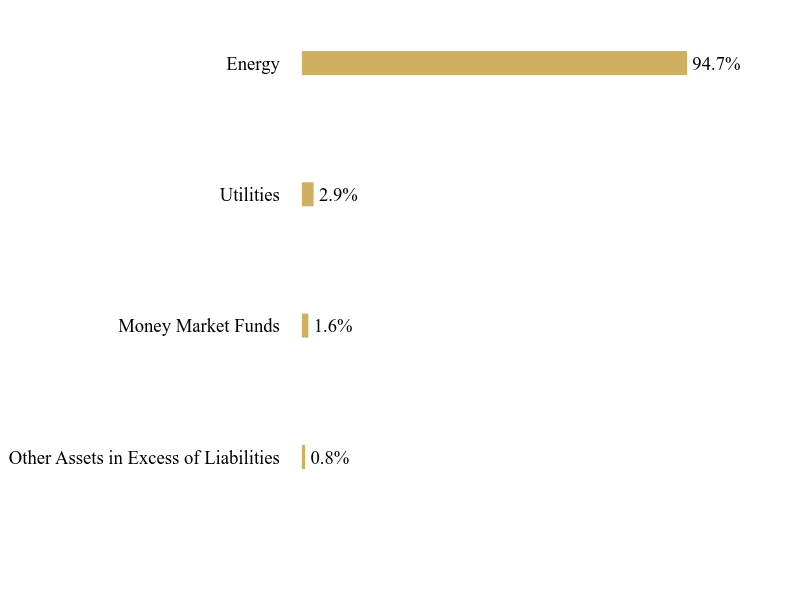
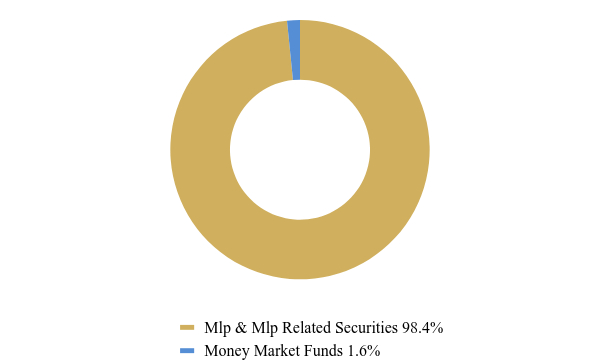
| Holdings [Text Block] |
Asset Weighting (% of total investments)Value | Value |
|---|
Mlp & Mlp Related Securities | 98.4% | Money Market Funds | 1.6% |
Sector Weighting (% of net assets)Value | Value |
|---|
Other Assets in Excess of Liabilities | 0.8% | Money Market Funds | 1.6% | Utilities | 2.9% | Energy | 94.7% |
Top 10 Holdings (% of net assets)Holding Name | % of Net Assets |
|---|
Targa Resources Corporation | 11.3% |
|---|
Plains GP Holdings, L.P., Class A | 11.0% |
|---|
Energy Transfer, L.P. | 9.9% |
|---|
Cheniere Energy, Inc. | 7.8% |
|---|
Western Midstream Partners, L.P. | 7.0% |
|---|
Kinder Morgan, Inc. | 4.9% |
|---|
Williams Companies, Inc. (The) | 4.9% |
|---|
DT Midstream, Inc. | 4.9% |
|---|
TC Energy Corporation | 4.9% |
|---|
Hess Midstream, L.P., Class A | 4.8% |
|---|
|
| C000124015 |
|
| Shareholder Report [Line Items] |
|
| Fund Name |
Eagle Energy Infrastructure Fund
|
| Class Name |
Class C Shares
|
| Trading Symbol |
EGLCX
|
| Shareholder Report Annual or Semi-Annual |
Annual Shareholder Report
|
| Additional Information Phone Number |
1-888-868-9501
|
| Additional Information Website |
www.eaglemlpfund.com
|
| Expenses [Text Block] |
What were the Fund’s costs for the last year?(based on a hypothetical $10,000 investment) Class Name | Costs of a $10,000 investment | Costs paid as a percentage of a $10,000 investment |
|---|
Class C Shares | $269 | 2.40% |
|---|
|
| Expenses Paid, Amount |
$ 269
|
| Expense Ratio, Percent |
2.40%
|
| Performance Past Does Not Indicate Future [Text] |
The Fund's past performance is not a good predictor of how the Fund will perform in the future.
|
| No Deduction of Taxes [Text Block] |
The graph and table do not reflect the deduction of taxes that a shareholder would pay on fund distributions or redemption of fund shares.
|
| AssetsNet |
$ 226,818,248
|
| Holdings Count | Holding |
21
|
| Advisory Fees Paid, Amount |
$ 1,538,227
|
| InvestmentCompanyPortfolioTurnover |
32.00%
|
| Additional Fund Statistics [Text Block] |
Net Assets | $226,818,248 |
|---|
Number of Portfolio Holdings | 21 |
|---|
Advisory Fee (net of waivers) | $1,538,227 |
|---|
Portfolio Turnover | 32% |
|---|
|
| Holdings [Text Block] |
Asset Weighting (% of total investments)Value | Value |
|---|
Mlp & Mlp Related Securities | 98.4% | Money Market Funds | 1.6% |
Sector Weighting (% of net assets)Value | Value |
|---|
Other Assets in Excess of Liabilities | 0.8% | Money Market Funds | 1.6% | Utilities | 2.9% | Energy | 94.7% |
Top 10 Holdings (% of net assets)Holding Name | % of Net Assets |
|---|
Targa Resources Corporation | 11.3% |
|---|
Plains GP Holdings, L.P., Class A | 11.0% |
|---|
Energy Transfer, L.P. | 9.9% |
|---|
Cheniere Energy, Inc. | 7.8% |
|---|
Western Midstream Partners, L.P. | 7.0% |
|---|
Kinder Morgan, Inc. | 4.9% |
|---|
Williams Companies, Inc. (The) | 4.9% |
|---|
DT Midstream, Inc. | 4.9% |
|---|
TC Energy Corporation | 4.9% |
|---|
Hess Midstream, L.P., Class A | 4.8% |
|---|
|
| C000112721 |
|
| Shareholder Report [Line Items] |
|
| Fund Name |
Eagle Energy Infrastructure Fund
|
| Class Name |
Class I Shares
|
| Trading Symbol |
EGLIX
|
| Shareholder Report Annual or Semi-Annual |
Annual Shareholder Report
|
| Additional Information Phone Number |
1-888-868-9501
|
| Additional Information Website |
www.eaglemlpfund.com
|
| Expenses [Text Block] |
What were the Fund’s costs for the last year?(based on a hypothetical $10,000 investment) Class Name | Costs of a $10,000 investment | Costs paid as a percentage of a $10,000 investment |
|---|
Class I Shares | $158 | 1.40% |
|---|
|
| Expenses Paid, Amount |
$ 158
|
| Expense Ratio, Percent |
1.40%
|
| Performance Past Does Not Indicate Future [Text] |
The Fund's past performance is not a good predictor of how the Fund will perform in the future.
|
| No Deduction of Taxes [Text Block] |
The graph and table do not reflect the deduction of taxes that a shareholder would pay on fund distributions or redemption of fund shares.
|
| AssetsNet |
$ 226,818,248
|
| Holdings Count | Holding |
21
|
| Advisory Fees Paid, Amount |
$ 1,538,227
|
| InvestmentCompanyPortfolioTurnover |
32.00%
|
| Additional Fund Statistics [Text Block] |
Net Assets | $226,818,248 |
|---|
Number of Portfolio Holdings | 21 |
|---|
Advisory Fee (net of waivers) | $1,538,227 |
|---|
Portfolio Turnover | 32% |
|---|
|
| Holdings [Text Block] |
Asset Weighting (% of total investments)Value | Value |
|---|
Mlp & Mlp Related Securities | 98.4% | Money Market Funds | 1.6% |
Sector Weighting (% of net assets)Value | Value |
|---|
Other Assets in Excess of Liabilities | 0.8% | Money Market Funds | 1.6% | Utilities | 2.9% | Energy | 94.7% |
Top 10 Holdings (% of net assets)Holding Name | % of Net Assets |
|---|
Targa Resources Corporation | 11.3% |
|---|
Plains GP Holdings, L.P., Class A | 11.0% |
|---|
Energy Transfer, L.P. | 9.9% |
|---|
Cheniere Energy, Inc. | 7.8% |
|---|
Western Midstream Partners, L.P. | 7.0% |
|---|
Kinder Morgan, Inc. | 4.9% |
|---|
Williams Companies, Inc. (The) | 4.9% |
|---|
DT Midstream, Inc. | 4.9% |
|---|
TC Energy Corporation | 4.9% |
|---|
Hess Midstream, L.P., Class A | 4.8% |
|---|
|
| C000203318 |
|
| Shareholder Report [Line Items] |
|
| Fund Name |
Eagle Energy Infrastructure Fund
|
| Class Name |
Class N Shares
|
| Trading Symbol |
EGLNX
|
| Shareholder Report Annual or Semi-Annual |
Annual Shareholder Report
|
| Additional Information Phone Number |
1-888-868-9501
|
| Additional Information Website |
www.eaglemlpfund.com
|
| Expenses [Text Block] |
What were the Fund’s costs for the last year?(based on a hypothetical $10,000 investment) Class Name | Costs of a $10,000 investment | Costs paid as a percentage of a $10,000 investment |
|---|
Class N Shares | $142 | 1.26% |
|---|
|
| Expenses Paid, Amount |
$ 142
|
| Expense Ratio, Percent |
1.26%
|
| Performance Past Does Not Indicate Future [Text] |
The Fund's past performance is not a good predictor of how the Fund will perform in the future.
|
| Performance Inception Date |
Aug. 16, 2018
|
| No Deduction of Taxes [Text Block] |
The graph and table do not reflect the deduction of taxes that a shareholder would pay on fund distributions or redemption of fund shares.
|
| AssetsNet |
$ 226,818,248
|
| Holdings Count | Holding |
21
|
| Advisory Fees Paid, Amount |
$ 1,538,227
|
| InvestmentCompanyPortfolioTurnover |
32.00%
|
| Additional Fund Statistics [Text Block] |
Net Assets | $226,818,248 |
|---|
Number of Portfolio Holdings | 21 |
|---|
Advisory Fee (net of waivers) | $1,538,227 |
|---|
Portfolio Turnover | 32% |
|---|
|
| Holdings [Text Block] |
Asset Weighting (% of total investments)Value | Value |
|---|
Mlp & Mlp Related Securities | 98.4% | Money Market Funds | 1.6% |
Sector Weighting (% of net assets)Value | Value |
|---|
Other Assets in Excess of Liabilities | 0.8% | Money Market Funds | 1.6% | Utilities | 2.9% | Energy | 94.7% |
Top 10 Holdings (% of net assets)Holding Name | % of Net Assets |
|---|
Targa Resources Corporation | 11.3% |
|---|
Plains GP Holdings, L.P., Class A | 11.0% |
|---|
Energy Transfer, L.P. | 9.9% |
|---|
Cheniere Energy, Inc. | 7.8% |
|---|
Western Midstream Partners, L.P. | 7.0% |
|---|
Kinder Morgan, Inc. | 4.9% |
|---|
Williams Companies, Inc. (The) | 4.9% |
|---|
DT Midstream, Inc. | 4.9% |
|---|
TC Energy Corporation | 4.9% |
|---|
Hess Midstream, L.P., Class A | 4.8% |
|---|
|