Shareholder Report
Apr. 30, 2025
USD ($)
$ / shares
https://logancapitalfunds.com/regulatory-info. You can also request this information by contacting us at 1-800-617-0004.
WHAT WERE THE FUND COSTS FOR THE PAST YEAR? (based on a hypothetical $10,000 investment)
|
Fund Name
|
Costs of a $10,000 investment
|
Costs paid as a percentage of a $10,000 investment
|
|
Logan Capital Broad Innovative Growth ETF
|
$96
|
0.90%
|
HOW DID THE FUND PERFORM LAST YEAR AND WHAT AFFECTED ITS PERFORMANCE?
Overview of Trailing Performance
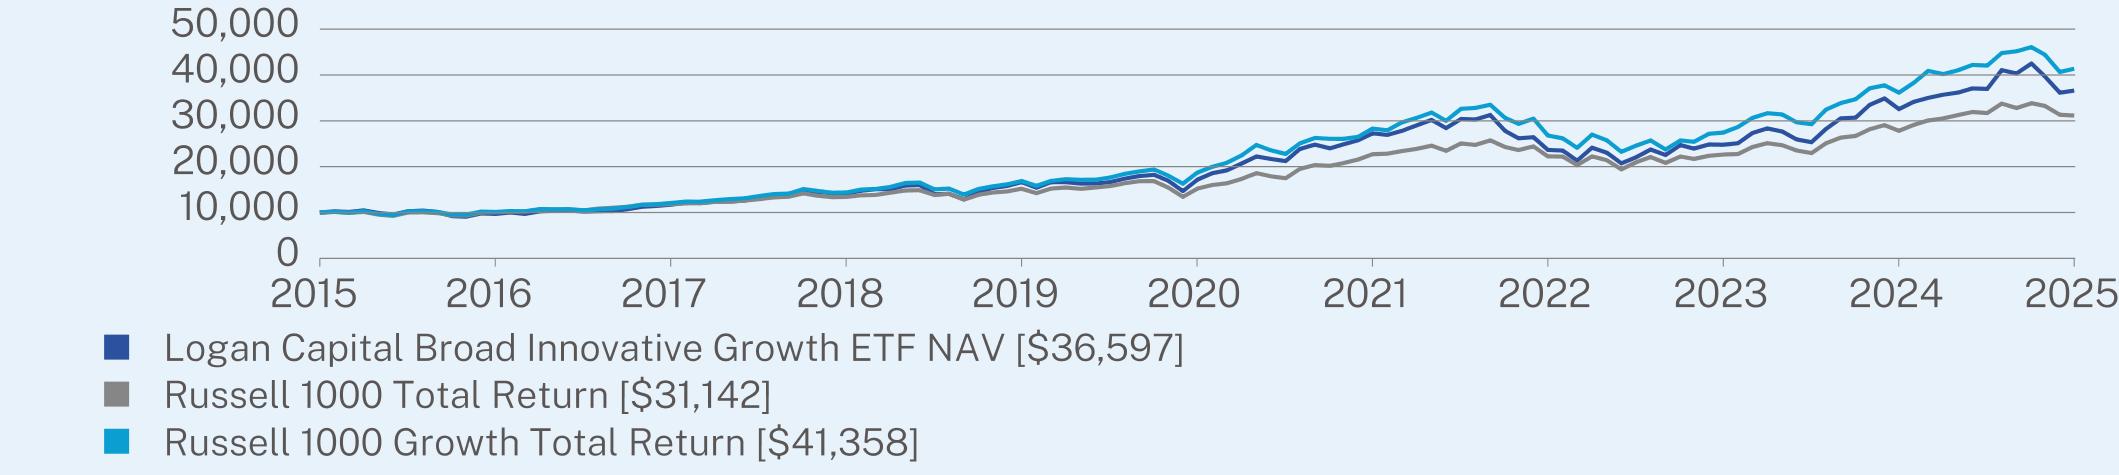
During the 12-month trailing period ending April 30, 2025 The Logan Capital Broad Innovative Growth ETF delivered a NAV total return of 12.40%, modestly beating the Russell 1000 Total Return Index, which returned 11.94%. Performance reflected Logan’s disciplined strategy and selective exposure to innovation-driven companies across sectors.
Market Context
The market environment over the reporting period was marked by evolving investor sentiment and sector rotation. While innovation-focused equities led early on, performance later shifted toward more defensive areas and international markets. Mega-cap technology names, particularly those associated with AI, experienced valuation consolidation following substantial gains in the prior year, while traditional retail sectors demonstrated renewed strength.
Investment Strategy and Positioning
Logan’s team used periods of strength in well-known technology names as opportunities to realize gains and reallocate capital to positions with more substantial relative upside. The team emphasized adding exposure to businesses with durable fundamentals that had underperformed, along with emerging companies leading in AI and next-generation infrastructure.
Portfolio Drivers and Sector Influence
The Fund’s relative performance compared to the benchmark was partly due to a more balanced approach that avoided overconcentration in a few mega-cap names, thereby driving index-level returns. Positive contributions came from selective holdings in software, media & entertainment and semiconductors—areas that reflect Logan’s focus on resilience, adaptability, and innovation-led growth.
|
Top Contributors
|
|
|
↑
|
Information Technology
|
|
↑
|
Communication Services
|
|
↑
|
Netflix
|
|
↑
|
AppLovin
|
|
↑
|
Broadcom
|
|
Top Detractors
|
|
|
↓
|
Consumer Staples
|
|
↓
|
Health Care
|
|
↓
|
e.l.f. Beauty
|
|
↓
|
Lincoln Electric
|
|
↓
|
lululemon
|
ANNUAL AVERAGE TOTAL RETURN (%)
|
|
1 Year
|
5 Year
|
10 Year
|
|
Logan Capital Broad Innovative Growth ETF NAV
|
12.40
|
16.36
|
13.85
|
|
Russell 1000 Total Return
|
11.94
|
15.42
|
12.03
|
|
Russell 1000 Growth Total Return
|
14.41
|
17.20
|
15.25
|
Visit https://logancapitalfunds.com/regulatory-info for more recent performance information.
Visit https://logancapitalfunds.com/regulatory-info for more recent performance information.
KEY FUND STATISTICS (as of April 30, 2025)
|
Net Assets
|
$68,999,583
|
|
Number of Holdings
|
56
|
|
Net Advisory Fee
|
$460,434
|
|
Portfolio Turnover
|
5%
|
|
30-Day SEC Yield
|
-0.04%
|
|
30-Day SEC Yield Unsubsidized
|
-0.04%
|
|
Top 10 Issuers
|
(%)
|
|
Netflix, Inc.
|
6.2%
|
|
MasterCard, Inc.
|
5.2%
|
|
AppLovin Corp.
|
5.1%
|
|
Amphenol Corp.
|
5.0%
|
|
Broadcom, Inc.
|
5.0%
|
|
Apple, Inc.
|
4.7%
|
|
KLA Corp.
|
4.5%
|
|
Alphabet, Inc.
|
4.3%
|
|
Amazon.com, Inc.
|
4.2%
|
|
Meta Platforms, Inc.
|
4.1%
|
|
Top Sectors
|
(%)
|
|
Information Technology
|
31.1%
|
|
Consumer Discretionary
|
19.1%
|
|
Communication Services
|
16.7%
|
|
Industrials
|
16.4%
|
|
Financials
|
8.5%
|
|
Health Care
|
4.2%
|
|
Materials
|
2.4%
|
|
Consumer Staples
|
1.1%
|
|
Cash & Other
|
0.5%
|