| MEDIOBANCA “ONE BRAND – ONE CULTURE” Strategic plan rolling to FY28 Milan, 27 June 2025 |
| 2 DISCLAIMER The economic and financial projections for the period 2025-2028 have been prepared on a stand-alone basis and do not take into account the effects of the acquisition of Banca Generali, announced on 28 April 2025 and expected to be finalized by the end of the year. Furthermore, the aforementioned projections do not reflect the impact of external or unforeseeable events at the time the Plan was prepared, including any negative effects deriving from the public exchange offer launched on MB by MPS, transaction which, as already communicated, does not have any industrial logic, does not create value for Mediobanca's shareholders and risks compromising the Bank's profitable and sustainable growth strategy. In the event that the acquisition of Banca Generali is completed, the Group will prepare a Plan for the combined entity, which will reflect the new configuration and consolidated objectives of the resulting scope. |
| AGENDA Section 1. MB investment case Section 2. Group ambitions & financials Section 3. Divisional ambitions 3.1 Wealth Management 3.2 Corporate & Investment Banking 3.3 Consumer Finance Section 4. Closing remarks Annexes |
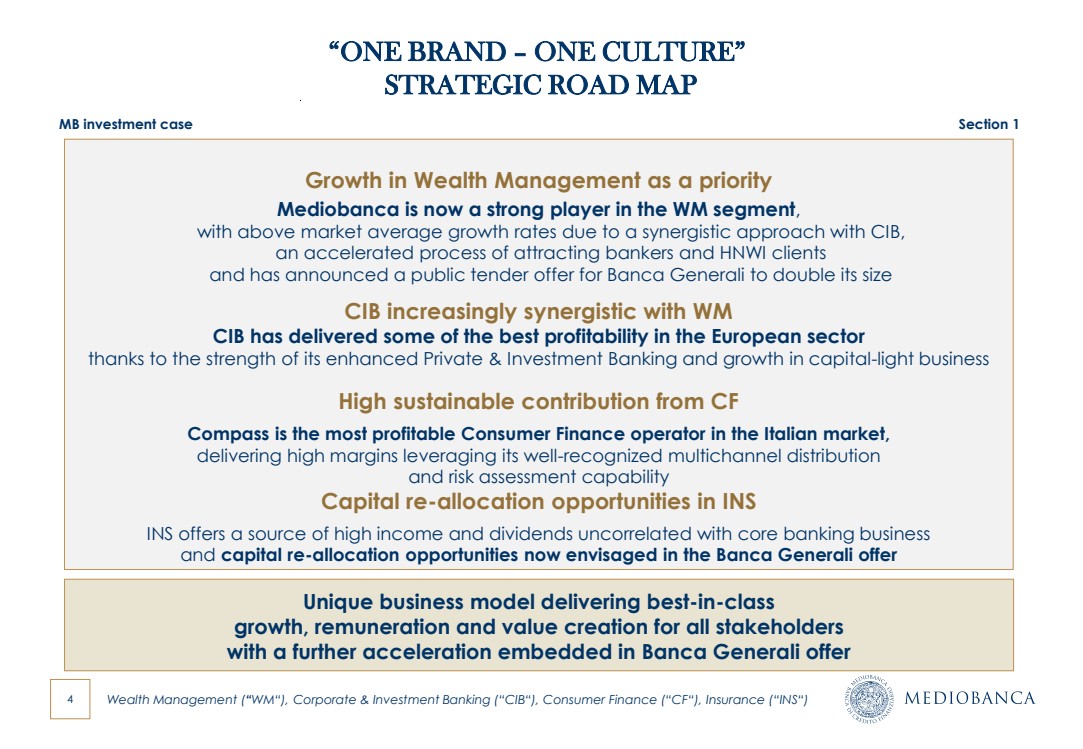
| 4 “ONE BRAND – ONE CULTURE” STRATEGIC ROAD MAP Growth in Wealth Management as a priority Mediobanca is now a strong player in the WM segment, with above market average growth rates due to a synergistic approach with CIB, an accelerated process of attracting bankers and HNWI clients and has announced a public tender offer for Banca Generali to double its size CIB increasingly synergistic with WM CIB has delivered some of the best profitability in the European sector thanks to the strength of its enhanced Private & Investment Banking and growth in capital-light business High sustainable contribution from CF Compass is the most profitable Consumer Finance operator in the Italian market, delivering high margins leveraging its well-recognized multichannel distribution and risk assessment capability Capital re-allocation opportunities in INS INS offers a source of high income and dividends uncorrelated with core banking business and capital re-allocation opportunities now envisaged in the Banca Generali offer Wealth Management (“WM“), Corporate & Investment Banking (“CIB“), Consumer Finance (“CF“), Insurance (“INS“) MB investment case Section 1 Unique business model delivering best-in-class growth, remuneration and value creation for all stakeholders with a further acceleration embedded in Banca Generali offer |
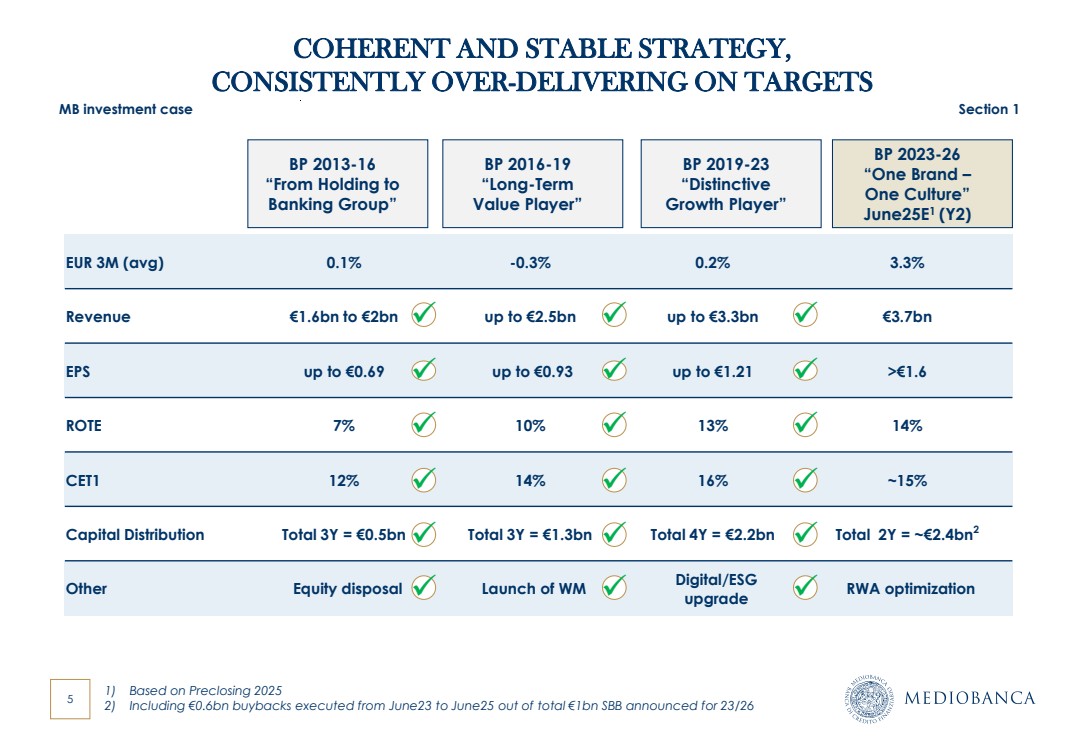
| 5 EUR 3M (avg) 0.1% -0.3% 0.2% 3.3% Revenue €1.6bn to €2bn up to €2.5bn up to €3.3bn €3.7bn EPS up to €0.69 up to €0.93 up to €1.21 >€1.6 ROTE 7% 10% 13% 14% CET1 12% 14% 16% ~15% Capital Distribution Total 3Y = €0.5bn Total 3Y = €1.3bn Total 4Y = €2.2bn Total 2Y = ~€2.4bn2 Other Equity disposal Launch of WM Digital/ESG upgrade RWA optimization ✓ COHERENT AND STABLE STRATEGY, CONSISTENTLY OVER-DELIVERING ON TARGETS ✓ ✓ ✓ ✓ ✓ BP 2016-19 “Long-Term Value Player” BP 2019-23 “Distinctive Growth Player” BP 2013-16 “From Holding to Banking Group” BP 2023-26 “One Brand – One Culture” June25E1 (Y2) ✓ ✓ ✓ ✓ ✓ ✓ ✓ ✓ ✓ ✓ ✓ ✓ 1) Based on Preclosing 2025 2) Including €0.6bn buybacks executed from June23 to June25 out of total €1bn SBB announced for 23/26 MB investment case Section 1 |
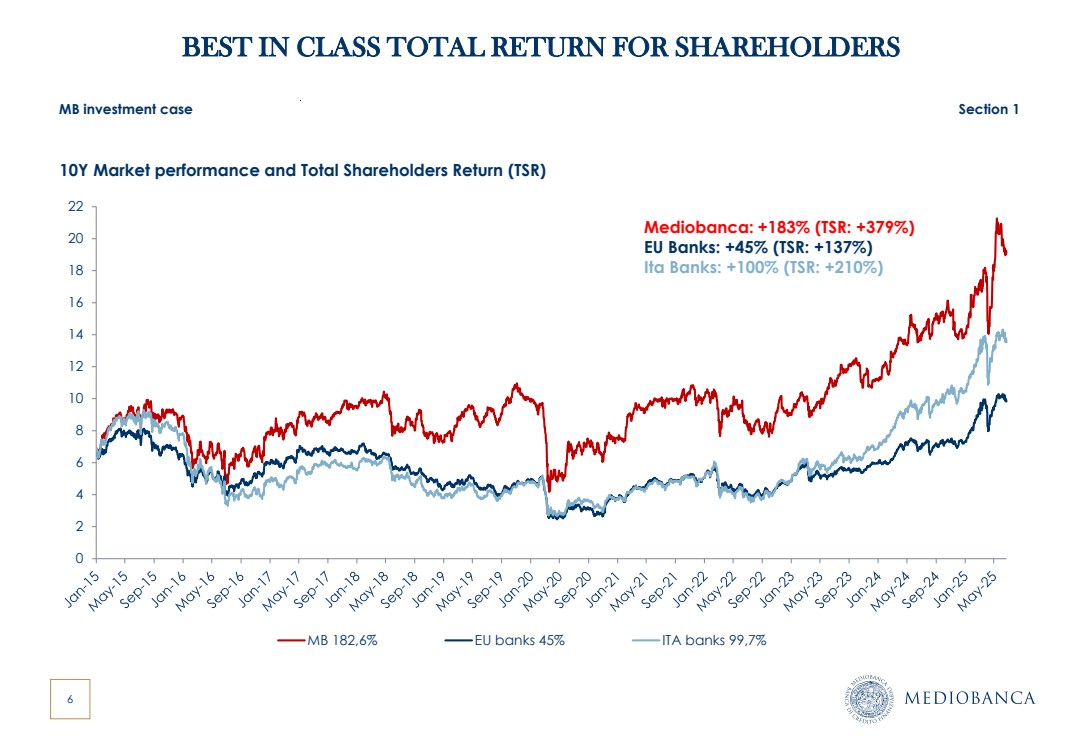
| 6 BEST IN CLASS TOTAL RETURN FOR SHAREHOLDERS MB investment case Section 1 10Y Market performance and Total Shareholders Return (TSR) 0 2 4 6 8 10 12 14 16 18 20 22 MB 182,6% EU banks 45% ITA banks 99,7% Mediobanca: +183% (TSR: +379%) EU Banks: +45% (TSR: +137%) Ita Banks: +100% (TSR: +210%) |
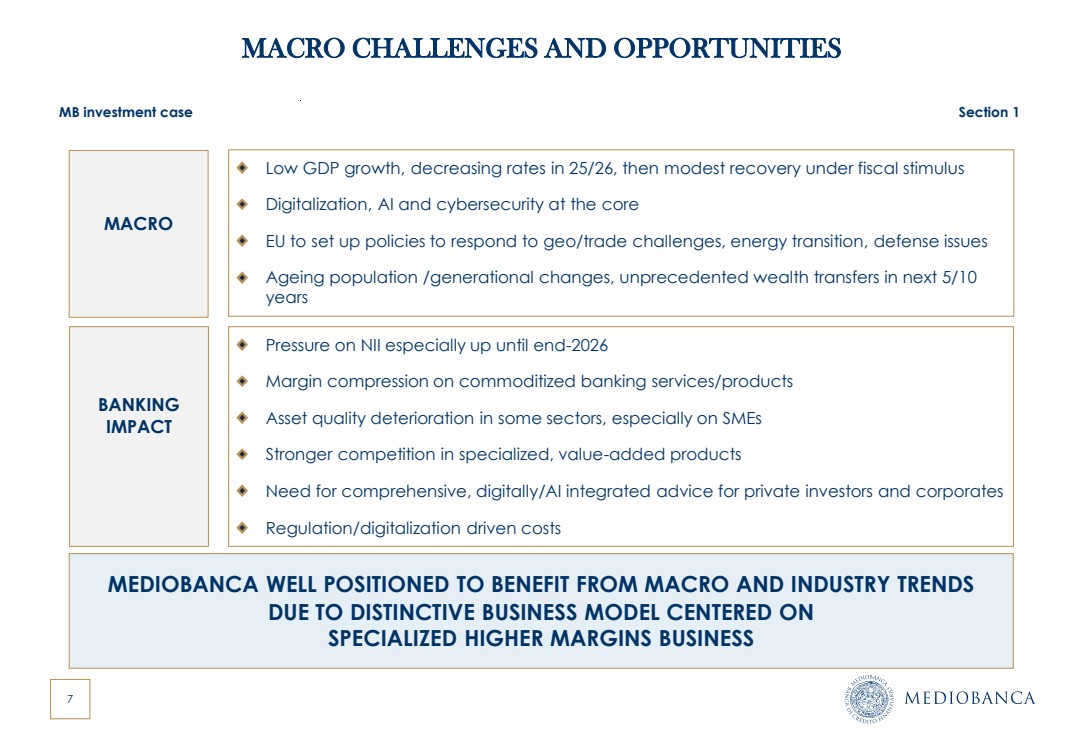
| 7 MACRO CHALLENGES AND OPPORTUNITIES Low GDP growth, decreasing rates in 25/26, then modest recovery under fiscal stimulus Digitalization, AI and cybersecurity at the core EU to set up policies to respond to geo/trade challenges, energy transition, defense issues Ageing population /generational changes, unprecedented wealth transfers in next 5/10 years Pressure on NII especially up until end-2026 Margin compression on commoditized banking services/products Asset quality deterioration in some sectors, especially on SMEs Stronger competition in specialized, value-added products Need for comprehensive, digitally/AI integrated advice for private investors and corporates Regulation/digitalization driven costs BANKING IMPACT MACRO MB investment case Section 1 MEDIOBANCA WELL POSITIONED TO BENEFIT FROM MACRO AND INDUSTRY TRENDS DUE TO DISTINCTIVE BUSINESS MODEL CENTERED ON SPECIALIZED HIGHER MARGINS BUSINESS |
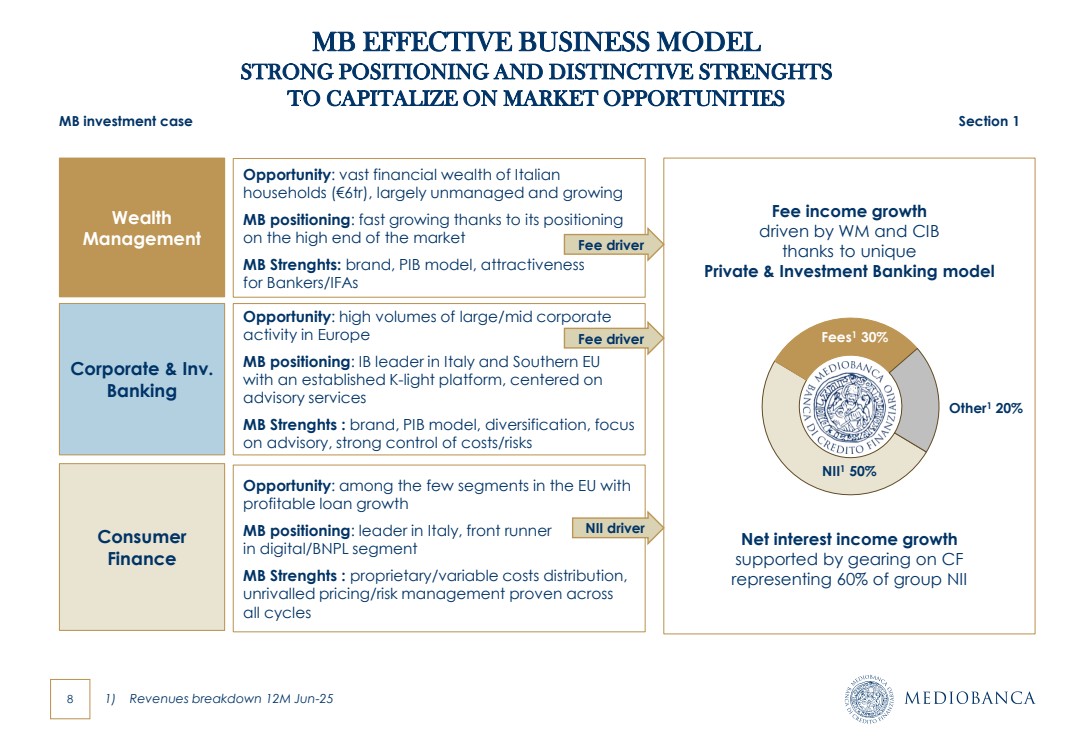
| 8 Wealth Management Consumer Finance Corporate & Inv. Banking MB EFFECTIVE BUSINESS MODEL STRONG POSITIONING AND DISTINCTIVE STRENGHTS TO CAPITALIZE ON MARKET OPPORTUNITIES NII1 50% Fees1 30% Other1 20% Opportunity: vast financial wealth of Italian households (€6tr), largely unmanaged and growing MB positioning: fast growing thanks to its positioning on the high end of the market MB Strenghts: brand, PIB model, attractiveness for Bankers/IFAs Opportunity: high volumes of large/mid corporate activity in Europe MB positioning: IB leader in Italy and Southern EU with an established K-light platform, centered on advisory services MB Strenghts : brand, PIB model, diversification, focus on advisory, strong control of costs/risks Opportunity: among the few segments in the EU with profitable loan growth MB positioning: leader in Italy, front runner in digital/BNPL segment MB Strenghts : proprietary/variable costs distribution, unrivalled pricing/risk management proven across all cycles 1) Revenues breakdown 12M Jun-25 Net interest income growth supported by gearing on CF representing 60% of group NII Fee income growth driven by WM and CIB thanks to unique Private & Investment Banking model Fee driver Fee driver NII driver MB investment case Section 1 |
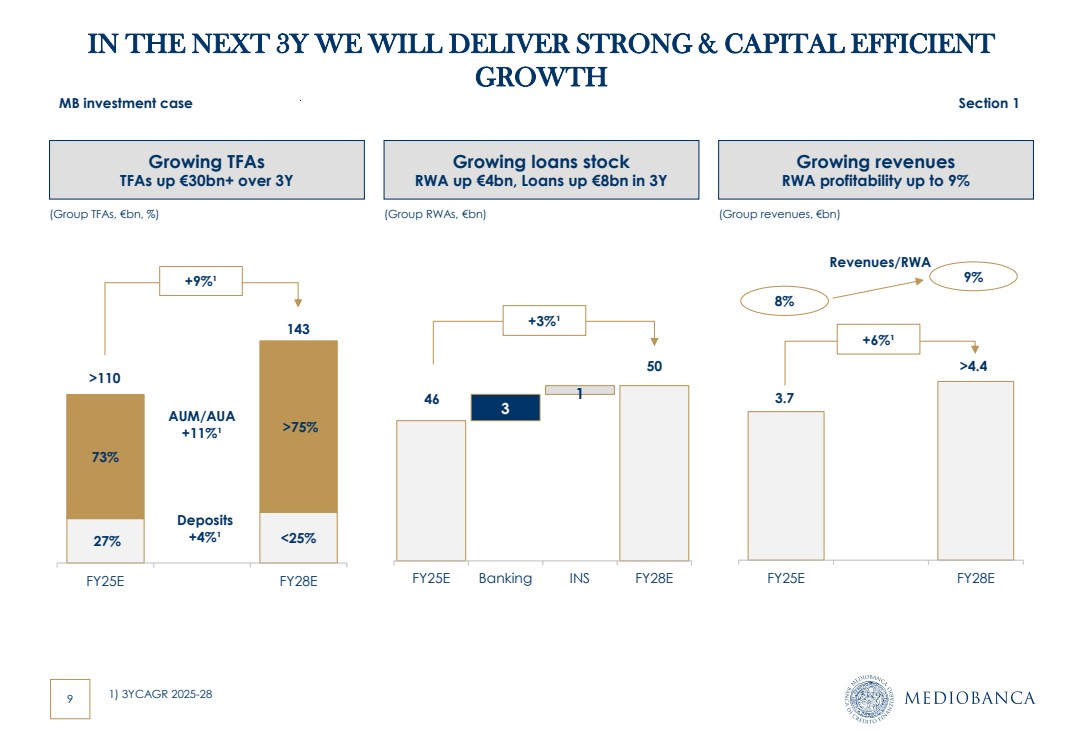
| 9 Revenues/RWA FY25E FY28E 3 1 FY25E Banking INS FY28E Growing revenues RWA profitability up to 9% >4.4 Growing TFAs TFAs up €30bn+ over 3Y Growing loans stock RWA up €4bn, Loans up €8bn in 3Y 27% <25% 73% >75% FY25E FY28E (Group TFAs, €bn, %) 1) 3YCAGR 2025-28 >110 143 +9%¹ 46 50 +3%¹ 3.7 AUM/AUA +11%¹ Deposits +4%¹ MB investment case Section 1 IN THE NEXT 3Y WE WILL DELIVER STRONG & CAPITAL EFFICIENT GROWTH (Group RWAs, €bn) (Group revenues, €bn) 8% 9% +6%¹ |
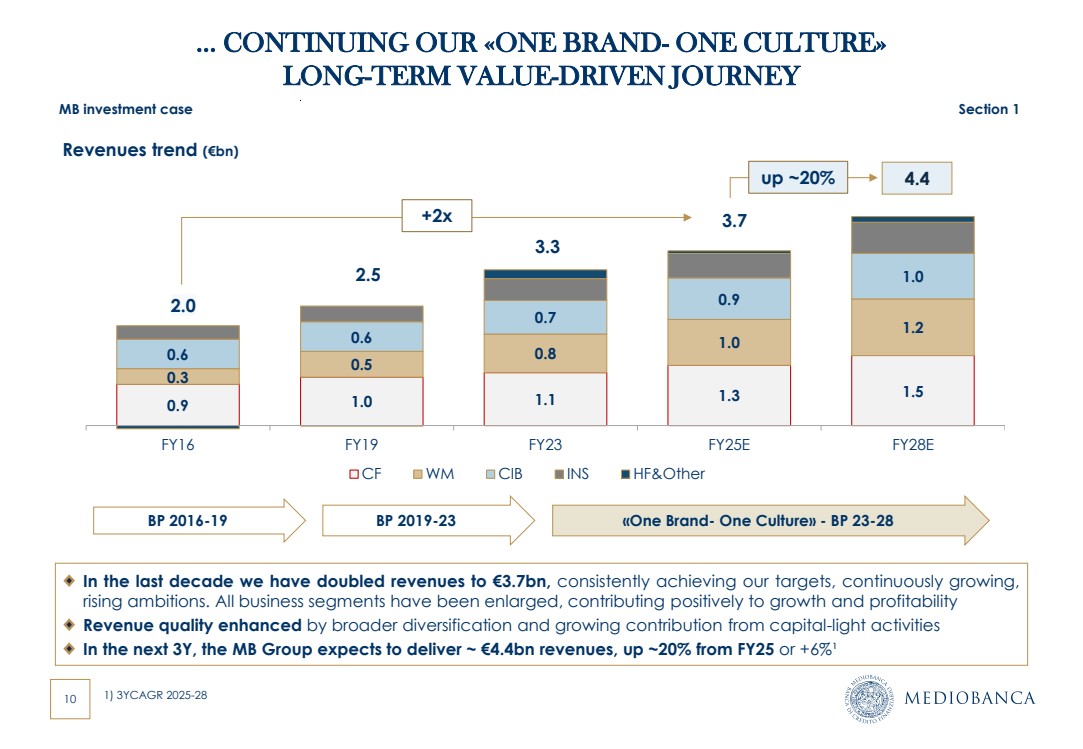
| 10 In the last decade we have doubled revenues to €3.7bn, consistently achieving our targets, continuously growing, rising ambitions. All business segments have been enlarged, contributing positively to growth and profitability Revenue quality enhanced by broader diversification and growing contribution from capital-light activities In the next 3Y, the MB Group expects to deliver ~ €4.4bn revenues, up ~20% from FY25 or +6%¹ Revenues trend (€bn) … CONTINUING OUR «ONE BRAND- ONE CULTURE» LONG-TERM VALUE-DRIVEN JOURNEY MB investment case Section 1 BP 2016-19 BP 2019-23 0.9 1.0 1.1 1.3 1.5 0.3 0.5 0.8 1.0 1.2 0.6 0.6 0.7 0.9 1.0 FY16 FY19 FY23 FY25E FY28E CF WM CIB INS HF&Other 2.5 3.3 4.4 2.0 +2x 3.7 up ~20% «One Brand- One Culture» - BP 23-28 1) 3YCAGR 2025-28 |
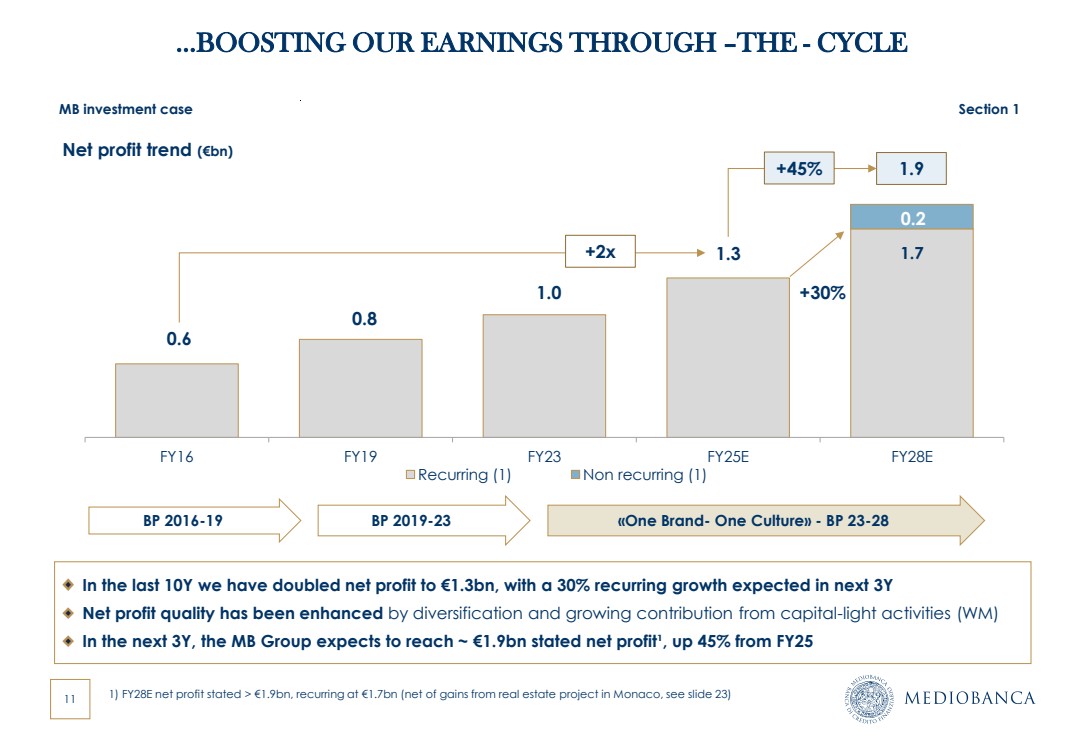
| 11 1.7 FY16 FY19 FY23 FY25E FY28E Recurring (1) Non recurring (1) 0.8 1.0 1.9 0.6 In the last 10Y we have doubled net profit to €1.3bn, with a 30% recurring growth expected in next 3Y Net profit quality has been enhanced by diversification and growing contribution from capital-light activities (WM) In the next 3Y, the MB Group expects to reach ~ €1.9bn stated net profit¹, up 45% from FY25 Net profit trend (€bn) …BOOSTING OUR EARNINGS THROUGH –THE - CYCLE 1.3 MB investment case Section 1 BP 2016-19 BP 2019-23 «One Brand- One Culture» - BP 23-28 +2x +45% 1) FY28E net profit stated > €1.9bn, recurring at €1.7bn (net of gains from real estate project in Monaco, see slide 23) +30% 0.2 |
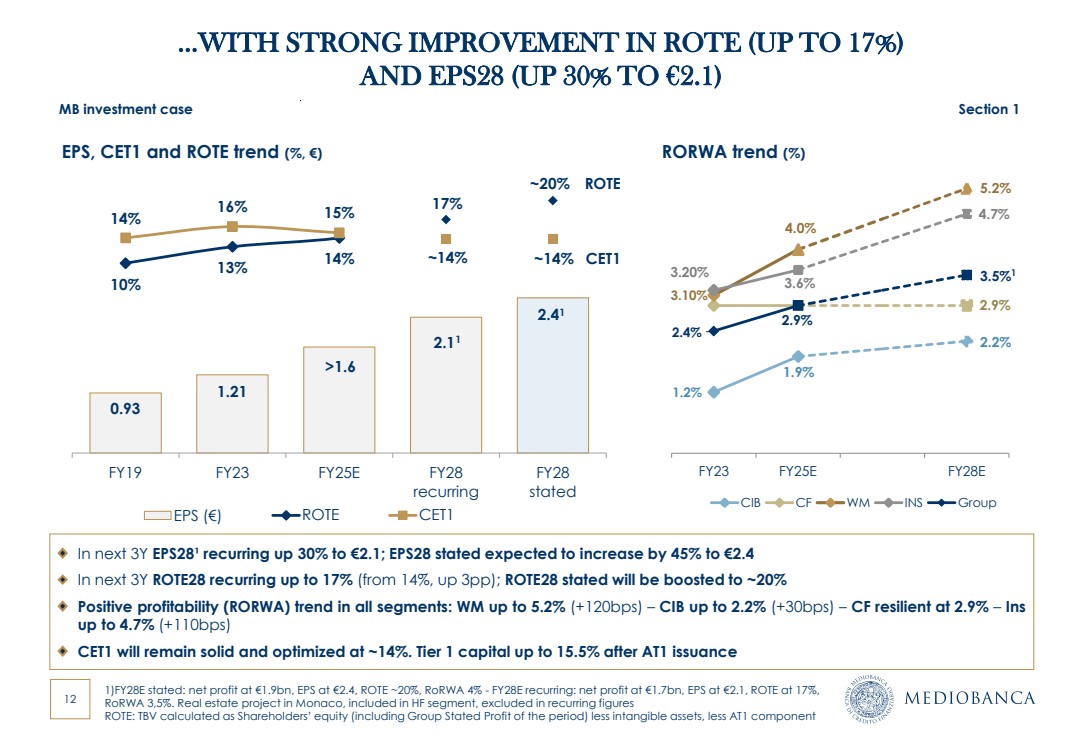
| 12 In next 3Y EPS28¹ recurring up 30% to €2.1; EPS28 stated expected to increase by 45% to €2.4 In next 3Y ROTE28 recurring up to 17% (from 14%, up 3pp); ROTE28 stated will be boosted to ~20% Positive profitability (RORWA) trend in all segments: WM up to 5.2% (+120bps) – CIB up to 2.2% (+30bps) – CF resilient at 2.9% – Ins up to 4.7% (+110bps) CET1 will remain solid and optimized at ~14%. Tier 1 capital up to 15.5% after AT1 issuance 0.93 1.21 >1.6 2.11 2.41 10% 13% 14% 17% ~20% 14% 16% 15% ~14% ~14% -20% -15% -10% -5% 0% 5% 10% 15% 20% 0% 50% 100% 150% 200% 250% 300% 350% 400% FY19 FY23 FY25E FY28 recurring FY28 stated EPS (€) ROTE CET1 EPS, CET1 and ROTE trend (%, €) …WITH STRONG IMPROVEMENT IN ROTE (UP TO 17%) AND EPS28 (UP 30% TO €2.1) MB investment case Section 1 1.2% 1.9% 2.2% 2.9% 3.10% 4.0% 5.2% 3.20% 3.6% 4.7% 2.4% 2.9% 3.5%1 FY23 FY25E FY28E CIB CF WM INS Group RORWA trend (%) CET1 1)FY28E stated: net profit at €1.9bn, EPS at €2.4, ROTE ~20%, RoRWA 4% - FY28E recurring: net profit at €1.7bn, EPS at €2.1, ROTE at 17%, RoRWA 3,5%. Real estate project in Monaco, included in HF segment, excluded in recurring figures ROTE: TBV calculated as Shareholders’ equity (including Group Stated Profit of the period) less intangible assets, less AT1 component ROTE |
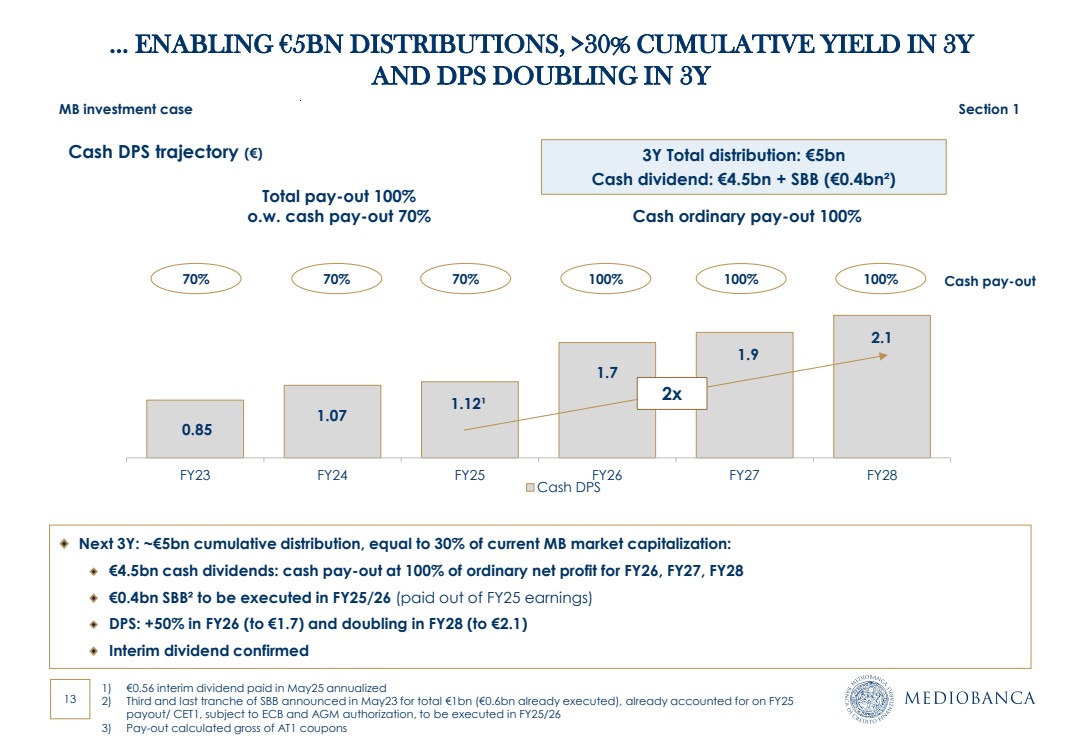
| 13 0.85 1.07 1.12¹ 1.7 1.9 2.1 FY23 FY24 FY25 FY26 FY27 FY28 Cash DPS Cash DPS trajectory (€) Next 3Y: ~€5bn cumulative distribution, equal to 30% of current MB market capitalization: €4.5bn cash dividends: cash pay-out at 100% of ordinary net profit for FY26, FY27, FY28 €0.4bn SBB² to be executed in FY25/26 (paid out of FY25 earnings) DPS: +50% in FY26 (to €1.7) and doubling in FY28 (to €2.1) Interim dividend confirmed … ENABLING €5BN DISTRIBUTIONS, >30% CUMULATIVE YIELD IN 3Y AND DPS DOUBLING IN 3Y MB investment case Section 1 1) €0.56 interim dividend paid in May25 annualized 2) Third and last tranche of SBB announced in May23 for total €1bn (€0.6bn already executed), already accounted for on FY25 payout/ CET1, subject to ECB and AGM authorization, to be executed in FY25/26 3) Pay-out calculated gross of AT1 coupons 100% 100% 100% 3Y Total distribution: €5bn Cash dividend: €4.5bn + SBB (€0.4bn²) 70% 70% 70% Total pay-out 100% o.w. cash pay-out 70% Cash ordinary pay-out 100% 2x Cash pay-out |
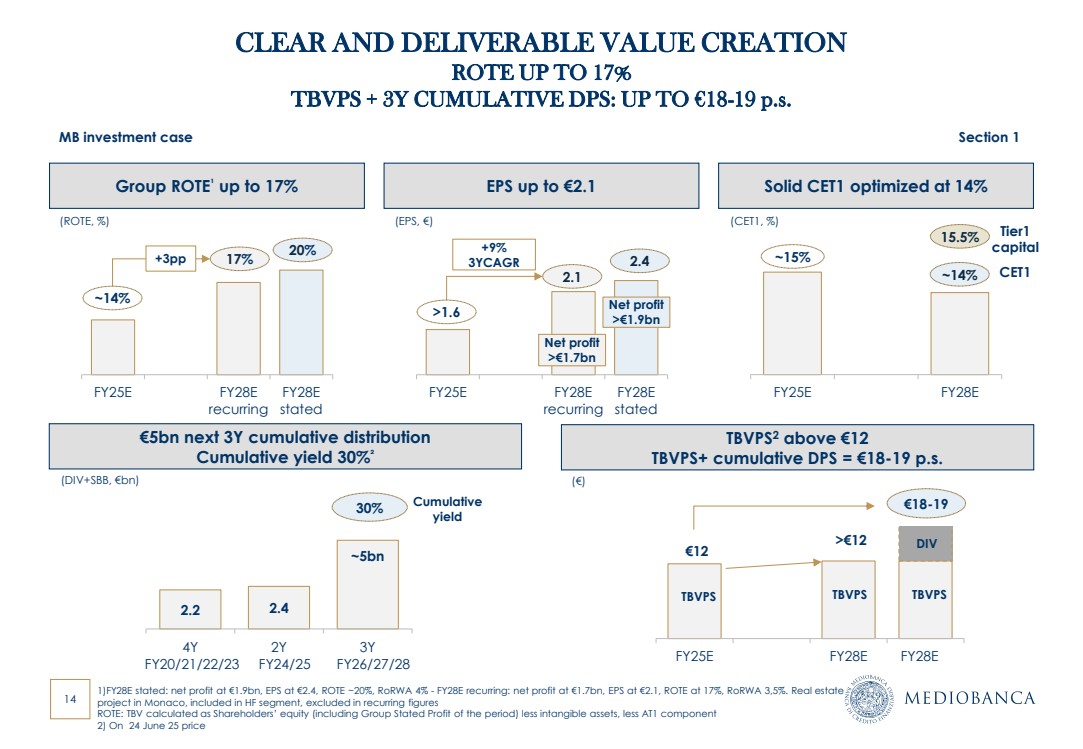
| 14 Group ROTE¹ up to 17% FY25E FY28E recurring FY28E stated 17% ~14% Solid CET1 optimized at 14% FY25E FY28E +3pp ~14% ~15% EPS up to €2.1 FY25E FY28E recurring FY28E stated >1.6 TBVPS2 above €12 TBVPS+ cumulative DPS = €18-19 p.s. +9% 3YCAGR FY25E FY28E FY28E €12 €5bn next 3Y cumulative distribution Cumulative yield 30%² 2.2 2.4 ~5bn 4Y FY20/21/22/23 2Y FY24/25 3Y FY26/27/28 30% (ROTE, %) (EPS, €) (DIV+SBB, €bn) (€) (CET1, %) TBVPS TBVPS TBVPS DIV Cumulative €18-19 yield CLEAR AND DELIVERABLE VALUE CREATION ROTE UP TO 17% TBVPS + 3Y CUMULATIVE DPS: UP TO €18-19 p.s. Net profit >€1.9bn MB investment case Section 1 >€12 2.1 1)FY28E stated: net profit at €1.9bn, EPS at €2.4, ROTE ~20%, RoRWA 4% - FY28E recurring: net profit at €1.7bn, EPS at €2.1, ROTE at 17%, RoRWA 3,5%. Real estate project in Monaco, included in HF segment, excluded in recurring figures ROTE: TBV calculated as Shareholders’ equity (including Group Stated Profit of the period) less intangible assets, less AT1 component 2) On 24 June 25 price 15.5% Tier1 capital CET1 20% Net profit >€1.7bn 2.4 |
| AGENDA Section 1. MB investment case Section 2. Group ambitions & financials Section 3. Divisional ambitions 3.1 Wealth Management 3.2 Corporate & Investment Banking 3.3 Consumer Finance Section 4. Closing remarks Annexes |
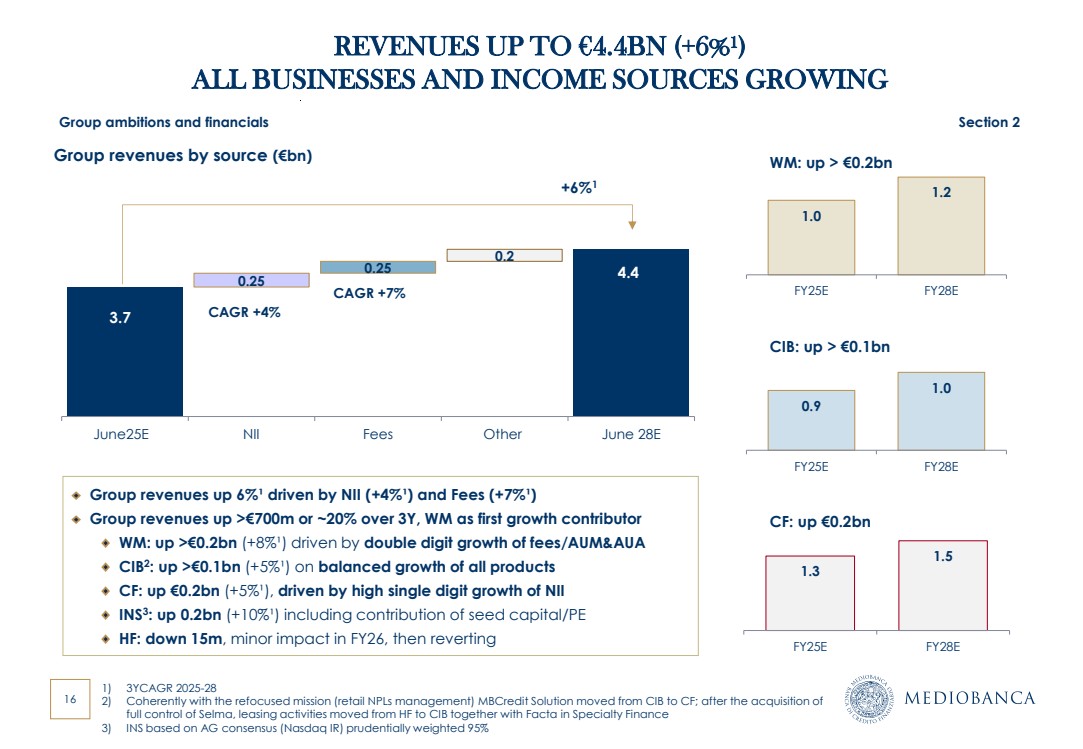
| 16 REVENUES UP TO €4.4BN (+6%¹) ALL BUSINESSES AND INCOME SOURCES GROWING 3.7 4.4 0.25 0.25 0.2 June25E NII Fees Other June 28E Group revenues by source (€bn) +6%1 1.0 1.2 FY25E FY28E 1.3 1.5 FY25E FY28E 0.9 1.0 FY25E FY28E Group ambitions and financials Section 2 1) 3YCAGR 2025-28 2) Coherently with the refocused mission (retail NPLs management) MBCredit Solution moved from CIB to CF; after the acquisition of full control of Selma, leasing activities moved from HF to CIB together with Facta in Specialty Finance 3) INS based on AG consensus (Nasdaq IR) prudentially weighted 95% CAGR +4% CAGR +7% Group revenues up 6%¹ driven by NII (+4%¹) and Fees (+7%¹) Group revenues up >€700m or ~20% over 3Y, WM as first growth contributor WM: up >€0.2bn (+8%¹) driven by double digit growth of fees/AUM&AUA CIB2 : up >€0.1bn (+5%¹) on balanced growth of all products CF: up €0.2bn (+5%¹), driven by high single digit growth of NII INS3 : up 0.2bn (+10%¹) including contribution of seed capital/PE HF: down 15m, minor impact in FY26, then reverting WM: up > €0.2bn CIB: up > €0.1bn CF: up €0.2bn |
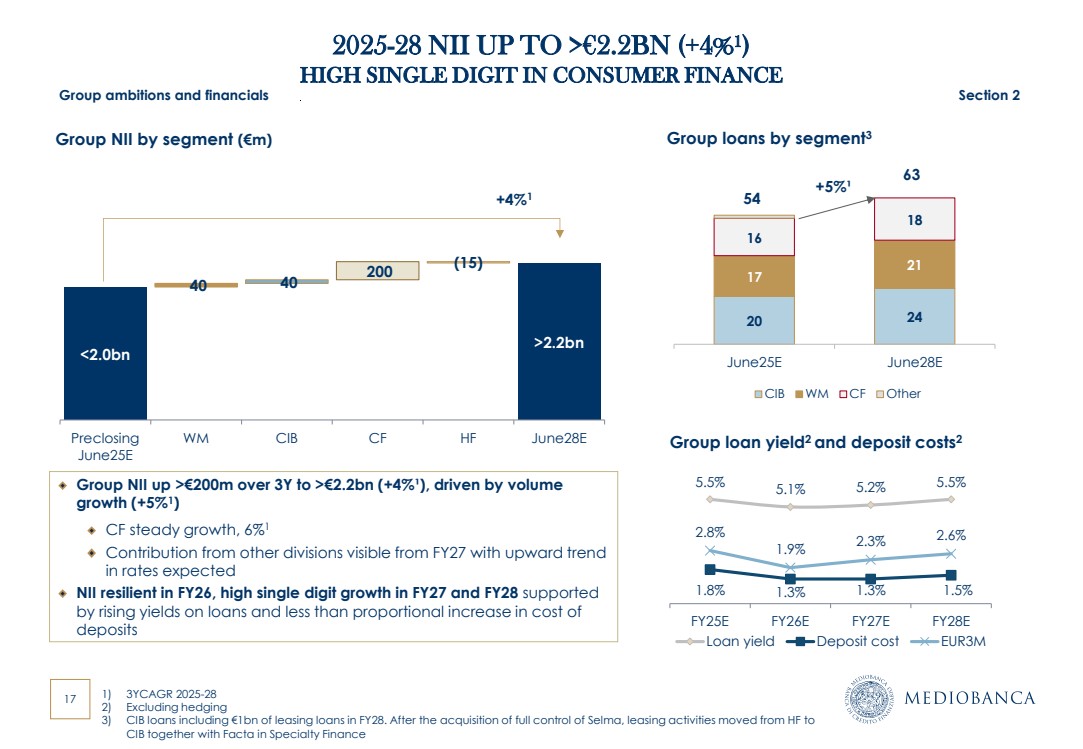
| 17 2025-28 NII UP TO >€2.2BN (+4%¹) HIGH SINGLE DIGIT IN CONSUMER FINANCE Group ambitions and financials Section 2 <2.0bn >2.2bn 40 40 200 (15) Preclosing June25E WM CIB CF HF June28E Group NII by segment (€m) Group NII up >€200m over 3Y to >€2.2bn (+4%¹), driven by volume growth (+5%1 ) CF steady growth, 6%1 Contribution from other divisions visible from FY27 with upward trend in rates expected NII resilient in FY26, high single digit growth in FY27 and FY28 supported by rising yields on loans and less than proportional increase in cost of deposits 20 24 17 21 16 18 June25E June28E CIB WM CF Other Group loans by segment3 Group loan yield2 and deposit costs2 5.5% 5.1% 5.2% 5.5% 1.8% 1.3% 1.3% 1.5% 2.8% 1.9% 2.3% 2.6% FY25E FY26E FY27E FY28E Loan yield Deposit cost EUR3M 1) 3YCAGR 2025-28 2) Excluding hedging 3) CIB loans including €1bn of leasing loans in FY28. After the acquisition of full control of Selma, leasing activities moved from HF to CIB together with Facta in Specialty Finance 54 63 +4%1 +5%¹ |
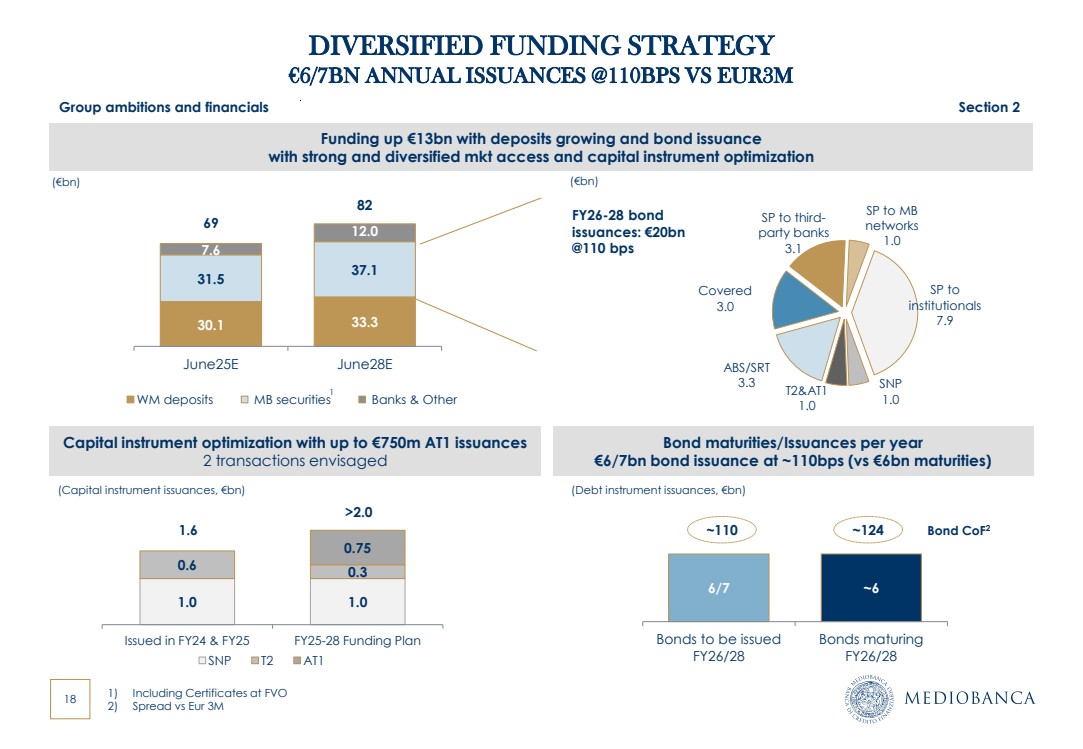
| 18 DIVERSIFIED FUNDING STRATEGY €6/7BN ANNUAL ISSUANCES @110BPS VS EUR3M 1) Including Certificates at FVO 2) Spread vs Eur 3M Funding up €13bn with deposits growing and bond issuance with strong and diversified mkt access and capital instrument optimization Capital instrument optimization with up to €750m AT1 issuances 2 transactions envisaged (Capital instrument issuances, €bn) 1.0 1.0 0.6 0.3 0.75 Issued in FY24 & FY25 FY25-28 Funding Plan SNP T2 AT1 1.6 >2.0 SNP 1.0 T2&AT1 1.0 ABS/SRT 3.3 Covered 3.0 SP to third-party banks 3.1 SP to MB networks 1.0 SP to institutionals 7.9 FY26-28 bond issuances: €20bn @110 bps (€bn) (€bn) 30.1 33.3 31.5 37.1 7.6 12.0 June25E June28E WM deposits MB securities Banks & Other 69 82 1 Bond maturities/Issuances per year €6/7bn bond issuance at ~110bps (vs €6bn maturities) 6/7 ~6 Bonds to be issued FY26/28 Bonds maturing FY26/28 ~110 ~124 Bond CoF2 Group ambitions and financials Section 2 (Debt instrument issuances, €bn) |
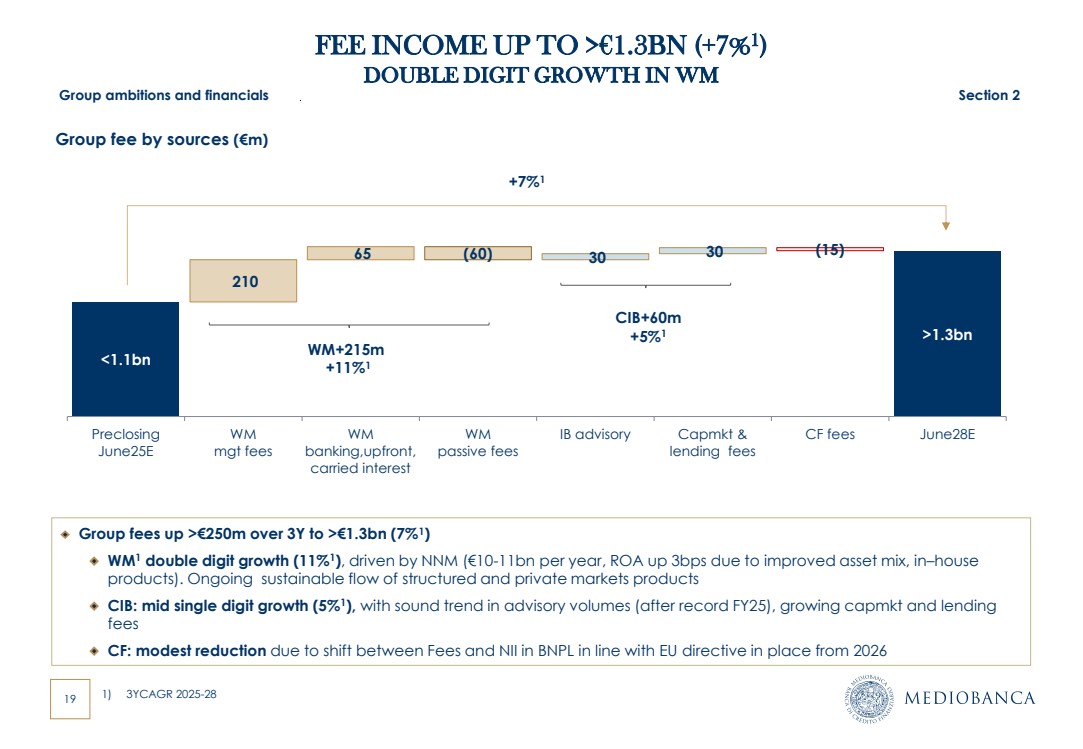
| 19 FEE INCOME UP TO >€1.3BN (+7%1 ) DOUBLE DIGIT GROWTH IN WM Group ambitions and financials Section 2 <1.1bn >1.3bn 210 65 (60) 30 30 (15) - Preclosing June25E WM mgt fees WM banking,upfront, carried interest WM passive fees IB advisory Capmkt & lending fees CF fees June28E +7%1 Group fee by sources (€m) WM+215m +11%1 CIB+60m +5%1 Group fees up >€250m over 3Y to >€1.3bn (7%1 ) WM1 double digit growth (11%1 ), driven by NNM (€10-11bn per year, ROA up 3bps due to improved asset mix, in–house products). Ongoing sustainable flow of structured and private markets products CIB: mid single digit growth (5%1 ), with sound trend in advisory volumes (after record FY25), growing capmkt and lending fees CF: modest reduction due to shift between Fees and NII in BNPL in line with EU directive in place from 2026 1) 3YCAGR 2025-28 |
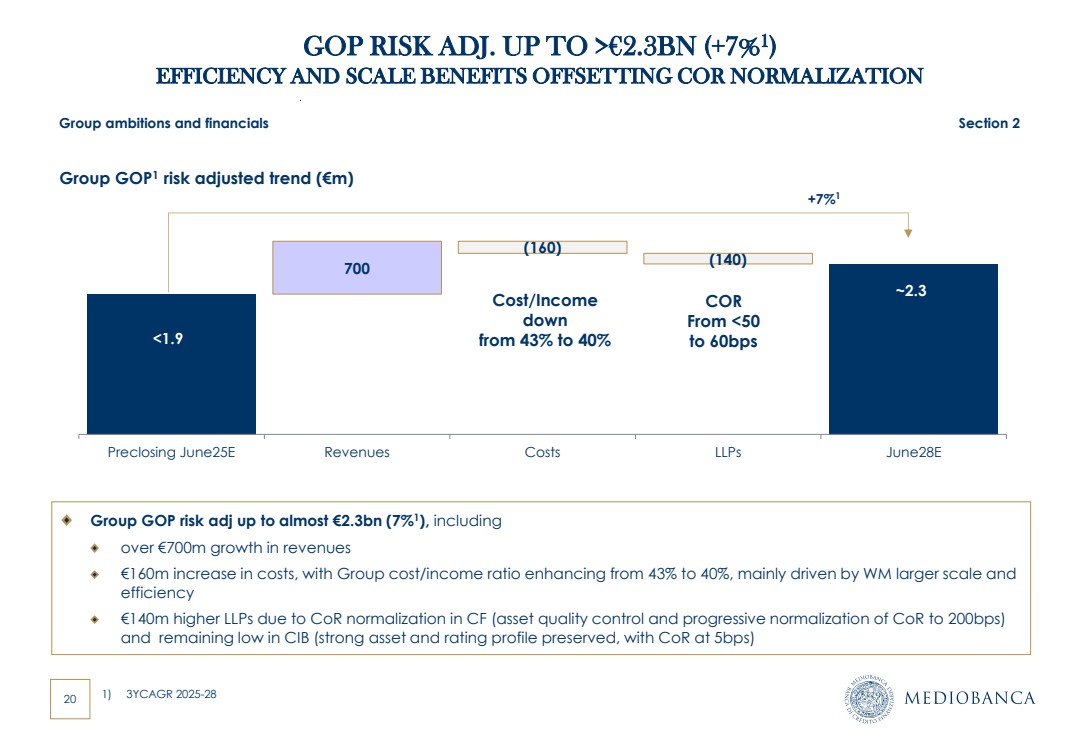
| 20 GOP RISK ADJ. UP TO >€2.3BN (+7%1 ) EFFICIENCY AND SCALE BENEFITS OFFSETTING COR NORMALIZATION <1.9 ~2.3 700 (160) (140) Preclosing June25E Revenues Costs LLPs June28E Group GOP1 risk adjusted trend (€m) +7%1 Group ambitions and financials Section 2 Cost/Income down from 43% to 40% 1) 3YCAGR 2025-28 COR From <50 to 60bps Group GOP risk adj up to almost €2.3bn (7%1 ), including over €700m growth in revenues €160m increase in costs, with Group cost/income ratio enhancing from 43% to 40%, mainly driven by WM larger scale and efficiency €140m higher LLPs due to CoR normalization in CF (asset quality control and progressive normalization of CoR to 200bps) and remaining low in CIB (strong asset and rating profile preserved, with CoR at 5bps) |
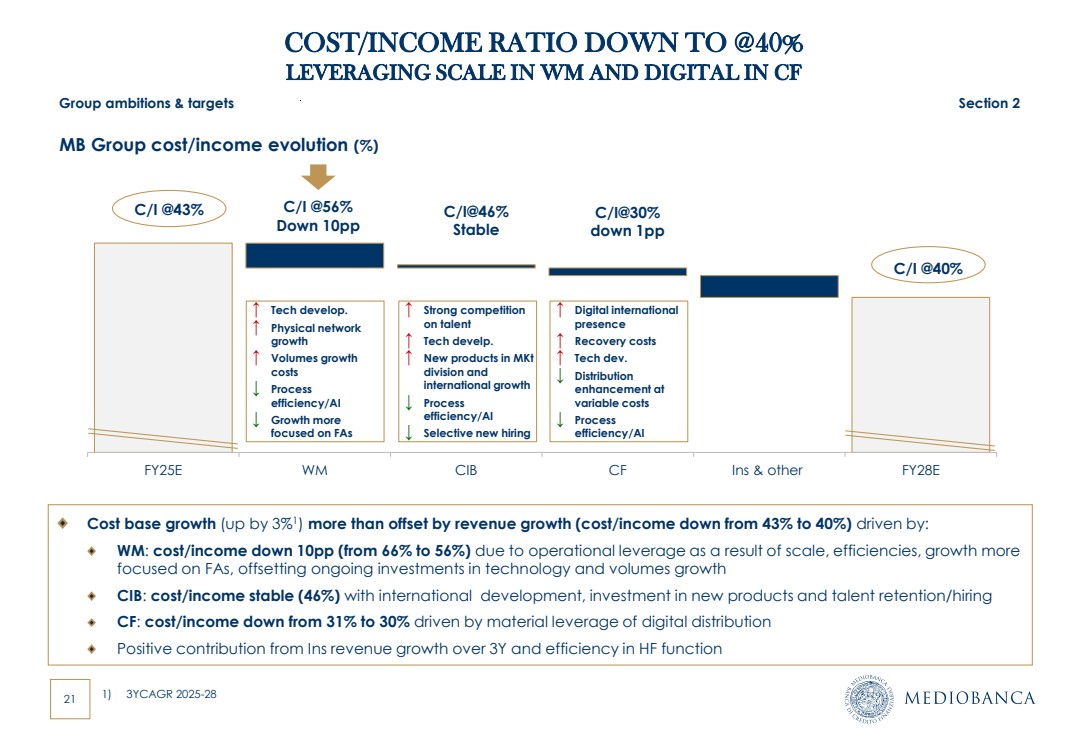
| 21 FY25E WM CIB CF Ins & other FY28E MB Group cost/income evolution (%) RCB Cost base growth (up by 3%1 ) more than offset by revenue growth (cost/income down from 43% to 40%) driven by: WM: cost/income down 10pp (from 66% to 56%) due to operational leverage as a result of scale, efficiencies, growth more focused on FAs, offsetting ongoing investments in technology and volumes growth CIB: cost/income stable (46%) with international development, investment in new products and talent retention/hiring CF: cost/income down from 31% to 30% driven by material leverage of digital distribution Positive contribution from Ins revenue growth over 3Y and efficiency in HF function C/I @43% C/I @40% C/I @56% Down 10pp C/I@46% Stable ↑ Tech develop. ↑ Physical network growth ↑ Volumes growth costs ↓ Process efficiency/AI ↓ Growth more focused on FAs ↑ Strong competition on talent ↑ Tech develp. ↑ New products in MKt division and international growth ↓ Process efficiency/AI ↓ Selective new hiring ↑ Digital international presence ↑ Recovery costs ↑ Tech dev. ↓ Distribution enhancement at variable costs ↓ Process efficiency/AI Group ambitions & targets Section 2 COST/INCOME RATIO DOWN TO @40% LEVERAGING SCALE IN WM AND DIGITAL IN CF 1) 3YCAGR 2025-28 C/I@30% down 1pp |
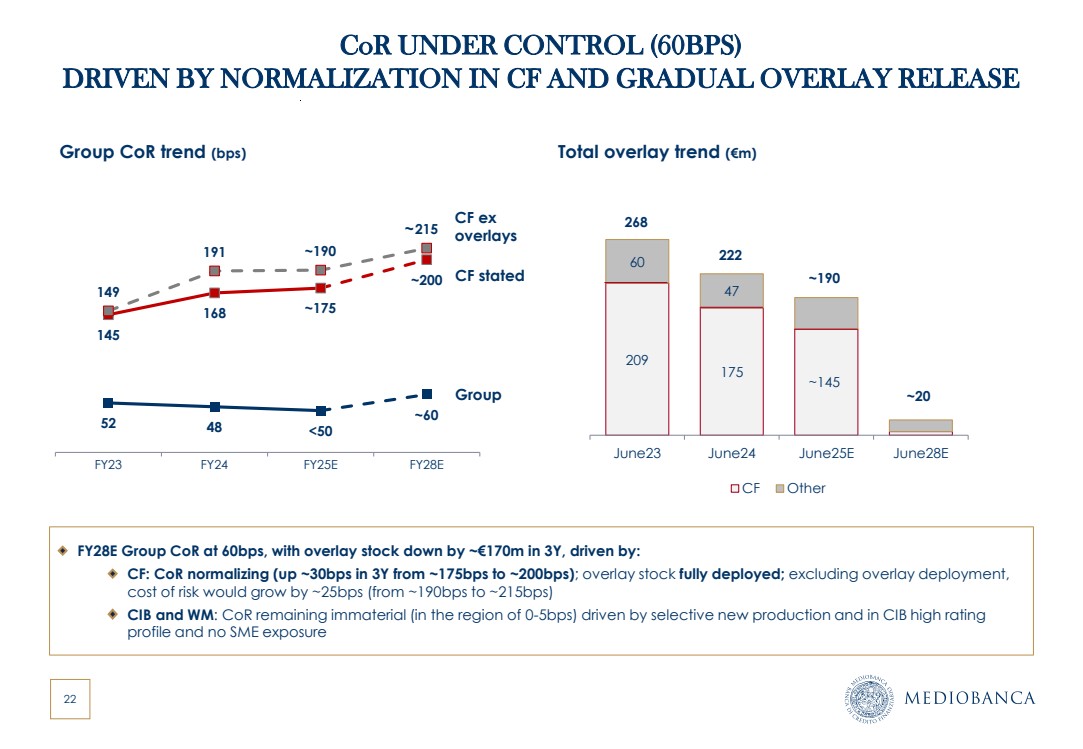
| 22 CoR UNDER CONTROL (60BPS) DRIVEN BY NORMALIZATION IN CF AND GRADUAL OVERLAY RELEASE FY28E Group CoR at 60bps, with overlay stock down by ~€170m in 3Y, driven by: CF: CoR normalizing (up ~30bps in 3Y from ~175bps to ~200bps); overlay stock fully deployed; excluding overlay deployment, cost of risk would grow by ~25bps (from ~190bps to ~215bps) CIB and WM: CoR remaining immaterial (in the region of 0-5bps) driven by selective new production and in CIB high rating profile and no SME exposure 52 48 <50 ~60 145 168 ~175 ~200 149 191 ~190 215 0 50 100 150 200 FY23 FY24 FY25E FY28E Group CoR trend (bps) 209 175 ~145 60 47 June23 June24 June25E June28E CF Other 268 222 ~190 Total overlay trend (€m) ~20 CF stated Group CF ex overlays ~ |
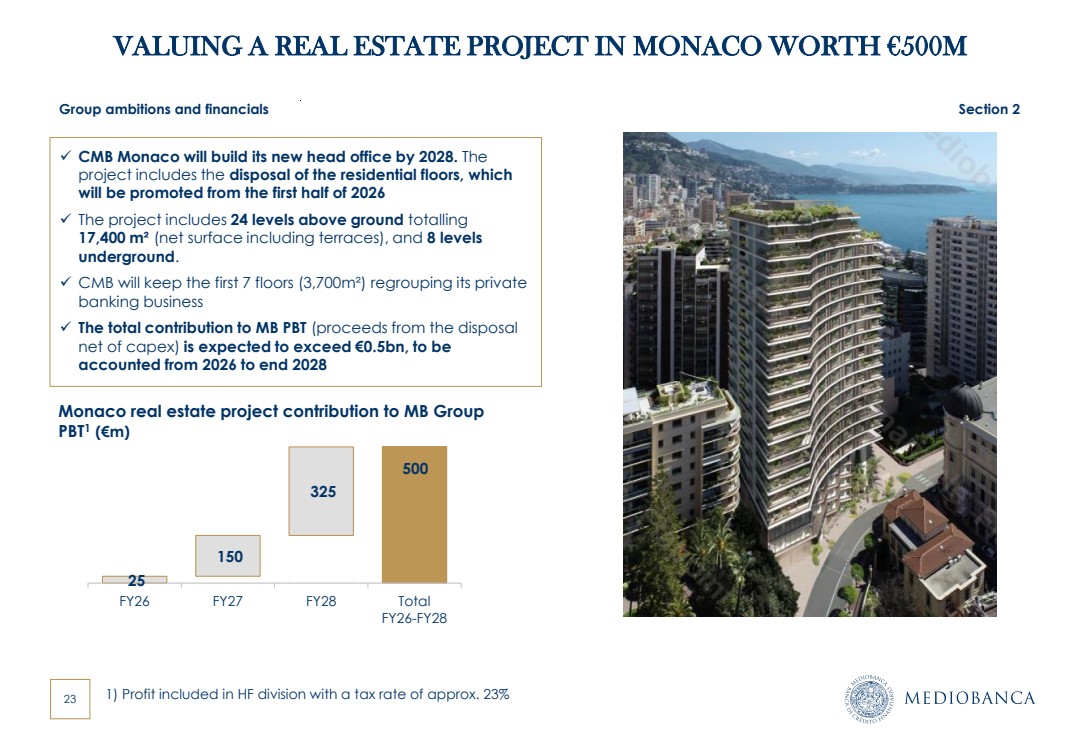
| 23 VALUING A REAL ESTATE PROJECT IN MONACO WORTH €500M Group ambitions and financials Section 2 ✓ CMB Monaco will build its new head office by 2028. The project includes the disposal of the residential floors, which will be promoted from the first half of 2026 ✓ The project includes 24 levels above ground totalling 17,400 m² (net surface including terraces), and 8 levels underground. ✓ CMB will keep the first 7 floors (3,700m²) regrouping its private banking business ✓ The total contribution to MB PBT (proceeds from the disposal net of capex) is expected to exceed €0.5bn, to be accounted from 2026 to end 2028 25 500 150 325 FY26 FY27 FY28 Total FY26-FY28 Monaco real estate project contribution to MB Group PBT1 (€m) 1) Profit included in HF division with a tax rate of approx. 23% |
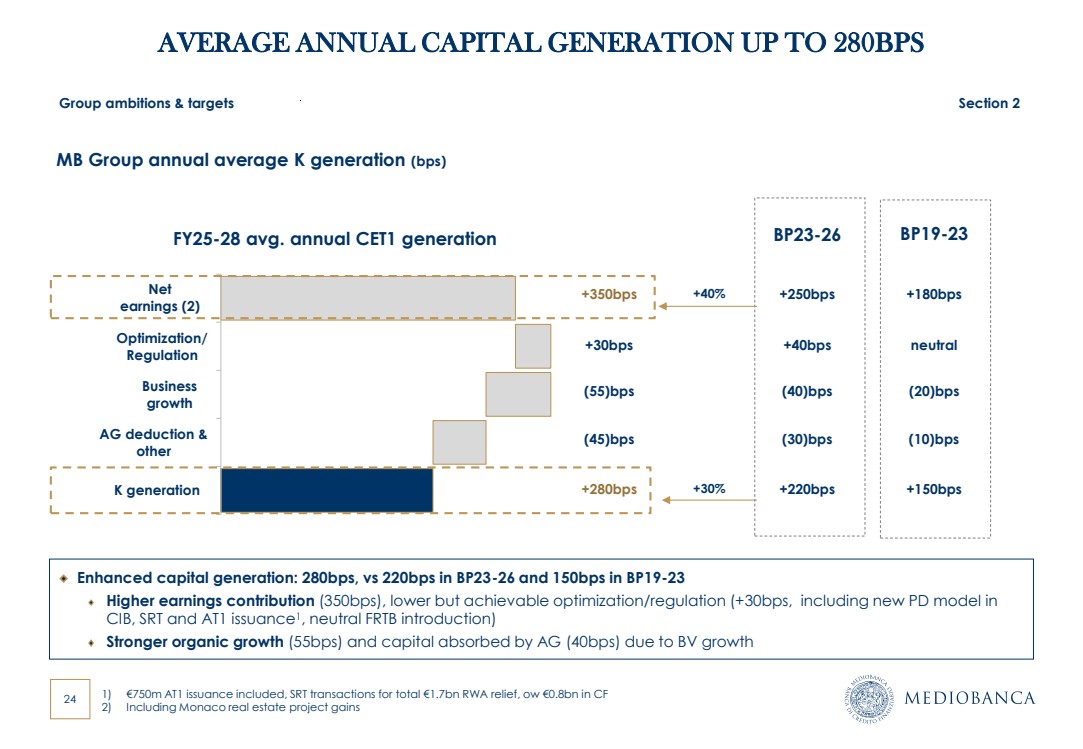
| 24 MB Group annual average K generation (bps) Enhanced capital generation: 280bps, vs 220bps in BP23-26 and 150bps in BP19-23 Higher earnings contribution (350bps), lower but achievable optimization/regulation (+30bps, including new PD model in CIB, SRT and AT1 issuance1 , neutral FRTB introduction) Stronger organic growth (55bps) and capital absorbed by AG (40bps) due to BV growth Net earnings (2) Optimization/ Regulation Business growth AG deduction & other K generation FY25-28 avg. annual CET1 generation +180bps (10)bps (20)bps neutral +150bps +350bps +30bps (55)bps +280bps BP19-23 (45)bps +30% Group ambitions & targets Section 2 AVERAGE ANNUAL CAPITAL GENERATION UP TO 280BPS +40% +250bps (30)bps (40)bps +40bps +220bps BP23-26 1) €750m AT1 issuance included, SRT transactions for total €1.7bn RWA relief, ow €0.8bn in CF 2) Including Monaco real estate project gains 000 |
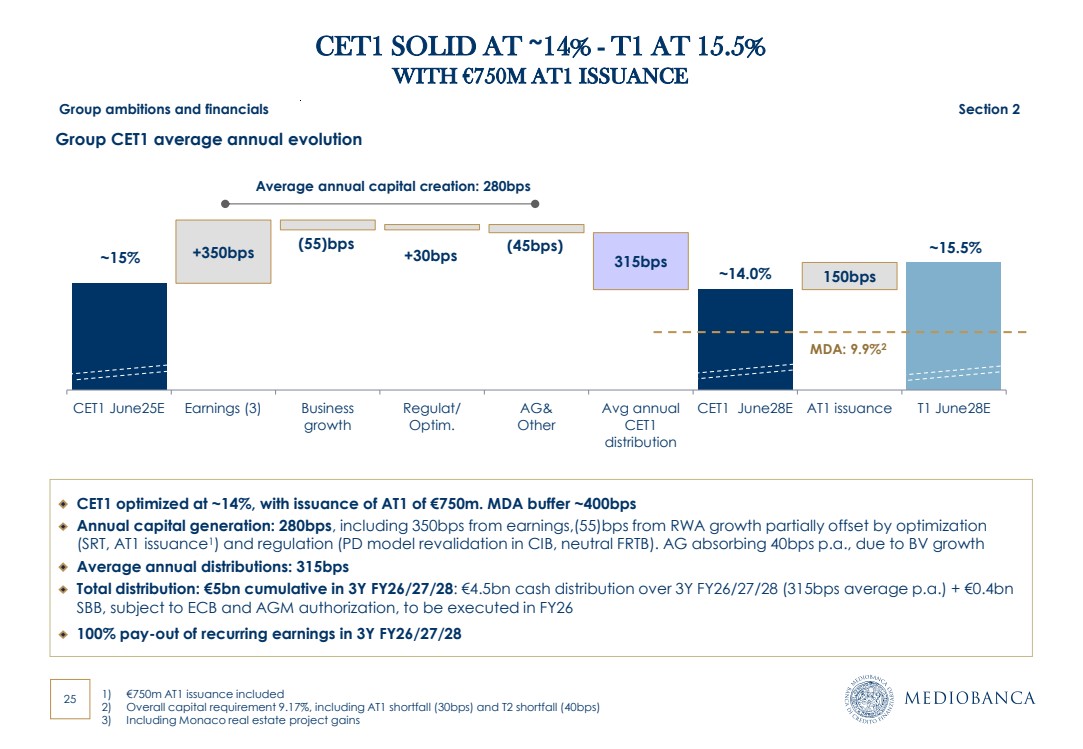
| 25 CET1 SOLID AT ~14% - T1 AT 15.5% WITH €750M AT1 ISSUANCE ~15% ~14.0% +350bps (55)bps ~15.5% +30bps (45bps) 315bps 150bps CET1 June25E Earnings (3) Business growth Regulat/ Optim. AG& Other Avg annual CET1 distribution CET1 June28E AT1 issuance T1 June28E Group CET1 average annual evolution CET1 optimized at ~14%, with issuance of AT1 of €750m. MDA buffer ~400bps Annual capital generation: 280bps, including 350bps from earnings,(55)bps from RWA growth partially offset by optimization (SRT, AT1 issuance1 ) and regulation (PD model revalidation in CIB, neutral FRTB). AG absorbing 40bps p.a., due to BV growth Average annual distributions: 315bps Total distribution: €5bn cumulative in 3Y FY26/27/28: €4.5bn cash distribution over 3Y FY26/27/28 (315bps average p.a.) + €0.4bn SBB, subject to ECB and AGM authorization, to be executed in FY26 100% pay-out of recurring earnings in 3Y FY26/27/28 Average annual capital creation: 280bps Group ambitions and financials Section 2 1) €750m AT1 issuance included 2) Overall capital requirement 9.17%, including AT1 shortfall (30bps) and T2 shortfall (40bps) 3) Including Monaco real estate project gains MDA: 9.9%2 |
| AGENDA Section 1. MB investment case Section 2. Group ambitions & financials Section 3. Divisional ambitions 3.1 Wealth Management 3.2 Corporate & Investment Banking 3.3 Consumer Finance Section 4. Closing remarks Annexes |
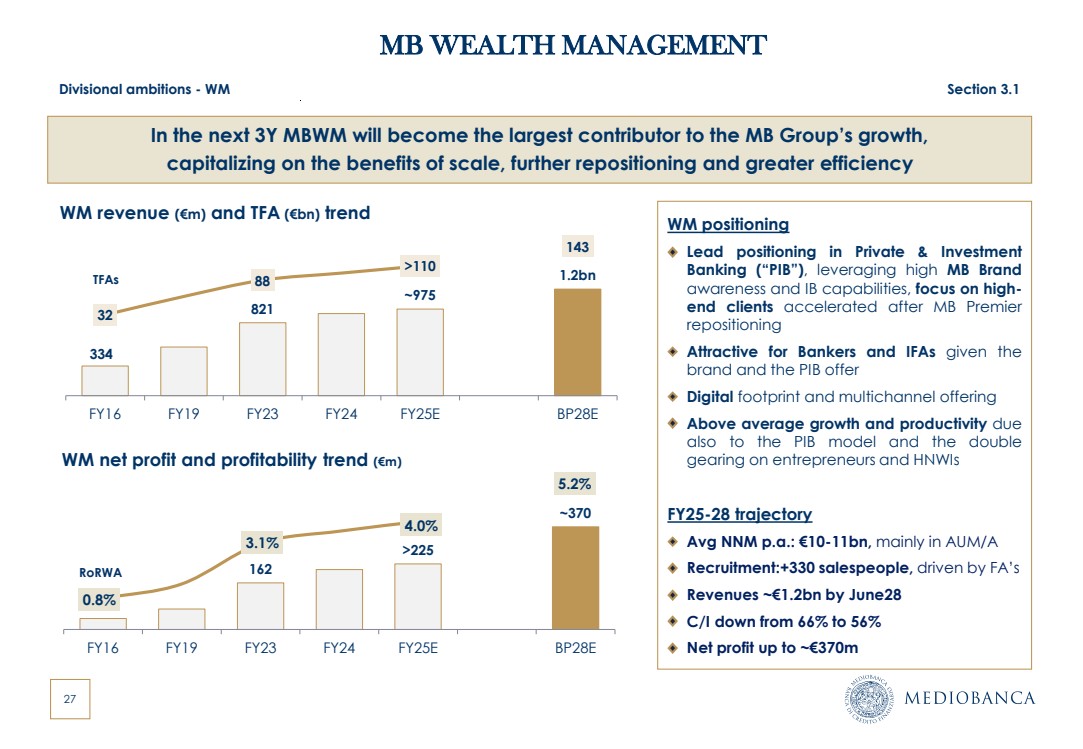
| 27 MB WEALTH MANAGEMENT 821 ~975 1.2bn 32 88 >110 143 -100.0 -50.0 0.0 50.0 100.0 150.0 FY16 FY19 FY23 FY24 FY25E BP28E 0 1000 334 WM revenue (€m) and TFA (€bn) trend 162 >225 ~370 0.8% 3.1% 4.0% 5.2% -0.5% 0.5% 1.5% 2.5% 3.5% 4.5% 5.5% FY16 FY19 FY23 FY24 FY25E BP28E 0 50 100 150 200 250 300 350 400 450 500 WM net profit and profitability trend (€m) RoRWA WM positioning Lead positioning in Private & Investment Banking (“PIB”), leveraging high MB Brand awareness and IB capabilities, focus on high-end clients accelerated after MB Premier repositioning Attractive for Bankers and IFAs given the brand and the PIB offer Digital footprint and multichannel offering Above average growth and productivity due also to the PIB model and the double gearing on entrepreneurs and HNWIs FY25-28 trajectory Avg NNM p.a.: €10-11bn, mainly in AUM/A Recruitment:+330 salespeople, driven by FA’s Revenues ~€1.2bn by June28 C/I down from 66% to 56% Net profit up to ~€370m TFAs Divisional ambitions - WM Section 3.1 In the next 3Y MBWM will become the largest contributor to the MB Group’s growth, capitalizing on the benefits of scale, further repositioning and greater efficiency |
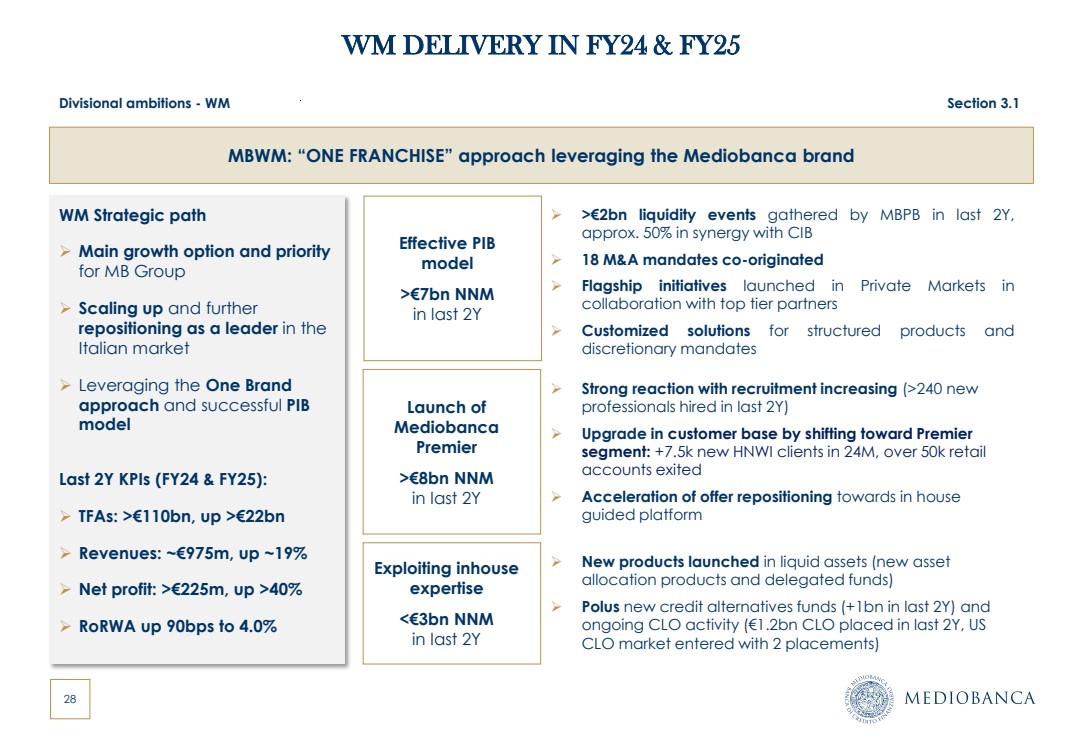
| 28 WM DELIVERY IN FY24 & FY25 WM Strategic path ➢ Main growth option and priority for MB Group ➢ Scaling up and further repositioning as a leader in the Italian market ➢ Leveraging the One Brand approach and successful PIB model Last 2Y KPIs (FY24 & FY25): ➢ TFAs: >€110bn, up >€22bn ➢ Revenues: ~€975m, up ~19% ➢ Net profit: >€225m, up >40% ➢ RoRWA up 90bps to 4.0% MBWM: “ONE FRANCHISE” approach leveraging the Mediobanca brand ➢ New products launched in liquid assets (new asset allocation products and delegated funds) ➢ Polus new credit alternatives funds (+1bn in last 2Y) and ongoing CLO activity (€1.2bn CLO placed in last 2Y, US CLO market entered with 2 placements) Exploiting inhouse expertise <€3bn NNM in last 2Y ➢ >€2bn liquidity events gathered by MBPB in last 2Y, approx. 50% in synergy with CIB ➢ 18 M&A mandates co-originated ➢ Flagship initiatives launched in Private Markets in collaboration with top tier partners ➢ Customized solutions for structured products and discretionary mandates Effective PIB model >€7bn NNM in last 2Y ➢ Strong reaction with recruitment increasing (>240 new professionals hired in last 2Y) ➢ Upgrade in customer base by shifting toward Premier segment: +7.5k new HNWI clients in 24M, over 50k retail accounts exited ➢ Acceleration of offer repositioning towards in house guided platform Launch of Mediobanca Premier >€8bn NNM in last 2Y Divisional ambitions - WM Section 3.1 |
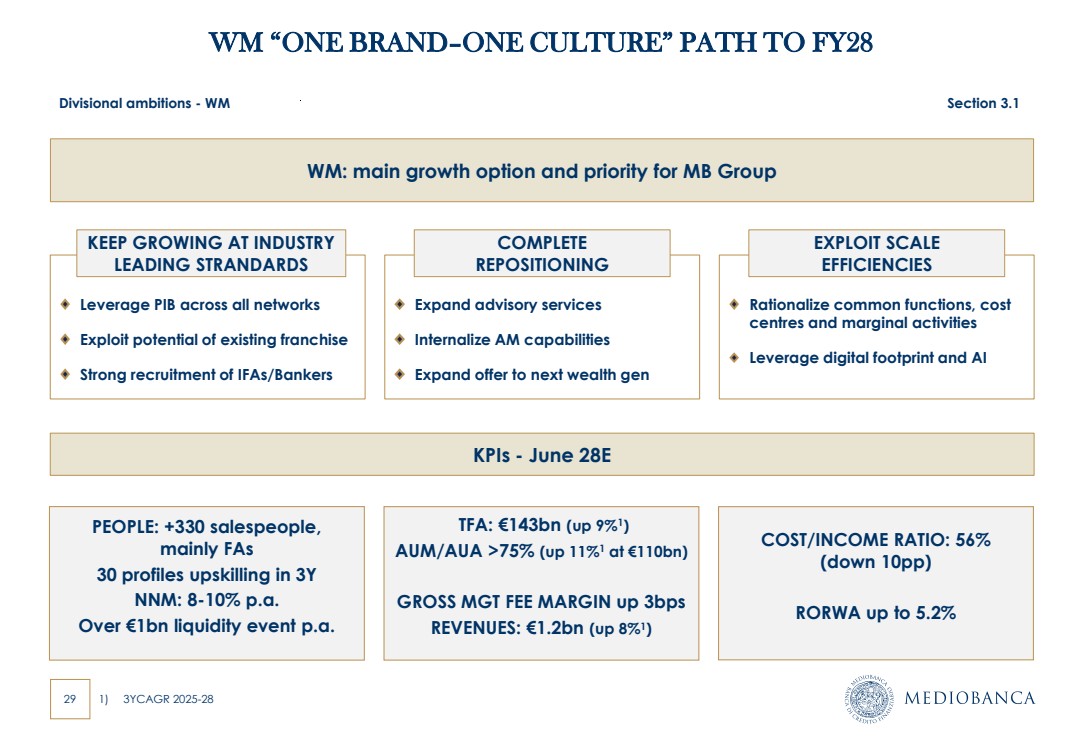
| 29 WM “ONE BRAND–ONE CULTURE” PATH TO FY28 Leverage PIB across all networks Exploit potential of existing franchise Strong recruitment of IFAs/Bankers Rationalize common functions, cost centres and marginal activities Leverage digital footprint and AI Expand advisory services Internalize AM capabilities Expand offer to next wealth gen KEEP GROWING AT INDUSTRY LEADING STRANDARDS COMPLETE REPOSITIONING EXPLOIT SCALE EFFICIENCIES WM: main growth option and priority for MB Group Divisional ambitions - WM Section 3.1 PEOPLE: +330 salespeople, mainly FAs 30 profiles upskilling in 3Y NNM: 8-10% p.a. Over €1bn liquidity event p.a. COST/INCOME RATIO: 56% (down 10pp) RORWA up to 5.2% TFA: €143bn (up 9%1 ) AUM/AUA >75% (up 11%1 at €110bn) GROSS MGT FEE MARGIN up 3bps REVENUES: €1.2bn (up 8%1 ) 1) 3YCAGR 2025-28 KPIs - June 28E |
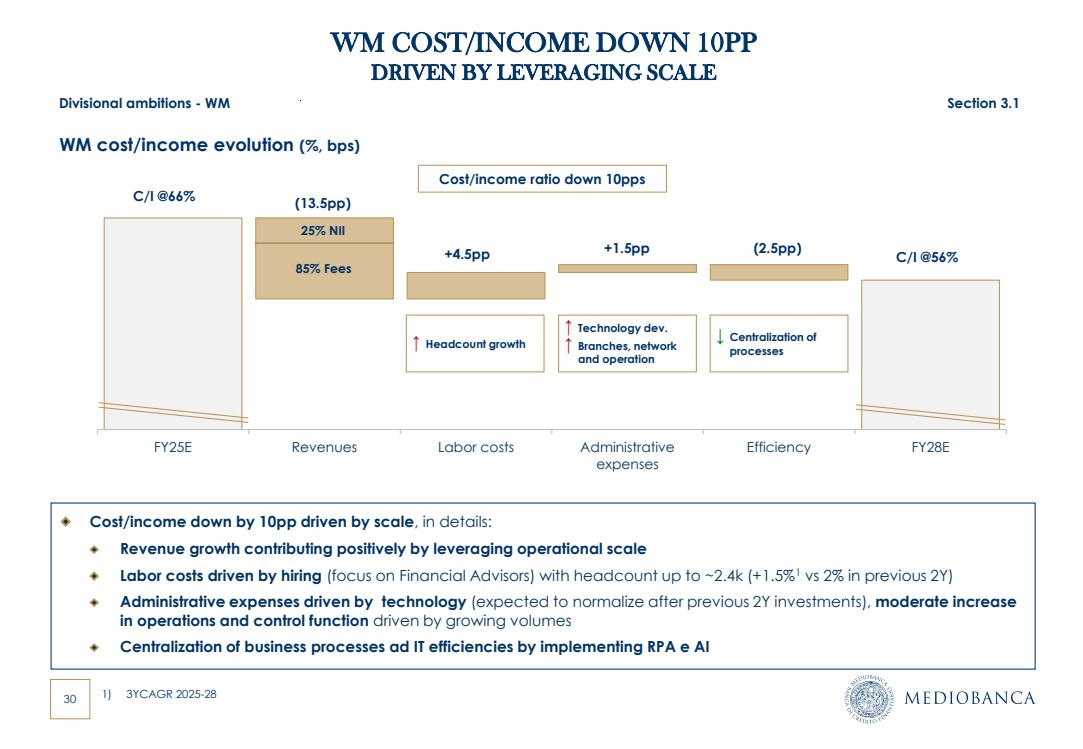
| 30 FY25E Revenues Labor costs Administrative expenses Efficiency FY28E WM cost/income evolution (%, bps) RCB Cost/income down by 10pp driven by scale, in details: Revenue growth contributing positively by leveraging operational scale Labor costs driven by hiring (focus on Financial Advisors) with headcount up to ~2.4k (+1.5%1 vs 2% in previous 2Y) Administrative expenses driven by technology (expected to normalize after previous 2Y investments), moderate increase in operations and control function driven by growing volumes Centralization of business processes ad IT efficiencies by implementing RPA e AI C/I @66% C/I @56% Cost/income ratio down 10pps (13.5pp) +4.5pp +1.5pp ↑ Headcount growth ↑ Technology dev. ↑ Branches, network and operation Divisional ambitions - WM Section 3.1 WM COST/INCOME DOWN 10PP DRIVEN BY LEVERAGING SCALE (2.5pp) ↓ Centralization of processes 85% Fees 25% NII 1) 3YCAGR 2025-28 |
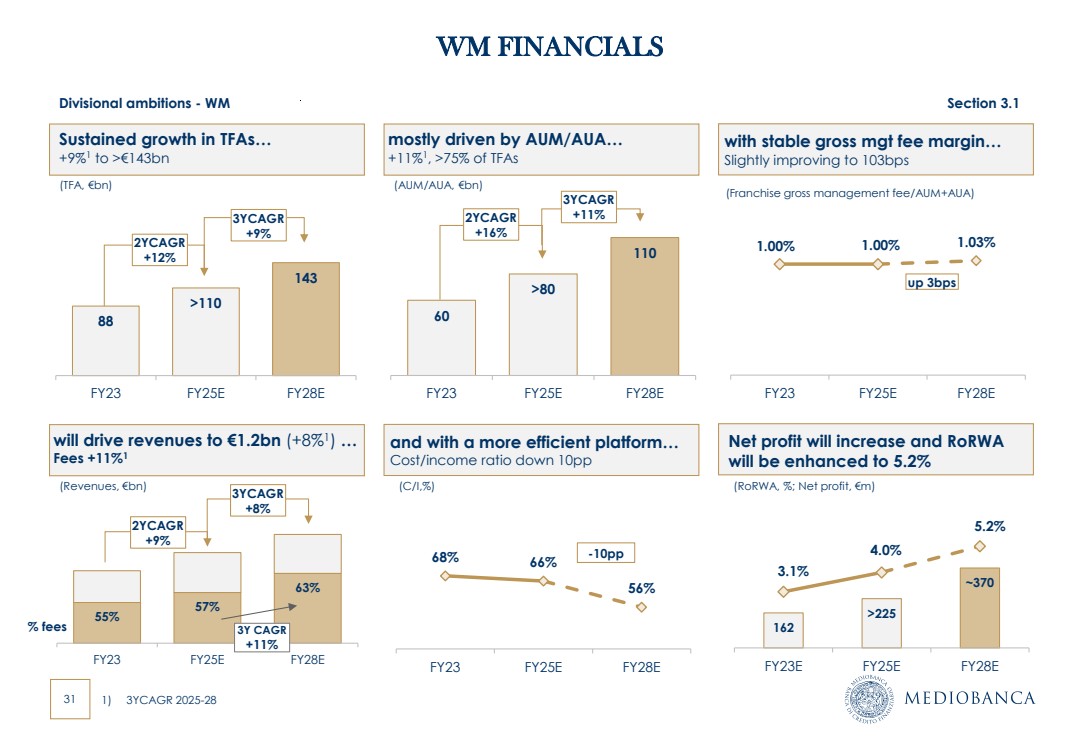
| 31 60 >80 110 FY23 FY25E FY28E (C/I,%) WM FINANCIALS AUM/AUA (€bn) and with a more efficient platform… Cost/income ratio down 10pp 68% 66% 56% FY23 FY25E FY28E -10pp 55% 57% 63% FY23 FY25E FY28E will drive revenues to €1.2bn (+8%1 ) … Fees +11%1 2YCAGR +9% (Revenues, €bn) 3YCAGR +8% Net profit will increase and RoRWA will be enhanced to 5.2% 162 >225 ~370 3.1% 4.0% 5.2% FY23E FY25E FY28E (RoRWA, %; Net profit, €m) 1.00% 1.00% 1.03% FY23 FY25E FY28E up 3bps 88 >110 143 FY23 FY25E FY28E with stable gross mgt fee margin… Slightly improving to 103bps Sustained growth in TFAs… +9%1 to >€143bn mostly driven by AUM/AUA… +11%1 , >75% of TFAs (TFA, €bn) (AUM/AUA, €bn) 2YCAGR +12% 2YCAGR +16% 3YCAGR +9% 3YCAGR +11% (Franchise gross management fee/AUM+AUA) Divisional ambitions - WM Section 3.1 1) 3YCAGR 2025-28 % fees 3Y CAGR +11% |
| AGENDA Section 1. MB investment case Section 2. Group ambitions & financials Section 3. Divisional ambitions 3.1 Wealth Management 3.2 Corporate & Investment Banking 3.3 Consumer Finance Section 4. Closing remarks Annexes |
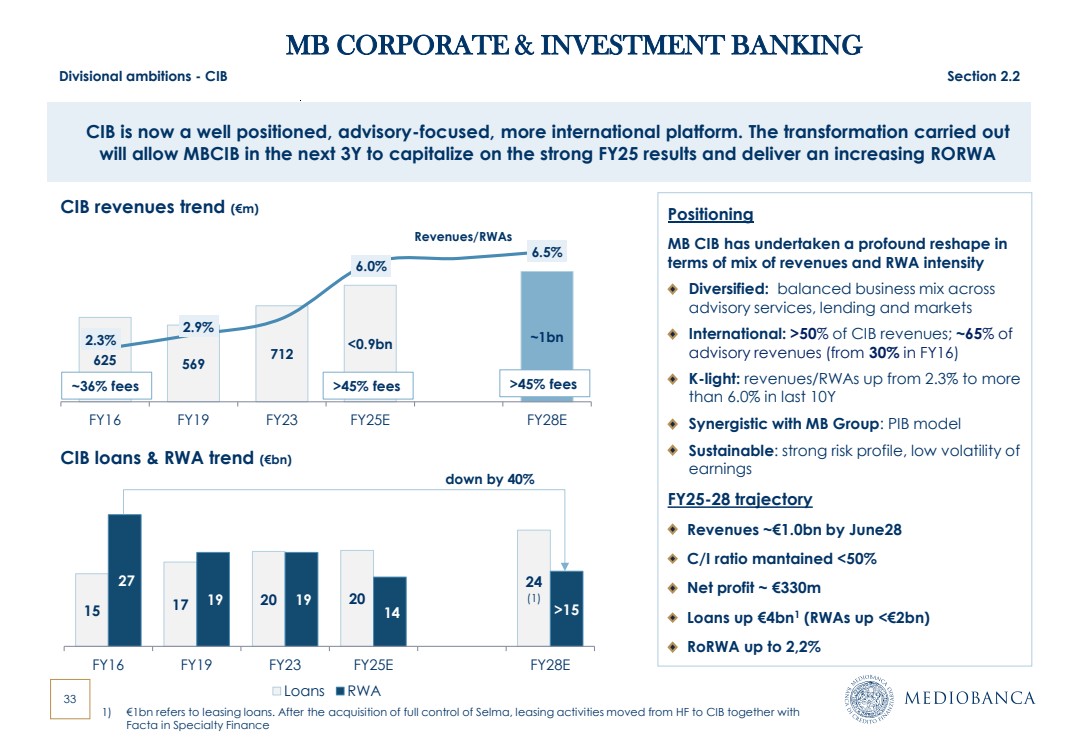
| 33 MB CORPORATE & INVESTMENT BANKING Positioning MB CIB has undertaken a profound reshape in terms of mix of revenues and RWA intensity Diversified: balanced business mix across advisory services, lending and markets International: >50% of CIB revenues; ~65% of advisory revenues (from 30% in FY16) K-light: revenues/RWAs up from 2.3% to more than 6.0% in last 10Y Synergistic with MB Group: PIB model Sustainable: strong risk profile, low volatility of earnings FY25-28 trajectory Revenues ~€1.0bn by June28 C/I ratio mantained <50% Net profit ~ €330m Loans up €4bn1 (RWAs up <€2bn) RoRWA up to 2,2% 625 569 712 <0.9bn 2.3% ~1bn 2.9% 6.0% 6.5% 0.0% 1.0% 2.0% 3.0% 4.0% 5.0% 6.0% 7.0% FY16 FY19 FY23 FY25E FY28E 0 200 400 600 800 1000 1200 CIB revenues trend (€m) Revenues/RWAs 15 17 20 20 24 (1) 27 19 19 14 >15 FY16 FY19 FY23 FY25E FY28E 0 5 10 15 20 25 30 Loans RWA Divisional ambitions - CIB Section 2.2 CIB loans & RWA trend (€bn) CIB is now a well positioned, advisory-focused, more international platform. The transformation carried out will allow MBCIB in the next 3Y to capitalize on the strong FY25 results and deliver an increasing RORWA ~36% fees >45% fees >45% fees down by 40% 1) €1bn refers to leasing loans. After the acquisition of full control of Selma, leasing activities moved from HF to CIB together with Facta in Specialty Finance |
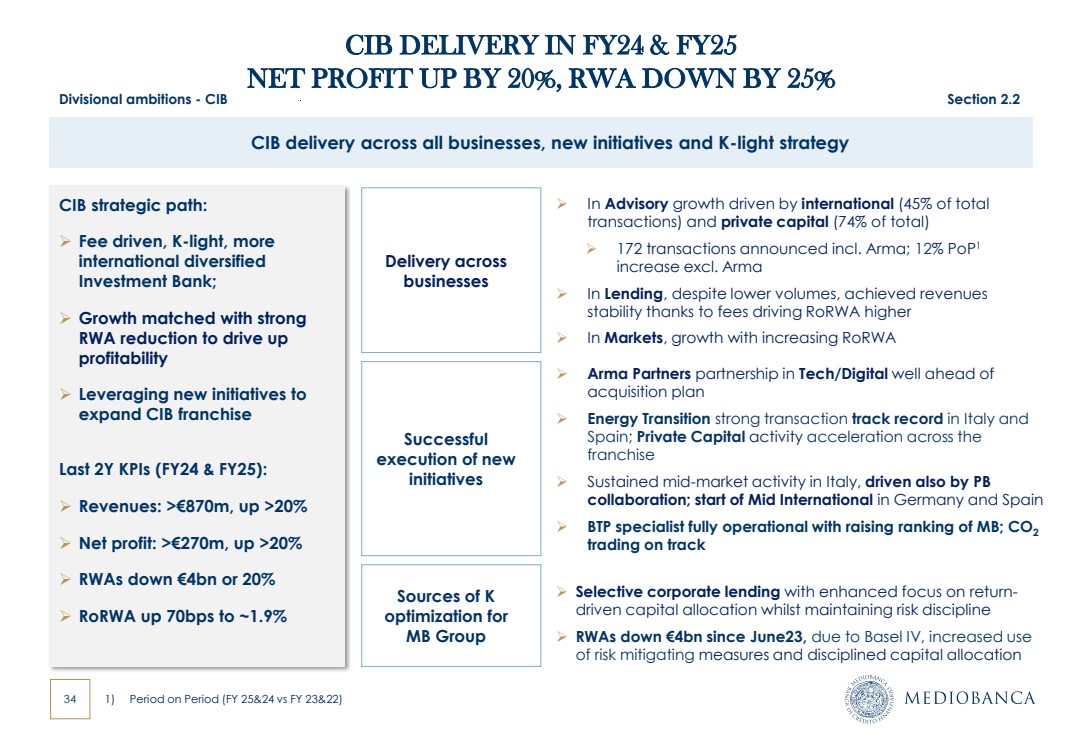
| 34 CIB DELIVERY IN FY24 & FY25 NET PROFIT UP BY 20%, RWA DOWN BY 25% ➢ Arma Partners partnership in Tech/Digital well ahead of acquisition plan ➢ Energy Transition strong transaction track record in Italy and Spain; Private Capital activity acceleration across the franchise ➢ Sustained mid-market activity in Italy, driven also by PB collaboration; start of Mid International in Germany and Spain ➢ BTP specialist fully operational with raising ranking of MB; CO2 trading on track Sources of K optimization for MB Group 1) Period on Period (FY 25&24 vs FY 23&22) Delivery across businesses ➢ In Advisory growth driven by international (45% of total transactions) and private capital (74% of total) ➢ 172 transactions announced incl. Arma; 12% PoP1 increase excl. Arma ➢ In Lending, despite lower volumes, achieved revenues stability thanks to fees driving RoRWA higher ➢ In Markets, growth with increasing RoRWA Successful execution of new initiatives ➢ Selective corporate lending with enhanced focus on return-driven capital allocation whilst maintaining risk discipline ➢ RWAs down €4bn since June23, due to Basel IV, increased use of risk mitigating measures and disciplined capital allocation CIB strategic path: ➢ Fee driven, K-light, more international diversified Investment Bank; ➢ Growth matched with strong RWA reduction to drive up profitability ➢ Leveraging new initiatives to expand CIB franchise Last 2Y KPIs (FY24 & FY25): ➢ Revenues: >€870m, up >20% ➢ Net profit: >€270m, up >20% ➢ RWAs down €4bn or 20% ➢ RoRWA up 70bps to ~1.9% Divisional ambitions - CIB Section 2.2 CIB delivery across all businesses, new initiatives and K-light strategy |
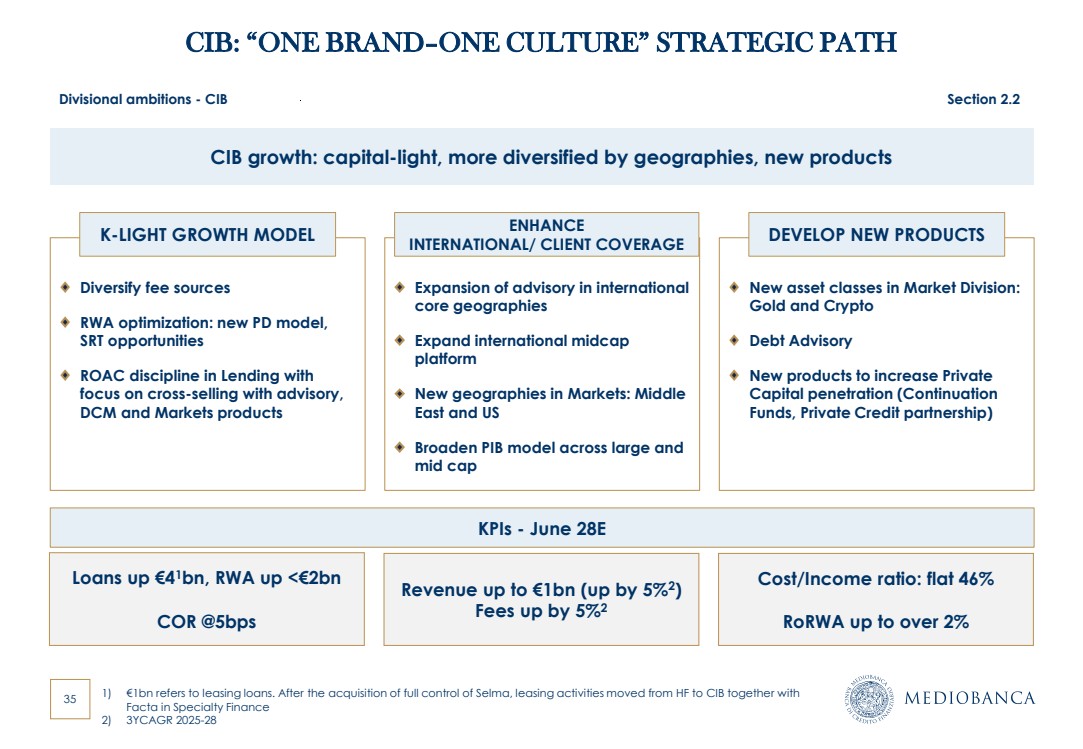
| 35 CIB: “ONE BRAND–ONE CULTURE” STRATEGIC PATH Diversify fee sources RWA optimization: new PD model, SRT opportunities ROAC discipline in Lending with focus on cross-selling with advisory, DCM and Markets products New asset classes in Market Division: Gold and Crypto Debt Advisory New products to increase Private Capital penetration (Continuation Funds, Private Credit partnership) Expansion of advisory in international core geographies Expand international midcap platform New geographies in Markets: Middle East and US Broaden PIB model across large and mid cap K-LIGHT GROWTH MODEL ENHANCE INTERNATIONAL/ CLIENT COVERAGE DEVELOP NEW PRODUCTS Loans up €41bn, RWA up <€2bn COR @5bps Cost/Income ratio: flat 46% RoRWA up to over 2% Revenue up to €1bn (up by 5%2 ) Fees up by 5%2 Divisional ambitions - CIB Section 2.2 CIB growth: capital-light, more diversified by geographies, new products KPIs - June 28E 1) €1bn refers to leasing loans. After the acquisition of full control of Selma, leasing activities moved from HF to CIB together with Facta in Specialty Finance 2) 3YCAGR 2025-28 |
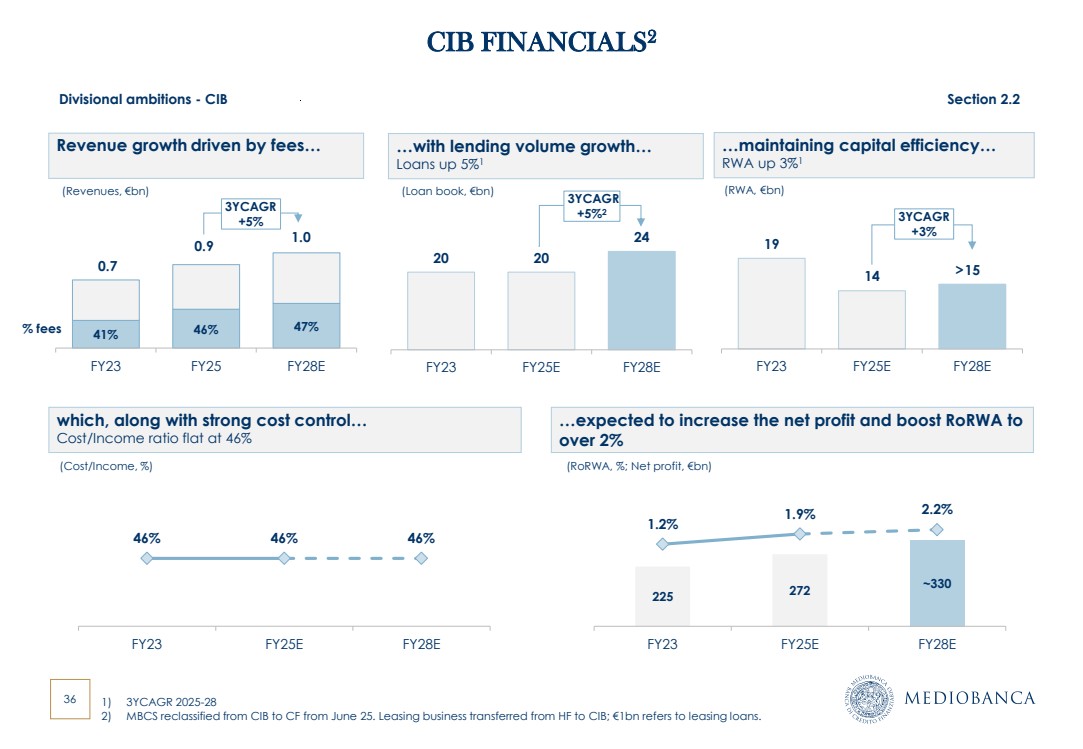
| 36 CIB FINANCIALS2 Divisional ambitions - CIB Section 2.2 20 20 24 5 7 9 11 13 15 17 19 21 23 25 FY23 FY25E FY28E 225 272 ~330 1.2% 1.9% 2.2% FY23 FY25E FY28E 19 14 15 5 7 9 11 13 15 17 19 21 FY23 FY25E FY28E …expected to increase the net profit and boost RoRWA to over 2% …maintaining capital efficiency… RWA up 3%1 …with lending volume growth… Loans up 5%1 which, along with strong cost control… Cost/Income ratio flat at 46% 3YCAGR +5%2 (Loan book, €bn) (RWA, €bn) (Cost/Income, %) (RoRWA, %; Net profit, €bn) 46% 46% 46% FY23 FY25E FY28E Revenue growth driven by fees… (Revenues, €bn) 41% 46% 47% FY23 FY25 FY28E % fees 3YCAGR +5% 0.9 0.7 3YCAGR +3% 1) 3YCAGR 2025-28 2) MBCS reclassified from CIB to CF from June 25. Leasing business transferred from HF to CIB; €1bn refers to leasing loans. 1.0 > |
| AGENDA Section 1. MB investment case Section 2. Group ambitions & financials Section 3. Divisional ambitions 3.1 Wealth Management 3.2 Corporate & Investment Banking 3.3 Consumer Finance Section 4. Closing remarks Annexes |
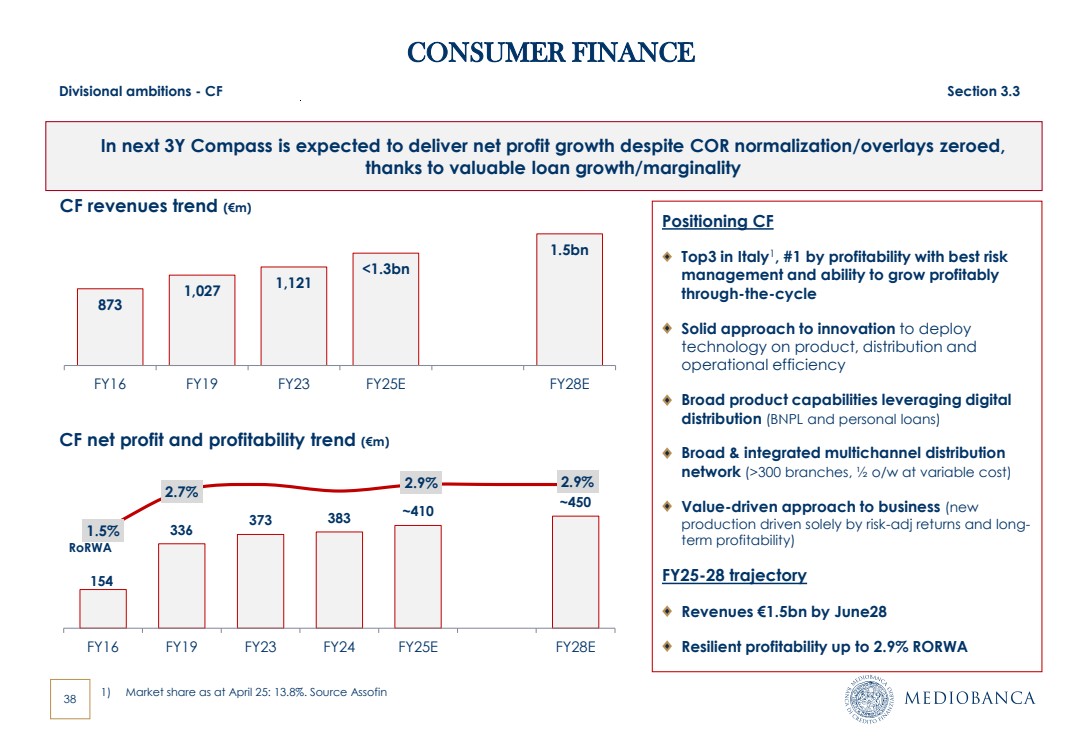
| 38 CONSUMER FINANCE 873 1,027 1,121 <1.3bn 1.5bn FY16 FY19 FY23 FY25E FY28E CF revenues trend (€m) 154 336 373 383 ~410 ~450 1.5% 2.7% 2.9% 2.9% -1.5% -1.0% -0.5% 0.0% 0.5% 1.0% 1.5% 2.0% 2.5% 3.0% 3.5% FY16 FY19 FY23 FY24 FY25E FY28E 0 100 200 300 400 500 600 CF net profit and profitability trend (€m) RoRWA Positioning CF Top3 in Italy1 , #1 by profitability with best risk management and ability to grow profitably through-the-cycle Solid approach to innovation to deploy technology on product, distribution and operational efficiency Broad product capabilities leveraging digital distribution (BNPL and personal loans) Broad & integrated multichannel distribution network (>300 branches, ½ o/w at variable cost) Value-driven approach to business (new production driven solely by risk-adj returns and long-term profitability) FY25-28 trajectory Revenues €1.5bn by June28 Resilient profitability up to 2.9% RORWA 1) Market share as at April 25: 13.8%. Source Assofin Divisional ambitions - CF Section 3.3 In next 3Y Compass is expected to deliver net profit growth despite COR normalization/overlays zeroed, thanks to valuable loan growth/marginality |
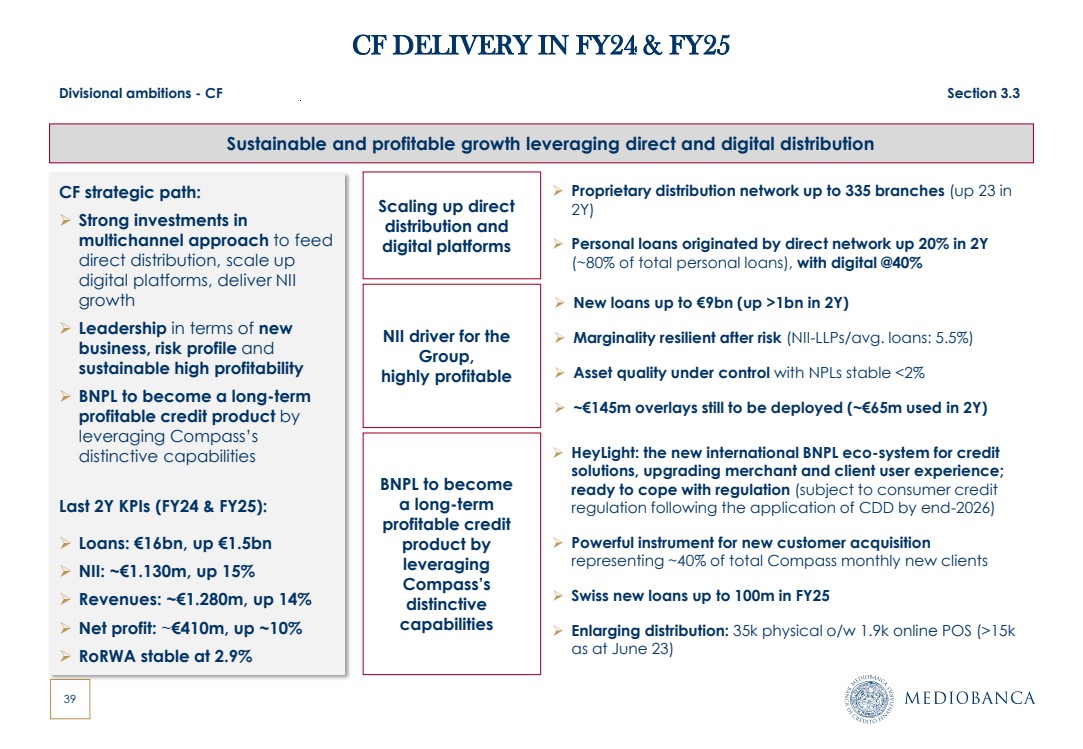
| 39 CF DELIVERY IN FY24 & FY25 CF strategic path: ➢ Strong investments in multichannel approach to feed direct distribution, scale up digital platforms, deliver NII growth ➢ Leadership in terms of new business, risk profile and sustainable high profitability ➢ BNPL to become a long-term profitable credit product by leveraging Compass’s distinctive capabilities Last 2Y KPIs (FY24 & FY25): ➢ Loans: €16bn, up €1.5bn ➢ NII: ~€1.130m, up 15% ➢ Revenues: ~€1.280m, up 14% ➢ Net profit: ~€410m, up ~10% ➢ RoRWA stable at 2.9% Sustainable and profitable growth leveraging direct and digital distribution ➢ HeyLight: the new international BNPL eco-system for credit solutions, upgrading merchant and client user experience; ready to cope with regulation (subject to consumer credit regulation following the application of CDD by end-2026) ➢ Powerful instrument for new customer acquisition representing ~40% of total Compass monthly new clients ➢ Swiss new loans up to 100m in FY25 ➢ Enlarging distribution: 35k physical o/w 1.9k online POS (>15k as at June 23) BNPL to become a long-term profitable credit product by leveraging Compass’s distinctive capabilities ➢ Proprietary distribution network up to 335 branches (up 23 in 2Y) ➢ Personal loans originated by direct network up 20% in 2Y (~80% of total personal loans), with digital @40% Scaling up direct distribution and digital platforms NII driver for the Group, highly profitable ➢ New loans up to €9bn (up >1bn in 2Y) ➢ Marginality resilient after risk (NII-LLPs/avg. loans: 5.5%) ➢ Asset quality under control with NPLs stable <2% ➢ ~€145m overlays still to be deployed (~€65m used in 2Y) Divisional ambitions - CF Section 3.3 |
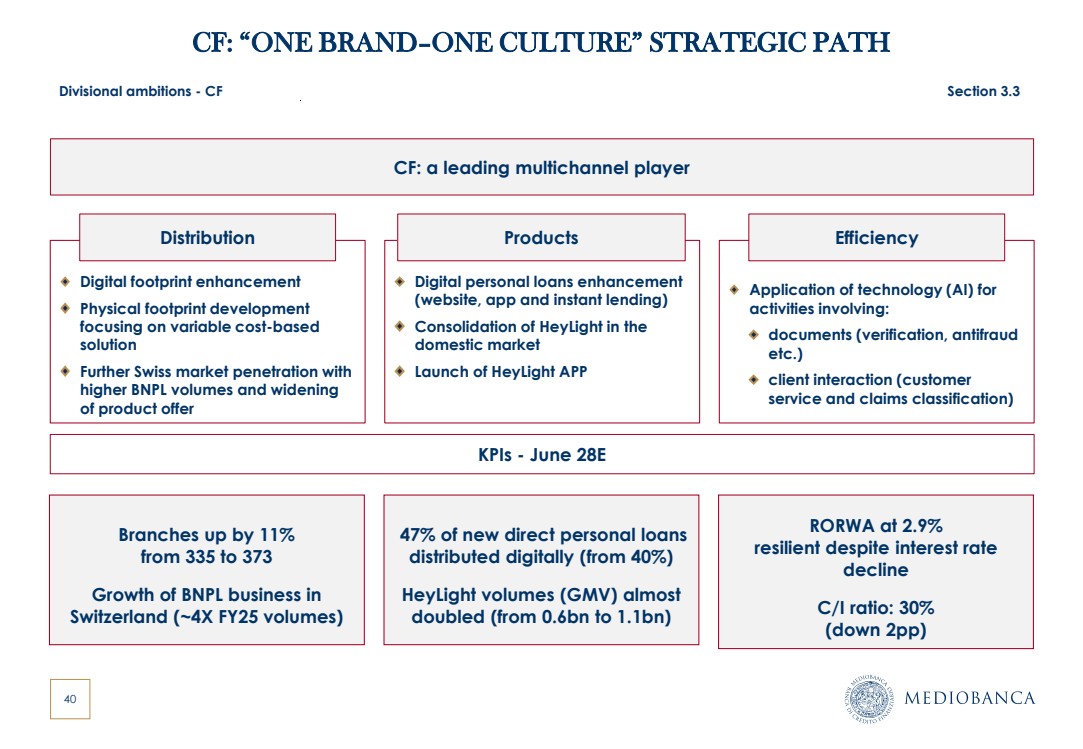
| 40 CF: “ONE BRAND–ONE CULTURE” STRATEGIC PATH Digital footprint enhancement Physical footprint development focusing on variable cost-based solution Further Swiss market penetration with higher BNPL volumes and widening of product offer Application of technology (AI) for activities involving: documents (verification, antifraud etc.) client interaction (customer service and claims classification) Digital personal loans enhancement (website, app and instant lending) Consolidation of HeyLight in the domestic market Launch of HeyLight APP Distribution Products Efficiency CF: a leading multichannel player Branches up by 11% from 335 to 373 Growth of BNPL business in Switzerland (~4X FY25 volumes) RORWA at 2.9% resilient despite interest rate decline C/I ratio: 30% (down 2pp) 47% of new direct personal loans distributed digitally (from 40%) HeyLight volumes (GMV) almost doubled (from 0.6bn to 1.1bn) KPIs - June 28E Divisional ambitions - CF Section 3.3 |
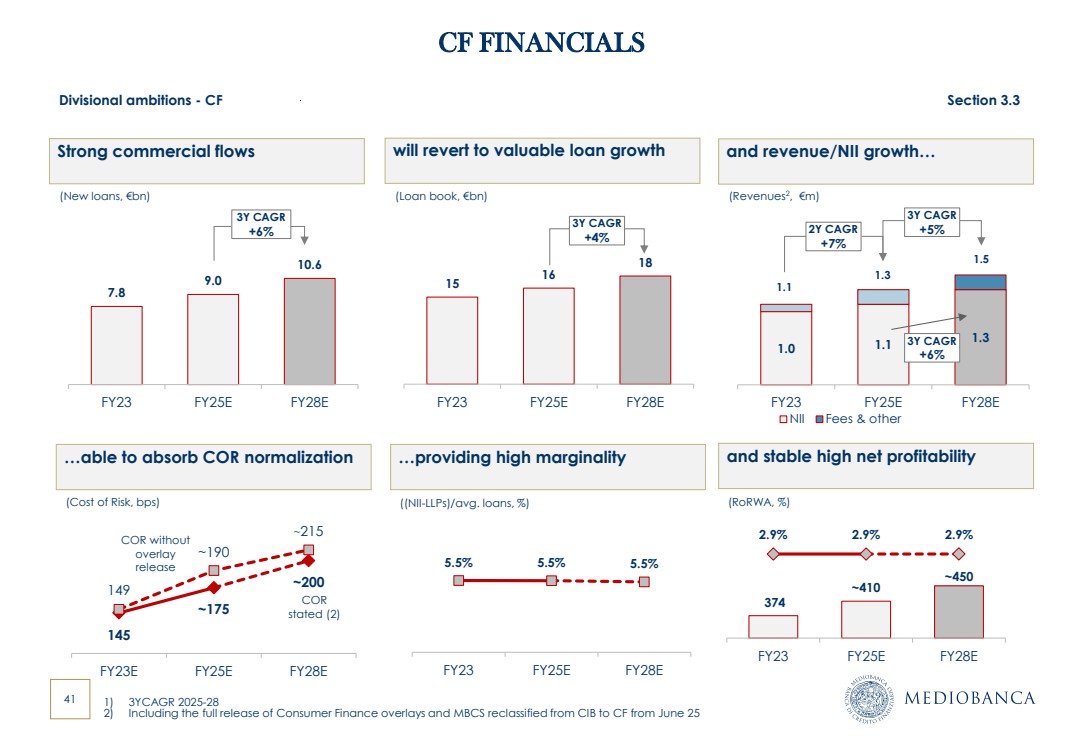
| 41 145 ~175 ~200 149 ~190 ~215 FY23E FY25E FY28E 15 16 18 FY23 FY25E FY28E CF FINANCIALS will revert to valuable loan growth and revenue/NII growth… and stable high net profitability (Loan book, €bn) (Revenues2 , €m) COR stated (2) 3Y CAGR +4% 1.0 1.1 1.3 FY23 FY25E FY28E NII Fees & other 3Y CAGR +5% 374 ~410 ~450 2.9% 2.9% 2.9% FY23 FY25E FY28E …able to absorb COR normalization (Cost of Risk, bps) 2Y CAGR +7% 1) 3YCAGR 2025-28 2) Including the full release of Consumer Finance overlays and MBCS reclassified from CIB to CF from June 25 7.8 9.0 10.6 FY23 FY25E FY28E Strong commercial flows (New loans, €bn) 3Y CAGR +6% COR without overlay release (RoRWA, %) 1.1 1.3 1.5 …providing high marginality 5.5% 5.5% 5.5% FY23 FY25E FY28E ((NII-LLPs)/avg. loans, %) 3Y CAGR +6% Divisional ambitions - CF Section 3.3 |
| AGENDA Section 1. MB investment case Section 2. Group ambitions & financials Section 3. Divisional ambitions 3.1 Wealth Management 3.2 Corporate & Investment Banking 3.3 Consumer Finance Section 4. Closing remarks Annexes |
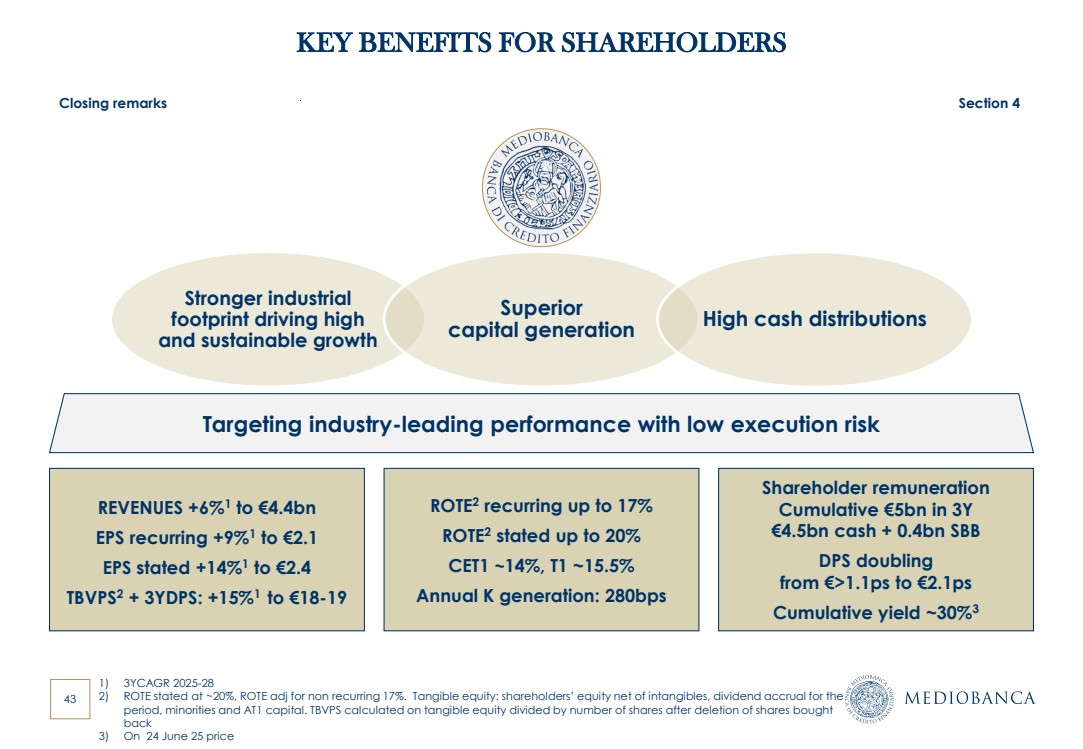
| 43 ROTE2 recurring up to 17% ROTE2 stated up to 20% CET1 ~14%, T1 ~15.5% Annual K generation: 280bps Shareholder remuneration Cumulative €5bn in 3Y €4.5bn cash + 0.4bn SBB DPS doubling from €>1.1ps to €2.1ps Cumulative yield ~30%3 Targeting industry-leading performance with low execution risk Stronger industrial footprint driving high and sustainable growth Superior capital generation High cash distributions REVENUES +6%1 to €4.4bn EPS recurring +9%1 to €2.1 EPS stated +14%1 to €2.4 TBVPS2 + 3YDPS: +15%1 to €18-19 Closing remarks Section 4 KEY BENEFITS FOR SHAREHOLDERS 1) 3YCAGR 2025-28 2) ROTE stated at ~20%, ROTE adj for non recurring 17%. Tangible equity: shareholders’ equity net of intangibles, dividend accrual for the period, minorities and AT1 capital. TBVPS calculated on tangible equity divided by number of shares after deletion of shares bought back 3) On 24 June 25 price |
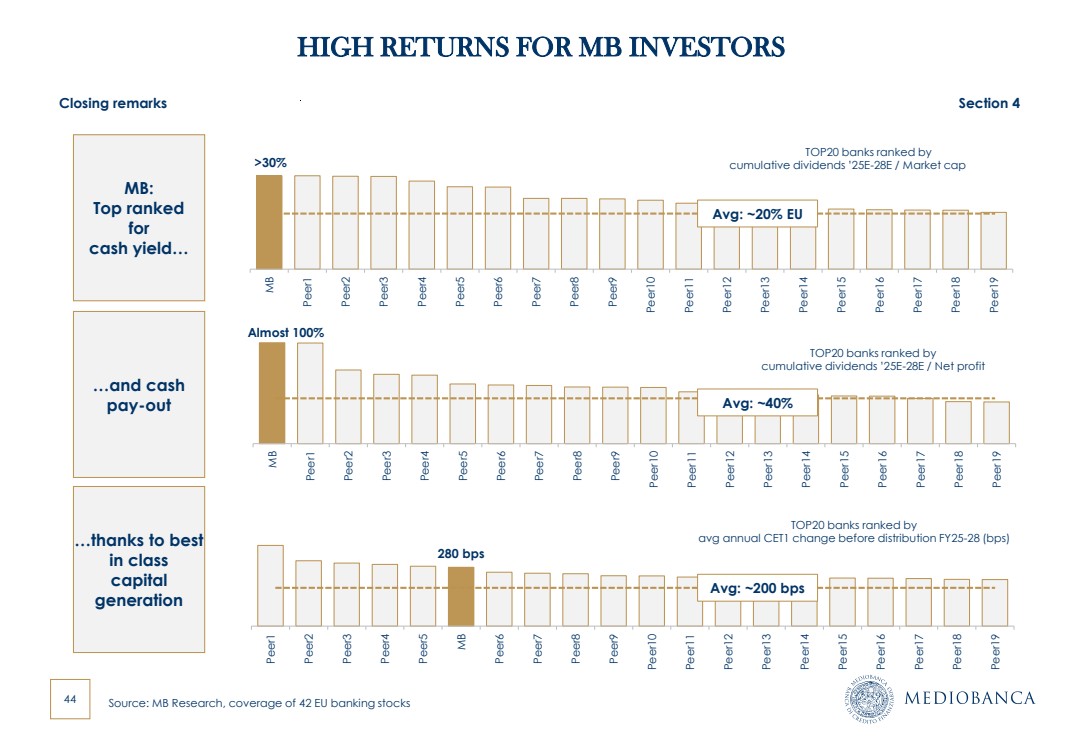
| 44 HIGH RETURNS FOR MB INVESTORS >30%MB Peer1 Peer2 Peer3 Peer4 Peer5 Peer6 Peer7 Peer8 Peer9 Peer10 Peer11 Peer12 Peer13 Peer14 Peer15 Peer16 Peer17 Peer18 Peer19 Avg: ~20% EU TOP20 banks ranked by cumulative dividends ’25E-28E / Market cap Almost 100% MB Peer1 Peer2 Peer3 Peer4 Peer5 Peer6 Peer7 Peer8 Peer9 Peer10 Peer11 Peer12 Peer13 Peer14 Peer15 Peer16 Peer17 Peer18 Peer19 MB: Top ranked for cash yield… 280 bps Peer1 Peer2 Peer3 Peer4 Peer5 MB Peer6 Peer7 Peer8 Peer9 Peer10 Peer11 Peer12 Peer13 Peer14 Peer15 Peer16 Peer17 Peer18 Peer19 …and cash pay-out …thanks to best in class capital generation Avg: ~40% TOP20 banks ranked by avg annual CET1 change before distribution FY25-28 (bps) Avg: ~200 bps Closing remarks Section 4 TOP20 banks ranked by cumulative dividends ’25E-28E / Net profit Source: MB Research, coverage of 42 EU banking stocks |
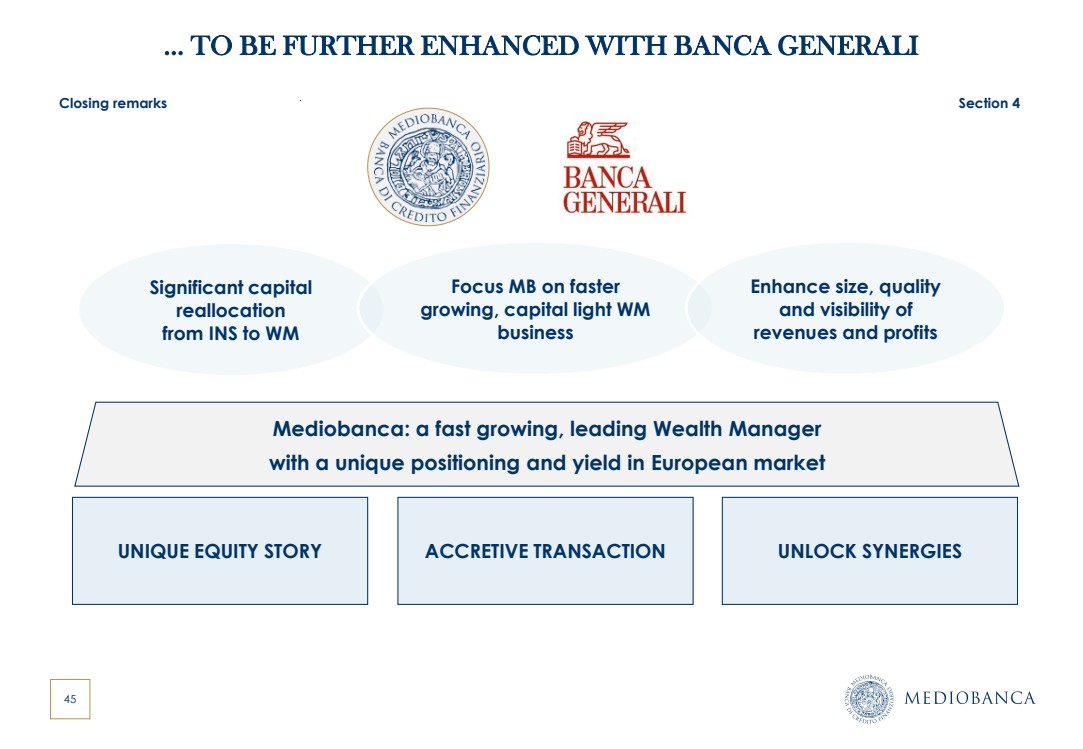
| 45 Significant capital reallocation from INS to WM Focus MB on faster growing, capital light WM business Enhance size, quality and visibility of revenues and profits … TO BE FURTHER ENHANCED WITH BANCA GENERALI UNIQUE EQUITY STORY ACCRETIVE TRANSACTION UNLOCK SYNERGIES Mediobanca: a fast growing, leading Wealth Manager with a unique positioning and yield in European market Closing remarks Section 4 |
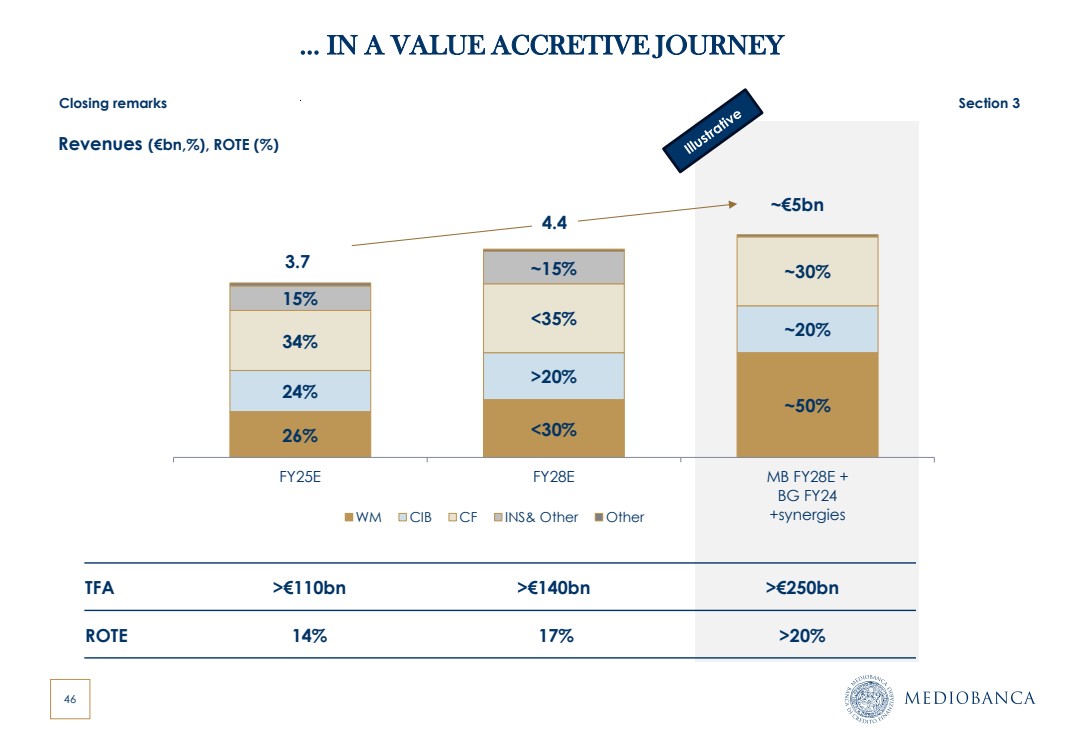
| 46 … IN A VALUE ACCRETIVE JOURNEY Revenues (€bn,%), ROTE (%) 26% <30% ~50% 24% >20% ~20% 34% <35% ~30% 15% ~15% FY25E FY28E MB FY28E + BG FY24 WM CIB CF INS& Other Other +synergies 3.7 ~€5bn Closing remarks Section 3 TFA >€110bn >€140bn >€250bn ROTE 14% 17% >20% 4.4 |
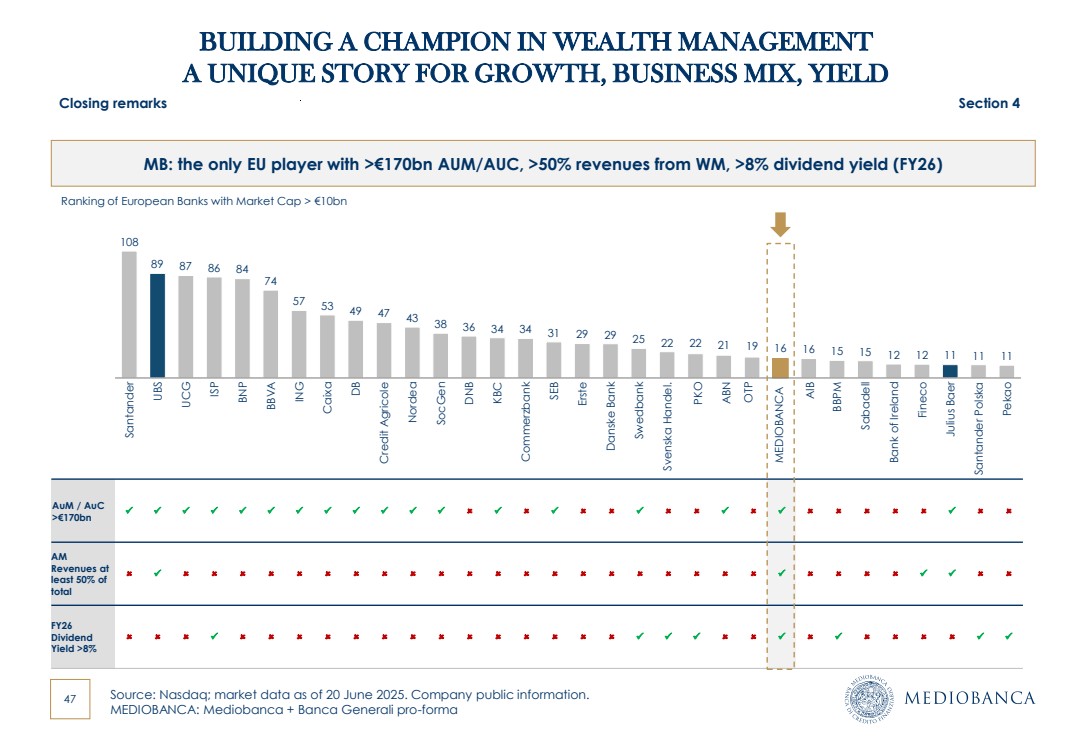
| 47 BUILDING A CHAMPION IN WEALTH MANAGEMENT A UNIQUE STORY FOR GROWTH, BUSINESS MIX, YIELD Source: Nasdaq; market data as of 20 June 2025. Company public information. MEDIOBANCA: Mediobanca + Banca Generali pro-forma Ranking of European Banks with Market Cap > €10bn MB: the only EU player with >€170bn AUM/AUC, >50% revenues from WM, >8% dividend yield (FY26) UBS UCGISP BNP BBVA ING CaixaDB Credit Agricole Nordea SocGen DNB KBC Commerzbank SEB Erste Danske Bank Swedbank Svenska Handel. MEDIOBANCA PKO ABN OTP AIB BBPM Sabadell Bank of Ireland Fineco Julius Baer Santander Polska Pekao 108 89 87 86 84 74 57 53 49 47 43 38 36 34 34 31 Santander 29 25 22 22 21 19 16 29 15 15 12 12 11 11 11 16 AuM / AuC >€170bn ✓ ✓ ✓ ✓ ✓ ✓ ✓ ✓ ✓ ✓ ✓ ✓ ✓ ✓ ✓ ✓ ✓ ✓ AM Revenues at least 50% of total ✓ ✓ ✓ ✓ FY26 Dividend Yield >8% ✓ ✓ ✓ ✓ ✓ ✓ ✓ ✓ Closing remarks Section 4 |
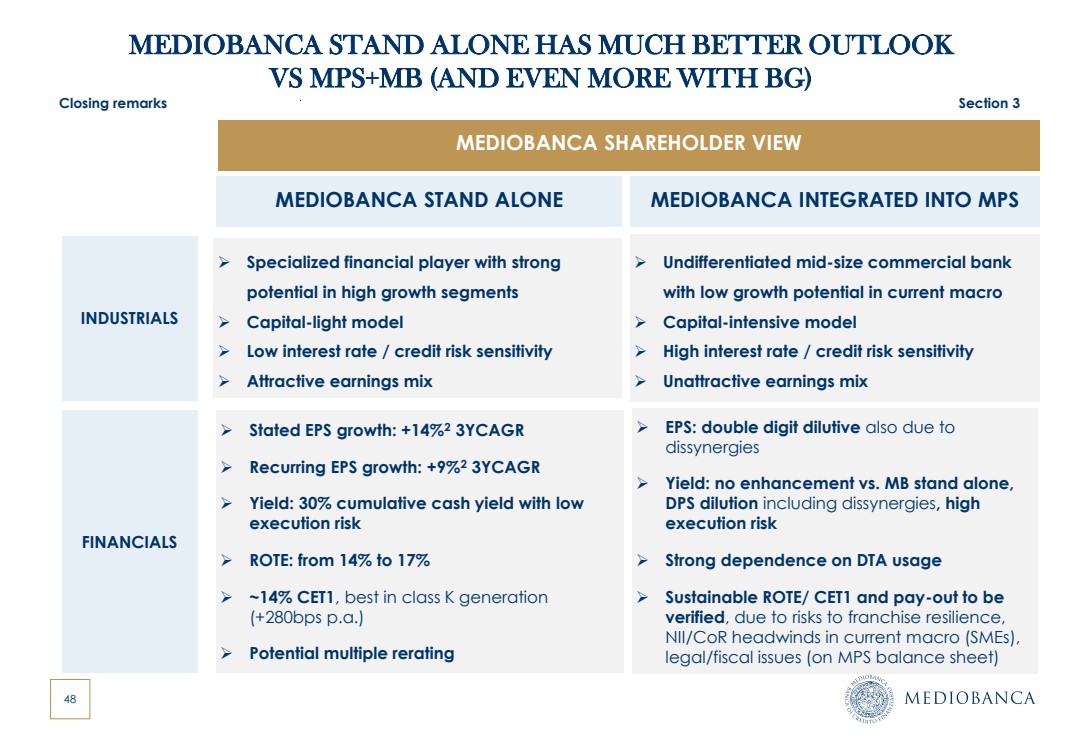
| 48 ➢ Specialized financial player with strong potential in high growth segments ➢ Capital-light model ➢ Low interest rate / credit risk sensitivity ➢ Attractive earnings mix MEDIOBANCA STAND ALONE HAS MUCH BETTER OUTLOOK VS MPS+MB (AND EVEN MORE WITH BG) MEDIOBANCA STAND ALONE MEDIOBANCA INTEGRATED INTO MPS ➢ Undifferentiated mid-size commercial bank with low growth potential in current macro ➢ Capital-intensive model ➢ High interest rate / credit risk sensitivity ➢ Unattractive earnings mix FINANCIALS ➢ Stated EPS growth: +14%2 3YCAGR ➢ Recurring EPS growth: +9%2 3YCAGR ➢ Yield: 30% cumulative cash yield with low execution risk ➢ ROTE: from 14% to 17% ➢ ~14% CET1, best in class K generation (+280bps p.a.) ➢ Potential multiple rerating ➢ EPS: double digit dilutive also due to dissynergies ➢ Yield: no enhancement vs. MB stand alone, DPS dilution including dissynergies, high execution risk ➢ Strong dependence on DTA usage ➢ Sustainable ROTE/ CET1 and pay-out to be verified, due to risks to franchise resilience, NII/CoR headwinds in current macro (SMEs), legal/fiscal issues (on MPS balance sheet) INDUSTRIALS MEDIOBANCA SHAREHOLDER VIEW Closing remarks Section 3 |
| Q&A MEDIOBANCA “ONE BRAND – ONE CULTURE” Strategic plan rolling to FY28 Milan, 27 June 2025 |
| AGENDA Annexes 1. Group key projections 2. Macro scenario 3. ESG targets 4. Digital agenda 5. Glossary |
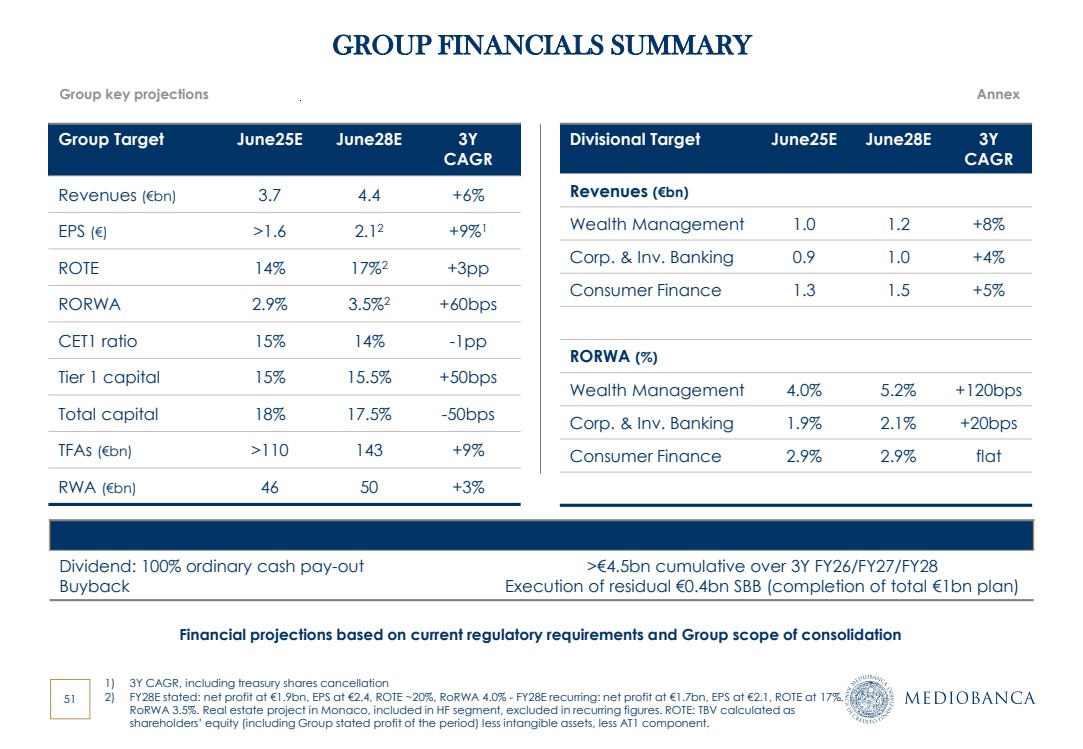
| 51 GROUP FINANCIALS SUMMARY Financial projections based on current regulatory requirements and Group scope of consolidation Group Target June25E June28E 3Y CAGR Revenues (€bn) 3.7 4.4 +6% EPS (€) >1.6 2.12 +9%1 ROTE 14% 17%2 +3pp RORWA 2.9% 3.5%2 +60bps CET1 ratio 15% 14% -1pp Tier 1 capital 15% 15.5% +50bps Total capital 18% 17.5% -50bps TFAs (€bn) >110 143 +9% RWA (€bn) 46 50 +3% Divisional Target June25E June28E 3Y CAGR Revenues (€bn) Wealth Management 1.0 1.2 +8% Corp. & Inv. Banking 0.9 1.0 +4% Consumer Finance 1.3 1.5 +5% RORWA (%) Wealth Management 4.0% 5.2% +120bps Corp. & Inv. Banking 1.9% 2.1% +20bps Consumer Finance 2.9% 2.9% flat 1) 3Y CAGR, including treasury shares cancellation 2) FY28E stated: net profit at €1.9bn, EPS at €2.4, ROTE ~20%, RoRWA 4.0% - FY28E recurring: net profit at €1.7bn, EPS at €2.1, ROTE at 17%, RoRWA 3.5%. Real estate project in Monaco, included in HF segment, excluded in recurring figures. ROTE: TBV calculated as shareholders’ equity (including Group stated profit of the period) less intangible assets, less AT1 component. Group key projections Annex Remuneration3 Dividend: 100% ordinary cash pay-out Buyback >€4.5bn cumulative over 3Y FY26/FY27/FY28 Execution of residual €0.4bn SBB (completion of total €1bn plan) |
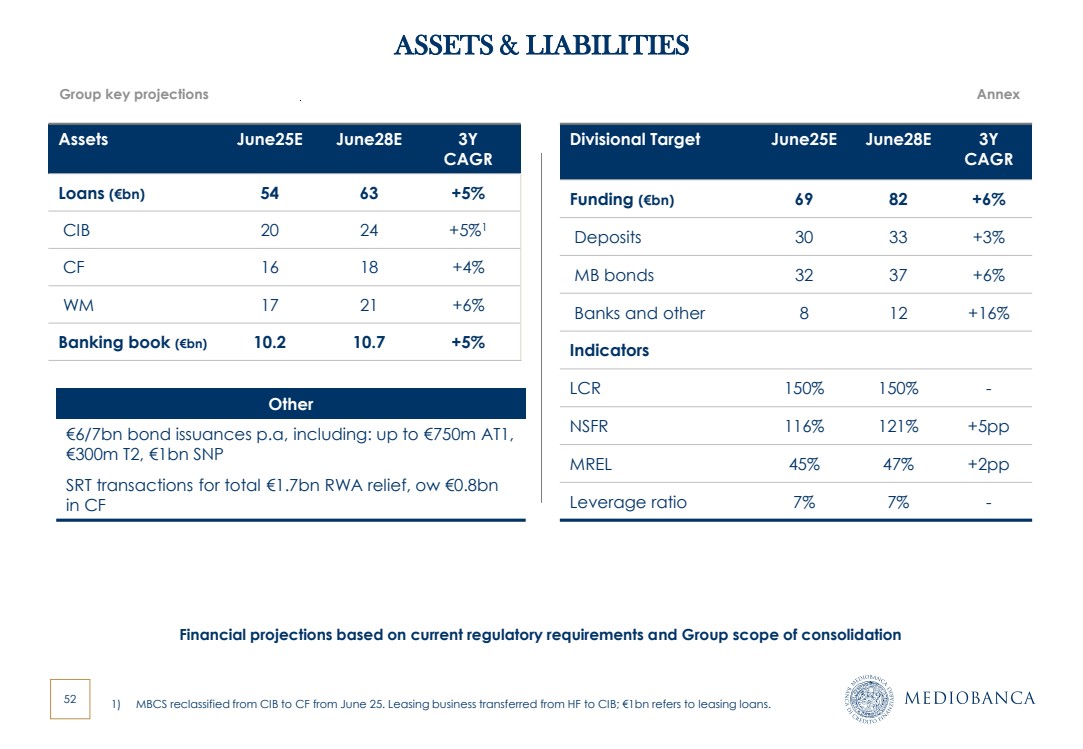
| 52 ASSETS & LIABILITIES Financial projections based on current regulatory requirements and Group scope of consolidation Assets June25E June28E 3Y CAGR Loans (€bn) 54 63 +5% CIB 20 24 +5%1 CF 16 18 +4% WM 17 21 +6% Banking book (€bn) 10.2 10.7 +5% Divisional Target June25E June28E 3Y CAGR Funding (€bn) 69 82 +6% Deposits 30 33 +3% MB bonds 32 37 +6% Banks and other 8 12 +16% Indicators LCR 150% 150% - NSFR 116% 121% +5pp MREL 45% 47% +2pp Leverage ratio 7% 7% - Group key projections Annex Other €6/7bn bond issuances p.a, including: up to €750m AT1, €300m T2, €1bn SNP SRT transactions for total €1.7bn RWA relief, ow €0.8bn in CF 1) MBCS reclassified from CIB to CF from June 25. Leasing business transferred from HF to CIB; €1bn refers to leasing loans. |
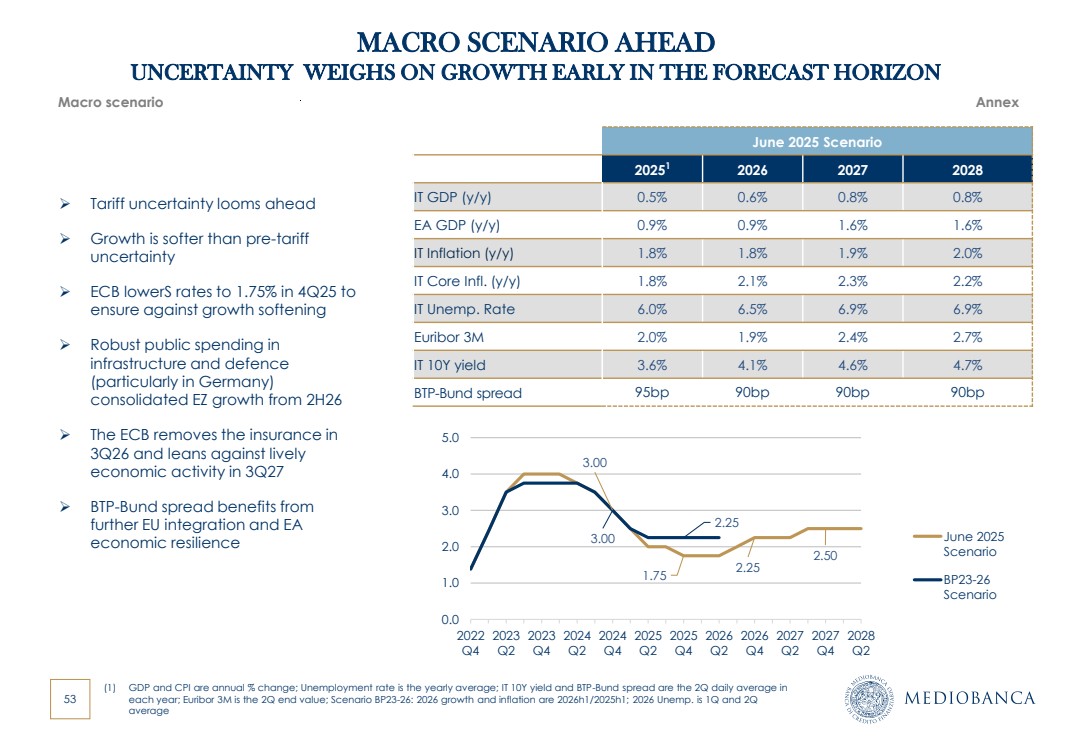
| 53 IT GDP (y/y) EA GDP (y/y) IT Inflation (y/y) IT Core Infl. (y/y) IT Unemp. Rate Euribor 3M IT 10Y yield BTP-Bund spread (1) GDP and CPI are annual % change; Unemployment rate is the yearly average; IT 10Y yield and BTP-Bund spread are the 2Q daily average in each year; Euribor 3M is the 2Q end value; Scenario BP23-26: 2026 growth and inflation are 2026h1/2025h1; 2026 Unemp. is 1Q and 2Q average MACRO SCENARIO AHEAD UNCERTAINTY WEIGHS ON GROWTH EARLY IN THE FORECAST HORIZON Macro scenario Annex June 2025 Scenario 20251 2026 2027 2028 0.5% 0.6% 0.8% 0.8% 0.9% 0.9% 1.6% 1.6% 1.8% 1.8% 1.9% 2.0% 1.8% 2.1% 2.3% 2.2% 6.0% 6.5% 6.9% 6.9% 2.0% 1.9% 2.4% 2.7% 3.6% 4.1% 4.6% 4.7% 95bp 90bp 90bp 90bp 3.00 1.75 2.25 2.50 3.00 2.25 0.0 1.0 2.0 3.0 4.0 5.0 2022 Q4 2023 Q2 2023 Q4 2024 Q2 2024 Q4 2025 Q2 2025 Q4 2026 Q2 2026 Q4 2027 Q2 2027 Q4 2028 Q2 June 2025 Scenario BP23-26 Scenario ➢ Tariff uncertainty looms ahead ➢ Growth is softer than pre-tariff uncertainty ➢ ECB lowerS rates to 1.75% in 4Q25 to ensure against growth softening ➢ Robust public spending in infrastructure and defence (particularly in Germany) consolidated EZ growth from 2H26 ➢ The ECB removes the insurance in 3Q26 and leans against lively economic activity in 3Q27 ➢ BTP-Bund spread benefits from further EU integration and EA economic resilience |
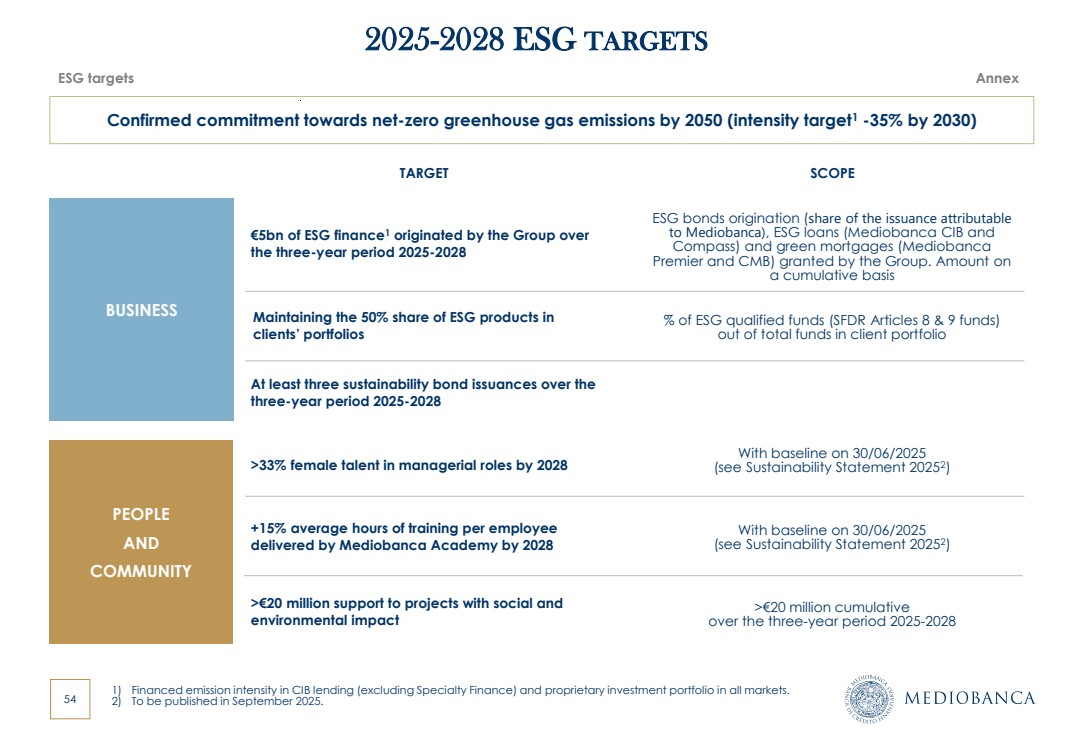
| 54 BUSINESS 2025-2028 ESG TARGETS PEOPLE AND COMMUNITY 1) Financed emission intensity in CIB lending (excluding Specialty Finance) and proprietary investment portfolio in all markets. 2) To be published in September 2025. Confirmed commitment towards net-zero greenhouse gas emissions by 2050 (intensity target1 -35% by 2030) >33% female talent in managerial roles by 2028 +15% average hours of training per employee delivered by Mediobanca Academy by 2028 >€20 million support to projects with social and environmental impact At least three sustainability bond issuances over the three-year period 2025-2028 Maintaining the 50% share of ESG products in clients’ portfolios €5bn of ESG finance1 originated by the Group over the three-year period 2025-2028 TARGET SCOPE ESG bonds origination (share of the issuance attributable to Mediobanca), ESG loans (Mediobanca CIB and Compass) and green mortgages (Mediobanca Premier and CMB) granted by the Group. Amount on a cumulative basis % of ESG qualified funds (SFDR Articles 8 & 9 funds) out of total funds in client portfolio With baseline on 30/06/2025 (see Sustainability Statement 20252 ) With baseline on 30/06/2025 (see Sustainability Statement 20252 ) >€20 million cumulative over the three-year period 2025-2028 ESG targets Annex |
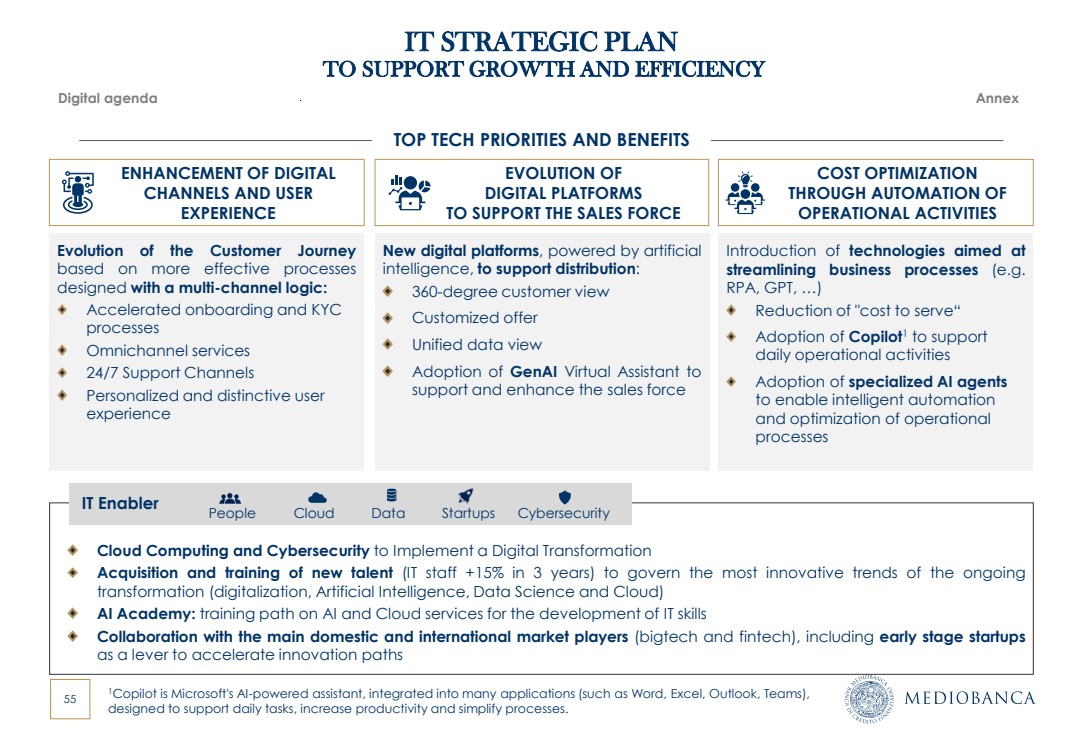
| 55 IT STRATEGIC PLAN TO SUPPORT GROWTH AND EFFICIENCY ENHANCEMENT OF DIGITAL CHANNELS AND USER EXPERIENCE EVOLUTION OF DIGITAL PLATFORMS TO SUPPORT THE SALES FORCE COST OPTIMIZATION THROUGH AUTOMATION OF OPERATIONAL ACTIVITIES Evolution of the Customer Journey based on more effective processes designed with a multi-channel logic: Accelerated onboarding and KYC processes Omnichannel services 24/7 Support Channels Personalized and distinctive user experience Introduction of technologies aimed at streamlining business processes (e.g. RPA, GPT, …) Reduction of "cost to serve“ Adoption of Copilot1 to support daily operational activities Adoption of specialized AI agents to enable intelligent automation and optimization of operational processes New digital platforms, powered by artificial intelligence, to support distribution: 360-degree customer view Customized offer Unified data view Adoption of GenAI Virtual Assistant to support and enhance the sales force Cloud Computing and Cybersecurity to Implement a Digital Transformation Acquisition and training of new talent (IT staff +15% in 3 years) to govern the most innovative trends of the ongoing transformation (digitalization, Artificial Intelligence, Data Science and Cloud) AI Academy: training path on AI and Cloud services for the development of IT skills Collaboration with the main domestic and international market players (bigtech and fintech), including early stage startups as a lever to accelerate innovation paths TOP TECH PRIORITIES AND BENEFITS People Cloud Data IT Enabler Startups Cybersecurity 1Copilot is Microsoft's AI-powered assistant, integrated into many applications (such as Word, Excel, Outlook, Teams), designed to support daily tasks, increase productivity and simplify processes. Digital agenda Annex |
| 56 Accelerating Innovation in CIB Innovation plan aimed at strengthening business competitiveness with data valorization, AI-based automation and cutting-edge platforms Digitally Driven Consumer Finance Intelligent Automation Platform Data valorization platform Development of a shared technology platform to support all smart automation (RPA, AI, Low Code) and dematerialization initiatives (e.g. electronic signatures) Consolidation of the Group's data platform, with real-time analytics and AI, to improve business development, cross-selling, ESG integration and compliance with regulatory requirements Strengthening the digital offering through new channels (e.g. BNPL), new products (e.g. instant lending) and new platforms to strengthen the resilience of the service. Consolidation of the Swiss market (e.g. acquisition of HeidiPay) DESCRIPTION MAIN PROGRAMMES Digital Platform for Wealth Technology consolidation to maximize synergies between companies and improve the overall digital level. Customized Management Account (CMA) platform to offer personalized wealth management to the client Journey to Cloud Advancement of the evolutionary path aimed at seizing the main advantages of the Cloud (e.g. reduction of time-to-market, on-demand capacity, ...), with a multi-cloud provider approach in line with market best practices Cross-divisional programmes Division-specific vertical programmes 25 Programmes 3 Years ~300 Projects The IT strategic plan is structured over a 3-year period and is made up of 25 programs that include more than 300 projects, with a focus on both specific businesses and cross-Group needs PROJECTS INVESTMENTS €260m IT STRATEGIC PLAN AND KEY INITIATIVES BY DIVISION Digital agenda Annex |

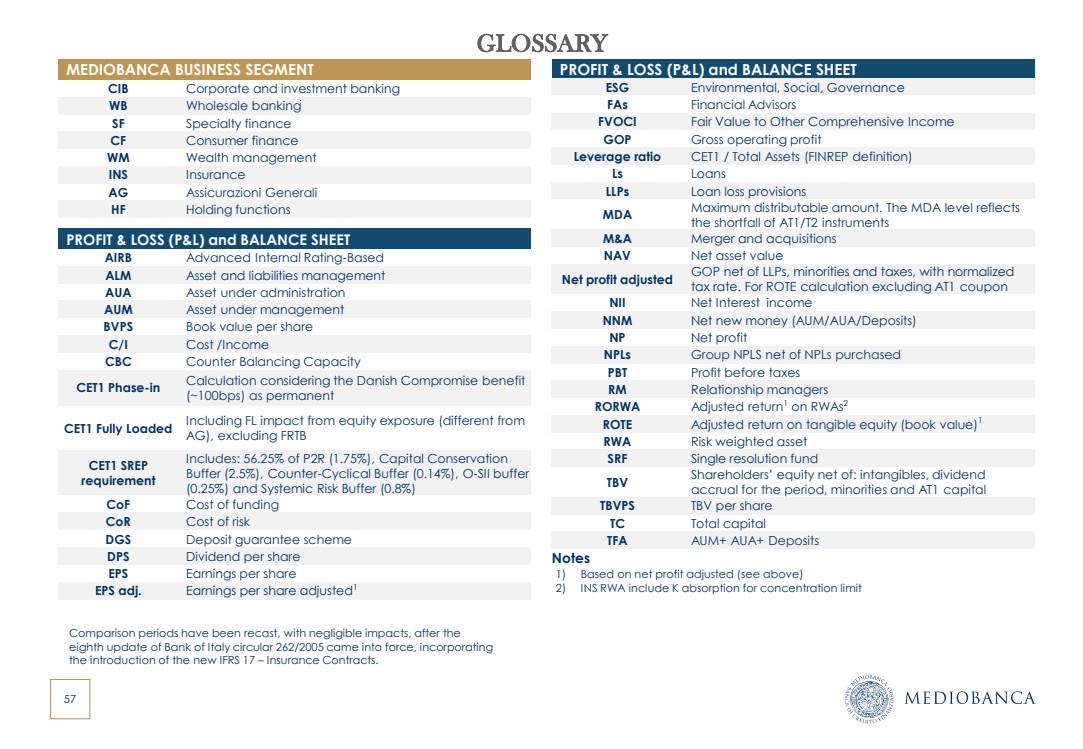
| 57 GLOSSARY MEDIOBANCA BUSINESS SEGMENT CIB Corporate and investment banking WB Wholesale banking SF Specialty finance CF Consumer finance WM Wealth management INS Insurance AG Assicurazioni Generali HF Holding functions PROFIT & LOSS (P&L) and BALANCE SHEET AIRB Advanced Internal Rating-Based ALM Asset and liabilities management AUA Asset under administration AUM Asset under management BVPS Book value per share C/I Cost /Income CBC Counter Balancing Capacity CET1 Phase-in Calculation considering the Danish Compromise benefit (~100bps) as permanent CET1 Fully Loaded Including FL impact from equity exposure (different from AG), excluding FRTB CET1 SREP requirement Includes: 56.25% of P2R (1.75%), Capital Conservation Buffer (2.5%), Counter-Cyclical Buffer (0.14%), O-SII buffer (0.25%) and Systemic Risk Buffer (0.8%) CoF Cost of funding CoR Cost of risk DGS Deposit guarantee scheme DPS Dividend per share EPS Earnings per share EPS adj. Earnings per share adjusted1 PROFIT & LOSS (P&L) and BALANCE SHEET ESG Environmental, Social, Governance FAs Financial Advisors FVOCI Fair Value to Other Comprehensive Income GOP Gross operating profit Leverage ratio CET1 / Total Assets (FINREP definition) Ls Loans LLPs Loan loss provisions MDA Maximum distributable amount. The MDA level reflects the shortfall of AT1/T2 instruments M&A Merger and acquisitions NAV Net asset value Net profit adjusted GOP net of LLPs, minorities and taxes, with normalized tax rate. For ROTE calculation excluding AT1 coupon NII Net Interest income NNM Net new money (AUM/AUA/Deposits) NP Net profit NPLs Group NPLS net of NPLs purchased PBT Profit before taxes RM Relationship managers RORWA Adjusted return1 on RWAs2 ROTE Adjusted return on tangible equity (book value)1 RWA Risk weighted asset SRF Single resolution fund TBV Shareholders’ equity net of: intangibles, dividend accrual for the period, minorities and AT1 capital TBVPS TBV per share TC Total capital TFA AUM+ AUA+ Deposits Notes 1) Based on net profit adjusted (see above) 2) INS RWA include K absorption for concentration limit Comparison periods have been recast, with negligible impacts, after the eighth update of Bank of Italy circular 262/2005 came into force, incorporating the introduction of the new IFRS 17 – Insurance Contracts. |
| 58 DISCLAIMER & DECLARATION OF HEAD OF FINANCIAL REPORTING Disclaimer This document includes certain projections, estimates, forecasts and consequent targets which reflect the current views of Mediobanca – Banca di Credito Finanziario S.p.A. (the “Company”) with regard to future events (“forward-looking statements”). These forward-looking statements include, but are not limited to, all statements other than actual data, historical or current, including those regarding the Group’s future financial position and operating results, strategy, plans, objectives and future developments in the markets where the Group operates or is intending to operate. All forward-looking statements, based on information available to the Company as of the date hereof, rely on scenarios, assumptions, expectations and projections regarding future events which are subject to uncertainties because dependent on factors most of which are beyond the Company’s control. Such uncertainties may cause actual results and performances that differ, including materially, from those projected in or implied by the data present; therefore the forward-looking statements are not a reliable indicator of future performances. The information and opinions included in this document refer to the date hereof and accordingly may change without notice. The Company, however, undertakes no obligation to publicly update or revise any forward-looking statement, whether as a result of new information, future events or otherwise, except as may be required by applicable law. Due to the risks and uncertainties described above, readers are advised not to place undue reliance on such forward-looking statements as a prediction of actual results. No decision as to whether to execute a contract or subscribe to an investment should be based or rely on this document, or any part thereof, or the fact of its having been distributed. Declaration by Head of Company Financial Reporting As required by Article 154-bis, paragraph 2 of Italian Legislative Decree 58/98, the undersigned hereby declares that the stated accounting information contained in this report conforms to the documents, account ledgers and book entries of the company. Head of Company Financial Reporting Emanuele Flappini |
| 59 INVESTOR CONTACT DETAILS Mediobanca Group Investor Relations Piazzetta Cuccia 1, 20121 Milan, Italy Email: investor.relations@mediobanca.com +39 02 8829 860/647 http://www.mediobanca.com |